15. compressibility, permeability and tress istory of sediments r 1
TRANSCRIPT

Mosher, D.C., Erbacher, J., and Malone, M.J. (Eds.)Proceedings of the Ocean Drilling Program, Scientific Results Volume 207
15. COMPRESSIBILITY, PERMEABILITY, AND STRESS HISTORY OF SEDIMENTS FROM DEMERARA RISE1
Matt O’Regan2 and Kate Moran2,3
ABSTRACT
The stress history, permeability, and compressibility of sedimentsfrom Demerara Rise recovered during Ocean Drilling Program Leg 207were determined using one-dimensional incremental load consolida-tion and low-gradient flow pump permeability tests. Relationshipsamong void ratio, effective stress, and hydraulic conductivity are pre-sented for sampled lithologic units and used to reconstruct effectivestress, permeability, and in situ void ratio profiles for a transect of threesites across Demerara Rise. Results confirm that a significant erosionalevent occurred on the northeastern flank of the rise during the lateMiocene, resulting in the removal of ~220 m of upper Oligocene–Miocene deposits. Although Neogene and Paleogene sediments tend tobe overconsolidated, Cretaceous sediments are normally consolidatedto underconsolidated, suggesting the presence of overpressure. A pro-nounced drop in permeability occurs at the transition from the Creta-ceous black shales into the overlying Maastrichtian–upper Paleocenechalks and clays. The development of a hydraulic seal at this boundarymay be responsible for overpressure in the Cretaceous deposits, leadingto the lower overconsolidation ratios of these sediments. Coupled withlarge regional variations in sediment thickness (overburden stresses),the higher permeability overpressured Cretaceous sediments represent aregional lateral fluid conduit on Demerara Rise, possibly venting methane-rich fluids where it outcrops on the margin’s northeastern flank.
1O’Regan, M., and Moran, K., 2007. Compressibility, permeability, and stress history of sediments from Demerara Rise. In Mosher, D.C., Erbacher, J., and Malone, M.J. (Eds.), Proc. ODP, Sci. Results, 207: College Station, TX (Ocean Drilling Program), 1–35. doi:10.2973/odp.proc.sr.207.114.20072Graduate School of Oceanography, University of Rhode Island, Narragansett RI, 02882. Correspondence author: [email protected] of Ocean Engineering, University of Rhode Island, Narragansett RI, 02882.
Initial receipt: 4 April 2006Acceptance: 8 March 2007Web publication: 16 May 2007Ms 207SR-114

M. O’REGAN AND K. MORANCOMPRESSIBILITY, PERMEABILITY, AND STRESS HISTORY OF SEDIMENTS 2
INTRODUCTION
Fluids play a pivotal role in the dynamics of continental margin evo-lution. Subseafloor fluids link many physical and chemical processesthrough the transport of energy and solutes over a wide range of scales.Defining these fluids, their flow systems, controlling mechanisms andrates on both active and passive margins are important scientific ques-tions that have become target themes for the Integrated Ocean DrillingProgram (Ge et al., 2002).
In normally consolidated sediments, hydrostatic pressure is main-tained in the pore spaces by the expulsion of pore waters as burial com-paction progresses. If sediment permeability is sufficiently low or ifsedimentation and the accumulation of overburden pressure are suffi-ciently high (as in many high-productivity shelf environments), porefluids cannot escape quickly enough and overpressures are generated.In these instances, the retained fluid carries part of the overlying sedi-ment load. As time progresses, pore pressures can reach lithostatic levelsand cause fracturing, affect local and regional slope stability, and in-duce flow channeling (Hart et al., 1995).
On continental margins, downhole variability in formation permea-bility and horizontal differences in overburden stresses result in the fo-cusing of fluids laterally along preferential flow channels (Dugan andFlemings, 2000). Where these flow channels outcrop on margin flanks,slope instabilities may occur near the seafloor. Modeling on the NewJersey margin has shown that lateral flow along highly permeable Mio-cene fluid conduits initiates slope failure and feeds cold seeps on theseafloor (Dugan and Flemings, 2000), and similar evidence of masswasting exists in the Eastern Nankai Trough on the Tokai margin, whereactive seepage is concentrated along outcrops of coarse turbidites(Henry et al., 2002). In both situations, the margins are characterized bylarge downhole variations in permeability and lateral heterogeneities insediment thicknesses.
A similar situation exists on Demerara Rise, an extension of the con-tinental margin off the coasts of French Guyana and Suriname. The riseis covered with 2–3 km of sediment and generally lies <700 meters be-low sea level (mbsl). Basement rocks on the rise are Precambrian andearly Mesozoic and are overlain by pre-Albian synrifted sediments(Erbacher, Mosher, Malone, et al., 2004). The rise’s northwestern edge ischaracterized by a gentle sloping surface that deepens >4000 mbsl whilemaintaining a generally constant thickness of sediment cover, whereason the eastern flank, sediments thin in the seaward direction, withbasement outcrops occurring below 3500 mbsl.
Five sites drilled on Demerara Rise during Ocean Drilling Program(ODP) Leg 207 constitute a depth transect extending from 1900 to 3200mbsl. Recovered sediments are primarily Cretaceous and Paleogene de-posits defined by five major lithsotratigraphic units (Figs. F1, F2). Threeregional unconformities are identified in the recovered sequences andoccur
1. Between the pre-Albian synrifted sediments and the Cenomanian–Santonian black shales,
2. Separating the Cenomanian–Santonian black shale sequenceand the overlying Campanian–Paleogene calcareous to siliceousoozes and chalks, and
0004
0002
0002
0002
5°S
0°
5°
10°
15°N
Georgetown
Paramaribo
65°W 60° 55° 50° 45°
54°50' W 54°40' 54°30' 54°20' 54°10' 54°00'
0042
0552
26500572 0592
0522
2150
2000
0571
0581
1600
0081
0091
0512
0532
0592
0542
0562
0022
0052
0032
0012 0002005205
72
054300
33
0023
3300
0543
0034 0534
00430044 ODP Site
1257
ODP Site1261
ODP Site1259
ODP Site1260
(DSDP 144)ODP Site
1258
9°40'N
9°30'
9°20'
9°10'
9°00'
6000 4000 2000 0 1000 3000 5000 7000 9000
F1. Leg 207 site map, p. 18.
Mio
cene
Olig
ocen
eE
ocen
e
early
early
late
middle
Plio.
Pleist.
earlymiddle
lateearly
late and mid.
late
middle
Pal
eoce
ne
early
late
Maastrichtian
Campanian
SantonianConiacianTuronian
Cenomanian
Albian
early
late
Lithology
Nannofossil clay
Foraminifer and nannofossil chalk
with clay
Foraminifer and nannofossil chalk
Silty claystone
Calcareous claystone with quartz
Foraminifer andnannofossil ooze
Foraminifer andnannofossil chalk
Nannofossil andsiliceous chalk
with foraminifers
nannofossil chalk Foraminifer and
Clayey nannofossil chalk
Claystone withforaminifers and
nannofossils
Calcareous claystone with organic matter
CaCO3Unit
I
IIA
IIB
IIC
IIIA
IIIB
IIIC
IV
V
Site 1259Unit
Slump of Oligocene
IIAIIB
IIB
IIC
IIIA
IIIB
IIIBIIIB
IVV
V
IIIC
IIA
IIA
Site 1260Unit
I
IIB
IIB
IIC
IIC
IIIA
IIIB
IIIC
IV
V
IIA
IIA
Site 1257Unit
IIB
IIB
IIB
IIIA
IIIB
IV
IV
V
IIIB/C
IIC
IIA
I
Site 1258Unit
IIB
IIIA
IIIA
IIIBIIIC
IIIC
IV
V
IIC
IIA
I
Clayey chalkwith organic matter
IIB
IIIA
IV
IIIB
Site 1261Unit
Slump
IIC
IIIA
I
I
IIIB
-
Increase in water depth Increase in water depth
Slump of Oligocene
Age
(M
a)
+0
10
20
30
40
50
60
70
80
90
100
110
F2. Schematic illustration of age and sediment type, p. 19.

M. O’REGAN AND K. MORANCOMPRESSIBILITY, PERMEABILITY, AND STRESS HISTORY OF SEDIMENTS 3
3. Near the late Oligocene–early Miocene, where an erosional sur-face, formed as part of a short-lived submarine channel system,is thought to be partially responsible for the thin veneer of Neo-gene deposits on the distal portions of the rise (Erbacher,Mosher, Malone, et al., 2004).
The changing depositional environment on Demerara Rise produceda diverse suite of sediments whose petrophysical properties are compli-cated by postdepositional diagenetic alterations and periods of erosionor nondeposition. This study presents laboratory test results that de-scribe the permeability, compressibility, and stress history of 12 samplesfrom Sites 1257, 1258, 1259, and 1261 (Fig. F3). The results of laboratorytesting allow for the construction of composite effective stress and per-meability profiles of the recovered sediments and are used to investigatethe timing and magnitude of documented unconformities and the evo-lution of pore pressure and possible fluid flow regimes on Demerara Rise.
METHODS
Consolidation Tests
One-dimensional incremental load consolidation tests provide keyparameters for reconstructing the stress history of clayey marine sedi-ments (Terzaghi, 1943). Testing is performed by incrementally loading asample to levels that exceed the expected in situ effective stress (σ′) andallowing the pore pressure to dissipate as the sediment settles. Thechange in sample height under each new load is used to calculate thevolumetric strain or void ratio (e) at the end of each step and definesthe sediment’s compressibility. Because soils are not perfectly elastic,the deformation behavior they exhibit depends on the stress history ofthe sample. This allows four critical parameters to be derived from aconsolidation test:
1. The compression index (Cc), which defines the sediment com-pressibility as the slope of the e-log(σ′) curve during loading;
2. The recompression index (Cr), which is the slope of the e-log(σ)curve during unloading;
3. The preconsolidation pressure (Pc′), interpreted as the maximumpast effective stress that the sediment has experienced and calcu-lated using the curve fitting method of Casagrande (1936); and
4. The void ratio of the sediment upon deposition (eo) (Fig. F4)(Moran et al., 1995; MacKillop et al., 1995).
In addition to these four parameters, the time deformation behavior ofthe sediments can be used to determine the relationship between perme-ability and void ratio for the sediment.
Whole-round samples, taken shipboard from visually undisturbedsections of core, were sealed with wax, immersed in seawater, and keptrefrigerated at 4°C after being shipped to the Marine GeomechanicsLaboratory (University of Rhode Island). Prior to testing, the sampleswere removed from the sealed core liner and trimmed to a standardheight of 2 cm and a diameter of 4.97 cm. Once trimmed, the wet massof the sample was recorded before the sample was transferred into theconsolidation cell that is immersed in de-aired, ultraviolet-treated sea-water taken from Narragansett Bay, Rhode Island. The cell is con-
0
100
200
300
400
500
Site 1260
0
100
200
300
400
500
Reworked
Site 1259
0
100
200
Site 1257
Dep
th (
mcd
)
20000
100
200
300
400
Velocity(m/s)
0 40 80
Porosity(%)
K/T
Site 1258
Fault in Hole A
0
100
200
300
400
500
600
Site 1261
Debris flow
Poo
r ho
le c
ondi
tions
dur
ing
logg
ing
Legend
2951 mbsl
2354 mbsl
3192 mbsl2549 mbsl
1900 mbsl
1.07
0.39
3.21
4.08
2.18
1.39
0.39
0.56
1.11
1.34
1.07
1.05
Neogene
Paleogene
Santonian through Cenomanian (shales)
Maastrichtian and Campanian
Early Cretaceous
B
B'
C
B
B'
C
2000
Velocity(m/s)
0 40 80
Porosity(%)
2000
Velocity(m/s)
0 40 80
Porosity(%)
2000
Velocity(m/s)
0 40 80
Porosity(%)
2000
Velocity(m/s)
0 40 80
Porosity(%)
F3. Location and OCR of samples used in this study, p. 20.
0.1
0.3
0.5
0.7
0.9
1.1
1.3
1.5
1 10 100 1000 104 105
Effective stress (kPa)
Voi
d ra
tio
Recompression index(Cr)
Compression index(Cc)
Maximum pasteffective stress (Pc')
Y-intercept at 1 kPa is the initial void ratio (eo)
Hypothetical test results
F4. Hypothetical consolidation results, p. 21.

M. O’REGAN AND K. MORANCOMPRESSIBILITY, PERMEABILITY, AND STRESS HISTORY OF SEDIMENTS 4
structed of stainless steel and allows sediment deformation to occuronly vertically. The sample is set within the cell and placed betweentwo porous stones. Saturated filter papers are used to separate the sam-ple from the porous stones and prevent fine-grained sediment particlesfrom blocking the drainage paths through the stones. After the cell isassembled, it is transferred to the consolidometer, where testing begins.General sample preparation and testing procedures followed the guide-lines set out by the American Standards and Testing Materials (ASTM)standard D2435-04 (ASTM International, 2007). One-dimensionalincremental load consolidation tests were conducted using one of twoinstruments: (1) an ELE International lever arm consolidometer or (2) afully automated Loadtrack consolidation frame and data acquisitionsoftware system manufactured by Geocomp. Using the selected samplediameter, both systems were capable of applying loads of as much as 10MPa.
The Geocomp assembly continuously monitors and records varia-tions in both the applied load and sediment height. Prior to the start ofeach test, the loading sequence is entered into the software, with both amaximum and minimum time specified for the duration of each step.For this testing program, the Geocomp system was programmed tomove to the next loading step 30 min after the end of primary consoli-dation. Primary consolidation is defined as the period over which thechange in specimen height is associated solely with the dissipation ofpore water pressure, whereas secondary consolidation is defined asstrain associated with the realignment of particles within the sedimentmatrix (Terzaghi, 1943; Sridharan and Rao, 1982). The most reliablemethod for assessing the end of primary consolidation (EOP) is throughthe measurement of pore pressures during loading and settlement;however, the EOP can also be reliably determined by analyzing the timedeformation data during settlement. No pore pressure measurementswere performed during testing, and for all tests, the EOP was deter-mined by analyzing the time deformation data using Taylor’s (1948)square root of time method.
Along the virgin compression curve, where permeability measure-ments were acquired, secondary consolidation was allowed to progressuntil permeability tests were completed; typically this was ~24 hr, butin some instances where the permeability was exceptionally low, testingtook between 3 and 5 days.
On the lever arm system, samples were allowed to settle for 24 hr af-ter the application of each new load. During loading and settlement,the change in specimen height was monitored using both a dial gaugeand a digital displacement transducer connected to acquisition soft-ware. Similar to the Loadtrack tests, secondary consolidation was al-lowed to proceed during permeability tests.
Permeability
Permeability (K) is an intrinsic property of the sediment matrix,whereas the rate of fluid flow through sediment is a function of boththe intrinsic permeability and the physical properties of the flowingfluid. The rate of fluid flow is termed Darcy’s coefficient of permeability,or hydraulic conductivity (k). The relationship between hydraulic con-ductivity and permeability is expressed by
K = kρg/µ, (1)

M. O’REGAN AND K. MORANCOMPRESSIBILITY, PERMEABILITY, AND STRESS HISTORY OF SEDIMENTS 5
where
K = intrinsic permeability (L2), k = hydraulic conductivity (L/T), ρ = pore fluid density, g = gravitational acceleration, and µ = fluid viscosity.
The hydraulic conductivity is reported here and normalized to seawaterhaving a density of 1.024 g/cm3 at 20°C.
The flow of fluids through marine sediments plays an important rolein regulating the temporal and spatial evolution of petrophysical prop-erties. Information on the relationship between void ratio and permea-bility for a given sediment type are used to assess the role and impact offluid flow. Void ratio-permeability relationships are derived from con-solidation tests using Terzaghi’s (1943) one-dimensional consolidationtheory or measured directly using a low-gradient flow-pump techniqueat the end of each incremental load during testing. Terzaghi’s deriva-tion of permeability is calculated using
k = CvρgAv/(1 + e), (2)
where
k = hydraulic conductivity;Cv = coefficient of consolidation, determined using either the curve
fitting procedure of Taylor (1948) or Casagrande (1936) on thetime deformation data during a given incremental load;
Av = slope of the load-displacement curve; and e = average void ratio over the incremental load for which the hy-
draulic conductivity is being determined.
This theoretical derivation is based upon a number of nested assump-tions. It requires that the sample be homogeneous and 100% saturated.The solids and the water in pore spaces are assumed to be incompressible,with drainage occurring solely from vertical compression. It requires thateffective stress maintain a unique relationship with the void ratio of thesample, which implies that both the slope of the consolidation curve (Av)and Darcy’s coefficient of permeability (hydraulic conductivity [k]) re-main constant during any loading step. This condition of maintaining aunique relationship between effective stress and void ratio assumes thatonly primary consolidation occurs. Permeability estimates made usingTerzaghi’s one-dimensional theory tend to be slightly lower than actualpermeability because secondary consolidation consistently plays a smallrole in the deformation of a sample under a load (MacKillop et al., 1995).
A more accurate way of determining hydraulic conductivity isthrough direct measurement using a low-gradient flow-pump tech-nique. Recommendations for low-gradient testing of fine-grained sedi-ments using a flexible-wall permeameter are outlined in ASTMdesignation D 5084-90 (ASTM International, 1990). The same testingprocedures can be applied using a consolidation cell. Flow pump testswere conducted at the end of primary consolidation at each step alongthe virgin compression curve for selected samples. Constant rate of flowtests apply a known flow rate (q) through a sample. This flow rate estab-lishes a head difference across the sample that is monitored using a dif-ferential pore pressure transducer. When the head equilibrates, a

M. O’REGAN AND K. MORANCOMPRESSIBILITY, PERMEABILITY, AND STRESS HISTORY OF SEDIMENTS 6
steady-state gradient is established (i) and the hydraulic conductivity iscalculated using Darcy’s law:
q = kiA, (3)
where
q = known flow rate (L3/T), k = hydraulic conductivity (L/T), i = dimensionless hydraulic gradient (Δh/Δl), and A = cross-sectional area of the sample (L2).
Terzaghi’s theory was used here to calculate sediment permeabilityduring loading along the virgin compression curve for each sample.Where hydraulic conductivities were large enough for direct measure-ments, complementary permeability measurements were made using alow-gradient flow-pump technique. During flow pump testing, threeflow rates were attempted and applied in both directions across the sam-ple, resulting in a maximum of six direct measurements of hydraulicconductivity at each void ratio. Because Darcy’s law states that the hy-draulic conductivity should be independent of flow rate, the slope of aq-i plot at a given void ratio should be linear. Nonlinearity is an indica-tion that Darcy’s law has been violated and the measurements are in-valid. The slope of the q-i plot was used for each series of measurementsto define the hydraulic conductivity of the sample at a particular voidratio. The regression of the q-i data was forced to pass through the originbecause a hydraulic gradient does not exist when the flow is zero. An e-log(k) relationship, in the form of an exponential function, is presentedfor each sample. When flow pump measurements existed, these wereused to define the relationship and are deemed more accurate than de-rived measurements. In the absence of flow pump measurements, thederived permeability data were used to calculate the e-log(k) relationshipfor that sample.
Effective Stress
Effective stress is defined as the stress that is passed between particlesin the sediment matrix and is calculated by removing the fluid pressure(u) from the lithostatic overburden, or total stress (σ):
σ′ = σ – u. (4)
If hydrostatic fluid pressures are assumed, σ′ can be directly calculatedusing bulk density data:
σ′ = (ρs – ρw)hg, (5)
where
ρs = sediment bulk density,ρw = density of seawater, and h = burial depth.
The in situ effective stress was calculated using the index property–derived bulk density values and the composite depth scales generated on

M. O’REGAN AND K. MORANCOMPRESSIBILITY, PERMEABILITY, AND STRESS HISTORY OF SEDIMENTS 7
board the ship. No rebound correction was applied to the depth scalesand calculations assume hydrostatic fluid pressures. The average bulkdensity was used to calculate the effective stress between consecutivedownhole samples and rounded to the nearest 5 kPa.
Stress History
The stress history of sediments is often described using the overcon-solidation ratio (OCR), which is a ratio of Pc′ and the in situ σ′ underhydrostatic conditions (OCR = Pc′/σ′). An OCR > 1 represents an over-consolidated sediment. Overconsolidation arises when an overburdenpressure is removed from a consolidated sediment column. Such condi-tions arise, for example, with glacial loading and subsequent melting orlithologic loading with subsequent removal of sediment by erosion. AnOCR ≅ 1 indicates that the sediment is normally consolidated, meaningthe current in situ effective stress represents the maximum stress thesample has experienced. A normally consolidated state implies that hy-drostatic fluid pressures are present in the sediment column. Sedimentswith an OCR < 1 are underconsolidated, a state which suggests the pres-ence of excess pore pressures within the sediment column. Excess porepressures develop through disequilibrium compaction associated withhigh sedimentation rates or the development of an overlying hydraulicseal, which impedes the dissipation of pore waters (Rubey and Hubbert,1959; Fertl, 1976).
By definition, the OCR is a more sensitive indicator of stress state innear-surface sediments when compared with deeply buried formations.In shallowly buried sediments where σ′ < 500 kPa, uncertainties associ-ated with sample disturbance and effective stress calculations can havesignificant impacts on the calculated OCR. Because of this uncertainty,Dadey and Silva (1989) used OCR ≥ 1.2 to represent overconsolidationand OCR ≤ 0.7 for underconsolidation. As the depth of burial increases,a greater offset between Pc′ and the in situ σ′ is required for a significantOCR ratio to develop. Furthermore, the accuracy in the evaluation of Pc′decreases at higher effective stresses because it is determined using acurve-fitting method on a log-linear plot.
Void Ratio
During sample preparation, an ~30 g subsample was used to deter-mine the void ratio of test specimens prior to consolidation by measur-ing wet and dry mass. Drying was performed at 105°C over a period of24 hr. The salt-corrected water content was calculated from the wet anddry mass of the subsample using
w = (Mwet – Mdry)/[Mdry – (0.035Mwet)], (6)
where
w = water content (%), Mwet = wet mass of the subsample (g), and Mdry = dry mass of the sample.
The calculated water content was used to determine the mass of solidsand liquid within the test sample:

M. O’REGAN AND K. MORANCOMPRESSIBILITY, PERMEABILITY, AND STRESS HISTORY OF SEDIMENTS 8
Msolid = Msample/[1 + (w/100)] and (7)
Mwater = Msample – Msolid. (8)
Using the specific gravity (Gs) of the sample, the volume of solids (Vs),water (Vw), and air (Va) were determined:
Vs = Msolid/Gs, (9)
Vw = Mwater/1.024 g/cm3, and (10)
Va = VT – Vs – Vw, (11)
where VT is the total sample volume calculated from its height and diam-eter.
Specific gravity was either measured directly in the laboratory or de-rived from shipboard measurements of grain density. When derivedfrom shipboard moisture and density data, the average grain density forthe entire core was used. The void ratio of the sample is defined as
e = Vv/VT, (12)
where
Vv = Va + Vw and (13)
VT = Va + Vs + Vw. (14)
The calculated void ratio was used to define the void ratio of the testspecimen prior to testing. For the two black shale samples (Samples 207-1257C-13R-1, 140 cm, and 207-1258B-45R-4, 45 cm), residues from ovendrying at 105°C were weighed before heating to 550°C for 1 hr. This al-lowed the total organic carbon (TOC) content to be determined using aloss on ignition approach:
%org = (M100 – M550)/M100, (15)
where
%org = total organic content,M100 = mass of the sample after drying at 100°C,M550 = mass of the sample after drying at 550°C, and
TOC = %org × 0.44, (16)
where 0.44 represents an approximate contribution of organic carbon tothe molecular weight of organic material by assuming a cellulose com-position.
RESULTS
Consolidation tests were performed on 12 samples from five of themajor lithostratigraphic units used to describe sediments recovered dur-ing Leg 207. The deepest sample came from Site 1261 at a depth of 364

M. O’REGAN AND K. MORANCOMPRESSIBILITY, PERMEABILITY, AND STRESS HISTORY OF SEDIMENTS 9
meters composite depth (mcd) and the shallowest from 26 mcd at Site1259. A summary of consolidation results is presented in Table T1 andincludes the stress history–related calculations of in situ σ′, Pc′, and theOCR, as well as the sediment compressibility coefficients (Cc and Cr)and the calculated eo.
No corrections were applied for the effects of sample disturbance.Disturbances related to coring, sampling, and preparation of the sampleall result in an underestimate of Pc′ and reduce both eo and Cc. There-fore, disturbance masks the effects of overconsolidation in test speci-mens. A qualitative approach for evaluating sample disturbance isassessing the shape of the consolidation curve (e-log[σ′]). A sharp transi-tion into the virgin compression curve suggests a high-quality sample.A more quantitative approach is by calculating the amount of volumet-ric strain that accumulates prior to reaching Pc′ (Lunne et al., 1999). De-veloped primarily for the evaluation of samples from near-surfacesediments and soils, Lunne’s method evaluates sample quality usingratings between excellent and very poor. Evaluation includes consider-ation of the OCR, with higher levels of strain permitted for sampleswith low OCR values (Table T2). The majority of the samples testedhere experienced between 5% and 10% strain before reaching Pc′. Usingthe evaluation criteria of Lunne et al. (1999), the quality of these sam-ples range from poor to good/fair (Table T1). The relatively high degreeof sample disturbance results from the depth of burial of the samplesand the type of sampling tools used to collect them, in this case therotary core barrel system. In the majority of marine sediments, thereexists an order of magnitude difference in Cr and Cc (Holtz and Kovacs,1981). At Site 1261, the high elasticity of the Neogene nannofossil claysreduced the difference between Cr and Cc, thus increasing the level ofapparent sample disturbance.
Significant levels of overconsolidation, as evidenced by the calculatedOCR (see Table T1), occur in samples from Sections 207-1257C-1R-2,207-1257C-6R-3, and 207-1259A-3R-5. These results are consistent withan interpretation of mass wasting on the eastern flank of the rise basedon seismic reflection data (Fig. F5) (Shipboard Scientific Party, 2004b).
An estimate of the magnitude of the erosional events is calculated bydetermining the amount of material required to account for the differ-ence between Pc′ and a hydrostatically determined σ′ (Table T1). The re-moved overburden is added to the current effective stress profile tocalculate the corrected effective stress profile. Predictions of ein situ aremade by combining the corrected effective stress profile with the com-pression indexes derived from consolidation tests using:
ein situ = elab – Crlog(σ′), and (17)
epredicted = eo – Cclog(σ′), (18)
where
ein situ = rebound-corrected laboratory measurement of void ratioand
epredicted = void ratio of sediments consolidating along the virgincompression curve until they reach the determined in situeffective stress.
T1. Laboratory consolidation results, p. 30.
T2. Lunne’s criteria, p. 31.
ES NW
Unit IV
Unit I
Unit II
Unit III
C
B
B'
A
Two-
way
trav
eltim
e (s
)
Site 1259
Unit IV
Unit I Unit II
Unit IIIa Unit IIIb
C
B
B'
A
2.4
2.6
2.8
3.0
3.2
3.4
3.6
3.8
4.0
4.2
4.4
Seafloor
Line GoeB219
Seafloor
10 km
Site 1257
Line GoeB220
F5. Seismic reflection profile of the flank of Demerara Rise, p. 22.

M. O’REGAN AND K. MORANCOMPRESSIBILITY, PERMEABILITY, AND STRESS HISTORY OF SEDIMENTS 10
A close agreement between the predicted and measured e supports thestress history interpretation and permits the application of the test-derived e-log(k) relationships to determine the current in situ k profile.
Permeability results are summarized in Table T3 and include calcu-lated variables (Cv and Av) used to derive k from the time deformationdata, as well as the calculated k for each set of low-gradient flow pumptests. A table is also presented summarizing q, i, and k for each set offlow pump tests (Table T4). Individual sample results from consolida-tion and hydraulic conductivity tests are presented in Figure F6.
One sample, Sample 207-1261A-4R-2, 80 cm, was tested using boththe lever arm consolidometer and the Geocomp system. Direct mea-surements of k were performed on the lever arm system during test B.Prior to flow measurements, the sample was unloaded to 30 kPa, whena leak was detected in the consolidation cell. After the sample was re-loaded and consolidation began to proceed along the virgin compres-sion curve, k tests were started.
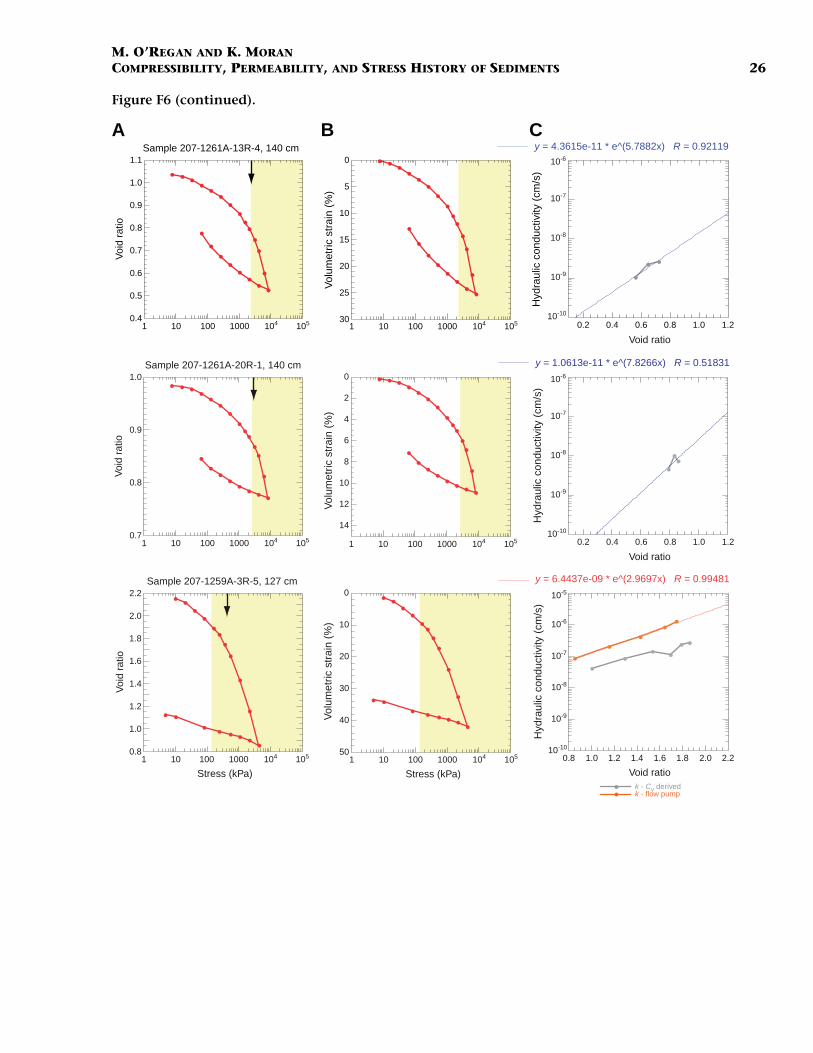
Very low permeability in a few samples either reduced the number offlow rates applied at any given e or, in one case, precluded the use oflow-gradient flow pump measurements. A steady-state hydraulic gradi-ent could not be established across Sample 207-1258B-36R-2, 8 cm(344.49 mcd), a Maastrichtian nannofossil chalk with forams. Flowpump tests were not possible on two other samples, Samples 207-1261A-13R-4, 140 cm, and 20R-1, 140 cm, because of leaks that devel-oped in the consolidation cell. However, results from samples takenfrom this same lithostratigraphic unit at Site 1261 show excellent agree-ment between the derived and measured permeability determinationsand suggest that the derived k values are correct.
The greatest offsets between the derived and measured k values oc-curred in Samples 207-1257C-1R-2, 140 cm, and 13R-1, 130 cm. In bothcases, the flow pump measurements were selected as being representa-tive of the sample’s permeability. The ability to derive k from Terzaghi’sone-dimensional theory of consolidation requires that over the ana-lyzed period of settlement, changes in void ratio maintain a unique re-lationship with changes in effective stress (Holtz and Kovacs, 1981). Ifsecondary consolidation occurs (i.e., the rearrangement of particleswithin the sediment), both the void ratio and permeability can changewithout accompanying changes in the effective stress and this assump-tion is no longer valid (Holtz and Kovacs, 1981). In marine sediments,permeability estimates made using Terzaghi’s theory tend to be slightlylower than the actual permeability (by a factor of 2–4), with secondaryconsolidation consistently playing a small role in the deformation of asample under a load (MacKillop, 1995). In organic-rich soils, secondarycompression can be greater than primary consolidation during loading(Hobbs, 1986). Sample 207-1257C-13R-1, 130 cm, was a black shalewith a TOC content of 8.2 wt%. Differences between the flow pumpmeasured and derived permeability curves for this sample may be asso-ciated with a high level of secondary compression during loading. Al-though secondary consolidation may have been a factor in theunderestimated k for Sample 207-1257C-1R-2, 140 cm, it should nothave been as significant as in the high organic content black shale sam-ple. Other assumptions of Terzaghi’s theory that may not have beenvalid during the testing of Sample 207-1257C-1R-2, 140 cm, include:(1) that the sample be homogeneous and 100% saturated, (2) that thesolids are incompressible, and (3) that drainage occurs from compres-sion in one dimension (Terzaghi, 1943).
T3. Derived and measured hydrau-lic conductivity results, p. 32.
T4. Low-gradient flow pump re-sults and k calculations, p. 33.
1.1
1.2
1.3
1.4
1.5
1.6
1.7
1.8
1.9
1 10 100 1000 104 105
Sample 207-1257C-1R-2, 140 cm
Voi
d ra
tio
1 10 100 1000 104 105
Vol
umet
ric s
trai
n (%
)
1.1 1.2 1.3 1.4 1.5 1.6 1.7 1.8 1.9
y = 1.0564e-09 * e^(2.9694x) R = 0.9991
Hyd
raul
ic c
ondu
ctiv
ity (
cm/s
)
1 10 100 1000 104 105
Sample 207-1257C-6R-3, 140 cm
Voi
d ra
tio
1 10 100 1000 104 105
Vol
umet
ric s
trai
n (%
)
0.5 0.6 0.7 0.8 0.9 1.0
y = 2.6474e-12 * e^(8.9781x) R = 0.97509
Hyd
raul
ic c
ondu
ctiv
ity (
cm/s
)
A B C
1 10 100 1000 104 105
Sample 207-1257C-13R-1, 130 cm
Voi
d ra
tio
Stress (kPa)1 10 100 1000 104 105
Vol
umet
ric s
trai
n (%
)
Stress (kPa)
0.4 0.6 0.8 1.0 1.2 1.4 1.6 1.8
y = 2.1708e-09 * e^(4.1039x) R = 0.98582
Hyd
raul
ic c
ondu
ctiv
ity (
cm/s
)
Void ratio
0.5
0.6
0.7
0.8
0.9
1.0
0.8
1.0
1.2
1.4
1.6
1.8 0
5
10
15
20
25
30
35 10-10
10-9
10-8
10-7
10-6
10-5
10-10
10-9
10-8
10-7
10-6
10-10
10-9
10-8
10-7
10-60
5
10
15
20
25
30
0
5
10
15
20
25
Void ratio
Void ratio
k - Cv derivedk - flow pump
F6. Consolidation and permeabil-ity test results, p. 23.

M. O’REGAN AND K. MORANCOMPRESSIBILITY, PERMEABILITY, AND STRESS HISTORY OF SEDIMENTS 11
The other sample from the black shale sequences was Sample 207-1258B-45R-4, 45 cm (TOC = 6.3 wt%). During testing, a leak was discov-ered around the perimeter of the sample. The leak prevented theestablishment of a hydraulic gradient across the sample. After unload-ing and sealing the leak, hydraulic conductivity measurements wereconducted at 6144, 7140, and 8100 kPa. Results from flow pump testson Sample 207-1257C-13R-1, 130 cm, are used to construct e-log(k) rela-tionships for the black shales. Estimates from these tests give a lowerhydraulic conductivity for void ratios greater than ~0.7 and higher esti-mates when the void ratio is less than ~0.7 when compared to theresults from Sample 207-1258B-45R-4, 45 cm (Fig. F4). The selection ofthis sample as being representative of the black shales at Sites 1257,1259, and 1261 reduced the variability in the estimates of permeabilitywithin and between sites, perhaps masking the potential for high andlow permeability lenses.
Lithostratigraphic Unit III sediments on Demerara Rise generallyconsisted of Maastrichtian–late Paleocene nannofossil chalks and clays.These sediments exhibited the lowest porosities recovered on the riseand often showed decimeter-scale variations between chalks and clays(Shipboard Scientific Party, 2004c). Two samples were taken from thisunit, Samples 207-1257C-6R-3, 140 cm, and 207-1258B-36R-2, 45 cm.Both samples exhibited significantly different compressibility and per-meability behavior, with the sample from Site 1258 being less com-pressible and less permeable, a state that may be linked to thediagenetic history of the sample. In constructing e and k profiles for theUnit III sediments, Cc and e-log(k) from Sample 207-1257C-6R-3, 140 cm(Tables T1, T3), was used at Sites 1257, 1259, and 1261. However, e-log(k)relationships from Sample 207-1258B-36R-2, 45 cm, were also plotted togive a lower limit to the permeability of sediments across this unit.
DISCUSSION
Stress History and Erosion
A complex Neogene depositional history on Demerara Rise is indi-cated by the prevalence of nonsynchronous slump deposits and hia-tuses at the five sites drilled during Leg 207 (Fig. F2). The limitednumber of samples in this study precludes a very detailed analysis ofthe relationships among these events but does allow inferences to bemade concerning their likely timing and magnitude.
At Site 1257, the shallowest Sample 207-1257C-1R-2, 140 cm (84.9mcd), has an OCR of 4.08, with 1510 kPa of overburden stress removed(Table T1; Fig. F3). The high OCR of the sample argues for a significanterosional event at this site. The timing of the erosional event must beassociated with either the absence of Pliocene–Pleistocene material orthe early Oligocene–late Miocene hiatus identified in the recovered sed-iments (Fig. F2). Generally, sedimentation rates on Demerara Rise werebetween 15 and 20 m/m.y. for the early and late Eocene, slowing to8–12 m/m.y. during the early Oligocene, and then increasing substan-tially during the Miocene (up to 65 m/m.y. at Site 1261) (Erbacher,Mosher, Malone, et al., 2004). The absence of significant Pliocene–Pleistocene deposits from all sites visited during Leg 207 suggests thatsignificant accumulation of these recent sediments on the outer marginflanks is untenable. Assuming a sedimentation rate of 5 m/m.y. for theEocene–Oligocene sediments at Site 1257 (Shipboard Scientific Party,

M. O’REGAN AND K. MORANCOMPRESSIBILITY, PERMEABILITY, AND STRESS HISTORY OF SEDIMENTS 12
2004b), and taking an average bulk density of 1.59 g/cm3, the missingmaterial represents ~270 m (Equation 5, p. 6) of Eocene–Oligocenechalks that would account for nearly 54 m.y. of deposition. If the esti-mated sedimentation rate is increased to 10 m/m.y., the duration of de-position is only 22 m.y. and approximates the length of the earlyOligocene–late Miocene hiatus at Site 1257. If the eroded material is as-sumed to be solely Miocene equivalent deposits of nannofossil clay,with an average bulk density of 1.72 g/cm3 (recovered at Site 1261), themissing overburden represents ~220 m of sediment (Equation 5, p. 6),and with a sedimentation rate of 65 m/m.y. (from Site 1261), the miss-ing sediment accounts for only 3.5 m.y. of deposition. The amount ofoverburden thus requires either a prolonged period of accumulationthroughout the Oligocene and early Miocene followed by a single largeerosional event or a prolonged period of deposition and erosion thatended in the middle Miocene, allowing the accumulation of significantMiocene nannofossil clays during a period of 3–4 m.y. The accumula-tion of this material over 3.4 m.y. is consistent with the stratigraphyfrom Site 1261, where 270 m of nannofossil clay were deposited be-tween 6 and 3 Ma (Shipboard Scientific Party, 2004b). Together, this ev-idence suggests a late Miocene age for the lost overburden at Site 1257and implies a stable period of deposition in the late Miocene that fol-lowed a prolonged period of continued deposition and erosion lastingfrom the early Oligocene to middle Miocene. The prevalence of non-synchronous Oligocene–Miocene slump deposits at Sites 1259, 1260,and 1261 fits with the interpretation of a dynamic period of depositionand erosion extending from the early Oligocene–middle Miocene (seeFig. F2).
OCRs from the single sample from Site 1259 and the shallow samplesfrom Site 1261 indicate other less substantial erosional events (Fig. F3).At Site 1259, an OCR of 3.21 in Sample 207-1259A-3R-5, 127 cm, repre-sents 310 kPa of lost overburden, equivalent to ~50 m of eroded nanno-fossil clay. An ~30-m-thick slide deposit of reworked lower Oligocenecalcareous ooze rests on top of the lower Miocene calcareous ooze andchalk where Sample 207-1259A-3R-5, 127 cm, was taken (Shipboard Sci-entific Party, 2004a), implying that the maximum amount of erodedmaterial was ~80 m and occurred sometime after the early Miocene.
There is no evidence for a large erosional event in the late Mioceneor Pliocene–Pleistocene at Site 1261, where the only substantial Neo-gene deposits were recovered during Leg 207. A single underconsoli-dated sample was recovered from 72 mcd at Site 1261, near the top oflithostratigraphic Subunit IB, with an age range of late Miocene–middlePliocene (Fig. F3). Because this interval was spot cored, a detailed agemodel was not developed, but shipboard results indicate that sedimen-tation rates between 70–140 m/m.y. are possible for the upper 70 mcdof Site 1261 (Shipboard Scientific Party, 2004c). These high rates, com-bined with the low permeability of the Unit II sediments (10–9 cm/s),may have resulted in disequilibrium compaction, a state where sedi-ment loading exceeds the rate at which pore water can be expelled fromthe consolidating strata. Downhole, the OCRs of samples from SubunitIB indicate very slight overconsolidation.
OCRs at Site 1257, and to some extent in the two samples from Site1258, tend to decrease downhole. Below the heavily overconsolidatedsample from Section 207-1257C-1R-2, the OCR for Section 207-1257C-6R-3, a Paleocene-age nannofossil chalk, also indicates an overconsoli-dated state as would be expected when a significant overburden hasbeen removed from a sedimentary sequence (Fig. F3). However, the

M. O’REGAN AND K. MORANCOMPRESSIBILITY, PERMEABILITY, AND STRESS HISTORY OF SEDIMENTS 13
magnitude of lost overburden represented by the difference between Pc′and σ′ is only 1000 kPa (Table T1). Conversely, Sample 207-1257C-16R-5,135 cm, representing the less porous Albian claystones underlying theblack shales at Site 1257, had an OCR of 0.35 (underconsolidated) and adifference between Pc′ and σ′ of –1750 kPa. Using the average erodedoverburden (1250 kPa) from Samples 207-1257C-1R-2, 140 cm, and 6R-3,140 cm, a modified OCR of 0.19 is determined using
OCRm = Pc′/(σ′ + σ′eroded material). (19)
The largely underconsolidated nature of this sample implies that normalconsolidation processes have been inhibited and that excess pore pres-sure is present below the black shales at this site. Although the blackshale sample from Site 1257 had an OCR of 1.39, the modified OCR(Equation 19) for this sample is actually 0.72 and implies that the blackshale sequence at this site was moderately underconsolidated at the timeof maximum loading, which, given the arguments for the timing of theerosional event, would have been in the late Miocene. It is difficult toreconcile the highly underconsolidated sample from beneath the blackshales at Site 1257 with the almost normally consolidated black shalesample. Part of the difference may be accounted for by sample disturbance,which may have reduced the Pc′ estimate for Sample 207-1257C-16R-5,135 cm. Alternatively, the black shale sample may be more normallyconsolidated because of the higher permeability, which allows flowchanneling toward the outcrops on the margin flanks, while the lowerpermeability underlying Albian claystones remain overpressured. Inspite of the mechanism for the drop in the OCR beneath the black shalesat Site 1257, a downhole decrease in the OCR at Site 1257 is recognized,with highly overconsolidated near-surface sediments giving way to un-derconsolidated sediments at the bottom of the hole (Fig. F3).
Sample 207-1258B-45R-4, 45 cm, the second Cretaceous black shalesample tested, was underconsolidated with an OCR of 0.39 (Fig. F3).Unlike Site 1257, where evidence for significant erosion was found, theMaastrichtian–early Paleocene chalk from above the black shales at Site1258 appears to be normally consolidated (OCR = 1.07). The low OCR(0.39) for the black shale from Site 1258 indicates that fluid pressures inexcess of hydrostatic are present. The difference in the current in situeffective stress and the Pc′ from this sample gives a rough estimate ofthe present excess pore pressure of 1990 kPa (Table T1).
Permeability and Fluid Flow
Permeability profiles for Sites 1257, 1259, and 1261 were constructedusing the best estimates of effective stress profiles to predict the in situvoid ratio profiles and applying the laboratory derived e-log(k) relation-ships to these profiles (Figs. F7, F8, F9). Differences in the predicted andmeasured void ratio profiles translate into uncertainties in the permea-bility profiles. These differences likely arise from variability in down-hole and intersite sediment composition or the degree of diagenesis butmay also include variability in stress history that cannot be identifiedwithout a more detailed sampling program. At Site 1261, this uncer-tainty would include the thickness of material removed during the de-bris flow of Subunit IC, which represents a gap of ~30 m.y. in thesediment record (Fig. F3).
10-11 10-9 10-7 10-5 10-3
Hydraulic conductivity (cm/s)0 1 2 3 4 5
Void ratio0 1000 2000 3000
0
50
100
150
200
250
300
Effective stress (kPa)
Depth
(m
cd)
0 1 2 3 4 5
Void ratio
Hydrostatic effective stress
Maxim
um past effective stress
Unit II
Unit III
Unit IV
Unit V
Nannofossil chalk withforams, nannofossil ooze with forams
Siliceous nannofossil chalk with forams to nannofossil chalk with siliceous microfossils and forams
Nannofossil chalk and foram nannofossil chalk
Foram nannofossil chalk
Black shale
Silty calcareous claystone to clayey carbonate siltstone
A B C D
Laboratory-measured void ratio
Rebound-corrected void ratio (maximum past effective stress)
k from rebound-corrected laboratory measurments of void ratio (maximum past effective stress)
Rebound-corrected void ratio (hydrostatic effective stress)
Predicted void ratio (maximum past effective stress)
Predicted void ratio (maximum past effective stress, rebounded after erosion)
Predicted void ratio (hydrostatic effective stress)
Predicted k (maximum past effective stress, rebound corrected after erosion)
Predicted k, (maximum past effective stress, rebound corrected after erosion, Unit III, Section 207-1258B-36R-2)
F7. Site 1257 effective stress, void ratio, and hydraulic conductivity profile, p. 27.
0 3000 6000
Effective stress (kPa)
Dep
th (
mcd
)
0 1 2 3 4
Void ratio
Hydrostatic effective stress
Maxim
um past effective stress
10-12 10-8 10-4
Hydraulic conductivity (cm/s)
Unit II
Unit III
Unit IV
Unit V
Unit IForam nannofossil ooze
Foram nannofossil chalk
Clayey nannofossil chalk
Siliceous foram nannofossil chalk
Black shale
Quartz sandstone, silty claystone, calcaerous siltstone
Foram nannofossil chalk
Nannofossil chalk, calcareous siltstone, glauconitic claystone
A B C0
100
200
300
400
500
6000.01
Laboratory-measured void ratio
Rebound-corrected void ratio (maximum past effective stress)
k from rebound-corrected laboratory measurments of void ratio (maximum past effective stress)
Rebound-corrected void ratio (hydrostatic effective stress)
Predicted void ratio (maximum past effective stress)
Predicted void ratio (hydrostatic effective stress)
Predicted k (maximum past effective stress)
Predicted k (maximum past effective stress, Unit III, Section 207-1258B-36R-2)
F8. Site 1259 effective stress, void ratio, and hydraulic conductivity profile, p. 28.
0 1 2 3
Void ratio10-12 10-10 10-8 10-6
Hydraulic conductivity (cm/s)
Unit II
Unit III
Unit IV
Unit INannofossil ooze
Clayey nannofossil ooze(debris flow)
Calcareous chalk with clay
Black shale
Nannofossil clay
Nannofossil chalk with clayClayey nannofossil chalk
0 3000 6000
Effective stress (kPa)
Dep
th (
mcd
) Hydrostatic effective stress
Maxim
um past effective stress
A B C0
100
200
300
400
500
600
700
Laboratory-measured void ratio
Rebound-corrected void ratio (maximum past effective stress)
k from rebound-corrected laboratory measurments of void ratio (maximum past effective stress)
Rebound-corrected void ratio (hydrostatic effective stress)
Predicted void ratio (maximum past effective stress)
Predicted void ratio (hydrostatic effective stress)
Predicted k (maximum past effective stress)
Predicted k (maximum past effective stress, Unit III, Section 207-1258B-36R-2)
F9. Site 1261 effective stress, void ratio, and hydraulic conductivity profile, p. 29.

M. O’REGAN AND K. MORANCOMPRESSIBILITY, PERMEABILITY, AND STRESS HISTORY OF SEDIMENTS 14
The general observation that underconsolidation increases withdepth at all the studied sites suggests that fluid pressures increase abovehydrostatic toward the black shales. On the flank of Demerara Rise, theblack shales at Site 1257 are currently normally consolidated to over-consolidated, but significant overpressuring exists in the underlying Al-bian claystones. At the time of maximum loading, the black shales atSite 1257 would have been slightly underconsolidated, as inferred fromthe OCRm for Sample 207-1257-13R-1, 130 cm (Table T1). The onlyother sample from the black shales (taken from Site 1258) was highlyunderconsolidated. Although these very different stress histories maysimply highlight the natural variability between and within sites on theDemarara Rise, they may also suggest that as one moves away from thesteeper eastern flank, where the black shales outcrop on the outer mar-gin, fluid pressures increase. In this scenario, the hydrostatic pressuresin the black shales along the eastern flank of the rise are being main-tained by lateral fluid expulsion into the water column.
Composite permeability profiles from Sites 1257, 1259, and 1261 in-dicate that the Cretaceous shale deposits are between 3 and 5 orders ofmagnitude more permeable than the Maastrichtian–Paleocene chalksand clays that overly them (Figs. F7, F8, F9). The existence of a hydrau-lic seal, associated with the deposition or diagenetic alteration of thelow-permeability Paleocene chalks and clays, is a possible mechanismfor generating the underconsolidation of the black shales and olderunderlying sediments. With a hydraulic seal in place, continued microbialgeneration of methane (Meyers et al., 2004), compaction-relateddewatering, or connections to deeper-sourced fluid reservoirs and thepresence of an active flow regime could all prevent normal consolida-tion of the black shales and underlying sediments.
Similar to the permeability structure of other passive margins, suchas the New Jersey margin (Dugan and Flemings, 2000), the architectureof the Demerara Rise appears to support a large horizontal componentto fluid flow. The black shale deposits serve as a high-permeability, lat-erally continuous conduit. Increasing sediment thickness toward thecenter of the rise provides a gradient in overburden to drive flow. Thepresence of an active flow regime within the black shales may partiallyexplain geochemical evidence for hypersaline pore fluid in the Creta-ceous shale deposits at three of the five sites (Sites 1257, 1259, and1261) (Erbacher, Mosher, Malone, et al., 2004). A reduction in chlorin-ity concentrations beneath the shale sequence at Site 1257 indicatesthat the profiles are not the result of a diffusion gradient driven by achloride source in the underlying synrifted sediments (Shipboard Scien-tific Party, 2004a).
The complex stress history of sediments on Demerara Rise makes itdifficult to tie regional evidence for large-scale slope instability to ele-vated fluid pressures in the sedimentary column. If the Maastrichtian–Paleocene chalks and clays are acting as a hydraulic seal, then dependingon the efficiency of this seal, fluid pressures would rise within the un-derlying black shales. Overpressure would build and either exceed theoverburden pressures making the formation unstable or drive a largehorizontal flow regime. These fluids would likely be focused toward thesea surface along existing faults or through the high-permeability blackshales toward outcrops located on the flanks of Demerara Rise. Ongoingmicrobial degeneration of organic matter within the black shales (Mey-ers et al., 2004) would contribute to the development of overpressuresand generate methane-enriched pore fluids that would migrate laterallyalong aquifers or vent on the margin flanks.

M. O’REGAN AND K. MORANCOMPRESSIBILITY, PERMEABILITY, AND STRESS HISTORY OF SEDIMENTS 15
SUMMARY
Stress history results derived from one-dimensional incremental loadconsolidation tests on sediments from ODP Leg 207 are used to con-strain the timing and magnitude of erosional events on Demerara Rise.These results indicate that significant sediment accumulation and sub-sequent erosion occurred in the late Miocene, following a prolongedperiod of dynamic deposition and erosion that existed between theearly Oligocene and middle Miocene. OCRs tend to decrease downhole,indicating that elevated pore pressures exist in the vicinity of Creta-ceous black shale deposits. The magnitude of the excess pore pressurevaries across the rise, potentially increasing away from regions wherethe black shales outcrop on the steep margin flanks. Permeability pro-files document a sharp decrease across the Maastrichtian–Paleocenechalks and clays that overly the black shales. These low permeabilitysediments may act as a hydraulic seal, providing a mechanism for gen-erating excess pore pressures in Cretaceous sediments. Together withlateral variations in overburden, the permeability profiles provide thearchitecture for a significant two-dimensional flow regime, with theblack shales acting as a laterally continuous permeable conduit. Thisflow regime may be able to explain anomalous pore water profiles ob-served in the black shales.
ACKNOWLEDGMENTS
This research used samples and/or data provided by the Ocean Drill-ing Program (ODP). ODP is sponsored by the U.S. National ScienceFoundation (NSF) and participating countries under management ofJoint Oceanographic Institutions (JOI), Inc. We would like to thank JOIfor funding for this research via the U.S. Science Support Program. Theauthors also thank Kevin MacKillop, Kevin Brown, and one anonymousreviewer who provided important suggestions to this manuscript.
M. O’REGAN AND K. MORANCOMPRESSIBILITY, PERMEABILITY, AND STRESS HISTORY OF SEDIMENTS 16
REFERENCES
ASTM International, 1990. Standard test method for measurement of hydraulic con-ductivity of saturated porous materials using a flexible wall permeameter (StandardD5084–70). In Annual Book of ASTM Standards: Philadelphia (Am. Soc. Testing andMater.), 63–70.
ASTM International, 2007. Standard test methods for one-dimensional consolidationproperties of soils using incremental loading (Standard D2435-04). In Annual Bookof ASTM Standards (Vol. 04.08): Soil and Rock (I): West Conshohocken, PA (Am. Soc.Testing and Mater.).
Casagrande, A., 1936. The determination of pre-consolidation load and its practicalsignificance. In Casagrande, A., Rutledge, P.C., and Watson, J.D. (Eds.), Proc. 1st Int.Conf. Soil Mech. Found. Eng., Am. Soc. Civ. Eng., 3:60–64.
Dadey, K.A., and Silva, A.J., 1989. Consolidation and strength of Pliocene–Pleistocenesediments from Sites 646 and 647, ODP Leg 105. In Srivastava, S.P., Arthur, M.A.,Clement, B., et al., Proc. ODP, Sci. Results, 105: College Station, TX (Ocean DrillingProgram), 791–796. doi:10.2973/odp.proc.sr.105.145.1989
Dugan, B., and Flemings, P.B., 2000. Overpressure and fluid flow in the New Jerseycontinental slope: implications for slope failure and cold seeps. Science,289(5477):288–291. doi:10.1126/science.289.5477.288
Erbacher, J., Mosher, D.C., Malone, M.J., et al., 2004. Proc. ODP, Init. Repts., 207: Col-lege Station, TX (Ocean Drilling Program). doi:10.2973/odp.proc.ir.207.2004
Fertl, W.H., 1976. Abnormal Formation Pressures: Implications to Exploration, Drilling,and Production of Oil and Gas Resources: Amsterdam (Elsevier).
Ge, S., Bekins, B., Bredehoeft, J., Brown, K., Davis, E., Gorelick, S., Henry, P., Kooi, H.,Moench, A., Ruppel, C., Sauter, M., Screaton, E., Swart, P., Tokunaga, T., Voss, C.,and Whitaker, F., 2002. Hydrogeology program planning group final report.JOIDES J., 28(2):24–29.
Hart, B.S., Flemings, P.B., and Deshpande, A., 1995. Porosity and pressure: role ofcompaction disequilibrium in the development of geopressures in a Gulf CoastPleistocene basin. Geology, 23(1):45–48. doi:10.1130/0091-7613(1995)023<0045:PAPROC>2.3.CO;2
Henry, P., Lallemant, S., Nakamura, K., Tsunogai, U., Mazzotti, S., and Kobayashi, K.,2002. Surface expression of fluid venting at the toe of the Nankai wedge and impli-cations for flow paths. Mar. Geol., 187(1–2):119–143. doi:10.1016/S0025-3227(02)00262-1
Hobbs, N.B., 1986. Mire morphology and the properties and behavior of some Britishand foreign peats. J. Eng. Geol. Hydrogeol., 19:7–80.
Holtz, R.D., and Kovacs, W.D., 1981. An Introduction to Geotechnical Engineering: Engle-wood Cliffs, NJ (Prentice-Hall).
Lunne, T., Berre, T., and Strandvik, S., 1999. Sample disturbance effects in soft lowplastic Norwegian clay. Publ.—Nor. Geotek. Inst., 204:81–102.
MacKillop, A.K., Moran, K., Jarrett, K., Farrell, J., and Murray, D., 1995. Consolidationproperties of equatorial Pacific Ocean sediments and their relationship to stresshistory and offsets in the Leg 138 composite depth sections. In Pisias, N.G., Mayer,L.A., Janecek, T.R., Palmer-Julson, A., and van Andel, T.H. (Eds.), Proc. ODP, Sci.Results, 138: College Station, TX (Ocean Drilling Program), 357–369. doi:10.2973/odp.proc.sr.138.118.1995
Meyers, P.A., Forster, A., Sturt, H., and Shipboard Scientific Party, 2004. Microbialgases in black shale sequences on the Demerara Rise. In Erbacher, J., Mosher, D.C.,Malone, M.J., et al., Proc. ODP, Init. Repts., 207: College Station, TX (Ocean DrillingProgram), 1–18. doi:10.2973/odp.proc.ir.207.109.2004
Moran, K., Gray, W.G.D., and Jarrett, C.A., 1995. Permeability and stress history ofsediment from the Cascadia margin. In Carson, B., Westbrook, G.K., Musgrave,

M. O’REGAN AND K. MORANCOMPRESSIBILITY, PERMEABILITY, AND STRESS HISTORY OF SEDIMENTS 17
R.J., and Suess, E. (Eds.), Proc. ODP, Sci. Results, 146 (Pt. 1): College Station, TX(Ocean Drilling Program), 275–280. doi:10.2973/odp.proc.sr.146-1.225.1995
Sridharan, A., and Rao, A.S., 1982. Mechanisms controlling the secondary compres-sion of clays. Geotechnique, 32:249–260.
Taylor, D.W., 1948. Fundamentals of Soil Mechanics: New York (John Wiley).Terzaghi, K., 1943. Theoretical Soil Mechanics: New York (John Wiley).Rubey, W.W., and Hubbert, M.K., 1959. Role of fluid pressure in mechanics of over-
thrust faulting, Part 2. Overthrust belt in geosynclinal area of western Wyoming inlight of fluid-pressure hypothesis. Geol. Soc. Am. Bull., 70:167–205.
Shipboard Scientific Party, 2004a. Site 1257. In Erbacher, J., Mosher, D.C., Malone,M.J., et al., Proc. ODP, Init. Repts., 207: College Station, TX (Ocean Drilling Pro-gram), 1–111. doi:10.2973/odp.proc.ir.207.104.2004
Shipboard Scientific Party, 2004b. Site 1259. In Erbacher, J., Mosher, D.C., Malone,M.J., et al., Proc. ODP, Init. Repts., 207: College Station, TX (Ocean Drilling Pro-gram), 1–110. doi:10.2973/odp.proc.ir.207.106.2004
Shipboard Scientific Party, 2004c. Site 1261. In Erbacher, J., Mosher, D.C., Malone,M.J., et al., Proc. ODP, Init. Repts., 207: College Station, TX (Ocean Drilling Pro-gram), 1–103. doi:10.2973/odp.proc.ir.207.108.2004

M. O’REGAN AND K. MORANCOMPRESSIBILITY, PERMEABILITY, AND STRESS HISTORY OF SEDIMENTS 18
Figure F1. Site map for Ocean Drilling Program (ODP) Leg 207 (figure adapted from Shipboard ScientificParty, 2004b). DSDP = Deep Sea Drilling Project.
0004
0002
0002
0002
5°S
0°
5°
10°
15°N
Georgetown
Paramaribo
65°W 60° 55° 50° 45°
54°50' W 54°40' 54°30' 54°20' 54°10' 54°00'
0042
0552
26500572 0592
0522
2150
2000
0571
0581
1600
0081
0091
0512
0532
0592
0542
0562
0022
0052
0032
0012 0002005205
72
054300
33
0023
3300
0543
0034 0534
00430044 ODP Site
1257
ODP Site1261
ODP Site1259
ODP Site1260
(DSDP 144)ODP Site
1258
9°40'N
9°30'
9°20'
9°10'
9°00'
6000 4000 2000 0 1000 3000 5000 7000 9000

M. O’REGAN AND K. MORANCOMPRESSIBILITY, PERMEABILITY, AND STRESS HISTORY OF SEDIMENTS 19
Figure F2. Schematic illustration of age and sediment type recovered from the five sites on Demerara Riseduring ODP Leg 207. Recovered sediments were described using five lithostratigraphic units.
Mio
cene
Olig
ocen
eE
ocen
e
early
early
late
middle
Plio.
Pleist.
earlymiddle
lateearly
late and mid.
late
middle
Pal
eoce
ne
early
late
Maastrichtian
Campanian
SantonianConiacianTuronian
Cenomanian
Albian
early
late
Lithology
Nannofossil clay
Foraminifer and nannofossil chalk
with clay
Foraminifer and nannofossil chalk
Silty claystone
Calcareous claystone with quartz
Foraminifer andnannofossil ooze
Foraminifer andnannofossil chalk
Nannofossil andsiliceous chalk
with foraminifers
nannofossil chalk Foraminifer and
Clayey nannofossil chalk
Claystone withforaminifers and
nannofossils
Calcareous claystone with organic matter
CaCO3Unit
I
IIA
IIB
IIC
IIIA
IIIB
IIIC
IV
V
Site 1259Unit
Slump of Oligocene
IIAIIB
IIB
IIC
IIIA
IIIB
IIIBIIIB
IVV
V
IIIC
IIA
IIA
Site 1260Unit
I
IIB
IIB
IIC
IIC
IIIA
IIIB
IIIC
IV
V
IIA
IIA
Site 1257Unit
IIB
IIB
IIB
IIIA
IIIB
IV
IV
V
IIIB/C
IIC
IIA
I
Site 1258Unit
IIB
IIIA
IIIA
IIIBIIIC
IIIC
IV
V
IIC
IIA
I
Clayey chalkwith organic matter
IIB
IIIA
IV
IIIB
Site 1261Unit
Slump
IIC
IIIA
I
I
IIIB
-
Increase in water depth Increase in water depth
Slump of Oligocene
Age
(M
a)
+0
10
20
30
40
50
60
70
80
90
100
110

M. O
’RE
GA
N A
ND
K. M
OR
AN
CO
MP
RE
SSIBIL
ITY, P
ER
ME
AB
ILIT
Y, A
ND
ST
RE
SS HIST
OR
Y O
F SE
DIM
EN
TS
20
Figure y a black box, with the OCRvalue ity measurements are uncor-rected and C, respectively. Discretemeasu ies corresponding to regionalseismi ure adapted from ShipboardScient
Dep
th (
mcd
)
0
100
200
300
400
B
B'
C
F3. Location and overconsolidation ratio (OCR) of samples used in this study. Sample locations are denoted boffset to the left (OCR from Table T1, p. 30). Downhole velocity and porosity profiles are also presented. Veloc for in situ temperature and pressure. Colors (blue, red, and green) indicate measurements from Holes A, B, rements of porosity (open circles) are shown alongside downhole wireline porosity logs. Stratigraphic boundarc markers B, B′, and C are indicated with dotted lines (see Fig. F5, p. 22, for description of seismic markers). Figific Party (2004b). mbsl = meters below sea level.
0
100
200
300
400
500
Site 1260
0
100
200
300
400
500
Reworked
Site 1259
0
100
200
Site 1257
2000
Velocity(m/s)
0 40 80
Porosity(%)
K/T
Site 1258
Fault in Hole A
0
100
200
300
400
500
600
Site 1261
Debris flow
Poo
r ho
le c
ondi
tions
dur
ing
logg
ing
Legend
2951 mbsl
2354 mbsl
3192 mbsl2549 mbsl
1900 mbsl
1.07
0.39
3.21
4.08
2.18
1.39
0.39
0.56
1.11
1.34
1.07
1.05
Neogene
Paleogene
Santonian through Cenomanian (shales)
Maastrichtian and Campanian
Early Cretaceous
B
B'
C
2000
Velocity(m/s)
0 40 80
Porosity(%)
2000
Velocity(m/s)
0 40 80
Porosity(%)
2000
Velocity(m/s)
0 40 80
Porosity(%)
2000
Velocity(m/s)
0 40 80
Porosity(%)

M. O’REGAN AND K. MORANCOMPRESSIBILITY, PERMEABILITY, AND STRESS HISTORY OF SEDIMENTS 21
Figure F4. Hypothetical consolidation results illustrating how eo, Pc′, Cc, and Cr are determined. Void ratiois calculated by the change in sediment height that occurs as a result of primary consolidation during thecourse of each loading step.
0.1
0.3
0.5
0.7
0.9
1.1
1.3
1.5
1 10 100 1000 104 105
Effective stress (kPa)
Voi
d ra
tio
Recompression index(Cr)
Compression index(Cc)
Maximum pasteffective stress (Pc')
Y-intercept at 1 kPa is the initial void ratio (eo)
Hypothetical test results

M. O
’RE
GA
N A
ND
K. M
OR
AN
CO
MP
RE
SSIBIL
ITY, P
ER
ME
AB
ILIT
Y, A
ND
ST
RE
SS HIST
OR
Y O
F SE
DIM
EN
TS
22
Figure y units and a heavily eroded Unit I. Key regionalseismi hemipelagic and pelagic deposition of Cretaceousblack orizon B marks the K/T boundary. Horizon A isassoci iments from the flanks of the Demerara Rise (fromErbach
NW
Two-
way
trav
eltim
e (s
)
nit I
C
B
B'
A
2.4
2.6
2.8
3.0
3.2
3.4
3.6
3.8
4.0
4.2
4.4
Seafloor
Site 1257
F5. Seismic reflection profile of the flank of Demerara Rise showing major sedimentarc markers are illustrated with Horizon C marking the transition from synrift deposition toshales. Horizon B´ correlates with the top of the Cretaceous black shale sequence, and Hated with an early Miocene erosional unconformity that removed most of the Neogene seder, Mosher, Malone, et al., 2004).
ES
Unit IV
Unit I
Unit II
Unit III
C
B
B'
A
Site 1259
Unit IV
U Unit II
Unit IIIa Unit IIIb
Seafloor
Line GoeB219
10 km
Line GoeB220

M. O’REGAN AND K. MORANCOMPRESSIBILITY, PERMEABILITY, AND STRESS HISTORY OF SEDIMENTS 23
Figure F6. Results from consolidation and permeability tests presented by sample. A. e-log(σ′) curves fromconsolidation tests with the calculated Pc′ identified by a black arrow. Shading represents the region thatexceeds the calculated in situ effective stress and corresponds to stresses over which a normallyconsolidated sample should be proceeding along the virgin compression curve. B. Volumetric strain-log(σ′). The amount of volumetric strain required to reach Pc′ offers a simple way to evaluate sample quality(Lunne et al., 1999). C. Results from low-gradient flow pump k tests and k derived from time deformationdata acquired during consolidation tests. An exponential fit representing the e-log(k) relationship is dis-played for each sample; red = measured k, blue = k from Cv during consolidation test. (Continued on nextthree pages.)
1.1
1.2
1.3
1.4
1.5
1.6
1.7
1.8
1.9
1 10 100 1000 104 105
Sample 207-1257C-1R-2, 140 cm
Voi
d ra
tio
1 10 100 1000 104 105
Vol
umet
ric s
trai
n (%
)
1.1 1.2 1.3 1.4 1.5 1.6 1.7 1.8 1.9
y = 1.0564e-09 * e^(2.9694x) R = 0.9991
Hyd
raul
ic c
ondu
ctiv
ity (
cm/s
)
1 10 100 1000 104 105
Sample 207-1257C-6R-3, 140 cm
Voi
d ra
tio
1 10 100 1000 104 105
Vol
umet
ric s
trai
n (%
)
0.5 0.6 0.7 0.8 0.9 1.0
y = 2.6474e-12 * e^(8.9781x) R = 0.97509
Hyd
raul
ic c
ondu
ctiv
ity (
cm/s
)
A B C
1 10 100 1000 104 105
Sample 207-1257C-13R-1, 130 cm
Voi
d ra
tio
Stress (kPa)1 10 100 1000 104 105
Vol
umet
ric s
trai
n (%
)
Stress (kPa)
0.4 0.6 0.8 1.0 1.2 1.4 1.6 1.8
y = 2.1708e-09 * e^(4.1039x) R = 0.98582
Hyd
raul
ic c
ondu
ctiv
ity (
cm/s
)
Void ratio
0.5
0.6
0.7
0.8
0.9
1.0
0.8
1.0
1.2
1.4
1.6
1.8 0
5
10
15
20
25
30
35 10-10
10-9
10-8
10-7
10-6
10-5
10-10
10-9
10-8
10-7
10-6
10-10
10-9
10-8
10-7
10-60
5
10
15
20
25
30
0
5
10
15
20
25
Void ratio
Void ratio
k - Cv derivedk - flow pump

M. O’REGAN AND K. MORANCOMPRESSIBILITY, PERMEABILITY, AND STRESS HISTORY OF SEDIMENTS 24
Figure F6 (continued).
0.3
0.4
0.5
0.6
0.7
0.8
1 10 100 1000 104 105
Sample 207-1257C-16R-5, 135 cm
Voi
d ra
tio
1 10 100 1000 104 105V
olum
etric
str
ain
(%)
0.3 0.4 0.5 0.6 0.7 0.8
y = 3.0047e-11 * e^(7.9772x) R = 0.62941
Hyd
raul
ic c
ondu
ctiv
ity (
cm/s
)
A B C
0.6 0.7 0.8 0.9 1.0 1.1 1.2
Hyd
raul
ic c
ondu
ctiv
ity (
cm/s
)
Void ratio
Void ratio
Void ratio
0.5
0.6
0.7
0.8
0.9
1
1.1
1.2
10 100 1000 104 105
Sample 207-1258B-36R-2, 8 cm
Voi
d ra
tio
0
5
10
15
20
25
3010 100 1000 104 105
Vol
umet
ric s
trai
n (%
)
10-12
10-11
10-10
10-9
10-8
10-7
10-6
0.5 0.6 0.7 0.8 0.9 1.0 1.1 1.2
y = 5.4693e-16 * e^(13.532x) R = 0.37331
Hyd
raul
ic c
ondu
ctiv
ity (
cm/s
)
0.6
0.7
0.8
0.9
1.0
1.1
1.2
1 10 100 1000 104 105
Sample 207-1258B-45R-4, 45 cm
Voi
d ra
tio
Stress (kPa)
0
5
10
15
20
251 10 100 1000 104 105
Vol
umet
ric s
trai
n (%
)
Stress (kPa)
0
5
10
15
20
25 10-10
10-9
10-8
10-7
10-6
10-12
10-10
10-8
10-4
10-6
k - Cv derivedk - flow pump

M. O’REGAN AND K. MORANCOMPRESSIBILITY, PERMEABILITY, AND STRESS HISTORY OF SEDIMENTS 25
Figure F6 (continued).
10 100 1000 104 105
Sample 207-1261A-6R-6, 134 cm
Voi
d ra
tio
0
5
10
15
20
25
30
3510 100 1000 104 105
Vol
umet
ric s
trai
n (%
)
0.5 0.6 0.7 0.8 0.9 1.0 1.1 1.2
y = 3.0462e-10 * e^(2.6758x) R = 0.98794
Hyd
raul
ic c
ondu
ctiv
ity (
cm/s
)
0.3
0.5
0.7
0.9
1.1
1.3
1.5
1 10 100 1000 104 105
Sample 207-1261A-4R-2, 140 cm
Test ATest B
Voi
d ra
tio
0
10
20
30
40
501 10 100 1000 104 105
Vol
umet
ric s
trai
n (%
)0.4 0.6 0.8 1.0 1.2 1.4 1.6
Test A Cv - derivedTest B Cv - derivedTest B - flow pump
y = 2.1783e-10 * e^(2.4984x) R = 0.99254
Hyd
raul
ic c
ondu
ctiv
ity (
cm/s
)
A B C
0.1
0.3
0.5
0.7
0.9
1.1
10 100 1000 104 105
Sample 207-1261A-9R-5, 140 cm
Voi
d ra
tio
Stress (kPa)
Broken porous stone
0
10
20
30
40
5010 100 1000 104 105
Vol
umet
ric s
trai
n (%
)
Stress (kPa)
0.2 0.4 0.6 0.8 1.0 1.2
y = 1.3462e-10 * e^(3.8685x) R = 0.9563
Hyd
raul
ic c
ondu
ctiv
ity (
cm/s
)
Void ratio
Broken porous stone
0.5
0.6
0.7
0.8
0.9
1.0
1.1
1.2
10-10
10-9
10-8
10-7
10-6
10-5
10-10
10-9
10-8
10-7
10-6
10-10
10-9
10-8
10-7
10-6
Void ratio
Void ratio
M. O’REGAN AND K. MORANCOMPRESSIBILITY, PERMEABILITY, AND STRESS HISTORY OF SEDIMENTS 26
Figure F6 (continued).
1 10 100 1000 104 105
Sample 207-1261A-13R-4, 140 cm
Voi
d ra
tio
1 10 100 1000 104 105V
olum
etric
str
ain
(%)
0.2 0.4 0.6 0.8 1.0 1.2
y = 4.3615e-11 * e^(5.7882x) R = 0.92119
Hyd
raul
ic c
ondu
ctiv
ity (
cm/s
)
A B C
1 10 100 1000 104 105
Sample 207-1261A-20R-1, 140 cm
Voi
d ra
tio
1 10 100 1000 104 105
Vol
umet
ric s
trai
n (%
)
0.2 0.4 0.6 0.8 1.0 1.2
y = 1.0613e-11 * e^(7.8266x) R = 0.51831
Hyd
raul
ic c
ondu
ctiv
ity (
cm/s
)
Void ratio
Void ratio
Void ratio
1 10 100 1000 104 105
Sample 207-1259A-3R-5, 127 cm
Voi
d ra
tio
Stress (kPa)1 10 100 1000 104 105
Vol
umet
ric s
trai
n (%
)
Stress (kPa)
10-10
10-9
10-8
10-7
10-6
10-5
0.8 1.0 1.2 1.4 1.6 1.8 2.0 2.2
y = 6.4437e-09 * e^(2.9697x) R = 0.99481
Hyd
raul
ic c
ondu
ctiv
ity (
cm/s
)
0.4
0.5
0.6
0.7
0.8
0.9
1.0
1.1
0.7
0.8
0.9
1.0
0.8
1.0
1.2
1.4
1.6
1.8
2.0
2.2
0
5
10
15
20
25
30
0
2
4
6
8
10
12
14
0
10
20
30
40
50
10-10
10-9
10-8
10-7
10-6
10-10
10-9
10-8
10-7
10-6
k - Cv derivedk - flow pump

M. O’REGAN AND K. MORANCOMPRESSIBILITY, PERMEABILITY, AND STRESS HISTORY OF SEDIMENTS 27
Figure F7. Effective stress, void ratio, and hydraulic conductivity profile for Site 1257. Stress history datawere used to calculate the maximum past effective stress profile for the sedimentary column (Equation 19,p. 13) and predict in situ e from consolidation test results (Equation 18, p. 9). At Site 1257, 1200 kPa ofoverburden was added to the hydrostatic effective stress profile to determine the maximum past effectivestress (Table T1, p. 30). Laboratory measurements of e (gray diamonds) were rebound corrected (Equation17, p. 9, black triangles) using the hydrostatically determined effective stress profile (Equation 5, p. 6), ex-cept for Unit V of Site 1257, where significant underconsolidation was present. For this unit, the presenteffective stress is equal to the maximum past effective stress and is used for both rebound corrections oflaboratory measurements and e predictions from consolidation test results. The hydraulic conductivity ofsediments was calculated in two ways: (1) by using the e-log(k) relationship for individual lithotypes on therebound-corrected laboratory measurements of e (black stars) and (2) by applying the e-log(k) relationshipto the predicted e profile (orange line) (Table T3, p. 32). Often the predicted e overestimates the in situ e,and thus serves as an upper bound to sediment permeability. For Unit III, an upper and lower permeabilitywere determined by applying the e-log(k) relationship from Samples 207-1257C-6R-3, 140 cm, and 207-1258B-36R-2, 45 cm. Blue shading represents a qualitative estimate for the possible range of hydraulic con-ductivity within each lithologic unit.
10-11 10-9 10-7 10-5 10-3
Hydraulic conductivity (cm/s)0 1 2 3 4 5
Void ratio0 1000 2000 3000
0
50
100
150
200
250
300
Effective stress (kPa)
Dep
th (
mcd
)
0 1 2 3 4 5
Void ratio
Hydrostatic effective stress
Maxim
um past effective stress
Unit II
Unit III
Unit IV
Unit V
Nannofossil chalk withforams, nannofossil ooze with forams
Siliceous nannofossil chalk with forams to nannofossil chalk with siliceous microfossils and forams
Nannofossil chalk and foram nannofossil chalk
Foram nannofossil chalk
Black shale
Silty calcareous claystone to clayey carbonate siltstone
A B C D
Laboratory-measured void ratio
Rebound-corrected void ratio (maximum past effective stress)
k from rebound-corrected laboratory measurments of void ratio (maximum past effective stress)
Rebound-corrected void ratio (hydrostatic effective stress)
Predicted void ratio (maximum past effective stress)
Predicted void ratio (maximum past effective stress, rebounded after erosion)
Predicted void ratio (hydrostatic effective stress)
Predicted k (maximum past effective stress, rebound corrected after erosion)
Predicted k, (maximum past effective stress, rebound corrected after erosion, Unit III, Section 207-1258B-36R-2)
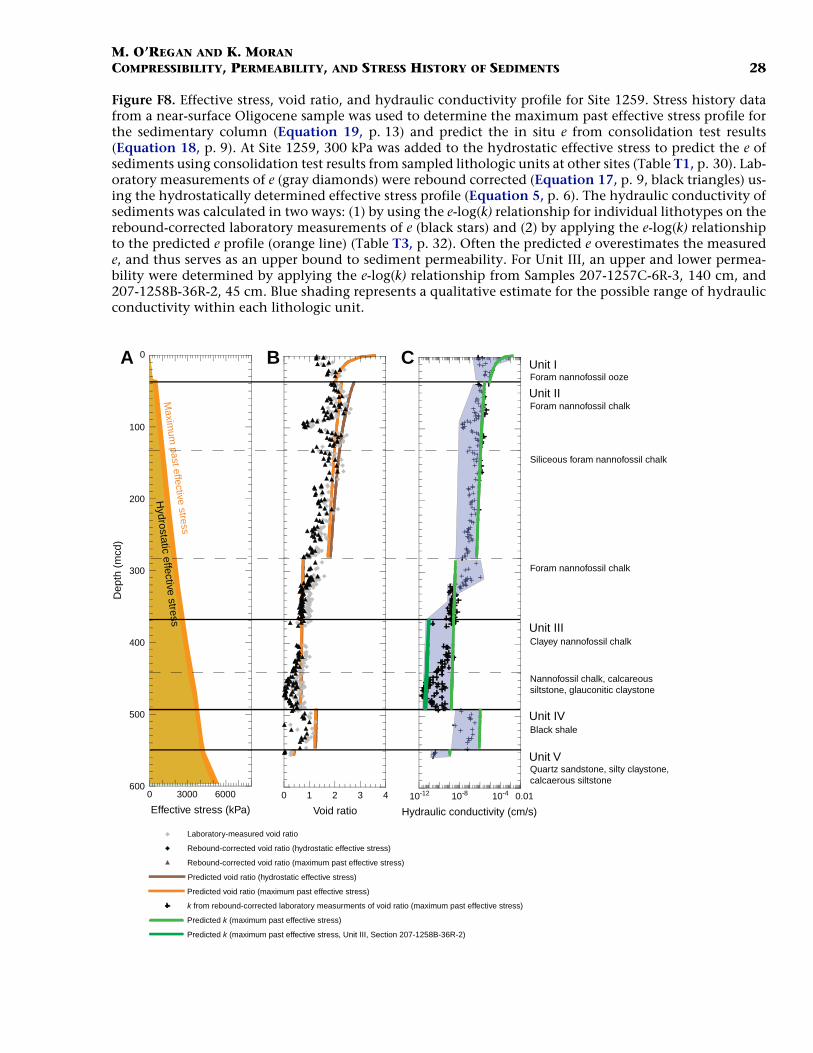
M. O’REGAN AND K. MORANCOMPRESSIBILITY, PERMEABILITY, AND STRESS HISTORY OF SEDIMENTS 28
Figure F8. Effective stress, void ratio, and hydraulic conductivity profile for Site 1259. Stress history datafrom a near-surface Oligocene sample was used to determine the maximum past effective stress profile forthe sedimentary column (Equation 19, p. 13) and predict the in situ e from consolidation test results(Equation 18, p. 9). At Site 1259, 300 kPa was added to the hydrostatic effective stress to predict the e ofsediments using consolidation test results from sampled lithologic units at other sites (Table T1, p. 30). Lab-oratory measurements of e (gray diamonds) were rebound corrected (Equation 17, p. 9, black triangles) us-ing the hydrostatically determined effective stress profile (Equation 5, p. 6). The hydraulic conductivity ofsediments was calculated in two ways: (1) by using the e-log(k) relationship for individual lithotypes on therebound-corrected laboratory measurements of e (black stars) and (2) by applying the e-log(k) relationshipto the predicted e profile (orange line) (Table T3, p. 32). Often the predicted e overestimates the measurede, and thus serves as an upper bound to sediment permeability. For Unit III, an upper and lower permea-bility were determined by applying the e-log(k) relationship from Samples 207-1257C-6R-3, 140 cm, and207-1258B-36R-2, 45 cm. Blue shading represents a qualitative estimate for the possible range of hydraulicconductivity within each lithologic unit.
0 3000 6000
Effective stress (kPa)
Dep
th (
mcd
)
0 1 2 3 4
Void ratio
Hydrostatic effective stress
Maxim
um past effective stress
10-12 10-8 10-4
Hydraulic conductivity (cm/s)
Unit II
Unit III
Unit IV
Unit V
Unit IForam nannofossil ooze
Foram nannofossil chalk
Clayey nannofossil chalk
Siliceous foram nannofossil chalk
Black shale
Quartz sandstone, silty claystone, calcaerous siltstone
Foram nannofossil chalk
Nannofossil chalk, calcareous siltstone, glauconitic claystone
A B C0
100
200
300
400
500
6000.01
Laboratory-measured void ratio
Rebound-corrected void ratio (maximum past effective stress)
k from rebound-corrected laboratory measurments of void ratio (maximum past effective stress)
Rebound-corrected void ratio (hydrostatic effective stress)
Predicted void ratio (maximum past effective stress)
Predicted void ratio (hydrostatic effective stress)
Predicted k (maximum past effective stress)
Predicted k (maximum past effective stress, Unit III, Section 207-1258B-36R-2)

M. O’REGAN AND K. MORANCOMPRESSIBILITY, PERMEABILITY, AND STRESS HISTORY OF SEDIMENTS 29
Figure F9. Effective stress, void ratio, and hydraulic conductivity profile for Site 1261. Stress history datafrom Unit I sediments were used to determine the maximum past effective stress profile for the sedimentarycolumn (Equation 19, p. 13) and predict the in situ e from consolidation tests (Equation 18, p. 9). At Site1261, 600 kPa (determined from the highest OCR of Unit I samples from the site) was added to the hydro-static effective stress to predict the e of sediments using consolidation tests (Table T1, p. 30). Below Unit I,consolidation results from lithologic units recovered at other sites were used to predict in situ e. Laboratorymeasurements of e (gray diamonds) were rebound corrected (Equation 17, p. 9, black triangles) using thehydrostatically determined effective stress profile (Equation 5, p. 6). The hydraulic conductivity of sedi-ments was calculated in two ways: (1) by using the e-log(k) relationship for individual lithotypes on therebound-corrected laboratory measurements of e (black stars) and (2) by applying the e-log(k) relationshipto the predicted e profile (orange line) (Table T3, p. 32). Often the predicted e overestimates the measurede, and thus serves as an upper bound to sediment permeability. For Unit III, an upper and lower permea-bility were determined by applying the e-log(k) relationship from Samples 207-1257C-6R-3, 140 cm, and207-1258B-36R-2, 45 cm. Blue shading represents a qualitative estimate for the possible range of hydraulicconductivity within each lithologic unit.
0 1 2 3
Void ratio10-12 10-10 10-8 10-6
Hydraulic conductivity (cm/s)
Unit II
Unit III
Unit IV
Unit INannofossil ooze
Clayey nannofossil ooze(debris flow)
Calcareous chalk with clay
Black shale
Nannofossil clay
Nannofossil chalk with clayClayey nannofossil chalk
0 3000 6000
Effective stress (kPa)
Dep
th (
mcd
) Hydrostatic effective stress
Maxim
um past effective stress
A B C0
100
200
300
400
500
600
700
Laboratory-measured void ratio
Rebound-corrected void ratio (maximum past effective stress)
k from rebound-corrected laboratory measurments of void ratio (maximum past effective stress)
Rebound-corrected void ratio (hydrostatic effective stress)
Predicted void ratio (maximum past effective stress)
Predicted void ratio (hydrostatic effective stress)
Predicted k (maximum past effective stress)
Predicted k (maximum past effective stress, Unit III, Section 207-1258B-36R-2)

M. O
’RE
GA
N A
ND
K. M
OR
AN
CO
MP
RE
SSIBIL
ITY, P
ER
ME
AB
ILIT
Y, A
ND
ST
RE
SS HIST
OR
Y O
F SE
DIM
EN
TS
30
Table
Notes: L eocomp Loadtrack testing apparatus, LA = lever arm testing apparatus. σ′ = effective stress, Pc′ = preconsoli-datio recompression index, eo = initial void ratio, OCRm = modified OCR.
Hole, cointer ge Description
In situ σ′ (kPa)
Pc′ (kPa) OCR Cc Cr eo
Pc′ – σ′OCRm(kPa) (m)*
207-1257C e–early Eocene Siliceous nannofossil chalk
with foraminifers490 2000 4.08 1.03 0.04 5.18 1510 246
1257C leocene Nannofossil chalk, foram nannofossil chalk
850 1850 2.18 0.36 0.08 1.97 1000 163
1257C Black shale 1330 1850 1.39 1.01 0.07 4.91 520 85 0.721257C lbian Silty calcareous claystone 1575 550 0.35 0.29 0.08 1.48 –1025 –167 0.191258B- Nannofossil chalk with forams 2575 2750 1.07 0.70 0.12 3.37 175 281258B- Black shale 3240 1250 0.39 0.45 0.05 2.53 –1990 –3241259A- , slumped Foram nannofossil ooze 140 450 3.21 0.88 0.09 4.08 310 50
1261A- e–late Miocene Nannofossil clay 450 250 0.56 0.67 0.12 2.94 –200 –331261A- e–late Miocene Nannofossil clay 450 0.83 0.18 3.541261A- e–late Miocene Nannofossil clay 1400 1550 1.11 0.80 0.18 3.54 150 241261A- e–late Miocene Nannofossil clay 1935 2600 1.34 0.76 0.17 3.42 665 1081261A- e–late Miocene Nannofossil clay 2245 2400 1.07 0.58 0.12 2.78 155 251261A- Clayey nannofossil ooze 2775 2900 1.05 0.26 0.03 1.81 125 20
T1. Summary of laboratory consolidation results.
ith. = lithostratigraphic. * = assuming mean density of 1.65 g/cm3. LT = Gn pressure, OCR = overconsolidation ratio, Cc = compression index, Cr =
re, section, val (cm)
Test device
DepthInitial
sample void ratio
Specific gravity
(Gs)Lith. unit A(mbsf) (mcd)
-1R-2, 140 LT 84.90 84.90 1.87 2.70 IIB early Oligocen
-6R-3, 140 LT 134.50 135.70 0.97 2.63 IIIA late–middle Pa
-13R-1, 130 LT 198.60 201.15 1.78 2.33 IV Cretaceous-16R-5, 135 LT 233.55 234.71 0.74 2.79 V middle–late A36R-2, 8 LA 331.68 344.49 1.12 2.70 III Maastrichtian45R-4, 45 LA 401.21 422.04 1.20 2.35 IV Cretaceous3R-5, 127 LT 25.57 25.57 2.20 2.74 IA early Miocene
Oligocene4R-2, 90 LT 72.10 72.10 1.48 2.78 IB middle Pliocen4R-2, 90 B LA 72.10 72.10 1.60 2.78 IB middle Pliocen6R-6, 134 LA 197.95 197.95 1.19 2.70 IB middle Pliocen9R-5, 139 LA 263.59 263.59 1.16 2.68 IB middle Pliocen13R-4, 140 LT 300.60 300.60 1.04 2.50 IB middle Pliocen20R-1, 140 LT 363.50 363.50 0.99 2.73 IC late Miocene

M. O’REGAN AND K. MORANCOMPRESSIBILITY, PERMEABILITY, AND STRESS HISTORY OF SEDIMENTS 31
Table T2. Lunne’s criteria for evaluating sample dis-turbance from consolidation test results.
Notes: Lunne’s criteria from Lunne et al. (1999). Sample quality isdetermined by evaluating the volumetric strain (percent) thatoccurs prior to reaching the preconsolidation pressure duringconsolidation testing. OCR = overconsolidation ratio.
OCRVery good
to excellentGood to fair Poor
Very poor
2–4 <4 4–7 7–14 >141–2 <3 3–5 5–10 >10

M. O’REGAN AND K. MORANCOMPRESSIBILITY, PERMEABILITY, AND STRESS HISTORY OF SEDIMENTS 32
Table T3. Summary of derived and measured hydraulic conductivity results.
Note: σ′ = effective stress, e = void ratio, Cv = coefficient of consolidation, Av = slope of the load-displacement curve,k = hydraulic conductivity.
Hole, core, section
σ′ (kPa)
e start of load
e end of load
Average e
Cv(cm2/s)
Av(m2/N)
Derived k(cm/s)
Measured k(cm/s) Ratio Slope Intercept
207-1257C-1R-2 2093 1.77 1.73 1.75 1.57E–04 7.81E–08 4.46E–10 1.78E–07 398.9 1.29 –8.98
3140 1.73 1.59 1.66 1.50E–03 1.35E–07 7.65E–09 1.19E–07 15.64186 1.59 1.45 1.52 4.79E–04 1.35E–07 2.57E–09 8.29E–08 32.26280 1.45 1.26 1.35 8.43E–04 9.28E–08 3.34E–09 4.33E–08 13.08374 1.26 1.12 1.19 1.08E–04 6.33E–08 3.15E–10 2.95E–08 93.9
1257C-6R-3 1036 0.83 0.81 0.82 7.62E–04 8.38E–08 3.52E–09 4.39E–09 1.2 3.90 –11.581554 0.81 0.79 0.80 1.32E–03 5.24E–08 3.87E–09 3.00E–09 0.82072 0.79 0.76 0.77 4.62E–04 4.83E–08 1.26E–09 2.25E–09 1.83109 0.76 0.71 0.74 6.97E–04 4.87E–08 1.96E–09 1.29E–09 0.74145 0.71 0.67 0.69 2.94E–04 4.29E–08 7.49E–10 1.27E–09 1.76281 0.67 0.62 0.64 1.60E–03 2.53E–08 2.47E–098290 0.62 0.53 0.58 9.23E–05 4.11E–08 2.42E–10
1257C-13R-1 2049 1.51 1.45 1.48 2.77E–03 1.30E–07 1.48E–08 9.50E–07 64.0 1.98 –8.923073 1.45 1.35 1.40 4.63E–03 9.60E–08 1.86E–08 5.12E–07 27.64098 1.35 1.25 1.30 3.04E–04 9.10E–08 1.21E–09 3.28E–07 271.36147 1.25 1.08 1.17 2.11E–03 8.70E–08 8.50E–09 1.71E–07 20.28196 1.08 0.95 1.01 1.46E–04 6.20E–08 4.52E–10 1.18E–07 261.5
1257C-16R-5 1554 0.59 0.54 0.56 9.52E–03 7.82E–08 4.78E–08 3.46 –10.522073 0.54 0.51 0.53 1.94E–04 7.05E–08 9.01E–10 1.25E–09 1.43108 0.51 0.46 0.48 1.83E–04 4.21E–08 5.22E–10 1.47E–09 2.84145 0.46 0.43 0.45 9.81E–05 3.00E–08 2.04E–10 1.37E–09 6.76217 0.43 0.37 0.40 6.95E–05 2.77E–08 1.38E–10 4.28E–10 3.18290 0.37 0.33 0.35 1.34E–04 1.91E–08 1.90E–10
1258B-36R-2 2582 1.00 0.95 0.98 3.78E–04 6.92E–09 1.33E–10 5.88 –15.263785 0.95 0.90 0.93 8.09E–04 4.25E–09 1.79E–105482 0.90 0.80 0.85 7.48E–04 6.20E–09 2.52E–106635 0.80 0.71 0.75 1.53E–05 7.53E–09 6.61E–128030 0.71 0.59 0.65 7.74E–06 6.97E–09 3.28E–12
1258B-45R-4 6140 0.89 0.82 0.86 2.26E–08 1.42E–03 1.74E–097140 0.82 0.80 0.81 3.22E–08 4.72E–04 8.36E–108200 0.80 0.77 0.79 5.87E–09 9.95E–05 3.22E–11 1.67E–07
1259A-3R-5 246 1.89 1.83 1.86 1.15E–02 6.50E–07 2.62E–07 1.29 –8.19369 1.83 1.75 1.79 9.03E–03 7.10E–07 2.31E–07 1.27E–06 5.5553 1.75 1.64 1.69 5.23E–03 5.60E–07 1.09E–07 8.27E–07 7.6
1107 1.64 1.43 1.54 9.15E–03 3.85E–07 1.40E–07 4.02E–07 2.92214 1.43 1.16 1.29 7.62E–03 2.48E–07 8.27E–08 1.99E–07 2.44428 1.16 0.85 1.00 5.87E–03 1.37E–07 4.02E–08 8.47E–08 2.1
1261A-4R-2 400 1.25 1.20 1.22 9.38E–04 5.50E–07 2.33E–08 1.50 –9.69500 1.20 1.13 1.16 4.12E–04 7.10E–07 1.36E–08750 1.13 1.03 1.08 3.13E–04 4.16E–07 6.29E–09
1000 1.03 0.95 0.99 2.39E–04 3.04E–07 3.66E–092000 0.95 0.72 0.84 5.01E–04 2.38E–07 6.52E–093000 0.72 0.62 0.67 3.62E–04 1.06E–07 2.31E–09
1261A-4R-2 B 1274 1.13 0.96 1.05 2.47E–04 3.11E–07 3.77E–09 2.56E–09 0.7 1.09 –9.662582 0.96 0.75 0.86 3.60E–04 1.65E–07 3.20E–09 1.29E–09 0.45482 0.75 0.39 0.57 2.50E–04 1.28E–07 2.04E–09 5.92E–10 0.3
1261A-6R-6 1824 0.97 0.91 0.94 1.42E–03 1.10E–07 8.11E–09 3.50E–09 0.4 1.16 –9.742582 0.91 0.81 0.86 2.81E–093785 0.81 0.68 0.75 4.51E–04 1.08E–07 2.81E–09 1.67E–09 0.65482 0.68 0.52 0.60 3.08E–04 9.58E–08 1.85E–09 1.31E–09 0.7
1261A-9R-5 2582 0.88 0.82 0.85 8.61E–04 8.45E–08 3.94E–09 2.98E–09 0.8 0.99 –9.373785 0.82 0.71 0.77 3.85E–04 9.33E–08 2.05E–09 2.44E–09 1.25400 0.71 0.57 0.64 3.35E–04 8.51E–08 1.74E–09 1.15E–09 0.78030 0.57 0.20 0.39 1.49E–07 7.44E–10
1261A-13R-4 4145 0.75 0.70 0.72 9.27E–04 4.80E–08 2.58E–096218 0.70 0.60 0.65 7.71E–04 4.80E–08 2.24E–098290 0.60 0.52 0.56 4.45E–04 3.60E–08 1.03E–09
1261A-20R-1 4145 0.87 0.85 0.86 8.35E–03 1.60E–08 7.23E–096218 0.85 0.81 0.83 9.62E–03 1.90E–08 1.00E–088290 0.81 0.77 0.79 4.05E–03 2.00E–08 4.51E–09

M. O’REGAN AND K. MORANCOMPRESSIBILITY, PERMEABILITY, AND STRESS HISTORY OF SEDIMENTS 33
Table T4. Summary of low-gradient flow pump results and k calculations. (Seetable note. Continued on next two pages.)
Hole, core, section
Stress (kPa)
Sample height (mm)
Cross-sectional
area (cm2)q
(cm3/s)Hydraulic gradient, l k (cm/s) Slope (q-i) R2
k from slope (cm/s)
207-1257C-1R-2 2093 20.28 19.35 –4.34E–05 –12.9 –1.76E–07 3.44E–06 0.999 1.78E–07
20.28 19.35 4.34E–05 11.2 2.03E–0720.28 19.35 –9.45E–05 –29.5 –1.68E–0720.28 19.35 9.45E–05 25.9 1.91E–07
3140 19.98 19.35 4.34E–05 14.7 1.55E–07 2.31E–06 1.000 1.19E–0719.98 19.35 –4.34E–05 –19.6 –1.16E–0719.98 19.35 9.45E–05 39.8 1.24E–0719.98 19.35 –9.45E–05 –42.0 –1.18E–0719.98 19.35 1.89E–04 80.7 1.23E–0719.98 19.35 –1.89E–04 –84.0 –1.18E–07
4186 18.94 19.35 1.93E–05 10.6 9.51E–08 1.60E–06 0.998 8.29E–0818.94 19.35 –1.93E–05 –12.4 –8.16E–0818.94 19.35 4.34E–05 23.7 9.56E–0818.94 19.35 –4.34E–05 –25.7 –8.83E–0818.94 19.35 9.45E–05 60.0 8.24E–0818.94 19.35 –9.45E–05 –60.0 –8.24E–08
6280 17.91 19.35 –1.93E–05 –28.5 –3.54E–08 8.37E–07 0.995 4.33E–0817.91 19.35 1.93E–05 23.0 4.38E–0817.91 19.35 –4.34E–05 –44.4 –5.11E–0817.91 19.35 4.34E–05 43.7 5.19E–0817.91 19.35 –9.45E–05 –114.5 –4.32E–0817.91 19.35 9.45E–05 115.9 4.26E–08
8375 16.49 19.35 –1.93E–05 –36.1 –2.79E–08 5.71E–07 0.996 2.95E–0816.49 19.35 1.93E–05 38.1 2.65E–0816.49 19.35 –4.34E–05 –68.7 –3.31E–0816.49 19.35 9.52E–06 17.3 2.88E–0816.49 19.35 –9.52E–06 –15.7 –3.16E–0816.49 19.35 4.34E–05 79.6 2.85E–08
1257C-6R-3 1036 18.54 19.35 9.52E–06 115.4 4.26E–09 8.50E–08 0.991 4.39E–0918.54 19.35 3.94E–06 47.8 4.26E–0918.54 19.35 –9.52E–06 –100.6 4.89E–0918.54 19.35 –3.94E–06 –57.9 3.52E–09
1554 18.29 19.35 –3.94E–06 –68.1 2.99E–09 5.81E–08 1.000 3.00E–0918.29 19.35 3.94E–06 67.6 3.01E–09
2072 18.03 19.35 –3.94E–06 –96.0 2.12E–09 4.36E–08 0.987 2.25E–0918.03 19.35 3.94E–06 83.2 2.45E–0918.03 19.35 –1.97E–06 –53.3 1.91E–0918.03 19.35 1.97E–06 34.4 2.96E–09
3109 17.66 19.35 –3.94E–06 141.9 –1.43E–09 2.49E–08 0.989 1.29E–0917.66 19.35 3.94E–06 –174.4 –1.17E–0917.66 19.35 –1.97E–06 72.4 –1.41E–09
4145 17.19 19.35 –3.94E–06 171.9 –1.18E–09 2.46E–08 0.994 1.27E–0917.19 19.35 3.94E–06 –147.1 –1.38E–09
1257C-13R-1 2047 17.87 25.55 –1.89E–04 –8.6 8.56E–07 2.43E–05 0.995 9.51E–0717.87 25.55 1.89E–04 9.0 8.18E–0717.87 25.55 –4.39E–04 –18.2 9.46E–0717.87 25.55 4.39E–04 16.9 1.02E–06
3072 17.27 25.55 –9.45E–05 –7.7 4.83E–07 1.31E–05 0.997 5.13E–0717.27 25.55 9.45E–05 6.1 6.04E–0717.27 25.55 –1.89E–04 –13.4 5.51E–0717.27 25.55 1.89E–04 15.5 4.76E–0717.27 25.55 –4.39E–04 –35.0 4.90E–07
4096 16.58 25.55 9.45E–05 9.9 3.72E–07 8.38E–06 0.992 3.28E–0716.58 25.55 –9.45E–05 –10.8 3.42E–0716.58 25.55 1.89E–04 22.9 3.22E–0716.58 25.55 –1.89E–04 –22.9 3.23E–0716.58 25.55 4.39E–04 42.2 4.07E–0716.58 25.55 –4.39E–04 –53.1 3.24E–07
6144 15.60 25.55 9.45E–05 19.1 1.93E–07 4.38E–06 0.985 1.71E–0715.60 25.55 –9.45E–05 –20.9 1.77E–0715.60 25.55 1.89E–04 36.5 2.02E–0715.60 25.55 –1.89E–04 –50.4 1.47E–0715.60 25.55 –4.34E–05 –7.5 2.25E–07
8192 14.51 25.55 –9.45E–05 –33.2 1.11E–07 3.02E–06 0.990 1.18E–0714.51 25.55 4.34E–05 12.3 1.38E–0714.51 25.55 –4.34E–05 –10.3 1.65E–07
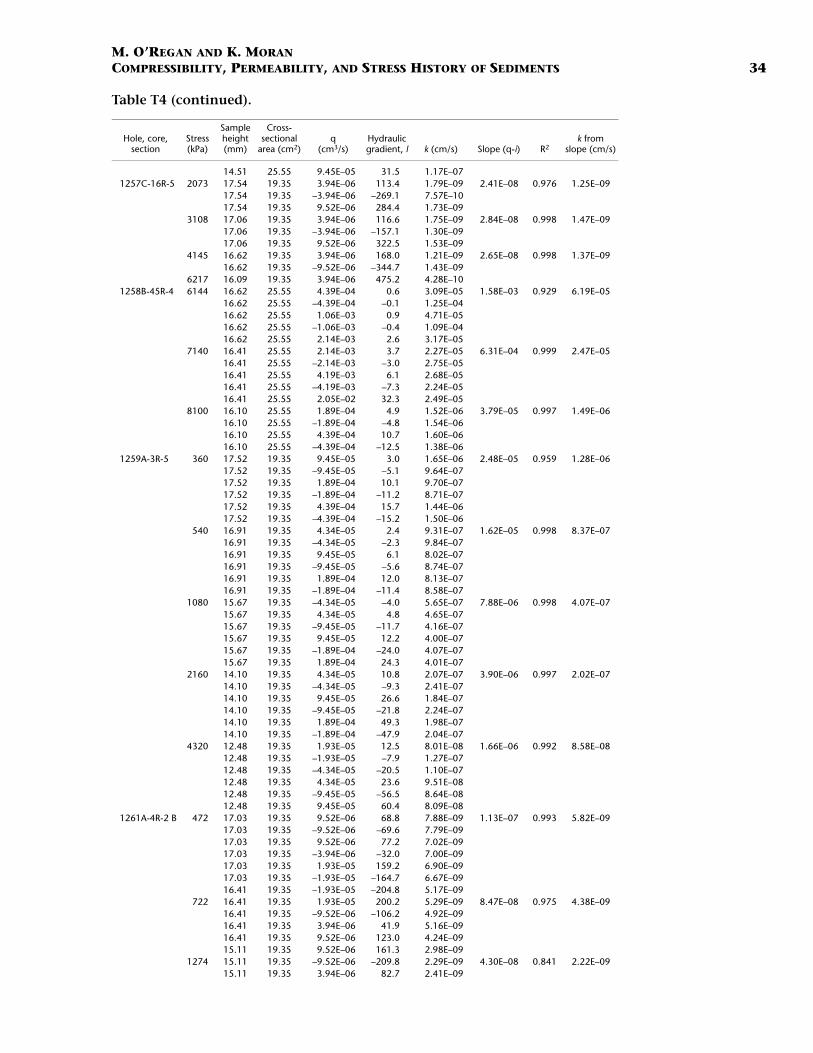
M. O’REGAN AND K. MORANCOMPRESSIBILITY, PERMEABILITY, AND STRESS HISTORY OF SEDIMENTS 34
14.51 25.55 9.45E–05 31.5 1.17E–071257C-16R-5 2073 17.54 19.35 3.94E–06 113.4 1.79E–09 2.41E–08 0.976 1.25E–09
17.54 19.35 –3.94E–06 –269.1 7.57E–1017.54 19.35 9.52E–06 284.4 1.73E–09
3108 17.06 19.35 3.94E–06 116.6 1.75E–09 2.84E–08 0.998 1.47E–0917.06 19.35 –3.94E–06 –157.1 1.30E–0917.06 19.35 9.52E–06 322.5 1.53E–09
4145 16.62 19.35 3.94E–06 168.0 1.21E–09 2.65E–08 0.998 1.37E–0916.62 19.35 –9.52E–06 –344.7 1.43E–09
6217 16.09 19.35 3.94E–06 475.2 4.28E–101258B-45R-4 6144 16.62 25.55 4.39E–04 0.6 3.09E–05 1.58E–03 0.929 6.19E–05
16.62 25.55 –4.39E–04 –0.1 1.25E–0416.62 25.55 1.06E–03 0.9 4.71E–0516.62 25.55 –1.06E–03 –0.4 1.09E–0416.62 25.55 2.14E–03 2.6 3.17E–05
7140 16.41 25.55 2.14E–03 3.7 2.27E–05 6.31E–04 0.999 2.47E–0516.41 25.55 –2.14E–03 –3.0 2.75E–0516.41 25.55 4.19E–03 6.1 2.68E–0516.41 25.55 –4.19E–03 –7.3 2.24E–0516.41 25.55 2.05E–02 32.3 2.49E–05
8100 16.10 25.55 1.89E–04 4.9 1.52E–06 3.79E–05 0.997 1.49E–0616.10 25.55 –1.89E–04 –4.8 1.54E–0616.10 25.55 4.39E–04 10.7 1.60E–0616.10 25.55 –4.39E–04 –12.5 1.38E–06
1259A-3R-5 360 17.52 19.35 9.45E–05 3.0 1.65E–06 2.48E–05 0.959 1.28E–0617.52 19.35 –9.45E–05 –5.1 9.64E–0717.52 19.35 1.89E–04 10.1 9.70E–0717.52 19.35 –1.89E–04 –11.2 8.71E–0717.52 19.35 4.39E–04 15.7 1.44E–0617.52 19.35 –4.39E–04 –15.2 1.50E–06
540 16.91 19.35 4.34E–05 2.4 9.31E–07 1.62E–05 0.998 8.37E–0716.91 19.35 –4.34E–05 –2.3 9.84E–0716.91 19.35 9.45E–05 6.1 8.02E–0716.91 19.35 –9.45E–05 –5.6 8.74E–0716.91 19.35 1.89E–04 12.0 8.13E–0716.91 19.35 –1.89E–04 –11.4 8.58E–07
1080 15.67 19.35 –4.34E–05 –4.0 5.65E–07 7.88E–06 0.998 4.07E–0715.67 19.35 4.34E–05 4.8 4.65E–0715.67 19.35 –9.45E–05 –11.7 4.16E–0715.67 19.35 9.45E–05 12.2 4.00E–0715.67 19.35 –1.89E–04 –24.0 4.07E–0715.67 19.35 1.89E–04 24.3 4.01E–07
2160 14.10 19.35 4.34E–05 10.8 2.07E–07 3.90E–06 0.997 2.02E–0714.10 19.35 –4.34E–05 –9.3 2.41E–0714.10 19.35 9.45E–05 26.6 1.84E–0714.10 19.35 –9.45E–05 –21.8 2.24E–0714.10 19.35 1.89E–04 49.3 1.98E–0714.10 19.35 –1.89E–04 –47.9 2.04E–07
4320 12.48 19.35 1.93E–05 12.5 8.01E–08 1.66E–06 0.992 8.58E–0812.48 19.35 –1.93E–05 –7.9 1.27E–0712.48 19.35 –4.34E–05 –20.5 1.10E–0712.48 19.35 4.34E–05 23.6 9.51E–0812.48 19.35 –9.45E–05 –56.5 8.64E–0812.48 19.35 9.45E–05 60.4 8.09E–08
1261A-4R-2 B 472 17.03 19.35 9.52E–06 68.8 7.88E–09 1.13E–07 0.993 5.82E–0917.03 19.35 –9.52E–06 –69.6 7.79E–0917.03 19.35 9.52E–06 77.2 7.02E–0917.03 19.35 –3.94E–06 –32.0 7.00E–0917.03 19.35 1.93E–05 159.2 6.90E–0917.03 19.35 –1.93E–05 –164.7 6.67E–0916.41 19.35 –1.93E–05 –204.8 5.17E–09
722 16.41 19.35 1.93E–05 200.2 5.29E–09 8.47E–08 0.975 4.38E–0916.41 19.35 –9.52E–06 –106.2 4.92E–0916.41 19.35 3.94E–06 41.9 5.16E–0916.41 19.35 9.52E–06 123.0 4.24E–0915.11 19.35 9.52E–06 161.3 2.98E–09
1274 15.11 19.35 –9.52E–06 –209.8 2.29E–09 4.30E–08 0.841 2.22E–0915.11 19.35 3.94E–06 82.7 2.41E–09
Hole, core, section
Stress (kPa)
Sample height (mm)
Cross-sectional
area (cm2)q
(cm3/s)Hydraulic gradient, l k (cm/s) Slope (q-i) R2
k from slope (cm/s)
Table T4 (continued).

M. O’REGAN AND K. MORANCOMPRESSIBILITY, PERMEABILITY, AND STRESS HISTORY OF SEDIMENTS 35
Note: q = flow rate, k = hydraulic conductivity.
15.11 19.35 –9.52E–06 –84.1 5.72E–0913.48 19.35 –3.94E–06 –139.5 1.27E–09
2582 13.48 19.35 3.94E–06 144.9 1.23E–09 2.63E–08 0.984 1.36E–0913.48 19.35 –1.97E–06 –64.9 1.37E–0910.67 19.35 1.97E–06 110.9 6.34E–10
5486 10.67 19.35 –1.97E–06 –104.8 6.71E–10 1.31E–08 0.974 6.76E–1010.67 19.35 –2.96E–06 –224.1 4.71E–10
1261A-6R-6 1821 17.70 19.35 –3.94E–06 –56.8 3.58E–09 6.76E–08 0.999 3.50E–0917.70 19.35 3.94E–06 57.0 3.57E–0917.70 19.35 –9.52E–06 –145.9 3.37E–0917.70 19.35 9.52E–06 136.5 3.61E–09
2582 16.98 19.35 3.94E–06 73.0 2.79E–09 5.45E–08 1.000 2.81E–0916.98 19.35 –3.94E–06 –78.3 2.60E–0916.98 19.35 9.52E–06 171.3 2.87E–0916.98 19.35 –9.52E–06 –175.4 2.81E–09
3785 15.95 19.35 –3.94E–06 –95.3 2.14E–09 3.23E–08 0.996 1.67E–0915.95 19.35 3.94E–06 128.5 1.58E–0915.95 19.35 –9.52E–06 –266.6 1.85E–0915.95 19.35 9.52E–06 276.7 1.78E–0915.95 19.35 –1.93E–05 –616.5 1.62E–09
5482 14.63 19.35 3.94E–06 131.3 1.55E–09 2.53E–08 0.995 1.31E–0914.63 19.35 –3.94E–06 –186.2 1.09E–0914.63 19.35 9.52E–06 351.4 1.40E–0914.63 19.35 1.97E–06 97.1 1.05E–0914.63 19.35 –1.97E–06 –88.5 1.15E–09
1261A-9R-5 2582 17.16 19.35 3.94E–06 65.4 3.11E–09 5.76E–08 0.998 2.98E–0917.16 19.35 –3.94E–06 –65.6 3.10E–0917.16 19.35 9.52E–06 156.2 3.15E–0917.16 19.35 –9.52E–06 –175.8 2.80E–09
3785 16.38 19.35 –3.94E–06 –103.4 1.97E–09 4.72E–08 0.974 2.44E–0916.38 19.35 3.94E–06 97.8 2.08E–0916.38 19.35 –9.52E–06 –177.6 2.77E–09
5482 15.22 19.35 3.94E–06 173.4 1.17E–09 2.23E–08 1.000 1.15E–0915.22 19.35 –3.94E–06 –180.1 1.13E–09
8096 12.87 19.35 2.76E–06 176.6 8.07E–10 1.44E–08 0.996 7.44E–1012.87 19.35 –1.97E–06 –143.1 7.11E–1012.87 19.35 1.97E–06 145.1 7.01E–10
Hole, core, section
Stress (kPa)
Sample height (mm)
Cross-sectional
area (cm2)q
(cm3/s)Hydraulic gradient, l k (cm/s) Slope (q-i) R2
k from slope (cm/s)
Table T4 (continued).