16-wi-i wisconsin supplement engineering field
TRANSCRIPT
16-WI-i
WISCONSIN SUPPLEMENT ENGINEERING FIELD HANDBOOK
CHAPTER 16 STREAMBANK AND SHORELINE PROTECTION
CONTENTS
Contents ......................................................................................................................................................... i References.....................................................................................................................................................ii Streambank Protection Anatomy of a Healthy Streambank ............................................................................................................... 1 Stream Stability Problem Identification ......................................................................................................... 2 Streambank Protection Design ..................................................................................................................... 4 Stream Channel Restoration Design ............................................................................................................ 5 Suggested Survey Points for Streambank Work........................................................................................... 8 Investigations ................................................................................................................................................ 9 Methods of Evaluation................................................................................................................................. 10 Velocities in Streams................................................................................................................................... 10 Streambank Protection Based on Permissible Velocity.............................................................................. 10 Streambank Protection Based on Permissible Tractive Force (Shear Stress) ........................................... 12 Design Example – Entrenched Channel ..................................................................................................... 14 Design Example – Non-Entrenched Channel ............................................................................................. 23 Rock Riprap Testing and Gradation............................................................................................................ 28 Leaching Protection of Base Soils Protection with Rock Riprap................................................................. 29 Filter Material Design .................................................................................................................................. 29 Rock Riprap Dimensions............................................................................................................................. 30 Volume Computations................................................................................................................................. 31 Toe Protection............................................................................................................................................. 32 Length of Geotextile Needed (Feet) Excluding Overlap ............................................................................. 35 Revetments Blocks ..................................................................................................................................... 36 Gabion and Mattress Revetments .............................................................................................................. 36 Cellular Confinement Systems.................................................................................................................... 36 Wisconsin Design for Stream Barbs ........................................................................................................... 38 Flood Gate and Watering Facility................................................................................................................ 42 Livestock Streambank Watering Ramp....................................................................................................... 46 Alternative Techniques for Streambank Protection .................................................................................... 47 Ice Damage................................................................................................................................................. 48 Shoreline Protection Shoreline Riprap Protection Design Procedure .......................................................................................... 90 Bioengineering Techniques for Small Lake Lakeshore Protection ........................................................... 113 Livestock Lake Shoreline Watering Ramp................................................................................................ 131 Maintenance Plan (Lakeshore) ................................................................................................................. 133
EFH Notice 210-WI-119 February 2009
16-WI-ii
WISCONSIN SUPPLEMENT CHAPTER 16
ENGINEERING FIELD HANDBOOK STREAMBANK PROTECTION
REFERENCES
American Society of Civil Engineers Proceedings, 6/48, Common Slope Protection. Hunt, Robert L., Glossary of Wisconsin Trout Habitat Development Techniques, Wisconsin DNR, 1987. Hunt, Robert L., Trout Stream Therapy, University of Wisconsin Press, 1993. Leopold, Luna B., A View of the River, 1994. National Engineering Handbook, Section 5, NRCS (SCS), Supplement B. Reckendorf, Frank, PHD, Geology, Soil Science, & Fluvial Geomorphology, Salem, OR 97301-1130, Wisconsin NRCS 1996, Fluvial Geomorphology Workshop manual. Robbin B. Sotir & Associates, Market, GA 30064, Wisconsin, NRCS 1996 Fluvial Geomorphology Workshop manual. Rosgen, David L. A Practical Method of Computing Streambank Erosion Rate. Wildland Hydrology Inc., Pagosa Springs, CO, 2001. Rosgen, D., Applied River Morphology. 1996. Printed Media Companies, Minneapolis, Minnesota. Rosgen, David L., 1994. A Classification of Natural Rivers. Catena vol. 22. Elsevier Press. p. 169-199. Rosgen, D.L., The Cross-Vane, W-Weir and J-Hook Structures . . .Their Description, Design and Application for Stream Stabilization and River Restoration. http://www.wildlandhydrology.com/assets/cross-vane.pdf Rosgen, David L., River Morphology and Applications Course/Field Manual, Wildland Hydrology, 2003. Saele, Ellen M., Design Engineer, NRCS, Guidelines For The Design Of Stream Barbs, NRCS (SCS), Portland, OR, Wisconsin NRCS 1996 Fluvial Geomorphology Workshop manual. Schumm, S.A., Harvey, M.D. and Watson, C.C. 1984. Incised Channels – Morphology, Dynamics and Control. Water Resources Publications. Silvey, Hilton L. and Rosgen, D.L. Reference Reach Field Book. 2005. Simon, A., and Hupp, C.R. 1987. Channel Evolution in Modified Alluvial Streams. Transportation Research Record 1151, Transportation Research Board. Steffen, Lyle, Geologist, NRCS, Lincoln, Nebraska, Wisconsin, NRCS 1996 Fluvial Geomorphology Workshop manual. U.S. Army Corps of Engineers, Publication No. EM 1110-2-1601, Engineering and Design – Hydraulic Design of Flood Control Channels, 1994. U.S. Department of Agriculture, Natural Resources Conservation Service, Fluvial Geomorphology Workshop Handbook, Wisconsin 1996.
EFH Notice 210-WI-119 February 2009

16-WI-iii
U.S. Department of Agriculture, Forest Service Technology and Development Program, A Soil Bioengineering Guide for Streambank and Lakeshore Stabilization, Eds. D. Meadows and C.E. Eubanks, October 2002. U.S. Department of Agriculture, Natural Resources Conservation Service, Stream Restoration Design Handbook, Engineering Field Handbook, Part 654, August 2007. U.S. Department of Agriculture, (Natural Resources Conservation Service) previously the Soil Conservation Service, 1994, Gradation Design Of Sand and Gravel Filters, National Engineering Handbook, Part 633, Chapter 26. U.S. Department of Transportation, Federal Highway Administration, Hydraulic Engineering Circular No. 11, Design of Riprap Revetment, 1989. Vetrano, David M., Unit Construction of Trout Habitat Improvement Structures For Wisconsin Coulee Streams, Administrative Report No. 27, 1988, Wisconsin DNR, Viroqua, Wisconsin. Wells, Gary, Landscape Architect, NRCS, Lincoln, Nebraska, Wisconsin NRCS 1996 Fluvial Geomorphology Workshop manual.
EFH Notice 210-WI-119 February 2009

16-WI-iv
EFH Notice 210-WI-119 February 2009

16-WI-1
ANATOMY OF A HEALTHY STREAMBANK A healthy streambank is an extravagant ecosystem, the consummate source of food, shelter and of course, water, for a diverse mix of plants and animals. There are several components to a healthy streambank, starting with the riparian zone. The riparian zone of a stream is a natural transition place from land to water, a kind of mud room before runoff enters the stream. It is ideal if it is 30 feet or wider, although narrower strips of land with a variety of vegetation can be adequate. Within healthy stream corridors, the riparian zone acts as a buffer between the damaging pollutants carried in runoff and the stream’s water. It can also help to stave off erosion. The vegetative mix in a healthy streambank can include:
tall grass, ferns, plants, flowers, vines and mosses. bushes — short conifers or deciduous shrubs less than 15 feet high. evergreen trees (conifers) — cone bearing trees that do not lose their leaves in winter. hardwood trees (deciduous) — trees that help to stabilize the riparian zone and soak up runoff.
For more information on appropriate vegetative plantings, consult with your Biologist or Resource Conservationist. Shape of Stream Channel is Important The cross section shape of the stream channel is important to healthy functions both within the stream and on the banks. Deep, cool water is ideal game fish habitat and is needed for fish to survive over the winter months. Stream beds free of excess sediment are needed for fish to reproduce. As a channel is distorted and widened either by straightening, erosion due to land use changes in the watershed, or some other reason, various components of the stream habitat begin to suffer. For example, the streambed fills up, creating warmer, shallower waters. Changing the aquatic environment will eventually change the kinds of aquatic species living there. These changes usually point back to evidence of certain land uses in the watershed. Nearby urban areas with many impervious surfaces, for example, increase the velocity and amount of stormwater runoff. This increased runoff can erode the streambank and alter the shape of the stream channel, often changing it from deep and narrow to wide and shallow. A stable channel has the ability to transport the flows and sediment of its watershed while maintaining the dimensions, pattern and profile of the stream without either aggrading (building up) or degrading (downcutting). For more information on fish habitat consult with a Fisheries Manager, Biologist or Resource Conservationist. For more information on stream channel shape, consult with a Geologist or someone trained in fluvial geomorphology. The natural resource professional needs first to determine that there is a problem and if so, find out if the problem is local or system-wide. Good observation skills and detective work are needed. It is important to look at more than one site to see if there is a problem just at a particular site or reach or if the entire system is unstable. The following pages contain more information on clues of instability and problem identification.
EFH Notice 210-WI-119 February 2009

16-WI-2
STREAM STABILITY PROBLEM IDENTIFICATION People living next to streams often request assistance to stabilize stream banks. The resource professional must look beyond the eroding stream bank to identify the true cause of the problem. Streambanks naturally erode. The question to answer is whether the rate is excessive. Generally, bank erosion rates are excessive when overhanging vegetation dominates the top of the bank, trees fall into the stream annually, or soil slips and slumps are common. Excessive bank erosion (lateral instability or widening) and downcutting are indicators of unstable streams. Excessive sediment deposition in a stream (formation of central bars or a braided stream) is also an indicator of instability. Bank protection problems fall into two categories: those that correct the problem (stream restoration) and those that compensate for it (streambank protection). Many projects compensate for a problem instead of correcting the fundamental cause. The scope of the problem may be the largest reason streambank protection is chosen over stream restoration. When examining natural streams, certain stream types are stable in certain geomorphic settings. A “natural” stream is one that has not been modified or constructed (refer to local history). Rosgen (1994) has developed a stream classification system for natural rivers. The “A”, “B”, “C”, and “E” types are usually stable. The “D”, “F”, and “G’ stream types usually indicate instability. Excessive rates of sediment deposition and bank erosion are symptoms of instability associated with “D” stream types. Downcutting is the typical indicator of instability in “G” stream types and widening is usually occurring in “F” types. So stream classification is usually the first step in defining a stream stability problem. In disturbed or constructed channels, determining the stage of channel evolution (Schumm 1984) is the first step in defining stream stability. Stages I and V are stable, Stage II indicates downcutting is occurring, Stage Ill indicates widening is occurring, and Stage IV is in the process of stabilizing. The extent and sequence of different stream types, or stages of evolution, occurring upstream and downstream of the “problem” site helps identify whether the landowner’s bank erosion “problem” is a local situation or is part of a system- wide instability. Some examples of local instabilities include bridge pier scour, trees or other debris blockages deflecting flows into banks, or uncontrolled drainage flowing over the streambank. If the “problem” is determined to be local in nature, the resource professional can proceed to the inventory and evaluation procedures outlined below for streambank protection. If a system-wide instability is indicated, additional investigation beyond that landowner’s property is warranted. Vertical instability can be detected by surveying a longitudinal profile. If the low bank height diverges from the average bankfull slope and the average water surface slope, this indicates vertical instability. Longitudinal profile instructions can be found in Companion Document 580-8. After establishing whether the banks or bottom of the stream are stable, becoming unstable, or are presently unstable, the cause of that problem must be identified. Downcutting typically occurs when the slope of a channel is steepened. Decreasing the length of the channel by straightening will increase its slope. Slope will also increase in an upstream reach above a point where the channel bottom elevation is lowered (by downcutting). However, changes in runoff and sediment loads can also initiate downcutting due to an imbalance between a stream’s energy and its resisting forces. For example, downcutting is typical below reservoirs due to the decreased amount of bed load in the stream. Downcutting is also typical in streams draining urbanized areas. The stream may actually fill with sediment initially during development, but as the area is built out, increased runoff and decreased sediment load usually initiates downcutting. Lateral instability, widening, or excessive bank erosion often occurs after a stream has downcut and created higher banks. Once the critical height of a streambank is exceeded, it will fail through mass wasting (bank sloughing). Excessive buildup of sediment on the floodplain (resulting from excessive upland erosion) can also increase the height of streambanks to a point that they become unstable.
EFH Notice 210-WI-119 February 2009

16-WI-3
Another typical cause of streambank erosion is the removal of bank and riparian corridor vegetation. Roots increase the erosion resistance of streambank soils and vegetative cover also helps to protect the banks. Widening can also result when a channel downcuts to a resistant layer. The excess energy in the stream results in bank erosion. If a central bar, or some other channel blockage, begins forming in a channel, the diverted flow generally accelerates bank erosion. Central bars indicate the sediment load in the stream is exceeding the stream’s capacity to move sediment. This is a precursor to the formation of a braided stream. The stream instabilities described above are generally tied to changes in runoff and sediment load from a watershed or to physical changes in the riparian corridor or in the stream itself, or the instability is due to a combination of these situations. The true cause of the instability must be identified before alternative solutions can be developed and analyzed. Ideally, the cause of the stream instability should be removed before any stream modification is attempted. However, local sponsors may not have the authority or ability to fix the true cause of stream instability. In many situations, local sponsors may not want to attempt to implement solutions due to social unacceptability. These situations can result in plans and designs of stream modifications that require taking into account the predicted runoff and sediment loads from the disturbed system. More detailed, onsite inventories occur after problems have been identified, alternative solutions analyzed, and local sponsors have decided on a course of action. The two levels of inventory and evaluation described on the following pages become applicable if the local sponsors select solutions that involve bank stabilization or channel reconstruction.
EFH Notice 210-WI-119 February 2009

16-WI-4
STREAMBANK PROTECTION DESIGN
Inventory and Evaluation Needed When Using a Geomorphic Approach I. Surveys
A. Plan form
1. Minimum length of 20 times the bankfull channel width (normally at least one meander upstream and one meander downstream).
2. Alignment of top of both banks (for determining sinuosity and meander geometry [radius of curvature, belt width, and meander wavelength]).
3. Elevations to determine channel slope. 4. Cultural features. 5. Reference points/landmarks.
B. Cross sections (as many as needed to represent site)
1. Three bankfull cross-sections for stream classification and hydraulic geometry parameters (width, depth, cross-sectional area, and slope) should be made at crossover areas between outside bends of meanders (riffles).
2. Record bank soils, water table, and vegetation pattern for at least one cross section. (attachment).
3. Dominant grain size of bed material (pebble count – Wisconsin Job Sheet 810).
II. Stream classification (Rosgen, 1994) III. Stage of channel evolution (Schumm, 1984 or Simon, 1989) IV. Riparian corridor condition
A. Soil layers in banks (Unified Soil Classification System)
B. Existing vegetation condition and potential
C. Land use and level of management
D. Availability of bank protection materials (inert or organic)
E. Terrestrial and aquatic habitat suitability
F. Water quality (pH and EC) V. Hydrology
A. Plot flow frequency distribution using the 1, 2, 5, 10, 25, 50 and 100-year recurrence interval storms
B. Identify base flow
C. Determine annual water table fluctuation (high and low points) VI. Hydraulics
A. Bankfull depth of flow (this is average depth)
B. Bankfull velocity
C. Manning’s “n” value
EFH Notice 210-WI-119 February 2009

16-WI-5
STREAM CHANNEL RESTORATION DESIGN
Inventory and Evaluation Needed When Using a Geomorphic Approach I. Surveys (in addition to those required for streambank protection)
A. Plan form
1. Establish a baseline 2. 1-foot contour map of valley floor
B. Typical cross-sections of pool and riffle areas C. Enough elevation information to plot longitudinal profile of valley floor and channel bottom
throughout project area
II. Stream classification (Rosgen, 1994)
A. Identify site’s geomorphic setting B. Identify stable stream types for that geomorphic setting (may be located outside of subject
drainage basin) C. Select stable stream type for project site D. Inventory stable stream types in area (use forms)
1. Survey reference reaches of stable stream types to help select design parameters for reconstructed channel
2. Adjust design parameters for drainage area 3. Select appropriate cross-section, longitudinal profile, and plan forms design parameters for
reconstructed channel. For a list of average values which can help with design, see Companion Document 580-15.
a. width/depth ratio (pools, riffles, runs, glides) b. cross-section area c. slope (valley, channel, pools, riffles, runs, glides) d. confinement (floodplain dimensions) e. D50 of bed material f. sinuosity g. radius of curvature h. meander wavelength i. belt width j. pool-to-pool spacing k check using empirical equations (dimensionless ratios)
Ill. Stage of channel evolution (Schumm, 1984 or Simon, 1989) IV. Riparian corridor condition (in addition to those required for streambank protection)
A. Area-wide resource management plan (watershed level with landscape considerations included) B. Biological investigations
1. Current and potential riparian and upland plant species composition and distribution
EFH Notice 210-WI-119 February 2009

16-WI-6
2. Current and potential terrestrial habitat assessment 3. Current and potential aquatic habitat assessment 4. Macroinvertebrate assay 5. Threatened and endangered species
C. Cultural resources D. Geotechnical investigation
1. Surface soils
a. map b. grain size distribution, plasticity index, and USCS c. fertility (pH, nutrients, salinity, restrictive layers)
2. Subsurface soils
a. profiles parallel and perpendicular to proposed alignment b. identify salvage and waste areas c. grain size distribution, plasticity index, and USCS d. undisturbed samples at proposed depths of reconstructed channel for dry density, shear
strength, dispersion potential, plasticity index, and grain size distribution 3. Bank stability analysis
a. qualitatively assess the height and slope of stable banks in reference stream reaches to support design
b. do a slope stability analysis if questions cannot be resolved based on field observations c. identify locations d. identify appropriate practices (consider other objectives in addition to stability)
4. Depth to ground water maps for wet and dry parts of the year (ground water flow paths and
annual fluctuation) 5. Surface and ground water quality (pH, TDS, EC, DO, BOD, heavy metals, fecal coliform,
pesticides, and temperature)
V. Hydrology A. Climate data (rainfall [amount and time of year], snowfall and snowmelt, ET, growing degree days
[growing season], temperature extremes) B. Gaged sites
1. Annual peak flow frequency distribution plot 2. Flow duration table 3. Determine base flow and bankfull discharge 4. Frequency of inundation of present floodplain and constructed floodplain 5. Obtain USGS Form 9-207 (Summary of Discharge Measurement Data) data far each gage
site for constructing graphs relating width and cross-sectional area to discharge (for use in helping select design parameters for bankfull channel)
6. Obtain expanded rating table for gages to identify peak flow that fills bankfull channel at each gage (use flow frequency distribution plot to determine frequency of this bankfull discharge)
EFH Notice 210-WI-119 February 2009

16-WI-7
C. Ungaged sites
1. Complete items 1-3 from the gauged site list using TR-55 or regional equations. 2. Complete item 4 from the gauged site list using TR-20. 3. Construct hydraulic geometry graphs from stable stream types in area.
VI. Hydraulics A. Select stable slope (use stream type and relationships between valley floor slope, channel slope,
and sinuosity of reference reaches on other stable stream types) B. Locate channel centerline
1. Start with appropriate meander belt width and adjust based on required sinuosity (slope) and meander geometry
2. Fit to existing terrain (property lines, right of way, minimize cut and fill)
C. Consider grade control options to maximize fit of new channel with existing terrain D. Develop water surface profile (WSP) to check width, depth, and velocity of flow through
reconstructed channel E. If D50 is gravel or cobble-size, do tractive stress analysis to check on size limits of particles moved
during bankfull flow F. If sand bed channel, use other tools, such as Chang, 1988 (pp. 277-281), to check on stability G. If channel boundaries are cohesive soils, check stability by establishing a relationship between
the width/depth ratio and the percent of silt and clay in the channel boundaries and compare with Schumm’s F = 255 M-1.08 (1960) relationship
H. Sediment transport analysis to determine potential for scour and deposition through new channel
and in downstream reaches (may need a sediment budget to quantify bedload introduced into new channel from upstream sources)
I. CHECK that high frequency flow fits designed, bankfull cross-section and that lower frequency
flows access the floodplain
References
Chang, H. H. 1988. Fluvial processes in river engineering. John Wiley and Sons, Inc. Reprinted by Krieger Publishing Company, Malabar, FL 32950. Rosgen, D. L. 1994. A classification of natural rivers. Catena. Vol. 22. No. 3. Elsevier Science, B. V. Netherlands. pp. 169-199. Schumm, S. A. 1960. Shape of alluvial channels in relation to sediment type. USGS Professional Paper 352-B. pp. 17-30. Schumm, S. A., Harvey, M. D., and Watson, C. C. 1984. Incised channels: Morphology, dynamics, and control. Water Resources Publications, P. 0. Box 2841, Littleton, CO 80161. Simon, A. 1989. A model of channel response in disturbed alluvial channels. Earth Surface Processes and Landforms. Vol. 14. pp. 11-26.
EFH Notice 210-WI-119 February 2009
16-WI-8
SUGGESTED SURVEY POINTS FOR STREAMBANK WORK
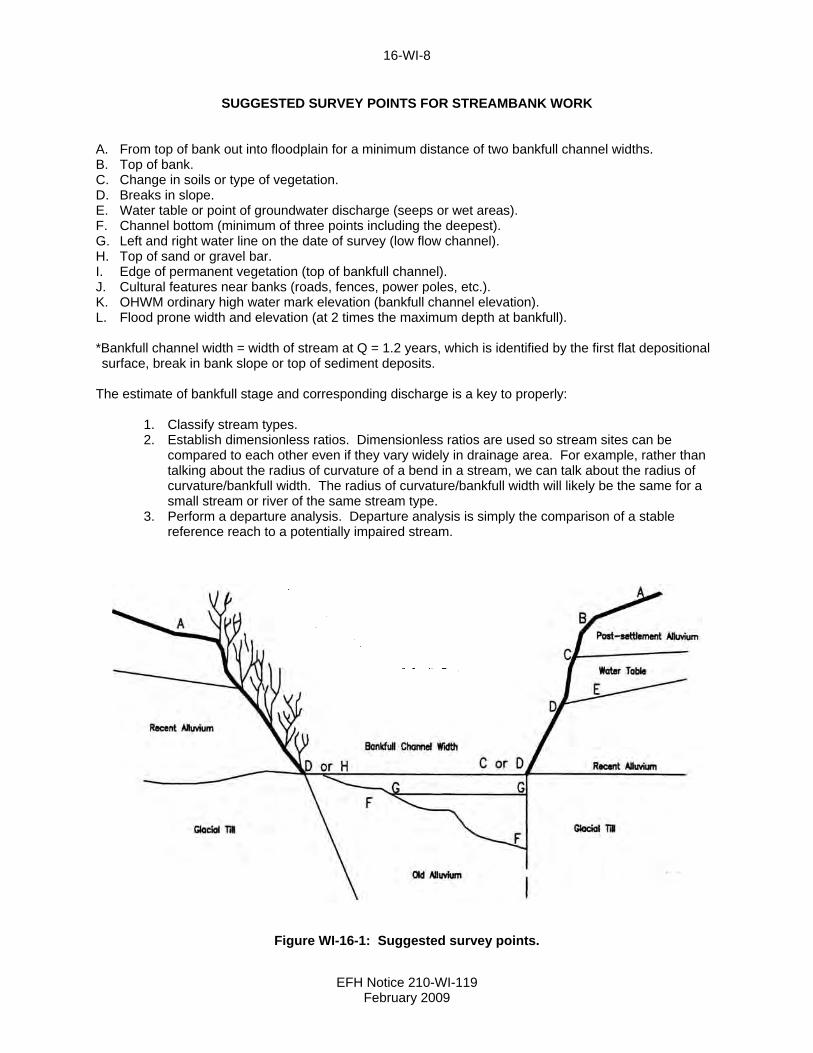
A. From top of bank out into floodplain for a minimum distance of two bankfull channel widths. B. Top of bank. C. Change in soils or type of vegetation. D. Breaks in slope. E. Water table or point of groundwater discharge (seeps or wet areas). F. Channel bottom (minimum of three points including the deepest). G. Left and right water line on the date of survey (low flow channel). H. Top of sand or gravel bar. I. Edge of permanent vegetation (top of bankfull channel). J. Cultural features near banks (roads, fences, power poles, etc.). K. OHWM ordinary high water mark elevation (bankfull channel elevation). L. Flood prone width and elevation (at 2 times the maximum depth at bankfull). *Bankfull channel width = width of stream at Q = 1.2 years, which is identified by the first flat depositional surface, break in bank slope or top of sediment deposits.
The estimate of bankfull stage and corresponding discharge is a key to properly:
1. Classify stream types. 2. Establish dimensionless ratios. Dimensionless ratios are used so stream sites can be
compared to each other even if they vary widely in drainage area. For example, rather than talking about the radius of curvature of a bend in a stream, we can talk about the radius of curvature/bankfull width. The radius of curvature/bankfull width will likely be the same for a small stream or river of the same stream type.
3. Perform a departure analysis. Departure analysis is simply the comparison of a stable reference reach to a potentially impaired stream.
Figure WI-16-1: Suggested survey points.
EFH Notice 210-WI-119 February 2009

16-WI-9
INVESTIGATIONS Additional things to investigate and document before treatment is started are: 1. Stage of Channel Evolution. Refer to the Channel Evolution Model (Schumm, Harvey, Watson, 1984)
sketches in Companion Document 580-7. 2. The stream reach classification by Rosgen's Classification System (Companion Document 580-5). 3. An evaluation of the stream cross section and meander relationships for the reach in question. 4. An evaluation of the channel stability visual indicators to help decide if stabilization is required. Some
erosion and deposition occurs in stable streams. Excessive erosion or deposition are signs of an unstable system. A longitudinal profile survey will show if the stream bed is degrading (downcutting), aggrading (building up), or stable. Instructions for completing a longitudinal profile survey are given in Companion Document 580-8.
5. When the bed of a stream is degrading, or is expected to occur, the grade of the channel must be
analyzed before a streambank protection project is planned. Four visual indicators of channel degradation are: a. headcuts or knickpoints in the channel bottom. b. lack of sediment deposits in the channel. c. the presence of a vertical face or scarp at the toe of the channel banks. d. the exposure of the foundations of cultural features or the undercutting of cultural features.
An evaluation for evidence of excessive deposition. This can be indicated by:
a. extremely high or wide point bars relative to the stream's width and depth. b. the formation of central bars - bars that build up in the middle of a channel instead of at its edges. c. vegetation buried in sediment. d. reduced bridge clearance.
6. An evaluation of streambank erodibility indicators such as (see Companion Document 580-4 for a
diagram of streambank erodibility factors):
a. the bank height above the base flow. b. the bank angle above the base flow. c. the density of roots and amount of bank surface protection. d. the soil layering in the bank to identify the weak soils. e. the soil particle sizes in the bank. f. the water table elevation and slope in the streambank. g. the thalweg is near the bank.
EFH Notice 210-WI-119 February 2009
16-WI-10
METHODS OF EVALUATION
Two methods or approaches can be used to evaluate a material resistance to erosion. These methods are: 1. Permissible velocity
The permissible velocity approach focuses on a computed velocity for the geometry of the channel. The channel particle, or treatment system is assumed stable if the computed velocity (mean [Vavg] or impingement [Vs]) is lower than the maximum permissible velocity. The impingement velocity (on outside bends directly in line with the centerline) may be assumed to be 33% greater than the average stream velocity (Vs.= Vavg * 1.33).
2. Permissible tractive force (Shear Stress) The tractive force approach focuses on stresses developed at the interface between the flowing water and the materials forming the channel boundary. The boundary is assumed stable if the computed (proportioned) shear stress is less than the allowable shear stress.
Velocity and shear stress data should be collected in a crossover riffle cross section.
VELOCITIES IN STREAMS Velocities in streams can be calculated using Manning's Equation. The Wisconsin Streambank Protection spreadsheet can be used to simplify the computation. Channel hydraulics, Manning's Equation, and Manning's "n" values are further discussed in the EFH, Chapters 3 and 14. Methods to determine Manning's "n" is in a Wisconsin supplement to EFH, Chapter 3. The design depth at which the velocity is determined for stability must be compatible with the design procedures for site risks and for the selected bank protection treatment. In some cases, the design storm elevation may be to the out-of-bank flow. When there is a low bank or flood record data showing that a stream goes out of bank (across the flood plain) frequently, the designer should consider design velocities for this stream stage. A stream with at least one low bank is not entrenched. The maximum stream velocity will occur as the water spreads-out across the floodplain, unless another terrace is encountered. In other cases, the design storm elevation may be a selected depth or a particular storm return period. If a 100-year frequency storm is contained within the channel banks, the designer may wish to design using the velocity for this depth or for a lesser storm frequency. EFH Chapter 2, TR-55, and the USGS publication, “Flood Frequency Characteristics of Wisconsin Streams,” can be used to determine runoff discharge.
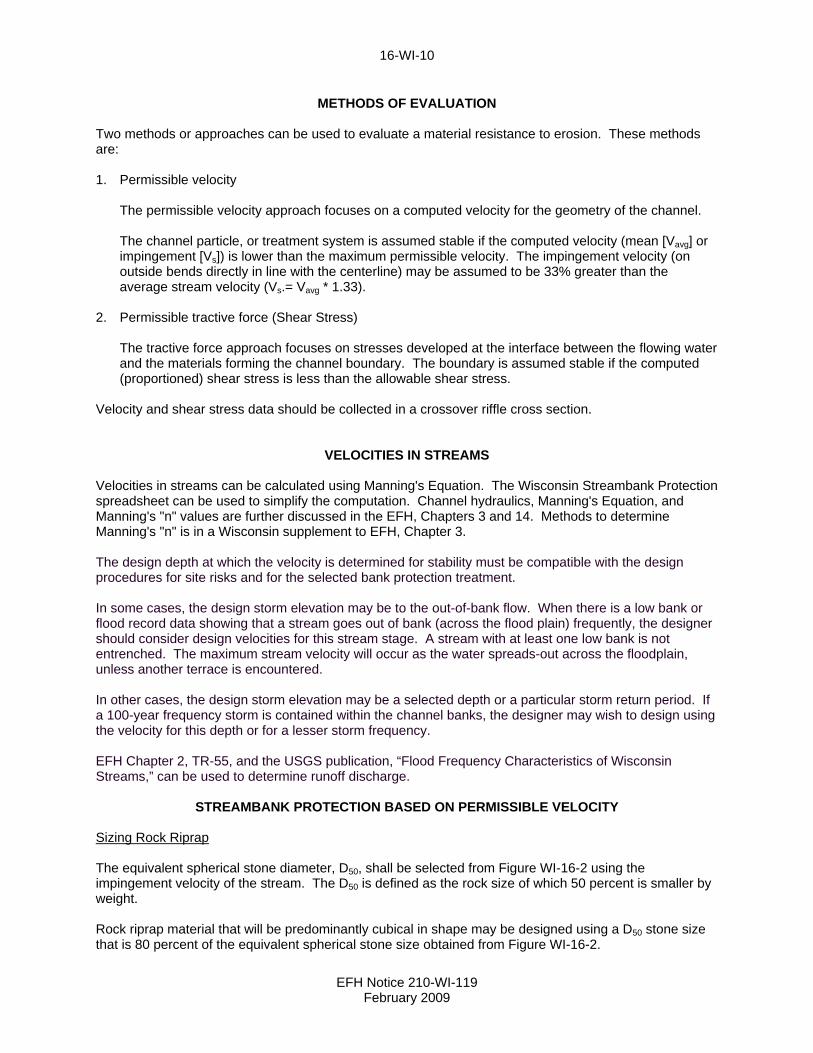
STREAMBANK PROTECTION BASED ON PERMISSIBLE VELOCITY Sizing Rock Riprap The equivalent spherical stone diameter, D50, shall be selected from Figure WI-16-2 using the impingement velocity of the stream. The D50 is defined as the rock size of which 50 percent is smaller by weight. Rock riprap material that will be predominantly cubical in shape may be designed using a D50 stone size that is 80 percent of the equivalent spherical stone size obtained from Figure WI-16-2.
EFH Notice 210-WI-119 February 2009
16-WI-11
Figure WI-16-2
Equation for Figure WI-16-2: Log D50 = (logVs – B) / M
Table 1 Constants for Figure WI-16-2 Equation
Side Slope B M
3:1 0.470 0.443 2:1 0.332 0.526
1.5:1 .0271 0.57
**Range1.5-4.0:1 )08433.(*)5.
3(470.0
z )04233(.*)
5.
3(443.0
z
**Approximate D50 for side slopes ranging from 1.5-4.0:1
EFH Notice 210-WI-119 February 2009
16-WI-12
EFH Notice 210-WI-119 February 2009
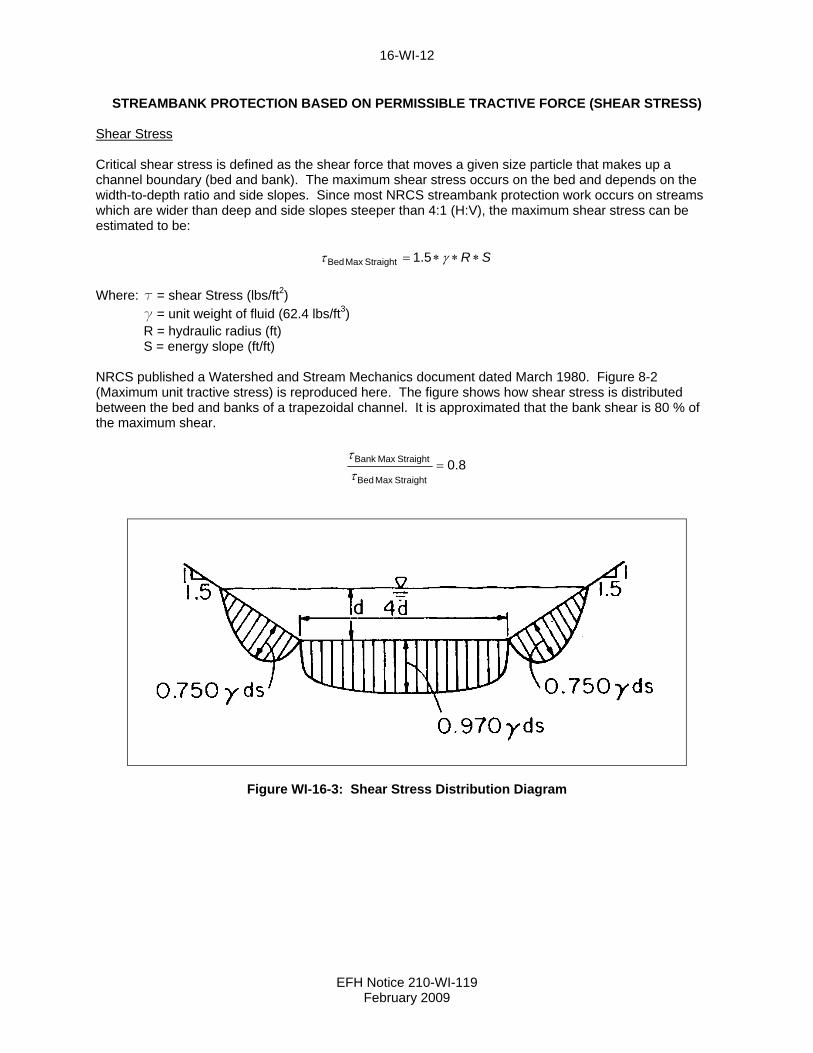
STREAMBANK PROTECTION BASED ON PERMISSIBLE TRACTIVE FORCE (SHEAR STRESS) Shear Stress Critical shear stress is defined as the shear force that moves a given size particle that makes up a channel boundary (bed and bank). The maximum shear stress occurs on the bed and depends on the width-to-depth ratio and side slopes. Since most NRCS streambank protection work occurs on streams which are wider than deep and side slopes steeper than 4:1 (H:V), the maximum shear stress can be estimated to be:
SR 5.1StraightMax Bed
Where: τ = shear Stress (lbs/ft2)
γ = unit weight of fluid (62.4 lbs/ft3) R = hydraulic radius (ft) S = energy slope (ft/ft)
NRCS published a Watershed and Stream Mechanics document dated March 1980. Figure 8-2 (Maximum unit tractive stress) is reproduced here. The figure shows how shear stress is distributed between the bed and banks of a trapezoidal channel. It is approximated that the bank shear is 80 % of the maximum shear.
8.0StraightMax Bed
StraightMax Bank
Figure WI-16-3: Shear Stress Distribution Diagram

16-WI-13
PC = point of curvature PT = point of tangency Rc = radius of curvature Ө = angle Lp = length of protection
Figure WI-16-4 Shear Stress in a Channel Bend Shear stress in a channel’s curve is greater than in a straight reach. Secondary currents develop in channel bends. The maximum shear stress is near the middle of the channel as a curve begins and drifts to the outer bank as the flow leaves the curve. The sharper the curve, the greater the shear stress on the bank. The method for calculating shear in a bend is to take the maximum bed shear and multiply it by a bend factor Kb which is a function of the radius of the bend (Rc) and the width of the water surface at bankfull flow (B).
StraightMax BedBendMax Bed bK
B
Rc
b eK0852.
)(4.2
After shear stress is calculated, this information can be used to pick treatment strategies on the proposed bank. Integrated bank treatments can be designed, with less vigorous measure higher on the bank (bank zone vs. toe zone) because shear stress will be reduced higher on the bank. Hard armoring is not required from the anticipated scour bottom to the top of the bank on all channels. Shear on the bank in a channel bend ( x ) can be estimated using the following:
BendMax Bed Cx
Table 2
Ratio of stream depth(x)
Coefficient (C) Top of Channel
1.0 0 0.9 0.14 0.8 0.27 0.67 .041 0.6 0.54 0.5 0.68 0.4 0.79 0.33 0.8 0.2 0.8 0.1 0.8
Bottom of Channel 0.0 0.8 Give a reach cross section, the shear on the bank on a straight reach and bend can now be distributed by elevation. The Streambank Protection spreadsheet will plot a distribution.
EFH Notice 210-WI-119 February 2009
16-WI-14
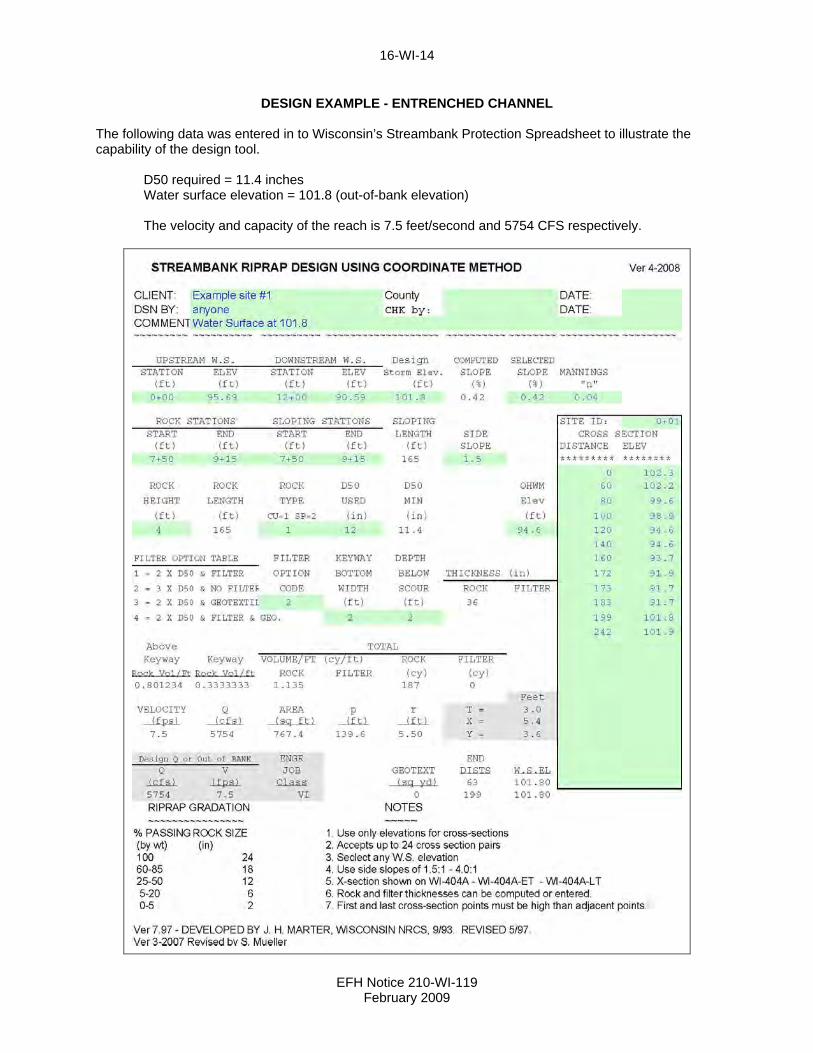
DESIGN EXAMPLE - ENTRENCHED CHANNEL
The following data was entered in to Wisconsin’s Streambank Protection Spreadsheet to illustrate the capability of the design tool.
D50 required = 11.4 inches Water surface elevation = 101.8 (out-of-bank elevation) The velocity and capacity of the reach is 7.5 feet/second and 5754 CFS respectively.
EFH Notice 210-WI-119 February 2009
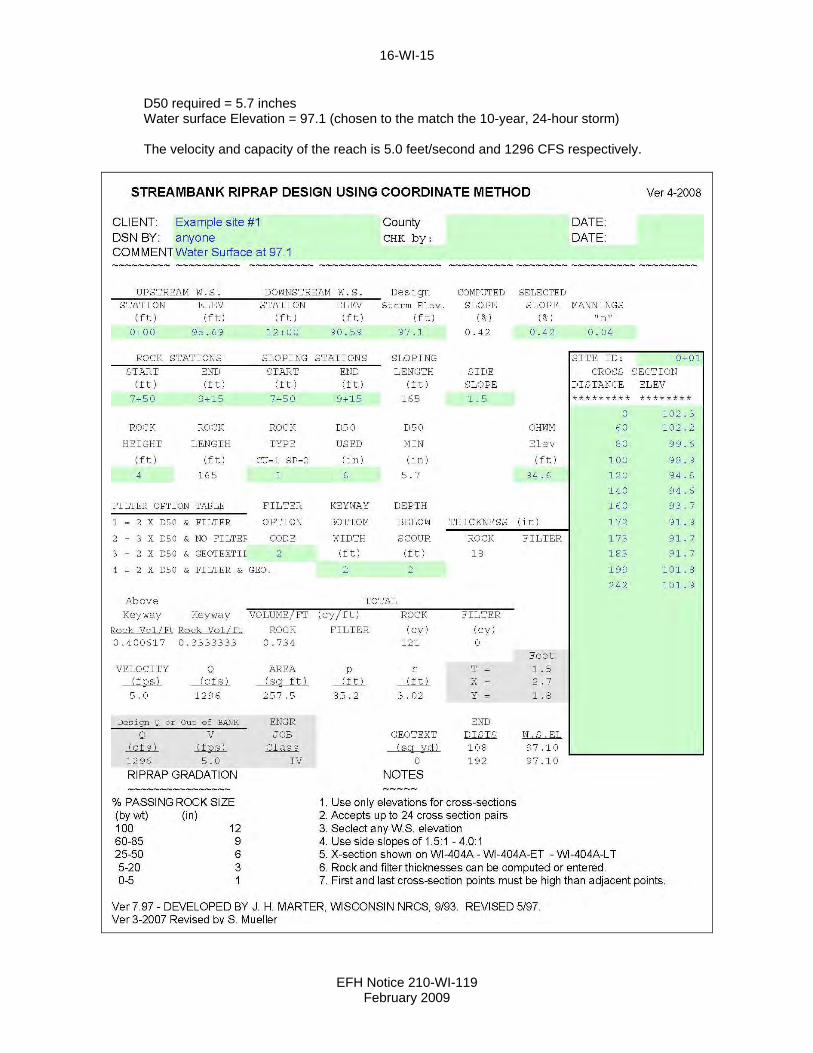
16-WI-15
D50 required = 5.7 inches Water surface Elevation = 97.1 (chosen to the match the 10-year, 24-hour storm) The velocity and capacity of the reach is 5.0 feet/second and 1296 CFS respectively.
EFH Notice 210-WI-119 February 2009
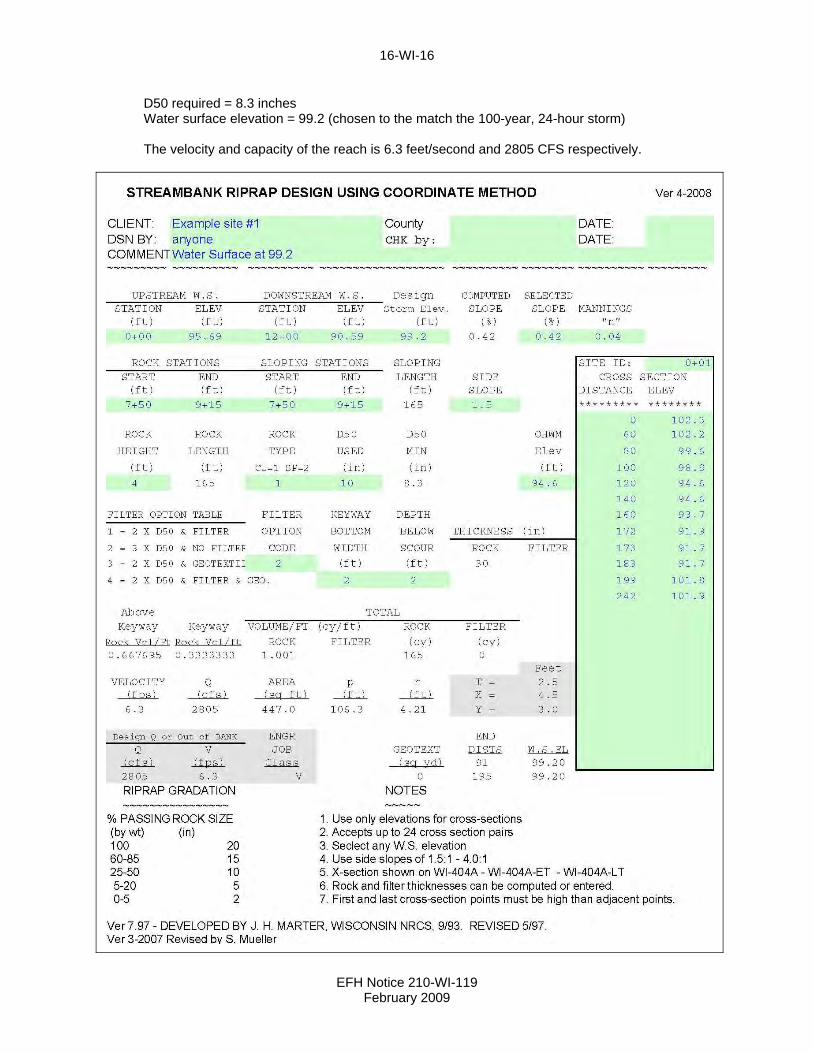
16-WI-16
D50 required = 8.3 inches Water surface elevation = 99.2 (chosen to the match the 100-year, 24-hour storm) The velocity and capacity of the reach is 6.3 feet/second and 2805 CFS respectively.
EFH Notice 210-WI-119 February 2009

16-WI-17
USGS’s Flood Frequency Characteristics of Wisconsin Streams was used to find the 100-year, 24-hour runoff rate of 2762 CFS, a rate which is exceeded with a reach water surface of 99.2. The 100-year storm is contained within the surveyed cross section.
The required riprap size varied from 11.4 to 5.7 inches with the various discharges. The current streambank protection standard allows the designer to use less than the out-of-bank flow rate if the minimum design flow rate is achieved at a lower stage. This reach is an example of that concept. The out-of-bank flow exceeds the 100-year storm event.
EFH Notice 210-WI-119 February 2009
16-WI-18
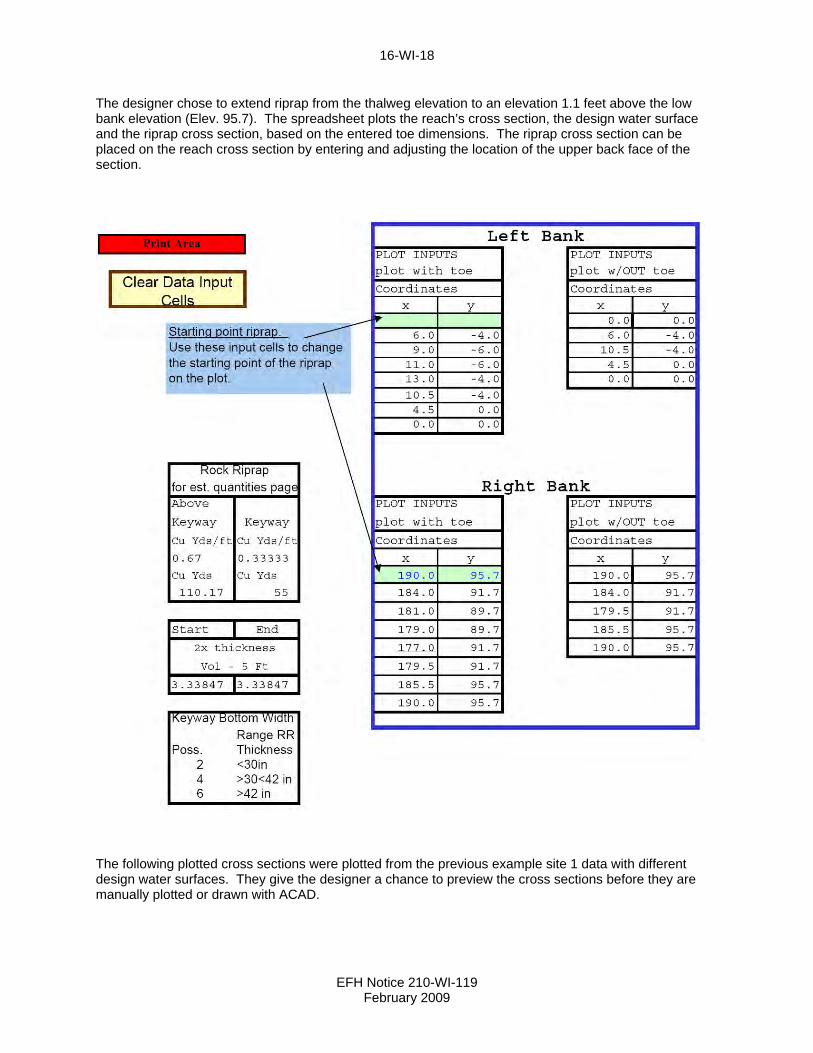
The designer chose to extend riprap from the thalweg elevation to an elevation 1.1 feet above the low bank elevation (Elev. 95.7). The spreadsheet plots the reach’s cross section, the design water surface and the riprap cross section, based on the entered toe dimensions. The riprap cross section can be placed on the reach cross section by entering and adjusting the location of the upper back face of the section.
The following plotted cross sections were plotted from the previous example site 1 data with different design water surfaces. They give the designer a chance to preview the cross sections before they are manually plotted or drawn with ACAD.
EFH Notice 210-WI-119 February 2009

16-WI-19
EFH Notice 210-WI-119 February 2009
16-WI-20
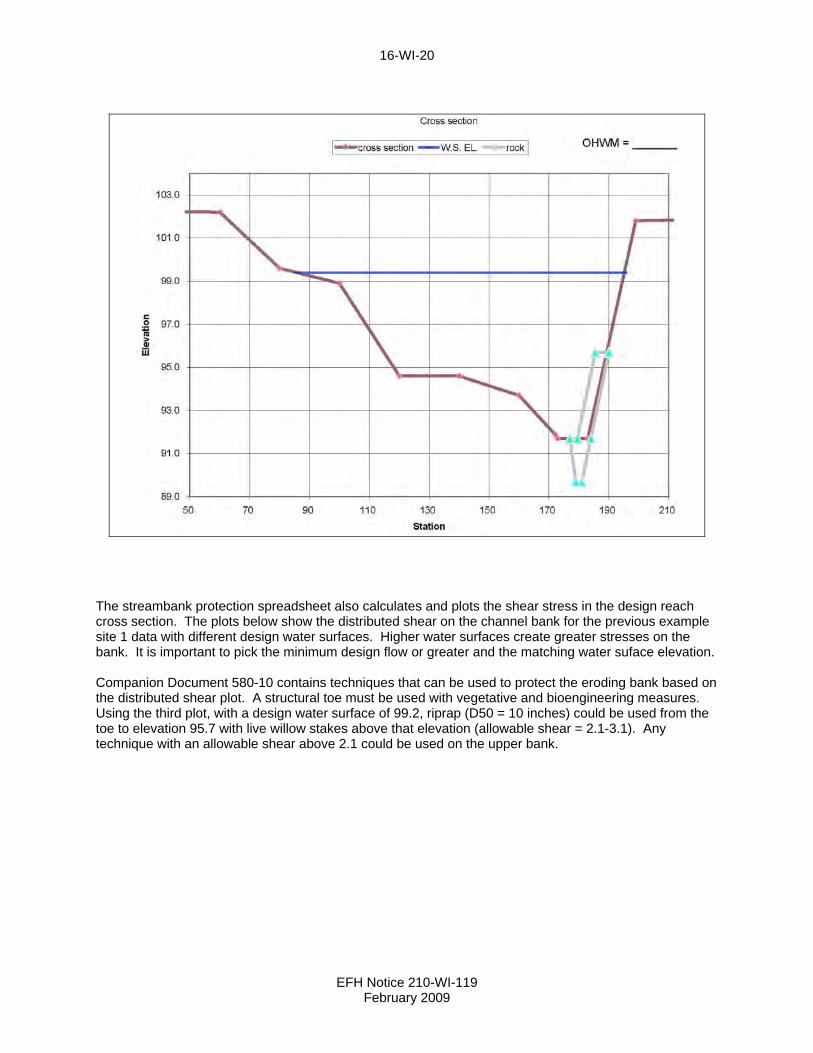
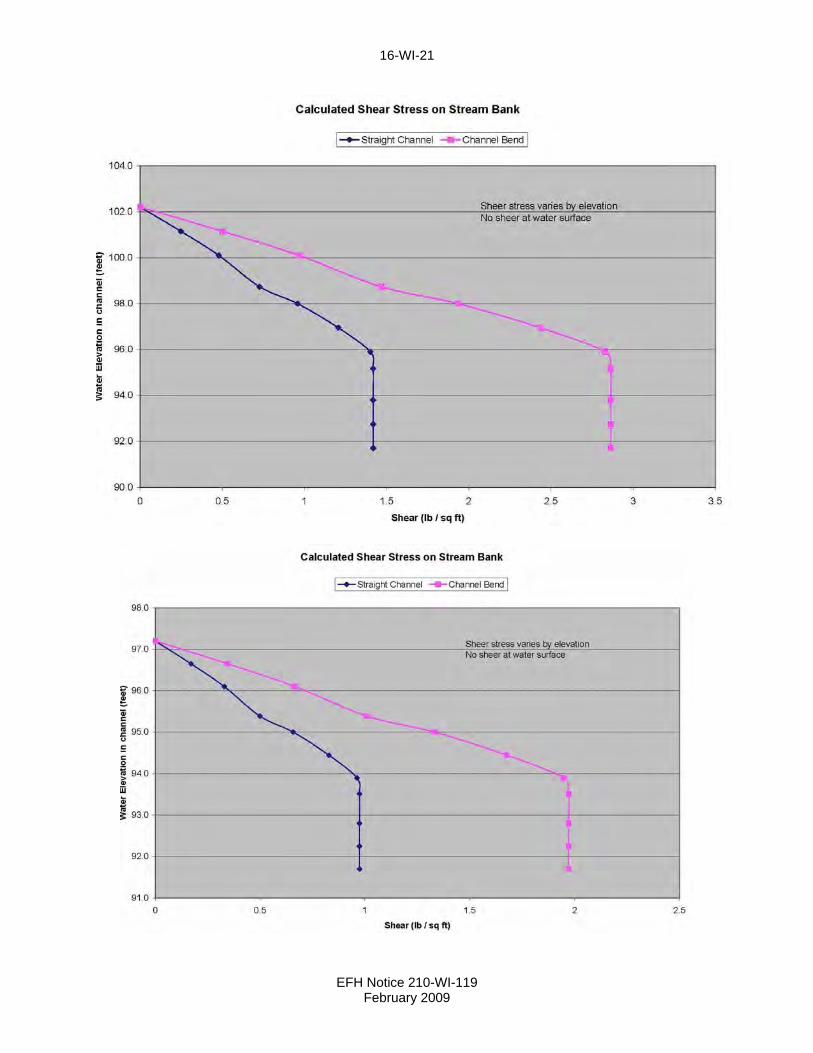
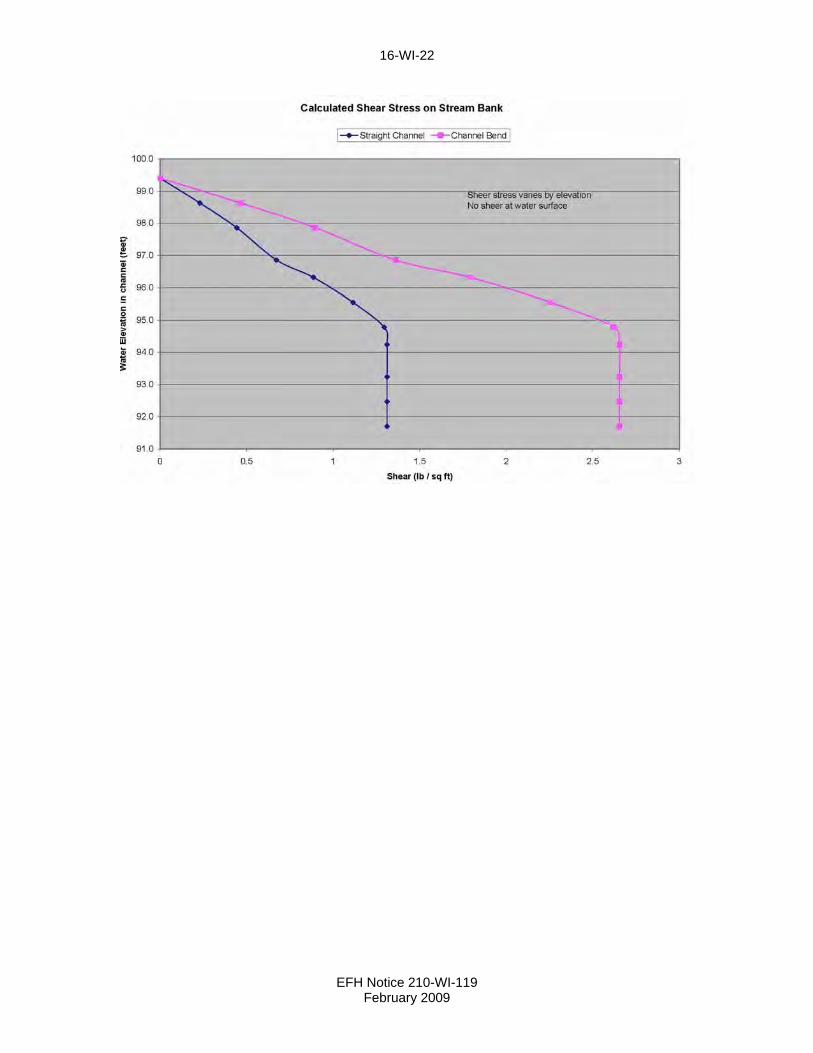
The streambank protection spreadsheet also calculates and plots the shear stress in the design reach cross section. The plots below show the distributed shear on the channel bank for the previous example site 1 data with different design water surfaces. Higher water surfaces create greater stresses on the bank. It is important to pick the minimum design flow or greater and the matching water suface elevation. Companion Document 580-10 contains techniques that can be used to protect the eroding bank based on the distributed shear plot. A structural toe must be used with vegetative and bioengineering measures. Using the third plot, with a design water surface of 99.2, riprap (D50 = 10 inches) could be used from the toe to elevation 95.7 with live willow stakes above that elevation (allowable shear = 2.1-3.1). Any technique with an allowable shear above 2.1 could be used on the upper bank.
EFH Notice 210-WI-119 February 2009
16-WI-21
EFH Notice 210-WI-119 February 2009
16-WI-22
EFH Notice 210-WI-119 February 2009

16-WI-23
DESIGN EXAMPLE – NON-ENTRENCHED CHANNEL
The following data was entered in to Wisconsin’s Streambank Protection Spreadsheet to illustrate the capability of the design tool. D50 required = 6.4 inches Water surface Elevation = 47.3. Out-of-bank Elevation = 48.6
EFH Notice 210-WI-119 February 2009
16-WI-24
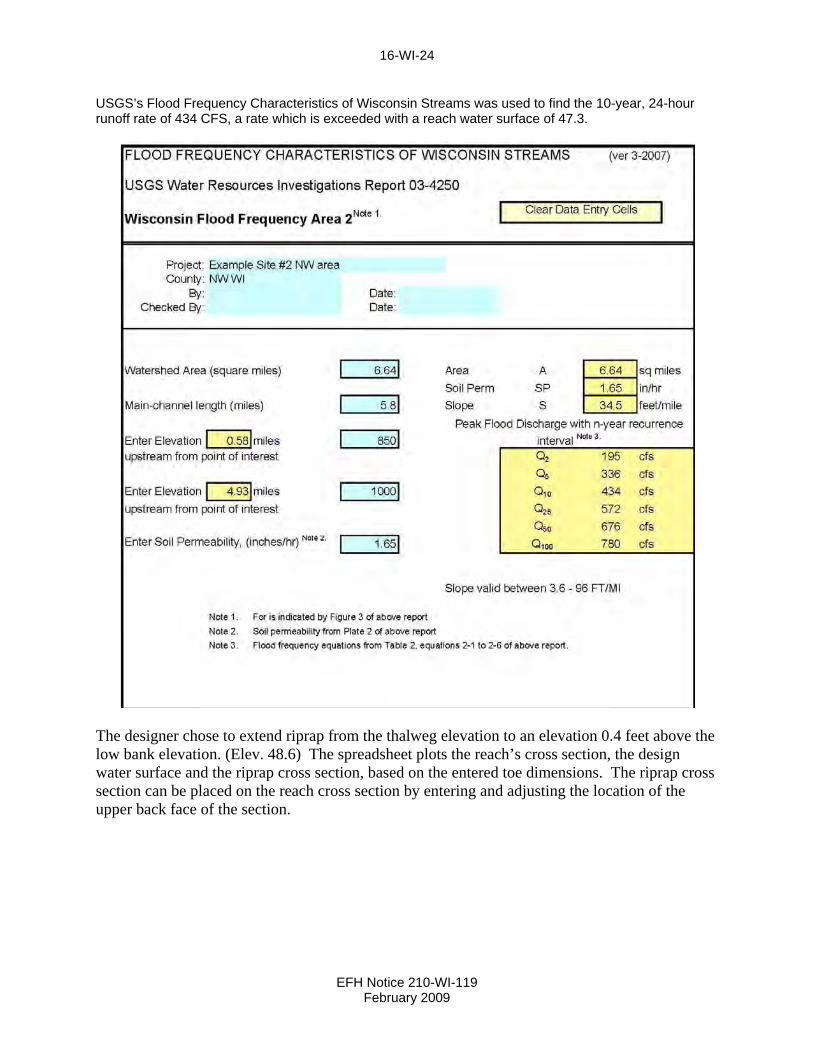
USGS’s Flood Frequency Characteristics of Wisconsin Streams was used to find the 10-year, 24-hour runoff rate of 434 CFS, a rate which is exceeded with a reach water surface of 47.3.
The designer chose to extend riprap from the thalweg elevation to an elevation 0.4 feet above the low bank elevation. (Elev. 48.6) The spreadsheet plots the reach’s cross section, the design water surface and the riprap cross section, based on the entered toe dimensions. The riprap cross section can be placed on the reach cross section by entering and adjusting the location of the upper back face of the section.
EFH Notice 210-WI-119 February 2009

16-WI-25
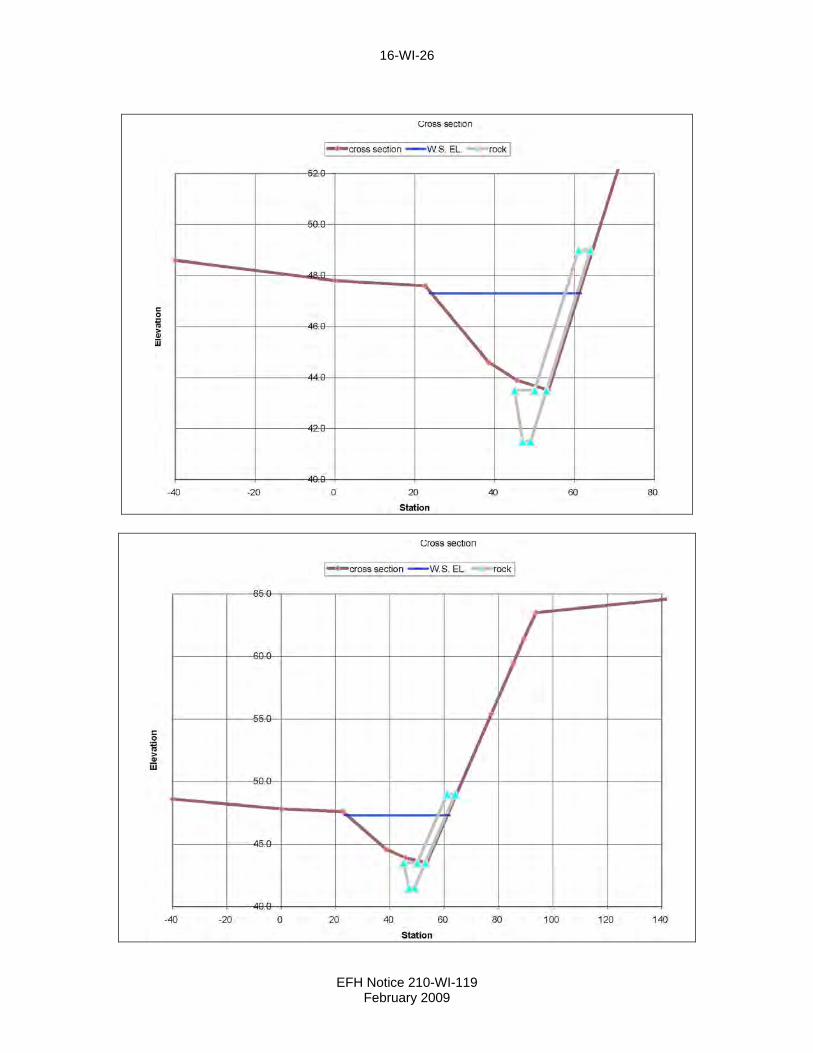
The following plotted cross sections were plotted from the previous example site 2 data. They give the designer a chance to preview the cross sections before they are manually plotted or drawn with ACAD. The second cross section had additional data entered to create the taller bank.
EFH Notice 210-WI-119 February 2009
16-WI-26
EFH Notice 210-WI-119 February 2009
16-WI-27
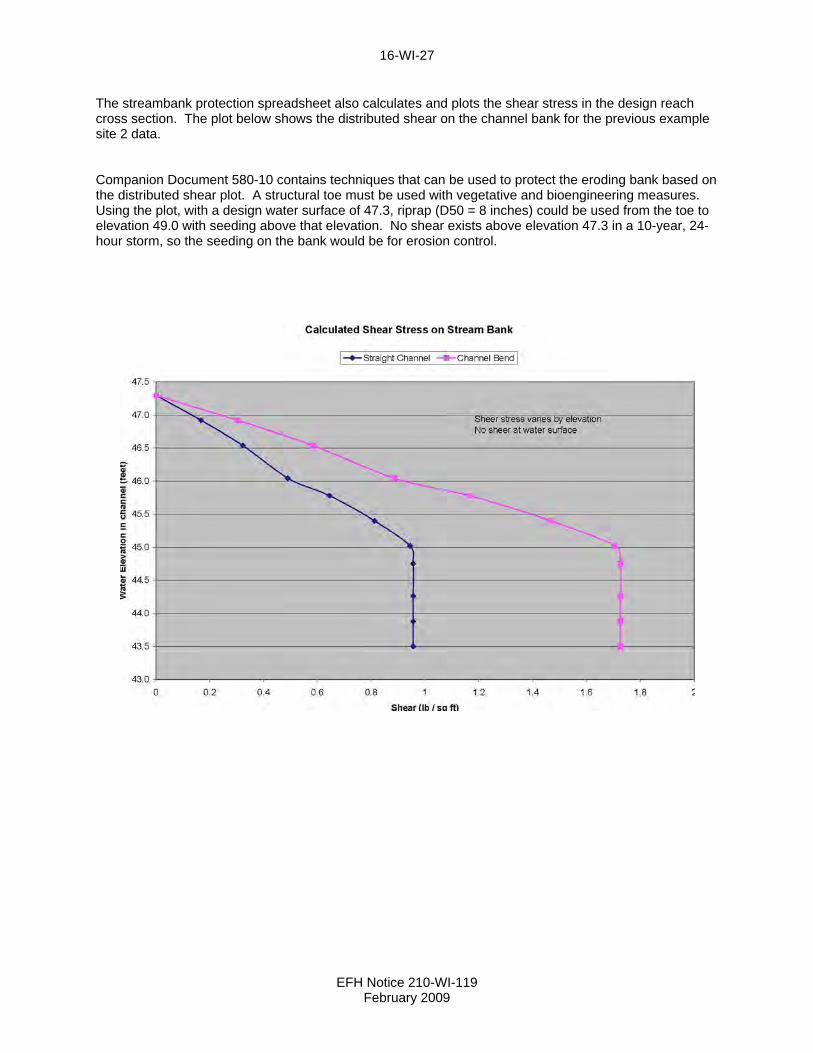
The streambank protection spreadsheet also calculates and plots the shear stress in the design reach cross section. The plot below shows the distributed shear on the channel bank for the previous example site 2 data. Companion Document 580-10 contains techniques that can be used to protect the eroding bank based on the distributed shear plot. A structural toe must be used with vegetative and bioengineering measures. Using the plot, with a design water surface of 47.3, riprap (D50 = 8 inches) could be used from the toe to elevation 49.0 with seeding above that elevation. No shear exists above elevation 47.3 in a 10-year, 24-hour storm, so the seeding on the bank would be for erosion control.
EFH Notice 210-WI-119 February 2009

16-WI-28
EFH Notice 210-WI-140 January 2018
ROCK RIPRAP TESTING AND GRADATION Wisconsin Construction Specification 9, Rock Riprap, requires most rock to be tested for soundness using a modified ASTM-C-88 procedure. Sodium sulfate tests from rock riprap sources with loss less than 20 percent are considered passing. The design D50 size can be increased for sources exceeding 20 percent loss. Rock with sodium sulfate test losses over 28 percent shall not be used. The rock gradation for streambank revetments shall be determined using one of the following criteria.
Table 3a Percent Passing by
Weight Size in Inches (round to
the nearest inch) 100 2 x D50
60-85 1.5 x D50 25-50 D50 5-20 0.5 x D50 0-5 0.2 x D50
Table 3b Percent Passing
by Weight Size in Inches (round to
the nearest inch) 100 1.5 x D50--2.0 x D50 85 1.3 x D50--1.8 x D50 50 1.0 x D50--1.5 x D50 10 0.8 x D50--1.3 x D50
The State of Wisconsin Department of Transportation Standard Specifications for Highway and Structure Construction has four gradations that closely represent the Table 3b gradation. Table 3c shows the D50 relationship with DOT riprap classifications.
Table 3c
D50 (in.) DOT Riprap Category
9 Light Riprap 11 Medium Riprap 14 Heavy Riprap 18 Extra Heavy Riprap
> 18 Site Specific Gradation Required

16-WI-29
LEACHING PROTECTION OF BASE SOILS PROTECTED WITH ROCK RIPRAP For bank soils with no significant seepage pressures, leaching of the bank base material through the riprap must be prevented. Leaching can be controlled by one of the following methods.
1. The thickness of the riprap is increased to 3 times the D50 stone size. Triprap = 3*D50 2. The riprap gradation is small enough (bedding) such that the rock material meets the leaching
protection requirements for the bank base material. Triprap = 2*D50 3. A protective layer of intermediate sized material (bedding) meeting the leaching protection criteria
is placed between the riprap and base material. Triprap = 2*D50 4. A geotextile is placed between the riprap and base material. It must meet the criteria for Class I
or II woven or non-woven geotextiles contained in Wisconsin Construction Specification 13, Geotextiles and the guide for the use of Wisconsin Construction Specification 13, Geotextiles, in Chapter 17, Engineering Field Handbook.
Leaching Protection Requirements (Bedding) Gradation Design The gradation of the underlying material must meet the following criteria for rock riprap.
sieve) 40 (No. mm 0.4240
max. (riprap)D(B)D 15
15
5
min. (riprap)D(B)D 15
15
5
max. (riprap)D(B)D 15
85
40
max. (riprap)D(B)D 50
50
The D15, D50, or D85 (B) is the size of the soil base or bedding material of which the designated percentage is smaller by weight. Note that the maximum and minimum values refer to the ranges shown in the gradation limits for the riprap. When comparing the plotted gradation curves of the riprap and bedding, the bedding gradation curve should be approximately parallel to the rock riprap curve or have a flatter slope.
FILTER MATERIAL DESIGN A filter is required when seepage pressures in the sides or bottom of a channel could cause detachment of soil particles and move them out through protective layers. A sand-gravel filter will be designed using criteria contained in National Engineering Handbook (NEH), Part 633, Chapter 26, Gradation Design of Sand and Gravel Filters. Geotextile Filter Design Refer to the guide for the use of Wisconsin Construction Specification 13, Geotextiles, in Chapter 17, Engineering Field Handbook.
EFH Notice 210-WI-119 February 2009
16-WI-30
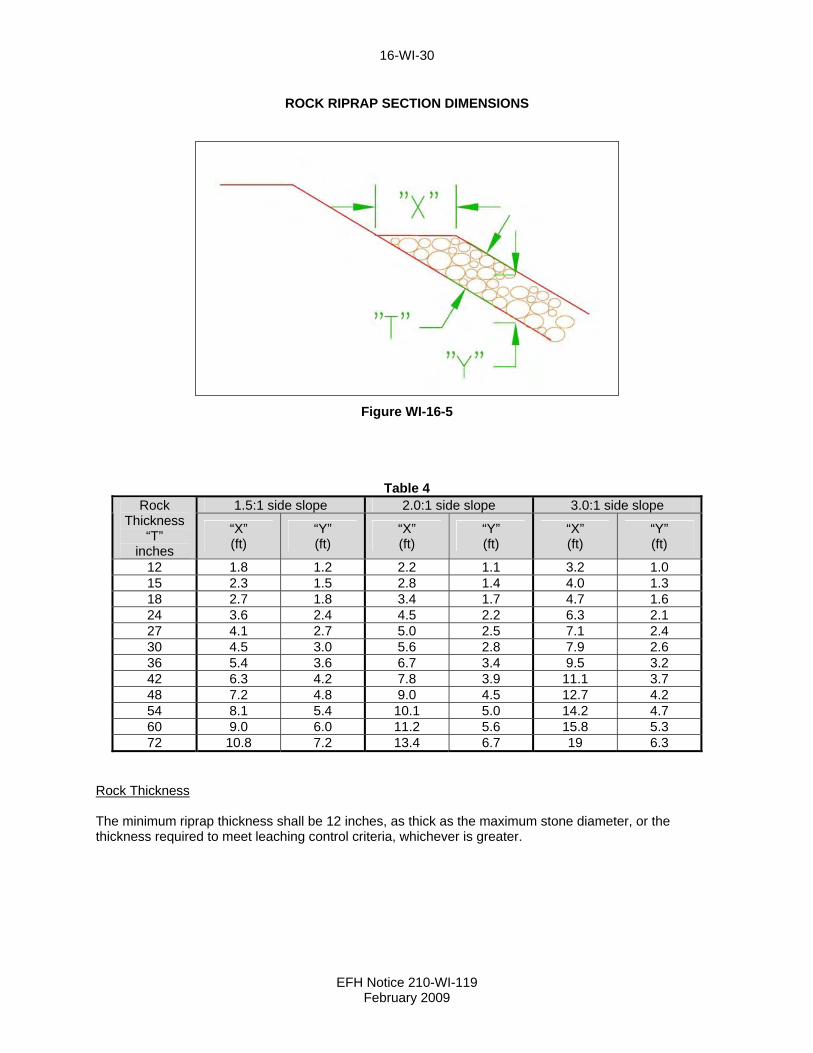
ROCK RIPRAP SECTION DIMENSIONS
Figure WI-16-5
Table 4 1.5:1 side slope 2.0:1 side slope 3.0:1 side slope Rock
Thickness “T”
inches
“X” (ft)
“Y” (ft)
“X” (ft)
“Y” (ft)
“X” (ft)
“Y” (ft)
12 1.8 1.2 2.2 1.1 3.2 1.0 15 2.3 1.5 2.8 1.4 4.0 1.3 18 2.7 1.8 3.4 1.7 4.7 1.6 24 3.6 2.4 4.5 2.2 6.3 2.1 27 4.1 2.7 5.0 2.5 7.1 2.4 30 4.5 3.0 5.6 2.8 7.9 2.6 36 5.4 3.6 6.7 3.4 9.5 3.2 42 6.3 4.2 7.8 3.9 11.1 3.7 48 7.2 4.8 9.0 4.5 12.7 4.2 54 8.1 5.4 10.1 5.0 14.2 4.7 60 9.0 6.0 11.2 5.6 15.8 5.3 72 10.8 7.2 13.4 6.7 19 6.3
Rock Thickness The minimum riprap thickness shall be 12 inches, as thick as the maximum stone diameter, or the thickness required to meet leaching control criteria, whichever is greater.
EFH Notice 210-WI-119 February 2009

16-WI-31
VOLUME COMPUTATIONS
Figure WI-16-6
Formulas H = Constructed height above keyway (ft) T = Thickness of rock (ft) F = Thickness of filter (ft) B = Bottom width of keyway (ft) d = Depth of keyway (ft) Z = Constructed side slope (Z:1) V = Volume per liner foot of protection (yd3/ft) Rock Volume above Keyway
27
**12 THZV
Rock Volume in Keyway
2722
**
22 ddZBd
V
Filter Volume
27
*)(*12 FdHZV
Thickness of Filter of Bedding Layer A sand-gravel filter or bedding shall be at least 1/3 the thickness of the rock riprap but not less than 6 inches nor greater than 12 inches.
EFH Notice 210-WI-119 February 2009
16-WI-32
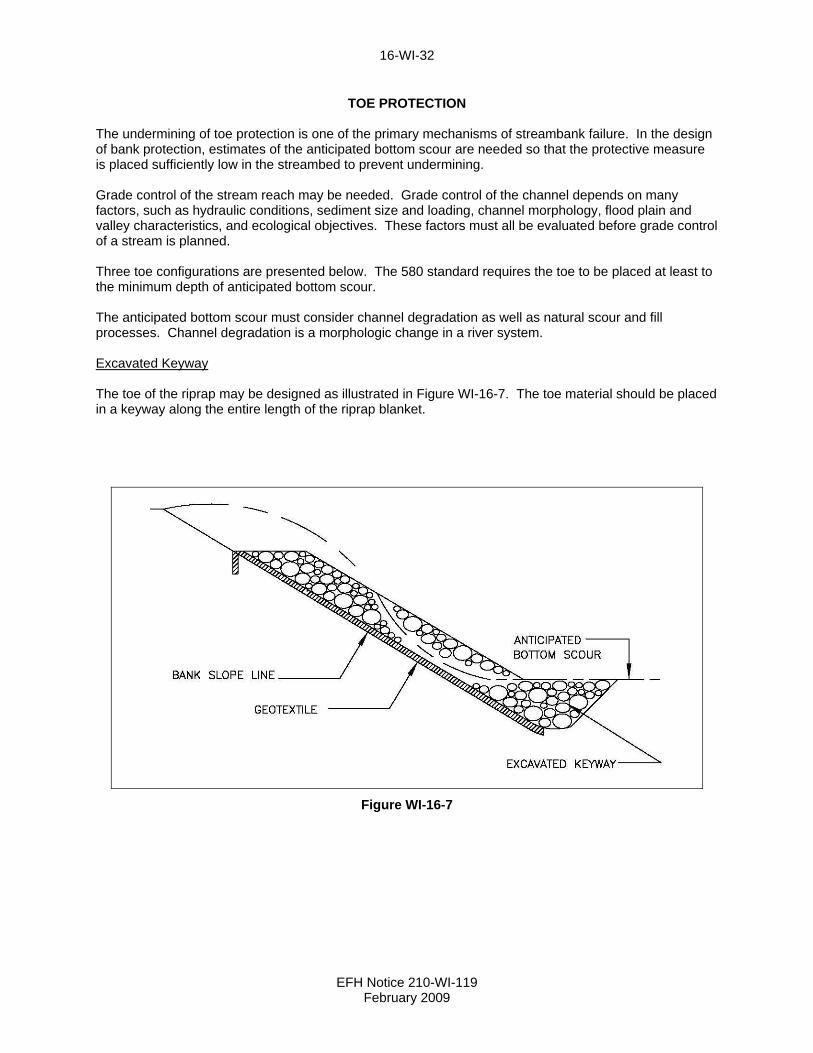
TOE PROTECTION The undermining of toe protection is one of the primary mechanisms of streambank failure. In the design of bank protection, estimates of the anticipated bottom scour are needed so that the protective measure is placed sufficiently low in the streambed to prevent undermining. Grade control of the stream reach may be needed. Grade control of the channel depends on many factors, such as hydraulic conditions, sediment size and loading, channel morphology, flood plain and valley characteristics, and ecological objectives. These factors must all be evaluated before grade control of a stream is planned. Three toe configurations are presented below. The 580 standard requires the toe to be placed at least to the minimum depth of anticipated bottom scour. The anticipated bottom scour must consider channel degradation as well as natural scour and fill processes. Channel degradation is a morphologic change in a river system. Excavated Keyway The toe of the riprap may be designed as illustrated in Figure WI-16-7. The toe material should be placed in a keyway along the entire length of the riprap blanket.
Figure WI-16-7
EFH Notice 210-WI-119 February 2009
16-WI-33
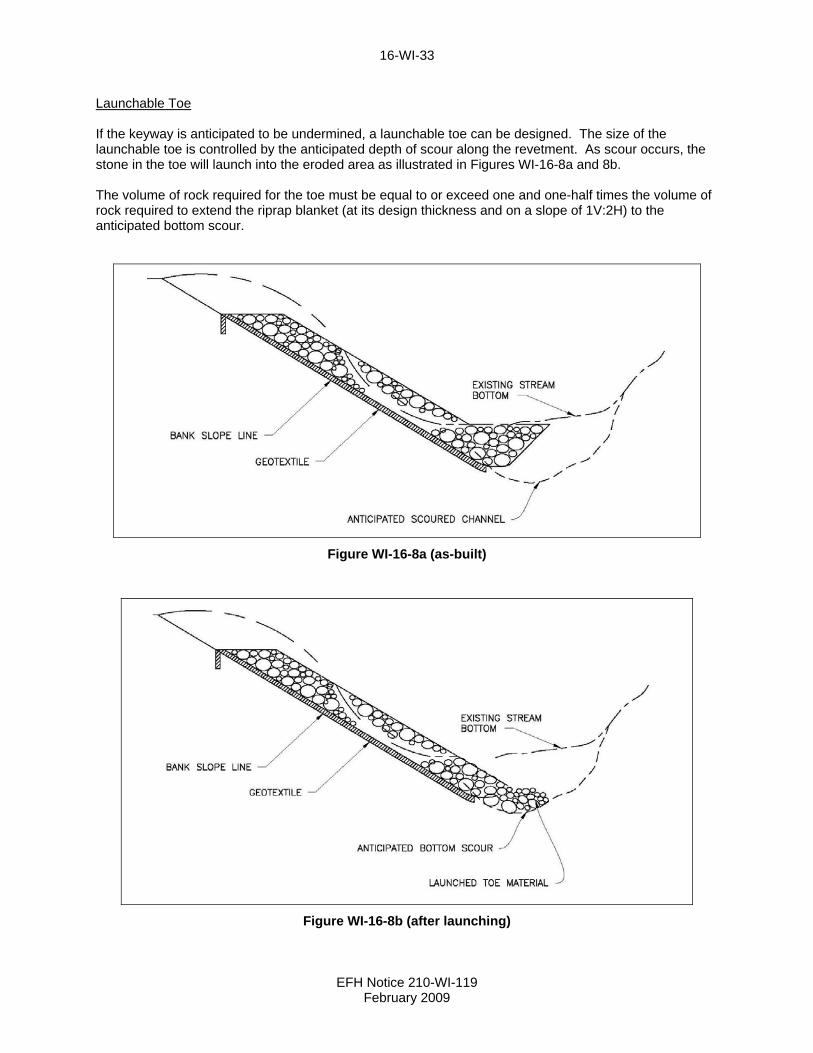
Launchable Toe If the keyway is anticipated to be undermined, a launchable toe can be designed. The size of the launchable toe is controlled by the anticipated depth of scour along the revetment. As scour occurs, the stone in the toe will launch into the eroded area as illustrated in Figures WI-16-8a and 8b. The volume of rock required for the toe must be equal to or exceed one and one-half times the volume of rock required to extend the riprap blanket (at its design thickness and on a slope of 1V:2H) to the anticipated bottom scour.
Figure WI-16-8a (as-built)
Figure WI-16-8b (after launching)
EFH Notice 210-WI-119 February 2009
16-WI-34
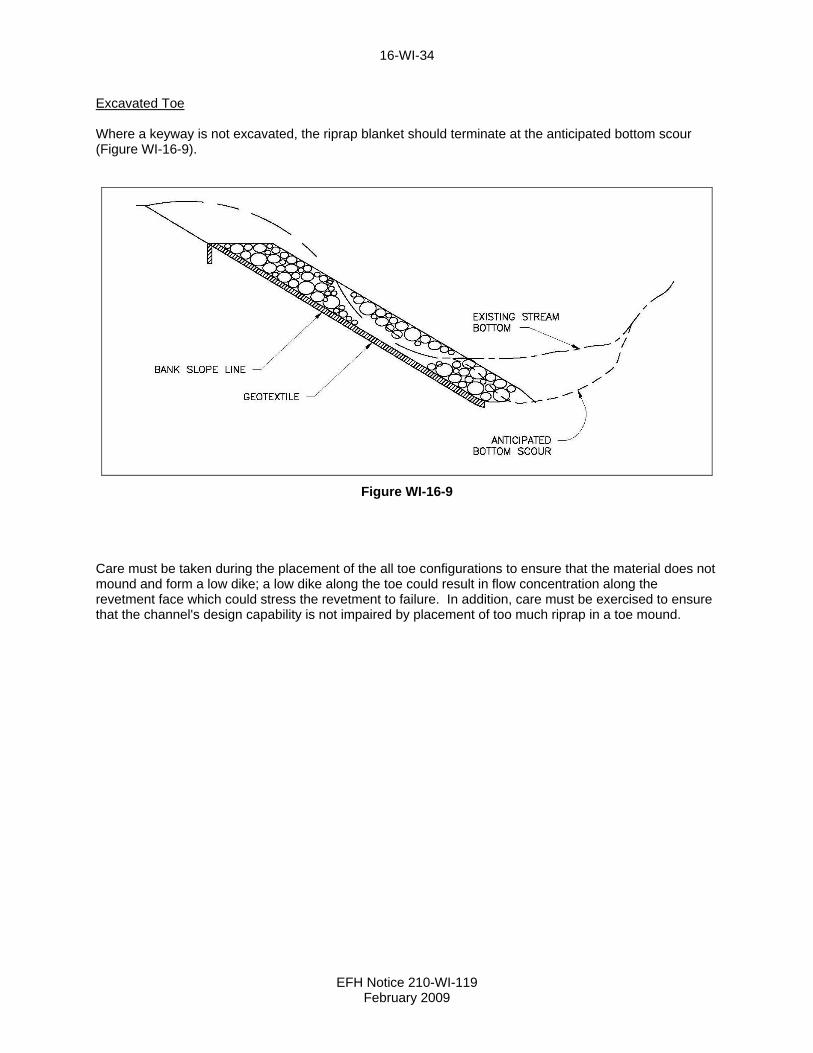
Excavated Toe Where a keyway is not excavated, the riprap blanket should terminate at the anticipated bottom scour (Figure WI-16-9).
Figure WI-16-9
Care must be taken during the placement of the all toe configurations to ensure that the material does not mound and form a low dike; a low dike along the toe could result in flow concentration along the revetment face which could stress the revetment to failure. In addition, care must be exercised to ensure that the channel's design capability is not impaired by placement of too much riprap in a toe mound.
EFH Notice 210-WI-119 February 2009

16-WI-35
LENGTH OF GEOTEXTILE NEEDED (FEET) EXCLUDING OVERLAP
Figure WI-16-10
Table 5 “Z”
“H” 1.5:1 2.0:1 3.0:1
2.0 4.6 5.5 7.2 3.0 6.4 7.7 10.4 4.0 8.2 9.9 13.6 5.0 10.0 12.2 16.8 6.0 11.8 14.4 20.0 7.0 13.6 16.7 23.1 8.0 15.4 18.9 26.3 9.0 17.2 21.1 29.5 10.0 19.0 23.4 32.6
For Additional “d” = 0.5 feet
0.9 1.1 1.6
Length includes 1 foot buried in anchor trench.
Values were computed by 22 ]*)[()(1 ZdHdHL with d assumed to be 0.0 feet. The
length needed to be increased for “d” below the top of the toe. Increase the length by 1.5 feet for each roll side overlap needed to cover the slope length.
EFH Notice 210-WI-119 February 2009
16-WI-36
REVETMENTS BLOCKS
Revetment blocks are manufactured blocks of various shapes and sizes. These generally are made with concrete, but other materials have been used. Interlocking or a tight butt fit provides resistance to displacement. Design Refer to the manufacture’s design procedures for these systems. Maximum allowable velocities will vary by manufacturer because of different abilities of the block systems to resist detachment or displacement from flood events. Independent studies are the best source for allowable velocity data.
GABION AND MATTRESS REVETMENTS
Gabion and mattress revetments are systems of wire baskets laced together and filled with rock of a predetermined size(s). Basket thickness, length, and width are of various dimensions. Baskets one foot or less in thickness are often called a mattress. Combinations of baskets and mattresses can provide needed stability. Main uses of these linings are:
control of bank seepage, improved stability of banks, protection from erosion, and meeting a predetermined value of Manning's "n".
In narrow confined sites, gabions can be stacked with a nearly vertical face or wall. Design Primary design parameters that must be evaluated are:
foundation, seepage and drainage needed behind them, velocity, stability of the stream bed (degrading), and hydraulic capacity.
Refer to the manufacturer's design procedures for these systems. Maximum allowable velocities will vary by basket thickness and manufacturer.
CELLULAR CONFINEMENT SYSTEMS
A cellular confinement system is generally a heavy-duty polyethylene that is delivered in a collapsed position. When pulled into the expanded shape, they are panels 4 or 8 inches thick, 8 feet wide, and 20 feet long. When expanded, there is a honeycomb appearance to the cell pattern. The cells are filled to give erosion control. They can be placed on the streambed and banks. Refer to the manufacturer’s design recommendations for details of design and construction. There are five infill materials that could be used for streambank protection.
Topsoil and vegetation on upper portion of side slopes. Sand and pit-run only for low flows. Use surface sealer recommended. Gravel, maximum 3-inch size, for low to moderate velocities. Crushed stone, maximum 3-inch size, for low to moderate velocities. Concrete or soil cement for moderate to very high velocities.
EFH Notice 210-WI-119 February 2009

16-WI-37
Design Primary design parameters that must be evaluated are:
foundation, seepage and drainage needed behind them, velocity, stability of the stream bed (is it down cutting?), and hydraulic capacity.
Allowable maximum velocities used for design needs to be based on reliable hydraulic studies for the material. Leaching Protection of Base Soils Protected with Revetment Blocks and Other Systems For bank soils with no significant seepage pressures, leaching of the bank base material through the revetment blocks must be prevented. Leaching can be controlled by one of the following methods.
1. A protective layer of intermediate sized material (bedding) meeting the leaching protection criteria is placed between the blocks and base material. See the manufacturer’s design criteria.
2. A geotextile is placed between the blocks and base material.
EFH Notice 210-WI-119 February 2009

16-WI-38
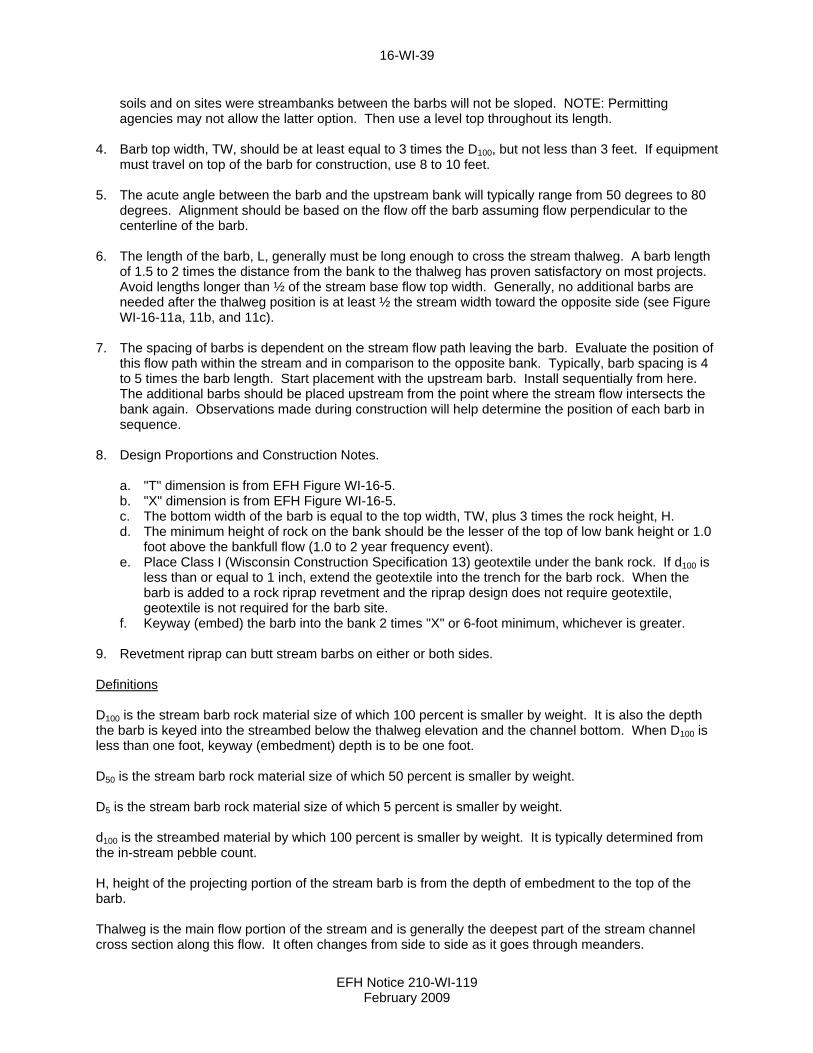
WISCONSIN DESIGN FOR STREAM BARBS Stream barbs are low rock sills projecting out from the bank and across the thalweg of a stream for the purpose of redirecting the stream flow away from an eroding bank. Flow passing over the barb is redirected such that flow leaving the barb is perpendicular to the barb centerline. The thalweg is defined as the thread of the deepest portion of the channel. Application and Effectiveness
Experience is increasing. The range of application has not been tested. Stable streambed required. Effective in control of bank erosion on streams. Less rock than jetties. Can be less rock than revetments. Environmentally more acceptable. Effective in controlling erosion while establishing vegetation on intervening bank.
Design and Construction Guidelines Materials - large rock, geotextile, or gravel bedding material. Design and Construction: 1. Rock Size, D5 - Select the larger size of the two methods shown below. One is based on velocity.
The other is based on d100 size of the streambed material.
Method 1. Compute the low bank velocity. The spreadsheet, "Streambank Riprap," is suggested. Determine a D50 rock size using EFH Figure 16-WI-4, or use the D50 MIN size shown on the spreadsheet calculation. For stream barb design, the D50 size determined by either of these methods is the D5 gradation size for the rock used in the stream barb. Rename D50 to D5 rock size for stream barb design for this use. The velocity shall be determined using the design storm or out-of-bank flow.
Method 2.
The d100 streambed material is from the stream pebble count. D5 for rock in the stream barb cannot be less than d100 of the streambed material.
Table 6
Rock Sizes and Gradation for Both Methods Percent Passing by
Weight Size (in.)
100 4 x D5 25 - 50 2 x D5
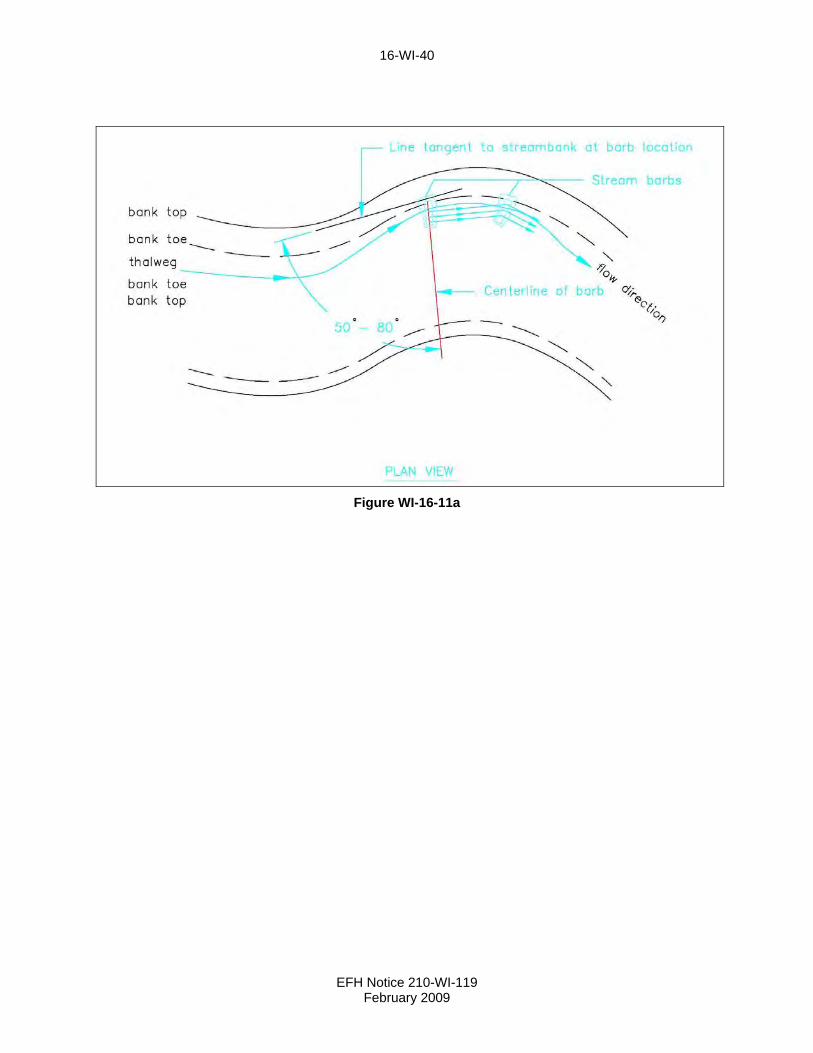
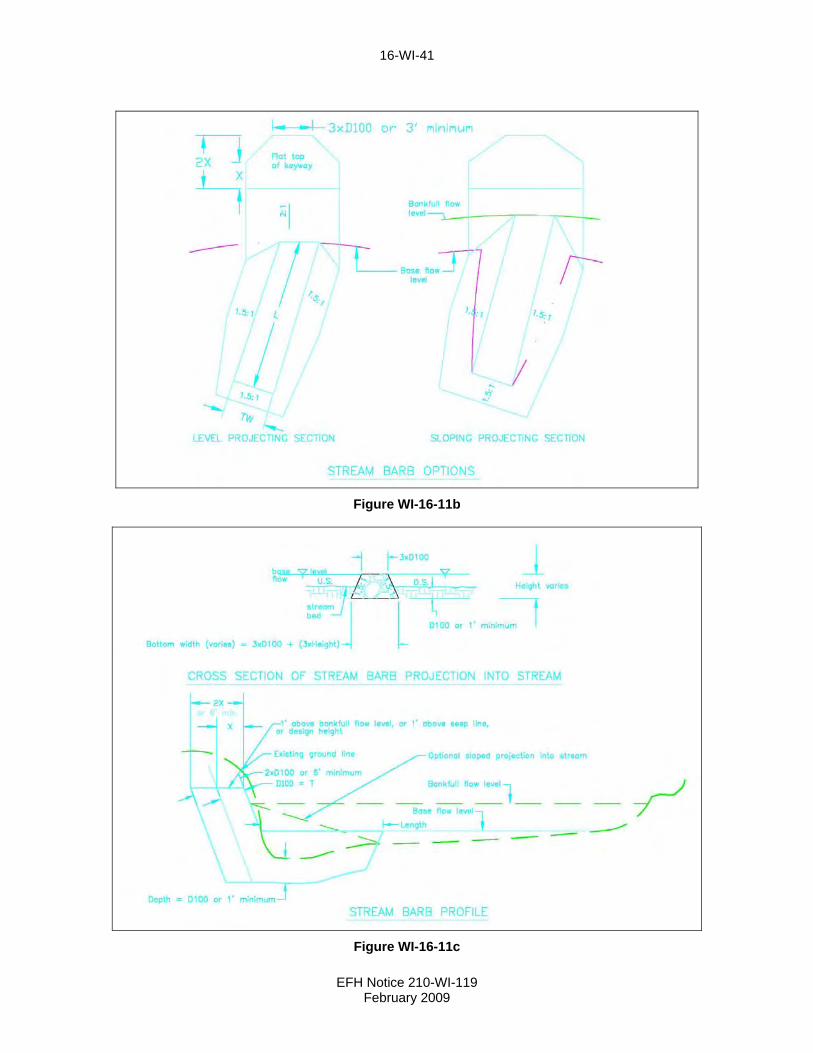
0 - 5 D5 2. Key the barb into the streambed a depth, D, approximately D100 or at least one foot below the channel
bottom. 3. The minimum elevation of the barb top projecting into the stream is at the typical base flow elevation.
An option is to slope the top of the projecting section down from the bankfull flow elevation to the base flow elevation at the end of the barb. The option should be used on sites with highly erosive
EFH Notice 210-WI-119 February 2009
16-WI-39
soils and on sites were streambanks between the barbs will not be sloped. NOTE: Permitting agencies may not allow the latter option. Then use a level top throughout its length.
4. Barb top width, TW, should be at least equal to 3 times the D100, but not less than 3 feet. If equipment
must travel on top of the barb for construction, use 8 to 10 feet. 5. The acute angle between the barb and the upstream bank will typically range from 50 degrees to 80
degrees. Alignment should be based on the flow off the barb assuming flow perpendicular to the centerline of the barb.
6. The length of the barb, L, generally must be long enough to cross the stream thalweg. A barb length
of 1.5 to 2 times the distance from the bank to the thalweg has proven satisfactory on most projects. Avoid lengths longer than ½ of the stream base flow top width. Generally, no additional barbs are needed after the thalweg position is at least ½ the stream width toward the opposite side (see Figure WI-16-11a, 11b, and 11c).
7. The spacing of barbs is dependent on the stream flow path leaving the barb. Evaluate the position of
this flow path within the stream and in comparison to the opposite bank. Typically, barb spacing is 4 to 5 times the barb length. Start placement with the upstream barb. Install sequentially from here. The additional barbs should be placed upstream from the point where the stream flow intersects the bank again. Observations made during construction will help determine the position of each barb in sequence.
8. Design Proportions and Construction Notes.
a. "T" dimension is from EFH Figure WI-16-5. b. "X" dimension is from EFH Figure WI-16-5. c. The bottom width of the barb is equal to the top width, TW, plus 3 times the rock height, H. d. The minimum height of rock on the bank should be the lesser of the top of low bank height or 1.0
foot above the bankfull flow (1.0 to 2 year frequency event). e. Place Class I (Wisconsin Construction Specification 13) geotextile under the bank rock. If d100 is
less than or equal to 1 inch, extend the geotextile into the trench for the barb rock. When the barb is added to a rock riprap revetment and the riprap design does not require geotextile, geotextile is not required for the barb site.
f. Keyway (embed) the barb into the bank 2 times "X" or 6-foot minimum, whichever is greater. 9. Revetment riprap can butt stream barbs on either or both sides. Definitions D100 is the stream barb rock material size of which 100 percent is smaller by weight. It is also the depth the barb is keyed into the streambed below the thalweg elevation and the channel bottom. When D100 is less than one foot, keyway (embedment) depth is to be one foot. D50 is the stream barb rock material size of which 50 percent is smaller by weight. D5 is the stream barb rock material size of which 5 percent is smaller by weight. d100 is the streambed material by which 100 percent is smaller by weight. It is typically determined from the in-stream pebble count. H, height of the projecting portion of the stream barb is from the depth of embedment to the top of the barb. Thalweg is the main flow portion of the stream and is generally the deepest part of the stream channel cross section along this flow. It often changes from side to side as it goes through meanders.
EFH Notice 210-WI-119 February 2009
16-WI-40
Figure WI-16-11a
EFH Notice 210-WI-119 February 2009
16-WI-41
Figure WI-16-11b
Figure WI-16-11c
EFH Notice 210-WI-119 February 2009
16-WI-42
FLOOD GATE AND WATERING FACILITY
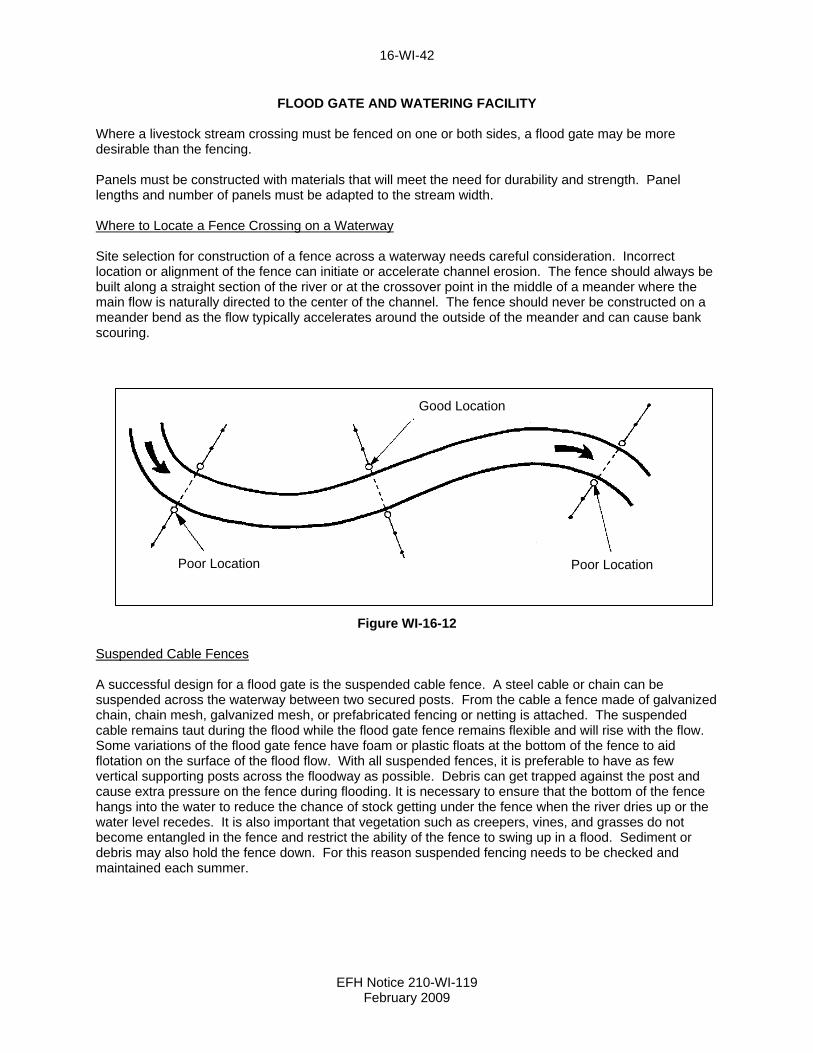
Where a livestock stream crossing must be fenced on one or both sides, a flood gate may be more desirable than the fencing. Panels must be constructed with materials that will meet the need for durability and strength. Panel lengths and number of panels must be adapted to the stream width. Where to Locate a Fence Crossing on a Waterway Site selection for construction of a fence across a waterway needs careful consideration. Incorrect location or alignment of the fence can initiate or accelerate channel erosion. The fence should always be built along a straight section of the river or at the crossover point in the middle of a meander where the main flow is naturally directed to the center of the channel. The fence should never be constructed on a meander bend as the flow typically accelerates around the outside of the meander and can cause bank scouring.
Good Location Poor Location Poor Location
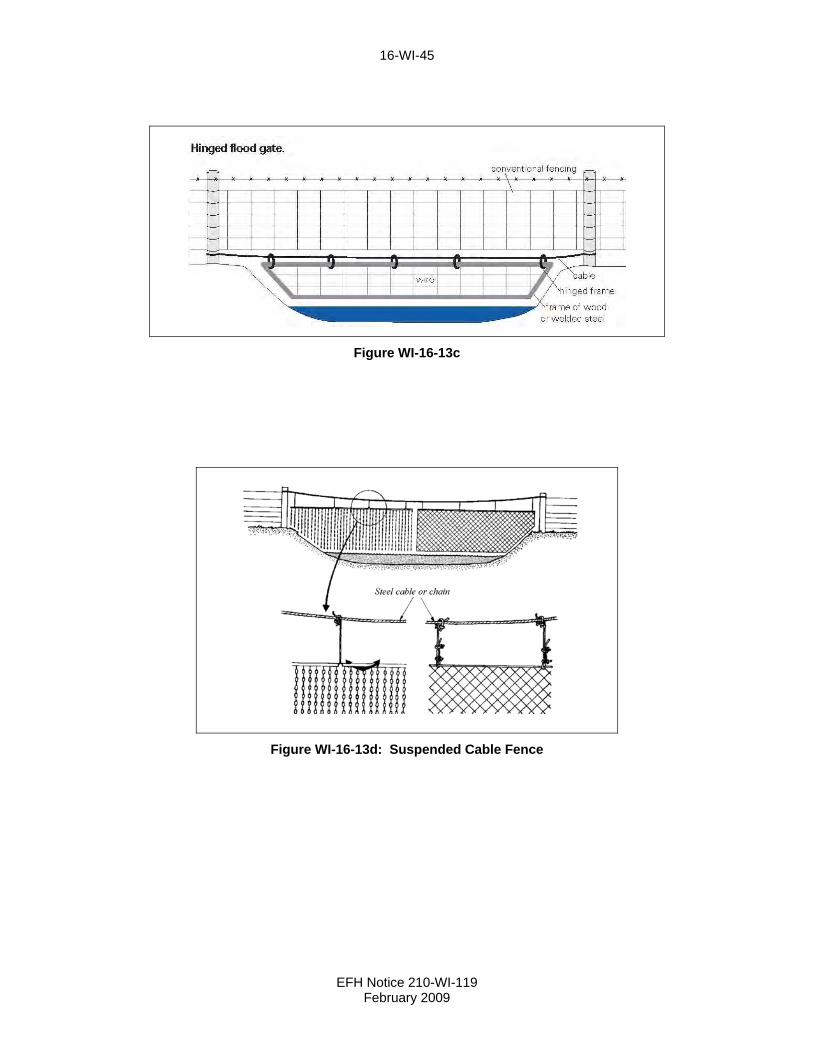
Figure WI-16-12 Suspended Cable Fences A successful design for a flood gate is the suspended cable fence. A steel cable or chain can be suspended across the waterway between two secured posts. From the cable a fence made of galvanized chain, chain mesh, galvanized mesh, or prefabricated fencing or netting is attached. The suspended cable remains taut during the flood while the flood gate fence remains flexible and will rise with the flow. Some variations of the flood gate fence have foam or plastic floats at the bottom of the fence to aid flotation on the surface of the flood flow. With all suspended fences, it is preferable to have as few vertical supporting posts across the floodway as possible. Debris can get trapped against the post and cause extra pressure on the fence during flooding. It is necessary to ensure that the bottom of the fence hangs into the water to reduce the chance of stock getting under the fence when the river dries up or the water level recedes. It is also important that vegetation such as creepers, vines, and grasses do not become entangled in the fence and restrict the ability of the fence to swing up in a flood. Sediment or debris may also hold the fence down. For this reason suspended fencing needs to be checked and maintained each summer.
EFH Notice 210-WI-119 February 2009
16-WI-43
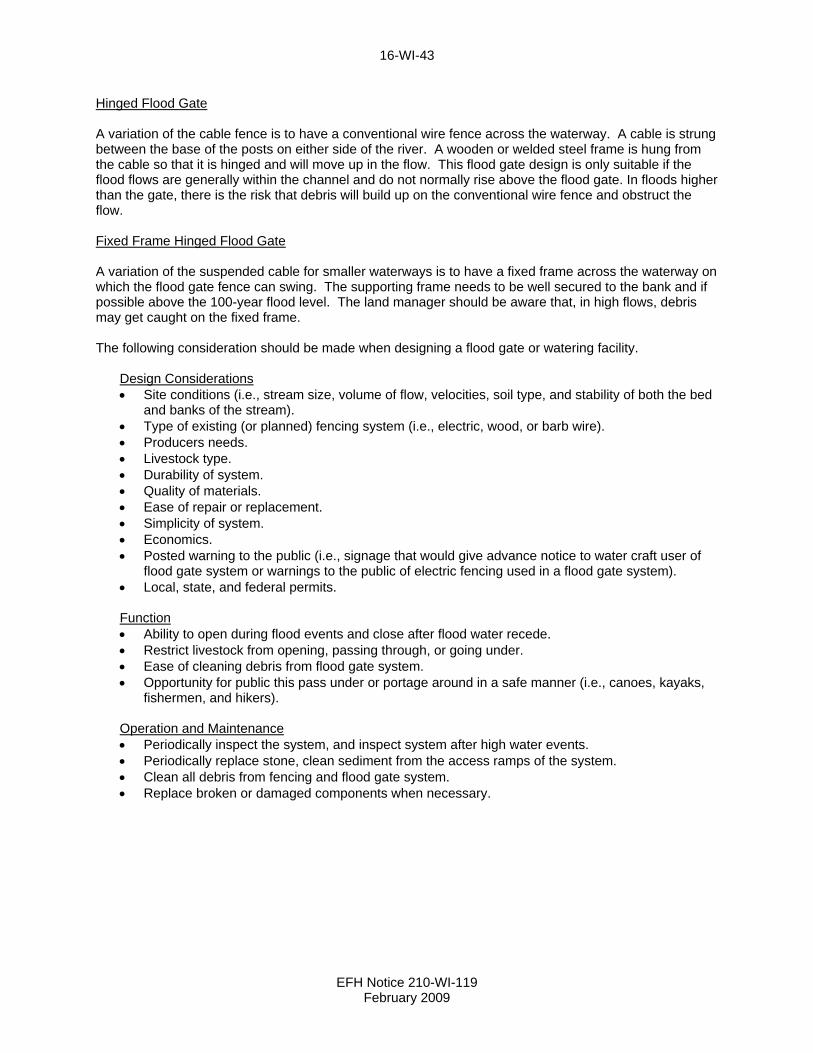
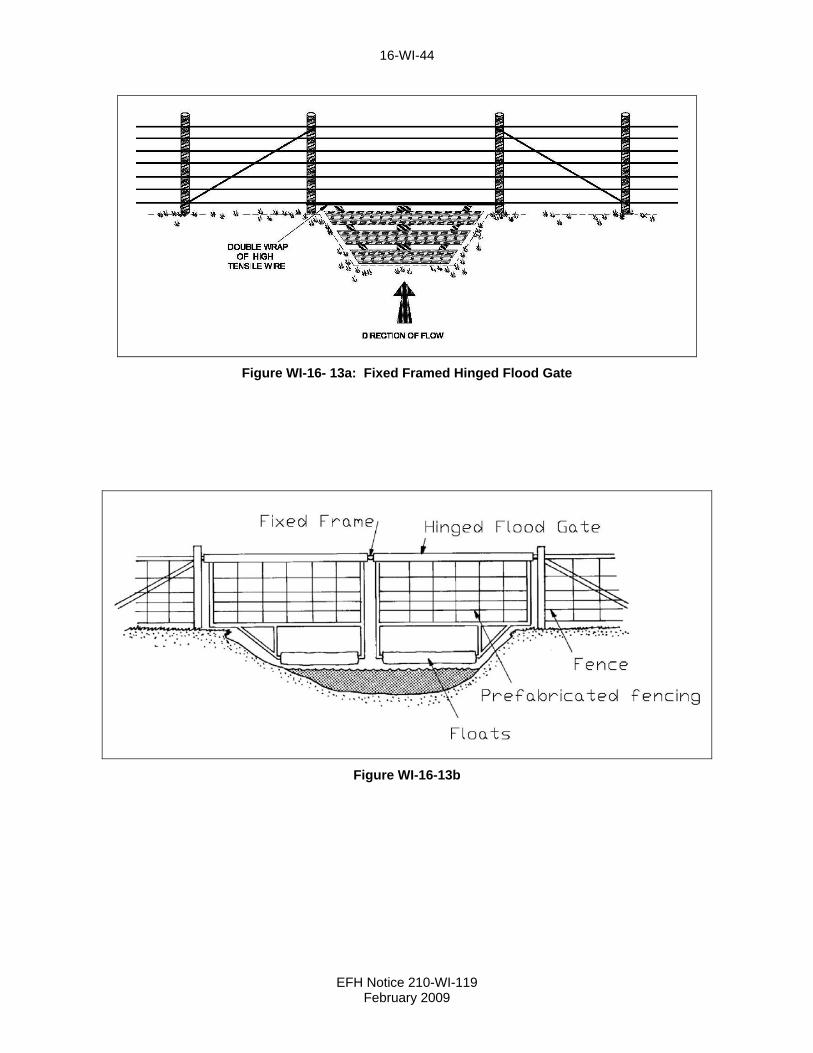
Hinged Flood Gate A variation of the cable fence is to have a conventional wire fence across the waterway. A cable is strung between the base of the posts on either side of the river. A wooden or welded steel frame is hung from the cable so that it is hinged and will move up in the flow. This flood gate design is only suitable if the flood flows are generally within the channel and do not normally rise above the flood gate. In floods higher than the gate, there is the risk that debris will build up on the conventional wire fence and obstruct the flow. Fixed Frame Hinged Flood Gate A variation of the suspended cable for smaller waterways is to have a fixed frame across the waterway on which the flood gate fence can swing. The supporting frame needs to be well secured to the bank and if possible above the 100-year flood level. The land manager should be aware that, in high flows, debris may get caught on the fixed frame. The following consideration should be made when designing a flood gate or watering facility.
Design Considerations Site conditions (i.e., stream size, volume of flow, velocities, soil type, and stability of both the bed
and banks of the stream). Type of existing (or planned) fencing system (i.e., electric, wood, or barb wire). Producers needs. Livestock type. Durability of system. Quality of materials. Ease of repair or replacement. Simplicity of system. Economics. Posted warning to the public (i.e., signage that would give advance notice to water craft user of
flood gate system or warnings to the public of electric fencing used in a flood gate system). Local, state, and federal permits.
Function Ability to open during flood events and close after flood water recede. Restrict livestock from opening, passing through, or going under. Ease of cleaning debris from flood gate system. Opportunity for public this pass under or portage around in a safe manner (i.e., canoes, kayaks,
fishermen, and hikers).
Operation and Maintenance Periodically inspect the system, and inspect system after high water events. Periodically replace stone, clean sediment from the access ramps of the system. Clean all debris from fencing and flood gate system. Replace broken or damaged components when necessary.
EFH Notice 210-WI-119 February 2009
16-WI-44
Figure WI-16- 13a: Fixed Framed Hinged Flood Gate
Figure WI-16-13b
EFH Notice 210-WI-119 February 2009
16-WI-45
Figure WI-16-13c
Figure WI-16-13d: Suspended Cable Fence
EFH Notice 210-WI-119 February 2009

16-WI-46
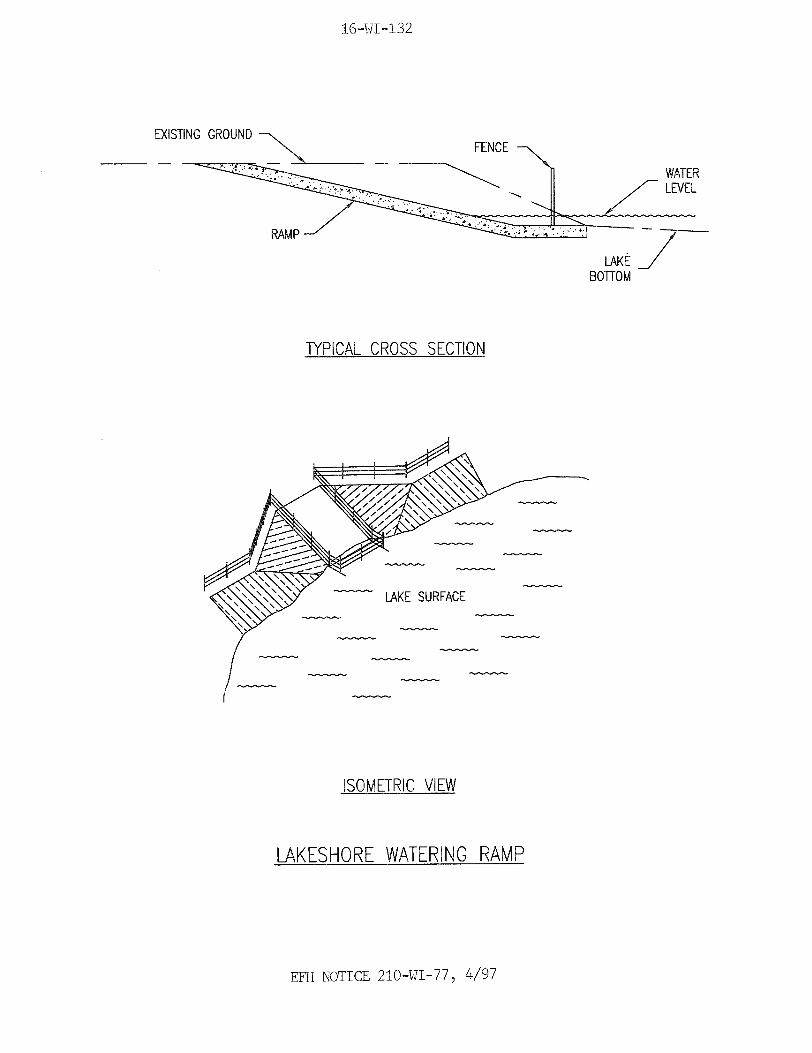
LIVESTOCK STREAMBANK WATERING RAMP Livestock streambank watering ramps need a ramp slope safe for the cattle to walk on in most seasons of the year. A slope of 4:1 or flatter has proven to work. The ramp side slopes should be 2:1 or flatter. The ramp surface for the end that is in the stream should be placed at the stream bottom elevation or lower. Recess the ramp from the edge of the stream bottom into the bank. Ramp surfacing shall be as specified for livestock stream crossings in Practice Standard 587, Stream Crossing, Section IV, Field Office Technical Guide, NRCS. The sides and bottom end of the ramp should be fenced to limit cattle access.
Figure WI-16-14
EFH Notice 210-WI-119 February 2009
16-WI-47
ALTERNATIVE TECHNIQUES FOR STREAMBANK PROTECTION
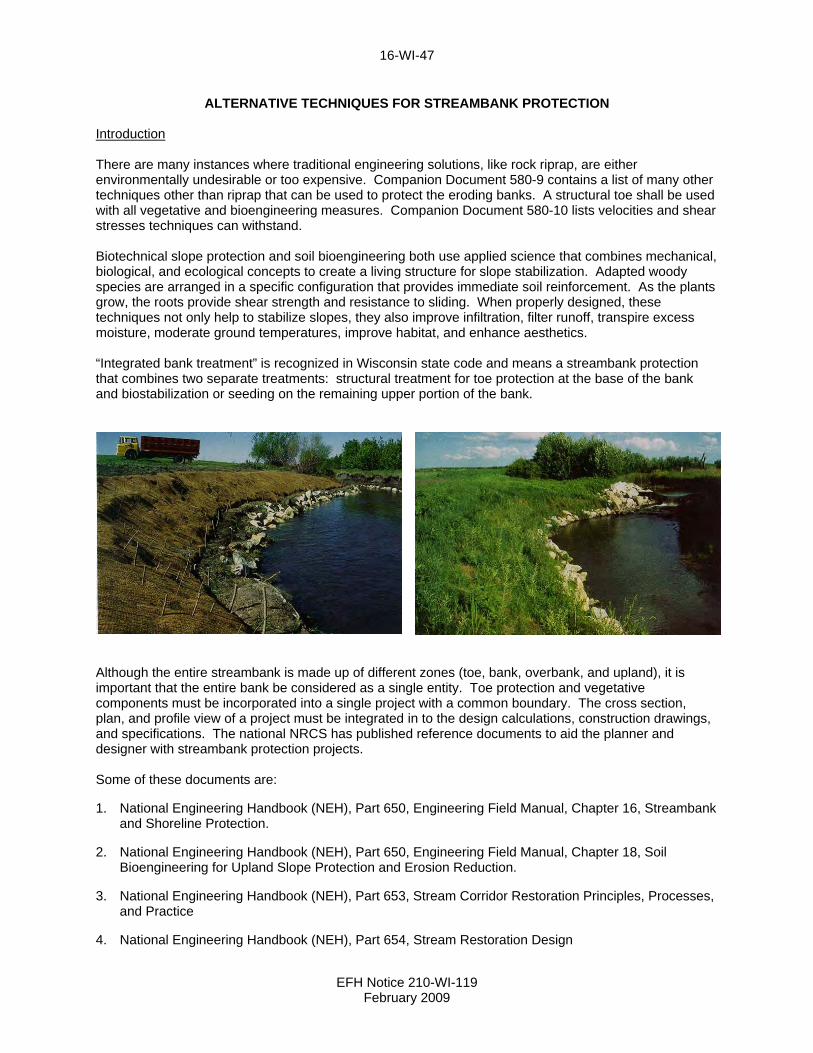
Introduction There are many instances where traditional engineering solutions, like rock riprap, are either environmentally undesirable or too expensive. Companion Document 580-9 contains a list of many other techniques other than riprap that can be used to protect the eroding banks. A structural toe shall be used with all vegetative and bioengineering measures. Companion Document 580-10 lists velocities and shear stresses techniques can withstand. Biotechnical slope protection and soil bioengineering both use applied science that combines mechanical, biological, and ecological concepts to create a living structure for slope stabilization. Adapted woody species are arranged in a specific configuration that provides immediate soil reinforcement. As the plants grow, the roots provide shear strength and resistance to sliding. When properly designed, these techniques not only help to stabilize slopes, they also improve infiltration, filter runoff, transpire excess moisture, moderate ground temperatures, improve habitat, and enhance aesthetics. “Integrated bank treatment” is recognized in Wisconsin state code and means a streambank protection that combines two separate treatments: structural treatment for toe protection at the base of the bank and biostabilization or seeding on the remaining upper portion of the bank.
Although the entire streambank is made up of different zones (toe, bank, overbank, and upland), it is important that the entire bank be considered as a single entity. Toe protection and vegetative components must be incorporated into a single project with a common boundary. The cross section, plan, and profile view of a project must be integrated in to the design calculations, construction drawings, and specifications. The national NRCS has published reference documents to aid the planner and designer with streambank protection projects. Some of these documents are:
1. National Engineering Handbook (NEH), Part 650, Engineering Field Manual, Chapter 16, Streambank and Shoreline Protection.
2. National Engineering Handbook (NEH), Part 650, Engineering Field Manual, Chapter 18, Soil Bioengineering for Upland Slope Protection and Erosion Reduction.
3. National Engineering Handbook (NEH), Part 653, Stream Corridor Restoration Principles, Processes, and Practice
4. National Engineering Handbook (NEH), Part 654, Stream Restoration Design
EFH Notice 210-WI-119 February 2009

16-WI-48
EFH Notice 210-WI-119 February 2009
ICE DAMAGE Ice can affect riprap linings in a number of ways. Moving surface ice can cause crushing and bending forces as well as large impact loadings. The tangential flow of ice along a riprap lined channel bank can also cause excessive shearing forces. Quantitative criteria for evaluating the impact ice has on channel protection schemes are unavailable. Ice attachment to the riprap also can cause a decrease in stability. For design, consideration of ice forces should be evaluated on a case-by-case basis. In most instances, ice flows are not of sufficient magnitude to warrant detailed analysis. Where ice flows have historically caused problems, a stability factor of 1.2 to 1.5 should be used to increase the design rock size. A general rule found in EM 1110-2-1601 is to increase the thickness of the revetment by 6-12 inches and accompanied by an appropriate increase in stone size (D50 increase of 3-6 inches).

16-WI-49
EFH NOTICE 210-WI-136
SHORELINE RIPRAP PROTECTION DESIGN PROCEDURE
This design procedure is based on deep water wave height development and wave height prediction developed by:
A) Young and Verhagen, 1996, “The growth of fetch limited waves in water of finite depth. Part 1. Total energy and peak frequency”
B) Young, 1997, “The growth rate of finite depth wind-generated waves”.
C) The “Shore Protection Manual” published by the U. S. Army Corps of Engineers 1984 edition is also used in the procedure. The design wave height (Ho) is based on wave height, wave length, setup, and run-up (See Figure 1) of waves caused by wind. Note: The method currently used by the Wisconsin Department of Natural Resources uses only the wave height (Hs).
Figure 1: Wave Height and Length, Setup, Run-up, and Upper Limits of Riprap and Protection
CALCULATE DESIGN WAVE HEIGHT:
1. Using an aerial photograph, USGS quad map, or other planimetric view of the lake, locate the site needing protection. Draw the longest unobstructed straight-line across the open water of the lake from the design point until it intersects the opposite shoreline. The length of the line is the fetch.
2. Estimate the average depth of the lake along the fetch line by examining a lake map. Numerical average is used when stations are uniformly spaced to represent the site and weighted average is used when grade changes (high and low elevations) are used to represent the site.
a. Using evenly spaced points along the fetch, sum the reported depths, and divide by the number of recorded values. (Numerical average)
b. Using unevenly spaced points along the fetch, weight the average of adjacent depths by the distance along the fetch line. (Weighted average, using the average end area)
16-WI-50
EFH NOTICE 210-WI-136
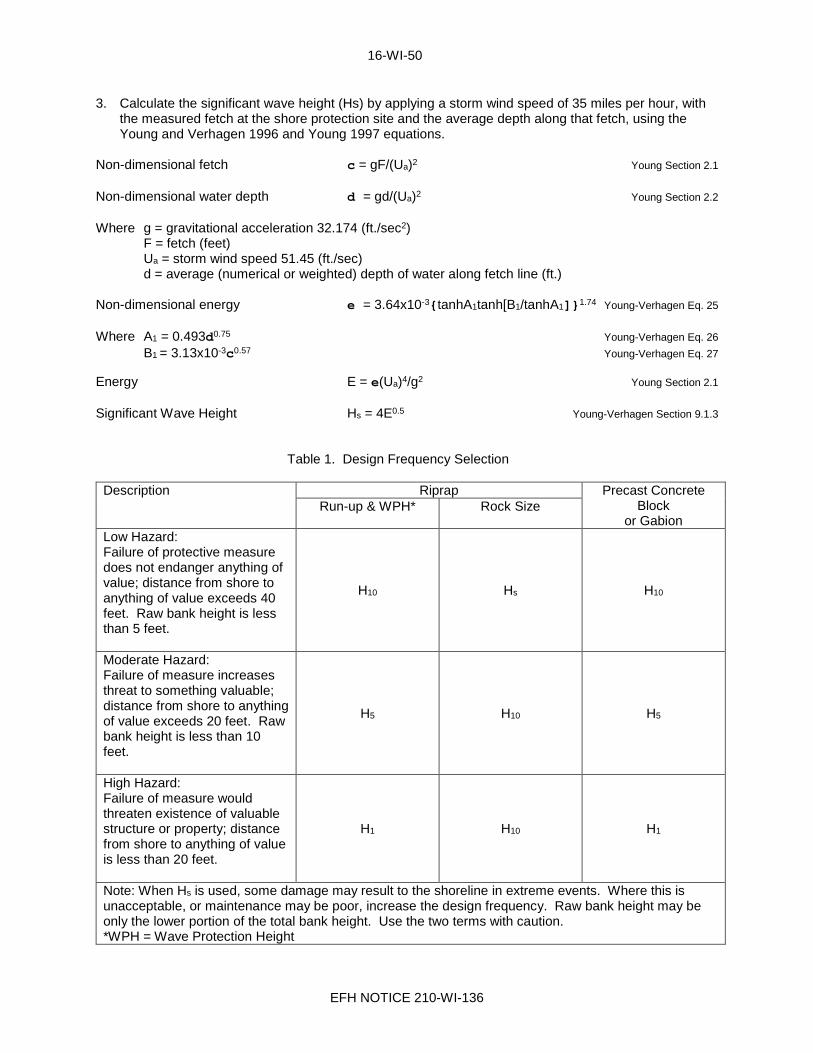
3. Calculate the significant wave height (Hs) by applying a storm wind speed of 35 miles per hour, with the measured fetch at the shore protection site and the average depth along that fetch, using the Young and Verhagen 1996 and Young 1997 equations.
Non-dimensional fetch c = gF/(Ua)2 Young Section 2.1 Non-dimensional water depth d = gd/(Ua)2 Young Section 2.2 Where g = gravitational acceleration 32.174 (ft./sec2)
F = fetch (feet) Ua = storm wind speed 51.45 (ft./sec)
d = average (numerical or weighted) depth of water along fetch line (ft.) Non-dimensional energy e = 3.64x10⁻³{tanhA1tanh[B1/tanhA1]}1.74 Young-Verhagen Eq. 25
Where A1 = 0.493d0.75 Young-Verhagen Eq. 26
B1 = 3.13x10⁻³c0.57 Young-Verhagen Eq. 27
Energy E = e(Ua)4/g2 Young Section 2.1 Significant Wave Height Hs = 4E0.5 Young-Verhagen Section 9.1.3
Table 1. Design Frequency Selection
Description Riprap Precast Concrete
Block or Gabion
Run-up & WPH* Rock Size
Low Hazard: Failure of protective measure does not endanger anything of value; distance from shore to anything of value exceeds 40 feet. Raw bank height is less than 5 feet.
H10 Hs H10
Moderate Hazard: Failure of measure increases threat to something valuable; distance from shore to anything of value exceeds 20 feet. Raw bank height is less than 10 feet.
H5 H10 H5
High Hazard: Failure of measure would threaten existence of valuable structure or property; distance from shore to anything of value is less than 20 feet.
H1 H10 H1
Note: When Hs is used, some damage may result to the shoreline in extreme events. Where this is unacceptable, or maintenance may be poor, increase the design frequency. Raw bank height may be only the lower portion of the total bank height. Use the two terms with caution. *WPH = Wave Protection Height
16-WI-51
EFH NOTICE 210-WI-136
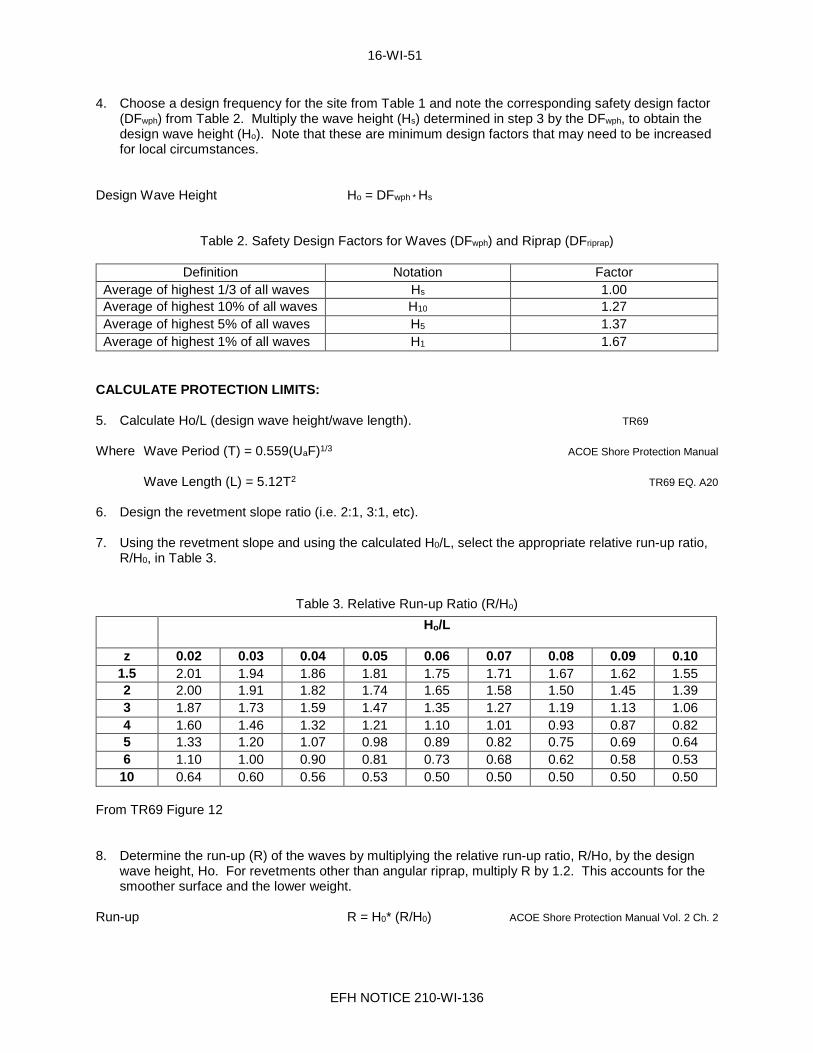
4. Choose a design frequency for the site from Table 1 and note the corresponding safety design factor (DFwph) from Table 2. Multiply the wave height (Hs) determined in step 3 by the DFwph, to obtain the design wave height (Ho). Note that these are minimum design factors that may need to be increased for local circumstances.
Design Wave Height Ho = DFwph * Hs
Table 2. Safety Design Factors for Waves (DFwph) and Riprap (DFriprap)
Definition Notation Factor Average of highest 1/3 of all waves Hs 1.00 Average of highest 10% of all waves H10 1.27 Average of highest 5% of all waves H5 1.37 Average of highest 1% of all waves H1 1.67
CALCULATE PROTECTION LIMITS: 5. Calculate Ho/L (design wave height/wave length). TR69
Where Wave Period (T) = 0.559(UaF)1/3 ACOE Shore Protection Manual
Wave Length (L) = 5.12T2 TR69 EQ. A20
6. Design the revetment slope ratio (i.e. 2:1, 3:1, etc).
7. Using the revetment slope and using the calculated H0/L, select the appropriate relative run-up ratio,
R/H0, in Table 3.
Table 3. Relative Run-up Ratio (R/Ho)
From TR69 Figure 12 8. Determine the run-up (R) of the waves by multiplying the relative run-up ratio, R/Ho, by the design
wave height, Ho. For revetments other than angular riprap, multiply R by 1.2. This accounts for the smoother surface and the lower weight.
Run-up R = H0* (R/H0) ACOE Shore Protection Manual Vol. 2 Ch. 2
Ho/L
z 0.02 0.03 0.04 0.05 0.06 0.07 0.08 0.09 0.10 1.5 2.01 1.94 1.86 1.81 1.75 1.71 1.67 1.62 1.55 2 2.00 1.91 1.82 1.74 1.65 1.58 1.50 1.45 1.39 3 1.87 1.73 1.59 1.47 1.35 1.27 1.19 1.13 1.06 4 1.60 1.46 1.32 1.21 1.10 1.01 0.93 0.87 0.82 5 1.33 1.20 1.07 0.98 0.89 0.82 0.75 0.69 0.64 6 1.10 1.00 0.90 0.81 0.73 0.68 0.62 0.58 0.53
10 0.64 0.60 0.56 0.53 0.50 0.50 0.50 0.50 0.50

16-WI-52
EFH NOTICE 210-WI-136
9. Determine the setup (S). Setup is the lesser of 0.1 times the wave height (Hs) or 0.5 feet.
Setup S = 0.1Hs ≤ 0.5 feet TR69 II.D.2
S = 0.5 > 0.5 feet
10. Calculate Lower Limit: The lower limit for the riprap shall be 1.5 times the Wave Height (Hs), below the normal low lake elevation for the year for deep water and the lake bottom for shallower water. TR69 II.D.1
11. Determine Upper Limit of Protection: Use the highest of the following:
Ordinary High Water Mark (OHWM) elevation plus the design storm wave height. Seep lines in the bank if not controlled in some other fashion. Boat-generated waves OHWM elevation plus the wave setup and run-up.
See Standard 580 Streambank and Shoreline Protection for minimum Criteria and treatment measures. (i.e. Vegetative Treatments, Soil Bioengineering Treatments, and Structural Treatments)
Note: The maximum upper limit for riprap for a NR-328 General Permit is Ordinary High Water elevation plus the Wave Height, (Hs). The designer may choose a higher elevation and a DNR Individual Permit if vegetated practices are not stable between the Upper Limit of Protection elevation and the General Permit maximum riprap elevation.
ROCK SELECTION: 12. Rock Size Wave Height: Choose a design frequency for the site from Table 1 and note the
corresponding safety design factor (DFriprap) from Table 2. Multiply the Hs determined in step 3 by the DFriprap to obtain a rock size wave height (Hrock).
Note:
• These are minimum design factors that may be increased for local circumstances. • The design factor is different for determining run-up and wave protection height (WPH)
and for determining rock size wave height (Hrock) Rock Size Wave Height (feet) Hrock = Hs*DFriprap
The size of rock is determined from relationships of wave heights, wave velocities, and drag on the rock relative to the stable size of the rock needed to resist these forces for a given bank slope. Rock Size Weight (lbs.) W50 = (Factorrock*Gs*Hrock3)/((Gs-1)3*z) TR-69 Eq. E14 Where Factorrock = 19.5 for cubical rock = 31.2 for spherical rock Gs = rock specific gravity (typically 2.65) z = revetment slope ratio (i.e. 2 for a 2:1 bank slope) Note: Rock Factor (Factorrock) is specific weight of water divided by a rock stability factor. Dumped rock riprap value of 3.2 is recommended for the rock stability factor. (62.4/3.2=19.5) A stability factor of 2.0 was used for the less stable spherical rock. 13. Rock Gradation and Thickness: The size, gradation and thickness of rock depends on the rock
available. Tables 4 and 5 describe two gradations that may be used.
16-WI-53
EFH NOTICE 210-WI-136
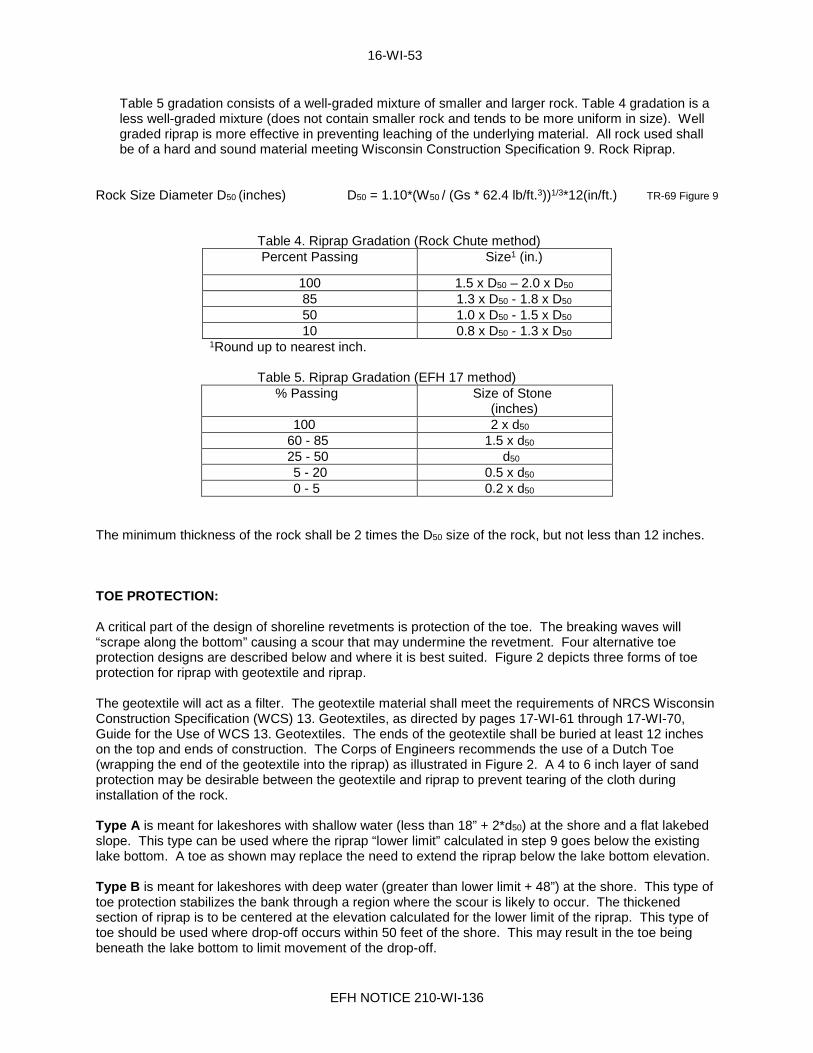
Table 5 gradation consists of a well-graded mixture of smaller and larger rock. Table 4 gradation is a less well-graded mixture (does not contain smaller rock and tends to be more uniform in size). Well graded riprap is more effective in preventing leaching of the underlying material. All rock used shall be of a hard and sound material meeting Wisconsin Construction Specification 9. Rock Riprap.
Rock Size Diameter D50 (inches) D50 = 1.10*(W50 / (Gs * 62.4 lb/ft.3))1/3*12(in/ft.) TR-69 Figure 9
Table 4. Riprap Gradation (Rock Chute method) Percent Passing Size1 (in.)
100 1.5 x D50 – 2.0 x D50 85 1.3 x D50 - 1.8 x D50 50 1.0 x D50 - 1.5 x D50 10 0.8 x D50 - 1.3 x D50
1Round up to nearest inch.
Table 5. Riprap Gradation (EFH 17 method) % Passing Size of Stone
(inches) 100 2 x d50
60 - 85 1.5 x d50 25 - 50 d50 5 - 20 0.5 x d50 0 - 5 0.2 x d50
The minimum thickness of the rock shall be 2 times the D50 size of the rock, but not less than 12 inches.
TOE PROTECTION:
A critical part of the design of shoreline revetments is protection of the toe. The breaking waves will “scrape along the bottom” causing a scour that may undermine the revetment. Four alternative toe protection designs are described below and where it is best suited. Figure 2 depicts three forms of toe protection for riprap with geotextile and riprap. The geotextile will act as a filter. The geotextile material shall meet the requirements of NRCS Wisconsin Construction Specification (WCS) 13. Geotextiles, as directed by pages 17-WI-61 through 17-WI-70, Guide for the Use of WCS 13. Geotextiles. The ends of the geotextile shall be buried at least 12 inches on the top and ends of construction. The Corps of Engineers recommends the use of a Dutch Toe (wrapping the end of the geotextile into the riprap) as illustrated in Figure 2. A 4 to 6 inch layer of sand protection may be desirable between the geotextile and riprap to prevent tearing of the cloth during installation of the rock. Type A is meant for lakeshores with shallow water (less than 18” + 2*d50) at the shore and a flat lakebed slope. This type can be used where the riprap “lower limit” calculated in step 9 goes below the existing lake bottom. A toe as shown may replace the need to extend the riprap below the lake bottom elevation. Type B is meant for lakeshores with deep water (greater than lower limit + 48”) at the shore. This type of toe protection stabilizes the bank through a region where the scour is likely to occur. The thickened section of riprap is to be centered at the elevation calculated for the lower limit of the riprap. This type of toe should be used where drop-off occurs within 50 feet of the shore. This may result in the toe being beneath the lake bottom to limit movement of the drop-off.

16-WI-54
EFH NOTICE 210-WI-136
Type C is intended for lakes with an intermediate depth (greater than 18” + 2*d50) at the shore. For safety reasons, there must be at least 18” of water depth at the shore after the riprap is installed. This type also replaces the need to go below the lake bottom elevation as in Type A. This toe may also be easier to install than the Type A toe. Type D is for sites where ice damage is a concern, larger rock can be placed in the toe area as shown in Figure 3. The rocks shall have a minimum weight of 425 pounds or a minimum diameter of 18 inches but should be approximately 2 times the D50 or larger They will be placed beginning at the shoreline and continue into the lake for a distance equal to three boulder diameters. The top of the boulders shall be set at an elevation no more than 1 foot above the Ordinary High Water elevation, which means that the boulders will have to be trenched into the lakebed in most instances. The boulders shall be placed over geotextile covered with a sand cushion a minimum of 6 inches thick.
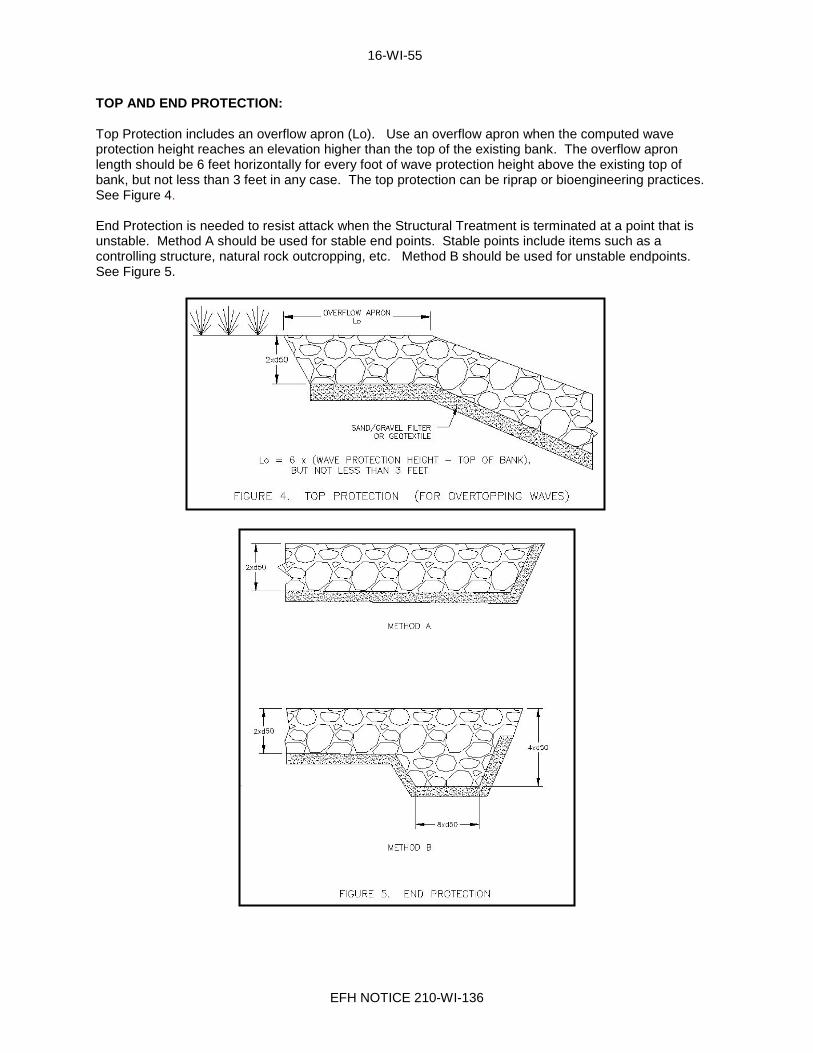
16-WI-55
EFH NOTICE 210-WI-136
TOP AND END PROTECTION: Top Protection includes an overflow apron (Lo). Use an overflow apron when the computed wave protection height reaches an elevation higher than the top of the existing bank. The overflow apron length should be 6 feet horizontally for every foot of wave protection height above the existing top of bank, but not less than 3 feet in any case. The top protection can be riprap or bioengineering practices. See Figure 4. End Protection is needed to resist attack when the Structural Treatment is terminated at a point that is unstable. Method A should be used for stable end points. Stable points include items such as a controlling structure, natural rock outcropping, etc. Method B should be used for unstable endpoints. See Figure 5.

16-WI-56
EFH NOTICE 210-WI-136
OTHER PROTECTIVE MEASURES:
1. Gabions Gabions can also provide acceptable shoreline protection. The designer is encouraged to follow steps 1 through 11 of the riprap design procedure for determining the extent of the gabion protection. Design of the gabions themselves should follow manufacturer’s recommendations and NRCS Wisconsin Construction Specification (WCS) 17. Wire Mesh Gabions and Mattresses. The wave run-up should be increased by a factor of 1.2 as noted in step 8 of the design procedure for riprap. Geotextile should be used as a filter, just as stated for riprap. Banks shall be sloped at 1½ horizontal to 1 vertical or flatter.
2. Beaching Slope Shore protection with beaching slopes utilize the movement of semi-fluid sands up the beach with breaking waves, and off the beach with the receding waves to dissipate energy. For any given wave size, a beach will stabilize with a particular relationship between beach slope and the median grain size of the beach material. This method of protection shall only be used for slopes in the range of 10 to 4 horizontal to 1 vertical. Requirements for the design of beaching slopes are:
Slope
*D50 size of
protective layer
Filter layer needed?
Minimum Layer Thickness (in)
Filter
Minimum Layer Thickness (in)
Protective 10:1 0.5 mm - 1.0 mm No None 12 8:1 1.0 mm - 5.0 mm No None 12 6:1 5.0 mm - 1.0 in. Yes 6 12 4:1 1.0 in. - 3.0 in Yes 6 12
*D50 size is percent of material passing by weight
A. Only material larger than 0.17 mm is to be used for obtaining the D50 size of the material for the protective layer. The minimum D50 size allowed shall be 0.5 mm.
B. Extend the slope protection below the normal low lake elevation for the year a distance of 2 design wave heights, 2 x Ho
C. Extend slope protection above the Ordinary High Water elevation a distance equal to the computed wave run-up plus 1 ft.
D. Wave height and run-up can be calculated using the method for designing rock riprap.
E. Gradation for the protective layer shall be based on the D50 size and limits described in the rock riprap section in Table 4 or 5.
F. Material for the protective layer that is outside the design particle size range (>2.5 x D50) may be used if the layer thickness is increased by the percentage of the material outside the range.
G. The filter layer below the protective layer shall be designed using Chapter 26 of Part 633 of the National Engineering Handbook.

16-WI-57
EFH NOTICE 210-WI-136
Pages 16-WI-57 to 16-WI-112 are Intentionally Left Blank


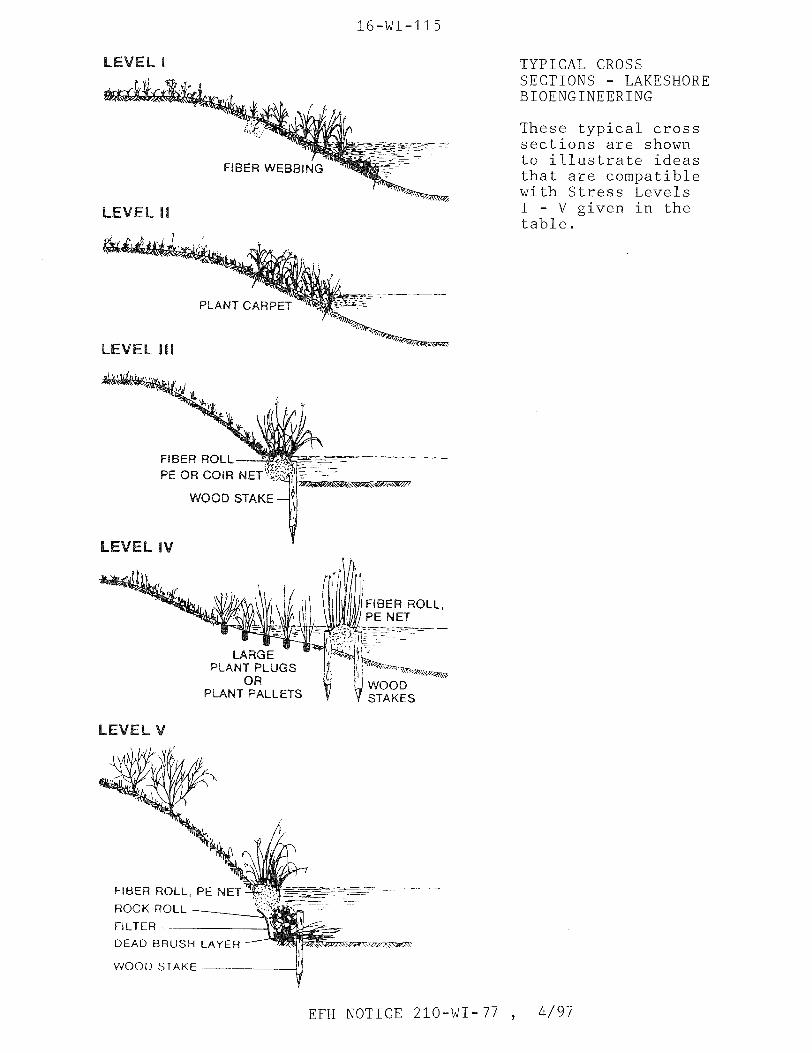
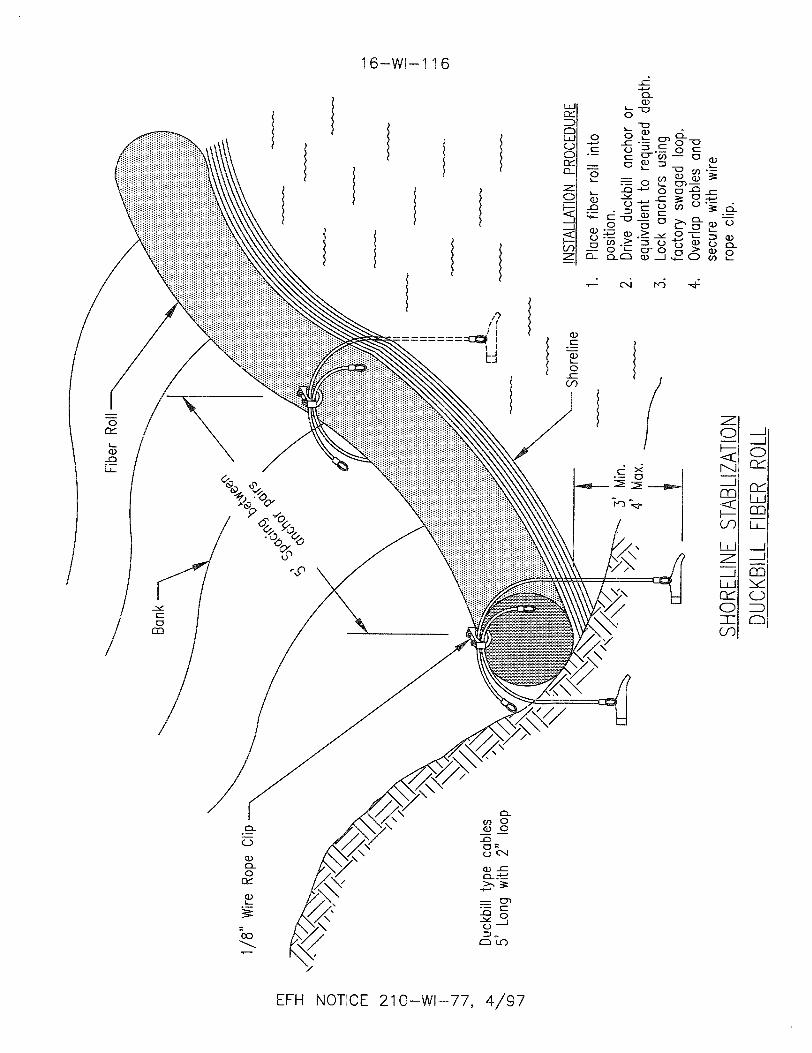

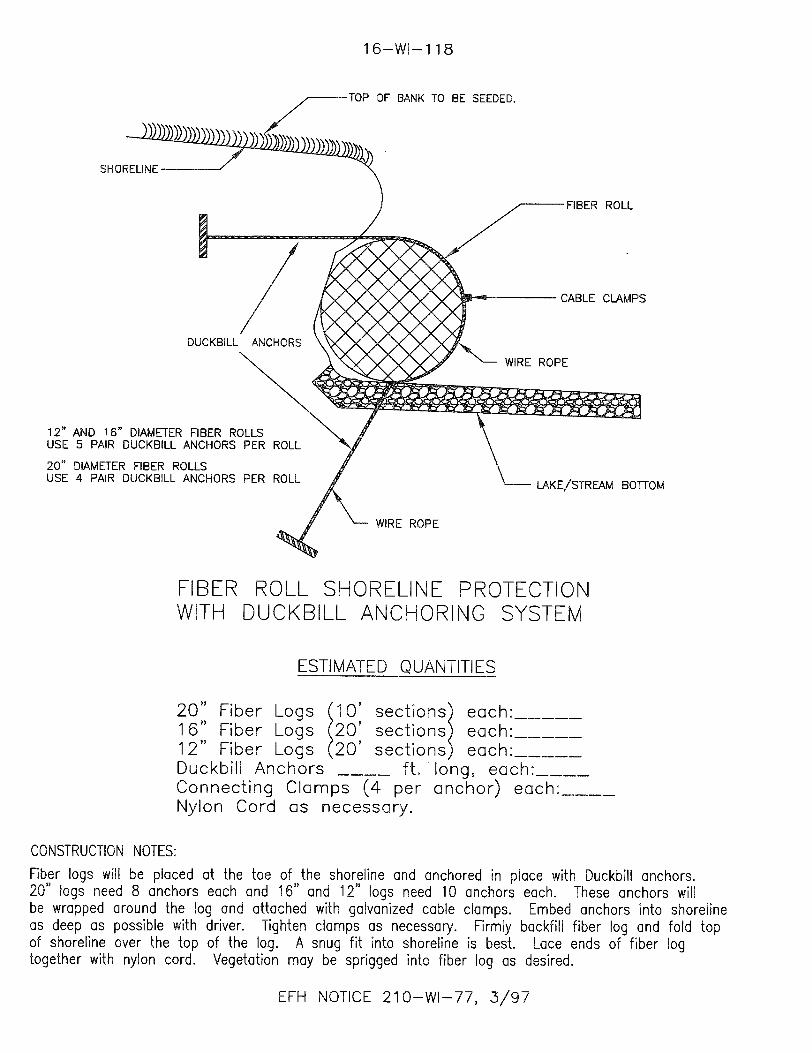
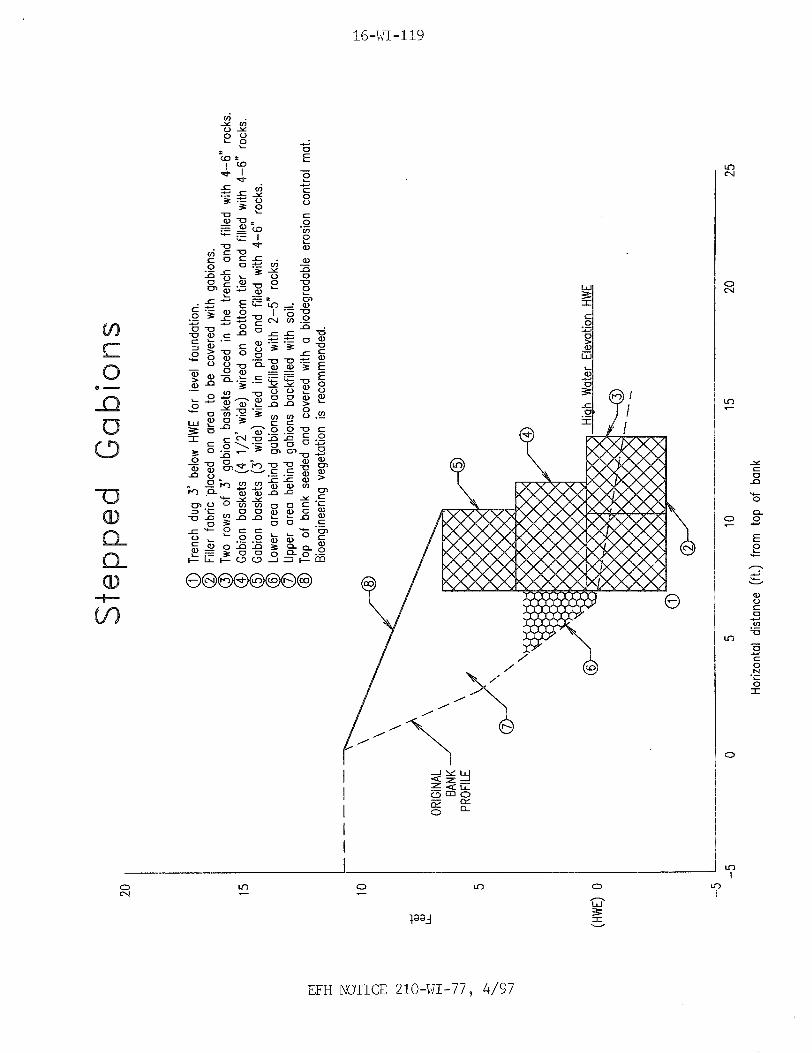
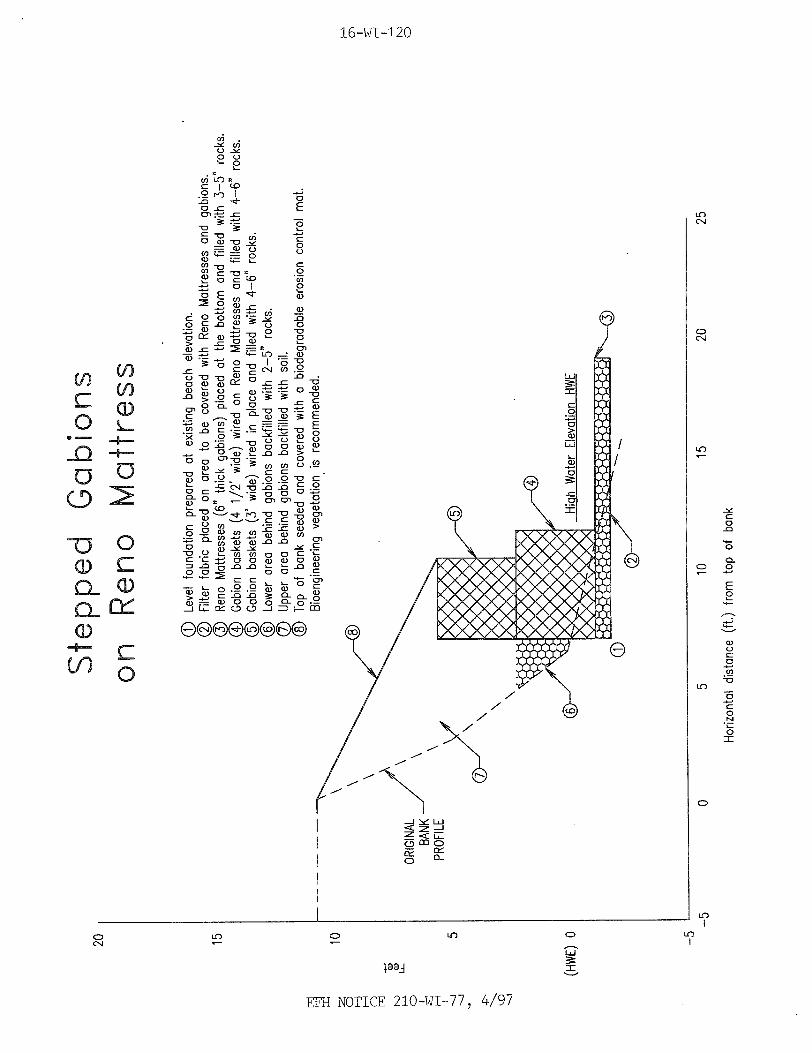

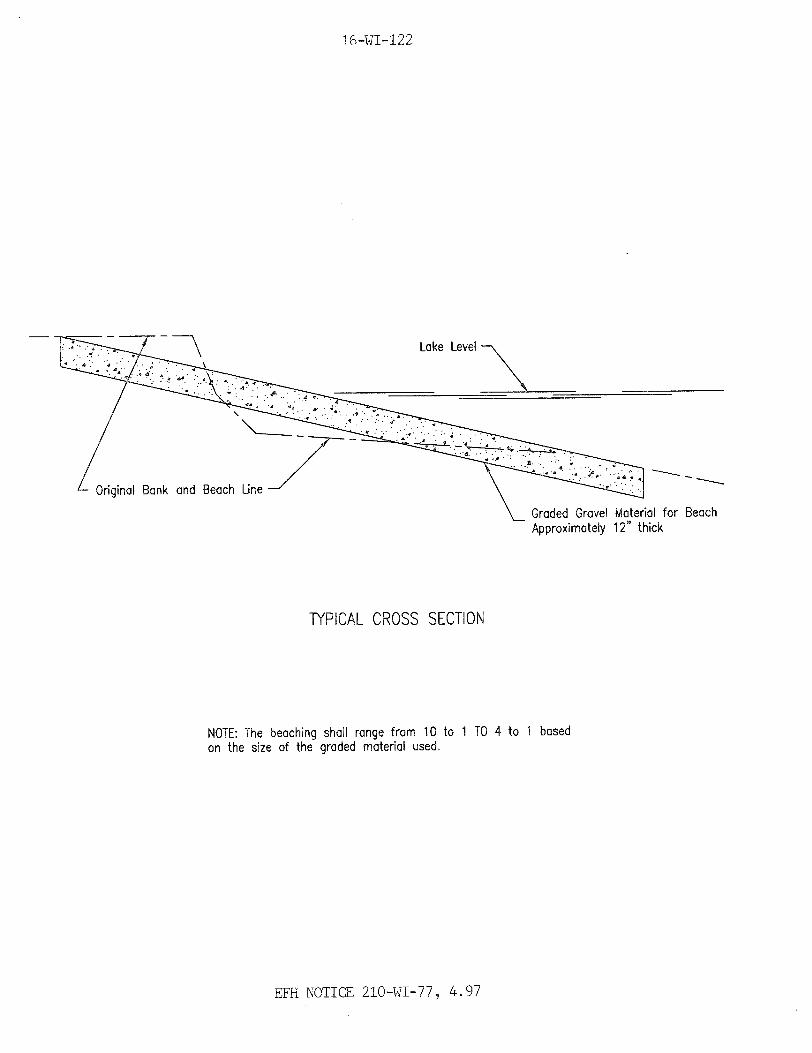
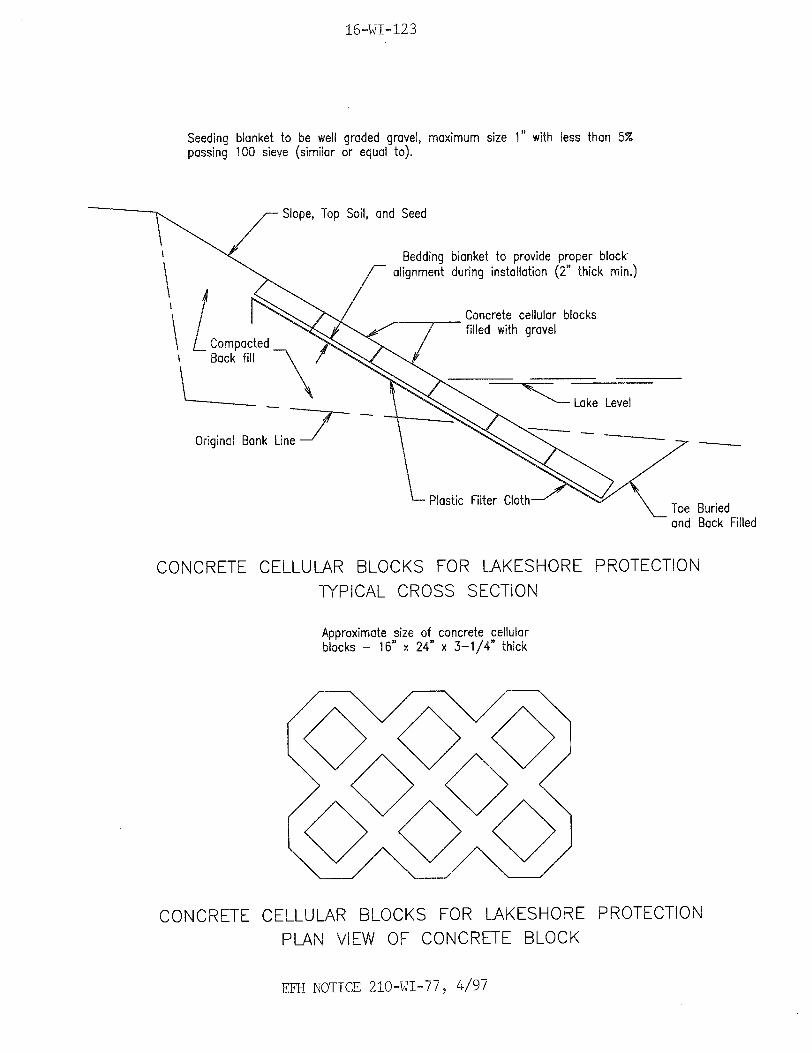
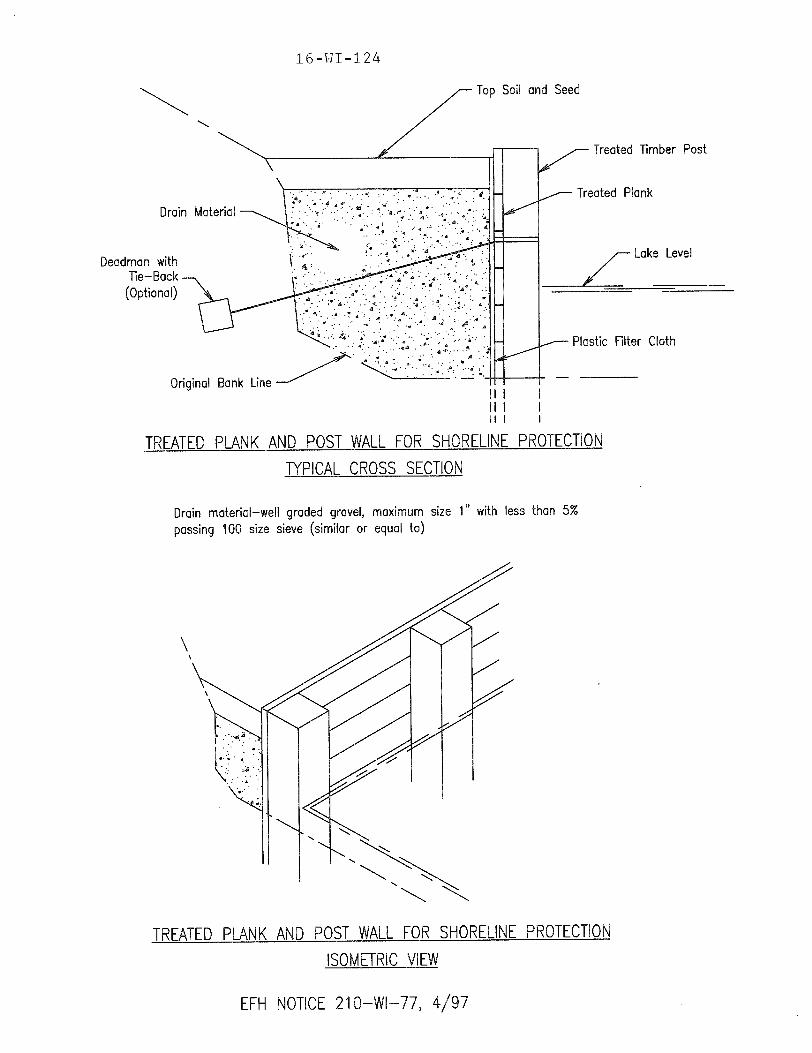
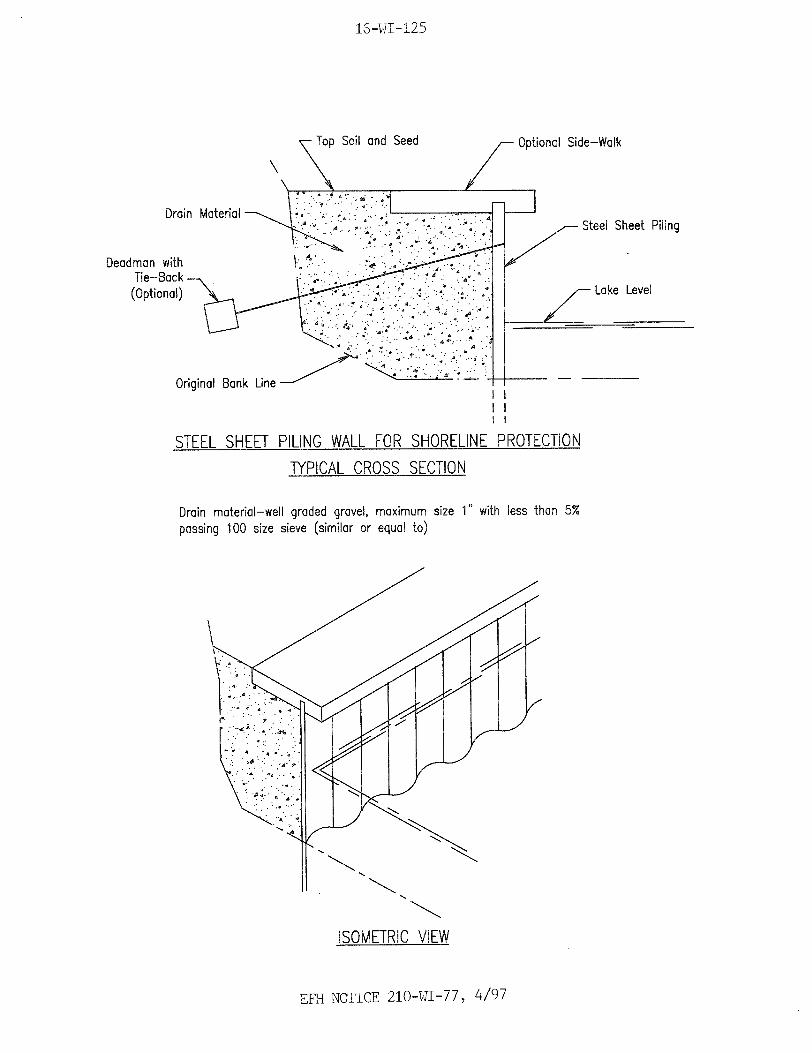


16-WI-127 through 16-WI-130
These pages intentionally left blank.
EFH NOTICE 210-WI-77, 4/97