1990 development and use of coal washery refuse for strata control in coal...
TRANSCRIPT

University of WollongongResearch Online
University of Wollongong Thesis Collection University of Wollongong Thesis Collections
1990
Development and use of coal washery refuse forstrata control in coal minesJohn Kwong HiiUniversity of Wollongong
Research Online is the open access institutional repository for theUniversity of Wollongong. For further information contact ManagerRepository Services: [email protected].
Recommended CitationHii, John Kwong, Development and use of coal washery refuse for strata control in coal mines, Doctor of Philosophy thesis,Department of Civil and Mining Engineering, University of Wollongong, 1990. http://ro.uow.edu.au/theses/1237

DEVELOPMENT AND USE OF COAL WASHERY REFUSE FOR STRATA CONTROL IN COAL MINES
A thesis submitted in fulfilment of the requirements
for the award of the degree of
Doctor of Philosophy
from
THE UNIVERSITY OF WOLLONGONG
.^^srrroT by / "^LONGON*
JOHN KWONG LEE HII, CPEng., B.E.(Hons), MIEAust., MAusIMM., MAPEA
DEPARTMENT OF CIVIL AND MINING ENGINEERING
1990
(ii)
DECLARATION
This is to certify that the work presented in this thesis was carried out by
the author in the Department of Civil and Mining Engineering, The University of
Wollongong, and has not been submitted to any other university or institute for a
Degree.
JOHN KWONG LEE HII

(iii)
LIST OF PUBLICATIONS
The following publications have appeared as a result of the present study:
Hii, J.K. and Aziz, N.I., (1989a), Microcomputer Automation of the Strength
Testing System for Use in a Rock Mechanics Laboratory, Australasian
Instrumentation and Measurement Conference, The Institution of Engineers
Australia, Adelaide, South Australia, 14th-16th November, pp. 51-55.
Hii, J.K. and Aziz, N.I., (1989b), Influence of Water Content on the Mechanical
Properties of Cement and Coal Washery Refuse Concrete, First Conference on
Concrete and Structures, Malaysia, 3rd and 4th October, 1989, Kuala Lumpur,
pp. 47-50.
Hii, J.K. and Aziz, N.I., (1990), Properties and Behaviour of Cement and Coal
Washery Refuse Concrete, Concrete for the Nineties, International Conference
on the Use of Fly Ash, Slag, Silica Fume and Other Siliceous Materials in
Concrete, Leura (Blue Mountains), New South Wales, Australia, 3rd-5th
September, 15 Pages.
Hii, J.K. and Standish, P., (1989), Data Acquisition Systems for Rock Mechanics
Applications, Computer Systems in the Australian Mining Industry, The
University of Wollongong, N.S.W., Australia, September, pp. 133-139.
Hii, J.K., and Wu, Y.H., (1989), Effect of Virgin Stress Fields on the Feasibility
of Using Yield Pillar Technique, Computer Systems in the Australian Mining
Industry, The University of Wollongong, N.S.W., Australia, September, pp.
107-111.

(iv)
Hii, J.K. and Yu, A.B., (1989), The Design of C C W R Concrete, First Conference
on Concrete and Structures, Malaysia, 3rd and 4th October, Kuala Lumpur, pp.
51-56.
Hii, J.K., Aziz, N.I., Zhang S. and Wu, Y.H., (1990a), Influence of Geometry on
Strength and Elasticity of Cement and Coal Washery Refuse Material Models,
3rd International Symposium on the Reclamation, Treatment and Utilization of
Coal Mining Wastes, The Kelvin Conference Centre, Wolfson Hall, The
University of Glasgow, UK, 3rd-7th September, 7 Pages.
Wu, Y.H., Hii, J.K. and Aziz, N.I., (1989), A New Yield Function for CCWR
Concretes, First Conference on Concrete and Structures, Malaysia, 3rd and 4th
October, Kuala Lumpur, pp. 173-176.
3 0009 02901 1397

(v)
ACKNOWLEDGEMENTS
The author wishes to thank the many persons who have contributed to the
completion of this thesis. Particular appreciation is extended to:
Professor L.C. Schmidt, Head of the Department of Civil and Mining
Engineering, The University of Wollongong, for the provision of laboratory
facilities and financial support which enabled this work to be carried out.
Dr. N.I. Aziz and Professor R.N. Singh for their suggestions and
encouragement during the course of this investigation.
Associate Professor Y.C. Loo, Associate Professor R.W. Upfold, Dr. I.
Porter, Dr. V.U. Nguyen and Dr. E.Y. Baafi for their interest in this study and for
numerous stimulating discussions.
Staff of the Department of Civil and Mining Engineering, The University
of Wollongong and Australian Coal Industry Research Laboratories, Bellambi for
their help and advice throughout the course of this thesis.
Dr. R.D. Lama, Manager, Technology and Development, Kembla Coal
and Coke Pty. Ltd. for his helpful suggestions in the course of this work.
Mr. Y.H. Wu, Mr. A.B. Yu and Mr. S.A. Lowe for their help and
encouragement.
Mr. S. Zhang and Mr. CC. Choo for their suggestions and
encouragement.

(vi)
All members of the author's family and special acknowledgement is due to
his parents for their constant support and encouragement throughout the years.
This research investigation was sponsored in part by Kembla Coal and
Coke Pty. Ltd. and in part by grants from The University of Wollongong. The
collaboration and financial assistance of Kembla Coal and Coke Pty. Ltd. and The
University of Wollongong are sincerely appreciated.

(vii)
TO DOMINIQUE PAULINE OEI
FOR HER LOVE AND SUPPORT

(viii)
ABSTRACT
This work involves the development and analysis of a new pump packing
material, which utilizes coal washery refuse ( C W R ) as a raw material, for strata
control in underground coal mining operations. A review on the state of the art of
pump packing systems is presented, together with an analysis of the cost
effectiveness of the new pump packing material as compared to other commercial
pump packing materials.
A method is proposed for use in the design of cement and coal washery
refuse ( C C W R ) material mixes to give a required early strength and degree of
workability when incorporating C W R . The usefulness of the method is shown by
comparison of the results from a large number of tests on C C W R specimens with
previously published results. It is shown that the relationship between the strength
and curing time of a mix can be accurately described by a simple equation. The
effects of the compositions on the strength within the experimental regions are
discussed. As expected an increase in the strength of C C W R materials can be
obtained either by decreasing the water content or increasing the quantity of O P C
used in the mixtures.
This study also investigated the influence of moisture content on the
mechanical properties of C C W R material. The unconfined compressive strength,
Young's modulus, indirect tensile strength, triaxial strength and drying shrinkage
were the primary properties investigated. Results indicate that the moisture content
has a significant effect on both the strength and elasticity of C C W R material at all
curing times. It is evident from the tests that the drying shrinkage of wet mixes is
larger than that of dry mixes. In general, moisture content affects the shrinkage of
C C W R material as it reduces the volume of the restraining C W R .

(ix)
A n empirical criterion is proposed for predicting the strength and yield
characteristics of C C W R materials. A numerical procedure has been developed to
determine the parameters contained in the proposed yield function. It has been
demonstrated that the proposed logarithmic yield function can accurately predict the
strength and yield characteristics of C C W R materials.
Preliminary tests have also been conducted to determine the influence of
moisture content on the flow properties of C W R . The test results indicate that the
presence of very fine grains in C W R enhances its flowability remarkably.
Further work investigated the effect of specimen geometry on the strength
and elasticity of C C W R material. C C W R models were tested, simulating
underground monolithic pack support with different widths in a coal seam of
uniform height. The study also investigated the load deformation characteristics of
C C W R models under the tests conditions. It is shown that geometry has a
significant effect on both the mechanical properties and load deformation
characteristics of C C W R models.
A yield pillar technique analysed by the finite element method appears
suitable for simulation of excavation of roadways under different virgin stress
conditions. Comparison of stability of yield and conventional pillars in several
examples substantiates the feasibility of the technique and indicates that yield pillars
are practical when the factor k, the ratio of horizontal to vertical stress exceeds 1.6.

(x)
TABLE OF CONTENTS
CHAPTER PAGE
Title page (i)
Declaration (ii)
List of Publications (iii)
Acknowledgements (v)
Abstract (viii)
Table of Content (x)
List of Figures (xvii)
List of Tables (xxvi)
List of Abbreviations (xxxi)
Notation (xxxii)
1 INTRODUCTION 1-1
2 MONOLITHIC PUMP PACKING SYSTEMS ... 2-1
2.0 Introduction 2-1
2.1 Types of Pump Packing System 2-1
2.2 History of Waste Packing 2-2
2.3 Application of Monolithic Pump Packing
Systems in Australian Underground
Coal Mines 2-7
2.4 Properties of Pump Packing Materials 2-20
2.4.1 Thyssen 2-22
2.4.2 Warbret 2-23
2.4.3 Anhydrite 2-24
2.4.4 Aquapak 2-25
2.4.5 Tekpak 2-26
2.4.6 Flashpak 2-27
2.4.7 Tailings pak 2-28
2.4.8 Monier 'Big Bag' 2-29
2.5 S urvey of the Types of Packing Materials Used
in the Southern Coalfields 2-30
2.6 Summary 2-33

(xi)
CHAPTER PAGE
3 THEORETICAL CONSIDERATIONS 3-1
3.0 Introduction 3-1
3.1 Principles of Pump Packing 3-1
3.1.1 Purpose of pump packing 3-1
3.1.2 Detached block theory 3-2
3.1.3 Roof beam tilt theory 3-4
3.1.4 Practical requirements for
the use of pump packing 3-5
3.1.5 Longwall strata behaviour and
the generation of pack load 3-5
3.1.6 Basic requirements 3-7
3.1.6.1 Short term support
requirements 3-7
3.1.6.2 Long term support
requirements 3-8
3.2 Suitability of Pump Packing under Australian
Conditions with Special Reference to
the Bulli Seam 3-10
3.3 Development of C C W R Material for
Strata Control 3-12
3.3.1 Design of C C W R material 3-12
3.3.2 Correlation of the strength
and the curing time 3-12
3.3.3 Optimum design of C C W R material.... 3-18
3.4 Application of the Experimental Design
with Mixtures 3-23
3.5 Development of a N e w Yield Function for
C C W R Material 3-27
3.5.1 General form of the yield function 3-27
3.5.2 Determination of parameters in the
yield function 3-28

(xii)
CHAPTER PAGE
3.5.3 The procedure for the computation
of parameters A, B and C 3-30
4 EXPERIMENTAL INVESTIGATIONS 4-1
4.0 Introduction 4-1
4.1 Material Used in the Experiments 4-2
4.1.1 Sampling and collection of C W R 4-2
4.1.2 Processing of C W R 4-4
4.1.3 Grain size analysis of C W R using
mechanical method 4-5
4.1.4 X-ray diffraction analysis 4-6
4.1.5 Ordinary Portland cement 4-7
4.1.6 Calcium chloride 4-9
4.2 Outline of the Experimental Programme 4-10
4.3 Experimental Equipment 4-14
4.3.1 Strength testing system 4-14
4.3.2 Instron 8033 testing machine 4-15
4.3.3 Data acquisition system components .... 4-17
4.3.4 Device dependence of strain
measurements of C C W R
material specimens 4-21
4.3.5 Experimental apparatus for flow tests
of C W R 4-22
4.4 Experimental Procedures 4-23
4.4.1 Test specimens identification coding .... 4-23
4.4.2 Design and construction of sample
moulds 4-24
4.4.3 Sample preparation 4-24
4.4.4 Mixing of concrete 4-25

(xiii)
PAGE
4.4.4.1 Batch size 4-25
4.4.4.2 Mixer 4-25
4.4.4.3 Charging sequence 4-25
4.4.5 Pouring of C C W R material specimens.. 4-26
4.4.6 Curing of C C W R material specimens ... 4-28
4.4.7 Observations of the physical appearance
of various C C W R material mixes 4-29
4.4.8 C C W R test specimen bulk density
determination 4-29
4.4.9 Determination of the grain mass M s of
C C W R specimens 4-30
4.4.10 Method for measuring the physical
properties of C C W R specimens 4-31
4.4.11 Method for determining the sound (sonic)
velocity of C C W R specimens 4-31
4.4.12 Strength test procedures 4-33
4.4.12.1 Unconfined compressive
strength tests 4-33
4.4.12.2 Indirect tensile strength
tests 4-36
4.4.12.3 Triaxial strength tests 4-37
4.4.13 Experimental technique for flow tests
of CWR 4-38
4.4.14 Testing procedures for flow tests of
CWR 4-39
Mechanical Properties Evaluation of C C W R
Material 4-41
Effect of Water Content on the Mechanical
Properties of C C W R Material 4-41
A N e w Yield Function for C C W R Material 4-43
(xiv)
CHAPTER PAGE
4.8 Effect of Water Content on the Flow Properties
of CWR 4-43
4.9 Effect of Geometry on the Properties and
Behaviour of C C W R Material Models 4-44
5 EXPERIMENTAL RESULTS AND
DISCUSSION 5-1
5.0 Introduction 5-1
5.1 Effect of Crushing on the Grain Size Distribution
of Minus 1 0 m m C W R 5-1
5.1.1 Discussion and conclusions drawn
from sieve analyses 5-2
5.2 Results from X-ray Diffraction Analyses and
Discussion 5-5
5.3 Mechanical Properties Evaluation of C C W R
Material 5-9
5.3.1 Unconfined compressive strength
test results 5-10
5.3.2 Triaxial strength test results 5-15
5.3.3 Brazilian test results 5-37
5.3.4 Sonic velocity values measured during
curing 5-37
5.3.5 Moist weight values measured during
curing 5-42
5.3.6 Observations and analyses of C C W R
specimen behaviour 5-42
5.3.6.1 Physical properties of
C C W R specimens 5-42
5.3.6.2 Specimen failure modes ... 5-44
5.3.7 Discussion of results 5-44

(xv)
CHAPTER PAGE
5.3.7.1 Mechanical properties of
C C W R specimens 5-46
5.3.7.2 CCWRpack
characteristics in relation
to strata behaviour 5-48
5.4 Effect of Water Content on the Mechanical
Properties of C C W R Material 5-49
5.4.1 Effect of water content on the drying
shrinkage of C C W R material 5-54
5.5 A N e w Yield Function for C C W R Material 5-59
5.6 Effect of Water Content on the Flow Properties
of C W R 5-63
5.6.1 Slump test results 5-63
5.6.2 Flow test results 5-66
5.6.3 Discussion of flow test results 5-66
5.7 Effect of Geometry on the Properties and
Behaviour of C C W R Material Models 5-69
5.7.1 Effect of geometry on the strength of
C C W R material models 5-75
5.7.2 Effect of geometry on the axial
modulus of C C W R material models 5-76
5.7.3 Effect of geometry on the Poisson's
ratio of C C W R material models 5-77
5.7.4 Effect of geometry on the stiffness of
C C W R material models 5-77
5.7.5 Discussion of test results 5-78
6 ALTERNATIVE METHOD OF IMPROVING
GATEROAD STABILITY USING YIELD
PILLAR TECHNIQUE 6-1
6.0 Introduction 6-1

(xvi)
CHAPTER PAGE
6.1 Review of Past Work 6-2
6.1.1 Stress control methods 6-4
6.2 Theoretical Considerations of Stress Control
Design 6-5
6 i 3 Effect of Virgin Stress Fields on the Feasibility
Study of Yield Pillar Technique 6-8
6.3.1 Method of analysis 6-9
6.3.2 Computation of stresses in pillars 6-9
6.3.3 Determination of factor of safety 6-16
6.3.4 Scheme of analysis 6-16
6.4 Results and Discussion 6-18
6.5 Conclusions 6-22
7 CONCLUSIONS 7-1
BIBLIOGRAPHY Rl
APPENDIX I PROGRAM PRINTOUT All
APPENDIX II EXPERIMENTAL DATA AH-1
1. Sieve Analysis Results AH-1
2. Sonic Velocity Data AII2-1
3. Specimens Moist Weight Data AII3-1
4. Calculated Compressive Strength Test Results
and Specimen Experimental Data AII4-1
5. Post-Failure Modulus and Residual
Strength Results AU5-1
6. Plots of Sonic Velocity and Strength
Relationships of C C W R specimens AU6-1
7. Flow Test Results AH7-1

LIST OF FIGURES

(xvii)
LIST OF FIGURES
FIGURE TITLE PAGE
2.1 Use of Monier "Big Bag" chocks as Longwall gateroad
support at Appin Colliery 2-8
2.2 Wooden crib roadway support at South Bulli Colliery 2-10
2.3 Proposed pump pack support system 2-11
2.4 Typical single pass wide heading layout 2-12
2.5 Typical double pass wide heading layout 2-13
2.6 Centre roadway packwall 2-14
2.7 Monier 'Big Bag' supports 2-15
2.8 Side roadway packwall 2-15
2.9 Maingate packwall 2-16
2.10(a) Concept of single entry dividing wall - driveage layout 2-16
2.10(b) Concept of single entry dividing wall - partial extraction
by Longwall with single entry 2-17
2.11 Advancing Longwall Panel 2-17
2.12 Shortwall entry driveage system with pump packing 2-18
2.13 Shortwall extraction system with pump packing, no
development is required 2-19

(xviii)
LIST OF FIGURES
FIGURE TITLE PAGE
2.14 Kemcol Beaver with pump packing 2-19
2.15 Uniaxial compressive strength of cement based materials
and industry by products 2-22
2.16 Layout of wooden chock installations per 60m of
Longwall 6 gateroads at Tahmoor Colliery 2-32
3.1 "Big Bag" chocks at West Cliff Colliery 3-3
3.2 Detached block theory 3-3
3.3 Generalised view of roof tilt 3-4
3.4 Floor heave problem 3-9
3.5 Support failure leads to excessive roof to floor closures 3-10
3.6 Plots of the measured strength against curing time
for each mix 3-14
3.7 Comparison between calculated and measured strength 3-16
3.8 Plots of InS against lM for mixes 2 through 5 3-16
3.9 Plots of InS against 1/Vt for mixes 1, 7, 8, 11, 12 and 13 3-17
3.10 Plots of InS against lM for mixes 6, 9 and 10 3-17
3.11 Plots of InS against 1/Vt for mixes 14 through 17 3-18
(xix)
LIST OF FIGURES
FIGURE TITLE PAGE
3.12 Comparison between the measured strength and the
calculated (by eqns 13 and 14) strength 3-21
3.13 Final strength contour plots 3-22
3.14 Contour plots for 28 day strength 3-22
3.15 The dependence of the strength on R1 for different R2
(28 day strength) 3-24
3.16 The dependence of the strength on R1 for different R2
(Final strength) 3-24
3.17 The dependence of the strength on R2 for different Rl
(28 day strength) 3-25
3.18 The dependence of the strength on R2 for different R1
(Final strength) 3-25
3.19 Flow chart for logarithmic yield function program 3-31
4.1 Model of West Cliff Coal Washery 4-3
4.2 Collection of CWR sample 4-3
4.3 Typical grain shapes of West Cliff CWR 4-5
4.4 Grain shapes of West Cliff CWR 4-6
4.5 Grain size distribution curves of the processed CWR 4-7

(xx)
LIST OF FIGURES
FIGURE TITLE PAGE
4.6 The servo controlled stiff testing machine 4-15
4.7 A closed loop servo block diagram 4-16
4.8 The interface of LVDT and HP data acquisition and
control system 4-17
4.9 Flow chart for the LVDT program 4-19b
4.10 The interface of strain gauges and HP data acquisition
and control system 4-21
4.11 Schematic of the flow-tube experimental apparatus 4-23
4.12 CCWR material specimen moulds 4-24
4.13 'Bennett' Mixer 4-25
4.14 Slump test 4-27
4.15 'ICAL Syntron Packer, Model VP65B* 4-28
4.16 Simplified 'Pundit' system diagram 4-32
4.17 'Pundit' sonic velocity apparatus 4-33
4.18 CCWR material specimen mounted in the LVDT strain
measurement rig during the unconfined compressive
strength test 4-35
4.19 LVDT strain measurement rig 4-35

(xxi)
LIST OF FIGURES
FIGURE TITLE PAGE
4-20 Indirect tensile strength (Brazilian) test rig 4-37
4-21 Triaxial cell applied to the LVDT strain rig 4-38
5.1 The grain size distribution curve of CWR before processing ... 5-4
5.2 The grain size distribution curve of CWR after processing 5-5
5.3 Plots of the measured strength against curing time for
mixes 1 to 5 5-13
5.4 Stress-curing time curves of various mixes of CCWR
specimens for up to 5 hours curing time 5-13
5.5 Stress-curing time curves of mixes 2 to 5 CCWR
specimens for up to 24 hours curing time 5-14
5.6 Triaxial strength test results for CCWR specimens at
different confining pressure (15.6% cement, mix 1) 5-22
5.7 Triaxial strength test results for CCWR specimens at
different confining pressure (12.5% cement, mix 2) 5-22
5.8 Triaxial strength test results for CCWR specimens at
different confining pressure (10.0% cement, mix 3) 5-23
5.9 Triaxial strength test results for CCWR specimens at
different confining pressure (7.5% cement, mix 4) 5-23
5.10 Triaxial strength test results for CCWR specimens at
different confining pressure (5.0% cement, mix 5) 5-24

(xxii)
LIST OF FIGURES
FIGURE TITLE PAGE
5.11 Peak strength Mohr's envelopes for 15.0%C-21.0%W mix.... 5-25
5.12 Peak strength Mohr's envelopes for 15.0%C-14.7%W mix.... 5-26
5.13 Peak strength Mohr's envelopes for 12.5%C-19.1%W mix.... 5-27
5.14 Peak strength Mohr's envelopes for 12.5%C-16.5%W mix.... 5-28
5.15 Peak strength Mohr's envelopes for 12.5%C-13.0%W mix.... 5-29
5.16 Peak strength Mohr's envelopes for 10.0%C-19.1%W mix.... 5-30
5.17 Peak strength Mohr's envelopes for 10.0%C-16.5%W mix.... 5-31
5.18 Peak strength Mohr's envelopes for 7.5%C-19.1%W mix..... 5-32
5.19 Peak strength Mohr's envelopes for 7.5%C-16.5%W mix.... 5-33
5.20 Peak strength Mohr's envelopes for 7.5%C-12.6%W mix.... 5-34
5.21 Peak strength Mohr's envelopes for 5.0%C-13.0%W mix.... 5-35
5.22 Peak strength envelope of CCWR specimens for
mixes 1 to 5 5-36
5.23 Peak strength envelope of CCWR specimens for
mixes 7, 8, 10, 11, 12 and 13 5-36
5.24 Small axial cracks appeared just before the maximum
compressive strength was reached - indicating
tensile cleavage failure 5-45

(xxiii)
LIST OF FIGURES
FIGURE TITLE PAGE
5.25 A typical hour glass failure shape 5-45
5.26 Shear cone with splitting above 5-46
5.27 Effect of nominal water content on the strength of CCWR
specimens at different curing time (15% OPC) 5-52
5.28 Effect of nominal water content on the strength of CCWR
specimens at different curing time (12.5% OPC) 5-52
5.29 Effect of nominal water content on the strength of CCWR
specimens at different curing time (10% OPC) 5-53
5.30 Effect of nominal water content on the strength of CCWR
specimens at different curing time (7.5% OPC) 5-53
5.31 The effect of water content on the drying shrinkage of
C C W R specimens 5-59
5.32 Measured and predicted triaxial strengths of CCWR mix 1 5-62
5.33 Measured and predicted triaxial strengths of CCWR mix 2 5-62
5.34 Measured and predicted triaxial strengths of CCWR mix 4 5-63
5.35 Effect of water content on the slump values of CWR 5-65
5.36 A comparison of the flowability of CWR for all mixes
at different slopes 5-68
5.37 Effect of water content on the flowability of CWR 5-69

(xxiv)
LIST OF FIGURES
FIGURE TITLE PAGE
5.38 Effect of geometry on the unconfined compressive strength
of C C W R material models 5-75
5.39 Effect of geometry on the axial modulus of
C C W R material models 5-76
5.40 Effect of geometry on the Poisson's ratio of CCWR
material models 5-77
5.41 Effect of geometry on the stiffness of CCWR
material models 5-78
5.42 CCWR models with distinct shear plane at complete
failures (diameter=55.5mm) 5-80
5.43 CCWR models at complete failures (diameter=75.5mm) 5-81
5.44 CCWR models at complete failures (diameter=102.8mm) 5-81
5.45 CCWR models at complete failures (diameter=149.5mm) 5-82
5.46 CCWR models at complete failures (diameter=206mm) 5-82
(xxv)
LIST OF FIGURES
FIGURE TITLE PAGE
5.47 CCWR models at complete failures (diameter=242mm) 5-83
5.48 CCWR models at complete failures (diameter=314.5mm) 5-83
5.49 Various CCWR models at complete failures (Elevation A) 5-84
5.50 Various CCWR models at complete failures Q3nd elevation B).. 5-84
5.51 Various CCWR models at complete failures (End elevation C).. 5-85
6.1 Principle of stress control method 6-6
6.2 Formation of Pillar A 6-10
6.3 Flow chart of the iterative scheme 6-15
6.4 Finite element mesh for yield pillar scheme 6-17
6.5 Principal stress field in the yield pillar scheme 6-19
6.6 Principal stress field in the conventional pillar scheme 6-19
6.7 Distribution of stress along a cross-section of pillar 6-20
6.8 Safety factor versus k (a0h/ oov) 6-21

LIST OF TABLES

(xxvi)
LIST OF TABLES
TABLE TITLE PAGE
2.1 Survey of the distribution of monolithic pump packing
systems in the United Kingdom 2-3
2.2 Cost and pipeline pumping life of tailings pak 2 (UK) 2-20
2.3 Cost and pipeline pumping life of packing materials for
various pump pack systems 2-21
2.4 Thyssen material properties 2-23
2.5 Warbret material properties 2-24
2.6 Anhydrite material properties 2-24
2.7 Aquapak material properties 2-25
2.8 Tekpak material properties 2-26
2.9 Flashpak material properties 2-27
2.10 Tailings pak material properties 2-28
2.11 CCWR material properties 2-29
2.12 Australian Monier "Big Bag" material properties 2-30
2.13 Types of packing materials used in the Southern Coalfields ... 2-31
3.1 (a) Measured unconfined compressive strength of CCWR
materials at different curing times 3-13a

(xxvii)
LIST OF TABLES
TABLE TITLE PAGE
3.1 (b) Measured unconfined compressive strength of CCWR
materials at different curing times 3-13b
4.1 Physical properties of oil samples 4-4
4.2 Chemical and mineralogical compositions of Type A
Portland cement 4-8
4.3 Summary of tests 4-12
4.4(a) Batching and pouring details of various mixes of
C C W R materials 4-13a
4.4(b) Batching and pouring details of various mixes of
C C W R materials 4-13b
4.5 Descriptions of the physical appearance of various
C C W R material mixes 4-30
5.1 The grain size distribution of CWR before processing 5-3
5.2 The grain size distribution of the processed CWR 5-3
5.3 Chemical compositions of West Cliff CWR 5-7
5.4 Average major geomechanical compounds in
fine discards (UK) 5-8
5.5 Chemical composition of coal preparation wastes for
four main coalfields of the Soviet Union 5-9

(xxviii)
LIST OF TABLES
TABLE TITLE PAGE
5.6(a) Summary of results of compressive strength tests 5-11
5.6(b) Summary of results of compressive strength tests 5-12
5.7 Results of triaxial tests for CCWR material specimens
(mixes 1 through 3) 5-16
5.8 Results of triaxial tests for CCWR material specimens
(mixes 4 and 5) 5-17
5.9 Results of triaxial tests for CCWR material specimens
(mixes 7 through 8) 5-18
5.10 Results of triaxial tests for CCWR material specimens
(mixes 10 and 11) 5-19
5.11 Results of triaxial tests for CCWR material specimens
(mixes 12 and 13) 5-20
5.12 Summary of triaxial test results for CCWR specimens 5-21
5.13 Results of Brazilian tests for CCWR material specimens
(mixes 3 through 5) 5-38
5.14 Results of Brazilian tests for CCWR material specimens
(mixes 7 through 8) 5-39
5.15 Results of Brazilian tests for CCWR material specimens
(mixes 10 through 11) 5-40
5.16 Results of Brazilian tests for CCWR material specimens
(mixes 12 through 13) 5-41

(xxix)
LIST OF TABLES
TABLE TITLE PAGE
5.17 Physical properties of CCWR specimens for different mixes... 5-43
5.18 Effect of water content on the unconfined compressive
strength of C C W R materials at different curing times 5-50
5.19 Effect of water content on the unconfined compressive
strength of C C W R materials at different curing times 5-51
5.20 Drying shrinkage values for 15.0%C-12.0%W specimens 5-55
5.21 Drying shrinkage values for 15.0%C-21.0%W specimens 5-55
5.22 Drying shrinkage values for 12.5%C-16.5%W specimens 5-56
5.23 Drying shrinkage values for 12.5%C-19.1%W specimens 5-56
5.24 Drying shrinkage values for 10.0%C-12.0%W specimens 5-57
5.25 Drying shrinkage values for 10.0%C-19.1%W specimens 5-57
5.26 Drying shrinkage values for 7.5%C-16.5%W specimens 5-58
5.27 Drying shrinkage values for 7.5%C-19.0%W specimens 5-58
5.28 Comparisons of predicted and measured values for
various C C W R materials 5-60
5.29 Slump test results of CWR 5-64

(xxx)
LIST OF TABLES
TABLE TITLE PAGE
5.30 Results of compressive strength testing for series VI
experiments (Effect of geometry on the strength and
elasticity properties of C C W R material models
with diameters of 55.5mm and 75.5mm) 5-70
5.31 Results of compressive strength testing for series VI
experiments (Effect of geometry on the strength and
elasticity properties of C C W R material models
with diameters of 102.8mm and 149.5mm) 5-71
5.32 Results of compressive strength testing for series VI
experiments (Effect of geometry on the strength and
elasticity properties of C C W R material models
with diameters of 2 0 6 m m and 2 4 2 m m ) 5-72
5.33 Results of compressive strength testing for series VI
experiments (Effect of geometry on the strength and
elasticity properties of C C W R material model
with a diameter of 314.5mm) 5-73
5.34 Summary of results of compressive strength testing for
series VI experiments (Effect of geometry on the strength
and elasticity properties of C C W R material models) 5-74
6.1 Virgin stress fields 6-17
6.2 Properties of rocks 6-18

(xxxi)
LIST OF ABBREVIATIONS
ACIRL Australian Coal Industrial Research Laboratories Ltd.
C C W R Cement and Coal Washery Refuse
C W R Coal Washery Refuse
KCC Kembla Coal and Coke Pty. Ltd.
M G Main Gate
MPPS Monolithic Pump Packing System
MRDE Mining Research and Development Establishment
NCB National Coal Board
NERDDC National Energy Research, Development and Demonstration Council
N S W New South Wales
OPC Ordinary Portland Cement
PFA Pulverised Fly Ash
R O M Run of Mine
TEA Triethanolamine
TG Tail Gate
U K The United Kingdom
USA The United States of America

(xxxii)
NOTATION
A and B unknown positive parameters (for Section 3.3);
A, B, C parameters to be considered by experiments (for Section 3.5);
[B] the derivative matrix of [N];
P the slope of stress - diametric strain curve of C C W R model;
C cohesive strength;
[D], [Dep] the elasticity matrix and elastic-plastic matrix respectively;
8u, 8e the virtual displacements and the corresponding strain in domain Q
respectively;
{Aa} the vector of nodal displacement increments;
{Ao0} the initial stress increment;
Aby the increment of body force;
[AF0] the iterative term of the nodal force;
[AFV] the nodal force due to the increment of the body force;
[AFT] the boundary traction;
Ap the increment of boundary traction;
A a A the increment of stress in the pillar due to the excavation of
Roadways 1 and 2;
Eps denotes the allowable tolerance;
f(t) a monotone increasing function of t;
<|) angle of internal friction;
T boundary of the domain Q;
T e boundary element;
[K] the stiffness matrix;
k ratio of ooh/oov

(xxxiii)
k, m , n unknown parameters;
n a constant for any mix formulation;
N number of triaxial tests;
[N] the matrix of specified shape functions;
Q domain;
Q e elements connected at the nodes;
Q the error of prediction;
Rl the ratio of Xi/(X3 + X4);
R 2 the ratio of X3/X4;
S unconfined compressive strength of C C W R specimens;
SF the safety factor;
S28 unconfined compressive strength of C C W R specimens at 28 day
curing time;
Sfmai final unconfined compressive strength of C C W R specimens;
o A the redistributed stress in the pillar;
o A 0 the virgin stress determined by in-situ stress measurement;
a o h horizontal virgin stress;
a o v vertical virgin stress;
Gc unconfined compressive strength;
Oi major principal stress;
CT3 minor principal stress;
CTii (o3i) predicted major principal stress under minor principal stress rj3i
condition;

(xxxiv)
experimental major principal stress under minor principal stress o3i
condition;
minor principal stress;
the strength of the rock, which is the function of o3;
curing time of CCWR specimens;
mass percentage of water;
mass percentage of calcium chloride accelerator;
mass percentage of ordinary Portland cement;
mass percentage of coal washery refuse;
the proportion of the i'th component in the mixture.

CHAPTER ONE
INTRODUCTION

Chapter 1 Introduction 1 - 1
CHAPTER 1
INTRODUCTION
The main theme of this thesis is the development of a pump packing
material, which utilizes coal washery refuse ( C W R ) , for strata control in Australian
underground coal mining operations. The thesis is also intended to provide an
introduction to the current state of the art design principles, applications and some
on-going research activities of p u m p packing for both mine operators and
researchers interested in pump packing technology, as well as providing to others a
general understanding of how cement and coal washery refuse ( C C W R ) material
can be used for strata control in coal mines.
An attempt is made to critically assess the present state of knowledge in the
development and utilization of C W R as a pump packing material in Australian
underground coal mines, and understand the importance of the research in relation
to future field application. It is anticipated that the contribution made with regard to
the treatment and utilization of wastes from the coal washery will play a major role
in future mine planning as a result of the increasing importance of environmental
issues; such as the disposal of C W R and surface subsidence.
In New South Wales, Australia, the raw coal production in the year 1987-
1988 alone was 76.3 million tonnes of which 12.3 million tonnes was extraneous
dirt. According to N S W Government (1983), it is estimated that by the year 2000,
the existing and planned coal mining activities could generate some 104 million
tonnes of C W R in the Southern Coalfields alone, while the existing and planned
surface emplacements have a capacity for only 30 million tonnes of C W R . There is

Chapter 1 Introduction 1 - 2
a need for a full study of the problems associated with the generation, utilization and
disposal of CWR in this state. The disposal of CWR in particular was considered to
be a significant economic and environmental issue which needed to be resolved as a
matter of urgency in the Illawarra region. It is anticipated that similar problems may
be faced in other coalfields (NSW Government, 1983).
At present, there is a growing interest in the utilization of wastes from the
coal washery, both as cementing medium and aggregate, for the construction of
monolithic pump pack (McCarthy and Robinson, 1981, Richmond et al, 1985,
Thomas, 1986, Atkins et al, 1984, 1986, 1987, Hii and Aziz, 1986a, 1986b,
1987a, 1987b, 1987c, 1987d, 1989, Zadeh et al, 1987, Hii and Yu, 1989). In
recent years the potential use of CWR has also been investigated.
Apart from the expensive commercial materials for pump packing, the
utilization of CWR would have a two-fold advantage in costs reduction. There
would be a reduction in both the dirt disposal costs and commercial materials costs.
Much work however needs to be done in this field since many problems are being
experienced in obtaining a consistent mix owing to the variation in products from
the coal washery.
In order to substitute the expensive commercial materials for pump
packing, it is necessary to improve its geotechnical characteristics. A comprehensive
laboratory testing programme was therefore devised to investigate the geotechnical
properties of CWR as a function of various cement mixes over a 365 day period.
The research programme aims at producing the most cost effective and economical
monolithic pump packing system for strata control and increased recovery of coal.
The investigation also aims: to optimize particular mechanical properties of
CCWR materials, to develop a cheaper binding material, to increase the initial

Chapter I Introduction 1 - 3
strength of the mixture, and to develop a material which is pumpable but can still
give sufficient strength for use as a pack material in Australian underground coal
mining operations. The study also investigates the effect of water content on the
mechanical properties and behaviour of CCWR material containing calcium chloride
admixture.
The effect of water content on the flow properties of CWR is also
examined. The objective of this study was to determine the optimum water content
for flowability of CWR. The test results from consistency measurements and flow
tests are used to characterize the flow properties of minus 10mm CWR with
different nominal water contents.
Cost-effective analysis of CCWR pump packing material as compared to
other commercial pump packing materials has been carried out.
A method is proposed for use in the design of CCWR material mixes. It
has been demonstrated that the relationship between the strength and curing time of
a mix can be accurately described by a simple equation. Based on the results of
laboratory strength tests, empirical equations were formulated to correlate the
strength of a mix to the composition of the mix through regression analysis. The
procedure for determining the parameters contained in the proposed empirical
equations is presented in Chapter 3 (Section 3.3). It is substantiated that an increase
in the strength of CCWR materials may be acquired either by decreasing the water
content or increasing the quantity of OPC utilized in the mixtures.
An empirical criterion is also proposed for predicting the strength and yield
characteristics of CCWR material. The parameters contained in the yield function
have been determined from routine material strength test results. A procedure for the
determination of the parameters is presented in Sections 3.5.1 and 3.5.2 (Chapter

Chapter 1 Introduction 1 - 4
3). The logarithmic yield function program, written in F O R T R A N , has been
developed to facilitate data processing of test results and a listing of the fundamental
FORTRAN code is given. The study has indicated that the proposed logarithmic
yield function can predict the strength and yield characteristics of CCWR material in
a satisfactory manner.
Research is required to understand the tectonic forces which prevail in
Australian mining conditions. The research work in turn could help in selecting the
most effective pump packing systems. The following basic works on strata
movement that have been conducted are:
(i) the understanding of the nature of load/deformation
characteristics (ground reaction curves) of the areas where
pump packing system is intended for support;
(ii) the evaluation of the strength and deformation characteristics
of various pump packing materials;
(iii) the selection of a suitable pump packing material based on the
strength and cost; and
(iv) an examination of the pump packing material characteristics in
relation to strata behaviour.
Further work investigated the influence of specimen geometry and end
constraint on the strength and elasticity of CCWR material. The feasibility of the
yield pillar technique under different virgin stress field conditions in underground
mining operations is also investigated.

CHAPTER TWO
MONOLITHIC PUMP PACKING SYSTEM

Chapter 2. Monolithic Pump Packing Systems 2 - 1
CHAPTER 2
MONOLITHIC PUMP PACKING SYSTEMS
2.0 INTRODUCTION
This Chapter presents a literature review of monolithic pump packing
systems with particular reference to their applications in the United Kingdom,
Germany and Australia. A review of the current state of the art design principles and
some on-going research activities of monolithic pump packing systems is also
included. Monolithic pump packing technologies which include the development of
pack materials, pack design principles, manpower and cost for pack installations,
pack material handlings and pack constructions have been reported previously
(McCarthy, 1974, Farmer and Robertson, 1975, Hodgkinson, 1977, Whittaker and
Woodrow, 1977, Lewis and Stace, 1981, Richmond, 1981, Smart et al, 1982,
Freeman, 1982, Buddery, 1984, Clark and Newson, 1985, Batten, 1985,
Richmond et al, 1985, Hii and Aziz, 1986). Attention is focused on the history and
technology of waste packing and the properties of pump packing materials.
2.1 TYPES OF PUMP PACKING SYSTEM
Common types of pump packing systems which have been used in coal
mines include the following:
(i) Anhydrite system (first used in 1964);
(ii) Thyssen system (first used in 1973);
(iii) Warbret system (first used in 1976);

Chapter 2. Monolithic Pump Packing Systems 2 - 2
(iv) Monolithic pump packing systems using:
(a) Aquapak;
(b) Tekpak;
(c) Flashpak; and
(d) Mine tailings.
Clark and Newson (1985) presented a statistics on the current distribution
of monolithic pump packing systems in Britain (Table 2.1). It is noted that the
number of Tekpak installations was significant. This gave a good indication of the
popularity and the unique properties of Tekpak installations.
2.2 HISTORY OF WASTE PACKING
Support of mine working in the form of waste packing underground has
been practised as long as some form of pillar extraction has been adopted, more
specifically in Longwall mining methods. Waste packing was initially confined to
hand packing in the form of building walls constructed from roof stone and stone
bands in the waste area. Hand packing was normally confined to strip packing,
because of the lack of material for solid stowing.
Total stowing in the form of hydraulic placing of stowage material in the
waste in mines was first reported about 1880. Although of unknown origin, the
system was practised in both U.S.A. and Silesia in the year mentioned above. It
was some 20 years later that hydraulic stowing was first used in coal mines in the
U K (Harlech, 1925).

Chapter 2. Monolithic Pump Packing Systems 2 - 3
Table 2.1 Survey of the distribution of monolithic pump packing systems
in the United Kingdom
(after Clark and Newson, 1985)
Area Installations Aquapak Tekpak Thyssen Others
M/G T/G M/G T/G M/G T/G
Scottish
North East
North York
Doncaster
Barnsley
South Yorks
North Notts
South Notts
North Derby
South Mids
Western
South Wales
11
Nil
Nil
2
Nil
3
Nil
9
1
6
22
7
4
4
2
4
1
11 10
2
2
4
2
2
3
3
3
Total 60 23 30 26
(Face Ends)
Other installations are: Doncaster Area -Synthetic Anhydrite
North Derby Area -Warbret
Western Area -Flash pack
Western Area -GP7
(Pack Reinforcement)
-1 Face End
- 3 Face Ends
-1 Face End
- 2 Face Ends
The early fifties saw the emergence of mechanized dry pack "stowing" for
roadside packing, with the main objective being strata control in roadways for
advancing Longwall faces. This was soon followed by a new concept of roadway
packing using monolithic packs constructed using some form of hydraulically

Chapter 2. Monolithic Pump Packing Systems 2 - 4
placed material. Anhydrite packing was the first type of monolithic packing system
to emerge as a new method of waste-side packing. The first trial of the Anhydrite
packing system was carried out at Holland Colliery, West Germany in 1964
(Heinrich, 1971, Recklinghausen et al, 1972). Following an initial success, the
Anhydrite packing system gained wide acceptance in the Saar and Ruhr Coalfields.
The advantages claimed were (Buddery et al, 1982):
(i) improved gate road stability;
(ii) improved face end ventilation, by preventing short
circuiting of the airflow across the goaf;
(iii) reducing the risk of spontaneous combustion in the
goaf area.
Interest in the UK began in 1973, when a pump packing system was
installed in Brynliw Colliery, South Wales. A detailed description of Thyssen
system has been published previously (Hodgkinson, 1977). This system was
developed by Thyssen (UK), and utilized up to 5 0 % , -19mm run of mine ( R O M )
fines, the rest was made of a bentonite component (flowmat), and a cementing
agent. However, it was soon realised that the system did not live up to expectations
when applied to seams with high clay impurities. The swelling factor of clay present
in the R O M material reduced the "pumpability" of the coal slurry to such a degree
that the system required to be discontinued on some occasions. Furthermore, since
coal constituted nearly half of the pack material, the system suffered in some cases
from the effects of spontaneous combustion which could not be eliminated.
In 1976, the modified Warbret system was developed. According to
Buddery and Ashika (1982), the likelihood of pipe blockages due to bleeding and
segregation is diminished by pre-mixing the bentonite suspension so that gelling is
complete before it is added to the aggregate, whereas, in the Thyssen system gelling

Chapter 2. Monolithic Pump Packing Systems 2 - 5
of the suspension takes place in the pipeline and hence is inhibited by the aggregate
causing blockages.
The deficiencies in the Thyssen and Warbret systems prompted British
Coal - formerly the National Coal Board (NCB) - to experiment with new products.
This resulted in the development and introduction of the Aquapak system in 1979
(Nixon et al, 1982). The system, which contained a very high proportion of water
was first tried at H e m Heath Colliery. The objective being to alleviate the
disadvantages encountered by the coal slurry systems. The large quantity of water
in the Aquapak material required the use of cement with a high affinity for water.
Therefore, Monopak, which is basically a blend of three cementitious materials,
was subsequently developed to suit the requirement. This was further helped by the
incorporation of a thixotropic medium such as bentonite clay which kept the
Monopak in suspension until it had set.
In Great Britain, by 1980, packing by mechanized methods was employed
at some 2 0 % of advancing face ends (Stokes and Kitching, 1980). About 5 5 % of
the systems used dirt collected insitu, 2 1 % used R O M material only and 2 4 % used
R O M material with a cement additive.
In 1981, Australian Coal Industry Research Laboratories (ACIRL)
investigated the use of monolithic pump packing as a means of underground roof
support (Richmond, 1981). Also in 1981, Monier Resources Australia established
their mining services section. They now have a market for "Big Bag" chocks
which, when filled with their "Minegrout H" mix, provide load bearing capacities of
up to 500 tonnes.
In 1983, there were 85 monolithic pump packed face end systems used in
Britain, with monolithic pump packing system (MPPS) still providing the largest

Chapter 2. Monolithic Pump Packing Systems 2 - 6
single group and constituted some 1 0 % of all advancing Longwall face end system
(Clark and Newson, 1985). The material cost in 1983 was approximately $85 per
cubic meter. The total annual expenditure including the capital cost and material
transportation cost was over $15.4 million for 67,800 tonnes of material.
Continued research into the development of pump packing material led to
the development of Tekpak. As with Aquapak, two materials are separately pumped
in solution and then mixed in the packing bag to form a quick setting monolithic
pack. The materials are Tekcem, which is based on high alumina cement and
Tekbent which is a mixture of Bentonite and accelerators. The advantages claimed
include: less use of solid materials in the pack construction in comparison to
Aquapak (nearly 7 3 % by weight of Aquapak); longer pumping life of the cement;
hence less risk of pipe blockages; less risk of cement burns as Tekcem is less
aggressive than Aquacem; and a lower cost of cement materials used.
Further studies by the Mining Research and Development Establishment
( M R D E ) of the British Coal, resulted in the development of a low cost product
called Flashpak which could be used to form a satisfactory monolithic pack. The
principle of the system consisted of pumping two grouts which when mixed in the
packhole, formed a monolithic pack. The attractive property of Flashpak material is
that when the two grouts are completely mixed together they form a gel, and hence
Flashpak does not require a waterproof containing bag.
Finally, development work has already started on a new phase, that of
using mine tailings and fly ash both of which are waste products. As well as
improving gate road strata control, this type of packing has the added advantage of
disposing of undesirable materials in a cost-effective manner (Atkins et al, 1984,
Atkins et al, 1986).

Chapter 2. Monolithic Pump Packing Systems 2-7
National Energy Research, Development and Demonstration Council
(NERDDC) has major on-going research and field investigation into the evaluation
of cementitious support for increased recovery from coal mines (Richmond et al,
1985). NERDDC, in association with ACIRL, Monier Resources Ltd., The
University of Wollongong and Kembla Coal and Coke (KCQ Pty. Ltd. initiated a
research programme aimed at producing the most effective and economical method
of monolithic pump packing system for strata control and increased recovery of
coal.
2.3 APPLICATION OF MONOLITHIC PUMP PACKING
SYSTEMS IN AUSTRALIAN UNDERGROUND COAL
MINES
The Australian pump packing experience has been reported previously
(Richmond, 1981, Todd, 1983, Schaller and Savidis, 1983, Richmond et al, 1985,
Batten, 1985, Thomas, 1985, Hii and Aziz, 1986). It is evident that to date no
Australian underground coal mine has used a bulk monolithic pump packing system
for roadway support. The fact that all Australian underground Longwalls are
retreating and not advancing (advancing Longwalls are used in UK) means that bulk
monolithic pump packing has not been needed to support roadways behind the face
on the goaf edge.
However, monolithic pump packing systems in the form of Monier "Big
Bag" chocks have been used in an attempt to keep a goaf side return airway partially
open back to the last cut through (Todd, 1983). Monier "Big Bag" chocks (lm
diameter) were set at 4m centres in the roadway following the passage of the face as
illustrated in Figure 2.1. The trial was a failure because before the next open cut
through was reached the chocks had crushed out and subsequently the airway was
lost to the goaf. The internal partitioning of the bag was recognised as an inherent

Chapter 2. Monolithic Pump Packing Systems 2 - 8
weakness, especially when controlling vertical as well as horizontal forces at the
goaf edge. It was found that eight sections had induced cleavage planes into the
bags and this was rectified in future Monier "Big Bag" chocks. It was realised that
the failure of the grout to reach sufficient strength in the short time allowed and the
wide spacings of single bags along the goaf edge indicated that too much had been
expected of the system.
PROPOSED INSEAM D R A I N A G E
Figure 2.1 Use of Monier "Big Bag" chocks as Longwall
gateroad support at Appin Colliery.
(after Todd, 1983)
Chapter 2. Monolithic Pump Packing Systems 2 - 9
The use of Monier "Big Bag" chocks has introduced several Australian
underground coal mines such as South Bulli, West Cliff, Darke Forest and others to
the material and technology used in monolithic pump packing systems. The
properties of Monier "Big Bag" material will be reported in Section 2.4.8. A general
review on the properties, the load/deformation behaviour, the availability and the
cost of different Monier Minegrouts has been published previously (Batten, 1985).
In Australia, interest is now being shown in monolithic pump packing
system utilizing wastes from power plants (flyash) and coal washeries (CWR). A
pneumatic bulk handling system has been installed at West Cliff Colliery with the
aim of constructing continuous lengths of monolithic pump pack support (using
flyash and cement mixture) in Longwall gateroads. However, this has not been
successful in terms of cost-effectiveness. The author and other researchers have
been committed to the evaluation of CWR for disposal and strata control in
underground coal mines. Results obtained thus far have been very encouraging.
Due to the need to continually maximize productivity levels in the
Australian underground coal mining industry, several alternative Longwall panel
layouts utilizing pump packing technology have been proposed by various
researchers (Richmond, 1981, Hebblewhite, 1983, Richmond et al, 1985, Marshall
and Lama, 1986, Lama, 1988). Some have the potential for increased development
rate and/or improved recovery.
Richmond (1981) conducted a laboratory simulation of the insitu load-
deformation characteristics of a wooden crib (chock) and compared the support
capabilities of the wooden crib support system and the pump pack support system.
Figure 2.2 illustrates the layout of the wooden crib support system for the tailgate of
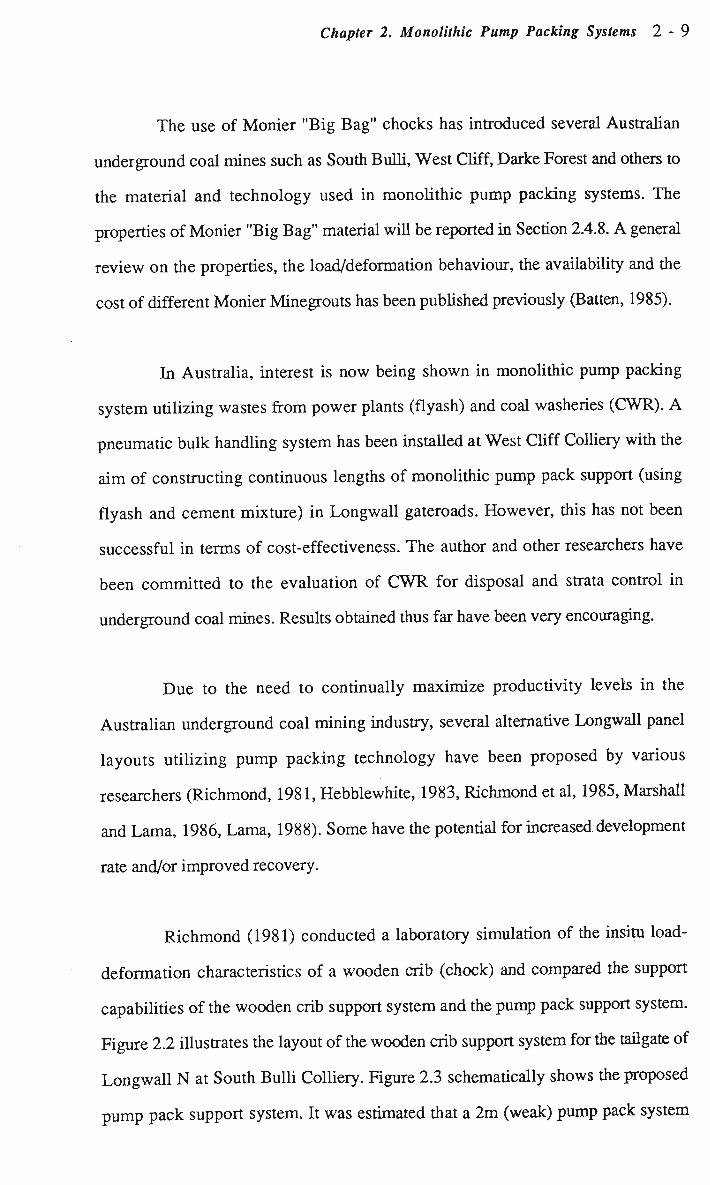
Longwall N at South Bulli Colliery. Figure 2.3 schematically shows the proposed
pump pack support system. It was estimated that a 2m (weak) pump pack system

Chapter 2. Monolithic Pump Packing Systems 2 - 1 0
would offer approximately 20 times the maximum support load density provided by
the wooden crib system. Richmond (1981) reported that in addition to the
significantly higher support capacity of the pump pack system it would also offer a
stiffer support.
Effective area of support 4.2m x 5.7m = 23.9m2
Figure 2.2 Wooden crib roadway support at South Bulli Colliery.
(Richmond, 1981)
Chapter 2. Monolithic Pump Packing Systems 2 - 1 1
2m (or 3m)
Figure 2.3 Proposed pump pack support system.
(after Richmond, 1981)
Hebblewhite (1983) proposed an advancing 12m wide single entry system
with a 3m central monolithic pack as shown in Figure 2.4.
Advantages claimed of the proposed system over a narrow single entry are:
(i) the two separate headings can act as an intake and return
airway; and
(ii) the pack can be broken at regular intervals for emergency
access.

Chapter 2. Monolithic Pump Packing Systems 2 - 12
ADVANCING WIDE FACE
t 12m
| -3 m->|
4.5m * •
4.5m 4 •
MO N O L I T H I C
•PACK SUPPORT
Figure 2.4 Typical single pass wide heading layout.
(after Hebblewhite, 1983)
Limitations of the proposed system are:
(i) economic considerations, the costs of installing pump pack
supports have to be compared with savings generated by
the system;
(ii) the NSW Coal Mines Regulations Act stipulates the
maximum width of a heading as 5.5m therefore exemption
would be needed;
(iii) technological problems in obtaining the most appropriate
mining equipment;
(iv) inability of the support system to provide initial control of
the roof strata in bad conditions;

Chapter 2. Monolithic Pump Packing Systems 2 - 1 3
(v) deterioration in roadways after the first Longwall face
passes due to high pack loadings on the goaf edge; and
(vi) the pack would need to be kept quite close to the face and
have early load bearing characteristics, and this could cause
face congestion and subsequently a loss in production.
A variation on this system is the mining of two roadways, firstly a 7.5m
wide roadway which has a 3 m wide pack against one rib and secondly a 'second
pass' face on the other side of the pack wall as illustrated in Figure 2.5. The
obvious advantage of this method over the previous one is that it would not require
as much shuttering or the need to keep the pack as close behind the face for effective
initial support of the roof.
1ST PASS F A C E
MONOLITHIC!
PACK SUPPORT
t 2nd PASS F A C E
Figure 2.5 Typical double pass wide heading layout
(after Hebblewhite, 1983)
Chapter 2. Monolithic Pump Packing Systems 2 - 1 4
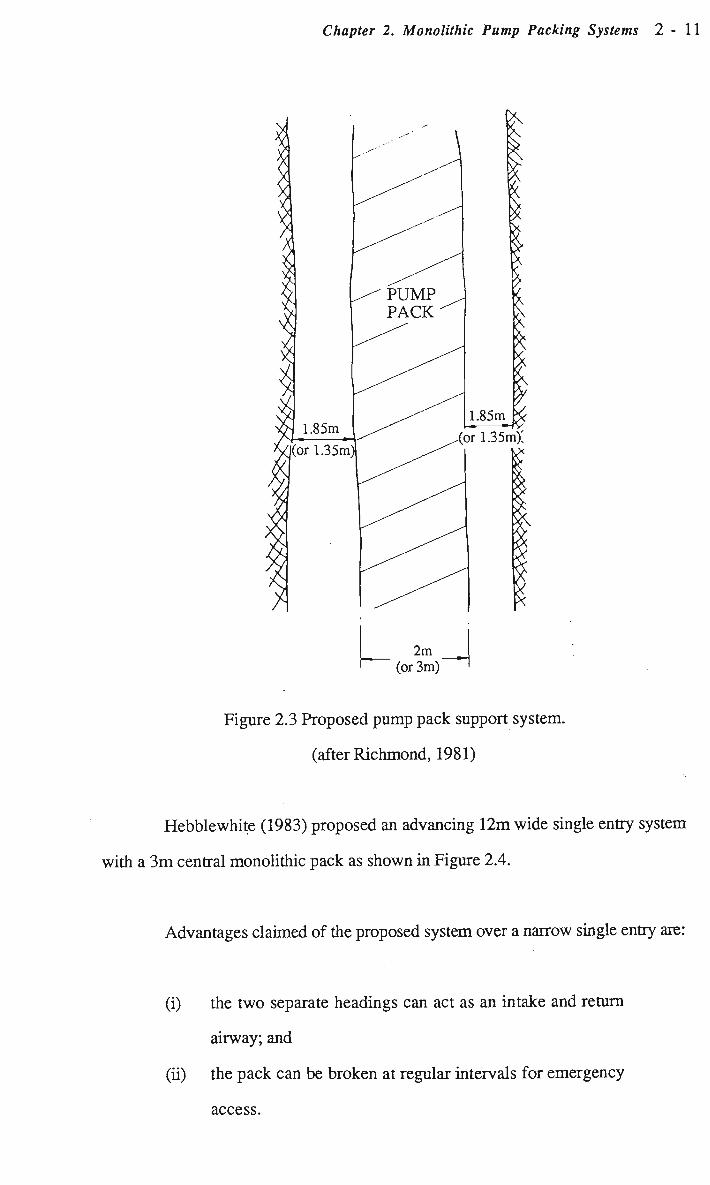
Richmond et al. (1985) have proposed several alternative Longwall panel
layouts utilizing pump packing technology as shown below:
(i) retreating Longwall gateroad support both as piers or continous wall
structure (see Figures 2.6 through 2.9);
(ii) dividing walls in single entry headings (see Figure 2.10); and
(iii) advancing Longwall monolithic emplacement (see Figure 2.11).
Figure 2.6 Centre roadway packwall.
(after Richmond et al, 1985)

Chapter 2. Monolithic Pump Packing Systems 2 - 1 5
Figure 2.7 Monier 'Big Bag' supports.
(after Richmond et al, 1985)
I
Figure 2.8 Side roadway packwall.
(after Richmond et al, 1985)

Chapter 2. Monolithic Pump Packing Systems 2 - 1 6
I •d\.
Figure 2.9 Maingate packwall.
(after Richmond et al, 1985)
^
CONVEYOR-BELT
^ ^ ^ % ^ \
FEEDING MACHINE
PACK .WALL
^ <? &
TRANSPORT ROAD
Figure 2.10(a) Concept of single entry dividing wall - driveage layout
(after Richmond et al, 1985)

Chapter 2. Monolithic Pump Packing Systems 2 - 17
LONGWALL FACE INTERPANEI PILLAR
__ CENTRE PACKWALL
Figure 2.10(b) Concept of single entry dividing wall - partial extraction by
Longwall with single entry.
(after Richmond et al, 1985)
PACK
MAIN GATE
PACK
POSSIBLE 2nd PACKLINE
Figure 2.11 Advancing Longwall PaneL
(after Richmond et al, 1985)
Chapter 2. Monolithic Pump Packing Systems 2 - 1 8
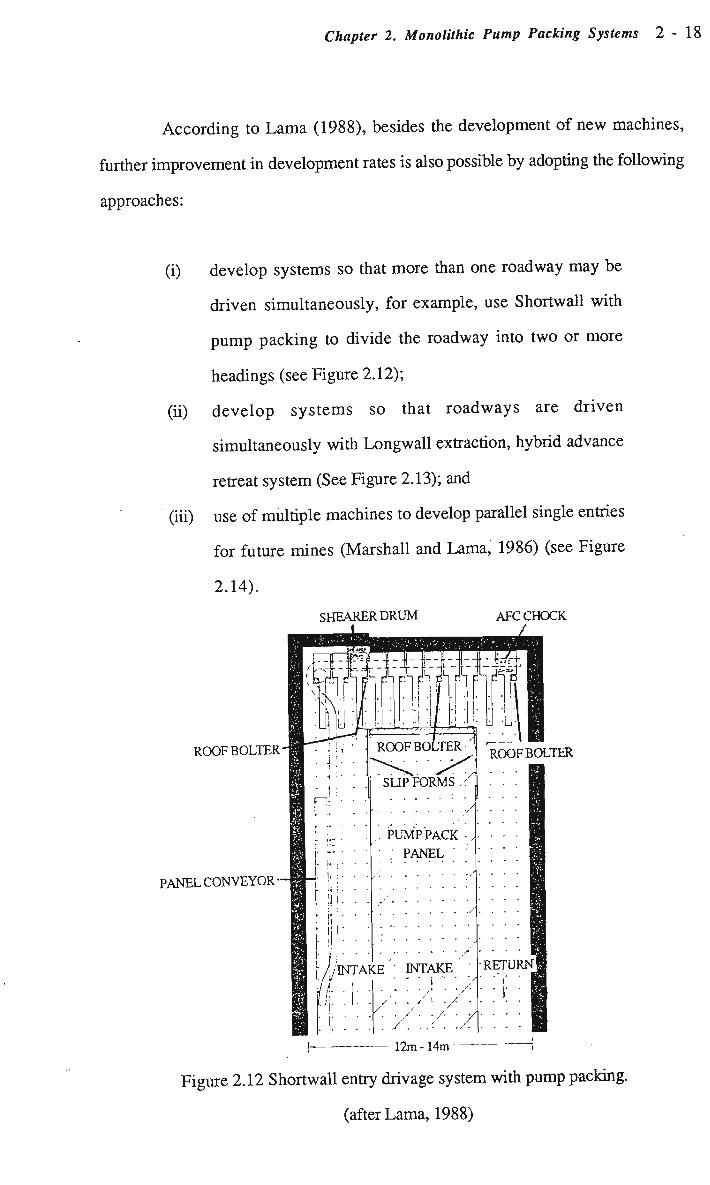
According to Lama (1988), besides the development of new machines,
further improvement in development rates is also possible by adopting the following
approaches:
(i) develop systems so that more than one roadway may be
driven simultaneously, for example, use Shortwall with
pump packing to divide the roadway into two or more
headings (see Figure 2.12);
(ii) develop systems so that roadways are driven
simultaneously with Longwall extraction, hybrid advance
retreat system (See Figure 2.13); and
(iii) use of multiple machines to develop parallel single entries
for future mines (Marshall and Lama, 1986) (see Figure
2.14).
SHEARER DRUM AFC CHOCK
ROOF BOLTER
Ll -LI-
ROOF BOLTER
PANELCONVEYOR-
Figure 2.12 Shortwall entry drivage system with pump packing.
(after Lama, 1988)

Chapter 2. Monolithic Pump Packing Systems 2
MAIN RETURN
PUMP. PACK;
PUMP PACK
MAIN INTAKE _
Figure 2.13 Shortwall extraction system with pump packing,
no development is required.
(after Lama, 1988)
KEMCOL BEAVER
PANELCONVEYOR
ROOFBOLTS
Figure 2.14 Kemcol Beaver with pump packing.
(after Marshall and Lama, 1986)

Chapter 2. Monolithic Pump Packing Systems 2 - 2 0
2.4 PROPERTIES OF PUMP PACKING MATERIALS
The cost and pipeline pumping life of various pump packing materials
currently available in the market are given in Tables 2.2 and 2.3. The prices quoted,
with the exception of Monier "Big Bag", are based on the U K market, and
converted to Australian dollars by a factor of $2=£l sterling (exchange rate, 1986).
The strength properties of various pump packing materials are presented in Sections
2.4.1 through 2.4.8. The use of pack materials for the control of roof in roadways
has been very successful in Germany. Materials used for early bearing strength
include alpha-hemihydrate and for late bearing strength comprise mixtures of alpha-
hemihydrate, flyash and sand (Ruston et al, 1988). Figure 2.15 graphically
illustrates the properties of the materials most suited for various purposes. More
than 20 different types of pack materials have been developed in Germany. They
have been used in a number of underground mining operations to counteract
abnormal strata conditions.
Table 2.2 Cost and pipeline pumping life of tailings pak 2 (UK)
(after Atkins etal, 1986)
Tailings pak 2 (UK)
Products
Pipeline pumping
life (mins)
kg/m3 of placed
material pack
Imported material
cost/m3ofpack
OPC
120
280
Additives PFA
IND IND
21 214
$57
Tailings
IND
857
Note: IND means indefinite.

Chapter 2. Monolithic Pump Packing Systems 2 - 2 1
*—> oo > . 00
M o
f P O
•8 3
> -s »-i ^
O S-?
"3 « 'fi *5
S o
a a bOvo
.s °° v> ON O ^ cd „ ^ rt
O £ .P C bO^P
.s< a §
!U p p<
;P .&• M PH'C
c ci (ZI O
u CO
cs r-H
.O in
H
u u
& a
a o PP
< a, &o
a
o •a 60
.S 5 1
•s D
< OH
5!
<
OO 00
X H
5:
u 0-o eP CO 00
U eS U
tf
a -i o
>. g
O PH
u 00 on
is
5 c o § t5 a, S * op
w < oo
.S « E-< CL,
$
u
5 0.
o
I E -
<
3
f .s
O.
I o E
a o p
o
<
o cn
Q
Q
5
o oo
z
Q
o CN
O oo
Q
s
Tt
o cn
, 60 w
5 o. 2
OH OH 3
o
8 <N
IT)
vo ov
o o Os
CN
O Tt
o Tt
© o r~ .—<
U~l
© <N Vs
o IT)
<N OO
ts oo
o tr)
O
Tt
O c3
'« S -5
p. & 3
cn
cn
cn cn ON
o oo &T>
ON Tt
&9
a M
o\ .—< O N &•}
VO
cn
r-(N V5
•a
1 cd
a
5 tft
o U
> -d i ! D q oo (U T,
^ ZI" oo fc CU O £i *-(
ot available:
e of accelera
c P "O ^
indefinite an
lk OPC
and
H -O
S 2 •o § <. fcfi
^ • T P -H 1 3
-P c P OJ CS p .
9 Q 6 *
0)

Chapter 2. Monolithic Pump Packing Systems 2 - 22
a
H O Zi
w H W > h-1
CW
W PM
S o u
3 0
25
20
15
10
5
0
0 02 025 1 3 5 12 2U8 168 672
TIME (HOURS)
Figure 2.15 Uniaxial compressive strength of cement based
materials and industry by products.
(after Ruston et al, 1988)
2.4.1 Thyssen
Table 2.4 presents the composition and strength properties of material for
the Thyssen pump packing system. The packbind grout is capable of setting in 30
minutes, however, the additional quantities of water within the mix can increase the
overall setting time of the finished pack to 60 minutes.

Chapter 2. Monolithic Pump Packing Systems 2 - 2 3
Table 2.4 Thyssen material properties
(after Hodgkinson, 1977)
Product Materials Formulation Setting Time Strength Properties
10.4% Packbind (cement) 0.4 MPa after 2 hours
1.4% Flowmat (Bentonite) 0.5 M P a after 1 day
Thyssen 51.5% Coal (-19mm) 60 mins 1.0 M P a after 7 days
36.7% Water 5.0 M P a after 28 days
(maximum strength)
During the setting period the pack has no measurable strength, and during
the strength development stages the pack will yield slightly under pressure. This
demonstrates a hydraulic characteristics so desired in any packing system.
2.4.2 Warbret
This is a modification of the material used in the Thyssen system in which
the following changes were made:
(i) mixing of bentonite;
(ii) using of O P C ; and
(iii) using of cement accelerator triethanolamine (TEA) 51.
As can be seen from Table 2.5, the final strength of the Warbret material is
greater than Thyssen material by as much as 5 MPa.

Chapter 2. Monolithic Pump Packing Systems 2 - 2 4
Table 2.5 Warbret material properties
(after Woodley et al, 1980)
Product Materials Formulation Setting Time Strength Properties
48.0% Coal 0.1 M P a after 1 hour
29.0% Water 1.2 M P a after 1 day
Warbret 1.2% Bentonite 60 mins 7-10 M P a
19.2% Accelerator (final strength)
(TEA 51)
2.4.3 Anhydrite
The strength characteristics of material for Anhydrite pump packing
system is shown in Table 2.6. The material has slow setting characteristics in the
natural state, and the addition of an accelerator in the ratio of 1:100 by weight is
thus desirable.
Table 2.6 Anhydrite material properties
(after Batten, 1985)
Product Materials Formulation Setting Time Strength Properties
89.9% Crushed Anhydrite 0.1 M P a after 2 hours
Anhydrite 0.9% Accelerator 4 hours 6.0 M P a after 1 day
9.3% Water 8.9 M P a after 7 days

Chapter 2. Monolithic Pump Packing Systems 2 - 2 5
2.4.4 Aquapak
Table 2.7 shows the setting time and strength properties of Aquapak
material. Aquapak is quite a remarkable development in that the pack comprises
8 5 % water, 1 4 % Aquacem and 1 % Aquabent by volume. Aquabent contains
bentonite to prevent water/cement separation and sodium carbonate accelerator.
Even though it is considered a weak cement from a civil engineering view point, its
properties have been proven ideal in meeting the requirement for pack applications.
Table 2.7 Aquapak material properties
(after Highton et al, 1984, Clark et al, 1985)
Product Materials Formulation Setting Time Strength Properties
33.3% Aquacem
High alumina cement
Portland cement
Anhydrite calcium sulphate
0.35 M P a in 1 hour
0.6 M P a in 2 hours
1.2 M P a in 24 hours
5.0 M P a after 28 days
Aquapak 3.7% Aquabent
Accelerator
Sodium Carbonate
(Soda ash)
Bentonite
20 mins
63.2% Water
The popularity of Aquapak system in the U K mines was attributed to the
smaller delivery pipe size (25mm), and the reduced size and lower cost of the power
packs, pumps and mixing tanks. Later experiences showed that the material could

Chapter 2. Monolithic Pump Packing Systems 2 - 2 6
be pumped from the outbye end of the district, which saved the transport of
materials to a station close to the coalface as was necessary with Packbind.
2.4.5 Tekpak
Table 2.8 shows the details of the strength properties of Tekpak material.
The unconfined compressive strength of Tekpak material has been shown to
approximate that of Aquapak material. Water makes up to 9 1 % of the pack by
volume. However, the material quantities used were only about 7 3 % of that used in
the Aquapak pump packing system.
Table 2.8 Tekpak material properties
(after Highton et al, 1984, Clark et al, 1985)
Product Materials Formulation Setting Time Strength Properties
14.2% Tekcem 0.7 MPa in 2 hours
Tekpak 14.2% Tekbent 30 mins 2.5 M P a in 24 hours
71.6% Water 5.0 M P a after 7 days
Foseco Technik has now designed a new product called Tekpak X X
which gives a minimum 24 hours pumping life. When Tekcem X X is mixed with
Tekbent X X in the packbag, the hardening action is said to be at least as swift as
with the standard Tekpak.
More recently, Masol, a cementitious binder for pump packing with coal
slurries, has been introduced into the "Tekpak technology". Masol is described as a

Chapter 2. Monolithic Pump Packing Systems 2 - 2 7
blend of non-aggressive high alumina cement and it is a modified form of Tekbent.
However, the performance of this new product in the field is yet to be assessed.
2.4.6 Flashpak
Table 2.9 shows the strength properties of Flashpak material. The
Flashpak material can set almost immediately after mixing. This reaction therefore
requires no particular packhole preparation or containing bag. Hence, simple steel
sheets suspended from the packhole supports are all that is required.
Table 2.9 Flashpak material properties
(after Highton et al, 1984, Clark et al, 1985)
Product Materials Formulation Setting Time Strength Properties
66% Fly ash mix slurry 0.5 MPa after 2 hours
Fly ash (64.5%) 1.6 M P a after 1 day
Alurninium sulphate 4.4 M P a after 7 days
(0.03%)
Flashpak Water (35.47%) Flash set
34% Cement mix slurry
O P C (62.5%)
Water (37.5%)
The pack is virtually built up layer upon layer until the pack is completed.
Additionally, according to Clark and Newson (1985), the excellent adherence of the
material to the roof, sides and pack wall itself helps to reduce air leakage.
Chapter 2. Monolithic Pump Packing Systems 2 - 2 8
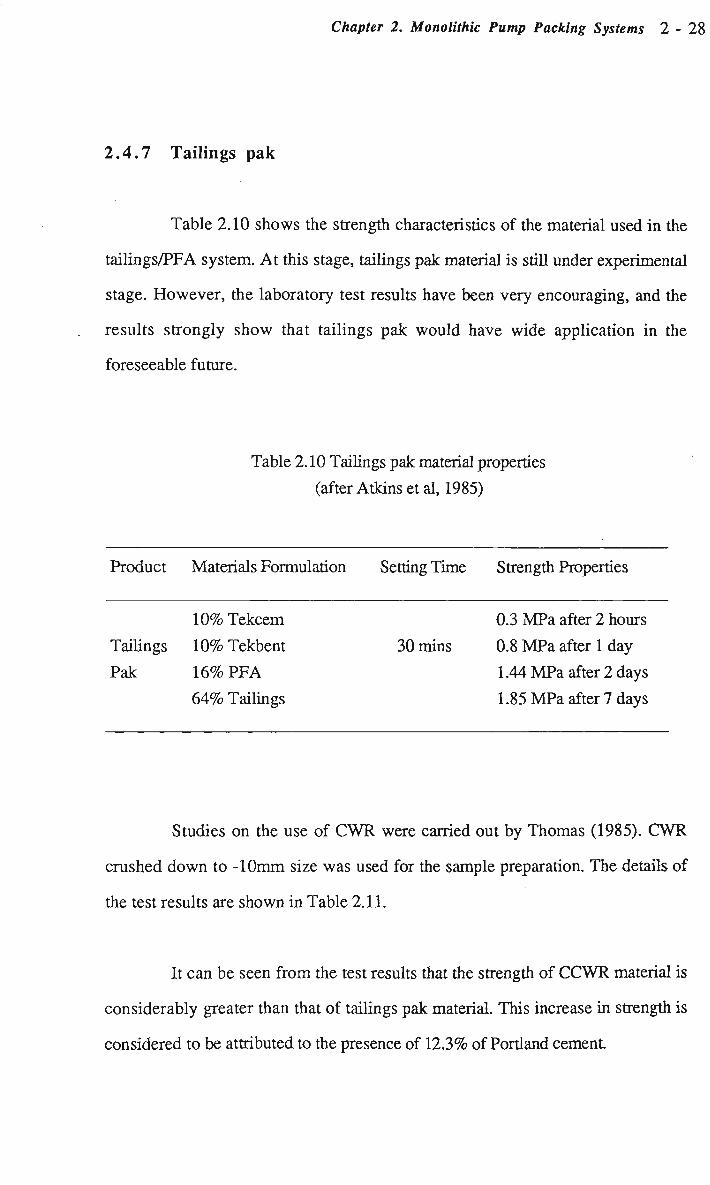
2.4.7 Tailings pak
Table 2.10 shows the strength characteristics of the material used in the
tailings/PFA system. At this stage, tailings pak material is still under experimental
stage. However, the laboratory test results have been very encouraging, and the
results strongly show that tailings pak would have wide application in the
foreseeable future.
Table 2.10 Tailings pak material properties
(after Atkins et al, 1985)
Product Materials Formulation Setting Time Strength Properties
10% Tekcem 0.3 MPa after 2 hours
Tailings 1 0 % Tekbent 30 mins 0.8 M P a after 1 day
Pak 1 6 % P F A 1.44 M P a after 2 days
6 4 % Tailings 1.85 M P a after 7 days
Studies on the use of C W R were carried out by Thomas (1985). C W R
crushed down to -10mm size was used for the sample preparation. The details of
the test results are shown in Table 2.11.
It can be seen from the test results that the strength of CCWR material is
considerably greater than that of tailings pak material. This increase in strength is
considered to be attributed to the presence of 12.3% of Portland cement

Chapter 2. Monolithic Pump Packing Systems 2 - 2 9
Table 2.11 C C W R material properties
(after Thomas, 1986)
Product Materials Formulation Setting Time Strength Properties
12.3% Portland cement 0.2 MPa after 1 hour
0.37% Calcium chloride 0.35 M P a after 2 hours
C C W R 69.7%-10mm coal N/A 5.17 M P a after 7 days
washery refuse 6.53 M P a after 14 days
17.6% Water 6.78 M P a after 28 days
2.4.8 Monier "Big Bag"
Table 2.12 shows the strength characteristics of Monier "Big Bag"
material. The Monier "Big Bag" chocks, which are said to be a fire resistant roof
support system are constructed from specially formulated materials including
Portland cement. The system offers high initial resistance to roof movement and it
also provides load bearing capacities of up to approximately 500 tonnes.
In Australia, Monier "Big Bag" chocks have been used as an additional
roof support system at "sensitive" roadways intersections. Studies carried out by
Batten (1985) and field observations have shown that the Monier "Big Bag"
chock/material tends to suffer from a lack of cohesion when loaded, which is not a
desirable feature as a pump packing material.

Chapter 2. Monolithic Pump Packing Systems 2 - 3 0
Table 2.12 Australian Monier "Big Bag" material properties
(after Batten, 1986)
Product Materials Formulation Setting Time Strength Properties
OPC 1.5 MPa after 1 day
P F A 2.7 M P a after 3 days
Monier Expansion Agents 10-16 hours 3.7 M P a after 7 days
"Big Bag" Plasticiser for better 6.3 M P a after 28 days
flow 10.46 M P a in 42 days
18.7 M P a in 90 days
2.5 SURVEY OF THE TYPES OF PACKING MATERIALS USED
IN THE SOUTHERN COALFIELDS
The Author conducted a survey of the types of packing materials used in
the Southern Coalfields, Australia as shown in Table 2.13. The survey indicates
that wooden chocks and Monier "Big Bag" chocks (a type of monolithic pump
packing system) are the two most popular types of packing materials. It is noted that
the number of wooden chocks used is significant. This gives a good indication of
the popularity and the relative ease of wooden chock installations. Monier "Big
Bag" chocks have been installed in several collieries since its introduction in 1981.
At present, most collieries have stopped using Monier "Big Bag" chocks because
they are not cost-effective for use as roof supports. The undesirable insitu
load/deformation characteristics of Monier "Big Bag" chocks have been discussed
in Section 2.4.8.

Chapter 2. Monolithic Pump Packing Systems 2 - 3 1
Table 2.13 Types of packing materials used in the Southern Coalfields.
T Y P E S O F P A C K I N G M A T E R I A L S U S E D
Colliery Wooden chock Steel chock "Big Bag" chock
Appin
Bulli
Coal Cliff
Cordeaux
Corrimal
Darke Forest
Huntley
Kemira
Metropolitan
North Cliff
Nebo
South Bulli
Tahmoor
Tower
West Cliff
Wongawilli
Yes
Yes
Yes
Yes
Yes
Yes
Nil
Yes
Yes
Yes
Yes
Yes
Yes
Yes
Yes
Yes
~
~
—
—
—
—
—
Yes
~
—
~
—
~
—
—
—
Yes
Yes
Yes
Yes
Yes
Yes
Nil
Yes
Yes
Nil
Yes
Yes
Nil
Yes
Yes
Yes
In the Southern Coalfields, Australia, wooden chocks are generally used as
extra supports when roof conditions deteriorate in gateroads and main development
headings and/or as preventive measures where overlying pillars are left in the Bulli
Seam and cause major stresses in the roof. It is evident that wooden chocks are
erected in the maingate and tailgate cut throughs prior to the extraction of the

Chapter 2. Monolithic Pump Packing Systems 2 - 3 2
Longwall pillar. In Kemira Colliery, typically some 40 wooden chocks are used as
secondary roof supports in each Longwall, 20 chocks for the maingate and 20
chocks for the tailgate.
In Tahmoor Colliery, BP Coal Australia which is now a subsidiary of
Kembla Coal and Coke Pty. Limited, extensive wooden chocks have been used to
secure the roof of Longwall gateroads because of difficult roof conditions. Some
300 mini chocks and 70 big chocks have been used for each Longwall. Some 130
mini chocks and 6 big chocks have also been used for Longwall recovery.
Typically, for every 60m of Longwall gateroads, 4 mini chocks and 1 big chock are
used for the maingate, and 7 mini chocks are used for the tailgate. Figure 2.16
diagrammatically shows the layout of wooden chock installations per 60m of
Longwall gateroads at Tahmoor Colliery.
W
15m
-E3
GOAF
LONGWALL 6 FACE
.
MINI CHOCK B BIG CHOCK
Figure 2.16 Layout of wooden chock installations per 60m of Longwall 6 gateroads
at Tahmoor Colliery.
\

Chapter 2. Monolithic Pump Packing Systems 2 - 33
2.6 SUMMARY
It can be inferred from the Uterature survey that the selection of any type of
packing material for use in the Australian coal mines would obviously be influenced
by the availability of the product at a competitive price and its function as a support
material. Given the existing environmental constraints imposed on the coal mine
operators, the utilization of C W R as a packing material is an attractive proposition.
In the likely event of high tonnage demand for packing material, the
crushed C W R can be piped down from the surface to the packing site, where it will
be readily mixed with other ingredients and pumped into the pack form or bag.
Other desirable features of a packing system should include:
(i) good packing characteristics (the behaviour and suitability
of the p u m p packing material with reference to strata
control requirement);
(ii) contain a minimum of imported material;
(iii) flexibility and ease of material handling, bulk pneumatic
and hydraulic pipeline conveying;
(iv) longer pipeline pumping life; and
(v) most importantly the cost-effectiveness of the system.
In general, pump packs are designed to yield and thus control
convergence, and are often built to an optimum size to save manpower and material
costs. In addition, as German experience has shown, pump packs greater than a
critical width lead to floor heave as the packs do not yield under load (Lewis and
Stace, 1981).

Chapter 2. Monolithic Pump Packing Systems 2 - 3 4
Extensive studies over the years have established the following criteria for
pack strengths: the strength of 0.1 M P a for deshuttering purposes, and initial
strengths of 0.4-0.5 M P a in 4 hours, and 1.0-1.4 M P a in 24 hours are desirable. A
more important criterion is that the pack should be able to develop strength as
quickly as possible, and the final strength should be in the order of 6-10 M P a
(Whittaker et al, 1977, Issac et al, 1982, Smart et al, 1982a, 1982b, Buddery,
1984, Clark and Newson, 1985, Smart, 1986, Isaac and Payne, 1986).
It is important to note that the above criteria for pack strength apply
especially for the United Kingdom conditions. Therefore, it is in the opinion of the
author that the pack strength for Australian conditions should be higher in order to
accommodate the excessive load of the massive sandstone roof (Hii and Aziz,
1986a). The strength of the pump packing material can only be determined from
field trials and monitoring programmes.
The state-of-the-art review of pump packing system has led to the
following conclusions and recommendations.
The planning of an efficient pump packing system requires a high level of
prediction, both of geological conditions and those likely to be caused by mining. It
is noted that the continued effective control of the roof strata in the vicinity of a
roadway is only achieved when the pack supports are capable of sustaining the
variations which arise from the changing mine layout, the ground stress conditions
and the variations in the geological conditions.
Judging from experiences gained in the United Kingdom and Germany,
the elimination of chain pillars leading to the pillarless Longwall mining can be an
attractive proposition. The re-use of roadways to serve adjacent Longwall faces
should be approached with caution. Excessive floor heave at the face ends is just

Chapter 2. Monolithic Pump Packing Systems 2 - 3 5
one example of the many problems encountered at Betws Colliery, South Wales,
where pillarless mining was successfully attempted (Issac et al, 1982).
An attempt has been made to emphasize the importance of understanding
the tectonic forces which prevail in mining. Consequently, an improvement in this
understanding can help to effectively control these forces by the selective use of
pump packing systems.
It has been proposed that considerations of the reaction of the pump pack
within its structural environment suggests that in heavy strata loading conditions,
increased pack strengths would be beneficial to strata control, ensuring maximum
control over convergence (Smart et al, 1982a, Hii and Aziz, 1986a).
Research has indicated that the material properties of tailings pak products
are ones of the most cost-effective pump packing materials, and are therefore
recommended for field trials in the Bulli seam.
The integrated methods of colliery waste disposal for ground control as
proposed by Atkins et al. (1986) are of particular interest to the coal mining
industry. The tailings pak pump packing system undoubtedly will have a large
contribution to make to the mining industry in the foreseeable future.

CHAPTER THREE
THEORETICAL CONSIDERATIONS

Chapter 3. Theoretical Considerations 3 - 1
CHAPTER 3
THEORETICAL CONSIDERATIONS
3.0 INTRODUCTION
This Chapter focuses on the principles of pump packing and the suitability
of p u m p packing under Australian conditions with particular reference to the Bulli
Seam. The Chapter is also concerned with the development of C C W R material for
strata control, the application of the experimental design with mixtures and the
development of a new yield function for C C W R material.
3.1 PRINCIPLES OF PUMP PACKING
3.1.1 Purpose of pump packing
In general, the purposes of pump packing can be outlined as follows:
(i) to provide support for the roadway behind an advancing
longwall face and the packs provide support to the
immediate beds of strata as the face advanced;
(ii) to effect a breaking off line at the waste edge to maintain the
competence of the immediate roof measures;
(iii) to facilitate the disposal of the controversial liquid tailings
from coal washery plant and pulverised fly ash from power
stations, this factor being pertinent to the use of tailings/fly
ash packing system; and

Chapter 3. Theoretical Considerations 3 - 2
(iv) to prevent or mmimize air leakage across the waste area.
It is envisaged that the first two points are strata control aspects and the last
two are environmental ones. It can be recalled that elimination of chain pillars by the
re-use of roadways has been successfully practised in Britain (Smart et al, 1982a).
In most cases, this has been achieved by employing pump packing techniques.
The two main reasons for the elimination of substantial chain pillars
between adjacent retreating longwall coal faces are: to improve recovery of reserves
(by preventing sterilisation of reserves); and to reduce the amount of development
required for retreating longwall faces through reuse of roadways.
In Australia, "Big Bag" packs have been used at some roadway
intersections as a secondary means of support. Figure 3.1 illustrates "Big Bag"
chocks which are used for roof support at West Cliff Colliery, N.S.W., Australia.
However, research has indicated that pump packing can also be used as an initial
means of strata control.
3.1.2 Detached block theory
The detached block theory has been successfully implemented to explain
the deformation mechanisms around both face lines and roadways in underground
coal mines (see Figure 3.2). The fundamental of detached block theory has been
reported in Wilson (1975) and Whittaker and Woodrow (1977). The actual caving
height and the geometry of the detached block are the major parameters in the
theory, and it is assumed that the caving characteristics of the waste govern the
caving height. It can be used to predict the load generated frorh the detached block
in the strata and the actual strength required for a pack.

Chapter 3. Theoretical Considerations 3 - 3
Figure 3.1 "Big Bag" chocks at West Cliff Colliery.
BRIDGING BEDS
DETACHED BLOCK
I rTTTTTTTTTT PACK
CAVING HEIGHT
Figure 3.2 Detached block theory.
(after Clark and Newson, 1985).

Chapter 3. Theoretical Considerations 3 - 4
In the United Kingdom, the detached block theory together with
appropriate safety factors have been widely used for roof support design on face
lines. It is cautioned that consideration should be taken of the imposed loading
generated by the bridging beds assuming the subsidence profile. This is because the
measured pack load has indicated that the pack at some distance behind the face line
is not solely supporting the dead weight of a detached block (Clark and Newson,
1985).
3.1.3 Roof beam tilt theory
The roof beam tilt theory has been reported in details elsewhere (Smart et
al, 1982, Smart, 1986). The roof beam tilt approach recognises the imposed loading
generated by the downward movement of the bridging beds around the roadway.
Figure 3.3 schematically shows the support mechanisms of roof beam tilt theory.
BRIDGING BEOS
WASTE m CONSOLIDATED
Figure 3.3 Generalised view of roof tilt.
(after Clark and Newson, 1985)
Chapter 3. Theoretical Considerations 3 - 5
The theory suggests that the immediate roof tilt towards the waste about a
pivot point in the ridside. Although the amount of downwards movement of the
roof can be controlled by the pack, it is unavoidable. In fact this phenomenon may
be modelled as a simple lever problem.
3.1.4 Practical requirements for the use of pump packing
In the light of several changes in the form and type of construction of
gateside packs that have been introduced in recent years with respect to longwall
mining, the basic requirements regarding the provision of roof support have
remained unchanged. The recent changes have been directed towards mechanizing
pump packing operations and achieving earlier and higher supporting resistance.
Progressive developments towards improving the optimum pack support resistance
is conditional upon full knowledge of the pack design requirements (Smart, Isaac
and Roberts, 1982, Smart, 1986).
In order to understand the implications of materials properties of pump
packing systems in an underground environment, it is necessary to appreciate and
briefly discuss the nature of strata behaviour above a longwall panel. Of particular
interest is the role of the pack in relation to the strata behaviour and support load
requirements about longwall faces.
3.1.5 Longwall strata behaviour and the generation of pack load
There is a general agreement that the longwall face disturbs the equilibrium
stress field of the strata. The immediate roof begins to sag away from the overlying
strata and subsequently becomes destressed as the face moves away from the
standing position. Eventually after a critical length of advancement the immediate
roof begins to cave.

Chapter 3. Theoretical Considerations 3 - 6
As the face continues to advance the vertical and horizontal forces
gradually rearrange to their former condition after a prolonged period. In the
working area, it is envisaged that the pack should be able to accept the movement
associated with the redistribution of stresses without compromising its ability to
accept later loading. One of the important requirements of a pack as reported by
Buddery, Hassani and Singh (1984) is to prevent bed separation above the roadway
which would promote strata failure in the roof.
In Australia, the caving material sometimes does not expand sufficiently to
completely fill the void, because the geology of roof often consists of massive
sandstones interrupted by shale and mudstone layers. However, under these
conditions, the bridging beds remain relatively stable but fracturing may occur.
Previous work by Smart et al. (1982b) suggested that under ideal caving
conditions, overburden pressure is believed to be taken by the solid coal in front of
the face and over the waste through the bridging beds. The purpose of pump
packing therefore is to control the immediate roof (the cantilever beam) by
restricting convergence of the roof, and consequently to prevent the beam from
breaking along the coal face. The amount of convergence to be allowed is very
much dependent upon the geology of the immediate roof.
Over the past years, various researchers have carried out extensive study
into pump packing technology needs (Hodgkinson, 1977, Whittaker et al, 1977,
Richmond, 1981, Smart et al, 1982a, 1982b, Buddery and Ashika, 1982, Issac et
al, 1982, Buddery, 1984, Lerche and Renetzeder, 1984, Clark and Newson, 1985,
Richmond et al, 1985, Singh et al, 1985, Thomas, 1986, James, 1986, Smart,
1986, Issac and Payne, 1986, Hii and Aziz, 1986a, 1986b, 1987a, 1987b, 1989,
Atkins et al, 1984, 1986, 1987, Zadeh et al, 1987, Hii and Yu, 1989).

Chapter 3. Theoretical Considerations 3 - 7
3.1.6 Basic requirements
It has always been recognised that, ideally, a packing medium must be
able to fulfil both the short term and long term support requirements. There is a
general agreement that early effective support is necessary to achieve good strata
control. Therefore, the early load-bearing capacity of a pack system is absolutely
essential. It is indicative that the pack must always be built in contact with the roof,
and preferably as near as possible to the coal face. It is also required that the pack be
built of a suitable material, and in such a way that the best use is made of the
available material.
3.1.6.1 Short term support requirements
The examination of the resistance of the existing packs indicates that
reliance is placed on the resistance of the "pack wall" in the early life of the packs. It
is of paramount importance that the packs be able to absorb the vertical closure
without bulging and weakening the wall.
Therefore, the pack should be able to accommodate 5-10% strain (in most
geological conditions) without undergoing failure. Unfortunately, not every
condition allows the building of suitable packs and resort is made to other measures
such as timber or other imported materials. However, roadways conditions often
hinder the transport of material in bulk.
The pump packing system has the distinct advantages of relatively short
setting time in relation to face operations and also early load-bearing characteristics.
However, sometimes the early support property of the system can be neglected due
to poor workmanship. This can result in inadequate roof contact or the existence of
unfilled cavities and broken roof which may render packing less effective.

Chapter 3. Theoretical Considerations 3 - 8
In normal face strata control, the break-offline which usually occurs at the
rear of powered supports can be diverted away from the face-end area by the
provision of the pump packing support which can also be a suitable packhole
support. In ground prefractured by interaction, it has been proven to be especially
advantageous to use pump packing for additional support
It is envisaged that a large amount of initial movement is necessary for the
stability of the strata and the pack should be able to accept this movement without
compromising its later strength. One of the important requirements of a pack is to
prevent bed separation which would promote strata failure in the roof.
3.1.6.2 Long term support requirements
It is often recognised that no matter how important the pack might be in
offering early resistance, it is equally important that the pack gives long-term yield
support at the side of the roadway.
The phenomenal lowering of the upper beds behind a longwall face is
governed by the condition existing in the waste area. It is anticipated that the pack
must offer sufficient resistance to maintain the immediate roof in contact with the
upper beds and allow all the strata to lower at the same rate, otherwise adverse
conditions in the associated roadway will occur.
However, too great a resistance could lead to the floor bearing capacity
being exceeded and consequently floor lift would occur (see Figure 3.4). The pack
long term support requirement is to be able to support the height of strata "caving
height" that is free to move under its own weight

Chapter 3. Theoretical Considerations 3 - 9
s£L'%.4 . SRfer
*&&&!
- .'ti!;-
.Ussifllllwl
;/:, .•At
Figure 3.4 Floor heave problem.
(Source: Monier Resources, Australia)
The success of pump packing suggests that its properties are close to those
required. Although the ultimate strength can be attained by many pump packing
systems, many packs (mechanically and poorly built hand packs) offer negligible
resistance initially, and consequently they cannot control the movement of the
immediate roof, other packs which are either made of wood or concrete offer too
high an early resistance damaging the structural integrity of the surrounding rock
mass and resulting in excessive roof to floor closures (see Figure 3.5).

Chapter 3. Theoretical Considerations 3 - 10
Figure 3.5 Support failure leads to excessive roof to floor closures
(West Cliff Colliery).
3.2 SUITABILITY OF PUMP PACKING UNDER AUSTRALIAN
CONDITIONS WITH SPECIAL REFERENCE TO THE
BULLI SEAM
The coal mines in Australia, especially those in the Southern Coalfields,
have been using p u m p packing in the form of "Big Bag" chocks since 1981.
However, to date bulk monolithic p u m p packing system for roadway support has
not found a general application in Australian collieries. The excellent geological
condition of Australian mines, with high production capacity, has placed little
importance in the past on the maximization of percentage extraction of the workable
reserves.

Chapter 3. Theoretical Considerations 3 - 11
In addition to its present form as "Big Bag", in providing stability to
roadways and intersections, the pump packing technique has a significant role in
contributing towards the success of the pillarless longwall mining method as
suggested by Marshal and Lama (1986). Such a system should be attempted in Bulli
Seam, in view of the less complicated geological conditions of the Southern
Coalfields of NSW. However, in the experimental stage, care must be taken to
provide means of minimising the possible effects of floor heave at the gate ends.
A careful study of the geological conditions of the mines in both Australia
and the United Kingdom has indicated a marked difference in the mining conditions
between the two countries (Smart and Aziz, 1986, Porter and Aziz, 1988).
Therefore, it is most important to be able to distinguish the difference in the
geological conditions, and thus modify the pump packing system before any
transfer of pump packing technology from Europe to Australian coal mines can be
successful.
In Australia, the average powered support setting load density is 0.625
MPa, and this is about 2.3 times higher than that used in the United Kingdom
(Porter and Aziz, 1985). This level of support density indicates that for successful
application of pump packing systems in Australian conditions a higher pack strength
is required.
Therefore, more laboratory testing of the properties of tailings pak material
which is the "key" pump packing material used in this particular research is highly
desirable. This research is necessary to develop cheaper alternatives and to match
the strength of the pack to the surrounding strata in Australia.
The characteristics of pump packing which would be suitable to act as a
means of underground roof support in Australian conditions include rapid initial

Chapter 3. Theoretical Considerations 3 - 12
setting and steady increase in strength from 1.0 M P a in one day to 5.0 M P a or more
in 28 days.
3.3 DEVELOPMENT OF CCWR MATERIAL FOR STRATA
CONTROL
3.3.1 Design of CCWR material
Although numerous methods of concrete mix design have been developed,
each method is applicable only under conditions similar to those for which it is
developed. All methods of mix design are deduced from empirical information and
follow substantially the same procedure. Loo and Ahmad (1982) have conducted a
comparative study of four popular concrete mix design methods. To substitute the
expensive commercial materials for pump packing, a method for use in the design
of C C W R material mixes is proposed.
This research program aims at producing the most cost effective and
economical C C W R material for strata control and increased recovery of coal. The
investigation also aims: to optimise particular mechanical properties of C C W R
material, to develop a cheaper binding material, to increase the initial strength of the
mixture, and to develop a material which is pumpable but can also give sufficient
strength for use as a pack material in Australian underground coal mining
operations.
3.3.2 Correlation of the strength and the curing time
Figure 3.6 shows the plot of the measured strength against curing time for
each mix (see Table 3.1). It is obvious from Figure 3.6 that the strength of a mix
increases with an increase in the curing time, which has also been reported (Kmssel

Chapter 3. Theoretical Considerations 3- 13a
ca
V)
a
bfl
c
•c 3 U *-*
c rt
cn
•c i)
rt
u u o
c P c/3
> . 1 - .
C/3 C/3
<D p
o o c :TH
C
o u c p
X) CD
P c/: rt <D
co
rt
OH
C Ol u
C/D
> 'c« c/3 Ol
o U •a a> c iC
e o u c 3
If)
>-. a
•a o Ov ID
X3 © vo t/i
;>-> c: •a 00
<s IT) >s
a ~a
IK
03
Q
Q
If)
<S
X
X
CJ
r> U
X
2 X a u
tH
S
£
t£
ON
ON ON
cn cn
oo 00 co
ON ""vt
<N
CN
co Tt CN
Tt" O
CN
NO
r-oo
oo
o CN
00
o CN
CN
p oo
Tl->0
Tt" IN
O
VO
CN
o VO
m cs • *
VO
o CN
NO
>o ^t
o io CN .—I CJ
o co CN"
vO
VO
vo
r-Tt
r-
<N
Tt VO
oo
o 00 VO
o —>
oo oo o vo
r-r—<
VO
r-Ov o
vo cs VO
Tf VO
O r-:
(N OO
o o p ON
CN
O
Tt
ON
r-CO —, »-< CO
Tt CN ON
ro i — i
CN
CN IT) f—l
ro CN 00 d
, — i
CN CO d
ON 00 CN r—<
Tt ON to
d
Tt VO NO CN
Ov CN
vq
VO VO
oo
o
o vo NO
CN TICS
oo ro O
vo
cs
d oo
I-H
VO O VO
ON Tt CS vd
00
o vd
>o Ov
o Tt
o
Tt ON
r-.—<
5? CO CO
VO 00 00
r-cs CO ^ oo r-ro Tt
CO O Ov CN
VO r-H
vo 00
ro vo
.-H
O l-H
ON
vo ON oo
vo ON
CS
Tt
r-io
cN
r-
Tt CS
CN
CO CO r-H
CN
r-H
O
CS
CO
o r--f~H
ON lO vO_
d
o .—< Tt CO
o p CO
o >o VO cs
Ov ON
Tt
TJ CO Tt
(N 00
oc CO
ON
4 ro
ON ON
r»
co CO Tt r
Tt
r» Tt r-'
cs CO CS
vd
>o o CO vd
«o ON Tiro
cN
00 Tt
p d
CN CO
o
cs Tt
p d ON CO
o d
oo r-
p d
t-Tt
o d VO CO
o
Tt ON
IO
o NO
00
co VO ON
oo r-
Tf VO
O 00
VO
<o CO oo
VO r-H
00
r
Tf
r-
oo
CN Tt <N d
o vo cs d
Tt CO <N d
ro VO CS
d
o cs
ON
vo
o o CM
vd
* VO
o Ov
r-_ CO
o o o cs
-C, VO OO ON .-H
B Vt ca
s o IS u, CD
CCS
*
-C CO OJ > >v Xi
bo ca «-. c u u D. on
o c 4) •o
*

Chapter 3. Theoretical Considerations
a &H
M C oi
u fi CU
> V) in oi t.
CU o U T3 Ol
#C C o o C
p
CQ
cs cs U rt
U
«
© ON
C/3
?>->
a •a o VO c/3
>-> C3
XJ oo cs in
>-, C3
C/3
a Q
cs
O
fc.
E
C/3
fc-
CS
C X
fc-
fc
$
#
X ^ #
£
o VO ON l-H
Ov CS
r-VO
o o ON
O 00
cs
Tt CS
r-00
o o
o .-H
VO -1
00
o CO 00 r-H
ON ON VO vo
(N O CO
t — .-1
CO o oo Tt
Tt ON ro
Ov cs o r-
Tt CO I — '
ro r-o VO
00 ro 00 t—t
VO r-1
o r-VO
ON
O O
CN
VO
d Tt ~
o o 00 cs
cs VO
^
VO ON 00 ro
VO VO ro ^
ro
o ©
Ov VO 00 00
oo ro
VO
^H
cN O I-H
<N CO
©
NO
o vo ©
CN
©
ON
CN
r-ON
CO
vo © oo vo
ON
cs 00
CS vo H cN co ro
© o © CN O Tf •—' vo O
Tt ON ON •"' r-H
r-i-H
vo
>o i-H
Tt I-H
VO
o Ov
O 00 VO cN
r-c^ ON CO
cs cs 00 ©
VO © O CS
CO
5 cs 00
cs
NO NO
ro r-r--cs
CO
cs VO Tt"
oo Tt
cs Tf
t-H
l-H
© OO
r-vo
o ro vo
vo cs ro ON
ON CO VO
r-
©
cs NO
CO ON Tt ON
VO CN r-H
00
CN 00 VO
o 00
cs
ON oo CN l-H
o r-i — < >o
Tt
r-vo
ON 00 VO CS
cs VO VO oo
Tt i-H
NO
CS ON
oo
vO Tf o
l-H
CO cs
VO CN ©
OO VO o
Tt
cs ON r-VO
VO
oo ON i-H
Ov ©
ON
NO
CS
o ro cs
© ON VO I—H
r-
cs vo cs CO
VO
o © CO
ON Tt
oo Tt
© ON 00 vo VO VO CO OO
ro ro ro ro
d d d d
© o o o ro CS CS vo r-- vq r- i>
r Tt —<
Ov
CN CO
oo NO VO
r-o r-VO i — i
© ro CS
vo
o r-r-o CN
o VO
o VO ON
CO
cs NO
o o co vd

Chapter 3. Theoretical Considerations 3 - 1 4
rX
H
z -W «
H tZ3
o •
•
+ •
o A
A
•
X
s X
•
• •
.
•
MIX 15 MIX 12 MIX5 MIX8 MIX 10
MDC9 MIX2
MIX3
MIX 14 MIX 11 MTX7 MIX 4
MK1 MIX 6 MIX 13 MIX 16 MIX 17
0 10 20 30 40 50 60 70 80 90 100
CURING TIME (DAYS)
Figure 3.6 Plots of the measured strength against curing time for each mix.
and Helms, 1983; Thomas, 1986; Hii and Aziz, 1986; 1987a; 1987b; 1987c).
However, it has been expected that after a critical value, a further increase in the
curing time will not result in any significant change in the strength of a mix. It is
apparent that the form of the curve is somewhat a typical one for concrete and it is a
function of the cement chemistry of the material. The relationship between the
strength S and curing time t of a mix may be described by the following equation:
S=A-exp(-B/f(t)) (3.1)
where
A and B are unknown positive parameters;
f(t) is a monotone increasing function oft

Chapter 3. Theoretical Considerations 3 - 1 5
In this case, constant A corresponds to the strength when the curing time
tends to be infinitive, i.e. the final strength; and constant B describes the increasing
rate of the strength with the curing time of a mix. For simplicity, f(t) can be written
as:
f(t)=tn (n>0) (3.2)
Substituting eqn.(3.2) into eqn.(3.1) gives
S=A-exp(-B/tn) (3.3)
The values of constants A, B and n can be determined by optimising the fit
of eqn.(3.3) to the measured data in Table 3.1 for each mix. This may have to
involve a non-linear regression procedure, which is not so convenient in practice.
Eqn.(3.3) can be rewritten as:
lnS=lnA-B/tn (3.4)
If n is a constant for any mix, the values of constants A and B can then be
obtained by plotting InS against 1/t , different values of n have been tried for the
data in Table 3.1. As shown in Figure 3.7, satisfactory fits can be obtained when n
is equal to 0.5 though it may not be the optimum value. Figures 3.8 through 3.11
show the plot of InS against 1/Vt for different mixes. The values of constants A and
B for each mix are included in Table 3.1, and the correlation coefficients for all the
mixes are greater than 0.97. It is, therefore, concluded that the relationship between
the strength and curing time of a mix can be accurately described by:
S=A.exp(-B/t0-5) (3.5)

Chapter 3. Theoretical Considerations 3
C. = 8.4634e-3 + 0.99144 M. RA2 = 0.986
30
CJ PH
s X H
w tf H c*o Q W H <l J P U J <
u
25
20
15
10
b
5 10 15 20 25 MEASURED STRENGTH (MPa)
Figure 3.7 Comparison between calculated and measured strength.
fcJD C 0)
s_ "is
Figure 3.8 Plots of InS against 1/Vt for mixes 2 through 5.

Chapter 3. Theoretical Considerations 3
2 I • l • i « i • i i i i I
0.0 0.2 0.4 0.6 0.8 1.0 1.2
l/Vt
Figure 3.9 Plots of InS against 1/Vt for mixes 1,7, 8, 11, 12 and 13.
l/Vt
Figure 3.10 Plots of InS against 1/Vt for mixes 6, 9 and 10.

Chapter 3. Theoretical Considerations 3 - 18
i/Vt
Figure 3.11 Plots of InS against 1/Vt for mixes 14 through 17.
Once the constants A and B in eqn.(3.5) are known, the strength S of a
mix at any curing time t can be calculated. In this way, the relationship between the
strength and the compositions of mixes at any given curing time can be further
discussed as shown in Section 3.3.3.
3.3.3 O p t i m u m design of C C W R material
The strength of a mix at any given curing time will depend on the
compositions in the mix provided that other conditions, for examples, compaction,
materials used and so on are unchanging. The variables which may affect the
strength of CCWR material should be considered to be the mass percentages of
water, calcium chloride accelerator CaCl2, OPC and coal washery refuse, which are
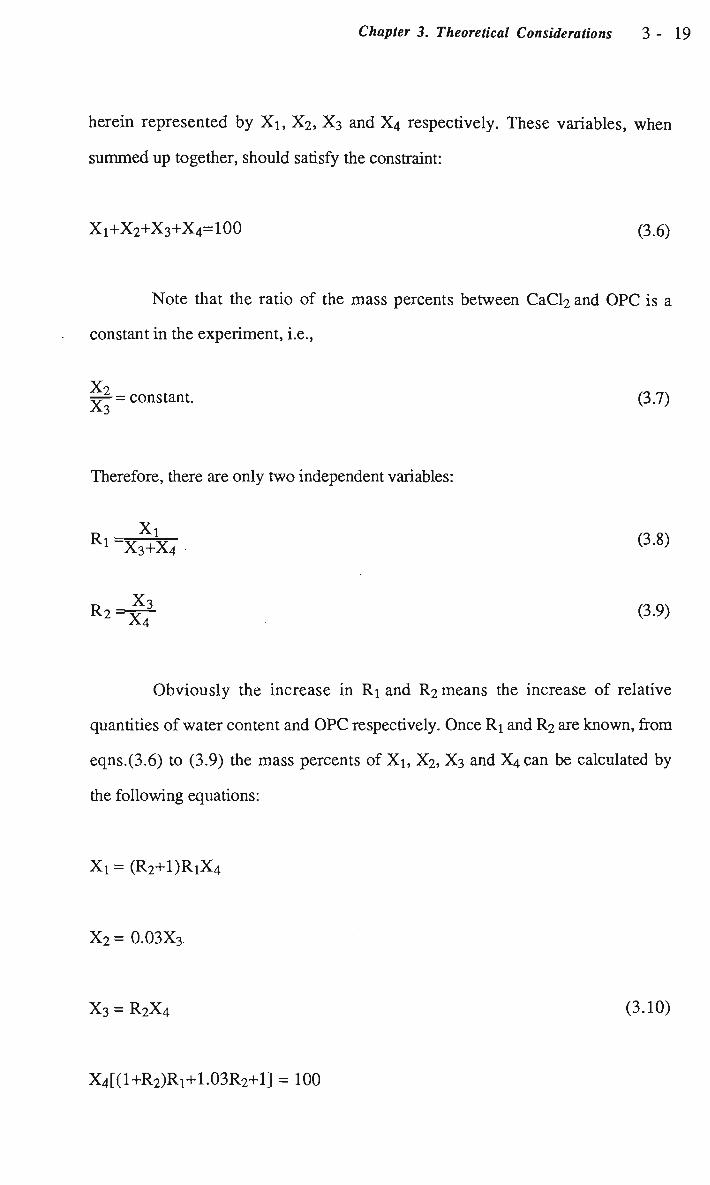
Chapter 3. Theoretical Considerations 3 - 19
herein represented by Xi, X2, X3 and X 4 respectively. These variables, when
summed up together, should satisfy the constraint:
Xi+X2+X3+X4=100 (3.6)
Note that the ratio of the mass percents between CaCl2 and OPC is a
constant in the experiment, i.e.,
X? TT*-= constant. (3.7)
Therefore, there are only two independent variables:
Xi ~X3+X4
x3
(3.8)
(3.9)
Obviously the increase in Ri and R2 means the increase of relative
quantities of water content and O P C respectively. Once Ri and R2 are known, from
eqns.(3.6) to (3.9) the mass percents of Xi, X2, X3 and X,can be calculated by
the following equations:
Xi = (R2+l)RiX4
X2 = 0.03X3
X3=R2X4 (3.10)
X4[(l+R2)Ri+L03R2+l] = 100

Chapter 3. Theoretical Considerations 3 - 20
The strength of a mix is therefore a function of Ri and R2, which can only
be determined empirically. For convenience, the form of the empirical function was
chosen as:
S=k-RimR2n (3.11)
where k, m and n are unknown parameters, which will be determined from the fit of
eqn.(3.11) to measured data. A s mentioned earlier, the strength of a mix at any
given curing time can be calculated by eqn.(3.5). However, the strength at the
curing time of 28 days is usually used as a standard. Therefore, the dependence of
the strength at 28 days on the compositions of a mix will be discussed, and this is
then compared with that at infinite curing time, the final strength. The data used for
the calculations have been included in Table 3.1.
As eqn.(3.11) can be rewritten as:
InS = lnk+m.lnRi+n.lnR2 (3.12)
the values of parameters k, m and n can then be obtained by linear regression. The
strength of a mix at 28 day curing time and its final strength can be calculated by
eqns.(3.13) and (3.14) respectively, the correlation coefficients of which are 0.984
and 0.980 respectively. It is obvious from Figure 3.12 that both the calculated and
measured strengths are in good agreement
S28d = 2.776-Ri'2-313R2
L597 (3.13)
Snnai = 4.486-Rf2-238R2 (3.14)
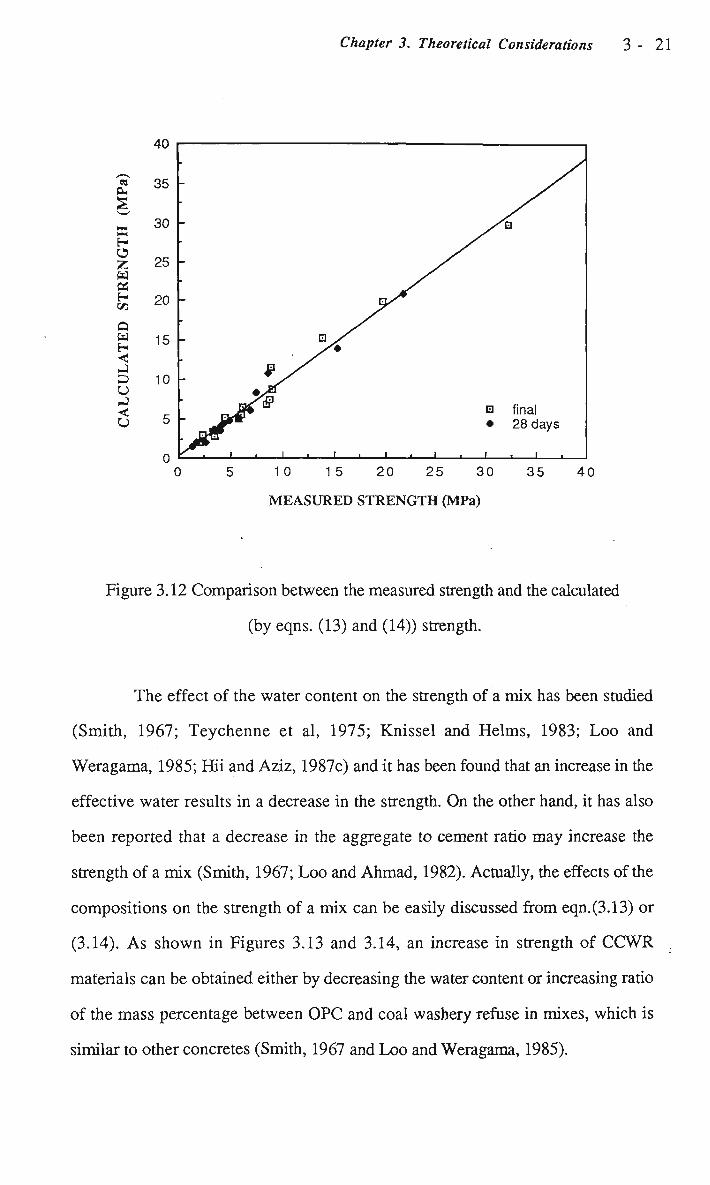
Chapter 3. Theoretical Considerations 3 - 21
03
te
X t-
te CM
Q te H <C te U te «<! U
10 15 20 25 30 35
MEASURED STRENGTH (MPa)
40
Figure 3.12 Comparison between the measured strength and the calculated
(by eqns. (13) and (14)) strength.
The effect of the water content on the strength of a mix has been studied
(Smith, 1967; Teychenne et al, 1975; Knissel and Helms, 1983; Loo and
Weragama, 1985; Hii and Aziz, 1987c) and it has been found that an increase in the
effective water results in a decrease in the strength. On the other hand, it has also
been reported that a decrease in the aggregate to cement ratio may increase the
strength of a mix (Smith, 1967; Loo and Ahmad, 1982). Actually, the effects of the
compositions on the strength of a mix can be easily discussed from eqn.(3.13) or
(3.14). As shown in Figures 3.13 and 3.14, an increase in strength of CCWR
materials can be obtained either by decreasing the water content or increasing ratio
of the mass percentage between OPC and coal washery refuse in mixes, which is
similar to other concretes (Smith, 1967 and Loo and Weragama, 1985).

Chapter 3. Theoretical Considerations 3
0.35 4
Rl ( water > ^ OPC+CWR '
Figure 3.13 Final strength contour plots.
0.24
OPC+CWR Figure 3.14 Contour plots for 28 day strength.
Chapter 3. Theoretical Considerations 3 - 2 3
However, it should be pointed out that the "interaction" between Ri and R2
can not be ignored. For example, as shown in Figures 3.15 and 3.16, a decrease in
Rl can result in a significant change in the strength when R2 is large but not much
change when R2 is small; and the effect of R2 on strength is also dependent on the
value of Ri (see Figures 3.17 and 3.18).
3.4 APPLICATION OF THE EXPERIMENTAL DESIGN WITH
MIXTURES
Response surface methodology was developed by Box and his colleagues
(Box and Wilson, 1951; Box, 1954; Box and Youle, 1955; Box and Hunter, 1957)
to explore relationships such as those between the yield of a chemical process and
the pertinent process variables. In its usual form, response surface methodology
exploits the relationship between a response variable and a set of input variables
over a current region of interest. Since its introduction in the early 1950's, response
surface methodology has become an acceptable and widely used set of concepts and
techniques.
However, unlike the usual response surface problem where the
concomitant variables represent quantitative amount, in the mixture problem the
components represent proportions of a mixture or composition. These proportions
must be non-negative and if expressed as fractions of the mixtures, they must sum
to unity. For example, suppose there are n components in the system under study.
If the proportion of the i'th component in the mixture is represented by Xi, then:
Xj>0 (Ki<n), £Xi=l (3.15) i=l

Chapter 3. Theoretical Considerations 3
tfi
a oo cs
cs te
s S H
z te
OS H c/a
0.12 0.14 0.16 0.18 0.20 0.22 0.24
R 1 , water , V OPC+CWR }
Figure 3.15 The dependence of the strength on Rl for different R 2
(28 day strength).
te <
z a CH
S X
CJ
z te Cs,
H C/3
0.12 0.14 0.16
Rl(
0.18 0.20
water
0.22 0.24
) OPC+CWR
Figure 3.16 The dependence of the strength on Rl for different R2
(Final strength).
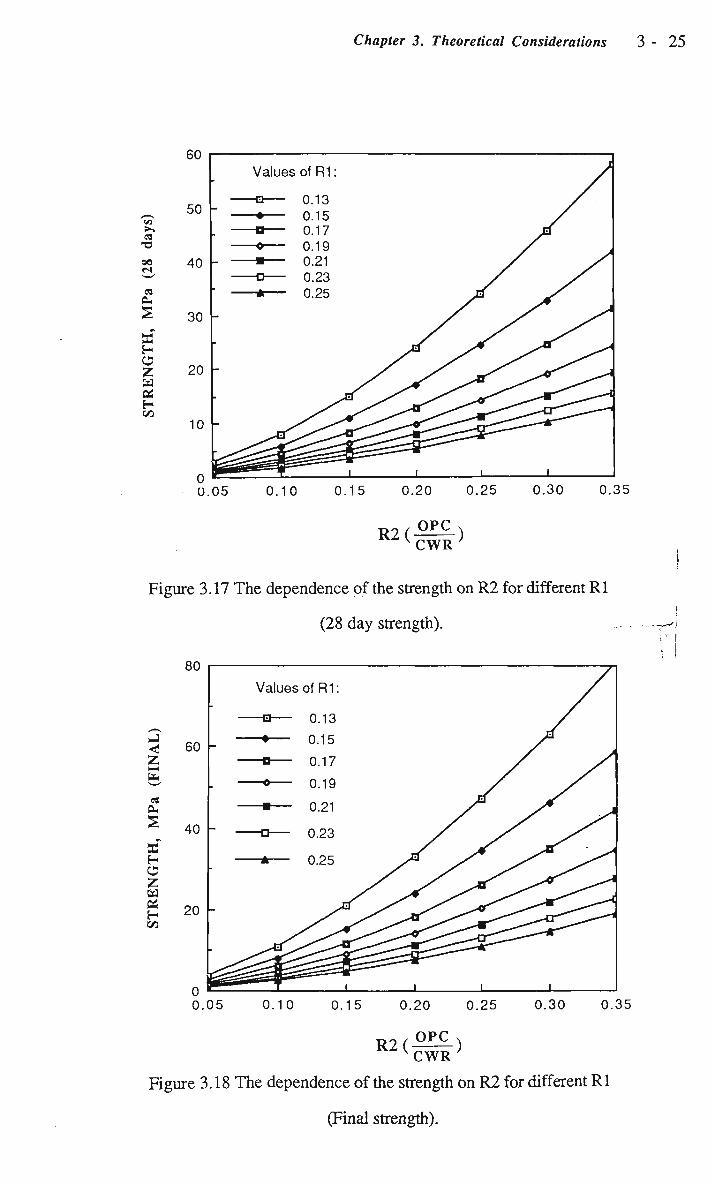
Chapter 3. Theoretical Considerations 3
cn >s 03 •o 90
<s OS
te
S
O Z te CM
H C/3
0.05 0.10 0.15 0.20 0.25 0.30 0.35
R2(cw¥}
Figure 3.17 The dependence of the strength on R 2 for different Rl
(28 day strength).
te <
Z hM
te te
X H O Z te CM
H C/3
0.35
R2( CWR
Figure 3.18 The dependence of the strength on R 2 for different Rl
(Final strength).

Chapter 3. Theoretical Considerations 3 - 2 6
A mixture experiment is an experiment in which the response is only a
function of the proportions of the components (constituents) present in the mixture
and is not a function of total amount of the mixture. The general purpose of mixture
experimentation is to make possible estimates through a response surface
exploration of the properties of an inter-multicomponent system from only a limited
number of observations. These observations are taken at preselected combination of
the components (resulting in the mixture) in an attempt to determine which of the
combination in some sense maximize the response.
Since the proportion Xi could be a unity, a mixture may be considered as
entirely being consisted of only one component Claringbold (1955) made use of
the fact that the design region for mixture is the (n-1) dimensional simplex. Rather
than transforming components, Scheffe (1958) suggested modifying the usual
polynomial model in the Xi's to reflect the restrictions (3.15). Since then, as
reviewed and summarized by Cornell (1981) great progress has been achieved and
various experimental designs with mixtures have been proposed.
As discussed above, the design of CCWR materials is obviously one of the
problems encountered in the experimental design with mixtures. To date the
optimum design of C C W R materials is still based on the empirical approach.
Considering the experimental cost and the time spent, one is naturally prompted to
enquire whether there are any method which may cost you less and give you an
immediate understanding of the effects of the compositions on the strength or other
properties of mixes. It is postulated that the theory of experimental designs with
mixtures can solve this problem. The present approach, though the experimental
design has not been directly used, could be regarded as a successful example of the
response surface methodology.

Chapter 3. Theoretical Considerations 3 - 2 7
3.5 DEVELOPMENT OF A NEW YIELD FUNCTION FOR CCWR
MATERIAL
The development of powerful finite element codes for analysing the
stability of underground pack structures has very much stimulated the interest in
constitutive laws for pack materials. At present, a considerable number of models
such as the Drucker-Prager model (1952), and the Hoek and Brown model (1982)
can be used to describe the strength and yield characteristics of pack materials under
different loading conditions. Complex models such as those due to Pramono and
Willam (1989) and Chen and Buyukozturk (1985) have also been developed.
However, these models require complex experiments to determine the model
parameters.
Based on the results of routine material strength tests (Hii and Aziz,
1987a), a logarithmic yield function which has been used by Tong and W u (1985)
to simulate the load-deformation behaviour of soft rocks is proposed for predicting
the strength and yield characteristics of C C W R materials. The procedure for
determining the parameters contained in the yield function is shown in Sections
3.5.1 and 3.5.2. It has been demonstrated that the proposed logarithmic yield
function can predict the strength and yield characteristics of C C W R materials in a
satisfactory manner.
3.5.1 General form of the yield function
The general form of the proposed yield function can be expressed as
follows:
o^ = A + B ln( a 3 + C ) (3.16)

Chapter 3. Theoretical Considerations 3 - 2 8
where
o~i= major principal stress;
03 = minor principal stress; and
A, B, C = parameters to be considered by experiments.
3.5.2 Determination of parameters in the yield function
A numerical procedure has been developed to determine parameters A, B
and C in the proposed yield function (eq.3.16). This procedure minimizes the error
between the predicted and measured triaxial strength values. The error can be
expressed as follows:
Q = Xki(a3i)-oli(o3i) =F(A,B,C) (3.17) i=i
where
a3i = minor principal stress;
°H (a3i) = predicted major principal stress under minor principal stress
rj3i condition;
* G1 i (a3 i) = experimental major principal stress under minor principal
stress 0~3i condition; and
N = number of triaxial tests.

Chapter 3. Theoretical Considerations 3-29
To minimize the error Q, let
3Q 3Q 3Q
dA dB ac = 0 (3.18)
Substitution of eq.3.16 into eq.3.18 produces:
N A + (zin( a3i+ C ))B = Ilau (3.19a)
(Eln(a3i+ C )]A + (sin2 (o3i+ C )jB = Eln( o-3i+ C ^ (3.19b)
rj3i+C I A + A*3i+Cf
\ °3i+C B = Z
o3i+C a li (3.19c)
From eqs.3.19a and 3.19b, parameters A and B can be expressed as:
A(C) = (B1A22-B2A12)i 1 A
(3.20a)
B(C) = ( B 2 A 1 1 - B 1 A 1 2 ) — 1 A
(3.20b)
where
A n=N;
A12=Lln(a3i+C);
A22=Eln2(a3i+C);
B r ^ l j ;

Chapter 3. Theoretical Considerations 3-30
B2=Zln(a3i+C)ali ; and
T4=(A11A22-Ai2A12)"1.
Substituting eq.3.20 into eq.3.19c and rewriting the equation, we can
obtain:
/
F(C) = | Z — ^ — |A(C) + G3[+C
i \._, ^M^i+c) z-V a 3 i + C I
B(C)-Z ' 1 *
G3 i+C on\ (3.21)
By using a numerical procedure, the value of C can be evaluated from
eq.3.21. Once C is determined, A and B can be computed using eq.3.20.
3.5.3 The procedure for the computation of parameters A, B and C
The procedure for the computation of parameters A, B and C is listed as
follows (see Figure 3.19):
(1) select Ce > C0, which satisfies F(C0>F(Ce) < 0;
(2) let D = Ce - C0, if D < Eps, then GOTO (4);
(3) let Cm = C0 + (D / 2), if F(C0)-F(Cm) < 0, then
Ce = On, otherwise C0 = Cm, then GOTO (2);
(4) let C = C0 + F(C0)-D / (F(C0) - F(Ce)); and
(5) compute the values of parameters A and B using eq.3.20.
where Eps denotes the allowable tolerance.

Chapter 3. Theoretical Considerations 3 - 31
C Start }
1 Select Ce > Co, and F(Co) F(Ce) < 0
Yes
Cm = Co + D/2
C = Co + D.F(Co)/{F(Co)-F(Ce)}
I Calculate A, B
( Stop j
Figure 3.19 Flow chart for logarithmic yield function program.

CHAPTER FOUR
EXPERIMENTAL INVESTIGATIONS

Chapter 4. Experimental Investigations 4 - 1
CHAPTER 4
EXPERIMENTAL INVESTIGATIONS
4.0 INTRODUCTION
The main purpose of the experimental investigations is to develop a fill
material, which utilizes C W R , for strata control in Australian underground coal
mining operations. C W R is currently being developed as a fill material in many
countries. Previous works by Knissel and Helms (1983), Atkins et al. (1984,
1986, 1987), Singh et al. (1985), Thomas (1986), Sleeman (1987), Zadeh et al.
(1987), Bros (1987), Ruban and Shpirt (1987), Leininger et al. (1987), Senyur
(1989), Thomas et al. (1989) andothers have provided information on the
properties and utilization of coal mining wastes with or without cement and various
additives. However, only a few data on the mechanical properties and behaviour of
C C W R material containing minus 1 0 m m C W R have been published.
Experimental investigations have been undertaken to study die mechanical
properties and behaviour of C C W R material. The mechanical properties evaluation
of C C W R material is an important step in the development and utilization of C W R
for strata control in Australian underground coal mining operations. In order to
determine the mechanical properties of C C W R material, a computerized strength
testing system capable of high speed data acquisition and further data processing is
being developed (Hii and Standish, 1989, Hii and Aziz, 1989). The methodology
and the strength testing system were tested prior to experimental investigations.
These tests were designed to investigate and ensure that reliable results could be
obtained from the strength testing system. A generalized approach to the analysis of

Chapter 4. Experimental Investigations 4 - 2
the deformation properties of C C W R material has been developed which permits an
integrated analysis of geotechnical measurements in the development of C C W R
material. The following sections detail the development of the experimental method
used in the experimental programme.
Details of a set of standard quantities and conditions used in the preparation
and the testing of C C W R material specimens are presented in mis Chapter.
4.1 Material Used in the Experiments
Type A Portland cement, minus 10mm CWR and calcium chloride set
accelerator were used in making the test specimens. Each of these materials will be
described in details in the following sub-sections. Other materials used for the
purpose of calibrating the flow-tube, used in the flow experiment, were four oil
samples (details of the flow experiment are given in Section 4.6). The four oil
samples were obtained from the Research and Development Department of Ampol.
The gradings and physical properties of oil samples are presented in Table 4.1.
4.1.1 Sampling and collection of CWR
A selected CWR (from the coal washery, West Cliff Colliery, Appin,
N S W , Australia) is the major constituent of the test specimens. A model of West
Cliff coal washery is shown in Figure 4.1. Sampling of the coal washery refuse
took place on seven consecutive weekdays. Samples were taken three to four times
a day by stopping the refuse conveyor belt and taking the C W R from a suitable
length by the full width of the conveyor belt as illustrated in Figure 4.2. Care was
taken to retain any fine C W R by scraping or otherwise removing it from the
conveyor belt and adding it to the sample. The sampling operations were conducted

Chapter 4. Experimental Investigations 4 - 3
—
i
£ • li
li Li, |j
•
V IJ A
jn
"|1J l~i
I H*1 /
Figure 4.1 Model of West Cliff coal washery.
Figure 4.2 Collection of C W R sample.

Chapter 4. Experimental Investigations 4 - 4
with the aim to ensure that the samples obtained represent, as far as possible, the
true nature and condition of the bulk of coal washery refuse from which they were
drawn.
Table 4.1 Physical properties of oil samples.
Sample Type
80 S N
500 S N
160 BS
190/210 P
Viscosity •
@ 100 °C
(cSt)
3.35
10.35
31.91
40.68
Viscosity •
@40 °C
(cSt)
14.03
88.55
488.60
1339.00
Viscosity
Index®
110
98
96
39
• Tests conducted in accordance with A S T M D445.
® Tests conducted in accordance with A S T M D567.
4.1.2 Processing of CWR
The sample-increments collected were re-combined to form bulk samples,
then reduced by sample division to form the samples which were sieved through a
standard lOrnrn sieve. The oversize C W R was passed through a small jaw crusher
and the crushed C W R was re-screened. The oversize material was rejected (this
constituted some 15.0% of the feed but could be reduced by more extensive
crushing in practice). The processed C W R was then used for making the test
specimens. The main purpose of processing the C W R was to produce a minus

Chapter 4. Experimental Investigations 4 - 5
1 0 m m product which was necessary for the ultimate placement by pneumatic and
high-density hydraulic conveying.
4.1.3 Grain size analysis of CWR using mechanical method
The grain size analysis was performed in accordance with AS 1289 C
6.1-1977 standard method of sieving analysis to determine the relative proportions
of different grain sizes which made up a given mass of the CWR. It is realized that
the sample is actually a statistical representation of the mass of the CWR. However,
it is difficult to determine the individual sizes of CWR. It is, therefore, cautioned
that the test can only bracket the various ranges of sizes. Figures 4.3 and 4.4 show
typical grain shapes of West Cliff CWR.
Figure 4.3 Typical grain shapes of West Cliff C W R

Chapter 4. Experimental Investigations 4 - 6
mnli JJJLUJIJ uiwliuli JJL U U I I f. I! I I II! liiiliiilmlmlmlmmiliimiil
Figure 4.4 Grain shapes of West Cliff C W R .
Figure 4.5 shows the grain size distribution curves of the processed CWR.
The relative density of the processed CWR was measured using Beckman Model
930 air comparison pycnometer and found to be 2.31. This value is comparable to
that obtained by Thomas (1986) for a different sample where the relative density
was found to be 2.54, also measured using Beckman Model 930 air comparison
pycnometer.
4.1.4 X-ray diffraction analysis
Chemical composition analyses of West Cliff C W R were carried out with
the help of the staff in the Departments of Geology and Chemistry, The University
of Wollongong.

Chapter 4. Experimental Investigations 4 - 7
O
< ft-
W
E-Z
w u f-M
GRAIN SIZE (mm)
Figure 4.5 Grain size distribution curves of the processed coal washery refuse.
4.1.5 Ordinary Portland cement
Type A Portland cement used in the making of C C W R material specimens
was supplied by Blue Circle Southern. An attempt has been made to find the
moisture content of the Portland cement, however, the results revealed that the
cement was very dry. The chemical and rnineralogical compositions of Type A
Portland cement is shown in Table 4.2.

Chapter 4. Experimental Investigations 4 - 8
Table 4.2 Chemical and mineralogical compositions of Type A Portland cement
Chemical
Si02
A1203
Fe203
CaO
M g O
S03
Loss on ignition
Free CaO
Insoluble residue
Sulphuric Anhydrite
Compositions
22.2%
4.8%
4.2%
64.9%
1.1%
2.9%
1.2%
1.1%
0.0%
2.9%
Mineralodcal comr>ositions
C3S 64.0%
C2S 10.0%
C3A 6.0%
C4AF 13.0%

Chapter 4. Experimental Investigations 4 - 9
4.1.6 Calcium chloride
The set accelerator used was 959 calcium chloride. The specification of
959 calcium chloride is detailed below.
959 calcium chloride, dried.
3-8 mesh.
CaC12 = 110.98
Assay 85.0% min.
Maximum limits of impurities.
Sulphate S 0 4 = 0.05%
Iron Fe = 0.02%
Merck Art 2382, a high grade calcium chloride-2-hydrat krist was also
used, in a view to determine more accurately the mass percentage of the set
accelerator used in the mix formulation. The specification of Merck Art 2382
calcium chloride-2-hydrat krist is detailed below.
CaC12.2H20
PH
So4
N
Pb
Fe
Mg
Sr
Ba
K
min 99.5%
4.5-6.5
max 0.005%
max 0.005%
max 0.0005%
max 0.0003%
max 0.005%
max 0.05%
max 0.003%
max 0.01%
(M = 147.02 g/mol)

Chapter 4. Experimental Investigations 4 - 1 0
4.2 OUTLINE OF THE EXPERIMENTAL PROGRAMME
The experimental programme was conducted in six series of tests which
are listed chronologically as series I, II, III, IV, V and VI in Table 4.3. All pouring
and batching details of CCWR material specimens are presented in Table 4.4. In
addition, series VII experiments were conducted to determine the influence of water
content on the flow properties of West Cliff CWR. Test procedures for the test
series are detailed in Sections 4.3 through 4.9. Test procedures for test series I, II,
HI and IV have been reported in details (Hii and Aziz, 1986). Tests in series V were
carried out generally to AS 1012.13/Amdt 1/1986-12-05 - Method for the
Determination of Drying Shrinkage of Concrete.
Series I experiments were on unconfined compressive strength tests of
CCWR material specimens with both lengths and diameters of 102.5mm. Series n,
III and IV experiments were on indirect tensile strength tests, triaxial strength
(confined compressive strength) tests and unconfined compressive strength tests
respectively of CCWR material specimens with the standard NX size. Series V
experiments were on the effect of water content on the drying shrinkage of CCWR
material and are reported in section 4.7. Series VI experiments were on the
influence of geometry on the strength and the elasticity of CCWR material models
and are reported in section 4.8.
Test series I was designed to investigate the strength development with
respect to time under uniaxial stress conditions of mixes of minus 10mm West Cliff
CWR, calcium chloride set accelerator and Portland cement. The objective of this
study was to determine the strength and characteristics of the formulated mixes and
to access their suitability for application in strata control under Australian coal
mining conditions.

Chapter 4. Experimental Investigations 4 - 1 1
Tests in series II, in and IV experiments were undertaken to develop a
new yield function which can predict the strength and yield characteristics of
C C W R material in a satisfactory manner. The proposed logarithmic yield function
may be used to simulate the load deformation behaviour of C C W R material. Results
generated from these three experiments can also provide valuable geotechnical data
of C C W R material which are much needed for the design of C C W R pack
structures.
Series V experiments were conducted to study the effect of water content
on the drying shrinkage of C C W R material specimens. The objective of this study
was to quantify the effect of water content, if any, on the drying shrinkage of
C C W R material.
Series VI experiments, which were initiated after series I through V had
been completed, were conducted to study the effect of geometry on the strength and
elasticity of C C W R material. This is a relatively new development in pump packing
material research. A special set of moulds were designed to complete these
experiments.
Series VII experiments were conducted to determine the optimum water
content for flowability of coal washery refuse. The study is detailed in Section 4.8.
All experimental results are evaluated in Chapter five.

Chapter 4. Experimental Investigations 4-12
Table 4.3 Summary of tests.
Test Series Description of Tests Experimental Total No.
Measurements of Tests
Unconfined compressive Force, axial and
strength tests. lateral displacements. 365
I (Specimens with both
lengths and diameters
of 102.5mm).
Indirect tensile strength Force and
II tests. (The discs were displacement 42
5 6 m m in diameters and
2 9 m m thick).
Triaxial tests. Force and
DI (Specimens with lengths displacement 44
and diameters of 113mm
and 56mm).
Unconfined compressive Force, axial and
strength tests. lateral displacements.
IV (Specimens with lengths 30
and diameters of 113mm
and 5 6 m m respectively).
Drying Shrinkage tests.
V (Prisms 7 5 m m x 7 5 m m Length. 24
x approximately 285mm
long).
Unconfined compression Force, axial and
strength tests. lateral displacement
(Specimens with a height
VI of 150mm and diameters 19
of 55.5mm, 75.5mm,
102.8mm, 149.5mm,
206mm, 242mm and 314.5mm)

Chapter 4. Experimental Investigations 4 - 13a
cx
s i &>: y -a •5" &
S S est U £.
2 « •3
£ £ < •a
W T) .s
Q ^ U
* i J P C/3 2 U
ts o
2 Q s
>N 00
s s
Q
bO
bo
bo
C o
a 6 o U a a
S U
bo
Q .cs s2
CN
r-
tf vO
r-
tf Tt"
in
o oo
(N m
in 00 ON
oo o Ov
VO CS
r-tf
in
o cs'
vo Ot VO
ON
o cs
o ON VO
r-
CO
u
q r-H
^ H
1-H
q in r-H
CS T-H
q i-H
oo l-H
q vd T-H
q cs
"1 vd
q cn
q d cs
Ov
d
q T-H
vq t-H
q cs
oo cn \o m
in vq
tf
o d r-(N
t~H
cn
in
q cn
cn
oo r—t
tf d <N (N
VO Ov cn cs
r-; in cn T-H
p-ON
tn
tn t-; Ov
Ov
i — i
vq r-H
cn > — t
o
cs »-H
tn oo vo
VO
d 00
u VO
3
VO CS m <s
CS
ON CS
ON
cn tf
in oo tf <s
cn cs Ov CS
vo in
m CS
o ©
m r-
o in
o in
o vn
oo oo in o
5 cs VO
in cs in tf
o cn r-cn
m 00 (N cs
VO o r-Ov
cn 00 cs 00
co
tf-in Tt
00 t-(N in
o o o o VO VO OO iX 1
1—1
cn
oo <s"
Ov O
r-cn tf O o o in tf
VO 00 00
1
vo
cn P~; cn
p-
a in tf o o o
5 vo 00 oo
1
Ov
ON cn"
o O o NO
tf-ON O N
r» r~ • t f
VO
oo oo T-H
cs
1—1
oo tf"
Ov VO in tf
o o o oo tf
NO 00 00 1
m cs
00
tf"
r-T-H
r-r-tf o o o o <n
00
d T—1 1
00
VO cs cs'
e'en Ov VO • t f
o o o 00 tf c-
1
o
tf 1—(
cs VO

Chapter 4. Experimental Investigations 4 - 13b
Hi
O <D w
>-< Vs ii -S2 ^
a a -a SM
8
T3 U
T3 .5
—i O
O T3 on
s ? | 5 «« 2
U 3 rf
§
bO
2 ° s bO
s s
u
o cs
"tf cs'
r-oo CN
Ov <N in
ON cs' NO
oq in
cs
cn tf m
q d ON
cn cs
o cs
o
r-
cn in
cs cn vo
cs vd cs
m oo
cs cs
vO
»n vd
cs
00 (TS cs
00 tf-" cn cs
vq cn vo tf
U
q d
Ov
ON
oo
VO
d vo
vO 00
r-• t f
CN
u
in
cs <N
cn
q ON
cn
cn in
cs m
o
in
q d ON
in
oo
in
co
in cs ON
«n
<n tf cs
vq cs
m vd
tf cn cs
o
cn cn"
cn vd
Ov cs cs
in cs ON
«n VO
tf CS
<N
q tn
r-OO Ov tf CS
m cn vo
00 00
,-. \o
tf in cs
o o
o o
in cs
in cs
m r-
m t—
>n tf
r-cs 00 r—
cs cs cs vo
cs tf 00 cn
vo t— 00 cn
vo c-— H
*-*
tn oo
o cn cs
VO c— 00 00 tf
o o o o in
t~-oo
1
o 1
cs
00
cn
cs'
r— in ON OO tf:
o o o o in
t~-00
d l-H
OO cs
ON
cn ON
tf
t-Ov r-"tf >n
o o in c-~ m
r-00 i-H
t-H
o\
o
cs cn cn"
in in in cn tf
O o o *£> tf
r-00 •—1
1—1
cn
t-H
t-H
in in
00 oo m r-tf
o o o o in
r~ oo r—1
i-H 1
in
cs
o NO tf
i—I
o oo r» • t f
o o o o in
r-oo t-H
I-H
4 cs cn
O f-CS
O o o o cs
T-H
r-T-H
m cs
00 oo
t Ov r1-cs
* tf
PH
e in
D m &
C <D
6 "Cv CL)
P . X ii 73 > o
o in ii 4-1
o e ii
u
on
•c in
O
n, *

Chapter 4. Experimental Investigations 4 - 1 4
4.3 EXPERIMENTAL EQUIPMENT
Measurements and the correct explication thereof are an essential part of
any engineering research and development programme. The measurements must
supply reliable information and their meanings must be correctly comprehended.
Material property determination using laboratory tests plays a vital role in this
research. The successful application of the science of solid mechanics to the
practical problems of pack design requires the acquisition and reduction to usable
form of large amounts of laboratory data.
In order to facilitate the development and utilization of CWR for strata
reinforcement in underground coal mining operations, a computerized strength
testing system capable of high speed data acquisition and further data processing
has been developed. Computer programmes, written in BASIC, have been
developed to control the measurement system and the data logging process, and to
facilitate data processing, printing and plotting of test results all with less risk
errors. One of the unique features of the language is the incorporation of block
structures and the ability to create functions and procedures. BASIC can also handle
interrupts within a program, which provides a powerful real-time capability. The
mechanical measurement tests performed on this automated system have
demonstrated that, it is highly reliable in use.
4.3.1 Strength testing system
The servo-controlled strength testing system, Figure 4.6, consists of five
units:
(i) a reaction loading frame,
(ii) an electronic control console,

Chapter 4. Experimental Investigations 4 - 1 5
(iii) a hydraulic power pack,
(iv) a LVDT strain measurement rig and/or strain gauges, and
(v) a HP 3054A automatic data acquisition and control system.
Upper] Grip
Lower Grip
Grip Manifold
Actuator
Load
Specimen
Servo Valve
Electric Box
LVDT Transducer
Figure 4.6 The servo controlled stiff testing machine.
4.3.2 Instron 8033 testing machine
A n Instron 8033 servo-controlled stiff testing machine is used in this
testing system. This machine is microprocessor controlled and a simple keyboard
serves as the interface with the operator. Magnetic tape cassettes are used to load
the test programmes. The Instron 8033 is capable of applying compressive and
tensile loads of 500KN over a working stroke from minus 75mm to plus 75mm
with an overall system stiffness greater than 1060 KN/mm. The control console
provides the necessary feedback control to enable closed-loop servo-controlled

Chapter 4. Experimental Investigations 4 - 1 6
testing to be performed. The program controls the microprocessor to process data,
and to control the flow of information to and from memory and input/output
devices as shown in the block diagram in Figure 4.7.
UP DEMAND
HYDRAULIC
SUPPLY
SUMMING JUNCTION
ERROR- >-cH ERROR AMHJFIER
ERROR AMPLIFIER
SIGNAL CONDITIONER EXCTTATION POSITION FEEDBACK
CONTROL CONSOLE
SERVO VALVE
OSCILLOSCOPE X-Y
PLOTTER
ACTUATOR
PISTON
LVDT posmoN TRANSDUCER
Figure 4.7 A closed loop servo block diagram.
The load cell, type 2518-110, which is employed in this machine has been
tested for accuracy and linearity on a suitable calibration device, which in turn has
been certified by the National Physical Laboratory to an accuracy better than 0.05%.
The accuracy of each range of the cell has been found to equal or exceed 0.2% of
cell rated output, or 0.5% of indicated load, whichever is greater.
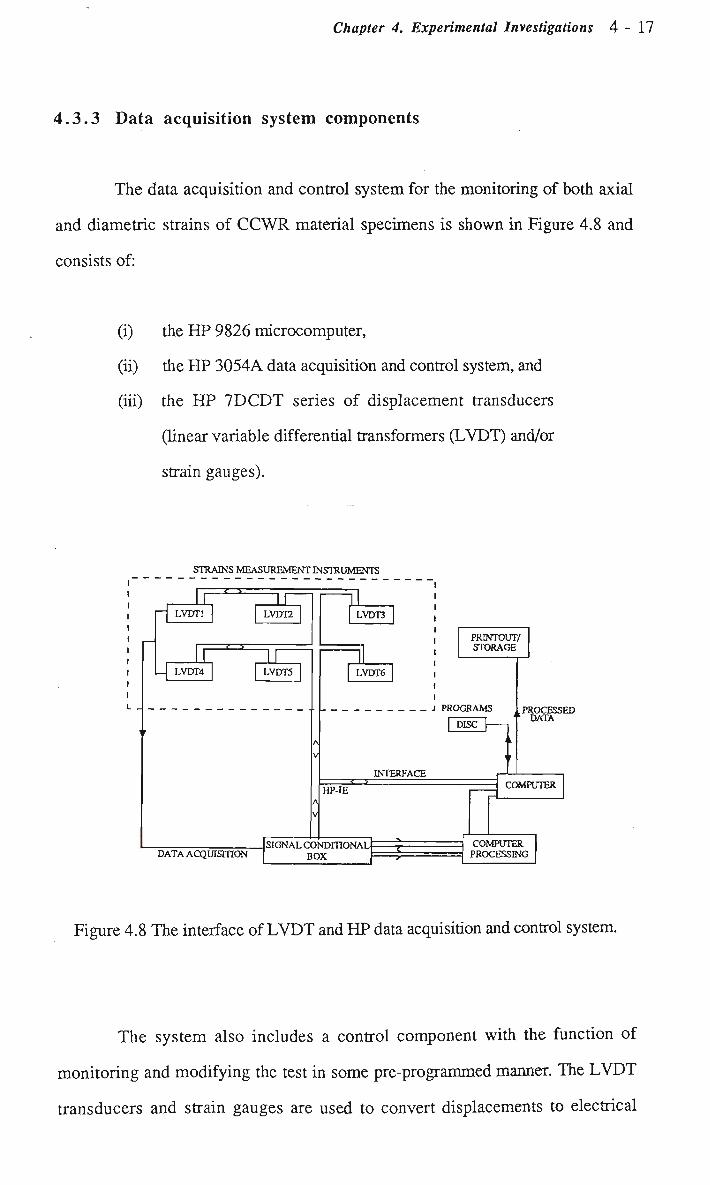
Chapter 4. Experimental Investigations 4 - 1 7
4.3.3 Data acquisition system components
The data acquisition and control system for the monitoring of both axial
and diametric strains of CCWR material specimens is shown in Figure 4.8 and
consists of:
(i) the HP 9826 microcomputer,
(ii) the HP 3054A data acquisition and control system, and
(iii) the HP 7DCDT series of displacement transducers
(linear variable differential transformers (LVDT) and/or
strain gauges).
STRAINS MEASUREMENT INSTRUMENTS
.• i
LVDT1
LVDT4
LVDT2
LVDT5
DATA ACQUISITION
LVDT3
LVDT6
PRINTOUT/ STORAGE
J PROGRAMS
DISC
HP-IE < i
INTERFACE
I ~
SIGNAL CONDITIONAL BOX
PROCESSED DATA
COMPUTER
COMPUTER PROCESSING
Figure 4.8 The interface of L V D T and H P data acquisition and control system.
The system also includes a control component with the function of
monitoring and modifying the test in some pre-programmed manner. The LVDT
transducers and strain gauges are used to convert displacements to electrical

Chapter 4. Experimental Investigations 4 - 1 8
signals. Generally, the transducer produces a change in either resistance, output
voltage, or output current which is proportional to a physical change within the
system being monitored. The H P 9826 microcomputer is the controller of the
whole system. The H P 3054A, a computer based automatic data acquisition and
control system, consists of a system mainframe 3497A and two voltmeters, the
3456A (for strain gauges) and the 3437A (for L V D T transducers). These
instruments are interfaced via HP-IB cable to the 9826 computer.
The strength tests require the application of a compressive force to the test
specimens and the measurement of one or more displacements. The need to record
both axial and diametric displacements in conjunction with specimen loading to
obtain strain data necessary to determine the elastic moduli (Young's modulus and
Poisson's ratio) led to the design and application of the L V D T strain measurement
rig. The H P 3054A automatic data acquisition and control system was used in
conjunction with the L V D T strain measurement rig constructed using six L V D T
transducers (three in the axial and three in the lateral direction). All L V D T
transducers were calibrated to determine their linear displacement constants. These
constants were included in the L V D T program to enable direct rrucrostrain values to
be obtained in the output. This L V D T strain measurement rig, is capable of
measuring both axial and diametric strains to an accuracy of + 0.5% of reading.
Several computer programs have been developed by the author to control
the data acquisition procedure for strain measurements. The L V D T program written
in H P BASIC, is used to control the 3437A voltmeter to take readings in steps.
Each L V D T transducer is sampled 30 times and the average is stored before
switching to the next transducer. Figure 4.9 shows the flow chart for the L V D T
program.

Chapter 4. Experimental Investigations 4 - 19 a
1=1+1
(" Start )
Dimension 19 arrays
i Initialize system communication
and assign system D V M
I Input File$, Title$, Date$,
N, diameter and length
I No
Set up counter: 1=4
I Read voltage
from channel I
I Store voltage from channel I
i Store voltage reading
data array position
No
Yes
Recall data; V$,Fo, from the floppy disk

Chapter 4. Experimental Investigations 4
Yes
| Area and volume] k. calculations J
I Print initial values
I Calculate stress, strain, young's modulus, poisson's ratio and stiffness
I / Print stress, N.
^/strain, Young's modulusK N. Poisson's ratio and > /
N. stiffness /
( End )
Figure 4.9 Flow chart for the LVDT program.

Chapter 4. Experimental Investigations 4 - 2 0
The recorded voltage signals are transferred to the H P 9826
microcomputer in a packed format, then converted to ASCII values. Subsequently
these ASCII values are converted to microstrain values according to calibrated
constants between voltage and displacement. Finally, an ASCII file is created to
store the data on a disk. The data can be retrieved and recombined in a variety of
ways depending on the needs, perhaps instantaneously or at any time, and
processed, printed and plotted in any desirable form.
The strain gauging technique is also employed to obtain strain data of
C C W R materials. The C C W R material specimens were instrumented with four
foil-type (Showa Nll-FA-30-120-11) strain gauges (two in the axial and two in
the lateral direction). The gauges in both directions were wired in separate series
circuits which enables automatic averaging of axial and transverse strain data. Each.
series of strain gauges was wired into a separate Wheatstone bridge configuration
for zero balancing and subsequent strain monitoring.
During the test, the specimen was loaded in the testing machine at some
preprogrammed loading rate (e.g. 0.0015mm/sec), and at the same time the load
and strains were monitored. A strain program which is also written in H P BASIC
controls the 3497A voltmeter to record readings in a step by step manner
continually; strains are monitored by measuring the associated bridge output
voltages, the magnitude of these output voltages are proportional to the specimen
strain. Figure 4.10 diagrammatically shows the interface of strain gauges and the
H P data acquisition and control system.
One of the unique features of HP BASIC language is the incorporation of
block structures and the ability to create functions and procedures. The user can
also create custom functions and procedures that extend the range of keywords

Chapter 4. Experimental Investigations 4 - 2 1
within the language as user needs dictate. H P BASIC can also handle interrupts
within a program, which provides a powerful real-time capability.
STRAINS M E A S U R E M E N T INSTRUMENTS
«* ">
STRAIN GAUGE 1
C •>
STRAIN GAUGE3
DATA ACQUISITION
STRAIN GAUGE2
STRAIN GAUGE4
PRINTOUT/ STORAGE
PROGRAMS
DISK
INTERFACE
HP-IE < •>
3054A
PROCESSED DATA
COMPUTER
COMPUTER PROCESSING
Figure 4.10 The interface of strain gauges and H P data
acquisition and control system.
4.3.4 Device dependence of strain measurements of CCWR material
specimens
Strain gauges and L V D T transducers are the two most widely used devices
for measuring the strain properties of specimens during strength testing.
Unfortunately, very little research has been undertaken to compare data obtained
from both devices on the same material. For this reason a program of work is being
attempted to correlate the strain property data obtained from both devices. The
strain property measurements on CCWR material specimens indicate that the
differences in data obtained from the two devices for the same material may, to a
significant degree, be the result of device dependence. The findings are complicated

Chapter 4. Experimental Investigations 4 - 22
by the fact that end effects have more influence on the strain values obtained using
L V D T transducers. Thus great care is needed when measuring strain properties to
minimize device dependence.
4.3.5 Experimental Apparatus for Flow Tests of CWR
This consisted of a conical funnel and the flow-tube fixed to a specially
fabricated steel frame as shown in Figure 4.11. The conical funnel from which the
flow-tube extended was used to load the test materials. The tube is made of 3 m m
thick transparent perspex with an internal diameter of 5 0 m m and length of 1.81m,
and can be adjusted to any angle up to 55°.
The perspex tube made it possible to observe the actual flow of the
material tested as it was discharged. Furthermore, for ease of cleaning, the tube is
fully detachable from the frame. The base plate of the frame is made of 8 m m thick
steel for stability.
The bottom end of the perspex tube was machined flat so that a flat block
of perspex could be manually pressed against it to form a watertight seal. After
considering many possibilities, including mechanical hinges and various valve
arrangements, this gate system was decided as the best method for a quick release
of material in the tube. A s well as being efficient, it also has simplicity and cost
advantages.

Chapter 4. Experimental Investigations 4 - 2 3
8mm THICK STEEL CHANNEL
Figure 4.11 Schematic of the flow-tube experimental apparatus.
4.4 EXPERIMENTAL PROCEDURES
4.4.1 Test specimens identification coding
In the first group, specimen 10%-1.5HRS, for example, means the
specimen had 10% of Portland cement and was tested 1.5 hours after pouring. In
the second group, specimen 10%-1-1, for example, means the specimen had 10%
of Portland cement, was tested after one day curing and was number one in a
replicate set of three.

Chapter 4. Experimental Investigations 4-24
4.4.2 Design and construction of sample moulds
The CCWR material specimens for series I experiments were poured in
specially designed and constructed PVC plastic tubing moulds with lengths and
diameters of 102.5mm. The standard NX size triaxial jackets were used to pour
CCWR material specimens for Series II, III and IV experiments. Figure 4.12
shows CCWR material specimen moulds. A special set of steel moulds with a
height of 150mm and diameters of 55.5mm, 75.5mm, 102.8mm, 149.5mm,
206mm, 242mm and 300mm were designed and constructed for pouring CCWR
material specimens for series VI experiments.
4.4.3 Sample preparation
A set of standard quantities and conditions have been used in the sample
preparation. The following techniques were used for each of the 14 batches poured.
Figure 4.12 C C W R material specimen moulds.

Chapter 4. Experimental Investigations 4-25
4.4.4 Mixing of concrete
4.4.4.1 Batch size
The batch size was over-batched by 10% to ensure an excess of material
after moulding the required specimens.
4.4.4.2 Mixer
The type of mixer used was a 0.2 cubic metre capacity, 'Bennett' motor-
driven mixer.
4.4.4.3 Charging sequence
The mixer (see Figure 4.13) was charged with materials in the
order set out below.
Figure 4.13 'Bennett' Mixer.

Chapter 4. Experimental Investigations 4 -
(i) The inside of the mixer was moistened.
(ii) The mixing drum was charged with moist CWR and part of
the mixing water. Then it was left operating for two minutes.
(iii) Portland cement was then added and the mixing time started.
The balance of the mixing water was added promptly as
required.
(iv) Calcium chloride admixture which has been dissolved in part
of the mixing water was added. The required level of this
admixture has been determined from previous tests carried
out by Thomas (1986).
(v) Final water additions were made.
(vi) Mixing was then continued for 15 minutes.
4.4.5 Pouring of CCWR material specimens
At the completion of mixing, slump test (see Figure 4.14) was performed
within 2.5 minutes. This test was aimed at measuring the consistency of the mix.
The mix was then sampled direct from the mixing pan, care being taken to avoid
segregation. The following sequence was strictly followed in each case to allow
assessment of any possible effects of non-uniformity.
1. Pour and vibrate 1.5H, 2H, 2.5H, 4.25H and 4.5H specimen.
2. Pour and vibrate 1-1, 7-1, 14-1, 28-1, 60-1 and 90-1 specimen.
3. Pour and vibrate 1-2, 7-2, 14-2,28-2, 60-2 and 90-2 specimen.
4. Pour and vibrate 1-3, 7-3, 14-3,28-3, 60-3 and 90-3 specimen.
5. Pour and vibrate the triaxial test specimens.

Chapter 4. Experimental Investigations 4 - 2 7
Figure 4.14 Slump test.
The workability of the mix determines the duration time of vibration to
compact the specimen and the surface of the specimen mix will become relatively
smooth when sufficient vibration has been applied. The duration of vibration of the
specimens on the vibrating table (see Figure 4.15) known as 'ICAL Syntron
Packer, Model VP65B', operating at a frequency of 50 H z was approximately 5
seconds for batch one, 20 seconds for batches two, three, four, five, six, nine, ten
and thirteen. Test specimens for batches seven, eight, eleven and twelve were not
vibrated because of their relatively high fluidity. All the triaxial test specimens were
vibrated for 25 seconds.

Chapter 4. Experimental Investigations 4 - 2 8
Figure 4.15 I C A L Syntron Packer, Model VP65B'
According to Thomas (1986) vibration was thought to be necessary to
produce adequate compaction of the test specimens which were much smaller than
the actual pouring dimensions in practice.
It took 25 minutes to fill and vibrate all the test specimens. Another 15
minutes was needed to level the tops of the specimens. The duration of the
preparation of specimens from start to finish was approximately one hour.
4.4.6 Curing of CCWR material specimens
At the completion of pouring and vibrating, CCWR material specimens
were cured in plastic bags to prevent dehydration. After 24 hours from pouring,

Chapter 4. Experimental Investigations 4 - 29
C C W R material specimens were demoulded with ELE Press. The specimens were
squared top and bottom and were later transferred to the humidity room for curing.
All specimens were cured at 20 °C in the humidity room, the condition of which
was the closest approximation to real mine situation.
4.4.7 Observations of the physical appearance of various CCWR
material mixes
Descriptions of various CCWR material mixes given in Table 4.5 are
reflected by the water content at pouring. They indicate the importance of water
content on the mix consistency.
4.4.8 CCWR test specimen bulk density determination
The bulk density of CCWR specimen was determined at the time of
compressive strength test and during the strength development period, and was
done in accordance with ISRM suggested method. The bulk volume of the
specimen was calculated from vernier caliper measurements. An average of several
readings for each dimension, each accurate to 0.1mm was used in the calculation of
the bulk volume.
_, „ _ . Ms + Mv Bulk Density = ^
where, Ms = Grain mass.
Mv = Mass of Void.
V = Volume of grain + volume of void.
or V = Bulk volume.

Chapter 4. Experimental Investigations 4-30
Table 4.5 Descriptions of the physical appearance of various
CCWR material mixes.
Batch
1
2
3
4
5
6
7
8
9
10
11
12
13
Cement content
15.6%
12.5%
10.0%
7.5%
5.0%
15.0%
15.0%
10.0%
10.0%
• 12.5%
12.5%
7.5%
7.5%
Water content
14.7%
13.0%
13.8%
12.6%
12.0%
12.0%
21.0%
19.1%
12.0%
16.5%
19.1%
19.0%
16.5%
Remarks
Slightly wet
Slightly dry
Good consistency
Good consistency
Slightly dry
Very dry
Very wet
Very wet
Very dry
Good consistency
Very wet
Very wet
Good consistency
4.4.9 Determination of the grain mass M s of C C W R specimens
The grain mass, Ms of CCWR specimen is defined as the equilibrium of
constant mass of the specimen after oven drying at a temperature of 105 °C (the
grain mass of CCWR specimens were determined in accordance with ISRM
suggested standard methods). After compression testing, each specimen was dried
to constant mass in an oven at a temperature of 105 °C. The dry density of CCWR
specimen was then calculated using
Dry Density = -y-
where, M s and V had been described in sub-section 4.4.8.

Chapter 4. Experimental Investigations 4 - 31
In this study, the porosity and grain density of C C W R specimen were also
determined using saturated method.
4.4.10 Method for measuring the physical properties of CCWR
specimens
Porosity, void ratio, specific gravity, bulk density and particle density of
C C W R specimens were determined using volumetric method and done in
accordance with I S R M suggested methods. The results from the measurement of
these physical properties were also used to characterized the properties and the
behaviour of C C W R material.
4.4.11 Method for determining the sound (sonic) velocity of CCWR
specimens
The velocity of ultrasonic pulses travelling in the specimen depends on its
density and elastic properties. The quality of the specimen can be related to its
elastic stiffness. Therefore, the measurement of ultrasonic pulse velocity in the
specimen can be used to indicate the quality of the specimen as well as to determine
its elastic property. Also, the sonic velocity data of C C W R specimens obtained
from this research can become a very useful and important parameter at the time of
field installation and testing of future C C W R pack structures.
During curing and before compressive strength testing of the specimen, its
sonic velocity was measured longitudinally using 'Pundit*. "Pundit' is simple to
operate and yet it can produce results with a high order of accuracy and stability. It
generates low frequency ultrasonic pulses and measures the time taken for them to
pass from one transducer to the other through the specimen interposed between
them. A simplified 'Pundit' system diagram is shown in Figure 4.16.

Chapter 4. Experimental Investigations 4 - 3 2
Tx A I— *
"Cs
r i r i i * i N V N "v \ \ \
*******
******* \ \ \ X X \ \ / t t f f f t
Rx
EHT & PULSE RECURRENCE GENERATOR
RECEIVER AMPLIFIER & STOP PULSE GENERATOR
SET REF DELAY
start
10 MHz OSCILLATOR
reset
GATE CONTROL
GATE
DECADES
stop
Figure 4.16 Simplified 'Pundit' system diagram.
The transit time was displayed in the form of three digits on three 'in-line'
numerical indicator tubes. The range of time measurements used was 0.1 to 99.9
microsec in units of 0.1 microsec. The accuracy of the transit time measurement
was generally not less than the direct reading values indicated on the display. An
accuracy of not less than 0.5% could be achieved. Sonic velocity measurement
results for CCWR material specimens are reported in Chapter 5. Specimen weights
were recorded at the same time as sonic velocities were determined. Results from
specimen weight and sonic velocity measurements of CCWR specimens have been
reported in Hii and Aziz (1987a, 1987b).

Chapter 4. Experimental Investigations 4 - 3 3
Figure 4.17 'Pundit' sonic velocity apparatus.
4.4.12 Strength test procedures
4.4.12.1 Unconfined compressive strength tests
The unconfined compressive strength tests (series I experiments) were
conducted on C C W R specimens with both lengths and diameters of 102.5mm at
ages of 1.5 hours, 2 hours, 2.5 hours, 4.25 hours, 4.5 hours, 1 day, 7 days, 14
days, 28 days, 60 days, 90 days and 365 days after casting. At least three
specimens from each group were tested. These tests were performed to determine
the ultimate compressive strength of the specimens. A strength testing system has
been developed for testing the specimens (this strength testing system has been
described in detail in Section 4.3).

Chapter 4. Experimental Investigations 4 - 3 4
The loading plates of the L V D T strain measurement rig were clamped to
the Instron stiff testing machine and each specimen to be tested was centred
between the loading plates as shown in Figure 4.18. A spherical seating was
situated between the upper loading plate and the specimen to prevent unequal load
distribution across the flat ends of the specimen. Three axial deflection L V D T S
were adjusted to record similar initial deflections as were three lateral deflection
L V D T S . Figure 4.19 shows the L V D T strain measurement rig. The initial electrical
outputs were incorporated in the L V D T programme to compute axial and diametral
strains from these starting points.
Axial load was applied at a constant rate of deflection (0.0015 mm/sec)
until the complete failure of the specimen. Load values during testing together with
electrical outputs from the transducers were recorded at regular load intervals until
the complete load deformation curve was obtained.
The measured values were used for determining the compressive strength
of the specimen given by:
F
where 0"c is the ultimate compressive strength of the specimen (MPa),
F is the applied ultimate failure load (N), and
A is the cross-sectional area of the specimen (mm 2 ).

Chapter 4. Experimental Investigations 4 - 3 5
Figure 4.18 C C W R material specimen mounted in the L V D T strain measurement
rig during the unconfined compressive strength test.
Figure 4.19 L V D T strain measurement rig.
Chapter 4. Experimental Investigations 4 - 3 6
Progressive and ultimate compressive strength were computed using the
L V D T programme. Secant Young's modulus and Poisson's ratio of the specimen
were also computed in this manner. Complete load deformation curves for all
C C W R material specimens were obtained and these curves have been given in Hii
and Aziz (1987a, 1987b). Results of compressive strength tests of C C W R
specimens such as ultimate strength, secant Young's modulus, Poisson's ratio,
maximum stiffness, post failure modulus and residual strength have been reported
in detail in Hii and Aziz (1987a, 1987b). The specimen experimental data such as
moist density, dry density, water content, sonic velocity value have also been
reported in Hii and Aziz (1987a, 1987b).
4.4.12.2 Indirect tensile strength tests
The indirect tensile strength tests (series II experiments) were conducted in
accordance with I S R M suggested methods. The indirect tensile test rig is shown in
Figure 4.20. The tensile strength 0"t of the specimen was calculated by the
following formula:
0.636 P C t = -D7-
where at is the indirect tensile strength (MPa),
P is the applied load at failure (N),
D is the diameter of test specimen (mm), and
t is the thickness of test specimen measured at the centre (mm).
The indirect tensile test results are reported in Chapter 5.
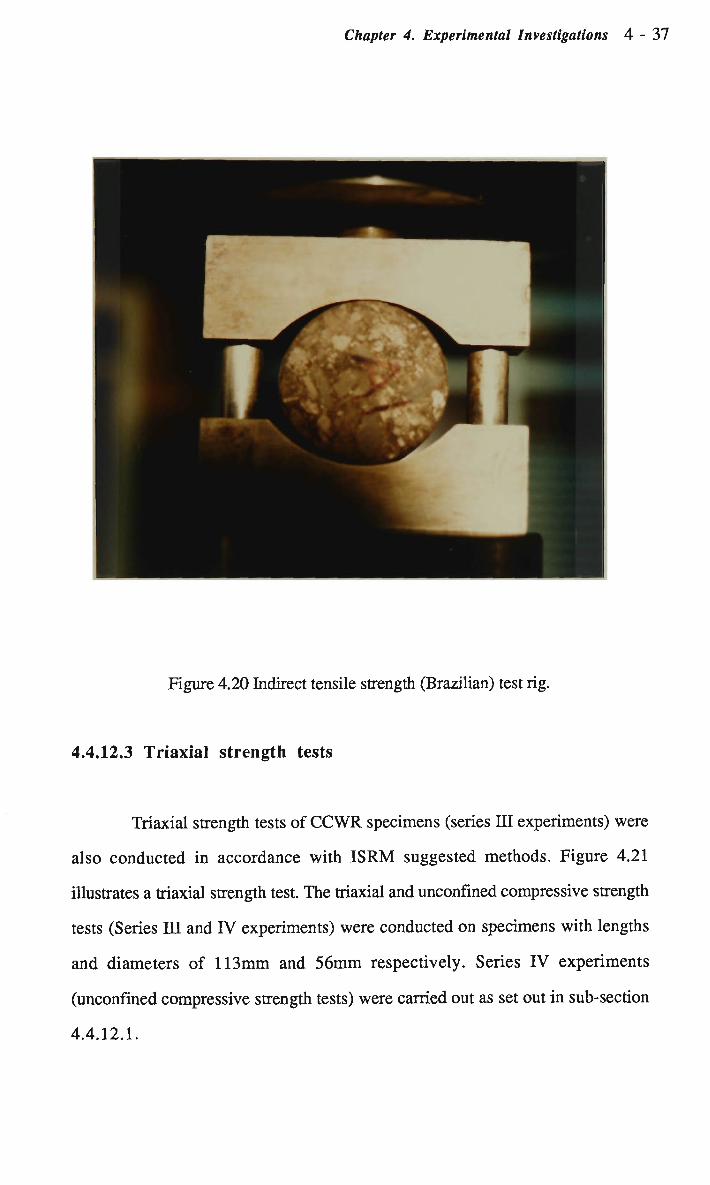
Chapter 4. Experimental Investigations 4 - 37
Figure 4.20 Indirect tensile strength (Brazilian) test rig.
4.4.12.3 Triaxial strength tests
Triaxial strength tests of CCWR specimens (series III experiments) were
also conducted in accordance with ISRM suggested methods. Figure 4.21
illustrates a triaxial strength test. The triaxial and unconfined compressive strength
tests (Series III and IV experiments) were conducted on specimens with lengths
and diameters of 113mm and 56mm respectively. Series IV experiments
(unconfined compressive strength tests) were carried out as set out in sub-section
4.4.12.1.

Chapter 4. Experimental Investigations 4 - 3 8
The conventional single point failure technique was used in all triaxial
strength tests. A confining pressure was applied to the specimen and maintained
constant at a selected level. The axial load was increased at a constant rate of
deflection until the specimen failed at peak load. This peak load was then used to
determine the cohesion strength C and the angle of friction <j> parameters of the
specimen. The experimental results of triaxial tests are reported in Chapter 5.
Figure 4.21 Triaxial cell applied to the L V D T strain rig.
4.4.13 Experimental technique for flow tests of C W R
In this study, test results from consistency measurements and flow tests
were used to characterize the flow properties of C W R with different nominal water
contents. A simple flow-tube technique was employed to quantify the flowability of
C W R . This involved the flow of a fixed quantity of C W R through the flow-tube.
The time for the fixed quantity of C W R to pass through the tube becomes a

Chapter 4. Experimental Investigations 4-39
measure of the consistence of C W R and this is known as the flow factor (FF). The
flowability of C W R is then expressed as:
F = FF"1 x 100
where F is the flowability and FF is the flow factor.
4.4.14 Testing procedures for flow tests of CCWR material
The initial flow tests were conducted to determine the slopes of the flow-
tube for the test runs. The selected slopes of the flow-tube were 38.5°, 45° and
50°. The procedure employed in the flow tests of various oil samples was carried
out in the order set out below:
(i) The flow-tube was set at the desired angle, starting at 38.5°-
(ii) The temperature of the oil sample and atmosphere was taken
prior to each run.
(iii) The flow-tube was closed at the bottom using the perspex
gate and subsequently filled to the top, that is, until no more
fluid could be added without spillage. This ensured that the
same volume of fluid was used for each run.
(iv) The bottom gate was then opened and timing simultaneously
started. All timing was done using a hundredth (1/100 th) of
a second A M F American Split-Taylor stopwatch.
(v) Run was terminated when the fixed volume of fluid had
passed through the flow-tube. The fixed volume of fluid was
deemed to have passed through the flow-tube when the wave
from the top of the flow-tube reached the bottom and
discharge into the atmosphere.

Chapter 4. Experimental Investigations 4 - 4 0
(vi) The time taken was recorded and the procedure repeated a
further four times (a total of five runs).
(vii) After five runs at 38.5°, the angle setting of the flow-tube
was increased to 45° for five more runs using the same
procedure, and finally to 50°. The flow-tube was then
cleaned and dried ready for the next series of tests.
Test runs were conducted on CWR with nominal water contents of 2%,
5%, 10%, 15%, 2 0 % , 2 5 % , 2 5 % and 30%. The procedure for the flow tests of
C W R was identical to that of the oil samples except for some additional steps as
described below:
(i) CWR of a known water content was weighed out and hence
the amount of water required to be added could be
calculated.
(ii) The temperature of the atmosphere and water to be added
was recorded.
(iii) The batch size was over-batched by 1 0 % to ensure excess of
material for the flow tests. The inside of the mixer was
moistened. The mixing drum was charged with moist C W R
and the mixing water. Mixing was then continued for 2.5
minutes. The type of mixer used was a 0.067 cubic metre
capacity, planetary action mixer.
(iv) At the completion of mixing, slump test was performed in
accordance with A S 1012, part 3-1976. The slump test not
only yielded valuable data, but also ensured that each mix
received equal compaction prior to the flow test. The flow
tests were then conducted on C W R as described before.

Chapter 4. Experimental Investigations 4 - 4 1
4.5 MECHANICAL PROPERTIES EVALUATION OF CCWR
MATERIAL
This study is an integral part of a broad research programme on the
development and utilization of C W R for strata reinforcement in underground coal
mining operations. Because the information on the mechanical properties of
C C W R material and the knowledge on the factors of influence are needed for
economical use of this material, a comprehensive laboratory test programme has
been devised to investigate the strength development of coal washery refuse as a
function of various cement mixes over a 365 day period. The study also
investigated the load deformation characteristics of C C W R material.
A set of standard quantities and conditions used in the preparations and
testings of C C W R material specimens studied have been given in Sections 4.1
through 4.4. Results from sound velocity measurements, unconfined compressive
strength tests, triaxial strength tests and indirect tensile strength tests and the
measurement of physical properties such as porosity, void ratio, specific gravity,
bulk density and particle density are used to characterize the properties and
behaviour of C C W R material. The results and analyses of these tests and
measurements are reported in Chapter 5.
4.6 EFFECT OF WATER CONTENT ON THE MECHANICAL
PROPERTIES OF CCWR MATERIAL
In many cementitious mixtures, industrial by-products such as granulated
blast furnace slag, fly ash, mine tailings and rice husk ash have been used
successfully (Mehta and Pirtz, 1978; Munn, 1979; Blunk, 1979; Berry and
Malhotra, 1980; Lerche and Renetzeder, 1984; Loo et al, 1984; Collepardi, 1988;
Mehta, 1989). More recently, the potential use of instant chilled steel slag as an

Chapter 4. Experimental Investigations 4 - 4 2
aggregate in concrete has been investigated (Montgomery and Wang, 1989). One
method is to substitute these by-products for the more expensive commercial
materials in proposed mixtures, either fully or partially.
In order to utilize CWR as a raw material for pump packing, it is necessary
to study the influence of water content on the mechanical properties and behaviour
of C C W R material because many problems are being experienced in obtaining a
consistent mix owing to the variation in products from the coal washery. T w o other
reasons for this study are, firstly, a serious problem such as shrinkage cracking can
arise frequently if the importance of water content is neglected, and secondly,
realistic experimental data of C C W R material are needed in pack design.
Series I and V experiments were undertaken to investigate the influence of
water content on the mechanical properties and behaviour of C C W R material. This
study is also a research effort on the development of C C W R material with calcium
chloride admixture to optimise particular physical properties with nominal water
contents ranging from 1 2 % to 2 1 % .
All pouring and batching details of CCWR material specimens have been
given in Table 4.4. Test procedures for test series I and V and materials used in
making test specimens have been reported in details in Section 4.1 through 4.4.
Tests in series V were carried out generally to A S 1012.13/Amdt 1/1986-12-05,
Method for the Determination of Drying Shrinkage of Concrete.
The unconfined compressive strength, modulus of elasticity, sonic
velocity, density and drying shrinkage of C C W R material were the primary
properties investigated.
The results of this investigation are analysed and discussed in Chapter 5.
Chapter 4. Experimental Investigations 4 - 4 3
4.7 A NEW YIELD FUNCTION FOR CCWR MATERIAL
In order to develop an empirical yield criterion for CCWR material, series
II, III and IV experiments were carried out. Series II, III and TV experiments
consisted of tensile strength tests, triaxial strength tests and unconfined compressive
strength tests respectively. These rountine material tests were carried out in
accordance with the I S R M Suggested Methods. Based on the results of these tests,
a logarithmic yield function is proposed for predicting the strength and yield
characteristics of C C W R material, and the parameters contained in the proposed
yield function have been determined.
A procedure for the determination of the parameters have been discussed
in Chapter 3. The logarithmic yield function program, written in F O R T R A N , has
been developed to facilitate data processing of test results and a listing of the
fundamental F O R T R A N code is given in Appendix I. The study has indicated that
the proposed logarithmic yield function can predict the strength and yield
characteristics of C C W R material in a satisfactory manner.
4.8 EFFECT OF WATER CONTENT ON THE FLOW
PROPERTIES OF CWR
The objective of this study was to determine the optimum water content for
flowability of West Cliff C W R (this has been reported in detail in Hii and Aziz,
1987c). A simple flow measuring device, called a flow-tube, was designed and
constructed for this series of experiments. West Cliff C W R with different nominal
water contents were mixed and tested using an inclined, open ended flow-tube
technique. The flow-tube used consisted of a perspex tube topped with a receiving
conical funnel and sealed at the discharge end by means of a flat block of perspex
until filled with C W R .

Chapter 4. Experimental Investigations 4 - 4 4
A series of flow tests and supplementary consistency measurements
(slump tests) were conducted to determine the influence of water content on the
flow properties of C W R . In all, 130 flow tests and 24 slump tests were conducted
to shed some light on the effect of water content on the flow characteristics of minus
1 0 m m West Cliff C W R . The results and discussion of the flow and slump tests of
C W R are presented in Chapter 5.
4.9 EFFECT OF GEOMETRY ON THE PROPERTIES AND
BEHAVIOUR OF CCWR MATERIAL MODELS
Series VI experiments were conducted to investigate the influence of
geometry on the mechanical properties and behaviour of C C W R material models.
The study focuses on the effect of the width/height ratio on the strength of the
material. The main purpose of this study is to ascertain the effect of end constraints
on the strength of C C W R material models.
CCWR material models (scale 1:15) with a height of 150mm and
diameters of 50mm, 75mm, 100mm, 150mm, 200mm, 2 5 0 m m and 300mm were
tested, simulating underground monolithic pack support with different widths in a
coal seam of uniform height. After they were cast, the C C W R material models were
cured at 20°C in the humidity room, condition of which was the closest
approximation to real mine situation.
Unconfined compressive strength, modulus of elasticity and poisson's
ratio were the primary properties investigated. The study also investigated the load
deformation behaviour of C C W R material models under the test condition.
The experimental data of the mechanical properties and behaviour of
C C W R material models are analysed and discussed in Chapter 5.

CHAPTER FIVE
EXPERIMENTAL RESULTS AND DISCUSSION

Chapter 5. Experimental Results and Discussion 5 - 1
CHAPTER 5
EXPERIMENTAL RESULTS AND DISCUSSION
5.0 INTRODUCTION
The experimental results obtained from the experiments described in
Chapter 4 are reported in this Chapter. The analysis, discussion and comparison of
the experimental results will also be presented in this Chapter.
5.1 Effect of Crushing on the Grain Size Distribution of Minus
10mm CWR
An attempt was made to study the effect of crushing on the grain size
distribution of CWR. The technique used was to perform sieve analyses on
different C W R samples and the results obtained were then studied and compared.
Firstly, sieve analysis was performed on CWR which had not been
processed. Secondly, at the completion of sieving, the sieved C W R was re-
combined and processed as described earlier. Thirdly, the processed minus 10mm
C W R was used for the final sieve analysis.
The results obtained from these sieve analyses were then used to study the
effect of crushing on the grain size distribution of CWR. This is presented in sub
section 5.1.1.

Chapter 5. Experimental Results and Discussion 5 - 2
5.1.1 Discussion and conclusions drawn from sieve analyses
It was revealed that before processing of CWR, the gravel fraction and
cobbles made up some 87.5% of its total weight And after processing of C W R ,
about 8 0 % of the processed C W R were lower medium gravel and fine gravel
fractions.
Tables 5.1 and 5.2 show the grain size distribution of CWR before and
after processing respectively. For brevity the experimental data of sieve analyses are
presented in Tables AII1.1 through AJI1.4 (in Appendix ALU). Sieve analyses were
also conducted by Lama (Richmond et al, 1985) using wet screening and the results
are conveniently given in Tables ALI1.5 through ALII.14.
According to Lama (Richmond et al, 1985), the results indicate that the
percentage of large particles which are greater than plus 12.7mm varies between
39.0% and 71.0% by weight and with the mean value of about 58.9%. In addition,
the minus 0.106mm fractions form only about 8.8% and this suggests that the finer
fractions form a very small part of the total. The practical significance of this
singular aspect is that this could create problems if the hydraulic transportation
system is used to convey this material for pack applications.
The curves in Figures 5.1 and 5.2 show that crushing of CWR did not
really affect its grains with sizes 1.0mm and under. It was also noted, however, that
crushing of C W R shifted A B portion of the curve in Figure 5.1 to the left. This
indicated an increase in the weight percentage of particles with sizes bigger than
1.0mm. Also noted was that processing of C W R generated some 0.1 per cent of the
coarse silt fraction.

Chapter 5. Experimental Results and Discussion 5 - 3
Table 5.1 The grain size distribution of C W R before processing.
Total Weight
(%)
87.5
12.5
Weight Percentage
(%)
42.0
30.0
15.0
6.0
4.5
2.0
General Remarks
Coarse gravel fraction
and cobbles.
Medium gravel
fraction.
Fine gravel fraction.
Coarse sand fraction.
Medium sand fraction.
Fine sand fraction.
Table 5.2 The grain size distribution of the processed C W R .
Total Weight
(%)
80.0
19.92
Weight Percentage
(%)
35.0
45.0
15.0
3.75
1.17
General Remarks
Lower medium gravel
fraction.
Fine gravel fraction.
Coarse sand fraction
Medium sand fraction
Fine sand fraction
0.08 0.08 Coarse silt fraction

Chapter 5. Experimental Results and Discussion 5 - 4
The shape of West Cliff C W R ranges from longish to flat with different
degrees of roundness as shown in Figures 4.3 and 4.4 (Chapter 4). The length to
thickness ratios range from 1:1 to 4:1 and the length to width ratios range from 1:1
to 3.6:1. The maximum grain size has been limited to minus 10mm.
West Cliff CWR is composed of sand grains, some may be the size of a
pea, and other may be much finer. Some grains are so fine that individuals cannot
be distinguished. The colour of CWR is light to dark grey. CWR is very porous, it
is also usually soft and can be easily carved into shapes.
z co < tf
W <
Z w u tf
w tf
90"
"6c>
-60-
50
•30
•20
-10
1
fi
I i i
0 02 00
TT! ' 1 i
JLL-^ *r*
l i
r *•<
r
i .
1
= £, — •
-( 1
•. vU'
' oo
• ou
' 50
r% o .
SAND FRACTION FINE j MEDIUM
*l 0 •2
COARSE
3 6 1 .
- J — 1
x^. •T
.
l/l (?•
j
tf
1 — i \ ~*~l 1 I
GRAVEL FRACTION FINE j MEDIUM
2 h \ *
COARSE
0
—\
CC
60
B6LES
1 *
0
10
20
30
CO
sn
BO
70
80
90
O w z <
tf
a <
H Z w o tf td tf
100
0-1 10 to 100
GRAIN SIZE (mm)
Figure 5.1 The grain size distribution curve of C W R before processing.

K^napier 5. Experimental Results and Discussion 5 - 5
z CO CO < tf
W O <
H Z tf
u tf tf tf
90'
•SO
•70-
•60'
50
JO
20
•10
0
1 i r -
r-n?
02 0
Tn—*
J:?2©-
1
2 UJ
L ...
t
-pi H-
- . ^y f
' 50 '
-~TvJ?
, j3 tn _
SAND FRACTION FINE |MEDUvt| COARSE
06 ) c •2 06 1 *
— i — r - 1 .
d P =A K ^ ^
*.?-K
'
. ' • . ' .
_ j
-4 -i -t J-/t *
i : L .
l_
1" 1 ,
tf
!
1
GRAVEL FRACTION
L_—L-
_J COBBLES
FINE j MEDIUM j COARSE
6 I 20 60 1 >
10
20
30
CO
50
60
70
80
90
100
Q w z > — I
H W tf
w o <:
H z w u tf
w tf
10 to wo
GRAIN SIZE (mm)
Figure 5.2 The grain size distribution curve of C W R after processing.
5.2 RESULTS FROM X-RAY DIFFRACTION ANALYSES AND
DISCUSSION
The results of x-ray diffraction analyses of West Cliff CWR are given in
Table 5.3. Silicon oxide, aluminium oxide and iron oxide compounds are the three
major compounds found in West Cliff CWR. They are on average 60.0% of silicon
oxide, 21.0% aluminium oxide and 5.0% iron oxide which constitute some 86.0%
of the total composition of West Cliff CWR.
The results indicate that West Cliff C W R may be classified as a siliceous
or pozzolanic material. It is very obvious by comparing Tables 5.3 and 5.4 that the
chemical composition of West Cliff CWR are very similar to that of the fine
Chapter 5. Experimental Results and Discussion 5 - 6
discards of the United Kingdom. However, it is also apparent that West Cliff CWR
(60.0% Si02) contains a comparatively higher percentage of silicon oxide than that
of the fine discards of the United Kingdom (maximum 46.0% Si02). It is indicative
that West Cliff C W R which contains silicon oxide, aluminium oxide, calcium oxide
and magnesium oxide exhibits pozzolanic characteristics.
Chemical composition analyses of coal preparation wastes conducted in
the U S S R have indicated that coal preparation wastes generated from different
coalfields exhibit a significant variation in their chemical compositions. Chemical
compositions of coal preparation wastes from four main coalfields of the Soviet
Union are presented in Table 5.5. It is obvious from Table 5.5 that the chemical
composition of coal preparation wastes differs markedly from one location to the
next and even within the limit of any particular coalfields. According to Ruban and
Shpirt (1987) for each individual coal washery plant the variation in chemical
composition between samples collected on any particular day is rather small. It can
be noted from Table 5.3 that the variation in chemical composition between samples
of West Cliff C W R is also small.
The most important clay mineral constituents of West Cliff CWR are 50%
to 6 0 % of kaolinite, 3 5 % to 4 0 % of illite and 5 % to 1 0 % of montmorillonite
(montmorillonite is of course the well known troublesome clay). The major
minerals found in West Cliff C W R include well crystallized quartz, degraded
muscovite and calcite.
The following metals also exist in West Cliff CWR:
Sample D - 130 ppm of rubidium, 222 ppm of strontium, 276 ppm of
zirconium, 17 p p m of niobium, 17 p p m of lead, 23 p p m of

Chapter 5. Experimental Results and Discussion 5 - 7
thorium, 35 ppm of yttrium, 37 ppm of nickel, 63 ppm of
copper, 52 ppm of zinc and 35 ppm of gallium.
Sample E - 148 ppm of rubidium, 182 ppm of strontium, 289 ppm of
zirconium, 17 ppm of niobium, 18 ppm of lead, 21 ppm of
thorium, 32 ppm of yttrium, 43 ppm of nickel, 70 ppm of
copper, 86 ppm of zinc and 36 ppm of gallium.
Table 5.3 Chemical compositions of West Cliff CWR.
SAMPLE A B C D E F G
Silicon as Si02
Aluminium as AI2O3
Iron as Fe203
Potassium as K 2 O
Calcium as CaO
Magnesium as M g O
Titanium as Ti02
Manganese as M n O
Phosphorus as P2O5
Sodium as Na20
67.17
24.54
4.19
2.93
1.09
0.76
1.01
0.10
0.05
-
64.69
22.65
6.51
3.08
1.74
0.92
1.05
0.14
0.26
-
65.81
22.70
5.68
3.09
1.45
1.24
1.07
0.10
0.19
-
65.93
22.43
5.75
2.97
1.98
1.34
1.02
0.12
0.28
-
67.62
23.87
3.56
3.23
1.28
1.26
1.02
0.06
0.15
-
43.3
14.7
'3.7
1.9
2.2
1.0
0.67
0.06
0.13
0.1
43.2
14.9
3.9
1.9
2.3
1.1
0.67
0.07
0.14
0.08
Ignition loss 21.9 25.3 25.3 - - 32.1 31.7
Total 101.9 101.0 101.3 101.8 102.0 99.9 100.0
Note that all values given in Table 5.3 are expressed in percentage.
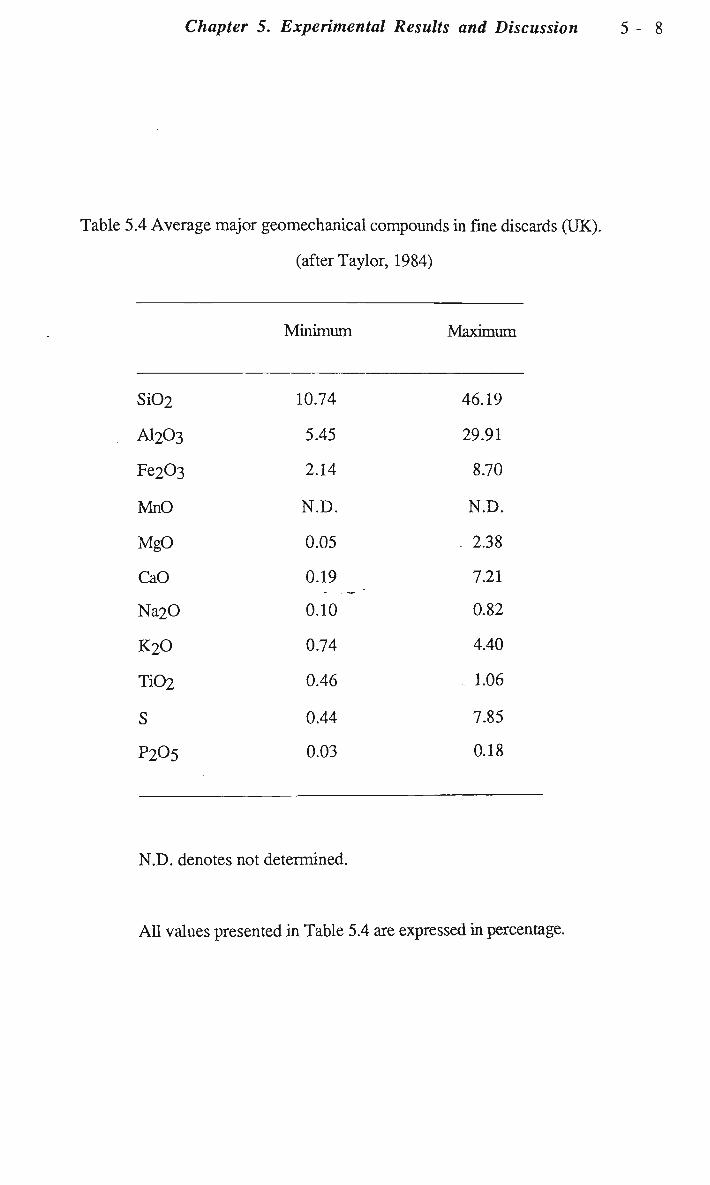
Chapter 5. Experimental Results and Discussion 5 - 8
Table 5.4 Average major geomechanical compounds in fine discards (UK).
(after Taylor, 1984)
Si02
AI2O3
Fe203
MnO
MgO
CaO
Na20
K2O
Ti02
S
P 2 0 5
Minimum
10.74
5.45
2.14
N.D.
0.05
0.19
0.10
0.74
0.46
0.44
0.03
Maximum
46.19
29.91
8.70
N.D.
. 2.38
7.21
0.82
4.40
1.06
7.85
0.18
N.D. denotes not determined.
All values presented in Table 5.4 are expressed in percentage.

Chapter 5. Experimental Results and Discussion 5 - 9
Table 5.5 Chemical composition of coal preparation wastes for
four main coalfields of the Soviet Union.
(after Ruban and Shpirt, 1987)
Coalfields (method of preparation)
Content Donbass Kuzbass Karaganda Pechora Ekibastuz
% grav. float, grav. float. grav. float. grav. grav.®
Si02 50-62 51-58 57-78 50-67 53-63 54-56 61-65 53-64
AI2O3 17-31 18-32 14-26 14-31 23-35 23-28 20-24 27-39
Fe203 3-16 4-12 2-10 2-9 4-7 6-13 6-8 0.2-5
CaO 0.3-5 2-4 1-7 1-10 1-6 1-5 1-2 0.4-2
M g O 0.8-2 1-2 0.3-3 0.7-3 0.3-1 1-2 2-4 0.4-1
®Wastes of open cut mining operations and coal preparation pilot plant.
5.3 MECHANICAL PROPERTIES EVALUATION OF CCWR
MATERIAL
In this study an attempt has been made to present a brief analysis of the
current state of work dealing with experimental studies of deformation properties of
C C W R material as affected by uniaxial compression and confining pressure. A n
examination is also made of the C C W R material characteristics in relation to strata
behaviour.

Chapter 5. Experimental Results and Discussion 5 - 10
5.3.1 Unconfined compressive strength test results
The complete load deformation curves for all CCWR specimens have been
reported in Hii and Aziz (1987a, 1987b). Photographs for each specimen taken
before and after the compressive strength testing have also been shown in Hii and
Aziz (1987a, 1987b). The calculated compressive strength test results, specimen
experimental data are presented in Appendix AIM. The results of compressive
strength testing are summarised in Tables 5.6(a) and 5.6(b).
The results of the uniaxial compressive strength tests in relation to the
curing time of the specimens of different mix formulations (mixes 1 to 5) are
presented in Figure 5.3. Mixes 2 to 5 exhibit good early strength followed by rapid
strength development from 1.5 to 5 hours. Figure 5.4 graphically illustrates this
property. The increase in maximum compressive strength for Mixes 2 to 5 during
the initial 24 hours curing time is shown in Figure 5.5. This increase is quite
pronounced.
It should be noted that specimens of mix 1 could not be tested under 24
hours curing time. This is due to the fact that specimens could not be demoulded
before this time because of the high fluidity caused by the relatively high water
content of 14.7%. Increases in the compressive strength from 1 to 7 days curing
time are still quite rapid although the rate is slightly lower than described for up to
24 hours curing time. Thereafter, the increase in strength is not significant for mixes
3 to 5. This could be explained by the high water to cement ratios of 1.76,2.0 and
3.0 for mixes 3,4 and 5 consecutively. Mix 1 displays a moderate strength increase
from 7 to 90 days curing time while mix 2 displays a high strength increase.

Chapter 5. Experimental Results and Discussion 5 - 11
in >-. 03
O NO cn If) >» 03
O o 9t m >-, CS
fi o NO 93
o OO
60 C u -LH
0)
If)
u
a o U
C3 P-i
s
a E 3
a
i*>
O
ift
a fi
Q
cn
v-i
ON tn in cn
cs cn oo r~
cs r-; d cs
o oo
cs
o o in
o ON VO
ON . — I
in
o »—< "*
o
cn in cn cs cs Ov vq cn Tt
oo Tt cs
o 00
r-Tt vo
ON vo cn cs in T-H
r-- oo
o o cs
X cs
X in
i-H
t-H
cn
O 00
cn in NO
o t — i
cs vq vd
Tt
r-r-
oo vq 00
in in
cs in in oo
in in
a a> c o U
CQ Q)
- i
t-
X IO
Ml
©
E E
ES
ON «S cs
Ov 00 CN
ON Tt oo •-< vn t-; cs' NO
cs ON 00
d
•t
o
vo "-1
S e n CM
d d
>n o
cs o
oo NO O
cs Tt
o
cn cn O
cn O
r» in .-H
m c-00
ON Ov VI
Tt NO "O
cn ON £ o cs p; »n oo Tt r-
Tt Ov cn
Tt oo cn cn t-i oo
cn m O
t- o cs .-. r~ •-* H \o ^ cn" Tt d
O >n ov O Ov «r» oo 00 oo cs cn oo
cs in oo in NO cn .-H cn .-; --J ^ iri
cn rt -< CM O O d T-'
m t-H
d
cs 00
o
Ov
o o
cn
vd
* u-i CM
NO Ov
* o cs
U o t-H
rt o
O NO r». q rt t— Tt cs f\J .—t t-H t—<
m <o un </i
VY
O oo O
rH VI O ON ^ cn
in vn <n
cs cs oi
NO 00 Ov
m cd
O JS
H
as
C/J
& 1=3 o o oo
* u

Chapter 5. Experimental Results and Discussion 5- 12
(S
fi in ii
> •1-H
m
B o o tt-H
o in 4-t C/3 H-H
o >V
6 B tfi
vq in
v
1
* IT) NO <»}
m
a fi o Ov in
a fi o SO
If)
>-> 01 fi oo CM cn
>-> 03
fi
O
e u co
en
O
u
a E a
5
C3
fi
X •rT
CM
X
C3 p.
T3 -M
9 B •5 S © «J
PH U
©
in
S3 CM
E £
#
tf
VO 00 00
cs
Tt
cs
cs
oo CO
•-• in cn ON
vq r-; u-> r>
ON cn ON cn VO Tf Tt* f"
cn O Tt Tt oo rt Tt r~ •-; ""*. e**! •*.
cs cn Tt" r~"
o
s cs cs oo cn oo CM CM cn cn vo
cn O
o m vo cs
ON un o 5
ON in VO
en cn NO
ov vn ON ON t- Tf
r-cs
OO CS 00
s s d. o d d
ON r»
s s d .©
io in cn
vd
r- f- m rt o\ cs vq o vq rt cs' Tt
vo Tt un rt vo o NO 00 rH rt »—f Tt
cs o ON t-H oo r-•—* VO C<J rt •—i cn
Tt cn cs CS rt u-i Ov CS rt
d rt" cn
cn ON Tt cs oo vo oo cs vq
d rt oi
r-H Tf ON CM Ov CM
cn un NO
o" d ~ vo VO
CM
s
00 cn
o
cs cn o
vo cn o
Tt
o
U in o
rt cs oo q ON" vo cn cs
o o o o
un o U t— '—
p un NO
ON NO cs
in un un p» r> r-
ON
cn Tt
co oo cn
cn ov Tt
cs'
cs cn Tt
cs"
Tt
o cs
VO
r-co
00
o CS
un ui CM
o cs'
q in
CX
vo 00 ON r—I
m vs a
a O t-H
4J ,rt C+H
S-> cn 73 ii in CX a
"o o cn ii H .
o c ii Ti
* u,
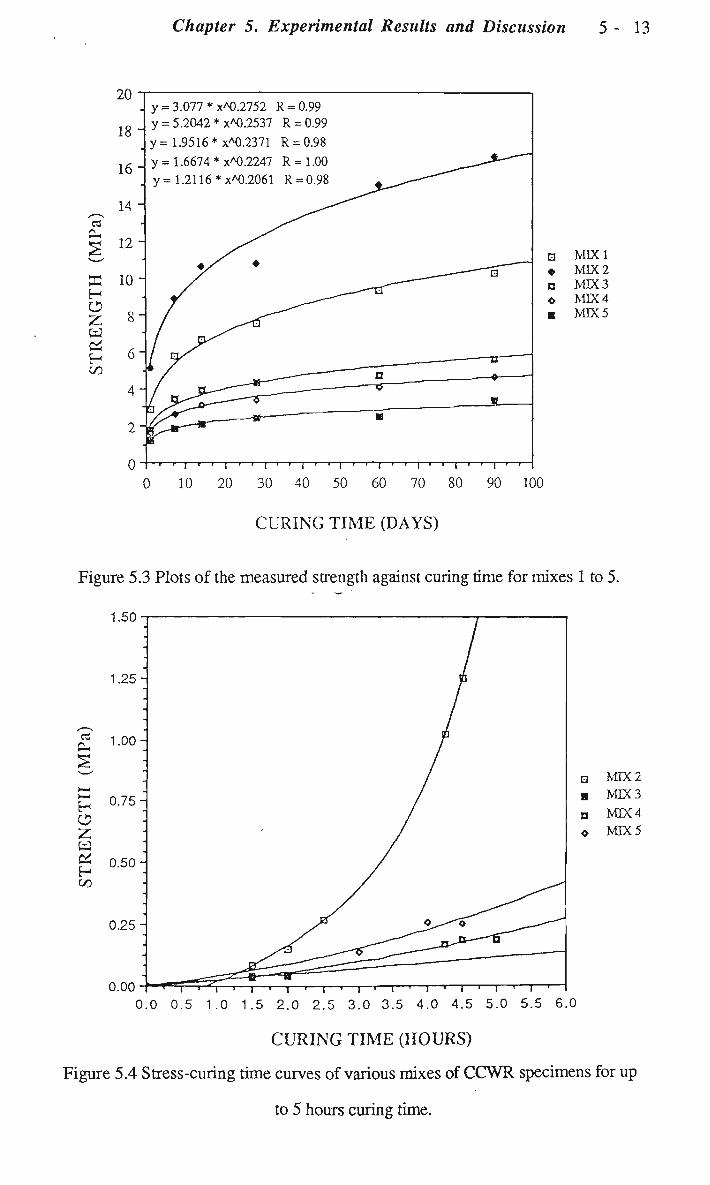
Chapter 5. Experimental Results and Discussion 5 - 1 3
20
18-i
16
y = 3.077 *xA0.2752 R = 0.99 y = 5.2042 * x*0.2537 R = 0.99
y= 1.9516 *x*0.2371 R = 0.98
n o
1 ' i ' • i ' ' i ' ' i • • i •' ' • i * • i ' •• c ' • i
0 10 20 30 40 50 60 70 80 90 100
MTX1 MIX 2 MIX 3 MIX 4 MIX 5
CURING TIME (DAYS)
Figure 5.3 Plots of the measured strength against curing time for mixes 1 to 5.
1.50
• MIX2 • MIX 3
o MDC4 o MIX5
^ i -• i — « — i — ' — i — > — i — > — i ^ — < — i — ' — i — ' — I — » — I • I *"
0.0 0.5 1.0 1.5 2.0 2.5 3.0 3.5 4.0 4.5 5.0 5.5 6.0
CURING TIME (HOURS)
Figure 5.4 Stress-curing time curves of various mixes of CCWR specimens for up
to 5 hours curing time.

Chapter 5. Experimental Results and Discussion 5 - 1 4
a
f-C
z Ed co
Q MIX 2 « MIX 3 Q MIX 4 © MIX 5
CURING TIME (HOURS)
Figure 5.5 Stress-curing time curves of mixes 2 to 5 of CCWR specimens for up to
24 hours curing time.
The form of the curve is a function of a very complicated cement chemistry
of the material. The load deformation relationships of the specimens of mixes 1 and
2 which have been shown in Appendices A and B (Hii and Aziz, 1987a) indicate
that the specimens with a curing time of up to 90 days display a plastic form. At the
curing of 1 day and after, the rate of increase in strength is more rapid and leads to a
more significant peak strength. At the time the peak strength is reached there is a
sharp drop in strength and this is a characteristic of a relatively brittle material.
The results indicate that the specimens of mix 2 exhibit stiffer and more
brittle characteristics than those of mix 1. The higher strength development pattern
of mix 2 than that of mix 1 can be explained by examining Table 4.4(a). It can be

Chapter 5. Experimental Results and Discussion 5 - 15
seen from Table 4.4(a) (in Section 4.2, Chapter 4) that the water to cement ratios
are very similar being 1.1 for mix 1 and 1.2 for mix 2; the higher fluidity of mix 1
on pouring coupled with the slightly lower water to cement ratio may have resulted
in this behaviour. Also, the higher mass percentage of calcium chloride admixture
(2.55% in mix 1 and 3.0% in mix 2) used in mix 2 and a longer duration of
vibration (5 seconds for mix 1 and 20 seconds for mix 2) could contribute to its
higher maximum strengths. Error in the preparation of mix 2 resulting in a higher
cement percentage than desired could also explain these anomalies, although this is
quite unlikely to occur.
The post failure modulus and residual strength results of CCWR
specimens for mixes 1 to 5 are presented in Appendix AII5. The results indicate that
the specimens exhibit low residual strengths.
5.3.2 Triaxial strength test results
Results of triaxial strength tests carried out on different mix compositions
are presented in Tables 5.7 through 5.11. The results of the triaxial strength tests
are summarised in Table 5.12. The stress-strain relationships of mixes of CCWR
specimens under different confining stresses are presented in Figures 5.6 through
5.10. The results show that the plastic behaviour of the material under confining
pressure is not only dominant for specimens with short curing time (7 days), but is
also evident for specimens with longer curing times. This is not like the brittle mode
of failure experienced for specimens under uniaxial compressive tests. Therefore the
effect of confining stress is the major contributory factor for such a change in failure
mode.

Chapter 5. Experimental Results and Discussion 5 - 16
Table 5.7 Results of triaxial tests for C C W R material specimens
(mixes one through three).
Mix Specimen Confining Strength Wet density Water content
Pressure
(MPa) (MPa) (t/m3) (%)
1
2
3
Al
A2
A7
A4
A5
A6
A3
B5
B6
B7
B4
B3
B2
Bl
Cl
C5
C4
C2
0
0
0
1.39
3.75
5.56
6.95
0
0
0
2.09
4.17
5.56
6.95
0
0
1.39
2.09
8.699
8.680
9.796
16.238
20.668
24.589
28.728
13.122
13.379
12.768
22.729
28.624
32.831
35.833
4.295
4.190
11.364
13.567
1.900
1.880
1.911
1.873
1.914
1.868
1.920
1.999
2.001
2.008
2.039
2.203
2.044
1.994
1.949
1.918
1.893
1.941
11.27
11.33
10.60
9.10
9.20
10.00
10.60
8.17
8.07
8.26
7.87
7.90
7.90
7.90
10.46
10.44
9.26
10.30

Chapter 5. Experimental Results and Discussion 5 - 1 7
Table 5.8 Results of triaxial tests for C C W R material specimens
(mixes four and five).
Mix Specimen Confining Strength Wet density Water content
Pressure
(MPa) (MPa) (t/nP) (%)
4
5
D5
D6
D3
DI
D2
E5
E6
El
E4
E2
E3
0
0
0.10
0.20
0.40
0
0
0.17
0.35
0.52
0.86
3.515
3.034
3.095
5.135
5.640
1.902
1.897
3.078
4.083
5.196
6.666
2.050
1.898
1.921
1.909
1.923
1.729
1.984
1.992
1.950
1.970
1.958
8.22
8.95
—
7.50
9.50
8.27
9.26
8.96
9.13
9.08
9.18

Chapter 5. Experimental Results and Discussion 5 - 18
Table 5.9 Results of triaxial tests for C C W R material specimens
(mixes seven and eight).
Mix
7
8
Specimen
GI
G2
G3
G4
G5
G6
G7
G8
HI
H2
H3
H4
H5
H6
H7
H8
Confining
Pressure
(MPa)
0
0
0
0.137
0.274
0.411
0.548
0.689
0
0
0
0.137
0.274
0.411
0.548
0.689
Strength
(MPa)
2.995
3.289
3.126
4.060
4.022
4.720
5.522
5.717
1.728
1.786
1.612
2.421
3.241
3.504
4.276
5.047
Water content
(%)
20.33
19.89
20.72
19.24
20.11
21.31
19.50
21.72
16.42
16.87
16.71
17.64
16.67
18.05
17.90
17.27

Chapter 5. Experimental Results and Discussion 5 - 19
Table 5.10 Results of triaxial tests for CCWR material specimens
(mixes ten and eleven).
Mix Specimen Confining Strength Water content
Pressure
(MPa) (MPa) (%)
Jl
J2
J3
J4
J5
J6
J7
J8
0
0
0
0.137
0.274
0.411
0.548
0.689
5.303
5.522
5.359
4.779
5.765
6.496
7.511
8.404
12.58
11.75
12.04
13.36
12.39
12.72
13.19
13.25
Kl
K2
K3
K4
K5
K6
K7
K8
0
0
0
0.137
0.274
0.411
0.548
0.689
3.295
3.185
3.307
3.472
4.423
5.067
5.231
5.729
14.21
14.43
15.21
15.95
16.35
15.38
15.87
16.32

Chapter 5. Experimental Results and Discussion 5 - 2 0
Table 5.11 Results of triaxial tests for C C W R material specimens
(mixes twelve and thirteen).
Mix
12
13
Specimen
Ll
L2
L3
L4
L5
L6
L7
L8
Ml
M2
M3
M4
M5
Confining
Pressure
(MPa)
0
0
0
0.137
0.274
0.411
0.548
0.689
0
0
0
0.274
0.689
Strength
(MPa)
0.974
1.000
0.971
1.538
2.116
2.603
3.133
3.695
1.848
1.976
1.790
3.886
5.704
Water content
(%)
17.28
17.24
16.36
16.31
16.53
16.79
16.71
16.51
11.91
12.59
12.17
12.56
12.67

Chapter 5. Experimental Results and Discussion 5 - 2 1
Table 5.12 Summary of triaxial test results for C C W R specimens.
Material Cohesive Unconfined Tensile
Mix friction strength compressive strength
angle
(o) (MPa) (MPa) (MPa)
15.0%C-21.0%W 28 0.625 3.123 0.608
15.6%C-14.7%W 14 1.400 9.058
12.5%C-19.1%W 22 0.740 3,262 0.629
12.5%C-16.5%W 20 1.100 5.395 0.840
12.5%C-13.0%W 16 2.600 13.090
I0.0%C-19.1%W 30 0.420 1.709 0.394
10.0%C-16.5%W 29 0.400 1.871 0.403
7.5%C-19.1%W 32 0.225 0.982 0.170
7.5%C-16.5%W 29 0.400 1.871 0.403
7.5%C-12.6%W 36 0,600 3.275 0.422
5.0%C-13.0%W 41 0.350 1.900 0.191

Chapter 5. Experimental Results and Discussion 5 - 2 2
STRESS STRAIN CLRVES:TRIAXIAL TEST
30.00
26.00 -
20.00 -
2 CL sz in IIS
w
15.00
10.00
5.00 -
0.00 0.00 5.00 10.00 15.00 29.00 25.00 30.00 35.00 40.00 45.00 50.00
STRAIN («10t-3) . D3SD-1S.6«(Cft=1.39tPA). A 1S.6K-2C tf3=3.475MPW 015.6»-3< Cf3=5.56MPA) X15.6*--J
Figure 5.6 Triaxial strength test results for CCWR specimens at different confining
pressure (15.6% cement, mix 1).
STRESS STRAIN CURVES: TRIAXIAL TEST
40.00
35.00 -
30.00
2S.00 -
20.00
15.00
10.00
5.00
0.00 0.00 5.00
25.00 38.00 10.00 15.00 20.00 STRAIN <»I0-N3) . A29D-12.5*(tf3=2.085HPA) 029D-12.5*(d3=4.17MPA) X290-12.5*tf3=5.56rt>A) +29D-4
Figure 5.7 Triaxial strength test results for C C W R specimens at different confining
pressure (12.5% cement, mix 2).

Chapter 5. Experimental Results and Discussion 5 - 2 3
14.00
12.00
STRESS STRAIN CURVES: TRIAXIAL TEST
2.00
0.00 lir 0.00 5.00 10.00 15.00 20.00 25.00 30.00 35.80
STRAIN (•let-3) . D AGE:280-10*( 03=2.085TPA) A AGE: 280-10s( 03=1.39MPA).
Figure 5.8 Triaxial strength test results for CCWR specimens at different confining
pressure (10.0% cement, mix 3).
STRESS STRAIN CURVES: TRIAXIAL TEST 6.00
5.00-
4.00
< fc
0.00 _ 0.00 4.00 8.00 12.03 16.00 20.00 24.08
STRAIN C»10T-3) . DAG£:29D-7.5*C<J3=0.2rPA) . A AGE: 290- 7.5*< 63=0.1 HPA) OAGE:29O-7.S*{d3=0.4ri!
Figure 5.9 Triaxial strength test results for CCWR specimens at different confining
pressure (7.5% cement, mix 4).

Chapter 5. Experimental Results and Discussion 5 -
STRESS STRAIN CURVES:TRIAXIAL TEST 7.00-p
6.00-
5.00 -
3 4.00-a.
<fS 1/1
w - £ 3.00-v>
2.00-
1.00 -
0.00 £ 0.00 5.00 10.00 15.00 20.00 25.00 30.00 35.0e 40.00
STRAIN C*10-f-33 . a28O-6»Cd3-0.172MPA) . A2BD-S<«( Cfc3«0.617MPA) . 02SD-Si*( d3-0.862MPA) . X280-E*< a
Figure 5.10 Triaxial strength test results for CCWR specimens at different
confining pressure (5.0% cement, mix 5).
Under triaxial stress conditions the post-failure stress-strain curves
(Figures 5.6 through 5.10) show that the test specimens behave in a brittle-ductile
manner. The residual strength values constitute a high proportion of the peak
strength values. In field application, the CCWR pack will initially be confined by
the forms. As the pack is loaded it may expand laterally and confinement will be
offered by adjacent packs. This means that a higher degree of resistance to closure
will still be offered by the packs.
Figures 5.11 through 5.21 show the peak strength Mohr's envelopes for
different mix compositions. Figures 5.22 and 5.23 show the peak strength envelope
of CCWR specimens. Mixes 3 to 5 display an expected increase in the friction angle
<|> and a decrease in the cohesive strength C for a subsequent decrease in the mix
cement percentage. Mix 1 exhibits a lower cohesive strength than mix 2 and this
explains the lower strength development pattern of mix 1 than mix 2 as described in
Section 5.3.1.

Chapter 5. Experimental Results and Discussion 5 - 2 5
m
in <N VO ©
ll
O
• a
m <N TH
?n
li u
o GO
n -e-
.3
s q 1-H
CN i
U o IO y-t
,o <4H Cfl
& »~H
> c OJ S-H T C
o
W)
c
s 4J OH
IT)
(MW) SS3H1S HV3HS

Chapter 5. Experimental Results and Discussion 5 - 26
x B
r--t H I
u q in l-H
a m ii CX ci li >
c Oi in "«H
o bfl C fa
•a o
>o
3 bJQ • *-< P H
II
u
S3 ft*
S ON
II u.
D
o rf
II
-e-
C3
C/3 til
H C/3
tf
o Zt
(MPV) SSStflS HV3HS

Chapter 5. Experimental Results and Discussion 5-21
a
cx
rr
U
PH
S <N VO »N fn ll
u 0
o rN (N II
-e-
.a s T—t
ON . — I
I
u <N
l-H
a in ii
CX > c
o
bO
e D fa m <D OH
cn T-H
lO
e 3 bfi
»1-H
PH
C3 PH
03 •W tf
H xsi
J
tf
o
(MJ\D SSa^XS HV3HS

Chapter 5. Experimental Results and Discussion 5 - 2 8
x
VO
vd .-H 1
u >o CN
cS in ii CX
o > 3 U in "l-H
TC
o bJO 3 ii
h •a OH
rl-
• ffl
iH •
i—1
CJ PH
Ui ON O
>/) o o cs
r CN
U b
PH
C/3
w tf
H C/3 <
tf
o
kO
e 3 bfl PH
(BdiAl) SS3HXS tfVSHS

Chapter 5. Experimental Results and Discussion 5 - 2 9
q cn r-H I
u io CN (H
a m V CX O > 3 ii LH
X
bO 3 <D
h m M d ii OH
lO v 1-H
3 bO PH
ca o.
vo CN
II
U
PH
1—1
tn iH
II u
o vo
II -e-
to
CN ro
CO OJ
"3"
O Ov!
VO t - l
CN
/""N
C3 PH
s v—' C/3 C/3 « tf H cc J ^
s tf
o £
_ CO
= • *
(*dW) SS3H1S HV3HS

Chapter 5. Experimental Results and Discussion 5 - 3 0
ca o.
s © CM rt •
© II
u
• ca UH
OS © f-iH
II
u
b
o ©
ll
•e-
r-H
ON rH
u o d ii
C/5
<D OH
O
13 > c O l-H
o
bJQ 3 iU
OH
VO
>o o LH
3 bfl PH
• Ln
- <*
- m
• CNI
os PH
g C/3 C/3
W tf
H C/3
tf
o z
(BdPV) SS3HXS HV3HS

Chapter 5. Experimental Results and Discussion 5 - 31
x •I-H
6
vd r-H I
u us o d LH
«s in
V CX
o 13 > c <D m ~U O bfl 3 CJ
fa M c3 (D OH
lO OJ l-H
3 ba • rH
PH
ca a.
90 © II
u
ea P<
rr (N rr ll
b
o 00 <N II -©-
Odw) ssaais avails

Chapter 5. Experimental Results and Discussion 5 - 3 2
ca o-<5 Ui «N «N • © II
V
ca PH
S <N GO C> ©
II o b
o CN
m
•l-H
S
ON T-H I
u VO
a in ii
CX O 13 > 3 OJ VH
o
bO 3 l-H
OH
OO
VO OJ l-H
3 ba • rH
PH
LT» rh
o rh
Ln cvi
o CSI
Ln "r-
o
,^-v
<3 PH
s C/3 C/3 W tf
H C/3
J <
s tf
o z
in
o
(*d.W) SS3HXS HV3HS

Chapter 5. Experimental Results and Discussion 5 - 3 3
ca ea k-H PH
© © rr
oo o • ON
U b
x «rH
E
>o vd T—I
!
u vo l-H
a in
4J OH
O 1 — I
> 3 OJ l - i
o
bO 3 <D fa GO
M <sj
<D OH
ON VO
g 3 bO
• I-H
PH
PH
CC CC
w tf
H cc
tf
O Z
OttHL) SS3HXS HV3HS

Chapter 5. Experimental Results and Discussion 5 - 3 4
x
B
VO CN
i
U
vo
l-H
a m ii
CX O 13 > c OJ
TH
-3
bfl 3 UJ U
M cd ii
OH
O CN "O u t-l
3 ba .^ PH
ca o,
vo ©
ca PH
CN
b
o VO
cn
03 PH
s CC CC
w tf
H cc tf
O
z
(MW) SS3HXS HV3HS

Chapter 5. Experimental Results and Discussion 5 - 3 5
ca a
Ui
©
ll
U
ca PH
ON
00 iH
II
b
o
ri
ll
•e-
X
1 q cn T-H I
u q »o tn ii CX
13 > 3 <D oo "VH
-3
o be 3 <o fa oo cd <D OH T-H
CN IO O 3 bfl •?H
PH
03 PH
CC CC
w tf
H cc
tf
O Z
(*aw) ssaaxs avaHS

Chapter 5. Experimental Results and Discussion 5 - 3 6
40.00
0.00
• MIX1 MIX 2 MIX 3 MIX 4 MIX 5
U.00 1.00 2.00 3.00 4.00 5.00 6.00 7.00 8.00
CONFINING STRESS (MPa)
Figure 5.22 Peak strength envelope of C C W R specimens for mixes 1 to 5.
ca PH
g, CO CO &H PH
E -
<
PH
O
z
0.00 U.10
• n o
MIX 7 MIX 8 MIX 10 MIX 11 MIX 12 MIX 13
0.70 0.20 0.30 0.40 0.50 0.60
CONFINING STRESS (MPa)
Figure 5.23 Peak strength envelope of CCWR specimens for mixes 7, 8,10, 11,
12 and 13.

Chapter 5. Experimental Results and Discussion 5 - 3 7
5.3.3 Brazilian test results
Brazilian test results of different mix compositions are given in Tables
5.13 through to 5.16. The tensile strength of C C W R specimens reflects that of the
compressive strength. A s would be expected the C C W R material is weaker in
tension than in compression. A rule of thumb is that the tensile strength of the
material is usually one tenth of its compressive strength.
The tensile properties of CCWR specimens are therefore slighdy better
than might be expected. After 28 days curing time the tensile strengths for mixes 3
and 4 are approximately 15.0% and 13.0% of the compressive strength
respectively. In practice, a large portion of a pack will be in compression,
particularly the centre which will be confined by the outer material. The
performance of the material therefore will not be significantiy affected by its tensile
property.
5.3.4 Sonic velocity values measured during curing
Sonic velocity values are presented in Tables AII2.1 through to AII2.13
(in Appendix AII2). All velocities show a marked increase from 1 day curing time
to 90 days curing time. This indicates stiffness increases in the specimens.
Calculated values of stiffness, Young's modulus and Poisson's ratio for the tested
specimens support this proposal.
The results show a slight but consistent increase with increased cement
content. The results also indicate that the degree of compaction of the specimen may
influence its sonic velocity value. W h e n comparing specimens of mixes 1 and 2 (5
seconds vibration for mix 1 and 20 seconds vibration for mix 2), specimens of mix
2 exhibit higher velocity values.

Chapter 5. Experimental Results and Discussion 5 - 3 8
Table 5.13 Results of Brazilian tests for C C W R material specimens
(mixes three through five).
Mix
3
Specimen
CB1
CB2
CB3
CB4
CB5
Tensile strength
(MPa)
0.697
0.575
0.669
0.441
0.760
Wet density
(t/m3)
1.934
1.963
1.951
1.949
1.940
Water content
(%)
9.54
11.34
10.91
11.40
—
Mean tensile strength = 0.628 M P a
DB1
DB2
DB3
DB4
0.446
0.365
0.440
0.436
1.907
1.942
1.944
1.992
10.93
10.83
9.79
10.60
Mean tensile strength = 0.422 M P a
5
EB1
EB2
EB3
0.154
0.188
0.232
1.972
1.990
1.960
10.59
10.40
10.12
Mean tensile strength = 0.191 M P a
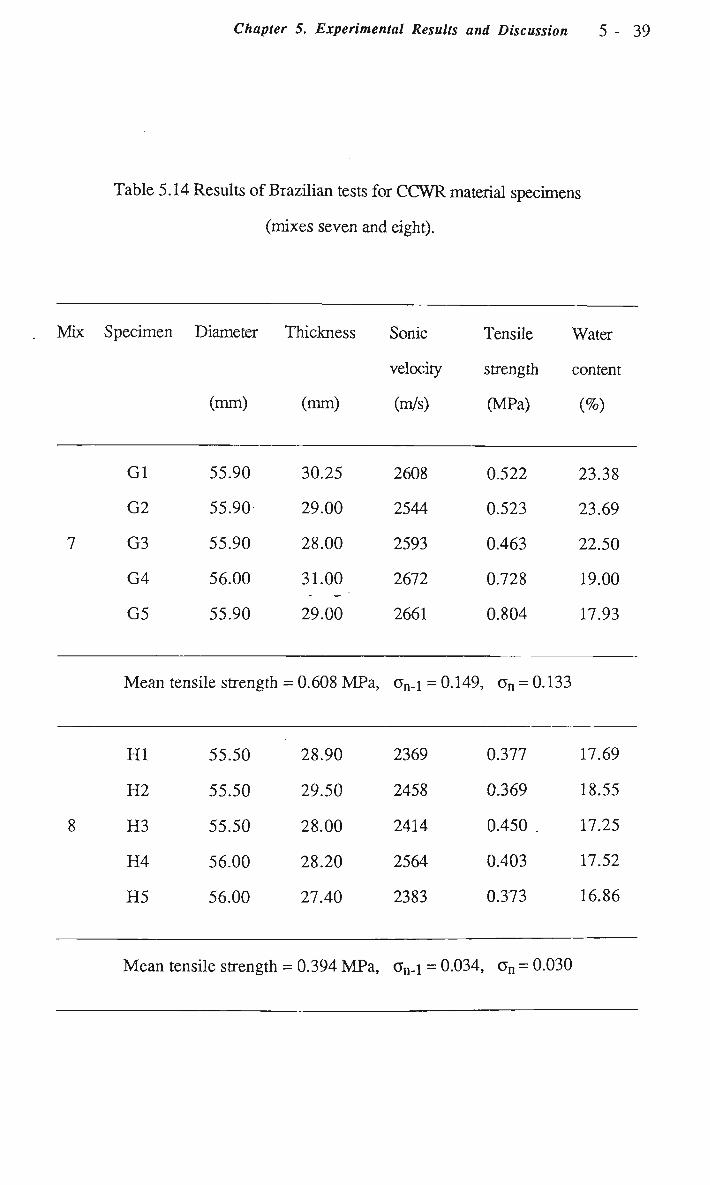
Chapter 5. Experimental Results and Discussion 5 - 3 9
Table 5.14 Results of Brazilian tests for C C W R material specimens
(mixes seven and eight).
Mix Specimen Diameter Thickness Sonic Tensile Water
velocity strength content
(mm) (mm) (m/s) (MPa) (%)
GI
G2
G3
G4
G5
55.90
55.90
55.90
56.00
55.90
30.25
29.00
28.00
31.00
29.00
2608
2544
2593
2672
2661
0.522
0.523
0.463
0.728
0.804
23.38
23.69
22.50
19.00
17.93
Mean tensile strength = 0.608 MPa, on.\ = 0.149, o n = 0.133
HI
H2
H3
H4
H5
55.50
55.50
55.50
56.00
56.00
28.90
29.50
28.00
28.20
27.40
2369
2458
2414
2564
2383
0.377
0.369
0.450 .
0.403
0.373
17.69
18.55
17.25
17.52
16.86
Mean tensile strength = 0.394 MPa, Gn_i = 0.034, o n = 0.030

Chapter 5. Experimental Results and Discussion 5 - 4 0
Table 5.15 Results of Brazilian tests for C C W R material specimens
(mixes ten and eleven).
Mix Specimen Diameter Thickness Sonic Tensile Water
velocity strength content
(mm) (mm) (m/s) (MPa) (%)
Jl
J2
J3
J4
J5
56.00
55.60
55.50
55.60
55.60
29.80
30.40
30.00
28.50
29.50
2785
2764
2727
2879
2682
0.896
0.847
0.859 .
0.743
0.853
14.17
13.09
15.19
13.05
13.27
Mean tensile strength = 0.840 MPa, on-l = 0.057, a n = 0.051
Kl
K2
K3
K4
K5
55.60
55.80
55.80
55.60
55.60
29.50
31.00
29.90
29.00
29.40
2634
2870
2769
2685
2748
0.620
0.643
0.648
0.671
0.564
17.72
15.69
17.12
17.92
15.56
Mean tensile strength = 0.629 MPa, rjn-i = 0.041, a n = 0.036

Chapter 5. Experimental Results and Discussion 5 - 4 1
Table 5.16 Results of Brazilian tests for C C W R material specimens
(mixes 12 and 13).
Mix Specimen Diameter Thickness Sonic Tensile Water
velocity strength content
(mm) (mm) (m/s) (MPa) (%)
Ll
L2
L3
L4
L5
55.50
55.50
55.50
55.00
55.50
28.50
29.00
30.00
27.50
29.00
2244
1921
1961
2148
1895
0.181
0.178
0.153
0.158
0.178
15.73
15.31
18.78
17.65
17.43
Mean tensile strength = 0.170 MPa, on.i =0.013, o n = 0.012
Ml
M 2
M3
M 4
M5
55.70
55.50
56.00
56.00
55.50
30.50
28.50
28.00
28.95
29.72
2421
2244
2353
2298
2436
0.374
0.362
0.371
0.415
0.494
12.25
13.32
13.27 .
12.50
12.15
Mean tensile strength = 0.403 MPa, <Jn_i = 0.055, o n = 0.049

Chapter 5. Experimental Results and Discussion 5 - 4 2
Sonic velocity and curing time relationships of C C W R specimens are
illustrated in Figures AII6.1 and AJJ6.2. Scatter plots of sonic velocity against
unconfined compressive strength of C C W R specimens for different mix
formulations are illustrated in Figures AH6.3 and AII6.4. As expected the sonic
velocity value of the specimen increases with a corresponding increase in its
strength. This trend is consistent for all C C W R mixes. The sonic velocity and
strength relationships of each mix is given in Appendix AII6. The results generated
in this study may be used to predict the in-situ strength of C C W R material.
5.3.5 Moist weight values measured during curing
Specimen moist weight values are presented in Tables AII3.1 through to
AII3.13 (in Appendix AII3). These values were recorded to indicate the degree of
dehydration of the individual specimen. The values presented show a general
decreasing trend.
5.3.6 Observations and analyses of CCWR specimen behaviour
5.3.6.1 Physical properties of CCWR specimens
The relative density of coal washery refuse solids was found to be 2.31
and this value is slightly lower than that obtained by Thomas (2.54) (Thomas,
1986). The physical properties of representative C C W R specimens are summarised
in Table 5.17. The results indicate that mix 1 has a relatively higher porosity
(26.0% for mix 1 and 18.6% for mix 2) and void ratio (0.35 for mix 1 and 0.23%
for mix 2) than mix 2. This can further explain the higher maximum strengths of
mix 2 than mix 1 as described in Section 5.3.1.

Chapter 5. Experimental Results and Discussion 5 - 4 3
Table 5.17 Physical properties of C C W R specimens for different mixes.
Mix Porosity Void Specific Pwei Pdry Ps
Ratio Gravity (1/m3) (t/m3) (t/m3)
15%C-12%W 11.516 0.114 2.054 2.049 1.941 2.193
15.6%C-14.7%W 25.990 0.351 1.930 1.928 1.681 2.272
15%C-21%W 24.728 0.247 1.960 1.955 1.709 2.271
12.5%C-13%W 18.580 0.228 2.033 2.031 1.853 2.276
12.5%C-16.5%W 20.303 0.202 2.013 2.007 1.807 2.268
12.5%C-19.1%W 23.030 0.229 1.952 1.947 1.729 2.246
10%C-12%W 14.494 0.145 2,083 2.077 1.935 2.264
10%C-13.8%W 23.990 0.316 1.966 1.963 1.733 2.280
10%C-19%W 25.898 0.259 1.961 1.956 1.698 2.291
7.5%C-12.6%W 23.600 0.309 1.979 1.977 .1.752 2.293
7.5%C-16.5%W 24.995 0.248 2.011 2.006 1.757 2.343
7.5%C-19%W 28.311 0.282 1.976 1.971 1.690 2.358
5%C-12%W 21.480 0.274 1.972 1.969 1.776 2.261

Chapter 5. Experimental Results and Discussion 5 - 4 4
5.3.6.2 Specimen failure modes
Failure due to unconfined compressive testing of CCWR specimens can be
described in two phases:
(1) Small axial cracks appeared just before the maximum
compressive strength was reached (see Figure 5.24). These
cracks indicated tensile cleavage.
(2) As strain increased these cracks widened and large slabs of the
specimen surface broke away leaving a typical hour glass failure
shape (see Figure 5.25). This indicated a concentration of shear
stress along some diagonal plane within the material and this
caused it to fail in shear.
Another failure mode observed is the shear cone with splitting above (see
Figure 5.26).
5.3.7 Discussion of results
The results presented in Sections 5.3.1 through 5.3.6 and the associated
analyses are discussed in this Section. Comparisons between five C C W R mixes
will be made in relation to pack strength requirements. A n examination is also made
of the C C W R material characteristics in relation to strata behaviour.

Chapter 5. Experimental Results and Discussion 5 - 4 5
Figure 5.24 Small axial cracks appeared just before the maximum compressive
strength was reached - indicating tensile cleavage failure.
Figure 5.25 A typical hour glass failure shape.

Chapter 5. Experimental Results and Discussion 5 - 4 6
Figure 5.26 Shear cone with splitting above.
5.3.7.1 Mechanical properties of CCWR specimens
Mix 1 (15.6% cement)
The high fluidity of mix 1 on pouring did not permit early strength testing
of the specimens (1 hour and 2 hours). The results for 1 day curing time specimens
reveal a strength value of 2.589 M P a which is nearly two times the strength
requirement described in Section 2.6 in Chapter 2.
Specimen strengths of 5.774 MPa after 7 days curing, 6.620 MPa after 90
days curing indicate very favourable pack properties. Young's modulus values of
0.386 GPa after 1 day increasing to 1.658 GPa after 90 days indicate satisfactory

Chapter 5. Experimental Results and Discussion 5 - 47
stiffness property of the material. For bulk transport of pack material a value of
1.95 t/m3 may be used for design purposes.
The mode of failure of specimens in compression is as described in
Section 5.3.6.2. The failure behaviour of the specimens indicates the cohesive
strength of 1.4 M P a is satisfactory.
Mix 2 (12.5% cement)
The ultimate compressive strengths of mix 2 specimens are higher than
those of mix 1. The strength of 0.082 M P a after 1.5 hours is suitable for
deshuttering purposes while the strength of 1.021 M P a after 4.25 hours is about
two times the value recommended in the United Kingdom. This mix formulation
gives a high strength of 16.599 M P a after 90 days. A Young's modulus of 2.847
GPa after 90 days gives a satisfactory elastic modulus property of the material.
The mix has a superior cohesive strength of 2.6 MPa (1.86 times the
cohesive strength of mix 1) and this reflects its high strength development pattern.
The mode of failure behaviour of specimens is typical shear cone with splitting
above. The failure behaviour of the specimens indicates the mix composition has a
comparatively good cohesive property.
Mix 3 (10.0% cement)
The compressive strength test results show that the early strengths of the
specimens of mix 3 are relatively low. This could extend deshuttering time in
practice. However, the material can be self-supporting if pumped into strong pack
bags or forms. The strength values after 1 day curing are favourable with the design

Chapter 5. Experimental Results and Discussion 5 - 4 8
criteria in the United Kingdom but the final strength of only 5.631 M P a after 90 day
curing would appear to be insufficient for Australian pack requirements.
The mode of failure consists of a general crumbling by the development of
multiple cracks at mid-height of the specimens. The failure surfaces of the
specimens appeared to be powdery indicating a low cohesive property of the
material.
Mix 4 (7.5% cement) and Mix 5 (5.0% cement)
Mixes 4 and 5 exhibit relatively low compressive strengths. The
compressive strength values are lower than those required for the pack design. The
final maximum strengths of 4.625 MPa for mix 4 and 3.388 MPa for mix.5 after 90
days curing are much lower than needed for effective strata control.
The mode of failure for both mixes manifests as slabs crumbling and
breaking away from the walls of the specimens. Again, the failure surfaces of the
specimens appeared to be powdery. This reflects the low cohesive strengths of the
materials (0.6 MPa for mix 4 and 0.35 for mix 5).
5.3.7.2 CCWR pack characteristics in relation to strata behaviour
An attempt is made to understand the implications of the mechanical
properties of CCWR material in the underground environment. The longwall strata
behaviour and the generation of pack load has been described in some details in
Section 3.1.5. However, an accurate assessment of the initial and ultimate strength
requirements of the pack in the underground environment would be complex.
Nevertheless, the initial strengths of 0.082 MPa in 1.5 hours, 0.151 MPa in 2.0
hours, 0.267 MPa in 2.5 hours, 1.251 MPa in 4.5 hours, 5.138 MPa in 24 hours

Chapter 5. Experimental Results and Discussion 5 - 4 9
and the long term strength of 16.599 MPa in 90 days for mix 2 indicate that the
mechanical properties of C C W R material are close to those required. It is indicative
that this material can offer a good early resistance, however, its strength should
continue to develop in spite of accommodating the irresistible movement of the
strata and possibly a degree of failure.
If the major displacement of the strata takes place within the first few days
of installation of C C W R pack, it m a y remain substantially unfailed. Contrary to
this, the pack may fail considerably, however, the initial confinement of the pack by
the retaining bags or forms and later by other packs can ensure a good residual
strength for the pack. However, at this present period of research accurate
prediction of the effect on strata behaviour, in general, by use of the pack material
properties can not be quantified.
5.4 EFFECT OF WATER CONTENT ON THE MECHANICAL
PROPERTIES OF CCWR MATERIAL
The results of unconfined compressive strength tests are summarized in
Tables 5.18 and 5.19. The effect of water content on the unconfined compressive
strength of C C W R material is illustrated in Figures 5.27 through 5.30. Generally,
unconfined compressive strength decreases as water content of C C W R material
decreases, its slump value also increases and this is shown in Tables 5.18 and
5.19. The results indicate that the strength of C C W R material of any mix
proportion can be severely affected by the degree of consistency of the mix. The
practical implications of this singular aspect is that the consistency of the mix be
such that C C W R material can be transported and placed sufficiently easily without
segregation.

Chapter 5. Experimental Results and Discussion 5
in
a •3 ta 3
•c 3 o <-• 3 J*-H SH tv.
c/3
13 •c OJ -t— »
cM
e u 3
s (O
.55 tn
m TH
OH O O -0 OJ
£ 3 O o 3 3 ii .3 3 O 3
a 3 O o
t+-H
o 4-1
o t "
5tt P4 oo
VO OJ I—H
•9
H
>> ca fi
VO cn
cw >->
ca fi © ON
V3 >> ca Q © so
C <u u
>^ca * 03 t-H
CN
O
U ca Q
tn >> ca fi
ca Q
fi.
s 3 Efl
(H
<U H-l
ca
"3 3 ca "X u o
H-J
c
? a,
3 ^ O
U -M
c cu e cu P H U
~
£
ON VO VO cn
cn
Tt VO
cn cN vo
(N cn oo r~
CN r-d CN
vo cn CN ON
cn ^t ON ON
OO O ON vo Tt- oo co cN CN| r-- vo I-H
rt vd rX oo
rH O O CN r-H cn cN oo T-H VO <i \o
cn vd vd oo
O O
OO T-H
^t CN 1-- vo c-> vo CN vo *0 00
ON OO CN
U
G\ TJ-O O i-H
vo r-; CN vd
o i-H _ .
T-t O
q vo r-; q r-i tX Tf CN CN I-1 r-H l-H
VO vo »0 >0
vo «0 ON
r~ Ov OO IO vd vd
cn ON cn
o oo
CN O o
•t r- vo
Tt Tf ON cn cn T-H
cn w-i
oo cn oo
- H < ^
r- o H i-H t-~ N O
-. d cn Tt .—i
o o oo CN
VO ON ON «n oo oo cn oo
N m oo io vo cn t—t cn I-H r-H l-H IO
U oo O
T-< io q ON vd cn
IO io «o CN CN ^
&
VO oo ON .-H
in
a B o -3 H l-H
4-1 <HH
cd
tn
T3 !D C/i
& cd .-H
*o O C/5
4J 4-1
O 3 <D T3
u
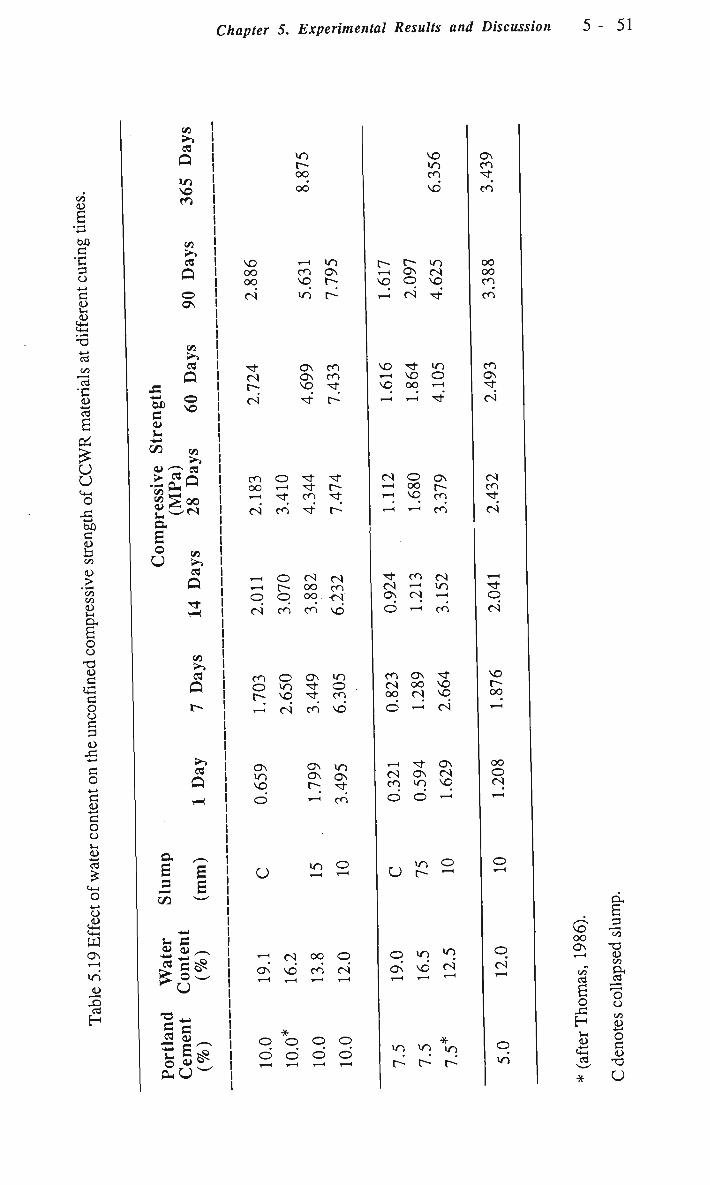
Chapter 5. Experimental Results and Discussion
tn 4)
•3 bO 3 •c 3 O 4-i
3 H-H
cd tn
13 •c <u ^ cd
B
B u O 4-1
bO 3 U fa o .TH
C/3 c/3
DH
6 o o T3 OJ 3 13 3 O o 3 3 U
4—1
3 O
c o
3 O o LH
U
cd =5
o
& PH1
O N T-H
VO
ii
H
C/3
>>. ca Q
U) VO cn
ir,
>>
ca Q © ON
tfi
>> ca Q © vo
OX) 3 <u u W tn eu ^ ca
a
E o U
cw >*> ca Q
cw >s ca Q
ca
Q
3- ,~.
E E B E CO w
c 3 ca ^
£u
VO r-oo oo
VD oo oo
.-H
cn VO
VO ON t-
CN VO
CN Tf r-
cn O Tf OO T-H Tf r-H Tf CO cN cn Tt
Tf
r-Tf
rH O CN CN .—( i>. oo cn © q oo -CN
cN cn cn vd
cn O O vo
f- ° r-H cN cn
ON VO Tf O Tf cn vd
ON VO VO
ON ON
r-
vo ON Tf cn
U VO
r-H CN oo q
ON vd cn CN
o o © q d> d> d> d>
VO
vo vo cn
vd
C- vo Ov cN
q vo CN Tf
Tf CN l>
ON ON VO
cn cn Tf
VO T-H
vq
Tf VO oo
VO O T-H
CN © ON
oo r— vq cn T-t cn
Tf cn cN cN I-H vo ON CN T-H
d I-H cn
cn O N Tf CN oo vo oo cs vq 6 H N
H Tf ON
CN ON CN cn »o vo © ©
r . vo © U r-- ^
o in "1 ON VO CN
vo vo io tX fX tX
ON cn Tf cn
00 oo cn cn*
cn ON Tf CN
CN cn Tf CN
Tf © CN
NO
r-oo
oo © CN
© CN
q vo

Chapter 5. Experimental Results and Discussion 5 - 5 2
WATER CONTENT (%)
Figure 5.27 Effect of nominal water content on the strength of CCWR specimens
at different curing time (15% OPC).
U *C Ui D-00
w
oo oo
w & H
o u
12
10
8 -
6 -
4 -
2 -
Curing time
T — « — J — » — T — i j 1 j 1 1 1 1
12 13 14 15 16 17 18 19 20
WATER CONTENT (%)
Figure 5.28 Effect of nominal water content on the strength of C C W R specimens at
different curing time (12.5% OPC).

Chapter 5. Experimental Results and Discussion 5 - 5 3
X
Ui &. H c/3 Ui
> cn ui a:
o CJ
WATER CONTENT (%)
Figure 5.29 Effect of nominal water content on the strength of CCWR specimens at
different curing time (10% OPC).
~*c to r~sS
OO
Ui
CO
OH
o
15 16 17
WATER CONTENT (%)
Figure 5.30 Effect of nominal water content on the strength of CCWR specimens at
different curing time (7.5% OPC).

Chapter 5. Experimental Results and Discussion 5 -
Wet mixes which contained high nominal water contents of 19.0% and
21.0% were proven to be very prone to segregation. Partial mechanical separation
of the coarse and fine constituents of the mixes were also noted. Bleeding also
occurred, which resulted in the mix water rising to the surface of the freshly poured
test specimens. Consequently, both segregation and bleeding can lead to non-
homogeneous CCWR concrete. However, although the strength of dry mixes with
nominal water contents of 12.0%, 12.6% and 13.0% appeared to be sufficiently
high, they would require more mixing water for sufficient workability and
cohesion. The importance of water content, therefore, with regard to its effect on
the strength and workability of the CCWR material is emphasised.
5.4.1 Effect of water content on the drying shrinkage of CCWR
material
The drying shrinkage of each specimen, and the average drying shrinkage,
at each drying period, namely after air drying of 2, 3, 4, 8 and 16 weeks,
expressed to the nearest 10 microstrain are presented in Tables 5.20 through 5.27.
Drying shrinkage of CCWR material varies from 684 microstrain for 12.5%
Portland cement mix (with moisture content of 19.1% dry basis) at two weeks to
2740 microstrain for 7.5% Portland cement mix (with moisture content of 19.0%
dry basis) at 16 weeks. Figure 5.31 illustrates the effect of water content on the
drying shrinkage of CCWR specimens.
It is evident from the tests that the drying shrinkage of wet mixes is larger
than that of dry mixes. In general, moisture content affects the drying shrinkage of
CCWR material as it reduces the volume of the restraining CWR. However, results
indicate that drying shrinkage is insignificant in all mixes. Generally, small
shrinkage means small microcracking and small crack connectivity, therefore,
lower permeability and moisture absorption are expected.

Chapter 5. Experimental Results and Discussion 5 -
Table 5.20 Drying shrinkage values for 1 5 . 0 % C - 1 2 . 0 % W specimens.
1 Curing time
1 (week)
j 2
i 3
j 4
j 8
16 i
Drying shrinkage values (mm)
Specimen
1
0.362
0.478
0.530
0.517
0.524
2
0.362
0.474
0.530
0.516
0.523
3
0.348
0.464
0.517
0.504
0.511
s
0.357
0.472
0.526
0.512
0.519
a n-1
0.008
0.007
0.008
0.007
0.007
Average :
drying j
shrinkage j
(microstrain)j
1390
1890 I
2100 j
2050 |
I 2080 1 ! 1
Note: Gauge length = 250mm.
Table 5.21 Drying shrinkage values for 1 5 . 0 % C - 2 1 . 0 % W specimens.
I Curing time J
(week)
| 2
1 3
j 4
i 8 i 1 i
16
Drying shrinkage values (mm)
Specimen
1
0.343 '
0.602
0.714
0.714
0.714
2
0.336
0.579
0.689
0.694
0.688
3 !
0.321
0.566
0.683
0.691
0.688
s
0.334
0.583
0.695
0.701
0.697
a n-1
0.O11
0.018
0.016
0.O15
0.015
Average j
drying j
shrinkage j
(microstrain)j
1330 J
2330 j
2780 j
2800
I 1 i ! 2800
1 Note: Gauge length = 250mm.

Chapter 5. Experimental Results and Discussion 5 - 5 6
Table 5.22 Drying shrinkage values for 12.5%C-16.5%W specimens.
Curing time
(week)
16
Drying shrinkage values (mm)
Specimen
0.242 0.236 0.233
0.443 0.437 0.433
0.534 0.529 0.523
0.607 0.607 0.605
0.615 0.617 0.616
n-1
0.237 0.005
0.438 0.005
0.529 0.006
0.606 0.001
0.616 0.001
Average
drying
shrinkage
(microstrain)
948
1750
2120
2420
2460
Note: Gauge length = 250mm.
Table 5.23 Drying shrinkage values for 12.5%C-19.1%W specimens.
1
1 1
1 1
1 1
J Curing time 1 (week)
1 i
1 i
j 2 j
i 3 j
i 4 1 1
8
16
1
0.171
0.316
0.465
0.575
0.626
Drying shrinkage
Specimen
2
0.167
0.306
0.441
0.545
0.591
3
0.176
0.322
0.468
0.584
0.638
values (mm)
-1 s
0.171
0.315
0.458
0.568
0.618
a n-1
0.005
0.008
0.015
0.020
0.024
Average j
drying J
shrinkage j
(microstrain) j
684
1260 j
1830 |
2270
2470 j
Note: Gauge length = 250mm.

Chapter 5. Experimental Results and Discussion 5 - 5 7
Table 5.24 Drying shrinkage values for 10.0%C-12.0%W specimens.
Curing 1 (week)
time
j 2
3
j 4
8
16 !
Drying shrinkage values (mm)
Specimen
1
0.256
0.303
0.384
0.471
1 0.511
2
0.249
0.295
0.374
J.
0.64l'
0.700'
3
0.257
0.303
0.387
0.465
0.517
s
0.254
0.300
0.378
0.468
i 0.514 1
a n-1
0.004
0.005
0.007
0.004
0.004
Average
drying j
shrinkage :
(microstrain) J
1020 j
1200 j
1510 j
1870
2056 | i
Note: Gauge length = 250mm.
* Drying shrinkage value abnormally high and not included in the average.
Table 5.25 Drying shrinkage values for 10.0%C-19.1%W specimens.
[Curing time [ (week)
! 2
3
4
""8~""'
i ^
Drying shrinkage values (mm)
Specimen
1
0.229
0.459
0.429
•""07517"
0.559
2
0.218
0.449
0.421
""0T50 T
0.548
3
0.235
0.479
0.446
"0.535
0.580
s
0.227
0.462
0.432
0.520
0.562
a 1 n-1
0.008
0.015
0.013
0.014
0.016
Average j
drying j
shrinkage j
(microstrain)j
910 j
1850 i
1730
2080
J 2250 ;
i
Note: Gauge length = 250mm.

Chapter 5. Experimental Results and Discussion 5 - 5 8
Table 5.26 Drying shrinkage values for 7.5%C-16.5%W specimens.
jCuring time
i (week)
2
3
i 4
8
1
0.248
0.487
0.574
0.586
Drying shrinkage
Specimen
2
0.265
0.511
0.599
0.601
3
0.252
0.487
0.576
0.583
values (mm)
__ _ _
_J__
_.
CO 1
! 0-255
j 0.495
J 0.583
j 0.590
a ' n-1
0.009
0.014
0.014
0.010
Average !
drying j
shrinkage |
(microstrain)j
1020 J
1980 ;
2330 |
2360 |
Note: Gauge length = 250mm.
Table 5.27 Drying shrinkage values for 7.5%C-19.0%W specimens.
Curing time
(week)
16
Drying shrinkage values (mm)
Specimen
0.276 0.250 0.234
0.623 0.572 0.563
0.681 0.622 0.630
0.717 0.659 0.673
0.717 0.664 0.673
n-1
4-0.253 0.021
0.586 0.033
0.644 0.032
0.683 0.030
0.685 0.028
Average
drying
shrinkage
(microstrain)
1010
2340
2580
2730
—I 2740
Note: Gauge length = 250mm.

Chapter 5. Experimental Results and Discussion 5 - 5 9
u HM tn
O u. u
O <
HM
tt
O
tt
Q
3UUU
2500
2000
1500
1000
. _ _, — p . T ,
/ • . "*"""-*
ll/f / y^
nil 11
i . i
i r —
El •
D O
•
D
A A
T » •
• = " " *
•
15%C-12%W 15%C-21%W 12.5%C-16.5%W 12.5%C-19.t%W 10%C-12%W 10%C-19.1%W 7.5%C-16.5%W 7.5%C-19%W
i
0 4 8 12 16
CURING TIME (WEEKS)
20
Figure 5.31 The effect of water content on the drying shrinkage of
CCWR specimens.
5.5 A NEW YIELD FUNCTION FOR CCWR MATERIAL
A variety of laboratory tests such as indirect tensile tests, triaxial strength
tests and unconfined compressive strength tests of CCWR specimens have been
carried out. Results of these routine material strength tests have been tabulated in
Tables 5.7 through 5.16. Table 5.28 shows the stress components at failure of
various CCWR materials generated by using the logarithmic yield function
program.

Chapter 5. Experimental Results and Discussion 5 - 6 0
Table 5.28 Comparisons of predicted and measured values for
various C C W R materials.
Mix
1
2
3
4
5
Minor Stress
o~3
(MPa)
0.00
1.39
3.75
5.56
6.95
0.00
2.09
4.17
5.56
6.95
-0.68
0.00
1.39
2.09
-0.44
0.00
0.10
0.20
0.40
-0.19
0.00
0.17
0.35
0.52
0.86
Measured Values
o"im
(MPa)
9.06
16.24
20.67
24.59
28.73
13.09
22.73
28.62
32.83
35.83
0.00
4.24
11.36
13.57
0.00
3.28
3.10
5.14
5.64
0.00
1.90
3.08
4.08
5.20
6.67
Predicted Values
<*lp
(MPa)
10.36
14.37
20.73
25.26
28.55
14.16
21.44
28.24
32.55
36.71
-0.06
4.40
11.11
13.72
0.02
3.08
3.76
4.45
5.81
0.50
1.72
2.79
3.91
4.96
7.04
Error
<*ie
(MPa)
-1.30
1.86
-1.06
-0.67
0.17
-1.07
1.29
0.39
0.28
-0.87
0.06
-0.16
0.26
-0.16
-0.02
0.20
-0.67
0.69
-0.17
-0.50
0.18
0.29
0.17
0.23
-0.38
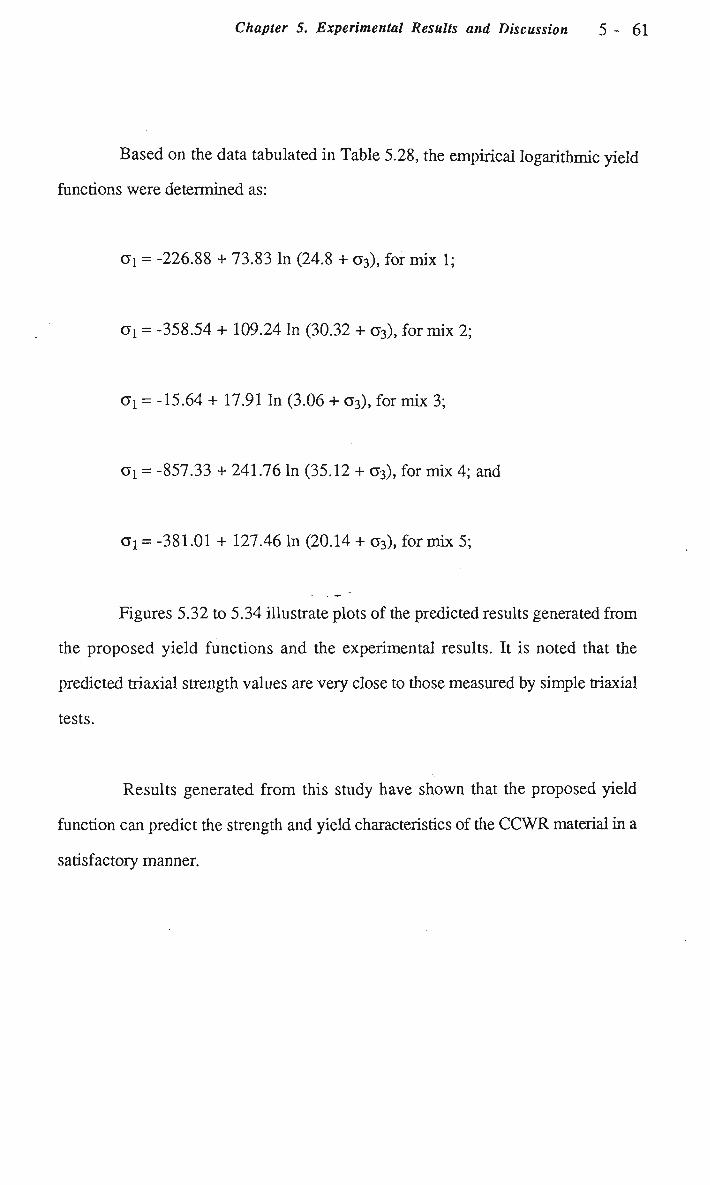
Chapter 5. Experimental Results and Discussion 5 - 6 1
Based on the data tabulated in Table 5.28, the empirical logarithmic yield
functions were determined as:
0"! = -226.88 + 73.83 ln (24.8 + 03), for mix 1;
Oi = -358.54 + 109.24 In (30.32 + a3), for mix 2;
Gl = -15.64 + 17.91 In (3.06 + o3), for mix 3;
0"! = -857.33 + 241.76 ln (35.12 + a3), for mix 4; and
Oi = -381.01 + 127.46 ln (20.14 + 03), for mix 5;
Figures 5.32 to 5.34 illustrate plots of the predicted results generated from
the proposed yield functions and the experimental results. It is noted that the
predicted triaxial strength values are very close to those measured by simple triaxial
tests.
Results generated from this study have shown that the proposed yield
function can predict the strength and yield characteristics of the C C W R material in a
satisfactory manner.

Chapter 5. Experimental Results and Discussion
1 1
< CL.
D tfi tfi
Ed
fe
<
U z
ci O •-> <
./ I.
40
35
30
25
20
15
71
5
»
-
•
>
Measured
J/ &/
. , i .
\
Predicted
t . , . i
-5.0 -2.5 0.0 2.5 5.0 7.5 10.0
MINOR PRINCIPAL STRESS c3 (MPA)
Figure 5.32 Measured and predicted triaxial strengths of CCWR mix
1
< CU
D" C/3
to
w a fe < OH l-H
u z S a. o
1
JL- 1
40
35
30
25
20
15
5
>
-
/
/ ^ r Predicted
i . i
r 'Qfc>
Measured
i . i
-5.0 -2.5 0.0 2.5 5.0 7.5 10.0
MINOR PRINCIPAL STRESS 03 (MPA)
Figure 5.33 Measured and predicted triaxial strengths of C C W R mix

Chapter 5. Experimental Results and Discussion 5 - 6 3
• — * - " 1 1 1 • i . — i ' • » • i
-0.50 -0.25 0.00 0.25 0.50 0.75 ).00
MINOR PRINCIPAL STRESS o3 (MPA)
Figure 5.34 Measured and predicted triaxial strengths of CCWR mix 4.
5.6 EFFECT OF WATER CONTENT ON THE FLOW
PROPERTIES OF CWR
5.6.1 Slump test results
The relationship between water content and slump values is given in Table
5.29. The effect of water content on the slump values of CWR is presented in
Figure 5.35. It is apparent that variation in water content of CWR results in variable
slumps. CWR with a nominal water content of 2.0% exhibits a high shear slump
value of 130.0mm. This is an indication of the lack of cohesion in the material. At
5.0% water content, a zero slump was measured indicating a material of stiff
consistency. As water content was increased from 5.0% to 15.0%, a relatively
small increase in the slump value was observed.

Chapter 5. Experimental Results and Discussion 5 - 6 4
Table 5.29 Slump test results of C W R .
Water
Content
C/O
1.9
a. 2.0 b. 2.0
3.0
a. S.O b. 5.0 c. S.O
7.5 a.10.0
b.10.0 „ c.10.0 a.13.0
b.15.0 a.20.0
b.20.0 c.20.0 a.25.0
b.25.0 a. 30.0
b.30.0
Slump
Values
Cmm)
50 130 135
0 0 0
0 10
15 10
15
20 145
170 185 150
210 233
200
Teiap.of
Water
O O
17.0 17.0 17.0
17.0
17.0 17.0 17.0
17.0 17.0
17.0 17.0
17.0
17.0
16.5
17.0 17.0
17.0
17.0 17.0
17.0
Temp.of
Atmosphere
O C >
18.0 18.0 18.0
18.0
18.0 18.0 18.0
18.0 18.0
18.0 - 18.0
18.0
18.0
18.0
18.0 18.0
18.0
18.0
18.0
18.0
Remarks
Shear slump yas observed, a. dry mv x. Shear slump yas observed, a. dry mix. Shear slump yas observed. a dry mv x No slump value can be measured as the mix, stuck, to the val I of slump cone. A very stiff, mix vas observed. A very stiff, mix vas observed. Again a very stiff mtx vas observed. Again a very stiff mtx vas observed. True slymp_vas. , observed. Particles pf the mix appeared to be .coaled vt t h vat er. True slump vas obs er ved. Again, true slump vas observed.
True slump.vas . observed. A mix oi good consistence. True slump vas obser ved. Shear slumo^yas. observed. The mv x vas, saturated vi t h vater. Shear slump vas obs er ved. Shear slump vas obs er ved.
Collapsed slump vas observed. Evidence of some Iree vat er . Collapsed slump vas obs er ved. Laterally collapsed slump vas observed. The mix yas. pyer-savuraled w t h vat er.
Laterally collapsed slump vas observed.

Chapter 5. Experimental Results and Discussion 5 - 6 5
T > 1 • 1 > I 1
B B -
B Q
B B B
_ l ' • I • i
50 100 150 200 250
SLUMP (mm)
Figure 5.35 Effect of water content on the slump values of CWR.
It is important to note that in the rather dry range no variation can be
detected between materials of different workability. From 15.0% to 20.0% water
content the slump is more sensitive to variations in workability. However, for CWR
with water content in the range between 20.0% and 30.0%, widely different values
of slump were obtained for different samples with the same water content.
It is noted that from 5.0% to 30.0% water content the slump value of
CWR shows a near linear relationship to water content. As water content of CWR
increases, its slump value also increases, but not proportionately. This does agree
with the finding of Lerche and Renetzeder (1984).
$
H Z H Z
o u ca w H <

Chapter 5. Experimental Results and Discussion 5 - 6 6
5.6.2 Flow test results
For the first series of flow tests, in which CWR was used, the average
values of flowability for each slope (38.5° , 45.0° and 50.0°) are plotted against
water content in Figures AII7.1 through AH7.3 (in Appendix AII7), respectively,
indicating the effect of water content on the flowability of C W R . A comparison of
the flowability of C W R for all mixes at different slopes is shown in Figure 5.36.
The individual flow factor (FF) measurement of flow tests are shown in Tables
AII7.1 through AII7.7.
For brevity the individual flow factor (FF) measurement of flow tests of
different oil samples is not presented in this thesis. However, the kinematic
viscosity-flow factor graphs for different oil samples are plotted in Figures AH7.4
through AII7.6.
Flow tests of different oil samples were conducted with a view to
calibrating the flow-tube. The technique employed is to pass each oil sample with a
known kinematic viscosity (cST) through measurement of time. The practical
significant of this lies in the fact that, provided that accurate time measurement of
the discharge is maintained, flow factors of oil samples and C W R with different
nominal water content will be direcdy comparable.
5.6.3 Discussion of flow test results
The effect of water content on the flowability of CWR is shown in Figure
5.37. Test results show that C W R with a low water content of 2.0% have high
flowability and this is reflected by an equally high slump value of 130.0mm. C W R
was observed to develop into a very stiff material as the water content was increased
to 5.0% (slump value = 0). Consequently, there was a notable decrease in the

Chapter 5. Experimental Results and Discussion 5 - 67
flowability of C W R at test slopes of 45° and 50°, and an even more significant
decrease observed at 38.5°. In practice, C W R with a water content of 5 % will
require a certain amount of energy to initiate the flow, but once its shear strength is
exceeded it will flow with minimal energy, and this is a characteristic of a so called
Bingham fluid.
At 10% water content, CWR exhibits good flowability. There was a
marked decrease in the flowability of C W R as its water content was increased to
15.0%. This appeared to be a very cohesive material with a low slump of 15.0mm,
exhibiting minimum flowability. The importance of the 15.0% water content in
relation to the flow properties of C W R is emphasized.
The increase in flowability for CWR with water content from 15.0% to
30.0% is quite pronounced and this is reflected by a corresponding overall increase
in slump values. Furthermore, the flowability value within this range of water
content shows a linear relationship to both water content and slump value. The
comparisons of C W R with different water contents with regard to flowability and
slump value should indicate the overall typical effect of water content on its flow
properties.
Atkins et al. (1987) reported that the degree of saturation (water content) is
one of the most important factors governing the pumpability or flowability of C W R ,
as the variation in water content influences the quantity of the material to be
pumped. They further stressed that solids concentration and void ratio also
influenced the pumpability of C W R , the most important factors being particle size
of the solids, water content and solid concentrations. The author's findings are in
complete agreement with these statements. It is important to note that chemical
composition of C W R , and in particular the presence of relatively cohesive

Chapter 5. Experimental Results and Discussion 5 - 6 8
compounds like clay minerals, is of decisive importance to its flow characteristics.
These findings agree with those of Lerche and Renetzeder (1984).
H Z
w H Z o u W
35
30
25
20
15
10
0
.
•
•
1
I K ^ _ ^
:
•
' . i
: !
yS
~~ __
\
\
1 >/\
I / I J
1
j i —
: • ^ , "
I
/"
fc
/
•
^*^
, .
0 10 20 30 40 50 60 70 80 90 100 110 120
FLOW ABILITY (Flow factor1 x 100)
• Slope of tube at 38.5 degrees.
o Slope of tube at 40 degrees.
a Slope of tube at 45 degrees.
-^ Slope of tube at 50 degrees.
Figure 5.36 A Comparison of the flowability of C W R for all mixes
at different slopes.

Chapter 5. Experimental Results and Discussion 5 - 6 9
£
Z H Z O u BJ H
35
30
25
20
15
10
0
•
•
•
-
•
-
1
:
:
:
' • .. _ i ... — •
/
. — i _ i
: ; : : \
L — i •
«
• •
0 10 20 30 40 50 60 70 80 90 100
F L O W A B I L I T Y (Flow factor^ 100)
Figure 5.37 Effect of water content on the flowability of CWR.
5.7 EFFECT OF GEOMETRY ON THE PROPERTIES AND
BEHAVIOUR OF CCWR MATERIAL MODELS
Results of unconfined compressive strength tests for series VI experiments
are presented in Tables 5.30 through 5.33. Table 5.34 shows the summary of
results of series VI experiments. Figures 5.38 through 5.42 show the effect of
geometry on the properties and behaviour of CCWR material models. The results
indicate that the geometry has a significant effect on both the mechanical properties
and load deformation behaviour of CCWR material models.

Chapter 5. Experimental Results and Discussion 5 - 7 0
•S to a fi V3
D
•s c o I o D
o
ii
tn tn
cn
& B
e o in tn
•T-H
o C-H
tn
£ 3 X) O
13
O •d «J CL,
'cd OH
O
O O
in
o o Tt Tt
ON CS
o o ON ON
cs cn ON ON
cs ci
VO O N CS T-H
d d
O N
CS
d Tf
vq en o ON
cn ON
CS
cn cs
VO ON SO Tt
vd vd
cs oo in vd
CS CO
oo oo ON r-
o o o o p vq Tt cn cs cs
cs cn
oo 00
in m in in
o o oo cn CS
r> '—< ON
UH ON cn xA O ON O ON oo
tS OO CS
oo CS tX ON in vo oo OO 00
in ts- cS ON ON ON
CS
d
vo cs
VO T-H
in ON
vq cn r-oo
in Ov
TICS
d
o r- oo cs oo ON >n cn p oo tX oo
cs o q 00
cn vo in cn O oo
O ON cs'
cs cs cs
o o o o in >n o r- cs ON Tt vd in in in
oo o Tt <S
cs cn
s & s e
in in >n in in in ts r- r-
B B
r-vo vo vd in

Chapter 5. Experimental Results and Discussion 5 - 71
e o
B o o
9H
a -s
6 s
tn tn <D
£ z •4-" l^>
co C>
tn
"ie o o
O OH
e i — i
1 cd
X <
<3 P H
cd OH
a
O
z
1-1
g "o a co
fe S M
• i—(
Q
o ^o cn o vq ON U^ T-H tS
cn O N cn
on C
P • t—(
o £
/ *N CO
vo ON T-H
ON T-H
Tt Tt
OO O ON r-H
OO Tt
T-H
in T 1
ON T-H
T-H
Tt
in '—>
cs cs d o
cn in T-H
cs
»n Tt T-H
ON
Tt Tf
cn cs
r-o Tt
ts in
cs o vo in ON r- oo
ON r~ oo oo vo "* cs vq p cs cs' cs'
O O O oo O Tf O tS-
cs" cs od d ON r- o in T-H T-H CS T-H
r-Tt ON
VO
Tt
oo
o d ON
TICS ON
oo oo oo OO
in t~- O N O N O N O N
odd
O cn CS cs
d d
cn T-H
in
oo
° 2 o o O Ui
cs' ON O ON
o o o d o
cs cn
B B oo cs o
in
cn cn cs'
o o in
d o
cn O N oo Tt oo vo vo cn cn tX vd oo
o oo d oo
cn
d ON
oo
00 ON
d
cs d
in Tt O ON
oo vo O vo cn cn ts >-;
{Nj T—4 T-H T-H
IS
vo Ti
en Tt
vo
o o o vd
o o o d
o o cs cs cs
o cs *n in vo
o o o ON
<S cn TJ-
6 6 in ON Tt
o oo cn Tt
O cs

Chapter 5. Experimental Results and Discussion 5 - 7 2
if *—•>
fi cn
9 i
c o o tfi •rl
.2 « O PH
PL,
fi
O 'Jd
is CZ ^—*
C ii s~^
£-j «j CO Pj
T3 cd O 1 z
g 53
O. »T-H
O cs cn cn ON cn d oo TX
cn Tt vo CS cs cs
rs cs vq d oo cn i-H © i-1
O N O N ON
CS CS CS c-; rs r-d © ©
Tl- r-*- rs T-H T-H T-H
odd
Tt o- cs OO Tt T-H
Tt CS CS ui vd vd
cs cs cs NO o o cn ON © cs' cs' cs
© o o © © o o o © cs o* ©' T-H cn o Tt Tt Tf
cs cn
B B o vd o cs
in oo vd TICS
oo
d T-H
ON
cs rs © '
VO T-H
d
ON
r-ON in
cs cs Tt cs
o o o Tt
o o
VO vo
© ON oo oo CS CS
Tt VO T-H
ON 1—1
CS VO ©
in T-H
CS ON T—H
T—H
VO ©
© ©
VO Tt ON ON r- vo Tt Tt
ui ts ts vo T-H IT)
vd in
o o © © o © Tt vd Tt -H r^ rs
1 © cs Tf cs
cs I

Chapter 5. Experimental Results and Discussion 5 - 73
fi o
I o ii bfl
tfi
tn ii
C
Cfi
tfi
fi cn <u Q
ci o tn tn
• i-H
O PH
fi
I rt 13
<
C
hi co X ed
T3 cd O rl
o • f i
cd CM
© o cn p cn in cn cn cn cn
cd PH
O
cd
3 r^
l-H
§ 'o <u CO
S3 tj rj c3 Q
in
ON OO T-H
r~-Tt
in
d o ON T-H
rs Tt
© ©
ts ON
© o © o
Ui T-H
Tt* cn cn
o vd O N
oo
r-» Tt
oo ©
rl CS © r-H cn in cn cn
r--o Tt cn
CS ON VO vo O N r^ in in*
o o
° 2 p p d in Tt cs cs cs cs
1 in Tt T-H
cn
vo 00 in
o o in cs cn CS

Chapter 5. Experimental Results and Discussion
& tn fi Q •i-H
O
, „ cn
£ w
c o V3 ..H
o PL
"8 Id •a <
cd PH
o
Xi
ta fi CO Pj
ON
CS o
VO
in ON
cn «n T-H
cs T-H
© oo o 00 T-H
in oo VO Tt CS
cn oo Tt oo cs
in T-H
Tt cn cn
vq vq in en oq p o d cn Tt" © d ON vd © rs i—i ON i—i T-H ON
ON oo ON oo ON ON oo
cn in Tt oo cs «—! rs ON ON Tt ON rs vq Tt CS T-t T—i © © O ©
o •a ed
Pi
Tt CS ©
Tt CS ©
cn CS ©
T-H
cs ©
VO T-H
d
T-H
T-H
©
00 © d
CS cs OO O in O
cn T-H
m
ts VO Tf
ON in rs Tt ON
vo oo oo r- in rs Tt
o Tf cn
3 £
/-N T—f
s o o oo cn cs
rs VO vo vd in
© © in © ©
cn oo in cn cs *-> vo oo © cn Tt cS rs vo oo Tt cn vq Tt oo oo rX cs' cs »-H cs in in
© o o © oo © O © cn © O in Tt Tt O cS O T-I cn cn cs Tt rs cs
in m in rs
cs ©
ON VO CS Tf Tt O Tt <rH
T-I cs cs cn

Chapter 5. Experimental Results and Discussion 5 - 7 5
5.7.1 Effect of geometry on the strength of C C W R material models
Figure 5.38 shows the effect of geometry on the unconfined compressive
strength of CCWR material models. It can be noted from Figure 5.38 that generally
the unconfined compressive strength of the model decreases with the increase in the
height to diameter (H/D) ratio. The increase in model diameters from 55.5mm
through to 206.0mm results in a small increase in the strength of the model.
However, the increase in model diameters from 206.0mm through to 242.0mm
gives a marked increase in the strength of the model.
18.0
CQ ft*
X H Z H Cd H co
0.0 0.5 1.0 1.5 2.0
H/D RATIO
Figure 5.38 Effect of geometry on the unconfined compressive strength of
CCWR material models.

Chapter 5. Experimental Results and Discussion 5 - 7 6
5.7.2 Effect of geometry on the axial modulus of C C W R material
models
Figure 5.39 illustrates the effect of geometry on the axial modulus of
CCWR material models. The increase from 0.47 through to 1.44 in height to
diameter ratios of models gives a significant increase in the axial modulus of the
models. A further increase (from 1.44 through to 2.93) in the height to diameter
ratio of the model results in a decrease in the axial modulus of the model. The
optimum geometry for maximum axial modulus is the model with a height to
diameter ratio of 1.44.
a PH
CJ CO
Q O
<
<
10.0
8.5
7.0
5.5
4.0
2.5
1.0
•
•
E
f
:
1
— Q
^^
"
1
r *" *^—o
i
0.0 0.5 1.0 1.5 2.0 2.5 3.0
H/D RATIO
Figure 5.39 Effect of geometry on the axial modulus of C C W R material models.

Chapter 5. Experimental Results and Discussion 5 - 7 7
5.7.3 Effect of geometry on the Poisson's ratio of C C W R material
models
The effect of geometry on the Poisson's ratio of CCWR material models is
illustrated in Figure 5.40. It is obvious from Figure 5.40 that the increase from 0.47
through to 1.44 in height to diameter ratios of models give a marked increase in the
Poisson's ratio of the models. The Poisson's ratio of the models with height to
diameter ratios of 1.44 through to 2.93 remains relatively constant
<
co
Z o co co r-i
o ft
0.4
0.3
0.2
0.1
0.0
•
-
•
1
r
_ 1 1 • i *
•
•
0.0 0.5 1.0 1.5 2.0 2.5 3.0
H/D RATIO
Figure 5.40 Effect of geometry on the Poisson's ratio of C C W R material models.
5.7.4 Effect of geometry on the stiffness of CCWR material models
The effect of geometry on the stiffness of C C W R material models is
illustrated in Figure 5.41. Generally, the stiffness of C C W R material model
decreases with the increase in its height to diameter ratio.

Chapter 5. Experimental Results and Discussion 5 - 7 8
S E Z CO CO
Z ti ti
H co
450
375
300
225
150
75
0
'
E
•
•
£ _
,
\
\ ^
,
JU Jul LJlJUL
I 1 1 1 1
0.0 0.5 1.0 1.5
H/D RATIO
2.0 2.5 3.0
Figure 5.41 Effect of geometry on the stiffness of C C W R material models.
5.7.5 Discussion of test results
Generally, the measured strength of the model increases with the increase
in its diameter. It is indicative that the model with a lower height to diameter ratio
exhibits a corresponding greater end constraint effect. Due to the end constraint
phenomenon, confining pressures were created around the core of CCWR material
models and this increased the strength of the models. The findings from the study
are in good agreement with that reported by Vutukuri et al. (1974).
Figures 5.42 through 5.48 illustrate the observed shapes of C C W R
material models at complete failures and clearly show the effect of geometry on the

Chapter 5. Experimental Results and Discussion 5 - 7 9
load deformation behaviour of C C W R material models. Complete collapse failures
which were observed for models with high height to diameter ratios of 1.44, 1.95
and 2.93 can be described in two phases:
(i) tensional cracks appeared as the maximum compressive
strength was reached (brittle shear failure pattern); and
(ii) as the strain increased these cracks widened and large slabs
of the model surface broke away leaving a typical hour
glass failure shape, and a concentration of shear stress
along some diagonal plane within the model was observed
(this caused the model to fail in shear).
Another failure mode observed, for models with height to diameter ratios
of 0.47, 0.61 and 0.72, is the shear cone with splitting above (see Figures 5.49
through 5.51). For models with height to diameter ratios of 0.47 and 0.61, distinct
fractured regions or yielded zones were observed at surfaces of models but no
collapse occurred. It is clear that these yielded zones offer some degree of
confinement to inner cores of models. This confinement phenomenon contributes to
the higher strength of the model.
It is particularly interesting to note that there is a marked increase in the
strength of C C W R material models with diameter to height ratios of 0.61. This
increase in the strength of C C W R material models becomes comparatively small for
models with even lower height to diameter ratios than 0.61. The practical
significance of this singular aspect is that, in C C W R pack design for roof support
in a real mine situation, the width to height ratio of the pack can neither be too low
nor too high and there exists an optimal width to height ratio of the pack.

Chapter 5. Experimental Results and Discussion 5 - 8 0
For roof support in a real mine situation, if the width to height ratio of
C C W R pack is lower than 1.6, there is a danger of inadequate roof support which
can lead to complete failure of the pack support and the roof. O n the other hand, if
the width to height ratio of C C W R pack is too high, resulting in a very stiff pack
which can cause floor heave and roadway closure problem, this may involve
unacceptable cost penalties. Of course, a more detailed study on this aspect is a vast
subject on its own, therefore, more comprehensive investigations on the end
constraint effect on insitu C C W R pack and triaxial strength properties of C C W R
materials are essential. Some studies on these aspects have been carried out by the
author. The results of these findings have been reported separately in W u et al.
(1989), Hii et al. (1990a) and Zhang and Hii (1990a, 1990b).
Figure 5.42 C C W R models with distinct shear plane at complete failures
(diameter=55.5mm).

Chapter 5. Experimental Results and Discussion 5 - 81
ot
U H 16 17 l'| !« JO Jl 23
—.. —
Figure 5.43 C C W R models at complete failures (diameter=75.5mm).
Figure 5.44 C C W R models at complete failures (diameter=102.8mm).

Chapter 5. Experimental Results and Discussion 5 - 8 2
Figure 5.45 C C W R models at complete failures (diameter=149.5mm).
Figure 5.46 C C W R models at complete failures (diameter=206mm).

Chapter 5. Experimental Results and Discussion 5 - 8 3
Figure 5.47 C C W R models at complete failures (diameter=242mm).
Figure 5.48 C C W R models at complete failures (diameter=314.5mm).

Chapter 5. Experimental Results and Discussion 5 - 8 4
Z
o p
fi
^ g • - •
»^^j|
^ h/d = 0.47 ^ ^ ^
•Ha(|^*h d = 0.6ll
.^V Oh/d~T(L72j
ELEVATION A
< > Ed J Ed O
z Ed
Figure 5.49 Various C C W R models at complete failures (Elevation A).
h/d = 0.47
h/d = 0.61
h/d = 0.72
Figure 5.50 Various C C W R models at complete failures (End elevation B).

Chapter 5. Experimental Results and Discussion 5 - 8 5
h/d = 0.47
,<-«*
h/d = 0.61
h/d = 0.72
Figure 5.51 Various C C W R models at complete failures (End elevation C).

CHAPTER SIX
ALTERNATIVE METHOD OF IMPROVING GATEROAD STABILITY USING YIELD PILLAR TECHNIQUE

Chapter 6 Alternative MethodoJImproving Gateroad Stability Using Yield Pillar Technique 6 - 1
CHAPTER 6
ALTERNATIVE METHOD OF IMPROVING GATEROAD
STABILITY USING YIELD PILLAR TECHNIQUE
6.0 INTRODUCTION
In the previous Chapters emphasis has been placed on the development and
use of artificial roof supports such as pump packs, Monier 'Big Bag' chocks and
wooden chocks for strata control in underground coal mines. According to
Hebblewhite (1988), whilst there should be no major constraints apart from the cost
constraint (capital cost for installing the pump packing system) to construct center
packwalls in roadways away from the goaf abutment, there are serious limitations
imposed by the physical properties of flyash and cement based packwalls and
failures of the packwalls under the influence of the goaf abutment are inevitable.
The results of this study have shown that CCWR material can be used as a
support material, although further work needs to be conducted to investigate the
pumpability of this material. While the reinforced Monier 'Big Bag' chocks
compared favourably with the wooden chocks the steel mesh reinforcement of the
'Big Bag' chocks can be very costly and even then serious shortcomings such as
floor heave and roadway closure still exist. A n alternative method of improving
gateroad stability using yield pillar technique was therefore investigated.
A yield pillar technique analysed by the finite element method appears
suitable for simulation of excavation of roadways under different virgin stress
conditions. Comparison of stability of yield and conventional pillars in several

Chapter 6 Alternative MethodofImproving Gat ero ad Stability Using Yield Pillar Technique 6 - 2
examples substantiates the feasibility of the technique and indicates that yield pillars
are potentially capable of eliminating roof falls and floor heave in adjacent entries
and crosscuts, and pillar bumps. A procedure using finite element method has been
established for the design of yield pillar under various geological conditions (Hii
and W u , 1989).
It is well known that the concept of yielding pillar can be successfully used
in solving ground control problems (Serata, 1982, Mark et al, 1988, N e w m a n ,
1988, Hii and W u , 1989, Tsang et al, 1989). The procedure developed in this
study may also be used as a tool for pack design. Recall that both the yielding pillar
and artificial yielding pillar (pump pack) are designed to yield and absorb vertical
closure without bulging and weakening the pillar. The concept utilizes the self
support capacity and ultimately the strain hardening and softening characteristics of
the surrounding rocks to create a stress relief environment. The application of the
stress control method in yielding pillar design is presented in this Chapter. It is
emphasized that the findings from the study are applicable to pump pack design.
Another objective of this study is to stimulate further investigation into
yielding pillars which are increasingly gaining acceptance as a technique for
improving ground control in underground coal mines. It is clear that much
additional work will be required before a complete understanding of the yield pillar
phenomenon is achieved, hence suggestions for continued work are highlighted.
6.1 REVIEW OF PAST WORK
The mining industry over the last two decades, has seen a major increase in
the usage of computers in most phases of its operations. Computer literacy has
become an important requirement in the mining profession. In recent years, most
mines have been operating in deeper and more difficult conditions than before,

Chapter 6 Alternative Methodof Improving GateroadStability Using Yield Pillar Technique 6 - 3
resulting in low productivity and extremely difficult working conditions with high
roof and side stresses. In order to alleviate these problems, the yield pillar technique
has been developed and used successfully in overseas mines, deep mines in the
U.S.A. and Canada in particular (Serata, 1982, Serata et al, 1986,1987, Shephard,
1986, Ruston, 1986, Mark et al, 1988, Tsang et al, 1989). Peng's group at West
Virginia University, Morgantown, West Virginia, U.S.A., has recently been
conducting a case study on the application of the yield pillar under strong roof and
strong floor condition. The comprehensive research with the yield pillar experiment
in 315 Panel to establish the ideal pillar size has led to the successful application of
this technology to the maingate of Longwall 12 at West Cliff Colliery (Anon.
1989).
Such applied research is not always possible in the current state of the
industry, considering the high costs involved in the experiment and the often
marginal economic nature of underground mining operations. Therefore, attempts
to establish the ideal pillar sizes for the introduction of yield pillars under different
virgin stress field conditions have given rise to the use of a computerised mine
structural analysis which has the potential capacity to calculate the distribution of
overburden stresses caused by mining and the resulting loadings on any given
portion of the underground mine. In recent years, computer modelling has been
increasingly recognized as an important asset in the design and analysis of
underground rock structures (Hebblewhite, 1982, Beckett and Madrid, 1986,
Kripakov, 1987, Zhou and Zhang, 1989, Schmidt and W u , 1989, Hii and W u ,
1989). The computational power of today's computers together with sophisticated
software have enabled the application of the computer modelling technique to
provide an approximate solution to complicated rock mechanics problems not
readily solved by other means. Generally, safety and productivity may be increased
and the costs reduced if an analysis is performed.

Chapter 6 Alternative Method of Improving Gateroad Stability Using Yield Pillar Technique 6 - 4
6.1.1 Stress Control Methods
The function of strata control in underground mines is to improve roadway
stability. Two prominent forms of strata control are the active roadway support and
the roadway strata control utilising stress control methods.
Common types of active roadway supports comprise rock bolting (roof
bolting and cable bolting), cementitious and resin injection, steel and timber prop
support, steel arching, steel meshing, timber chock support, monolithic
cementitious support (Australian big bag chock) and steel-fibre-reinforced concrete
cribbing (block and donut cribbing). The main function of these supports is to
increase the strength of the pressure arch acting above the opening.
Over the last two decades, yield pillars have been used to produce and
control the redistribution of stresses around mine openings (Serata, 1982, Serata et
al, 1986, 1987, Newman, 1988, Tsang et al, 1989, Hii and Wu, 1989). The yield
pillar technique is the principal tool of stress control methods, and the control
required to achieve a desired stress condition as mentioned by Serata (1982) is
highly site-specific, varying with geological conditions, material properties, initial
stress fields, ground water conditions, discontinuity planes and other geological
anomalies. Serata (1982) has grouped the current field practice into the following
six categories of stress control techniques:
(i) Stress Relief Technique;
(ii) Parallel Room Technique;
(iii) Time-Control Technique;
(iv) Compounded Time-Control Technique;
(v) Multiple-Level Technique; and
(vi) Large Room Technique.

Chapter 6 Alternative MethodofImproving Gateroad Stability Using Yield Pillar Technique 6 - 5
Detailed descriptions of all the six stress control techniques have been reported in
Serata (1982).
The stress control technology which has found extensive use in salt and
potash mines has been expanded to a wide variety of underground mine openings in
various weak grounds including coal mines through more than two decades of field
experience. In Australia, pillar systems utilising yield pillar technology is now
finding application in underground coal mines but only on an extremely limited
scale. The main reasons for the limited application have been the lack of general
appreciation of the rock mechanics principles involved in yielding pillar technology
and the mining legislation which controls the size of the pillars in underground coal
mines (Marshall and Lama, 1986). However, this technology is becoming widely
used in deep underground mines for stabilizing openings in weak and complex
grounds.
Recently three stress control methods such as pillar extraction on the
advance, stress relief headings and yield pillar technique have been used in
Australian underground coal mines. It has been demonstrated in practice that these
stress control techniques can reduce the extent of lateral stress acting within the
pressure arch by decreasing the lateral constraint in the roof strata.
6.2 Theoretical Considerations of Stress Control Design
Openings in underground coal mines excavated by room and pillar method
experience the highest concentration of shear stress which is potentially destructive,
and according to Serata et al. (1986) this is due to the formation of a stress envelope
around each individual opening as shown in Figure 6.1. This high concentration of
shear stress may cause roof and floor failures if the strength of the surrounding

Chapter 6 Alternative Method of Improving Gateroad Stability Using Yield Pillar Technique 6 - 6
rocks is lower than the shear stress. Stress control method can be used to relocate
these destructive stress envelopes away from the individual room boundaries and
this may be achieved by grouping the room closely as also illustrated in Figure 6.1.
However, this must, be done by first excavating the two side rooms follow by the
middle room (Serata et al, 1986)
CONVENTIONAL ROOM-AND-PILLAR ENTRY
Figure 6.1. Principle of stress control method which is illustrated by three-
room "stress-controlled" entry and this is formed by grouping
three isolated conventional rooms very close together, and
hence transforming three primary destructive stress envelopes
into a single secondary protective stress envelope.
(after Serata etal, 1986)

Chapter 6 Alternative MethodofImproving Gateroad Stability Using Yield Pillar Technique 6 - 7
Since the protective stress envelope is formed as a direct and natural
reaction to both the overburden and lateral tectonic stresses it takes the entire burden
of those stresses, and as mentioned by Serata et al. (1986) the yielding pillars which
accommodates the deformation do not actually fail as they are protected and stress
relieved by the formation of the so called protective stress envelope. An important
feature of this stress control technique is that the immediate roof and floor which are
located inside the protective stress envelope are also stress relieved, and they form a
natural protective lining for the final protective stress envelope.
As mentioned earlier, the design of a stress controlled entry in an
underground coal mine can be highly site-specific and two major factors are to be
considered for any given coal seam. Firstly, there is the operation factor such as the
desired number of rooms to be grouped into a single entry and the desired width of
individual rooms within the entry. Secondly, the so called "live" geomechanical
factor which is both time dependent and site specific, and this comprises the virgin
stress fields and the material properties of coal and the surrounding rocks (Serata et
al, 1986).
It is important to note that in a steady state, the rate of hardening is
balanced by that of softening and therefore the strength enhancement due to
hardening is essentially nil (Hambley, 1989). However, the stress relief due to the
development of a pressure arch as mentioned above does undeniably occur, hence,
the idea of protecting openings using the concept of a pressure arch is valid.
Chapter 6 Alternative Methodof Improving Gateroad Stability Using Yield Pillar Technique 6 - 8
6.3 EFFECT OF VIRGIN STRESS FIELDS ON THE
FEASIBILITY STUDY OF YIELD PILLAR TECHNIQUE
In general, a yield pillar is designed to yield or crush in a controlled
fashion throughout its width and to provide locally resilient support in the mine
excavation while operating in a plastic mode, at a factor of safety less than unity.
Contrary to the traditional concept of pillar design, in yield pillar design a relatively
small pillar is designed to yield as soon as it is being developed, and its original
load is transferred to the adjacent pillars (Tsang et al, 1989).
In Australia, yield pillars have been used in West Cliff Colliery, NSW, and
it has been demonstrated that they can improve entry stability and control floor
heave problems (Anon. 1989). However, the existing yield pillar design is mostly
based on trials and errors, and the mechanisms and limitations of yield pillar
technique are still not well understood.
It is well known that the duration of yielding of coal and rocks before
collapse depends on the initial loading condition material properties, and as long as
the rate of yielding is in the safe range, the overall stability condition for the entry-
pillar system may be maintained for the required service life time. The design of
yield pillars therefore must take into account the overall stability of the surrounding
geology and the orientation and direction of stress. For safe mining operations, a
yield pillar must satisfy two basic requirements (Tsang et al, 1989): firstly, it
should yield totally after development so that its load can be transferred, and
secondly, it should sustain and maintain good working conditions in the adjacent
entries for the intended service life period.
If the yield pillar satisfies both the abovementioned requirements it is
defined as a stable or functional yield pillar, however, if it only satisfies the first

Chapter 6 Alternative MethodofImproving Gateroad Stability Using Yield Pillar Technique 6 - 9
requirement it is considered to be an unstable or unfunctionable yield pillar. It
should be noted that a yield pillar is less stable than a stiff pillar but by considering
the overall stability condition, a yield pillar may provide the best results and also it
may be the only alternative design for certain geological conditions.
In this study, the mechanisms of yield pillar were discussed. This Section
presents an application of the finite element method to investigate the feasibility of
using the yield pillar technique under different virgin stress field conditions in
Australian underground mining operations. A given portion of an underground
mine in the Southern Coalfields, NSW, Australia is specified as a grid and the
program then calculates the two dimensional ground stresses and deformations
resulting from the formation of both the yield pillar and the conventional pillar.
6.3.1 Method of analysis
The finite element method is employed for the computation of stresses in
pillars under various virgin stress fields. The factor of safety of the pillar is
evaluated according to the ratio of the computed stress and the strength of rocks.
6.3.2 Computation of stresses in pillars
Stresses in pillars are computed by using an excavation model (Brown and
Booker, 1984, Schmidt, Wu and Lu, 1989), in which the loading or the unloading
history of stresses during the formation of pillars can be simulated. Figure 6.2
shows the formation of Pillar A, that is, by excavating Roadways 1 and 2. Stresses
in Pillar A are computed as:
°A=OAO+AOA (6.1)

Chapter 6 Alternative Method of Improving Gateroad Stability Using Yield Pillar Technique 6 - 1 0
where
a A is the redistributed stress in the pillar,
GA0 is the virgin stress determined by in-situ stress measurement; and
AoA is the increment of stress in the pillar due to the excavation of roadways 1 and
2 and it can be computed by the finite element procedure, the details of which
is presented in the following.
coal yield pillar A coal
roadway B B | roadway
width = 8.5m
H
Figure 6.2 Formation of Pillar A.
The finite element formulae used for the computation of pillar stress can be
obtained from the virtual work principle. Consider a domain Cl with a boundary T
the virtual work equation governing the behaviour of the domain can be expressed
in an incremental form as:
I Se A a d n = 6 u T A b v d Q + 8u TApdT JQ
Jn jr
(6.2)

Chapter 6 Alternative Method of Improving Gateroad Stability Using Yield Pillar Technique 6 - 1 1
where
8u and 8e are the virtual displacements and the corressponding strain in domain Q;
Aby denotes the increment of body force; and
Ap denotes the increment of boundary traction.
To solve eq.(6.2) numerically, the domain Q is discretized into a number
of elements Q.e connected at the nodes. Consequently, the boundary T is also
divided into a number of boundary element Te. In each element, the displacement
field is approximated by:
{Au} = [N] {Aa} (6.3)
where
[N] is the matrix of specified shape functions; and
{Aa} is the vector of nodal displacement increments.
From eq.(6.3) both the strain and stress increments can be expressed in
terms of nodal displacement increment {Aa} as:
{Ae} = [B] {Aa} (6-4)
{Ao} = [D]ep [B] {Aa} or {Ao} = [D] [B] {Aa} + {Ac0} (6.5)
where
[D], Pep] are the elasticity matrix and elastic-plastic matrix respectively;
[B] is the derivative matrix of [N];

Chapter 6 Alternative Method of Improving Gateroad Stability Using Yield Pillar Technique 6 - 1 2
{A<J0} is the initial stress increment.
The substitution of eqs. (6.3), (6.4) and (6.5) into eq. (6.2) produces:
{Aa} I [B]T[D][B]dQ{Aa} = {Aa> f[N]T{Abv} d Q - { A a }T [ [B]T{Aox}dQ
+ {Aa}j [B]T{Ap}dT (6.6)
Due to the arbitrary, {Aa}T in eq. (6.6) can be deleted. And then by
abbreviating the notation, there results:
[K] {Aa} = [AFV] - [AFJ + [AFJ (6.7)
with
[K]=l [B]T[D][B]dD
[AFV] = [N]T{Abv}d<3
[AFJ == | [B]T{Ao0} d Q
[AFJ - ) [N]T{Ap}dQ
where
[K] is the stiffness matrix;

Chapter6 Alternative MethodofImproving Gateroad Stability Using Yield Pillar Technique 6 - 1 3
[AFV] is the nodal force due to the increment of the body force;
[AF0] denotes the iterative term of the nodal force; and
[AFt] denotes the boundary traction, which, in the current computation model is the
stress relaxation at the excavation boundary due to the excavation of
Roadways 1 and 2.
Eq. (6.7) is a nonlinear equation because [AF0] depends on Ao0, and Aa0,
in turn, depends on o. Therefore an iterative procedure is used for the computation.
Figure 6.3 shows the flow chart of the computation procedures.

Chapter 6 Alternative Method of Improving Gateroad Stability Using Yield Pillar Technique 6 - 1 4
(Stan)
( Data input J
Generate finite element mesh
Compute load matrix
Form elastic stiffness matrix K
Decompose K into L D L
Load step i = 1 j
Calculate load increment at step i AFi = WiF(Wi< 1, ZWj= 1)
Solve (LDL )AUi = AFi For AUj
Compute elastic stress increment
A 0) from A U J
Update a^Oj.i + AOj
Ui=Ui-l H-AUi
No
Yes
T

Chapter 6 Alternative Method of Improving Gateroad Stability Using Yield Pillar Technique 6 - 1 5
4
•
No
Compute elastic-plastic stress increment A a
Modified stress and compute initial stress
A a „
Calculate nodal force A F 0 due to
initial stress A a„
Yes
No
Print and plot results
JL
Stop
No
Yes
5
A
a 'i
Calculate nodal force
due to stress relaxation
Figure 6.3 Flow chart of the iterative scheme.

Chapter 6 Alternative Method of Improving Gateroad Stability Using Yield Pillar Technique 6 - 16
6.3.3 Determination of the factor of safety
Once the stress in any point of the pillar is obtained, the factor of safety at
that point can be evaluated as the ratio of the strength and the stress, that is,
o"s (ox) S F = s 3
°i (6.3)
where SF is the safety factor; as (o3) is the strength of the rock, which is the
function of a3; Oi denotes the major principal stress; and a 3 denotes the minor
principal stress.
6.3.4 Scheme of analysis
Two illustrative examples are designed to investigate the feasibility of
using yield pillar under different virgin stress fields.
Illustrative example 1 considers the stability of a yield pillar under various
virgin stress fields. The width of the pillar adopted is 8.5m, and the finite element
mesh generated is shown in Figure 6.4.
Illustrative example 2 considers the stability of a conventional pillar under
the same virgin stress field as in example 1. The width of the pillar is taken as 30m.
In both examples, five cases of virgin stress field are considered, and this
is tabulated in Table 6.1. Table 6.2 shows the properties of rocks used in the
analysis of the illustrative examples.

Chapter 6 Alternative Method of Improving Gateroad Stability Using Yield Pillar Technique 6 - 1 7
T • • • I I I • • • l y j i . . . , . -
-.
Figure 6.4 Finite element mesh for yield pillar scheme.
Rock 2
Rockl
Coal
Rockl
Rock 2
Scale: . . 5 m
Table 6.1 Virgin stress fields.
Case
Horizontal stress aoh (MPa)
Vertical stress oov (MPa)
Ratio k aoh / °ov
1
-5
-10
0.5
2
-10
-10
1
3
-15
-10
1.5
4
-20
-10
2.0
5
-25
-10
2.5

Chapter 6 Alternative Method of Improving Gateroad Stability Using Yield Pillar Technique 6 - 1 8
Table 6.2 Properties of rocks.
Parameters
Coal
Rockl
Rock 2
Young's modulus
(MPa)
1000
2000
3000
Poisson's ratio
0.3
0.25
0.25
Cohesive strength
(MPa)
0.4
1.5
3.0
Angle of friction
(°)
35
37
37
Tensile strength
(MPa)
0.01
0.1
0.2
Residual cohesive strength
(MPa)
0.15
0.6
1.2
Residual angle of fiiction
(°)
28
30
30
6.4 RESULTS AND DISCUSSION
Figures 6.5 and 6.6 show the principal stress distribution for both the yield
pillar and the conventional pillar under Case 5. It is indicative that the horizontal
stress relaxation occurs in the entire yield pillar. In the conventional pillar,
however, the horizontal stress relaxation only occurs in the two sides of the pillar.
The computed maximum stress at the centre of the conventional pillar is the
horizontal stress, and no significant horizontal stress relaxation takes place.
Figure 6.7 illustrates the distribution of horizontal and vertical stresses
along the cross sections of both the yield pillar and the conventional pillar under
Case 5. It is evident that a significant relaxation of horizontal stresses occurs
approximately 4m from the edge of the pillars. The results indicate that the average
deviator stress of the yield pillar is smaller than that of the conventional pillars.

Chapter 6 Alternative Method of Improving Gateroad Stability Using Y ield Pillar Technique 6 - 1 9
•4- I'I l'-t--4--4- I I i -fr- i i i i H - H - H - i i i i -I 1—I—I 1 l-H I-4H K-
-I »—t—I 1 1 1 1- |.|--t- -4- -*-• I I I.-4-H »— —I—I—I 1—
-l-IH H-1 • I '•! -1-1 -4- -*-• I I l-H 1 1- I I -4-
. | „ | i | • • | . • | H 1 — + . -4- I I I -4-H 1- I I I -4-
-4- I I I I I I I . |.|.-f-
-I 1-+—I 1 1 1 1—*H »-
—•— —«—I—I 1 t-H 1—+H t-
— — • * • » - * * ; • « * . • * . - — — r*-**>"*»»••. •+• •*• Jf rJ*i*-_*-—-.-xcMfc.-*. -*---S*g- "*••*•* * «g*r^ '— ^fcSC • » ; * * > J*>^- ~*^«j*^ **. •*-
Jkr Jtr
Jr X t I + + « I •*- X \.1
"*-"*." , "*• **• **5*&- • - » • . * • . * • • * . "fc, "<»?fc, »-»- jf Jr t. •%. "siZ*£+^ — ,*•»- jf Jr
•*. •*. «*&W»^———~-^*vmr JC .+- f. •*.-*wj^.-»___—>*-.*i*-.*- A- f. •*. -*r»c^.-«—.—-^i*i*- -*- -*-
l \ X -f- + X ^ i M X + + + « i l t X •*- "f- X Vt
^k=^.^^i i t £&L J&'"* i i £&U.~ J&* * x \ X -f- + X / # ' • + + + + « i
'./ X + •*• X Vt
» \ X -f-I « + -+-» / X •+•
•4- •f-'l'l'l-' I- <-• I I 1 1 - 4 -
-t-H-l- I 1 1 M- I • I . I -t- -4- -«_ -| 1.|. | 1 1 l-.tn-l.t-
-*-•< I I H l-H- I • I I H- -4- H- -
•4- -f- • I • I • I H + H t — H t-
H t-t—I 1 1 1 t—t-i I-
•4- I I I H--4- I I I I H -
I III -4-H-H- I I I -4-
H- -4-'l I I -4--4--4--I • I I •-!- -4- -#- H - I I I 1- I I I I I H - -4- -4- -4-1 l-l -4--4-H- I I I -4- -4-
Scale: t • 2.5 m
, , 50 MPa
Figure 6.5 Principal stress field in the yield pillar scheme.
« »«l» » « « ' • « .*. •* -»"»^^^^'*- • H- *• • * » « • » ^ ^ » 4 . »
•»• » »» • » • « " • « •
•*• <l «* « »—» • ' ^ ^ '
«• « » n ft •*•»•• *• . .*. -».»^« ..
.4. *. ^ « « i i i » •
^ ^. ^^^II •••—• -*
Mr- -N •» » » I » ' I H »•
^ • » " » ' » ^ "
^ *• • — 4 1 »"•« « «« •«'
^, .». ->.«-»• -»-
••• > «» *.4 < ^ » < -
t^M», » ^ ^ ~
• »»-<..»^l»^«
^, -K -»—«• • > > • • »
^. ^. •«••»« t » • •
_ta *. - ^ » t ^•^•-
^ ^ - ^ « « • « ' « • < » • * • '
• •^ »»'ti<*i <w
-*. ^ ^ I » » . » » ^ . . » - » . ^ • * ^. -*. ^ ^.^ <'••-
^- ^ -t * » » * ^ •'• «•
i t4 » I »•> - * ^ ^ ^- ^ • • ^ 1' > ••• '
^. ^- ^ ^ •* • ^ '<<* •
Scale: i i 5 m 100 MPa
Figure 6.6 Principal stress field in the conventional pillar scheme.

Chapter6 Alternative Methodof Improving Gateroad Stability Using Yield Pillar Technique 6 - 2 0
in in
O
c o N "C
o
£ cs
ca
D. 13 c o •rs c a >
c o U
"3 o 00
"3 c • l-H
OH <+H
o c o • -H 4-1
o a m
i in
m
s O rt bfl C O
13 oo fi oo
<+-(
O G O •d 3 Xl
LH
D H
Q r-^d <u LH
3 bfl
CS o m m .J o
(MW) SS9J5S

Chapter 6 Alternative Methodof Improving Gateroad Stability Using Yield Pillar Technique 6 - 2 1
Figure 6.8 shows the average safety factor of the cross section of the pillar
versus the ratio of the vertical virgin stress and the horizontal virgin stress. It is
clear that, in the case of high horizontal virgin stress fields, k is greater than 1.6,
the yield pillar is more stable than the conventional pillar even though the width of
the yield pillar is much smaller. However, in the case of low horizontal virgin stress
fields, the conventional pillar exhibits comparatively greater stability than the yield
pillar.
2.5
2.0
I L5 t*s
<H-H
o LH
o 4—1
O
£ xo
0.5 -
0.0
conventional pillar
yield pillar
/
1 2
Ratio k (a0h/ o~ov)
Figure 6.8 Safety factor versus k (a0h/ oov)

Chapter 6 Alternative Methodof Improving Gateroad Stability Using Yield Pillar Technique 6 - 2 2
6.5 CONCLUSIONS
The finite element method may be successfully employed to investigate the
feasibility of using the yield pillar technique under different virgin stress field
conditions. It is demonstrated that when k, the ratio of the horizontal virgin stress
and the vertical virgin stress, is greater than 1.6, the yield pillar technique can be
successfully used, and a greater pillar stability is achievable. On the other hand, if
the ratio k is not greater than 1.6, a decrease in the pillar width will give a lower
safety factor of the pillar.
It is suggested that there exists an optimal pillar width for a particular ratio
of k. The pillar design using the optimal pillar width will exhibit the highest safety
factor of the pillar.
Further work should include:
(i) an experimental research to verify the numerical results, and
(ii) the development of nomographs, from which the optimal
width of the pillar can be determined for a particular ratio k.

CHAPTER SEVEN
CONCLUSIONS

Chapter 7. Conclusions 7 - 1
CHAPTER 7
CONCLUSIONS
From a review of strata control theories and overseas successes in
achieving effective strata control using monolithic pump packing techniques it can
be concluded that a study into the introduction of pump packing technology to
Australian coal mining operations is warranted.
It can be inferred from the literature survey that the selection of any type of
packing material for use in the Australian coal mines would obviously be influenced
by the availability of the product at a competitive price and its function as a support
material. Given the existing environmental constraints imposed on the coal mine
operators, the utilization of C W R as a packing material is an attractive proposition.
In the likely event of high tonnage demand for packing material, the
processed C W R can be piped down from the surface to the packing site, where it
will be readily mixed with other ingredients and pumped into the pack form or bag.
In general, pump packs are designed to yield and thus control
convergence, and are often built to an optimum size to save manpower and material
costs. In addition, as German experience has shown, pump packs greater than a
critical width lead to floor heave as the packs do not yield under load (Lewis and
Stace, 1981).

Chapter 7. Conclusions 7 - 2
Extensive field trials and studies over the years have established the
following criteria for pack strengths (Whittaker et al, 1977, Issac et al, 1982, Smart
et al, 1982a, 1982b, Buddery, 1984, Clark and Newson, 1985, Smart, 1986, Isaac
and Payne, 1986). The strength of 0.1 MPa for deshuttering purposes, and initial
strengths of 0.4 - 0.5 MPa in 4 hours, and 1-1.4 MPa in 24 hours are desirable. A
more important criterion is that the pack should be able to develop strength as
quickly as possible, and the final strength should be in the order of 6 -10 MPa.
It is important to note that the above criteria for pack strength apply
especially for the United Kingdom conditions. Therefore, it is in the opinion of the
author that the pack strength for Australian conditions should be higher in order to
accommodate the excessive load of the massive sandstone roof (Hii and Aziz,
1986a). However, the required pack strength for Australian underground coal
mines should be quantified from field trials and in-situ monitoring programmes.
The planning of an efficient pump packing system requires a high level of
prediction, both of geological conditions and those likely to be caused by mining. It
is noted that the continued effective control of the roof strata in the vicinity of a
roadway can only be achieved when the pack supports are capable of sustaining the
variations which arise from the changing mine layout, the ground stress conditions
and the variations in the geological conditions.
An attempt has been made to emphasise the importance of understanding
the tectonic forces which prevail in mining. Consequently, an improvement in this
understanding can help to effectively control these forces by the selective use of
pump packing systems.
The integrated methods of colliery waste disposal for ground control as
proposed by Atkins et al. (1986) are of particular interest to the coal mining

Chapter 7. Conclusions 7 - 3
industry. The pump packing system using C C W R material undoubtedly will have a
large contribution to make to the Australian mining industry in the foreseeable
future.
The experimental investigation has shown that the use of CCWR pack
material is a major step in the development of a cost-effective pack. The laboratory
study has greatly improved understanding of the mechanical properties and
behaviour of the pack material produced.
Laboratory tests performed on the experimentally formulated CCWR
specimens of varying mix compositions have shown great promise towards
monolithic pack material applications. However, results indicate that water content
and calcium chloride admixture must be very closely controlled to ensure optimum
pack quality, as confirmed by overseas studies in similar research work (Lerche and
Renetzeder, 1984, Zadeh et al, 1987).
It is shown that the relationship between the strength S and curing time t of
a CCWR material mix can be described by the following equation:
S=A-exp(-B/f°-5) (3.5)
The response surface methodology is shown to be valid for the analysis of
test results presented and it is suggested to be used as a general method in the study
of the optimum design of CCWR materials. For CCWR materials the unconfined
compressive strength can be calculated from the compositions of a mix using
equations (3.14) and (3.15).

Chapter 7. Conclusions 7 - 4
As expected an increase in the strength of CCWR materials can be attained
either by decreasing the water content or increasing the quantity of OPC used in the
mixtures.
It has been demonstrated that the proposed logarithmic yield function can
predict the strength and yield characteristics of CCWR materials in a satisfactory
manner. The general form of the proposed yield function can be expressed as
follows:
a1 = A + Bln(o3-i-C) (3.16)
The following conclusions can be drawn from the present investigation
concerning the effect of water content on the mechanical properties of CCWR
material containing calcium chloride admixture:
(i) For any length of curing time up to 28 days, the strength of
CCWR material markedly decreases as the water content
increases.
(ii) The decrease in ultimate unconfined compressive strength
due to an increase in water content for CCWR material test
specimens at lower curing time spans is quite significant.
The practical significance of this aspect is that the water
content must be very closely controlled to ensure high early
strength of CCWR concrete which is rather essential for
successful monolithic pack applications.
(iii) Test results indicate that the drying shrinkage of CCWR
material is insignificant in all mixes.

Chapter 7. Conclusions 7 - 5
(iv) The importance of water content with regard to its effect on
strength, workability and other related mechanical
properties of CCWR material is emphasised.
The initial test results of the study have revealed the effect of water content
on flow properties of CWR. The importance of the effect of water content and other
related parameters on the flow characteristics of CWR has been emphasised by the
author and various researchers (Lerche and Renetzeder, 1984; Verkerk, 1986 and
Atkins et al, 1987). Based on the results of this investigation the following
statements appear justified:
(i) CWR with a nominal water content in the region of 15.0%
exhibits undesirable flow characteristics, and this is
manifested by its relatively low flowability behaviour.
(ii) Within the range from 15.0% to 30.0% water content, the
flowability of CWR shows a linearly increasing
relationship to both water content and slump value.
(iii) The presence of very fine grains (less than 0.2mm),
amounting to about 1.25 weight percentage, appeared to be
remarkably beneficial under all flow conditions of the
study. They were observed to form a very thin film at the
inner wall of the flow-tube. Lerche and Renetzeder (1984)
have shown similar finding to that described above.
Because of their practical significance, this would bear
further confirmation for other flow and pumping conditions
of interest.

Chapter 7. Conclusions 7 - 6
The results indicate that geometry has a significant effect on both the
mechanical properties and load deformation characteristics of CCWR material
models. The measured strength of the model increases with the increase in its
diameter. It is indicative that the model with a higher width to height ratio exhibits a
corresponding greater end constraint effect. Due to the end constraint phenomenon,
confining pressures were created around the core of CCWR material models and
this increased the strength of the models. Of course, a more detailed study on this
aspect is a vast subject on its own, therefore, more investigations on the end
constraint effect on insitu CCWR pack and triaxial strength properties of CCWR
materials are essential.
It is envisaged that the results obtained can serve as a realistic basis for
numerical analysis of underground pack under variable geological and stress
conditions. The experimental data of the material models generated from this study
may also be used as a guide in the pack design in underground coal mining
operations.
The finite element method may be successfully employed to investigate the
feasibility of using the yield pillar technique under different virgin stress field
conditions. It is demonstrated that when k, the ratio of the horizontal virgin stress
and the vertical virgin stress, is greater than 1.6, the yield pillar technique can be
successfully used, and a greater pillar stability is achievable. On the other hand, if
the ratio k is not greater than 1.6, a decrease in the pillar width will give a lower
safety factor of the pillar.
It is suggested that there exists an optimal pillar width for a particular ratio
of k. The pillar design using the optimal pillar width will exhibit the highest safety
factor of the pillar.

Chapter 7. Conclusions 7 - 7
RECOMMENDATIONS FOR FURTHER RESEARCH:
(i) Permeabilities are among the most important characteristics
of materials as, for example, ventilation applications.
Furthermore, permeabilities are, to some degree, a function
of water/cement ratio and strength. The measurements of
permeabilities are therefore suggested.
(ii) Quantitative rheological measurements for pumpability is
recommended.
(iii) More tests are required before meaningful flow properties
of CWR can be quantified. A detailed evaluation of the
conveying characteristics of CWR in an adequately sized
test rig, such as the one at the University of Wollongong, is
suggested.
(iv) Field data from insitu stress measurements are much
needed for the calibration and refinement of the finite
element model. An experimental research to verify the
numerical results is also recommended.
(v) Development of nomographs, from which the optimal
width of the yield pillar can be determined for a particular
ratio k.

BIBLIOGRAPHY

Bibliography R - 1
BIBLIOGRAPHY
Anon., (1989), The Longwall 12 at West Cliff Set to Go, The KCC Conveyor,
Kembla Coal and Coke Pty. Ltd., Wollongong, N.S.W., Australia, Vol. 4, No.
1, Jan.-Feb., pp. 1-2.
Arnold, P.C. and Reed, A.R., (1986), On the Machine Dependence of Flow
Property Measurements on Bulk Solids, 2nd International Conference on Bulk
Materials Storage Handling and Transportation, Wollongong, N.S.W.,
Australia, 7th-9th July, pp. 98-101.
AS 1013, Part 3-1976, Method for the Determination of Properties Related to the
Consistence of Concrete, Standards Association of Australia, S A A Publication.
AS 1289 C 6.1-1977, Standard Method of Sieving Analysis, Standards
Association of Australia, S A A Publication.
AS 1012.13/Amdt 1/1986-12-05, Method for the Determination of Drying
Shrinkage of Concrete, Standards Association of Australia, S A A Publication.
ASTM C 230-80, Standard Specification for Flow Table for Use in Tests of
Hydraulic Cement, Annual Book of A S T M Standard, Cement, Lime, Gypsum,
Section 4, Vol. 04.01, 1983, 6 Pages.
Atkins, A.S., Atkin, J.C., Singh, R.N. and Zadeh, A.M.H., (1986), An
Alternative Method of Surface Disposal and Stabilization of Coal Mine Tailings,
Geotechnology and Geohydrological Aspects of Waste Management, Fort
Collins, pp. 277-286.
References R - 2
Atkins, A.S., Aziz, N.I., Singh, R.N. and Bridgewood, E.W., (1986), Integrated
Methods of Colliery Waste Disposal for Ground Control and Safety, The
AusIMM Illawarra Branch, Ground Movement and Control Related to Coal
Mining Symposium, Wollongong, Australia, August, pp. 263-268.
Atkins, A.S., Hughes, D., Parkin, D. and Singh, R.N., (1984), Utilization of
Colliery Tailings in Mining Activities, Paper 18, 1st Symposium on the
Reclamation, Treatment and Utilization of Coal Mining Wastes, Durham,
England, September, pp. 18.1-18.11.
Atkins, A.S., Singh, R.N., Barkhordarian, R.N. and Zadeh, A.H., (1987),
Pumpability of Coal Mine Tailings for Underground Disposal and for Regional
Support, Second International Symposium on the Reclamation, Treatment and
Utilization of Coal Mining Wastes, Edited by Rainbow, A.K.B., Elsevier, 7th-
11th. September, Nottingham University, pp. 401-414.
Australian Standards for Civil Engineering Students, (1982), Published by the
Standards Association of Australia, North Sydney.
Aziz, N.I., (1983), The Performance of Powered Support System at Longwall
Coal Seam LW2, West Cliff Colliery, Report MI 83/2, Department of Civil and
Mining Engineering, The University of Wollongong, N.S.W., Australia, 76
Pages (Unpublished Report).
Babcock, CO., (1987), Compressive Strength, Burst Proneness, and Failure
Modes of Model Coal Pillars Related to the End Constraint and Geometry, 28th
US Symposium on Rock Mechanics, Tucson, USA, 29th June-lst July, pp.
173-180.

References R - 3
Barraclough, W., (1984), Strata Control in Longwall Mining with Particular
Reference to the Performance of Powered Supports at Longwall LW5, Corrimal
Colliery, Undergraduate Thesis, Department of Civil and Mining Engineering,
The University of Wollongong, N.S.W., Australia.
Batten, M.B., (1985), The Application of Monolithic Pump Packs to Colliery
Support, Undergraduate Thesis, Department of Civil and Mining Engineering,
The University of Wollongong, N.S.W., Australia.
Beckett, L.A. and Madrid, R.S., (1986), Practical Application of MULSIM/BM
for Improved Mine Design, 3rd Conf. on the Use of Computers in the Coal
Industry, West Virginia University, Morgantown, West Virginia, U.S.A., 28th-
30th July, pp. 209-219.
Beckwith, T.G., Buck, N.L. and Marangoni, R.D, (1982), Mechanical
Measurements, 3rd edn., Addison-Wesley.
Bentley, J.P., (1983), Principles of Measurement Systems, Longman.
Berry, E.E. and Malhotra V.M., (1980), Fly Ash for Use in Concrete, A Critical
Review, ACI Journal, March-April, pp. 59-72.
Bexon, R., (1986), Monolithic Packing, Mining Engineer, Vol. 296, No. 296,
May, pp. 512-519.
Biron, C. and Arioglu, E., (1983), Design of Supports in Mines, John Wiley and
Sons, pp. 171-232.

References R - 4
Blight, G.E. and Clarke, I.E., (1983), Design and Properties of Stiff Fill for
Lateral Support of Pillars, Proceedings of the International Symposium on
Mining with Backfill, Lulea, 7th-9th, June, pp. 303-308.
Blunk, G., (1979), Utilisation of Blast Furnace Slag and Steelmaking Slag in the
Federal Republic of Germany, The AusIMM., Illawarra Branch, Utilisation of
Steelplant Slags Symposium, February, pp. 35-39.
Bollinger, J.G. and Duffie, N.A., (1988), Computer Control of Machines and
Processes, Addison-Wesley.
Bowles, J.E., (1978), Engineering Properties of Soils and Their Measurement, 2nd
Edition, McGraw-Hill International Book Company, pp. 35-46.
Broadhead, W.S., (1988), Practical and Economic Feasibility of Transporting Coal
Washery Refuse into Underground Coal Mines, Undergraduate Thesis,
Department of Mechanical Engineering, The University of Wollongong,
N.S.W., Australia, November, 129 Pages.
Bros, B., (1987), Geotechnical Aspects of Fine Coal Waste Disposal in Lower
Silesia, Poland, Second International Symposium on the Reclamation,
Treatment and Utilization of Coal Mining Wastes, Edited by Rainbow, A.K.B.,
Elsevier, 7th-11th September, Nottingham University, pp. 381-392.
Brown, P.T. and Booker, J.R., (1984), Simulating Excavation by Finite Element
Methods, The ninth Aust. Conf. on the Mech. of Structures and Materials, The
University of Sydney, 29th-31th August, pp. 44-47.

References R - 5
Brown, E.T., (1981), Rock Characterization Testing and Monitoring, ISRM
Suggested Methods, Pergamon Press, pp. 81-116.
Box, G.E.P., (1954), The Exploration and Exploitation of Response Surfaces:
Some General Considerations and Examples, Biometrics, Vol. 10, pp. 16-60.
Box, G.E.P. and Hunter, J.S., (1957), Multi-factors Designs for Exploring
Response Surfaces, Annals of Mathematical Statistics, Vol. 28, pp.195-241.
Box, G.E.P. and Wilson, K.B., (1951), On the Experimental Attainment of
Optimum Conditions, J. of Royal Statistical Society, B13, pp. 1-45.
Box, G.E.P. and Youle, P.V., (1955), The Exploration and Exploitation of
Response Surfaces: An Example of the Link Between the Fitted Surface and the
Basic Mechanism of the System, Biometrics, Vol. 11, pp. 287-323.
Buddery, P.S., (1984), Grout Pack Strength Characteristics in Longwall Gate
Roadways, Mining Science and Technology, Vol. 1, pp. 165-172.
Buddery, P.S. and Ashika, S.T., (1982), Evaluation of Monolithic Packing
Systems with Special Reference to the Aquapak Trials at Ellistown Colliery,
Research Report, Department of Mining Engineering, The University of
Nottingham, U K , January (Unpublished Report).
Buddery, P.S., Hassani, F.P. and Singh, R.N., (1984), A Study of Aquapak
Behaviour with Reference to Strata Control Requirements, The Coal Journal.
November, pp. 55-56.

References R - 6
Buschmann, N., (1987), Testing of Packing Materials Made of Waste Products,
Gluckauf, Translation Vol. 123 No. 20, 22nd October, pp.557-561.
Cain, P. and Stokes, A.W., (1987), Monolithic Packing in the Undersea Coalfield
of Cape Breton, Nova Scotia, Mining Engineer, No. 313, Vol. 147, October,
pp. 168-174.
Callis, A.V. and Newson, S.R., (1987), Progress into Roadway Reinforcement
Techniques in the UK, Mining Engineer, No. 314, Vol. 147, pp. 233-242.
Cambourn, G.R., (1984), Comparison of Support Performance on Two
Longwalls at South Bulli Colliery, Undergraduate Thesis, Department of Civil
and Mining Engineering, The University of Wollongong, N.S.W., Australia.
Chen, E.S. and Buyukozturk, O., (1985), Constitutive Model for Concrete in
Cyclic Compression, Engrg. Mech., ASCE, 111(6), pp. 797-814.
Chlumechy, N. and Smith, R., (1986), Donut Cribbing a New Heavy-Duty Roof
Support Concept, Proceedings Fifth Conference on Ground Control in Mining,
llth-13th., June, pp. 29-43.
Choi, D.S., (1989), Theoretical Analysis of Breaking Strength of Mine Pillars and
Test Specimens, 30th U S Symposium on Rock Mechanics, Morgantown, W V ,
USA, pp. 953-962.
Claringbold, P.J., (1955), Use of the Simplex Design in the Studies of Joint
Action of Related Hormones, Biometrics, Vol. 11, pp. 174-185.

References R - 7
Clark, C A . and Newson, S.R., (1985), A Review of Monolithic Pumped Packing
Systems, Mining Engineer, Vol. 144, No. 282, March, pp. 491-495.
Collepardi, M., (1988), International Workshop on the Use of Fly Ash, Slag,
Silica Fume and Other Siliceous Materials in Concrete, July, 4th-6th, The
Regent Hotel Sydney, Australia.
Collier, L., (1984), Further Developments of Monolithic Packing in the
Warwickshire Coalfield, Mining Engineer, Vol. 143, No. 271, April, pp. 475-
483.
Cornell, J.A., (1981), Experiments with Mixtures: Designs, Models and Analysis
of Mixture Data, New York, John Wiley and Sons.
Deutschman, A.D., Michels, W.J. and Wilson, C.E., (1975), Machine Design
Theory and Practice, Macmillan Publishing Co., Inc., pp. 409-417.
Didcoct, D.A., (1982), Research, Development, and Use of Steel-Fibre-Reinforced
Concrete Cribbing for Mine Roof Support, Proceedings Second Conference on
Ground Control in Mining, 19th-21st July, pp. 202-208.
Drucker, D.C and Prager, W., (1952). "Soil Mechanics and Plastic Analysis or
Limit Design", Quarterly of Appl. Math., Vol. 10, No. 2, pp. 157-165.
Materials Testing Division, ELE International Catalogue, A Mowlem Technology
Company.

References R - 8
Evans, D.W. and Colaizzi, G.J., (1982), Control of Mine Subsidence Utilizing
Coal Ash as a Backfill Material, Proceedings Second Conference on Ground
Control in Mining, 19th-21st July, pp. 222-228.
Faddick, R.R., (1978), Flow Properties of Energy Slurries, Proe. of the 3rd. Int.
Tech. Conf. on Slurry Transportation, 29th-31st March, Las Vegas, Nevada,
pp. 93-97.
Farmer, I.W. and Robertson, J.T., (1975), The Effect of Pack Construction on
Roadway Stability behind Working Faces, The Mining Engineer, Vol. 134,
Nos. 166-167, August/September, pp. 599-606.
Foseco: Technik Catalogues on Tekpak and Tekpak XX.
Franklin, J.A. and Dusseault, M.B., (1989), Rock Engineering, McGraw-Hill, pp.
539-562.
Freeman, P.N., (1982), The Design and Installation of 52's Face at Newdigate
Colliery, Mining Engineer, Vol.141, No. 247, April, pp. 609-613.
Garland, B., (1984), Strata Control in Longwall Mining with Particular Reference
to the Work Face Appin Colliery, Undergraduate Thesis, Department of Civil
and Mining Engineering, The University of Wollongong, N.S.W., Australia,
pp. 1-17.
Glynn, E.E., (1987), Elastic Moduli of Rock: A Comparison of In-Situ Vs.
Laboratory Values, 28th U S Symposium on Rock Mechanics, Tucson, USA,
29th June-1st July, pp. 223-230.

Harlech, (1925), Hydraulic Stowing of Mines, The Science and Art of Mining, Vol
36, pp. 104, 118, 134, 148,359.
References R - 9
Gomez, B., (1989), Advanced Instrumentation Monitors Smelter Emissions,
Engineers Australia, Vol. 61, No. 8, 5th May, pp. 35.
Gomez, B., (1989), BHP Exports Instruments Developed for CIM, Engineers
Australia, Vol. 61, No. 8, 5th May, pp. 34-35.
Grosvenor, P.J., (1986), Experimental Investigations into the Material Properties
of Monolithic Pump Packing Systems with Special Reference to Cemented Coal
Washery Refuse, Undergraduate Thesis, Department of Civil and Mining
Engineering, The University of Wollongong, N.S.W., Australia.
Hambley, D.F., (1989), Pillar Design for Mines in Saltrock - 1, Mining Science
and Technology, 9, pp. 111-123.
Hebblewhite, B.K., (1982), The Use of Modelling Techniques for Mine Design,
The Aust. J. of Coal Mining Tech. and Research, No. 1, pp. 1-19.
Hebblewhite, B., (1983), Alternative Longwall Panel Layouts for Use in
Australian Coal Mines, Paper 3, Proceedings of Longwall Mining Design,
Development and Extraction Seminar, Sydney, NSW, Australia.
Hebblewhite, B., (1988), Evaluation of Cementitious Support for Increased
Recovery of Coal Reserves, Commonwealth of Australia National Energy
Research, Development and Demonstration Program, End of Grant Report
Number 858, Australian Coal Industry Research Laboratories, October, 267
Pages.
Heidarieh Zadeh, A.M., Barkhordarian A., Singh, R.N., Atkins, A.S. and
Hughes, D., (1986), Studies of Cost Effective and Environmentally Acceptable

References R - 10
Methods of Coal Mine Tailings Disposal, 3rd Interim Report (SERC Research
Contract No. GR/D-06902), Department of Mining Engineering, University of
Nottingham in Collaboration with the Department of Mining Engineering, North
Staffordshire Polytechnic, Stoke-on-Trent, September, 20 Pages.
Highton, W. and Cooper, J.M., (1984), Development of Monolithic Packing
Systems within Western Area, Mining Engineer, Vol. 143, No. 273, June, pp.
623-628.
Hoek, E. and Wood, D.F., (1988), Rock Support, Mining Magazine, October, pp.
282-287.
Hii, J.K. and Aziz, N.I., (1986a), The State of the Art of Pump Packing in Coal
Mining, Research Report No.l, Department of Civil and Mining Engineering,
The University of Wollongong, N.S.W., Australia, May, 76 Pages.
Hii, J.K. and Aziz, N.I., (1986b), An Evaluation of the Mechanical Properties of
Cemented West Cliff Washery Refuse, Research Report No.2, Department of
Civil and Mining Engineering, The University of Wollongong, N.S.W.,
Australia, September, 30 Pages.
Hii, J.K. and Aziz, N.I., (1987a), Mechanical Evaluation of Cement and Coal
Washery Refuse Material, Research Report No.3, Vol.1, Department of Civil
and Mining Engineering, The University of Wollongong, N.S.W., Australia,
January, 262 Pages.
Hii, J.K. and Aziz, N.I., (1987b), Mechanical Evaluation of Cement and Coal
Washery Refuse Material, Research Report No.3, Vol.2, Department of Civil

References R - 11
and Mining Engineering, The University of Wollongong, N.S.W., Australia,
January, 263 Pages.
Hii, J.K. and Aziz, N.I., (1987c), Influence of Water Content on the Flow
Properties of Mine Tailings, Research Report No.4, Department of Civil and
Mining Engineering, The University of Wollongong, N.S.W., Australia, July,
28 Pages.
Hii, J.K. and Aziz, N.I., (1987d), Influence of Water Content on the Mechanical
Properties of Cement and Coal Washery Refuse Material, Research Report
No.5, Department of Civil and Mining Engineering, The University of
Wollongong, N.S.W., Australia, December, 16 Pages.
Hii, J.K. and Aziz, N.I., (1989a), Microcomputer Automation of the Strength
Testing System for Use in a Rock Mechanics Laboratory, Australasian
Instrumentation and Measurement Conference, The Institution of Engineers
Australia, Adelaide, South Australia, 14th-16th November, pp. 51-55.
Hii, J.K. and Aziz, N.I., (1989b), Influence of Water Content on the Mechanical
Properties of C C W R Concrete, First Conference on Concrete and Structures,
Kuala Lumpur, Malaysia, 3rd and 4th October, pp. 47-50.
Hii, J.K. and Aziz, N.I., (1990), Properties and Behaviour of Cement and Coal
Washery Refuse Concrete, Concrete for the Nineties, International Conference
on the Use of Fly Ash, Slag, Silica Fume and Other Siliceous Materials in
Concrete, Leura (Blue Mountains), N e w South Wales, Australia, 3rd-5th
September, 15 Pages.

References R - 12
Hii, J.K. and Standish, P., (1989), Data Acquisition Systems for Rock Mechanics
Applications, Computer Systems in the Australian Mining Industry, The
University of Wollongong, N.S.W., Australia, September, pp.133-139.
Hii, J.K., and Wu, Y.H., (1989), Effect of Virgin Stress Fields on the Feasibility
of Using Yield Pillar Technique, Computer Systems in the Australian Mining
Industry, The University of Wollongong, N.S.W., Australia, September, pp.
107-111.
Hii, J.K. and Yu, A.B., (1989), The Design of CCWR Concrete, First Conference
on Concrete and Structures, Kuala Lumpur, Malaysia, 3rd-4th October, pp.51-
56.
Hii, J.K., Aziz, N.I., Zhang S. and Wu, Y.H., (1990a), Influence of Geometry on
Strength and Elasticity of Cement and Coal Washery Refuse Material Models,
3rd International Symposium on the Reclamation, Treatment and Utilization of
Coal Mining Wastes, The Kelvin Conference Centre, Wolfson Hall, The
University of Glasgow, U K , 3rd-7th September, 7 Pages.
Hii, J.K., Aziz, N.I., Zhang, S. and Wu, Y.H., (1990b), Development and
Utilization of Coal Washery Refuse for Strata Reinforcement in Underground
Coal Mining Operations, 3rd International Symposium on the Reclamation,
Treatment and Utilization of Coal Mining Wastes, The Kelvin Conference
Centre, Wolfson Hall, The University of Glasgow, U K , 3rd-7th September, 9
Pages.
Hii, J.K., Zhang, S. and Wu, Y.H., (1990), Evaluation of the Triaxial Strength of
Cement and Coal Washery Refuse Concrete, The Twelfth Australasian
Conference on the Mechanics of Structures and Materials, 24th-26th September,

--v--~ • •
Heinrich, F., (1971), Technical Experience with Gateroad Side Pack from
Anhydrite and Blitzdammer, Gluckauf, Vol 107 No.2, pp. 51-63.
Hoek, E., (1982), Analysis of Slope Stability in Very Heavily Jointed or
Weathered Rock Masses, 3rd International Conference on Stability in Surface
Mining, Vol 3, Edited by Brawner, CO., Published by the Society of Mining
Engineers of the American Institute of Mining, Metallurgical, and Petroleum
Engineers, Inc., New York, pp. 375-406.

References R - 13
Organised by School of Civil Engineering, Queensland University of
Technology, Australia, in Press.
Hodgkinson, D.R., (1977), Pump Packing Systems at Florence Colliery, Mining
Engineer, Vol. 136, No. 195, August, pp. 707-716.
Operating and Service Manual, Vol. 3, Hewlett Packard Company, U.S.A., 1979.
Huang, Z.B., Zhang, Y.G. and Hii, J.K., (1989), On the Matrices Wear and Self-
sharpening of Impregnated Diamond Drill Bits, Second Large Open Pit Mining
Conference, The A u s I M M Latrobe Valley Branch, Melbourne, Victoria,
Australia, April, pp.25-29.
Hughson, R., Tuminski, A. and Holla, L., (1987), A Review of Stowing and
Packing Practices in Coal Mining, The AusIMM Bulletin and Proceedings,
Australia, Vol. 292, No. 9, pp. 79-86.
Hunke, H., (1983), Cost Effectiveness of Centralised and Decentralised Pack
Material Supply Systems, Gluckauf, Translation Vol. 9, No. 119,12th May, pp.
167-171.
Hurlbut, B.J., (1985), Experimental and Computational Investigation of Strain-
Softening in Concrete, Thesis Presented to the University of Colorado,
Boulder, Colorado, in Partial Fulfilment of the Requirement for the Degree of
Master of Science, USA.
Iannacchione, A.T., (1989), Numerical Simulation of Coal Pillar Loading with the
Aid of a Strain-softening Finite Difference Model, 30th U S Symposium on Rock
Mechanics, Morgantown, W V , USA, pp. 775-782.
References R - 14
Instron Instruments and Systems for Advanced Materials Testing, Handbook for
Model 8033 Materials Testing Machine.
Isaac, A.K. and Payne, A.R., (1986), Influence of Pack Design Upon Gateroad
Deformation in Soft Floor Conditions, The AusIMM Illawarra Branch, Ground
Movement and Control Related to Coal Mining Symposium, Wollongong,
Australia, August, pp. 253-262.
Isaac, A.K., Smart, B.D.G. and Roberts, D., (1982), The Reuse of Gateroads
Serving Retreat Faces at Betws Colliery, Mining Engineer, Vol. 141, No. 249,
June, pp. 727-737.
Jackson, J.B., (1980), Reducing Run of Mine Dirt, Colliery Guardian, Vol. 228,
No. 9, September, pp. 435-441.
James, A.M., (1986), New Materials Technology Applied to Longwall Mining,
The AusIMM Illawarra Branch, Ground Movement and Control Related to Coal
Mining Symposium, Wollongong, Australia, August, pp. 240-246.
Jones, C, 91989), Aust Smoke Detectors for British Rail, Engineers Australia,
Vol. 61, No. 8, 5th May, pp. 37.
Jones, C, (1989), Mass Spectrometer Invented at UNSW, Engineers Australia,
Vol. 61, No. 8, 5th May, pp. 38.
Kellet, W.H. and Mills, P.S., (1980), Advancements in Monolithic Packing
Materials Developed by M R D E , Colliery Guardian, Vol. 228, No. 9,
September, pp. 240-241.

References R - 15
Keren, L. and Kainian, S., (1983), Influence of Tailings Particles on Physical and
Mechanical Properties of Fill, Proceedings of the International Symposium on
Mining with Backfill, Lulea, 7th-9th June, pp. 21-30.
Kimura, T., (1987), Experimental and Theoretical Studies on Strain Softening
Behaviour of Rocks, 28th US Symposium on Rock Mechanics, Tucson, USA,
29th June-1st July, pp. 197-202.
Klek, S.R., (1982), An Investigation into Pneumatic Handling of Cement for
Littleton Colliery, Mining Engineer, Vol. 142, No. 254, pp. 259-263.
Knissel, W. and Helms, W., (1983), Strength of Cemented Rockfill from Washery
Refuse, Results from Laboratory Investigations, Proceedings of the
International Symposium on Mining with Backfill, Lulea, 7th-9th, June, pp. 31-
38.
Kripakov, N.P., (1987). Numerical Modeling in Mine Structure Design,
Underground Mining Methods and Tech., Edited by Szwilski, A.B. and
Richards, M.J., Elsevier Sci. Publishers B.V., Amsterdam, pp. 441-455.
Kuo, B.C., (1987), Automatic Control Systems, 5th edn., Prentice Hall.
Lama, R.D., (1988), Developments in Underground Coal Mining Technology and
Their Implications, The AusIMM Illawarra Branch, 21st Century Higher
Production Coal Mining Systems, Their Implications, Wollongong, N.S.W.,
Australia, April, pp. 7-17.

References R - 16
Lama, R.D. and Vutukuri, V.S., (1978), Handbook on Mechanical Properties of
Rocks, Vols. 2-4 Series of Rock and Soil Mechanics, Trans Tech Publications,
Germany.
Lee, G.E., (1985), The Washability Analysis of ROM Coal from West Cliff
Washplant Reject for December, Report No. 04/5693, ACIRL, N.S.W.,
Australia, 6 Pages (Unpublished Report).
Lehmann, B.G. and Krahe, J., (1987), Light-Weight Supports with material
Backfilling to Consolidate a Lateral Road, Gluckauf, Translation Vol. 123, No.
21, 5th November, pp 578-580.
Leininger, D., Leonhard, J. Erdmann, W. and Schieder, T, (1987), Research on
Suitability of Coal Preparation Refuse in Civil Engineering in Federal Republic
of Germany, Second International Symposium on the Reclamation, Treatment
and Utilization of Coal Mining Wastes, Edited by Rainbow, A.K.B., Elsevier,
7th-11th September, Nottingham University, pp. 55-68.
Lerche, R. and Renetzeder, H., (1984), The Development of "Pumped Fill" at
Grand Mine, A successful N e w Approach to Back-filling Using High-density
Hydraulic Conveying, Preussag A G Metall, Federal Republic of Germany,
Presented at the 9th. Int. Conf. on the Hydraulic Transport of Solids in Pipes,
Rome, Italy, 17th-19th October, 24 Pages.
Lewis, S. and Stace, L.R., (1981), A Rationale of Roadside Packing, Mining
Engineer, No. 235, Vol. 140, April, pp. 717-721.

References R - 17
Loo, Y.C and Ahmad, S.F., (1982), A Comparative Study of Four Popular
Concrete Mix Design Methods, AIT, Bangkok, Thailand, Research Report No.
151, 23 pages.
Loo, Y.C, Nimityongskul, P. and Karasudhi, P., (1984), Economical Rice Husk
Ash Concrete, Building Research and Practice, the CIB Journal, July/August,
Vol. 12, No. 4, pp. 233-238.
Loo, Y.C and Weragama, W.K.B., (1985), Mix Design of Rice Husk Ash
Concrete, Journal of CIB, the Internal Council for Building Research Studies
and Documentation, Kent, UK, Vol. 13, No.6, Nov./Dec, pp. 361-367.
Lydon, F.D., (1972), Concrete Mix Design, Applied Science Publishers Ltd.
London, 139 Pages.
Mark, C, Listak, J. and Bieniawski, Z.T., (1988), Yielding Coal Pillars - Field
Measurements and Analysis of Design Methods, Key Questions in Rock
Mechanics: Proceedings of the 29th U.S. Symposium, Edited by Cundall,
P.A., Sterling, R.L. and Starfield, A.M., University of Minnesota,
Minneapolis, USA, 13th-15th June, pp. 261-270.
Marshall, P. and Lama, R.D., (1986), Changes in Underground Coal Mining
Technology - An Australian Outlook, 13th Congress of the Council of Mining
and Metallurgical Institutions, Singapore, 1 lth-16th May, pp. 91-101.
McCarthy, K., (1974), Experiences in Roadside Packing with the Low Pressure
Jet Stower at Daw Mill Mine, The Mining Engineer, November, pp. 59-65.

References R - 18
McCarthy, K. and Robinson, A., (1981), Pump Packing Experiences at Newdigate
and D a w Mill Collieries, Mining Engineer, Vol. 140, No. 236, May, pp. 831-
836.
Mehta, P.K., (1989), Pozzolanic and Cementitious By-Products in Concrete -
Another Look, Third CANMET/ACI Int. Conf., Fly Ash, Silica Fume, Slag
and Natural Pozzolans in Concrete, Editor V.M. Malhotra, Vol. 1, June, pp. 1-
43.
Mehta, P.K. and Pirtz, D., (1978), Use of Rice Hull Ash to Reduce Temperature
in High-strength Mass Concrete, ACI Journal, Vol. 75, No.2, pp. 60-63.
Mifflin, A.D., (1986), Pump Packing Developments of Rowhurst 304s Face at
H e m Heath Colliery, Mining Engineer, Vol. 145, No.292, January, pp. 307-
310.
Monier Construction Products Catalogues, Monier Resources, Australia.
Montgomery, D.G. and Wang, G.C., (1989), Instant Chilled Steel (I.C.S.) Slag
as an Aggregate in Concrete, Third CANMET/ACI Int. Conf, Fly Ash, Silica
Fume, Slag and Natural Pozzolans in Concrete, Supplementary Paper, Editor
V.M. Malhotra, June, 3 Pages.
Morgan, D.R. and Bruere, G.M., (1975), Workshop on The Use of Chemical
Admixtures in Concrete, The University of N e w South Wales, Sydney,
Australia, lst-2nd December, pp. 29-184.

References R - 19
Munn, R.L., (1979), Blast Furnace Slag as an Aggregate in Concrete, The
AusIMM., Illawarra Branch, Utilisation of Steelplant Slags Symposium,
N.S.W., Australia, February, pp. 41-50.
Nadai, A., (1963), Theory of Flow and Fracture of Solids, Monographs
Engineering Societies, Vol. 2, McGraw-Hill Book Company, Inc., pp. 357-377.
Nandy, S.K. and Szwilski, A.B., (1987), Disposal and Utilization of Mineral
Wastes as a Mine Backfill, Underground Mining Methods and Technology,
edited by Szwilski, A.B. and Richards, M.J. Elsevier Science Publishers,
B.V., Amsterdam, Netherlands, pp. 401-414.
Neville, A.M., (1981), Properties of Concrete, 3rd Edition, Pitman.
Newman, D.A., (1988), Yield Pillar Behaviour in Deep Mines, Proceedings 6th
Annual Workshop Generic Mineral Technology Center Mine Systems Design
and Ground Control, Fairbanks, Alaska, 31st July-2nd August, Edited by
Topuz, E. and Richard Lucas, J., pp. 21-29.
Newson, S.R., (1983), Strata Control - Present Problems, Future Plans, Mining
Engineer, Vol. 143, No. 266, November, pp. 229-235.
Nixon, D.W. and Mills, P.S., (1981), Pump Packing Developments a Hem Heath
Colliery, Mining Engineer, Vol. 140, March, pp. 645-651.
Nguyen, V.U., Aziz, N.I., Hii, J.K. and Fabjanczyk, M.W., (1986), An
Experimental Investigation on Cable Reinforcement, The AusIMM Illawarra
Branch, Ground Movement and Control Related to Coal Mining Symposium,
Wollongong, Australia, August, pp. 93-101.

References R - 20
N S W Government, (1983), Coal Reject Disposal in the Southern Coalfields, Coal
Reject Disposal Sub-Committee, Report to the Coal Resource Development
Committee (NSW Department of Mineral Resources: Sydney), May, pp. 1-47.
Ostermann, W., Jacobi, H., Sander, K.H. and Diederich, T., (1988), Re-
introduction of Pneumatic Stowing at the Friedrich Heinrich Colliery, Gluckauf,
Journal for Technology and Economics in the Mining Industry, Vol. 124,
No.21, 3rd. November, pp. 476-481.
Peng, S.S., (1986), Coal Mine Ground Control, 2nd. Edition, John Wiley and
Sons.
Peng, S.S. and Chiang, H.S., (1984), Longwall Mining, John Wiley and Sons.
Plate, M., (1988), Waste Disposal Underground - An Opportunity for Solving
Environmental Problems, Gluckauf, Translation Vol. 124, No. 4/5, 3rd March,
pp. 122-126.
Porter, I. and Aziz, N.I., (1985), The Relationship Between Rock Competency and
Convergence on Longwall Facelines (Private Communication).
Pouska, G.A. and Link, J.M., (1981), Differential Flow Rheometer, Proe. of the
6th Int. Tech. Conf. on Slurry Transportation, 26th-28th March, Sahara Tahoe,
Lake Tahoe, Nevada, pp. 120-126.
Pramono, E. and Willam, K., (1989), Fracture Energy-Based Plasticity
Formulation of Plain Concrete, Engrg. Mech., ASCE, 115(6), pp. 1183-1204.

Recklinghausen, W.K., Marl, D.S. and Walsum, K.I., (1972), Suppressing
Convergence through the Gateroad Side Pack from Anhydrite, Gluckauf, Vol
108 No.21, pp. 980-982.

References R - 21
Pundit Manual for Use with the Portable Ultrasonic Non-Destructive Digital
Indicating Tester, C.N.S. Instruments Ltd., London, 35 Pages.
Ramachandra, V.S., (1976), Calcium Chloride in Concrete Science and
Technology, Applied Science Publishers Ltd., London.
Ramachandra, V.S., (1984), Concrete Admixtures Handbook, Properties, Science
and Technology, Noyes Publications.
Rao, Y.V.A. and Vutukuri, V.S., (1983), Some Aspects of Recovery of Pillars
Adjacent to Uncemented Sandfilled Slopes, Proceedings of the International
Symposium on Mining with Backfill, Lulea, 7th-9th June, 1983, pp. 397-403.
Raring, L.M., (1980), The Hydraulic Disposal of Colliery Waste Material, Proe. of
the 5th. Int. Conf. on Slurry and Transportation, 26th-28th March, Sahara
Tahoe, Nevada, pp. 120-126.
Richmond, A.J., (1981), Investigation into Monolithic Pump Packing as a Means
of Underground Roof Support, Part A: Laboratory Studies to Determine Pack
Properties, P.R. 81-8, ACIRL, August, 34 Pages.
Richmond, A.J., Skybey, G., Ross, A., Wypych, P. and Lama, R.D., (1985),
Evaluation of Cementitious Support for Increased Recovery of Coal Mines,
Progress Report, NERDDP Project Contract No. 84/4149.
Roberts, A., (1977), Geotechnology, An Introduction Text for Students and
Engineers, Pergamon Press.

References R - 22
Rockey, K.C, Evans, H.R., Griffiths, D.W. and Nethercot, D.A., (1983), The
Finite Element Method, A Basic Introduction for Engineers, 2nd Edition,
Granada.
Rose, B.W., (1988), Planning and Preparing a Pneumatically Stowed Face in the
Northern Take of Haus Aden Colliery, Gluckauf, Translation Vol. 124, No. 8,
21st April, pp.240-245.
Ruban, V.A. and Shpirt, M.Y., (1987), Utilization of Mining Operations and Coal
Preparation Processes Wastes in the U S S R and the principles of Their
Classification, Second International Symposium on the Reclamation, Treatment
and Utilization of Coal Mining Wastes, Edited by Rainbow, A.K.B., Elsevier,
7th-11th September, Nottingham University, pp. 45-54.
Ruston, R., (1986). Yield Pillar - Overseas Experience and Plans for
Experimentation at West Cliff Mine, Supplementary Paper, Ground Movement
and Control Related to Coal Mining Symposium, Illawarra Branch - The
AusIMM, The University of Wollongong, N.S.W., Australia, 26th-29th
August, 6 Pages.
Ruston, R., Lama, R.D. and Cutifani, M., (1988), Roof Control Technology
under Abnormal Conditions, The AusIMM Illawarra Branch, 21st Century
Higher Production Coal Mining Systems, Their Implications, Wollongong,
N.S.W., Australia, April, pp. 145-157.
Schaller, S. and Savidis, G., (1983), Investigation into Innovative Means of
Secondary Gate Road Support, Paper 11, Proceedings of Longwall Mining
Design, Development and Extraction Seminar, Sydney, N S W , Australia.

Produced from Coal Washery Rejects, 4th International Symposium on Mining
with Backfill, Innovations in Backfill Technology, Edited by Hassani, F.P.,
Scoble, M J . and Yu, T.R., Montreal, Quebec, 2nd-5th October, pp. 307-314.

References R - 23
Scheffe, H., (1958), Experiments with Mixtures, J. of Royal Statistical Society,
Series B 20, pp. 344-360.
Schmidt, L.C and Wu, Y.H., (1989), Numerical Evaluation of Dynamic
Pressures Exerted by Broken-ore in Underground Storage Structures,
Submitted to Computer Systems in the Aust. Mining Industry, The University
of Wollongong, N.S.W., Australia, September, pp. 112-116.
Schmidt, L.C, Wu, Y.H. and Lu, J.P., (1989), Effect of Tectonic Stresses on the
Stability of Slope, Second Large Open Pit Mining Conf, Latrobe Valley
Branch-The AusIMM, Australia, April, pp. 217-220.
Schroer, D., (1987), Use of Packing Materials from Waste Products, Gluckauf,
Translation Vol. 123, No.22, 19th November, pp. 621-625.
Serata, S., (1982), Stress Control Methods: Quantitative Approach to Stabilizing
Mine Openings in Weak Ground, First International Conference on Stability in
Underground Mining, Vancouver, British Columbia Canada, Editor Brawner,
CO., SME/AIME, Published by S M E of the A I M M , and PE, Inc., New York,
16th-18th August, pp. 52-98.
Serata, S. and Galagoda, H.M., (1987), Integration of Finite Element Analysis and
Field Instrumentation for Application of the Stress Control Method in
Underground Coal Mining, 28th U S Symposium on Rock Mechanics, Tucson,
USA, 29th June-1st July, pp. 265-272.
Serata, S., Gardner, B.H. and Shrinivasan, K., (1986), Integrated Instrumentation
Method of Stress State, Material Property, and Deformation Measurement for

References R - 24
Stress Control Method of Mining, Proceedings Fifth Conference on Ground
Control in Mining, llth-13th June, pp. 123-133.
Serata, S., Gardner, B.H. and Preston, M., (1986), Optimization of the Stress
Control Method to Improve Productivity and Safety in Underground Coal
Mining, Proceedings Fifth Conference on Ground Control in Mining, 11th-13th
June, pp. 156-166.
Shephard, P., (1986), The Use of Yield Pillars at West Cliff Colliery - A Union
View, Supplementary Paper, Ground Movement and Control Related to Coal
Mining Symposium, Illawarra Branch - The AusIMM, the University of
Wollongong, N S W , Australia, 26th-29th August, 5 Pages.
Singh, R.N., Atkins, A.S. and El-Mherig, A.M., (1985), An Approach to Solve
Some of the Problems of Coal Mines Liquid Tailings Disposal in the U K
National Symposium on Surface Mining, Hydrology, Sedimentology and
Reclamation, Lexington, Kenturky, USA, 10 Pages.
Sinha, K.M., (1989), Hydraulic Stowing - A Solution for Subsidence Due to
Underground Mining in the USA, 30th U.S. Symposium on Rock Mechanics,
West Virginia University, Morgantown, West Virginia, U.S.A. 19th-22th June,
pp. 827-834.
Sleeman, W., (1987), The Economics of Minestone Utilization, 3rd International
Symposium on the Reclamation, Treatment and Utilization of Coal Mining
Wastes, The Kelvin Conference Centre, Wolfson Hall, The University of
Glasgow, U K , 3rd-7th September, pp. 1-20. >

Smart, B^GTX and AzizTN.I., (1986), The Influence of Caving in the Hirst and
BulU Seams on Powered Support Rating, The AusIMM Illawarra Branch,
Ground Movement and Control Related to Coal Mining Symposium, Edited by
Aziz, N.I., Wollongong, N.S.W., Australia, August, pp. 182-193.

References R - 25
Smart, B.D.G., (1986), Monolithic Partitions for the Wide Drivages - Some Design
Considerations, The AusIMM Illawarra Branch, Ground Movement and Control
Related to Coal Mining Symposium, Wollongong, Australia, August, 1986, pp.
247-252.
Smart, B.D.G., Davies, D.O. and Issac, A.K., (1982), Conclusions from Strata
Mechanics Investigations Conducted by Cardiff and Strathclyde Universities at
Longwall Faces, Mining Engineer, Vol. 141, No. 246, March, pp. 539-545.
Smart, B.D.G., Isaac, A.K. and Roberts, D., (1982), Pack Design Criteria at
Betws Colliery, Mining Engineer, Vol. 141, No. 230, July, pp. 15-21.
Smith, I., (1976), Experience with Anhydrite Packing (ANPAC) at Easington
Colliery, Mining Engineer, Vol. 135, No. 186, October, pp. 47-51.
Smith, I.A., (1967), The Design of Fly-Ash Concretes, Proceedings of the
Institution of Civil Engineers, Vol. 36, pp. 769-790.
Standish, N., (1983), A Study of Size Separation by Screening, MMIJ/AusIMM
Joint Symposium, Sendai, pp. 129-144.
Standish, P., (1989), Report on Performance of Seco-Titan Roof Bits, Uniadvice,
the University of Wollongong, Wollongong, Australia, 11/89 (Unpublished
Report).
Statham, C.A., (1980), Roadside-Pack Construction Demonstration, Colliery
Guardian, Vol. 228, No. 9, September, pp. 553-554.

Taylor, R.K., (1984), Composition and Engineering Properties of British Colliery
Discards, British Coal Mining Department, pp. 244.
Thomas, E.G., Lama, R.D. and Wiryanto, K., (1989), Preparation of an Early-
Strength Fill Material for Roof Support in Longwall Mining of Coal, 4th
International Symposium on Mining with Backfill, Innovations in Backfill
Technology, Edited by Hassani, F.P., Scoble, M.J. and Yu, T.R., Montreal,
Quebec, 2nd-5th October, pp. 297-306.

References R - 26
Stockes, H. and Kitching, F., (1980), The Effect of Mechanisation on Strata
Control at Face-Ends, Symposium Paper No. 5, Presented at a Symposium on
Face-Ends Technology, Harragate, 10th-12th December, pp. 5.1-5.6
Sydenham, P.H., (1982), Handbook of Measurement Science, Vols. 1 & 2, John
Wiley & Sons.
Szwiski, A.B. and Whittaker, B.N., (1975), Control of Strata Movement around
Face-ends, The Mining Engineer, July, pp. 515-524.
Teale, R., (1965). The Concept of Specific Energy in Rock Drilling, Int. Journal
of Rock Mech. Min. Sci., Vol. 2, pp. 57-73.
Teychenne, D.C, Franklin, R.E. and Erntroy, H.C, (1975), Design of Normal
Concrete Mixes, Department of the Environment, Her Majesty's Stationery
Office, London, U K , 30 pages.
Thomas, E.G., (1978), Fill Permeability and its Significance in Mine Fill Practice,
Mining with Backfill, 12th Canadian Rock Mechanics Symposium, Sudbury,
Ontario, 23th-25th May, pp. 139-145.
Thomas, E.G., (1986), Report on Laboratory Strength Testing of West Cliff
Washplant Reject, School of Mining Engineering, the University of New South
Wales, N.S.W., Australia, pp. 1-40.
Thomas, E.G. and Cowling, R., (1978), Pozzolanic Behaviour of Ground Isa
Mine Slag in Cemented Hydraulic Mine Fill at High Slag/Cement Ratios,
Mining with Backfill, 12th Canadian Rock Mechanics Symposium, Sudbury,
Ontario, 23th-25th May, pp. 129-132.

References R - 27
Todd, G., (1983), Development and Use of Gate Roads at Appin Colliery, Paper
4, Proceedings of Longwall Mining Design, Development and Extraction
Seminar, Sdyney, N S W , Australia.
Tong, G.X. and Wu, Y.H., (1985), Logarithmic Yield Criterion and Its
Implementation in Finite Element Analysis, Internal Report, Beijing University
of Iron and Steel Technology, pp. 14.
Tsang, P., Peng, S.S. and Hsiung, S.M., (1989), Yield Pillar Application under
Strong Roof and Strong Floor Condition - A Case Study, 30th U.S.
Symposium on Rock Mechanics, West Virginia University, Morgantown, West
Virginia, U.S.A. 19th-22th June, pp. 411-418.
Verkerk, C.G., (1986), The Transportation of Flyash and Bottom Ash in Slurry
Form, 2nd International Conference on Bulk Materials Storage Handling and
Transportation, Wollongong, N.S.W., Australia, 7th-9th July, pp. 34-38.
Vernard, J.K. and Street, R.L., (1976), Elementary Fluid Mechanics, 5th Edition,
John Wiley and Sons, Inc., pp. 521-528.
Vutukuri, V.S., Lama, R.D. and Saluja, S.S., (1974), Handbook on Mechanical
Properties of Rocks, Vol. 1, Series of Rock and Soil Mechanics, Trans Tech
Publication, Germany.
Whittaker, B.N., (1974), An Appraisal of Strata Control Practice, The Mining
Engineer, Vol.134, Nos. 166-175, October, pp. 9-58.

References R - 28
Whittaker, B.N. and Woodrow, G.J.M., (1977), Design Loads for Gateside Packs
and Support Systems, The Mining Engineer, Vol. 136, No. 189, February, pp.
263-275.
Wilson, A.H., (1975), Support Load Requirements on Longwall Faces, Mining
Engineer, Vol. 134, No. 173, June, pp. 479-488.
Wiryanto, K., (1989), Strength Characteristics of Cemented Coal Reject as Pump
Packing Material, M.E. Thesis, the Department of Mining Engineering, School
of Mines, The University of New South Wales, Australia, pp. 1-91.
Wood, J.K., (1986), Expanded Cement: New Solutions for Age-old Problems,
Proceedings Fifth Conference on Ground Control in Mining, USA, 11th- 13th
June, pp. 1-5.
Woodley, J.N.L. and Osborne, B.A., (1980), MRDE Experience with Pump
Packing, Mining Engineer, Vol. 140, No. 231, December, pp. 437-443.
Wu, Y.H., Hii, J.K. and Aziz, N.I., (1989), A New Yield Function for CCWR
Concretes, First Conference on Concrete and Structures, Kuala Lumpur,
Malaysia, 3rd-4th October, pp 173-176.
Wypych, P.W. and Armitage, W.R., (1986), The Operation of a Large Pneumatic
Conveying Test Rig in Australia, 2nd International Conference on Bulk
Materials Storage Handling and Transportation, Wollongong, N.S.W.,
Australia, 7th-9th July, pp. 29-33.
Zadeh, A.H., Barkhordarian, A., Mills, P.S., Atkins, A.S. and Singh, R.N.,
(1987), An Investigation into Cheaper Monolithic Packing Materials Utilization

References R - 29
Colliery Tailings, Second International Symposium on the Reclamation,
Treatment and Utilization of Coal Mining Wastes, Edited by Rainbow, A.K.B.,
Elsevier, 7th-11th September, Nottingham University, pp. 369-380.
Zhou, X. and Zhang, S., (1989), Stability Evaluation of Alternative Designs of
Drift-and-fill Stoping in Zhaoyuan Gold Mine, P.R. China, 30th U.S.
Symposium on Rock Mechanics, West Virginia University, Morgantown, West
Virginia, U.S.A. 19th-22nd June, pp. 285-292.
Zienkiewicz, O.C, (1986), The Finite Element Method, 3rd. Edition, McGraw-
Hill.
Zienkiewicz, O.C, Vallippan, S. and King, LP., (1969), Elastic-plastic Solutions
of Engineering Problems, 'Initial Stress', Finite Element Approach, Int. J.
Numerical Methods in Eng., (1), pp. 75.
Zhang, S. and Hii, J.K., (1990a), An Analytical Approach for the Estimation of
Pillar Strength, Ninth Conference, Ground Control in Mining, Edited by Peng,
S.S., 4th-6th June, Sheraton Lakeview Resort and Conference Center
Morgantown, W V 26505 USA, in Press.
Zhang, S. and Hii, J.K., (1990b), A Computer Model for the Prediction of Fully
Mobilized Pillar Strength, 3rd Conference on Ground Control Problems in the
Illinois Coal Basin, Edited by Chugh, Y.P., Southern Illinois University at
Carbondale, USA, 8th-10th August, in Press.

APPENDIX I
PROGRAM PRINTOUT

Appendix I AI - 1
Listing of the logarithmic yield function program
: #LOGARITHMIC YIELD FUNCTION* DIMENSION X(50),Y(50),YC(50),DY(50) C O M M O N N,A,B,X,Y READ(5,*) NPROBL D O 1 NP=l,NPROBL READ(5,*) N,C0,CE,EPS READ(5,*)(Xai),Y(Il),Il=l,N) CALL OBTF(C0,F0) CALL OBTF(CE,FE) IF (F0*FE.LT.0.0) GOTO 2 WRITE(6,*) NP,NP,C0,F0,CEJFE STOP
2 D=CE-C0 IF(D.GT.EPS) GOTO 3 CALL OBTF(CE,FE) C=C0+D*F0/(F0-FE) CALLOBTF(CF) NN=NN+1 SUMY=0.0 D 0 4K=1,N
4 SUMY=SUMY+Y(K) YB=SUMY/N Q=0.0 QQ=0.0 QS=0.0 D O 5 K=1,N YC(K)=A+B*ALOG(X(K)+C) D=Y(K)-YC(K) DY(K)=D Q=Q+ABS(D) QQ=QQ+D*D QS=QS+(Y(K)-YB)**2
5 CONTINUE R=1.0-QQ/QS DYB=Q/N WRITE(6,6667) NP
6667FORMAT(lX,////////,6X,'.**.PROBLEM.',I2,'.**.') WRITE(6,10) A,B,C •ypTTP /i 19^ TiYTi R F
12 TORMAT(5X,6HDCGMl=,F8.2,2X,'R=,J'8.4,2X,T=^8.4vO 666^SAT(65X,-.NO.-,6X,'.C3M.'.7X>-.C1M/,7X.'.C1C/,7X.-X1C1.'J0
WRTTEC6 11) axa),Y(D,YC(I),DY(I),I=l,N)
10 romATa^X,'CGMl=l 11 FORMATbx,I2,lH),4X,F8.2,4X^8.2,4X^8.2,4X,F8.2)
GOTO 1002 3 CT=CE CE=0.5*(CE+C0)

Appendix I AI - 2
CALLOBTF(CE,FE) IF(F0*FE.LT.0.0) GOTO 2 C0=CE F0=FE CE=CT GOTO 2
1 CONTINUE STOP END
C SUBROUTINE OBTF(C,F) DIMENSION X(50),Y(50) COMMON N,A,B,X,Y A11=N A12=0 A22=0 B1=0 B2=0 C1=0 C2=0 C3=0 DO 1 K=1,N T1=X(K)+C T2=ALOG(Tl) A12=A12+T2 A22=A22+T2*T2 B1=B1+Y(K) B2=B2+Y(K)*T2 C1=C1+Y(K)/T1 C2=C2+1.0/T1 C3=C3+T2/T1
1 CONTINUE T4=1.0/(A11*A22-A12*A12) A=(B 1*A22-B2*A12)*T4 B=(B2*A11-B1*A12)*T4 F=C1-C2*A-C3*B RETURN END

APPENDIX II
EXPERIMENTAL DATA

Appendix II A U - 1
Table AII1.1 Experimental data of sieve analysis one of C W R before processing.
Total weight of C W R sample = 26344.7 gm.
Sieve size Weight retained % of weight retained % of weight passing
(mm) (g) (%) (%)
+37.5
+26.5-37.5
+19.0-26.5
+13.2-19.0
+9.5-13.2
+6.7-9.5
+4.75-6.7
+2.36-4.75
+1.18-2.36
+0.60-1.18
+0.30-0.60
+0.212-0.30
+0.150-0.212
+0.075-0.150
under-sized
£ =
5803.1
3054.9
2766.0
3137.5
2331.5
1975.1
1606.4
1861.6
1324.0
863.3
647.7
240.9
214.4
272.8
289.8
= 26389.0
OL r\f prrn
21.99
11.58
10.58
11.89
8.84
7.48
6.09
7.05
5.02
3.27
2.45
0.91
0.81
1.03
1.01
I = 100.0%
26389.0 - 26344.7 T — • T-.
78.01
66.43
55.95
43.95
35.12
27.64
21.55
14.50
9.48
6.21
3.75
2.84
2.03
1.01
x 100%
= 0.168%

Appendix II AJJ - 2
Table AII1.2 Experimental data of sieve analysis two of C W R after processing.
Total weight of CWR sample = 3766.9 gm.
Sieve size Weight retained % of weight retained % of weight passing
(mm) (g) (%) (%)
+10.0
+8.0-10.0
+6.7-8.0
+4.75-6.7
+3.35-4.75
+2.5-3.35
+2.0-2.5
+1.7-2.0
+1.18-1.7
+0.850-1.18
+0.600-0.850
+0.425-0.600
+0.300-0.425
+0.212-0.300
+0.150-0.212
+0.105-0.150
+0.075-0.105
+0.063-0.075
+0.053-0.063
under-sized
0
740.8
535.9
747.3
413.7
332.9
243.5
138.3
196.5
119.2
89.6
67.1
44.5
32.7
30.1
9.4
12.9
4.6
6.4
1.5
0
19.70
14.23
19.84
10.98
8.84
6.46
3.67
5.22
"3.16
2.38
1.78
1.18
0.87
0.80
0.25
0.34
0.12
0.17
0.04
0
80.33
66.10
46.26
35.28
26.44
19.98
16.31
11.09
7.93
5.55
3.77
2.59
1.72
0.92
0.67
0.33
0.21
0.04
—
I = 3766.9 I = 100.03%
* * 3766.9-3766.9 „inng, % of error = 2,1669
= 0%

Appendix II AJJ - 3
Table AII1.3(a) Experimental data of sieve analysis three of C W R after processing.
Total weight of CWR sample = 1814.2 gm.
Sieve size Weight retained % of weight retained % of weight passing
(mm) (g) (%) (%)
+10.0
+8.0-10.0
+6.7-8.0
+4.75-6.7
+3.35-4.75
+2.5-3.35
+2.0-2.5
+1.7-2.0
+1.18-1.7
+0.600-1.18
+0.425-0.600
+0.300-0.425
+0.212-0.300
+0.125-0.212
+0.106-0.125
+0.063-0.106
+0.038-0.063
under-sized
0
289.1
189.1
301.4
169.5
148.2
88.6
67.4
103.8
146.1
57.4
53.6
69.4
73.92
23.95
24.56
6.86
0.07
0
15.95
10.43
16.63
9.35
8.17
4.89
3.72
5.73
8.06
-3.17
2.96
3.83
4.08
1.32
1.36
0.38
0.004
100.00
84.05
73.62
60.00
47.65
39.47
34.59
30.87
25.14
17.09
13.92
10.96
7.14
3.06
1.74
0.38
0.004
—
S = 1812.97 1=100.03%
„, , 1812.97-1814.2 1fVW % of error = i%]A2 X
= -0.068%

Appendix II All - 4
Table AJJ1.3(b) Grain size distribution of sieve analysis three of C W R
after processing.
Total Weight Weight Percentage
i) (%)
General Remarks
67.75
31.87
29.0
. _ -
38.75
14.75
12.50
4.618
Lower medium gravel
fraction.
Fine gravel fraction.
Coarse sand fraction
Medium sand fraction
Fine sand fraction
0.38 0.38 Coarse silt fraction

Appendix II All - 5
Table Alt 1.4 Experimental data of sieve analysis four of C W R after processing.
Total weight of CWR sample = 2319.5 gm.
Sieve size Weight retained % of weight retained % of weight passing
(mm) (g) (%) (%)
+10.0
+8.0-10.0
+6.7-8.0
+4.75-6.7
+3.35-4.75
+2.5-3.35
+2.0-2.5
+1.7-2.0
+1.18-1.7
+0.600-1.18
+0.425-0.600
+0.300-0.425
+0.212-0.300
+0.125-0.212
+0.106-0.125
+0.063-0.106
+0.038-0.063
under-sized
0
401.6
274.1
379.1
199.4
176.8
128.2
91.6
155.7
199.4
70.6
53.4
44.7
57.1
14.7
24.83
23.52
21.59
0
17.34
11.83
16.37
8.61
7.63
5.53
3.95
6.72
'8.61
3.05
2.31
1.93
2.47
0.63
1.07
1.02
0.93
0
82.66
70.83
54.46
45.85
38.22
32.69
28.73
22.01
13.40
10.35
8.05
6.12
3.65
3.02
1.95
0.93 —
Z = 2316.34 2 > 99.99%
2316.3-2319.5 1Anc? % of error = 2319 5 X
= -0.14%

Appendix II A H - 6
Table AII1.4(b) Grain size distribution of sieve analysis four of C W R
after processing.
Total Weight
(%)
71.0
28.0
Weight Percentage
(%)
32.0
39.0
16.5
7.5
4.0
General Remarks
Lower medium gravel
fraction.
Fine gravel fraction.
Coarse sand fraction
Medium sand fraction
Fine sand fraction
1.0 1.0 Coarse silt fraction

Appendix II All - 7
Table All 1.5 Experimental data of sieve analysis of West Cliff C W R sample 1.
(after Richmond et al, 1985)
Size Weight retained Weight Cumulative Weight
Oim) (g) % %
12700
6350
3350
1700
850
425
212
106
53
38
-38
5600
2881
1691
1204
501
399
304
101
146
52
1471
39.0
20.1
11.8
8.4
3.5
2.8
2.1
0.7
1.0
0.4
10.3
39.0
59.1
70.9
79.3
82.8
85.5
87.7
88.4
89.4
89.7
100.0
14350 100.0

Appendix II AJJ - 8
Table AII1.6 Experimental data of sieve analysis of West Cliff C W R sample 2.
(after Richmond et al, 1985)
Size Weight retained Weight Cumulative Weight
Om) (g) % %
12700
6350
3350
1700
850
425
212
106
53
38
-38
8280
1455
820
507
319
170
178
232
118
146
875
63.2
11.1
6.3
3.9
2.4
1.3
1.4
1.8
0.9
1.1
6.7
63.2
74.3
80.6
84.4
86.9
88.2
89.5
91.3
92.2
93.3
100.0
13100 100.0
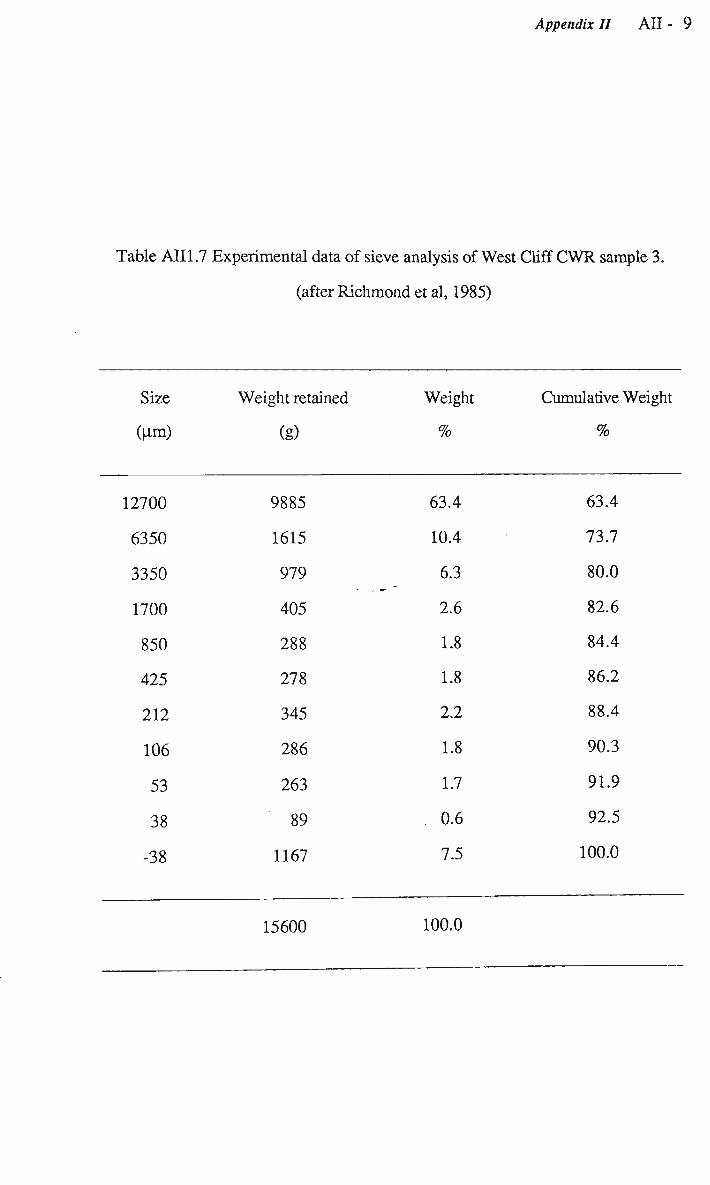
Appendix II All - 9
Table AII1.7 Experimental data of sieve analysis of West Cliff C W R sample 3.
(after Richmond et al, 1985)
Size Weight retained Weight Cumulative Weight
(Jim) (g) % %
12700
6350
3350
1700
850
425
212
106
53
38
-38
9885
1615
979
405
288
278
345
286
263
89
1167
63.4
10.4
6.3
2.6
1.8
1.8
2.2
1.8
1.7
. 0.6
7.5
63.4
73.7
80.0
82.6
84.4
86.2
88.4
90.3
91.9
92.5
100.0
15600 100.0

Appendix II All - 10
Table All 1.8 Experimental data of sieve analysis of West Cliff C W R sample 4.
(after Richmond et al, 1985)
Size Weight retained Weight Cumulative Weight
(Hm) (g) % %
12700
6350
3350
1700
850
425
212
106
53
38
-38
6278
1826
1075
657
364
250
164
82
76
36
492
55.6
. 16.2
9.5
5.8
3.2
.. 2.2
1.5
0.7
0.7
0.3
4.4
55.6
71.7
81.2
87.0
90.3
92.5
93.9
94.7
95.3
95.6
100.0
11300 100.0
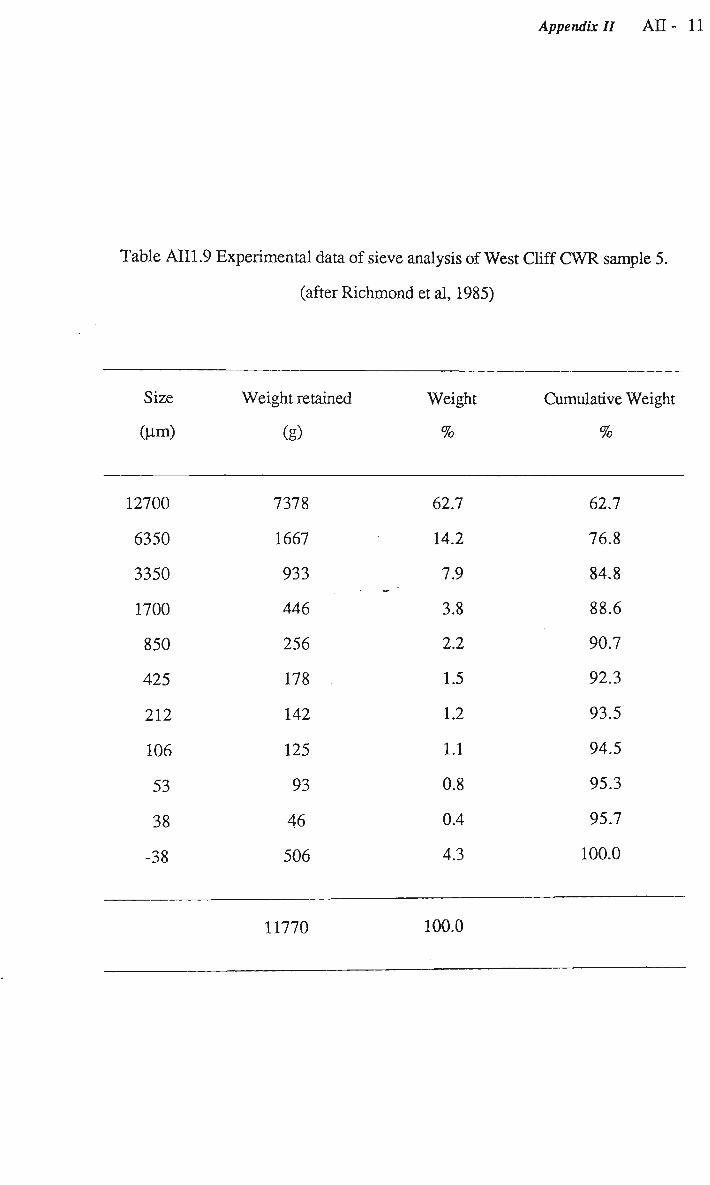
Appendix II A H - 11
Table AII1.9 Experimental data of sieve analysis of West Cliff C W R sample 5.
(after Richmond et al, 1985)
Size Weight retained Weight Cumulative Weight
(Jim) (g) % %
12700
6350
3350
1700
850
425
212
106
53
38
-38
7378
1667
933
446
256
178
142
125
93
46
506
62.7
14.2
7.9
3.8
2.2
1.5
1.2
1.1
0.8
0.4
4.3
62.7
76.8
84.8
88.6
90.7
92.3
93.5
94.5
95.3
95.7
100.0
11770 100.0

Appendix II All- 12
Table AJJ1.10 Experimental data of sieve analysis of West Cliff C W R sample 6.
(after Richmond et al, 1985)
Size Weight retained Weight Cumulative Weight
(r^m) (g) % %
12700
6350
3350
1700
850
425
212
106
53
38
-38
5917
1219
562
383
212
107
81
83
83
25
228
66.5
13.7
6.3
4.3
2.4
1.2
0.9
0.9
0.9
0.3
2.6
66.5
80.2
86.5
90.8
93.2
94.4
95.3
96.2
97.2
97.4
100.0
8900 100.0

Appendix II ATI - 13
Table AH1.11 Experimental data of sieve analysis of West Cliff C W R sample 7.
(after Richmond et al, 1985)
Size
Qim)
12700
6350
3350
1700
850
425
212
106
53
38
-38
Weight retained
(g)
6370
1620
1235
735
451
200
148
188
524
75
2094
Weight
%
46.7
li:9
9.1
5.4
3.3
1.5
1.1
1.4
3.8
0.5
15.4
Cumulative Weight
%
46.7
58.6
67.6
73.0
76.3
77.8
78.9
80.3
84.1
84.6
100.0
13640 100.0

Appendix II AJJ - 14
Table AIJ1.12 Experimental data of sieve analysis of West Cliff C W R sample 8.
(after Richmond et al, 1985)
Size Weight retained Weight Cumulative Weight
(Urn) (g) % %
12700
6350
3350
1700
850
425
212
106
53
38
-38
9825
1369
770
480
287
144
118
90
69
43
570
71.4
9.9
5.6
3.5
2.1
1.0
0.9
0.7
0.5
0.3
4.1
71.4
81.3
86.9
90.4
92.5
93.5
94.4
95.0
95.5
95.9
100.0
13765 100.0

Appendix II All- 15
Table AIJ1.13 Experimental data of sieve analysis of West Cliff C W R sample 9.
(after Richmond et al, 1985)
Size Weight retained Weight Cumulative Weight
(M-m) (g) % %
12700
6350
3350
1700
850
425
212
106
53
38
-38
7208
1884
1107
642
373
287
164
138
122
64
811
56.3
14.7
8.6
5.0
2.9
2.2
1.3
1.1
1.0
0.5
6.3
56.3
71.0
79.7
84.7
87.6
89.9
91.1
92.2
93.2
93.7
100.0
12800 100.0

Appendix II A H - 16
Table AII1.14 Experimental data of sieve analysis of West Cliff C W R sample 10.
(after Richmond et al, 1985)
Size
(nm)
12700
6350
3350
1700
850
425
212
106
53
38
-38
Weight retained
(g)
11980
1740
1062
829
401
278
168
189
183
79
1850
Weight
%
63.9
9.3
5.7
4.4
2.1
1.5
0.9
1.0
1.0
0.4
9.9
Cumulative Weight
%
63.9
73.1
78.8
83.2
85.4
86.8
87.7
88.7
89.7
90.1 .
100.0
18759 100.0

Appendix II AH2
Cv} I
o 05 I
o Cft CO I
o CO CNI I
o WO I
o CO CO I
CO CN] CN] I CO CNJ
SE I
250 CNl
Z CJ co
wo OH&S CM
lO "«*
CM I
I
CM
C^COCDCOWr'-CNJC-CD^'CO coocow-'tfcftcocooj'^'io ioo»aci)0)o>ooOrTH CMCMCMCMCMCMCOCOCOCOCO lOJOrHCMCMftCDCMr-ICOCO COCMCOCMCMaJCMt-»COCM'<# ( o a j c o r o c D o o o o ^ H CMCMCMCSCMCMCOCOCOCOCO COCOC-iOC^OJf-l^CO C--lQ0J'<S,0J»O,'f'^,C'» ( O W O S f f i O J O O H H CMCMCMCMCMCOCOCOCO C-CO^OJr-tCOCOCMr-t O O ) Q O > O O O H r r CMCMCMCMCOCOCOCOCO •r-liOiOiOiOCOCOCMO C0CMCOCOCDCMCOC">-© ^ O O O D C D O J O O O H CNJCNJCNJCNJCNJCOCOCOCO t-» OJ co i-* co r- O co co co c- io o) m ^ CD CO CD Cft cn o CM CM CM CM CM CM CO CJ C» lO *M TH lO CO CO CM CM •** "tf CD O lO C- CO CO 03 Cft O OJ CM CNI CM CNl CM CO lO CO OJ T-I CM Cft lO VO CM C^ rH CO C-» O CO CO CO OJ Cft Cft o CM CM CM CM CM CM CO oorr c- CM m CM CO »C CM CO CO I"- CO Cft OJ CM CM CM CM CM Cft T-4 TH lO C"* CO TC CO CO TH lO CO OJ Cft O CM CM CM CM CO r> co r-t *-. co CM CO lO JO CO CO OJ 0> OJ OJ CM CM CM CM CM
CO O CO CO Cft Cft CM CM CM
CO f» OO CO CO CO lO CO OJ CM CM CM
o CD CM CM
o co CM
rt^C^O^^OiOOiOO i-HiHCMCM'tfCOC-aJ

Appendix II AB2- 2
cn i
o ON CS
I
o ON
o ON
cn o NO
cs
d NO
o NO
cn « oo cs cs
^ S c n in -4
cs
i
Tf
cn i
r-
i
r-
i
cn
cs i
ONONr-^OOCSONOOOO oo«noor-T-HoooooNTt T-HcscnTt<n»n>nNor~ cscscscscscscscscs cSf-cs^tr-T-t^toooN o\ ^ <n h-o vo >n m ocs^-^t-^vntnNor-cscscscscscscscscs IH OO VO OO N OO Ov Ov ^f >t >n o\ vo vo T-I vo >n iHTt^inmvor^voov CSCSCSCSCSCSCSCSCS ONcSooovcnONT—tov T-HO\T-Hooo«novin ONCScncnmmmNO - H C S C S C S C S C S C S C S r~-r~-r-cSNor~-csr-oo in oo vo r^ r^-o n rHoico^-invovot^ CSCSCSCSCSCSCSCS ONCsocsinr^-'-'cn n rf o oo-^ TH t---f CNI n <n in in vo vo r-CSCSCSCSCSCSCSCS T-H cs cs o r- ui oo oo ON vo CS vo T-H cs "3- -* Ui Ui CS CS CS CS CS CS inr-ocncnr^ oo Tt in oo m c-<-H cn Tt Tt t •«*
cs cs cs cs cs CS cn Tt r- O NO in ON ON O oo CS cn T-H Tt Tt in Tt «n
cs cs cs cs cs cs oo t-~- in cs cn cn NO NO T-H CS""tf "t
cs cs cs cs T-H r- Tt r—
ON in cs cn T-H cs in in cs cs cs cs oo m cn cn vo ON Tt in
Mol^in cs cs cs cs
cn cn vo O^t vo cn cn Tf cs cs cs T-H CS O Tf NO 1> T-H CNl ^
cs cs cs Tt m r-oo NO cn T-H Tf Tt
cs cscs ON CS o cs NO o cs
mr-Tt'—IOOT-HOO ^H cs cs m NO ON

Appendix II AD2
tf) .
I tfi 1
ii
a ' - T H
PH 00
I.
fe p T-H
CS
U t£ p in l-H
TH
a •g J3 O bO C-•c 3 T3 TJ
a 3 C/3
ii
B * - > •»-H
o 1—1
ii >
o •H CH
O 00 cn
t-H
< 03
1 H
CO 1 1 I O 1 Cft 1
CM 1 I 1
O 1 Cft 1
r-i 1 1 1 O 1 OJ 1
CO I 1 1 O 1 CO 'I
CM 1 1 1 O 1 CO 1
«H I 1 1 O 1 CO 1
CO 1 1 1 CO 1 CM
CM I 1 CO 1 CM
tH 3 1 I ^ o o
2 O CM (id .
SH« M CM 1. O t "tf W O lH ix, &? t/3 O CM
. 1 IO tf T-H TH
T-I 1 tf T-I
CO 1 t
t>
CM 1 1 1 c~
1 r-i 1 1 1 C»
1 CO 1 ! 1 -ri
1 CM 1 1 1 iH
1 T-I
1 1 1 TH
I C5 <-* 1 Z H W 1 H S ^ 1 « M < J 1 D H Q 1 O •«-*
C*<- t> CO IN T-I IH c* 0 CO 0 O 1 ojtococMiOiOT-<r"»r>*-iT-H: 1 COCM"tfTriOJOCOlOCOC"»C- 1 r-l CM CM CM CM CM CM CM CM CM CM I
CO CM CO t> CO CD O C-» CM tf tf 1 O CM r-l CO O CM IS-C"* i-H CO CO 1 r-i'tfioiococococD>'t"-rs» i CM CM CM CM CM CM CM CM CM CM CM 1
O t^COCMCOJOCMr-iCMOO 1 O CM VO OJ Cft CM r-i if} in <o CO 1 r-rCMCOCOtftOiOiOCOCOCO 1 CMCMCMCMCMCMCMCMCMCMCM 1
O r-< CJ CO CO CO CO CM OJ i OJ m CO CO CM CO Cft CO CM 1 CM "tf lO JO CO CO CO t> CO I CM CM CM CM CM CM CM CM CM 1
CO C- r-i © CO T-I CO t> iH 1 CM O "tf CO CM O W £-* CO 1 CM 'tf JO r)* CO CO CD CO r> 1 CM CM CM CM CM CM CM CM CM 1
•tfCftCOCOOJCOCftOC^ 1 rtnrtoowoioto i C N J T T I O J O C O C O C O C O C - 1 CMCMCMCMCMCMCMCMCM 1
«D CM CM C- OJ CO t** 1 O CM CM m CO -tf JO 1 O CO "tf -tf »o CO CO 1 CM CM CM CM CM CM CM 1
tf tf CO CO i-l T-H. O 1 T-\ O O CO CO CO OJ 1 TM CO "tf tf lO JO lO 1 CM CM CM CM CM CM CM I
CO CO %H tf CO tf O 1 CM O CM CO O tf *-» | Cft CM "tf CO JO JO CO 1 T-I CM CM CM CM CM CM 1
T-I CO 'tf tf* JO 1 "CO O CO "tf CM 1 CM JO JO JO CO i CM CM CM CM CM 1
JO CO OJ OJ CO 1 lOOrlrlC. 1 T-I tf ID JO CO 1 CM CM CM CM CM 1
tf TH OJ r- CO 1 T-I CO CD JO T-I 1 Cft CO -tf tf lO 1 TH CM CM CM CM 1
C v ! W > 1 1 lO CM JO I [ CM -tf JO ( 1 CM CM CM 1
i CO OJ OJ I t tf O C- 1 1 OJ CM CO 1 1 T-H CM CM i
1 CO CO Cft 1 1 CO ID CD 1 1 r-l CO tf* t 1 CM CM CM 1
1 tf 1 1 CM 1
1 o ! 1 CM 1 TH 1 1 OJ f i o ! 1 CM
1 CM \ J CO 1 OJ 1 1-1
i TH>tfr>OtfT-icoioO)DO i 1 T-lT-ICMCMtfCOC-Cftl

Appendix II AII2
cn i
o ON
CS i
o Ov
o ON
cn o NO
cs 1
o
o NO
cn r OO CS cs
I
oo cs
cn i
cs I
r~
cn
cs
OOOONONOOONOO ovcscnT—iTtONOor-cnr--r-r-r--r~-oooo CSCSCSCSCSCSCSCS r-ooNoininoo^-vo HtfTtr-ooinr-in-tf •r} m vo t^ oo r^ o\ ov CSCSCSCSCSCSCSCS cSNOoO'—tcnin'-'r-oovoOTtr-vomm TfVOVOOOOOOOONON CSCSCSCSCSCSCSCS r— ON in ui 00 vo oo VO NO O NO ON in Tt cn in t~- oo oo ON ON CS CS cs cs cs cs cs Tt cn CS CS ON-tf T-H m ON O O "tf T-* cn cn in NO oo oo ON ON CS CS CS CS CS CS CS oo Tt t--1— in cs T-H oo oo cn Tf ON NO I— Tt in in OO OO ON ON cs cs cs cs cs cs cs
NO ON -tf ON cn in T-H oo T-H ON Tf NO NO r» t> cs cs cs cs cs CS O N ^ t *-* T-H
cn <n t-^O O vo NO NO ON ON cs cs cs cs cs o O CS NO vo cn r- o o o cn in vo ON ON cs cs cs cs cs t- OO O NO T-H IT)
cn NO oo cs cs cs ON in O in cn r-in vo r-cs cs cs Tf ON T-H
•tf o r-m t-~ r-cs cs cs cs -tf vo in Tf m cs cs
o m in r-Tf NO CS cs oo vOO in r-~ cs cs
O z l-H OH
X
o
ON CS o cs
NO o cs
oo cn cs
cnr-TtcnooTfpo

Appendix II AU2
1 m C U
B • H
o ii PH
co in
vd T-H I
u in
cs
& bfl C
•g o bo C •c Tj
1 O
o > o
•l-H
c-o CO in
cs r—I HH
< »—H
•s
co I l I
o C D I - I C O T - I T - O J C M C O C O O O
T - I C O C M P - O C O T - I C O C O O O
OJ I THC0CDCDC^D*-COC0C0Cft0J CMCMCMCMCMCMCMCMCMCMCM
<tfC0C*»iOr-CMC0CDC0COCO J O T - T O J C O C O T H C M O O C O C O
iH'tfJOCOi>COCOCftOJOJOJ CMCMCMCMCMCMCMCMCMCMCM
COHCO'J'OlOOHHHH C0THT-<0JtfC0OC^iV»-<TH O'tfJOxOC—C^COCOCOOJCO CMCMCMCMCMCMCMCMCMCMCM
I CM I I I O I Cft I
I I I I
I
o OJ 1 I CO I I I O I CD I TH I CM I I I
O CD
ifjT-<cOTHCMCOCOCDtf COOJJOOJlOCOCMC-CO
coiojor>c<*cococo CMCMCMCMCMCMCMCMCM
I
o CO CO
COC-CMtfOOOCOi-lC*-0 > C O H O V Q > H O M D O C O J O J O C O C - C O C O C O
CMCMCMCMCMCMCMCMCM
CO CM*
CM I
CO CM
3 I ^ CO
2 JO CM W • 22 CD CO M i-H I O I "tf W O T-I P H & S
CO JO CM . I
CM -tf
I tf
CO I
CM I
CM
•tf
o I CM I I I> I CO I O I CM I
I o I CO I OJ i i i i i
o o I CM
I I CM I O I r-i I CM I
O CO t> CM O tf tf C- C-CM CM CM
C-L>- CO CD CO CO CO JO lO CM CM CM
CO CO OO JO tf CO JO CO CM CM CM
CO CD CO CM O CM CO JO CO CM CM CM
CD CO JO tf CO CO CO JO CO CM CM CM
CO CO CO CO CM CM
i-l CO TM CO i> r> CM CM
tf CM O CO
CM CM
vt OJ tf -tf
CM CM
CM tf
c-CM
M f l O CO "tf C-00 CD OJ CM CM CM
OJ CO CO CM
O O CO CM
JO CM CO CM
I <tf I OJ I OJ I rH I I CO I CO I OJ I T H
I
r> co O CM
CO CM CO O OJ C-* tf JO CO CM CM CM
i-l CM CO CO CO CO CM »0 CM CM CM
COOJ CM CO CO JO CM CM
T-I CO JO CO CO JO CM CM
JO O CO CM
CO tf
co CM
rH
I I I
CO
CM
CO tf CD CO CO JO O CO JO CM CM CM
CO JO
CM
c^ r> O CM
T-I I GO I I r-i
TH I O I CM
<3
w 22
OH O
CO I
>*\ ' tfr>Otf*-,cDJOO«oO T-lT-ICMCM-tfCOC-OJ

Appendix II AII2
co I 1 i O 1 OJ I
I CM I I I
O I OJ I
I I I
I
o OJ I
I CO I I I O 1 CD t T-I
C M O J J O O O J I O T H O O O O
lOCDCMT-iJOOJO'tf^tf'tf CMCOiOCDCOCOCOCOCOCDtD CMCMCMCMCMCMCMCMCMCMCM oo<tfcor>i-icocof-000 O O O C D J O O C - O C O C O C O CM-tfCOCDCOC-C-COCOCOCO CMCMCMCMCMCMCMCMCMCMCM OcMOcoT-iT-ir>ojajojoj OJCOlOiHL>.i>COCMCMCMCM T H C O J O C D C D C O C - C D C O C O C O
CMCMCMCMCMCMCMCMCMCMCM
CM I I I O I CD I
I I
I
CDCOr>"tfOCO>DCOCM C^OJJOCMOOCOCOOCO
CMtfCOCOCOC^COCO CMCMCMCMCMCMCMCMCM
i
o CO
CO I CO CM
CM I 00 CM
SE TH i* I COCO
: THCM
! OJCO
I TH I
, i tf W O T - I P H ^ • CO JO CM
Cv)T-lHHOfflMOW COtfCMlOOJCOT-IOOOJ T-ico'tfJOiocDr»c^r* CMCMCMCMCMCMCMCMCM »OiOC->-CftCDJOtfC^CO OCOCOOQOT-<tfCft»-< N C O J O C D C O C ^ C - I > C O C M C M C M C M C M C M C M C M C M
nonnooco r-i TH CO CO CO CO CM CM tf "tf »o co co r-CM CM CM CM CM CM CM CO lO C- CO CO CO OJ iH tf CO CO CM CM OJ CM "tf JO JO i> C*» C-CM CM CM CM CM CM CM O O TH O CO CM CO r> TH co r> JO c» CM T-I tf tf* JO co co i> CM CM CM CM CM CM CM
o tf CO "tf CD tf co -tf co co r> O CM CO "tf tf .CNJ CM CM CM CM
I I CM tf1 I H H I
I ! tf
CO I
I I I I I
I I
CM I C^
I
CO I
CM I
co c-» co »o o JO CM CD CM C* CM "tf tf1 JO >0 CM CM CM CM CM Cft O CO "tf CM CO *-i CD CM r> ,H -tf "tf CO CD CM CM CM CM CM O 00 c-* lO OJ CM T-I CM tf CM CM CM tf CO TH CO O CM i-l tf "tf
CM CM CM lO CM OJ CO tf "3 t-* CO CO CM CM CM JO tf T-I
CM
CO tf CM CM
I I T-I I
I I 1
*-* I I I
CM CO CM CM
tfL>0"tf*-rCOlO©JOO ^ T H T-I CM CM tf1 CO C- CO

Appendix II AII2
tn
C
e •TH
o p in O cs r-H I
u o d T-H
& bfl
•1 o OX) CH
•c 2-
on cd
> O •TH
a o CO
d
CM 1 I I O I OJ I
1 T-H I I I O I OJ I
I CO I I I O I CD I
I
C^COCOCOC^T-IOJOJCDCOCO COC-f-C'-CMOJJOCMCDOO tfC0l>-t^C0CD0JOOT-HiH CMCMCMCMCMCMCMCOCOCOCO COOJCOCO»-«JOCOlOCOCOCO OCDOOCOtfCOi-ICOCOCO JOCDCOCOCOOJOT-IT-IT-<TH
CMCMCMCMCMCMCOCOCOCOCO CDT-ICMCMtfCOC^r-'tf JOCDCJOJJOCMOJCOtf tfCOOC^COOJOJOiH CMCMCMCMCMCMCMCOCO CM
I O I CO I
i CJ o tf f* P* io io i-H I> CO C- r-H OJ CD CO tf JOCOI>C^CD00 0 J © O CMCMCMCMCMCMCMCOCO I
I O 1 CO I
I CO I i I CO I CM 1
I CM I 1 I 00 I CM I
3 I I >§ CO I
2 © C M I 23 CM co I H H I I U I tf I W O T H I
0 H ^ I CO O CM I
. 1 I O tf I
I tf
tftftfCOOJCOOOOO COT-IJOC^COCMCDCMCM
tfCOl>-l>CDOJOJOO CMCMCMCMCMCMCMCOCO CM T-I tf* rf OJ OJ C-T-I OJ OJ OJ tf CO T H JO CO C»- P- CO OJ O CM CM CM CM CM CM CO t-I "tf JO JO CO © iH CD lO CO CO JO CO OJ tf co r> c- CD OJ OJ CM CM CM CM CM CM CM
CM CO CO CD C- CM JO CM CM CO CO JO CM CO tf CO C^ C^ CO OJ O CM CM CM CM CM CM CO
CO T-I CM OJ CO •tf OJ © tf c-JO CO CO CO CO CM CM CM CM CM
CO.© CO CO CO tf OJ CM CM JO lO CO CO CO OJ CM CM CM CM CM
I CO OJ tf CO tf I T-4 CD JO OJ CO I io co co r- ao I CM CM CM CM CM CO I CO JO CO
I i "tf r> J O C* I tf CO oo
I CM CM CM CM 1
r-i I I I
C- I I I
CO I I I
CM ! I 1
iH i
© 2 W M 2s
DH o
I f T-I I
I I I I I
O CO -rH iHOO CO JO co oo CM CM CM CM CO OJ CM © © tf CO CO CM CM CM CO r-CO CM l> CO tf CM JO r-CO CM
CO
< Q
^ ltff>©tf^C0JO©|O© r-i T-I CM CM tf CD r> OJ

Appendix II AII2
z
cn i
O ON cs
I
O ON
T-H 1
O ON
cn 1
o NO
cs 1
o vo
( o
cn 1
oo (N
cs 1
oo cs
T-H
r*- OO
SPECIMI
10.0%C-13.8'
14-2 14
r3
a r-H
p
u
1
"tf r-H
cn
cs •
T-H 1
r-
cn l-H
CS 1
i-H 1
TIME
(DAYS)
o cn NO r- Tt cn in cn NO cn -tf T-H r^ in r-< cs cn cn Tf Tt Tt CS CS CS CS CS CS CS cs cn T—i o cn oo vo T-H o NO in cs in c--T-I cs cn cn Tt Tf Tf cs cs cs cs cs cs cs Tf OO T-H NO in OO T-H •tf -tf cn oo in ON ON T-I cs cn cn Tt Tf Tt CS CS CS CS cs cs cs cs r-~ T-H cn T-H c~ ON T-H r>-NO cn NO T-H cn cn Tt in oo cs cs cs cs cs cs r- in o o o o Tf T-H o oo NO cs cn —' cs cs cn Tf Tf CS CS CS CS cs cs O cn in cs oo ON oo oo r» cn o oo o T-H cs cn Tf t--cs cs cs cs cs cs O OO CS Tf NO O o Ov cn r-O cs cs cn Tf cs cs cs cs cs cs oo r-« o -tf ON O in Tf ON ON cs cs cn cn •"-• cs cs cs cs cs o o o o o ON NO cs o r-o T-H cs cn cn cs cs cs cs cs
2067 2156
2169 2302
2281 2277
2366 2389
CS OO NO NO T-H o in vo T-H cs cn cn cs cs cs cs
2112
2277
2401
r- r— cn cs oo in T-H T-H cn cs cs cs O N CS NO T-H ON vo r-H l-H Cn
CS CS CS Tf oo ON T-H
ON tf
o cs r-cn o CS
T-H cn r-- Tf oo o O rH cs V O O N

Appendix II A H 2
I m
C
D
B • T H
O ii CX in
CS T-H
ON T-H I
u O
d
bO
a •c
o bo
c
•c •§ TJ PH
3 oo cd
> o 'H
P
o tfi ON
d HH
H
CO 1 1 1 © 1 OJ 1
1 CM 1 i I O 1 OJ 1
1 T-I 1 1 1 O 1 OJ 1
1 CO 1 1 1 O 1 CD 1
1 CM 1
1 J © 1 CO I
1
1-1 1 1 1 © 1 CO 1
1 CO 1 1 1 CO 1 CM 1
1 CM ) 1 1 CO 1 CM 1
i 3 tH VZ 1 CM CO
2 T-{ CM
22 OJ co H-1 rH I O I tf W O T-I OH c* CO © CM
• 1 © tf r-H iH
T-i
1 tf iH
CO 1 p-
CM 1 t
iH 1 P-
CO 1 T-I
CM 1 iH
1 iH I 1 1 rH
1 o ** 1 2 WtO 1 M 2s >* | p , H < 1 D H Q 1 O —
OOCMCMCMCOCMCOCOtftftf J OJ CM CO CO © JO -ri "tf OJ OJ OJ 1 OJ TH CM CM tf tf JO JO JO JO JO 1 iHCMCMCMCMCMCMCMCMCMCM 1
CMOJJQOJCOCOCftOT-HCOCO 1 co JO tf co O O O co r> co co I O CM tf tf JO JO CD COCO CD CD 1 CMCMCMCMCMCMCMCMCMCSCM 1
C M J O C M C M O J C O C O J O O J O J J O 1 OJCOCOCOt-©JO00COCOtf 1 OJ CM tf tf tf IO lO JO CD CO CO 1 I H C M C M C M C M C M C M C M C M C M C M 1
COJOOOCOCOCDCOP-P-© r-» r- CM OJ CO CO © CM 1 O CM CO tf tf JO JO CD CO 1 CMCMCMCMCMCMCMCMCM 1
CM OJ OJ CO CO CO tf CO © i CO CO OJ TH OJ OJ tf OJ CO 1 © CM CO tf tf tf IO JO CO 1 CMCMCMCMCMCMCMCMCM 1
O J C O C D C M C O C O O O J O T - I CM © © JO T-H TH CO P- tf ' ©COCOtfJOJOJOJOCO ' CMCMCMCMCMCMCMCMCM j
I f l N P p O O N i H O i O J O O O O O CO tf tf JO lO CO I CM CM CM CM CM CM CM j
"tf T-H l> CO iH iH JO 1 CO CO CO tf JO JO P* ' t~ rH CO CO tf tf tf ' TH CM CM CM CM CM CM \
TH OJ OJ lO CM TH CO j CO P* CO tf T-H CO O 1 0) CM tf tf JO JO CO i TH CM CM CM CM CM CM
"tf p* CO CO CO 1 JO CO CM CM iH 1 © CM tf tf JO 1 CM. CM CS CM CM 1 1 JO © tf tf TH | © O CO CO CO J 1 © CM tf tf JO J 1 CM CM CM CM CM 1 '•
1 CO JO CO CO © \ 1 p- CM OJ OJ © 1 CO CM CO CO JO 1 TH CM CM CM CM 1 I
1 CO CO OJ I 1 P O O H 1 CO TH CO 1 TH CM CM 1 •
1 tf CD 00 ' J 1 0J CO CM 1 OJ CM tf I TH CM CM 1 1 | CO TH TH { 1 © CO iH I © CM tf 1 CM CM CM 1 1 CO | t tH
1 © 1 CM 11 i tf i 1 CO 1 CO t tH i • 1 i
1 r-i 1 JO 1 CO 1 TH
I I 1
1 J ! tHtfr>otf'-•COJOOIOO | | ,H T-» CM CM tf CD c- o>
' 1 1

Appendix II AII2 - 10
I m C ID
B • t — i
o ii
&
m
NO CS 1 — I
I
U
-o IO |H
m d ii
o
O
>
o •TH
p
o CO O , — I
CS l-H l-H
< ii r—H
H
cn i
o ON
CS i
o ON
o ON
•
o NO
<N i
o NO
o NO
cn i
oo cs CS
*£ i in i tX r-l
a bO P p o bQ p • H L H
3 T3
i
oo cs
r oo
Z^?s PJ NO gCSco W T-H |
ur\it tU X> T-< co in cs
1 r^4
cn i
p-
cs I
p-
p-
cn
cs
cn cs cs
NO Tf T-H
cs
NO in o cs NO
cs
s o cs cn t-H
CS
cs
o oo o cs NO r~H
cs
cn p-o cs "tf o T-H
cs NO
cs
cn cs vo T-H r-oo O N tf ui T-H T-I T-H cs cs cn CS CS cs cs cs NO NO NO NO T-H oOOvOvOvP cs cs cs cs cn cs cs cs cs cs ON cn NO NO T-H in r- Tt in ON o T-I cs cs cs cs cs cs cs cs O cn cn oo
o NO NO p-cs cs cs cs CS CS CS cs oo cn ON CS cs O OO 00 O CS T-H cS CS CS CS CS p v o i n o N O oo CS O N THrHCHCH
cs cs cs cs (SO tf
oo o in T-H cS cs cs cs cs ON OO VO N O r~- N O <—I T-H ( S
cs cs cs cn cs p» O CS oo cs cs cs CS CS cs r-H NO
NOVO r-H T-H
CS CS
r— cs oo r> O r H
cs cs 'sO ON P- cs cs cn cs cs
Tf cs NO O r-. CS cs cs in cs T-H S^)
T-H CS
cs cs
ON ON O rH CS CS
cn in ON
VO ON ON
cn NO ON
cs r-ov-tf o o p o T-H CS NO Ov
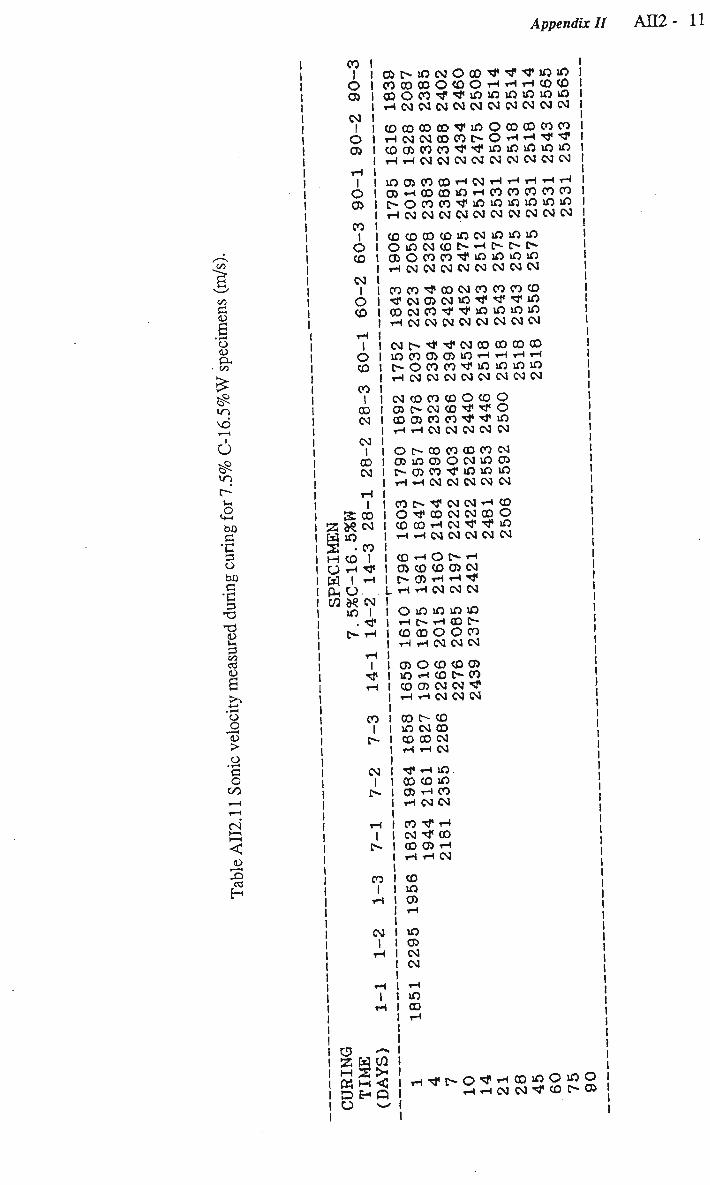
Appendix II AII2- 11
m p
a
.g o ii CX tfi in NO i — I
6 in p^
& bO P •c p
o bO P
I TJ
1 tfi
o a o o >
•1 o CO r-t
< ii
CO I
o OJ CM I I I © OJ
o OJ CO I © CD
CM I I I O 1 CO 1
I © CO I
I CO I I I CO I CM I
I CM I 1 I CO I CM I
Q>P*-iOCM©CDtftftfiOlO C O C O C Q O C O O T H I - H T H C D C O C0©CDtftfJOlOJOiOJOJO T H C M C M C M C M C M C M C M C M C M C M
COCOCOCOtfiOOCOCOCOCO iHCMCMCOCOP^OtHTHtftf COOJCOCOtftflOJOJOJOJO T H T H C M C M C M C M C M C M C M C M C M
JOOJCOCOT-ICMTHTHTHT-IT-I O J I H O O O O J O T H C O C O C O C O C O p-OCOCOtfiOJOJOiOJDlO r-HCMCMCMCMCMCMCMCMCMCM
CDCOCOCDiOCMJOJOiO O J O C M C O P - I H P - C ^ P -
OJOCOCOtfJOJOiOlO iHCMCMCMCMCMCMCMCM COCOtfOOCMCOCOCOCD tfCMOJCMlOtftftfJO COCMCOtftfiOJOJOJO iHCMCMCMCMCMCMCMCM
CMP»tftfCMCOCO0OCO JOCOOJOJlOtHiHiHiH P^OCOCOtfJOJOiOiO T H C M C M C M C M C M C M C M C M
I 3co
2 c* CM W JO S • co hi CO I U tH tf W I *H PHO. CO « CM
JO I . tf
P* iH I tf TH
CM CO CO CD O CO O OJ O CM CO tf tf © CO OJ CO CO tf tf JO r-H T-H CM CM CM CM CM
O P» CO CO CO CO CM OJ JO CB © CM JO OJ p- OJ CO tf JO JO JO TH r-H CM CM CM CM CM
CO P- tf CM CM r-H CO © tf CO CM CM 00 O CO CO T-I CM tf tf JO iH iH CM CM CM CM CM
I CO T-H I OJ CO I P-OJ L H r H I I o
CO I p>
CM I P~
I P-
lO p-
CO CO T-H T-H
OJ o JO iH CO OJ iH iH CO P-JO CM CO CO
O P- T-H CD OJ CM H H t f CM CM CM JO JO JO THCD P-
© O C O CM CM CM CO CO OJ CO P* CO CM CM tf CM CM CM CO CD CM CM
tf T-H
CO CO OJ tH tH CM
JO JO CO CM
CO ! I I
CO tf iH CM tf CO CO OJiH iH TH CM
CO IO OJ iH
CM I I I t-i I
xO OJ CM CM
iH JO CO
CO I
< Q
I TH tf p O t f ^ C O i O O i O TH TH CM CM tf CO P-

Appendix II AII2 - 12
I tn
P
1 • H
o <u PH
m
O ON T 1
1
O in
p^ l-H
bfi P
i o bO P
•g T3 T3
I tn cd 03
O r2 a >
o • H
p
o CO CS r-H
i a
CO I I I © I OJ I
I CM I
I I © I OJ I
I
O OJ CO I © CO CM t O CD TM
I O CD CO 1 CO CM CM
© O J J O C M C O P « - I O T H © 0 0
tfOJf-itftf00tfCD©O© OOT-HCOCOCOCOtftflDiOJO iHCMCMCMCMCMCMCMCMCMCM tf©COCOCOiOP-OCOCDCO C D C 0 t f C M C M T H C M © © © O CO©CMCOCOtftf»OJDlDiO iHCMCMCMCMCMCMCMCMCMCM COr-iOJOJOJCOt-OJJOiOiO CMCOOOlOiOOJCMCOtftftf OJiHCMCOCOCOtftftftftf iHCMCMCMCMCMCMCMCMCMCM tfrHJOOMOTHCOP-OJCMCOOCOtfCO©CO COiHCMCOCOtftfJOJO T H C M C M C M C M C M C M C M C M
I I CO I CM I
CO CM
COCMC»iO©JOP-P-tfP^P-CDP-tftfJCO
Cftr-HCMCOCOtftftf iHCMCMCMCMCMCMCM
iH CM tf CD CO lO CO CO CDtfOCOtHCOCMlO C-»©CMCMCOCOtftf iHCMCMCMCMCMCMCM
O CO tf CM CO tf CM CO OJ CO P> P- CO lO OJ CM CO CO CO tf tf TH CM CM CM CM CM CM
CD CM tf tH CO CD JO . O P* CO CM tf P» tf I CO TH CM CO CO CO tf I iH CM CM CM CM CM CM
I O OJ O JO P- CO CO I CD O tf tf CO tf tf I CO CM CO CO CO tf tf I TH CM CM CM CM CM CM
CM T-i IO CM
JO OJ tf CM
CO
I tf
rH OJ O T-
W I OH O COJ£CM
JO I . tf
IP-
I CO
iH I J3JT-H
p* OJ iH tf
tf co co OJ CO CO CO
CM CM CM CM
T-H i JO CO
© CD CM JO CM CO T-i JO rH CM CO CO CM CM CM CM
I tf
CO
p- I
O CO IN tf CM iH CO P- OJ CM OJ CM CO CO tf r-H CM CM CM CM
O O CO CO CO CO CO OCM TH CM CM
CM I p»
JO CO CO CO OJ P-00 iHCM iH CM CM
r-H CO OJ CO OJ CO CO tH CO T-I CM CM
I CO I CM I I "H
TH I OJ
o
CM 1 iH
iH
1 TH
*•*+
2 WCO r-i
tf 22 r* I-H <C
O H Q O V.*
1 OJ 1 CO 1 CO 1 TH • i I © 1 © 1 CO 1 T-H
1 1 1 1 1 1 iH ( 1
tf c-O tf tH 00 JO © JO
r-» iH CM CM tf © P~ OJ

Appendix II A H 2 - 13
. on
m P D
6 • H
o 13
p in
£ O CS*
•
U c£
p in &
bo P
•c P O
ba p
•c p T3 T3
s C/3 OS D
s 4—* •^H
o r—1 <D > O
• i—i P o CO
cn
cs l-H l-H
< ii
rt
cd
H
Zt
^ t-H
U w
cn i
o ON
cs
d ON
T-H t
o ON
cn
d NO
cs 1
o NO
^ 1
o vo
cn 1
oo cs
cs 1
oo cs
"1 oo ^ C S
p . cs'To rH V
62 OHS* COO CS
> — 1
Ot,
U
iri -4 r~*
r-H t
tf 1—1
cn i
P-
cs p~
T-H
p-
cn
cs 1
1—1 1
/—s
pq co
p-VO oo T-H
o oo p-T-H
1 1 1
T-H
p-'"'
rH
cs p-T-H
in cn oo T-H
tf ON cn oo o | CS NO P- OO o i ON ON ON ON O
T-H r-H T-H T-H ( S
T-1 en -tf o vo ! cs O in cs cn ! OOON ON O ON
T-H r-H T-H C S T-H
Tf in in "tf oo vo in NO in ON NO P-P- OO ON ON O O rH T-H T-H T-H CS CS
T-H O OO O
! NO .-H cs cs i oo ON O O
T-H r-H CS C S
T-H cn Tf p-• ON oo in ov ! OO ON Tf o TH H cS CS
T-H CS P- Tf ! oo ON p- cn ! o v o v O ^ T-H T-H CS CS
oo oo ON cS ON ON O T-H o cn oo ON ON O cn T-H
OO ON P-T—H
rH rH CS CS
T—1 Tf OO ! T H O O O i OO OO OO
T-H r-H r-H
OO OO NO OO P-ON O cn p~ oo oo ON o O O T-H
ON T-H
p-T-H
cs cs oo T-H
1
1
cn oo p-T-H
Tf o OO T-H
p-p> OO T (
o o p-T-H
T-H
tf rH
o o oo T-H
,_
<-H CS cs cs
cs o ! cs cn ! p- oo
T-H T-H
cn oo ! cn ON ! ON ON
T-H T-H
tf tf cs tf tf p-p- oo oo T-H T-H T-H
p~ p-oo
o ON
oo T-H
cn p-ON T-H
in p- tf oo o o rH (S NOON

Appendix II AH3 - 1
CM I I I
© I OJ I
I O OJ
CO 1 I I © I CD I
I CM I 1 I © I © I
I I © 1 © I
J CO I I ! 00 I CM I
I CM I I I CO I CM I
i HCMOOJiHOCMOJCMtftf CD00COP-C0COCDP-CO00C0 COCOCOCOCOCDCDCDCOCOCO
P-P-OJCDCMCMCOCOiHtfCO tftftftflOJOlOtflOlOlO COCQCOCDCQCOCOCOCO©CQ rl rl rl H rH H rl rl rH »H rl COCOtfCOCQiOP-tfP* COCDOOCOCOCOCDCOCO COCDCOCOCDCQCOCOCO rtrlrlrlrlrlrlrlH iHCMOJOJCMCMtfTHCO lOiOtftfiOJOiOJOiO cococococo©cococo H r l r l r l r t r l H r l r l tfp-CDCOCOCDOJjOP-coojcocftCftcfta>o>o^ C O © © © < O C D C O C O C D rlrlrHrlTHrliHrlrl p* CO © © OJ OJ OJ CO © CO CO OO © CO JO JO JO JO JO lO JO
JO CO tf tf © CO CO p- p* p- p- p* p* p* lO lO JO lO lO iQ *0
3 1 ;*oo
2 © CM CM © I M rl O I
wo CO O
CM
I tf CO CO CM CM O CM | ^ H r l r l r l r H H I,CD CD CO CO CD CD CD | rl rl rl rl T-i iH ri I CM CM CO CO CO
o o o o © p». p~ p» p - p-rl rH rt rl iH
IO tf
I tf rl
CM I
P»
I I CO I CD I CD I r-H I I OJ I iH 1 P-I tH I
O rH rl rl CO P* P* P» CO CO © CO rtrlHH OO OJ OJ o H H H C V C H C O P P
tf 1 Cft I CO I iH
CM
I rH
© CO Cft OJ
co co rl n
JO tf P-lO JO JO CD CO CO rlrlrl CO OJ ©
o 2 W HH 22 04 M O
to
<
©
tf
P-©
Tjt>Otf H C O l O O l O O T H T H C M C M tf ©P-OJ

Appendix II AII3
tn
B cd oo P 13
B •t-H
o 13 P in rs p-tf
in
P
•§ o bO P •c p TJ 13 >-H
P cd 13 (ZI
13
Id > -P bO • l-H
13 P
.rH
o 13 PH
CO CS cn < 13 >—H
•s
cn i
O ON
cs I
O ON
O ON
cn i
o NO
cs 1
o
o NO
m i
oo cs
cs i
oo cs
, fcg oo
Z*:CM
cn i
p-
cs p^
cn
CN
O z t-H
X u
cs cn NO
o cn NO
tf CS NO
ON cs NO
cn NO
tf NO
cn o NO
tf cs VO
m cn m
c s o m cncn cs VO vo vO
cs cn oo tf cs T—i CS T-H vo NO vo vo
O oo in cn o oo vq CO CM CS ' CS CS CM CS NONOVO NONOVOVO
tf T-H VO
CS CS T-I vo vo vo
oo p- tf cs cs cs VO NO NO
T-H ON P-m cs cs NO VO NO
O oo in tf cn cn NO NO NO
cn in O ON
rH o t f cs NO VO VO VO
T-H OO P-(S r-l T-H
vo VO vo
m in T-H cs T-H cn VO VO vO
cs vo in cn cs cs vo VO vo
O T-H
vO
cn tf vO
cn cn NO
cn T-H c~- in O O ON ON
vo vo m m
cn T-H oo vo CS CS H H vo vo VO VO
tf ocxiCi cn en cS cs in in in in
O P T-H O NOVO
cn cS
tf "J vo vO
CS T-I cn cn NO NO
ON in oo T-H T-H T-H
NO NO NO
ON O cs tf NO NO
oo tf P-cn cn cn vo NO NO
m cn in
oo m m
cn m m
i n r - o O t f r H O O O N O O O ' ^ T ^ c s c s c s m N O O N

Appendix II AII3
tn
1 tn P 13
a • TH
O 13 PH CO
CS I
U p in T-H
& bO P •c
P o bfl P
•c p TO T3
I p c/3
cd 13
00
13 P
> j—»
rP bo 13 r* P 13
CJ 13 PH
CO
cn cn t-H t-H
13 i-H
JO ed
H
CO I
o OJ CM I O OJ
1
© OJ CO I
o co CM I © CO
CD © tf tf P-O rl iH rl rl CO CO CO © © rirlrlHH CD P» r-i TH CO ri T^ CM CM CM CO © CO CD CO rH iH rH rl rH
CO © OJ OJ © P- P- P- P» CO JO JO JO JO JO Hrlrlrlri
COP-CM JO JO tf rl rl rl rl rH rl
© CO CO CO CD CO iH rl rl
CO tf rl CM CM CM CO © C D rl rl rl
©con CO CO CO JO JO JO rl rl rl
CM CM CM CM CM CM
© © C O
CO tf rl © CO CO JO JO JO
I C O C O i O i O l S P - O p - O I JOJOJOJOlOJO©lOCO I C O C O © C O © © C D C 0 C 0 1 rl rl rl rl rl rl rH rl H I I C O C O O J O J C M O C O C O O I T H T H T H T H C M C M C M I H C M
I cocococococococo© I rl rH rl ri rl rl rl rl rH I
I I O CO
CO I 00 CM
CM I CO CM
3 I « 0 0
2 O CM
rllOlOCOlOP»tfP"
I cococococoeocococo I COCOCOCOCDCOCDCDCO
r l r l H r l H r l r l H I JO tf t>
rt rl CD CO CD
tf JO P-
oo© co co co rt rl rl CO P- tH © © tH CD CO CO
P-tH T-H CM CO CD
CD CD
© O CD CO
rl CO rl rl
© ©
© CM rl CM CO CO
© O O tH
co co rl rl rl lO rt rl
co co 22 n M CM
O I W O PH*?
CO O
CO I tf
OJ
© tf ret
© rH rl ©
© © © © JO JO lO JO
CM I
JO tf iH TH
I tf rl
OJ © tf tf tf CM CO © CO CO JO JO JO lO lO
CO P- CO P- CD CO CO © CO CO lO JO lO JO © rl rl rt rl rH
CO I p»
CM I P*
I I
CM CO CO CO CO CO lO JO JO
co © P-iO IO JO tf tf tf
rl
I P*
CO I
CM 1 I I
Cft © TH
rl CM CM CO CO CO
CO
o CO
co CO CO
rl I 05 I I r-H rl I CO
O 2 W M 22 04 W D H O
CO
< tfOOtfrlCOJOOlO
rH rt CM CM tf CO t> OJ

Appendix II AII3 - 4
co
a cd c/3
p 13
a •T-H
o 13
P C/3 ^
cn
U in cs
bO P •c p
o bfi P •c p T3 T3 13
If)
cd oo 13 3 Id > Xi bJO • H 13 P 13
O 13 PH
CO tf cn
H < 13 r—i
X> cd tr
im i
o ON CS
i
o ON
1
o ON
cn i
O VO CS
I
o NO
o NO
cn i
OO cs
cs i
oo cs
cn i
p~
cs I
p-
cn
CM i
o z t-H
X
u
p-csoocnoocsinoo oop-NONOinmtfcs VONONONONONONONO
ONp-cncnp-mrHg O O O O v O O P ~ N O t f r^p-p-vovovovovo
cs ON
NO
NO
xn ui T—i oo ON oo I oo p-p-in tf cs NO vO NO NO NO NO
TH O m oo p-H O C V O O P p~ p- vo vo VO
vo oo NO
o cnNOcs NO oo NO in tf cn VO NO NO NO NO
cn CS P- tf ON O Ov CS CS T-H O ON O N P; ^ t--. . \o NO NO
r-t O OO NO tf O O O N P- P-f-. C-. vo vO VO
O N p - m tf O in m in tf tf vo vo vO vo vO
tf en ON in o m ui tf cn en NO VO NO NO NO
t— p~ cn ON ON P-NO NO NO
C S O N O
O O P ; P- P-VO
T-H O P -_ TH P-P-P-VO
NO in cs p- P~ P-vo vO VO
in T-H
oo in vo vO
r-H NO P- NO NOVO
tf VO NO
cn ON tn
oo ON NO
icnp-tfcnooinpo i, cscs tf VOON

Appendix II AH3
tfi
I feb m p
o 13 P. C/3
© I 1 ! O 1 © I
tDP»©CDGJ<"JiHr<!OCft05 tftflOJOJOiO©CO©JOiO C O C D C D C D © © C O C D © © < 0 I rHrHrHrliHiHrtrlrlrlrl
CM I I I O I OJ I
I rl I I 1 O I OJ I
I CO I I 1 O I CD I
I CM I I I O I CD I
lOtfOrHlOlOP-©iOtftf P*P-C0C0CO©COCO©COCD CDCDCDCDCDCOCDCOCOCOCD H H r l r l H H H W r l r t r l JOtfOJOJtfCOP-COtfCOCO COCDCOCDP-P-P-P-P-P-C~-CDCO©CO©CO©CDCD©CD rlrlrlWrlHrlrlrlWrl JOCOOOOOCOCMJOJOtf P-P-P*P-0OCO©CO© C D C O © C O © © C O © C D rlHrlrlrlHrlrlri ©©THiHtfCOOJOJO CD©P-P-P»P-P-P»P-C O © © C O © C O © C O C D rlrlrHrlrlrliHrliH
I | lflCOHHlOlOP JOtf © i c o a o o J O J O J O J O J O J O J CO I C O C O C D C O C D C D C D C D C O
I rlrlrlrlrlrlrinrl CO I I I
OO CM
1 I )
CM I I 1 1 I
CO CM
I I 3 «co
2 JO CNJ 22 © co M rH 1 O I tf WOT-H OH J* ' CO JO CM
. I CM tf
tf JO © P- P- 00 CO CD CO
O O) tf P» CO P* CD CO CO
JO tf O CO CD P» CD CO ©
rl p- CD CO OO OOCO 00 co © co co
p- © OJ TH pr CO P- CD CO © © CO rH rl rH rH O CO CM JO p- r^p- P-co CO CO CO rl rH rt rl
CO JO CM CD COP-CO CO CO X H H CM OJ © p- CD P-CD CO © rl rl rl
CM tf P-P-CO CO
lO P-p* p-CO CO
I tf
CO I p-
CM
I p-
I © t p-I CO I tH I I CO I JO I CD I rl I I JO I CO I CO
l> TH rH tf CD P- P- P" CD © CO CD
tf O JO CD CO CO
CO © coco co co
rH t © I P-
I CO I CO
O J © P- CO CO CO
CO I
CM I rl
CO P-CO rl
O CO
co
l I © CO
© 2 W w 2s
D H O
CO
<
p I TH tfp-OtftH©©^"0
T-H rH CM CM tf © P* 0J

Appendix II A I D
1 tfi 1
a ! cd 1 fe 1 00 '
C 1
.1 ! o ' a I PH | oo *-. ^ ! T t ^ '
cn .
O N I T-H 1 1 U i
^ i in cs' r-H
IH
a bO P 1 "C I p o bO P
•c P T3 TJ 13 P P C/3 cd 13
a oo 13 3 13 > <-> -p bJO •T-H
% P
•»H
13 PH
CO vq cn t-H t-H
< 13 Xl cd H
CO 1 1 1 O 1 © 1
CM 1 1 I © 1 OJ 1
T-i 1
i 1 © 1 OJ I
CO 1 1 I © 1 co I
CM 1 1 1 © 1 © I
tH ( 1 1 © 1 © 1
CO 1 1 1 CO 1 CM I
CM 1 1 1 CO 1 CM 1
3 TH I c* 1 1 CO CO 1
2 T-i CM 1 M . | 2 o> co i H r l I 1 O 1 tf 1 W U H I cu « eo io CM i
. 1 1 CM tf 1 •rl rl
rl 1 tf rl
© 1 I
P~
1 CM 1 1
; ^
1 *H [ 1 1 P-
1 CO 1 I 1 r|
1 CM 1 1 1 TH
l n l I 1 TH
1 © ~ I 2 WCO ( H S > H l « H < 1 D H © I O ^
1 P" JO tH rl rl CO © tf rl JO O 1 rtOrlrlHrlHrlrlrlH I © c o c o © © c o © © c o c o © 1 rlrlrHrHrlrlrlrlrlTHrl j
P» CO CO CM CM p-CO CO P-CO JO 1 O O r l r t H r l r t r l r l H r l I © C O © © © C 0 © © © C 0 © 1 r l H H r l r l H r l r l H H r l j
CM CO CO JO IO OJ CM n O CM CO 1 CO CO CO © C O CO tf tf tf tf CO 1 COCOCO©CDCDCDCD©COCO 1 rtHrlrlrlrlrlrlrtHrl 1
CO O CM CM CM r> CO CO JO 1 rl CM CM CM CM CM CM CM CM 1 cococococococococo 1 r l r l r H H r l H r l r l r t 1
© 00 CM CM CM JO 00 P-JO 1 O O TH rl rl rl rl TH T-H I © CD © CO CO CO CO CD CO I rlrlrtrtrtrlrlrlrt I
tf tf CO P-t> CM JO CO rH | rHrlrlrlrlCMCMCMCM 1 © C O C O © © © © C O © 1 rlrlrlrlrlrtrHrlrl I
CO rt P- p» P- JO CO I tf tf tf tf tf tf tf ) CD CD CO CO CO CD CO 1 ^ 1 T-H THJ ^H] -J-1 T"*H ^"1 I
tf CO tH CO CM rl CM 1 CM CM CO CO CO CO CO 1 CO CO CD CO CO CO CO 1 rH rH rt rl rH rl rl f
Cft © tf tf CO CD P- 1 rl CM CM CM CM CM CM I CO CO © CO © CD © 1 rl rl rl rl rl H rl 1
lO CO JO tf tf ' OJ OJ OJ OJ OJ 1 lOnO JO JO lO 1 r-H rl rl rH rl 1
© OJCM CO CM 1 CM rl CM CM CM ' CO © CO CO CD 1 rlHrlrlrl I
r> co tf tf co i rl rl CM CM CM 1 CO CO «D CO CO I rl rl rH T-H rl J
JO CO JO | rH T-i rl 1 © ©CO J rlrlrl '
f> COCM [ 1 rl rl CM 1 1 co co co | I iH rl rl
i CO co© ! | HHCVJ ' 1 © CO© j T*l * -l ,f*f *
1 00 | i o i co 1 rt
1 © { 1 CM 1 CO I rl "
1 iO I 1 CM 1 <o 1 rl !
( H t f P O ' J ' H C Q l O O l O O 1 I rl rl CM CM tf © P* © '

Appendix II AII3
C/3
I ift
P 13
a • T H
O 13 P tfi o cs T-H
I
U <•£
o d <-H tH
49 bfl p
•c p
o bO P
•c P TJ TJ r ^
P 00
cd
tn 13
P
n > bO
•53
I .rH
o 13 PH
CO P-cn l-H 13
CM I 1 1 O I © I
I rl 1 I I © I © I
I © I I I O 1 CD I
I CM I I I O I © I
I I
I O I CD I
p-COOJOJTHrlCOCM©JOiO O O O O H r l r l H r l r l H p»p-p-p-p*p»p-p-p-r""Pv
H r l r l r l H r l r l H H r l r l CMrltftfP-P-O©tHO0J CMCMCMCMCMCMCOCMCOCOCM C^.i>f>c-.i>p-P-P-P-P-P-rlrlrlrHHrHrlrlrlrlH OOOJCOCMJOtfP-tfOO cocotftftftftftftf p-p-p-r^c^c^p-p-t*-rHrlrinrlrliHrlrl 0J©iHOCMO©CMtf p - P - C 0 0 0 © © C O C O © tO(QtOCO<Q<Q<OtO<£i rlrlrlrlrinrlrlrl
O©tfCOP-©C0JOP-C^P-P-P-P-P*^^-^" P-p-P»P-IP-P,-P~^~Cs'
CO I CO CM
CM I CO CM
rH 3 I »&. CO
2 © C M 22 CM CO M rl I O 1 tf W O t H CO © CM
. 1 O tf rl rl
I tf
n
rl rl CO CM JO CO tf JO JO IO lO iO lO lO P» P- P» P- P- P- P* rH rl rl rl rH rl rl OJ OJ CM CM tf CM tf r-H rl CM CM CM CM CM P- P- P- P- P- P- P"
I OJ CD CM CM tf tf CO
t OJCft © O © O o I CO CO P- P* P* P- P" 1 rl rl rl rl rt rl rl I CO CO O ©CM I OJ OJ O O O I CO CO P- P-P" I rl rl rt rH rl
CO I p-
0J OJ CO "CO p» p-
O OJ tf CO p-p*
CM CM CO P- P-C-p- p» p* rl n rl rl T-H CO tf tf tf p- P~C~
CM 1 P-
I
COP-JO JO p-p-rl rl COCO lO JO P-C^
05 JO P-
P-JO P-
CO !
CM CM JO CO CO CO COCO CO
O p* p» T-H
CM ) T-i I I tf
I p -I rl
1 I
w 23 >* « H < D H P O ^
CM iO P» tH
tfP-OtftHCO^O^DO rHrHCMCMtf CO C- ©

Appendix II A H 3
cn i
o ON
cs I
o ON
I
O ON
cn i
O NO
i
O NO
O NO
cn i
oo cs
cs 1
oo cs
I
tf
cn i
cs p-
en
cS
O
z l-H PH
X U
CS O CS\ Ui T-H ON O cn cn cs cs cs T-H o NO NO NO NO NO VO VO
P- tf cn O P- T-H ON tf tf tf tf cn cn T-H NO NO NO NO VO VO VO
Ov P- P- VO T-H O rH cn cn cn cn cn cS O vo vo vo vo vo vo vo
T-H oo p- ui ov T-H tf cn cn cn cS in NO NO NO vo vo vo
in cs T-H t- o ON cn cn cn cS cs O \0 \o \o \o \o io
cn T-H o P» cS P-m in intf tf vo NO VO VO VO VO VO
CS ON ON P~ tf r-. vO NO NO NO NO NO NO NO NO
p- cn cn ON P~ in in in tf tf NO NO NO NO NO
H O O P C O in tf tf tf cn NO NO NO NO NO
ON NO in cs m in in in NO NO NO NO
NO cn cs oo cn cn cn cS vo NO NO vo
V O I N O P m in m tf NO NO NO NO
CS ON P; m tf tf VO VO VO
VO CS T-I in in in VO vo VO
o vo in tf cn cn vo vo vo
vo NO in
cs
in
oo tf in
tf r~- tf oo o O T H M V O O V

Appendix II A H 3
tn
a cd
fe co
P
§ .rH
o 13 PH 00 CS T 1
ON T-H I
u o d
bO
P
•c P o bfl
p •c p T3 TJ 2-T P oo cd 03
oo 13
P 13 > rP bo .TH
13 P
8 •TH
o 13 PH
CO ON
cn
K <
a
1
CO I l i O I 0J I
I CM I 1 ! O I Cft I
I 1 1
OJOJOOtfCMCMOCMCMCM cocotftftftftftftftftf CDCOCOCOCOCOCOCDCDCOCO
IH
o w OH
©
I
o © !
1 CO I I I O 1 © I
I CM I I I O I co l
I rH I I I O I CO I
I CO I I I CO I CM I
I CM I I t 00 I CM
3TH <* I CM CO , n CM OJ CO
1
COtfiOJOOJOJCftP-P-P-Pj-
O O O O O O O O O O O CDCOCOCO©CO©©©<DCD r l r l r l r l r l r l H r l H r l H
CDC^COCOCMCMtftHiHrlrt CMCSCMCMCOCOCO©COCOCO C0COCOCOCOCDC0COC0C0C0 rlrlrlrlrlrtrlrlrlrlrl tftfCDCO©OJTHOJOJ COCOCOCOtfCOtfCOCO C0C0C0CQ©C0C0COC0 iHrlrinrliHrlrtrl OOOJOOiOCOlOtfCO
05 0 ) 0 0 0 0 0 0 0 JOJO©CO©COCOCOCO rliHrinrlrlrlrHiH OOiHOCOrHCMCO© tftftftftftftftftf cocococo©cocococo r t r l r l r t r t r H r l r l i H
I P P O J C O
I © o o o I coco co co | rt rl rl rl I I p>- CO CO P-I CO CO 00 00 I JO JO JO iO
l rl rl rl rl I I tf tf JO JO
I o © o o I CO CO CO CO I rlrlrlrl
CO CO tf rl rl rl CO CO CO
CM r-H CM OJ OJ OJ JO JO JO rl rl rl
lO JO JO
© O O CD CO ©
o
tf rH
CM I tf
I tf
CO I p-
CM 1 P-
I P»
O CO rH rH CO CM CO CO CO CD CO CO
CM © ©
tf CO P~ P-CM CM CM CM CO CO CD CO rH rt rl rl
COlOPP
oo oo CD CO CO CD Hrlrlrl rH O TH CO CO CO CD CO CD CO JO CO CM CM CM CD CO CO
OJ P- OJ CO CO CO CD CO CO
CM co
CO
o CO
CO I
CM I
© tf CO
n I I I
tf CO
co
rH I rH
o CM
co
© 2 P4 r-H
D H O
*-> I CO 1 >* I < I © I
rH tf P- O tf TH CO JO O JO rl rl CM CM tf © P* ©

Appendix II A H 3 - 10
00
a cd fe oo P 13
a •l-H
o 13 P oo
VO CS T 1
I
U in tX
bO P
•c P
o bfl P •c P T3 T3 JH
p oo cd 13
OO
13
13 > -J—»
-c bO
•T-H
13 P 13 O 13 P CO
cn
H < 13 X> cd
E'
en i
o ON
CS I
O ON
O Ov
cn I
o NO
cs I
o vo
o NO
en i
00 cs
cs i
oo cs
I
tf
en
cs I
p-
cn
cs i
p-NO NO
OO NO VO
cn in NO
o p-NO
NO in NO
p~ tf NO
P~ VO VO
NO in NO
NO NO VO
en NO NO
oo tf NO
P-NO VO
cn T-H N O V O
vo vo
P O O O in cn ON vo vo m
tf cn ON vo oo NO vo j in tf cs NO NO ! NO NO NO
p-tf tf tf NO NO
in en NO NO NOVO
in cs tf tf NO NO
ONtf cn en NO NO
VOP-P-en c n o vo V O N O
cn p-in en vo NO
in in c s o NO NO
in o cs en VO NO
T-H ON in NO in in NO NO NO
o in T-H m tf tf NO NO NO
CS ON NO NO in in NO NO NO
in ov m tf vo NO
O P~ tf en VO NO
tf cs VO NO VONO
O P-P- NO VO NO
0O NO NO NO VO NO
NO cn in in vo vo
CS m NO
Ov NO NO
m NO NO
C S p - O v t f O O O O O T—i cs cn NO ON

Appendix II AB3 - 11
cn i
o CTJ (N I O CTJ
I O 03
CO I
o to
<M I
o CD
I
o CD CO I
00 IN
CN) I
00 CNI
2 W H
o w PH
co to
LO I - 00
CD CNI rH I CO O i &S Tf
C- CNI
I Tt"
I Tf
CO I
og
t-
co
CM
a H
w cn
p- C D c O C O T f T f C O C N l C M I M O t - o c o o o o o o o o o o o o o o o o o C O C O C D C O C O C O C O C O C D C O C O
ooc-cDiocjiCDcnc^-cnaicD L O m c O C O C O C O C O C O C O C O C O C O C O C O C O C O C D C D C O C D C O C O
n o o o j N n c v o i o O T * l O l O C O m c O C D C D l O C D C O L O CO CD CD COCO CD CD CO CD CD CD
COi-HtT-t-T-HrHoOCNlCO L--t--p-t>-OOOOCOO0OO CDCOCDCDCOCDCOCDCD
C O O O l O T f C D P - c D t O P -CDCOC--P-t— C-C-P-L— CDCDCDCDCOCDCDCOCD
CDlOPl'NlOf-lfllOt--C-t-00CO00C00OC000 (DCDCOCOCDCOCOCOCO
D O
EH Q
CD P- Tf CO CD CO CD io m CO CO CD CD CD CO CD CO CO CO CD CO
io co CM ca c~ in co t- C- CO 00 CO 00 00 CO CD CO CD CO CD CO
cn oo LO io o o o CD CD t> t- 00 CO CO CD CD CD CD CO CO CD
cs oo in in in P- CD I— t> t~ CO CD CO CD CD
CO Tf CO CO 00 CD CO CD CD CD CD CD CO CD CD
IO CO CNI rH CM CO CO p- t— t~ CO CO CD CO CD
C73 CO CO CO CO CO CO CD CO
CO P- O IO LO CD CO CO CO
[>- Tf O P- t- 00 CD CO CD
m CD CD
03
m co
t-co
T-H Tf f- o Tf TH co io o m rH rH CM CM Tf CD e' en

/_"N 00
a cd fe
!Z> P 13 a
•TH
O 13 CH OO £ •t£ o as r-H 1
u ^ in tX fa & bo p
•c P o bO P
"S P T3 TJ 13
13 cX)
cd ri
a 00 13 P 13 > 4-J
bO •TH
13
£ P 13 P 'cj 13 PH CO CS T-H
en t—H t-H < <o
cd H
CO 1
o OJ
CM
1 O OJ
rl 1 O OJ
CO 1
o © CM 1
o CO
rH
I
o CO
CO I CD CM
CM ! CO CM
rl 1
3 OO 2 « N
w o 22 • co M OJ 1 O rH tf W i_iH P H O © &<? CM
JO 1 • tf
p*. rH
rl 1 tf rl
CO 1 P-
CM 1 1
P»
rl 1 1
P-
CO 1 I
rl
CM 1 rH
rl 1 1
rH
! © -» 1 2 W CO 1 M 22 >* 1 K w < 1 D H Q O w
Appendix II
CMCOCOCOCOCOiOt>p-p»tf CMCMCMCMCMCMCMCMCMCMCM COCOCOCOC0C0©COCOCOC0
JO lO O rl rl O O CM CM CM 00 TH rl CM CM CM CM CM CM CM CM rl | C0CD©C0COC0CDCO©COCO
0J OJ CM CO COCOCO tf tf tf O i CMrHCMCMCMCMCMCMCMCMCM 1 COCOCDCOCOCOCOCOCDCOCO 1 T-HrlrtrtrirlrlrlrlrHrl 1
00 CO OJ O CM CM rH CO CO 1 CM CM CM CO CO CO CO CO CO 1 CO CD CO CD CO CD CO CO CO 1
CO CO CO CO CO 00 CO OJ OJ 1 CMCMCMCMCMCMCMCMCM 1 COCOCOCOCOCOCOCOCO 1
OJ O CO CO tf tf CO JO JO 1 OrHrHrHrlrlrlrHrl | CO CD CO CO CO CO CO CO CO 1 rlrlrlrlrlrlrlrlrl 1
OJ O CM CO CO CO CM 1 JO CO CO CO CO CO CD 1 CO CO CD CO CO CO CO 1 rl rl rl rl rl rl rH 1
CO O) CM CM CO CM rl I CO CO tf tf tf tf tf 1 CO CO CO CO CD © CO 1 rl rl rl rl rl rl rl 1
JO CO 0J OJ © OJ CO lO JO JO JO CO JO JO 1 CO CO CO CO CD CO CD 1
© rl tf IO JO 1 JO JO lO JO JO CO COCO CO CO 1 r l H r l H r t
CO CO P« P* P* 1 * j* J* xj* XI*
CO CD CO CO © rl rH rl r-H rl
O CO tf JO JO ^* Tf XP Xr ^ CO CO CO CO CO 1 rl rl rl rl rl
OJ OJCM CM CM CO CO CO CD rH rH rl
JO CO OJ tf tf tf CO CO CD rl rl rl
CM COP-JO JO IO CD CO CD rl rl rl
CM CO CO rl
CM tf CO rl
CO IO CO rl
r t t f P - O t f r l C O l D O l O O rlrtCMCMtfCOI>OJ
AH3- 12

Appendix II AII3 - 13
oo
a cd fe oo
P 13
a .rH
o 13
P oo
<•£ O CS T 1
I
u in LH
<0 <+H
bO
P P C3 bO
P •c TJ 13 t-H
P oo cd 13 00 13
P Id > 4—1
xi bfl • H 13
g O 13
P CO cn cn
< 13
cd
H
cn i
o ON
cs I
o ON
o ON
cn i
o NO
cs I
o NO
o
cn I
oo
CS t
00 PI
z^3 SCMCT-, l-H-T-H ,
m vj T-H
cop cs in Ti
en p-
cs I
p-
en
cs I
NO o NO m NO o vo ' NO in tf T-H ON in i m in in m tf
cs T-H in NO cn p-•n ' tf en en ON in vo NO NO NO in in
oo cn p- cs tf ON vo T-H tf en en cs ON NO vo NO NO vo vo in in
8 NO
tf tf NO
in tf NO
vo m NO
oo oo NO
O N in O T-H
m in in en
p- ON CS oo tf en in en NO NO NO NO
o NO o in vo in in en
en o in in in tf NO NO NO
T-H xn en oo p- vo NO NO NO
O N in NO T-H oo oo tf cn cn tf in NO vo N O V O
tf vo NO
00
o NO
tf in in tf NO NO
cn o o o vo NO
oo en p- T-H
O p- NO NO vo vo vo vo
T - H O P-tf tf cn vo vo vo
p- tf
tf ! "l vo ! vo
enooo in in tf vO vO VO
NO ON
NO
P-in VO
NO
en vo
m p~ tf oo O O T—I CS NO ON

Appendix II AII4 - 1
Table AII4.1 Results of compressive strength testing (15.6%C-14.72%W, mix 1).
SPECIMEN
15.6X-1-1
15.6Z-1-2
15.6%-l-3
AVERAGE
i5.6y-?-i
15.6y.-7-2
15.6Z-7-3
AVERAGE
15.6^-14-1
15.6^-14-2
15.6^-14-3
AVERAGE
15.6%-28-i
15.6%-28-2
15.6^-28-3
AVERAGE
15.6%-6G-1
15. 6?<-60-2
15.6%-60-3
AVERAGE
15.6%-90-l
15.6%-90-2
15.6%-90-3
AVERAGE
MAX. LOAD
CKN)
20.720
20.000
20.000
20.240
47.400
46.800
48.500
47.567
53.000
55.500
55.000
54.500
57.500
61.900
64.800
61.400
78.500
73.600
75.400
75.830
81.000
69.600*
86.200
83.600
MAX. STRESS
CMPa)
2.638
2.546
2.583
2.58P
5.733
5.688
5.901
5.774
6.417
6.750
6.691
6.620
7.f56
7.546
7.915
7.539
9.607
9.007
9.361
9.325
9.971
8.585*
10.593
10.282.
E
CGPa>
0.403
0.369
0.38,5
1.750
0.947
1.685
1.461
1.104
1.137
1.051
1.097
0.841
1.067
1.110
1.006
1.916
1.622
1.282
1.607
1.658
1.162
1.658
V
0.358
0.250
0.304
0.111
0.053
0.077
0.080
0.024
0.027
0.015
0.022
0.025
0.021
0.017
0.021
0.109
0.072
0.110
0.097
0.106
0.015
0.106
LOAD RATE
C mux's)
0.0015
0.0015
0.0015
0.0018
0.0015
0.0015
0.0015
0.0015
0.0015
0.0015
0.0015
0.0015
0.0015
0.0015
0.0015
0.0015
0.0015
0,0015
0.0015
0.0015
0.0015
0.0015
0.0015
0.0015
* Not included in the average.

Appendix II AII4 - 2
Table AII4.2 Specimen experimental data (15.6%C-14.72%W, mix 1).
SPECIMEN
15.6?i-l-l 15.6X-1-2 15.6K-1-3 15.6%-7-l 15.6%-7-2 15.6?i-7-3' 15.6^-14-1 15.6^-14-2 15.6^-14-3 15.6^-28-1 15.6^-28-2 15.6%-28-3 15.6X-60-1 15.6JS-60-2 15.6!*-60-3 15.6^-90-1 15.6^-90-2 15.6X-90-3
Pvel
Ct/m3} 1.958 1.964 1.969 1.960 1.950 1.926 1.936 1.958 1.940 1.876 1.935 1.908 1.943 1.950 1.968 1.957 1.971 1.935
Pdry
1.653 1.657 1.662 1.669 1.658 1.638 1.655 1.672 1.651 1.621 1.674 1.647 1.721 1.723 1. 739 1.667 1.703 1.674
WATER CONTENT
c-*o 15.60 15.60 15.60 14.87 15.00 14.94 14.49 14.63 14.83 13.61 13.50 13.64 11.40 11.63 11.62 14.82 13.59 13.50
TEMP.
C°C )
19.5 19.0 19.5 18.0 17.8 17.8 20.0 20.1 21.8
DURATION
Cmins)
13.7 12.8
' 12.7 20.0 16.0 16.0 17.0 16.0 15.0 58.0 62.0 63.0 43.3 50.0 53.0

Appendix II A H 4 - 3
Table ATI4.3 Results of compressive strength testing (12.5%C-13.0%W, mix 2).
SPECIMEN
12.5?i-1.5H
12.5^-2.OH
12.5%~2.5H
12.5%~4.25H
12.5*-4.5H
12.5^-1-1
12.5%-l-2*
12.5^-1-3
AVERAGE
12.5^-7-1
12.55i-7-2
12.5?i-7-3
AVERAGE
12.5^-14-1
12.5^-14-2
12.5^-14-3
AVERAGE
12.55i-28-l
12.5^-28-2
12.5JJ-28-3
AVERAGE
12.5X-60-1
12.5^-60-2
12.5^-60-3
AVERAGE
12.5>S-90-i
12.55S-90-2
12.5*~90~3
AVERAGE
MAX. LOAD
CKN)
0. 642
1.188
2.100
8.000
9.920
41.700
33.000
43.000
42.520
76.800
73.900
68.840
73.180
87.500
86.000
88.000
87.167
89.600
82.150©
96.000©
8P.250
124.150
121.450
125.570
123.723
146.600
139.300
121.000
135.#33
MAX. STRESS
CMPa)
0.082
0.151
0.267
1.021
1.251
5.054
4.023
5.221
5.138
9.399
9.009
8.169
8.85P
10.666
10.422
10.748
10.612
10.859
9.975
11.680
10.838
15.046
14.805
15.367
IS.073
17.940
17.048
14.808
16.3PP
E
CGPa>
0.008
0.088
0.905
0.588
0.641
0.863
0.726
1.509
2.716
1.349
1.858
2.129
2.123
1.642
1.P05
4.524
6.460
2.345
4.443
2.430
3.171
3.017
2.873
2.757
2.948
2.836
2.847
V
0.193
0.077
0.172
0.004
0.023
0.060
0.032
0.059
0.049
0.023
0.044
0.231
0.085
0.047
0.121
0.173
0.243
0.025
0.147
0.098
0.144
0.055
O.OPP
0.070
0.100
0.100
0.0P0
LOAD RATE
< mra/s)
0.0125
0.0750
0.0125
0.0125
0.0015
0.0015
0.0015
0.0015
0.0015
0.0015
0.0015
0.0015
0.0015
0.0015
0.0015
0.0015
0.0015
0.0015
. 0.0015
0.0015
0.0015
0.0015
0.0015
* Not included in the average. © Specimen subjected to re-loading.

Appendix II AII4 - 4
Table AII4.4 Specimen experimental data (12.5%C-13.0%W, mix 2).
SPECIMEN
12.5X-1.5H
12.5^-2.OH
12. 554-2. 5H
12.554-4.25H
12.554-4.5H
12. 554-1-1
12.554-1-2
12.554-1-3
12.554-7-1
12.5/4-7-2
12.554-7-3
12.554-14-1'
12.554-14-2
12.554-14-3
12.554-28-1
12.554-28-2
12.554-28-3
12.554-60-1
12.554-60-2
12.554-60-3
12.554-90-1
12.554-90-2
12.554-90-3
Pvel
Ct/in3)
2.034
2.032
2.002
2.015
1.995
2.011
1.907
1.991
2.017
1.983
1.994
2.004
2.003
1.997
1.931
1.946
1.981
1.978
1.925
1.918
1,958
1.953
1,956
PA dr y
Ct/m3)
1.789
1.772
1.800
1.705
1.780
1.817
1.796
1.808
1. 820
1.819
1.817
1.761
1.767
1. 808
1.841
1.794
1.775
1.837
1.823
1.822
HATER CONTENT
<L*0
11.22
11.19
10.47
10.61
10.61
9.70
9.77
9.76
9.20
9.20
9.00
8.79
9.20
8.75
6.93©
6.84©
7.42©
6.20©
6.65©
6.85©
TEMP.
(°C)
15.0
16.3
16.3
18.5
19.0
19.0
18.5
18.8
19.3
22.0
22.5
22.5
26.0
25.5
25.5
DURATION
Crains)
16.8
9.0
8.3
9.0
18.0
20.0
14.0
15.0
15.3
14.3
15.6
20.0
16.5
19.Q
15.0
15.0
14.0
50.8
45.2
55.0
45.0
48.0
50.0
© Small portion only of specimen used in the determination of
water content. Hence low resultant value.
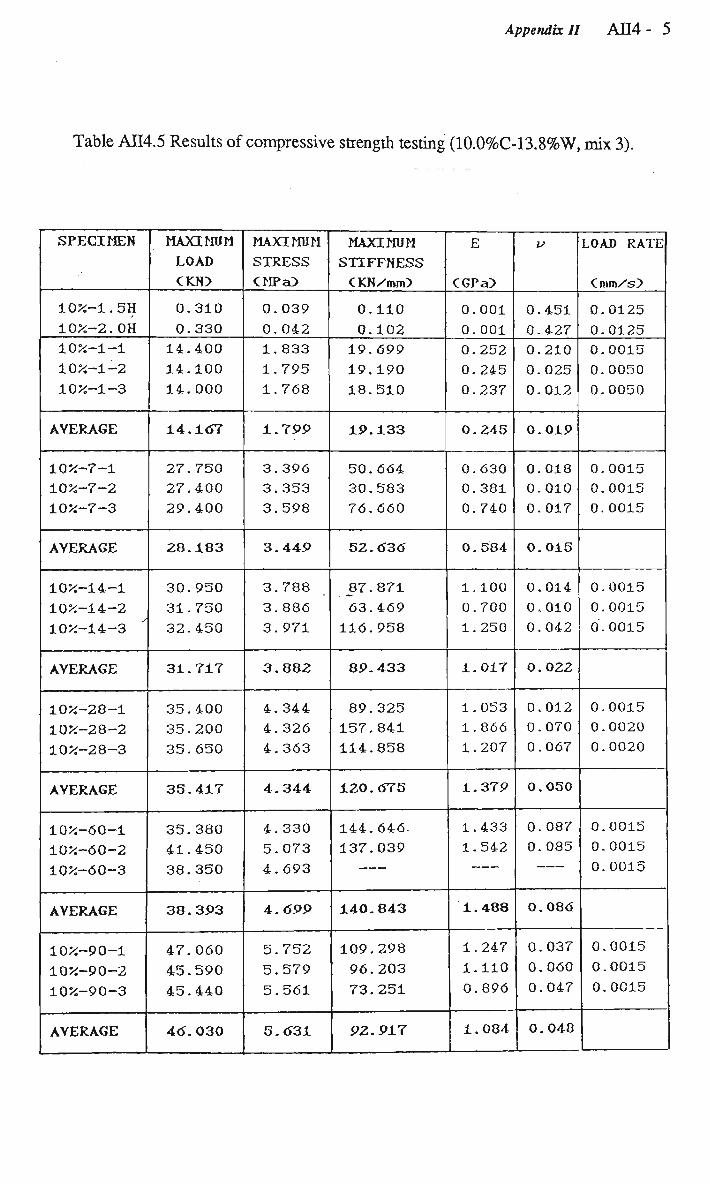
Appendix II AII4 - 5
Table AII4.5 Results of compressive strength testing (10.0%C-13.8%W, mix 3).
SPECIMEN
1054-1. 5H
1054-2. OH
1054-1-1
1054-1-2
1054-1-3
AVERAGE
1054-7-1
1054-7-2
1054-7-3
AVERAGE
1054-14-1
1054-14-2
1054-14-3
AVERAGE
1054-28-1
1054-28-2
1054-28-3
AVERAGE
1054-60-1
1054-60-2
1054-60-3
AVERAGE
1054-90-1
1054-90-2
1054-90-3
AVERAGE
MAXIMUM
LOAD
CKN>
0.310
0.330
14.400
14.100
14.000
14.16T
27.750
27.400
29.400
28.183
30.950
31.750
32.450
31.717
35.400
35.200
35.650
35.417
35.380
41.450
38.350
38.3P3
47.060
45.590
45.440
4<5. 030
MAXIMUM 1
STRESS
CMPa>
0.039
0.042
1.833
1.795
1.768
1.7PP
3.396
3.353
3.598
3.44P
3.788
3,886
3.971
3.882
4.344
4.326
4.363
4.344
4.330
5.073
4.693
4.6PP
5.752
5.579
5.561
S.tf3i
MAXIMUM
STIFFNESS
CKN/mm)
0.110
0.102
19.699
19.190
18.510
IP.133
50.664
30.583
76.660
52.636
87.871
63.469
116.958
8P.433
89.325
157.841
114.858
120. 6T5
144.646.
137.039
140.843
109.298
96.203
73.251
PZ. P17
E
CGPa>
0.001
0.001
0.252
0.245
0.237
0.245
0.630
0.381
0.740
0.584
1.100
0.700
1.250
1.017
1.053
1.866
1.207
1.37P
1.433
1.542
1.488
1.247
1.110
0.896
1.084
V
0.451
0.427
0.210
0.025
0.012
0.01P
0.018
0.010
0.017
0.015
0.014
0.010
0.042
0.022
0.012
0.070
0.067
0.050
0.087
0,085
0.086
0.037
0.060
0.047
0.048
LOAD RATE
Cmm/s)
0.0125
0.0125
0.0015
0.0050
0.0050
0.0015
0.0015
0.0015
0.0015
0.0015
0.0015
0.0015
0.0020
0.0020
0.0015
0.0015
0.0015
0.0015
0.0015
0.0015

Appendix II AII4 - 6
Table AII4.6 Specimen experimental data (10.0%C-13.8%W, mix 3).
SPECIMEN
1054-1. 5H
1054-2. OH
1054-1-1
1054-1-2
1054-1-3
1054-7-1
1054-7-2
1054-7-3 '
1054-14-1
1054-14-2
1054-14-3
1054-28-1
1054-28-2
1054-28-3
1054-60-1
1054-60-2
1054-60-3
1054-90-1
1054-90-2
1054-90-3
Ct/m3)
1.990
2.007
1.961
1.961
1.951
1.971
1.983
1.980
1.977
1.953
1.982
1. 967
1.975
1. 992
1.993
1.950
2.001
1.932
1.943
1.908
pdry
Ct/m3)
1.707
1.712
1.690
1.694
1.686
1.729
1.727
1.721
1.737
1.707
1.734
1.723
1.726
1.734
1.723
1.728
1.723
1.757
1.749
1.726
WATER CONTENT
C54>
14.2
14.7
13.8
13.6
13.6
12.3
12.9
13.1
12.12
12.59
12.49
12.43
12.61
12.94
13.54
11.38
13.91
9.07
10.00
9.56
TEMP.
19.0
19.5
19.5
18.5
20.0
20.0
20.0
20.0
20.5
17.5
17.8
17.8
22.0
22.0
25.0
22.0
22.0
21-5
DURATION
Cmins)
11.3
11.0
25.0
10.0
11.0
18.0
20.5
19.5
20.0
18.0
20.0
20.0
14.2
15.0
48.0
50.0
55.0
60.0
55.0
58.0

Appendix II AII4 - 7
Table AH4.7 Results of compressive strength testing (7.5%C-12.6%W, mix 4).
SPECIMEN
7. 554-1. 5H
7.554-2. OH
7.554-4.25H
7. 554-4. 5H
7. 554-5. OH
V.5J4-1-1 7.554-1-2
7.554-1-3
AVERAGE
V.b'k-7-1 7.554-7-2
7.554-7-3
AVERAGE
7.554-14-1'
7.554-14-2
7.554-14-3
AYERAGE
7.554-28-1
7.554-28-2
7.554-28-3
AVERAGE
7.554-60-1
7.554-60-2
7.554-60-3
AVERAGE
7.554-90-1
7.554-90-2
7.554-90-3
AVERAGE
MAXIMUM
LOAD
CKN)
0.300
0.330
1.300
1.460
1.470
13.180 13.250
13.500
13.310
23.600 22.120
21.000
22.240
24.750
25.130
25.400
25.0P3
28.600
28.000
27.000
27.870
31.200
34.400
34.370
33.320
38.000
36.500
39.600
38.033
MAXIMUM
STRESS
CMPa)
0.038
0.042
0,166
0.186
0.187
1-613 1.622
1.652
1.629
2.888 2.681
2.424
2.C64
3.029
3.045
3.078
3.152
3.500
3.365
3.272
3.37P
3.941
4.210
4.165
4.105
4.605
4.423
4.846
4.6-25
MAXIMUM
STIFFNESS
CKN/BUB)
0.106
0.098
0.263
0.363
0.404
13.509 16.824
16.181
15.505
36.20^ 27.091
. 41.722
35.007
50.834
35.784
56.775
47.582
92.396
30.156
35.152
52.568
104.241
68.006
50.399
74.215
71.281
80.572
63.452
Ti.. 168
E
CGPa}
0.001
0.001
0.003
0.004
0.005
U.168 0.210
0.201
0.1P3
0.436
0.302
0.410
0.383
0.629
0.392
0.655
0.55P
1.124
0.325
0.369
0.606
1.266
0.833
0.541
0.88O
0.842
0.973
0.788
0.877
0,413
0.576
0.287
0.402
0.281
0.046
0.028
0.045
O.03P
0X014 0.010
0.022
0.015
0.020-
0.020
0.070
0.031
0.054
0.006
0.014
0.024
0.072
0.053
0.016
0.047
0.056
0.044
0.052
0.051
LOAD
RATE
Cmm/t?)
0.0125
0.0200
0.0125
0.0125
0.0125
0.0015 0.0030
0.0030
u.UUlo 0.0030
0.0030
0.0015
0.0030
0.0030
0.0020
0.0020
0.0020
0.0015
0.0015
0.0015
0.0015
0.0015
0.0015

Appendix II AII4 - 8
Table AII4.8 Specimen experimental data (7.5%C-12.6%W, mix 4).
SPECIMEN
7. 554-1. 5H
7. 554-2. OH
7.554-4.25H
7. 554-4. 5H
7.554-5. OH
7.554-1-1
7.554-1-2
7.554-1-3
7.554-7-1 y
7.554-7-2
7.554-7-3
7.554-14-1
7,554-14-2
7.554-14-3
7.554-28-1
7.554-28-2
7.554-28-3
7.554-60-1
7.554-60-2
7.554-60-3
7.554-90-1
7.554-90-2
7.554-90-3
Pvel
Ct/m3}
2.029
2.043
1.990
2.026
2.022
2.000
2.000
1.994
2.003
1.989
1. 990
1.994
1.964
1.959
1.987
1.979
1. 968
1.975
1.925
1.951
1.900
1.944
1.917
Pdry
•Ct/m3)
1.737
1.753
1.711
1.738
1.741
1.738
1.735
1.731
1.747
1.732 _
1.735
1.754
1.733
1.728
1.749
1.749
1.735
1.751
1.748
1.762
1.737
1.800
1.777
WATER CONTENT
CX)
14.4
14.2
14.0
14.2
13.9
13.1
13.3
13.2
12.79
12.90
12.80
12.03
11.74
11.81
12.00
11.60
11.80
11.37
9.20©
9.70©
8.60©
7.40©
7.31©
TEMP
18.5
19.0
19.5
19.0
19.5
18.5
18.8
19.0
19.5
19.5
19.5
20.0
20.0
20.0
20.0
20-0
20.3
18.8
19.5
20.1
16.0
16.0
17.3
DURATION
(rains)
11.2
6.3
11.0
11.0
11.0
28.0.
14.3
15.0
. 23.0
14.0
15.0
18.0
13.0
13.0
16.0
20.0
21.0
66.0
88.0
72.0
60.0
63.0
53.0
© Small portion only of specimen used in the determination of Hater content. Hence low resultant value.
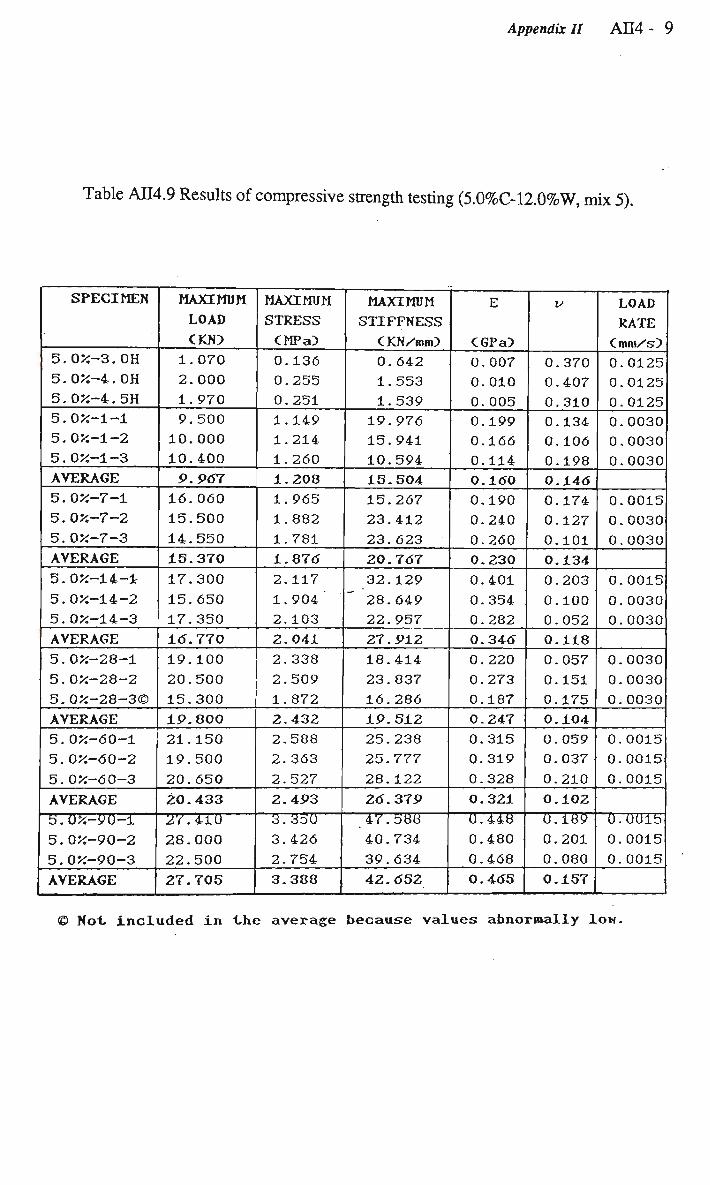
Appendix II A H 4 - 9
Table AII4.9 Results of compressive strength testing (5.0%C-12.0%W, mix 5).
SPECIMEN
5. 054-3. OH
5. 054-4. OH
5. 054-4. 5H
5.054-1-1
5.054-1-2
5.054-1-3
AVERAGE
5.054-7-1
5.054-7-2
5.054-7-3
AVERAGE
5.054-14-1
5.054-14-2
5.054-14-3
AVERAGE
5.054-28-1
5.054-28-2
5.054-28-3©
AVERAGE
5.054-60-1
5.054-60-2
5.054-60-3
AVERAGE
5.054-yO-l
5.054-90-2
5.054-90-3
AVERAGE
MAXIMUM
LOAD
CKN)
1.070
2.000
1.970
9.500
10.000
10.400
P. POT
16.060
15.500
14.550
15.370
17.300
15.650
17.350
id. 770
19.100
20.500
15.300
IP.800
21.150
19.500
20.650
20.433
2JV.4iU 28.000
22.500
27.705
MAXIMUM
STRESS
CMPa)
0.136
0.255
0.251
1.149
1.214
1.260
1.208
1.965
1.882
1.781
1.876
2.117
1.904'
2.103
2.041
2.338
2.509
1.872
2-432
2,588
2.363
2.527
2.4P3
3.350 3.426
2.754
3.388
MAXIMUM
STIFFNESS
CKN/mm)
0.642
1.553
1.539
19.976
15.941
10.594
15-504
15.267
23.412
23.623
20.767
32.129
28.649 22.957
27.P12
18.414
23.837
16.286
IP.512
25.238
25.777
28.122
Z6.37P
40.734
39.634
42.65Z
E
CGPa)
0.007
0.010
0.005
0.199 0.166
0.114 0.16O
0.190
0.240
0.260
0.230
0.401
0.354
0.282
0.346
0.220
0.273
0.187
0.247
0.315
0.319
0.328
0.321
0.448 0.480
0.468
0.465
V
0.370
0.407
0.310
0.134
0.106
0.198
0.146
0.174
0.127
0.101
0.134
0.203
0.100
0. 052
0.118
0.057
0.151
0.175
0.104
0.059
0. 037
0.210
0.102
0.189 0.201
0.080
0.157
LOAD
RATE
< ttwa/sy
0.0125
0.0125
0.0125
0.0030
0.0030
0.0030
0.0015
0.0030
0.0030
0.0015
0.0030
0.0030
0.0030
0.0030
0.0030
0.0015
0.0015
0.0015
0.001b 0.0015 0.0015
© Not included in the average because values abnormally low.

Appendix II AII4 - 10
Table ATI4.10 Specimen experimental data (5.0%C-12.0%W, mix 5). „ ^
SPECIMEN
5. 054-3. OH
5. 054-4. OH
5. 054-4. 5H
5.054-1-1
5.054-1-2
5.054-1-3
5.054-7-1
5.054-7-2
5.054-7-3
5.054-14-1 X
5.054-14-2
5.054-14-3
5.054-28-1
5.054-28-2
5.054-28-3
5.054-60-1
5.054-60-2
5.O54-6J0-3
5.054-90-1
5.054-90-2
5.054-90-3
Ct/m3)
2.040
2.042
2.048
1.946
1.972
2.007
1.996
1.992
1. 964
1.993
1.917
1.966
1.993
1.985
1.987
1.962
1.945
1.957
1.907
1.868
1.805
"dry
Ct/m3)
1.785 1.787
1.790
1.723
1.746
1.775
1.778
1. 763
1.748
1.788"
1.710
1.768
1.781
1.792
1.758
1.788
1.739
1.982
1.793
1.780
1.702
WATER CONTENT
C54D
12.51
12.51
12.59
11.44
11.47
11.56
10.92
11.51
11.02
10.29
10-80
10.07
10.60
9.71
11.54
8.88©
10.56
8.97©
6-00©
4. 70©
5.75©
TEMP
C C)
21.0
20.5
20.5
19.5
19.3
19.5
18.5
18.8
19.0
18.8
19.5
19.0
19.0
18.5
19.0
18.5
19.5
20.8
21.0
22.3
22.8
DURATION
<mins>
10.2
9.0
9.4
17.0
16.0
17.0
23.0
15.0
15.0
29.0
15.1
16.5
28.0
30.0
31.0
68.0
58.0
• 66.0
88.0
83.0
76.0
© Small portion only of specimen used in the determination of
water content. Hence low resultant value-

Appendix II A H 5 - 1
Table AII5.1 Post failure modulus and residual strength results of
C C W R specimens (15.6%C-14.72%W, mix 1).
Specimen
15.6% - 7 - 1 2 3
15.6% - 14 - 1 2 3
15.6% - 28 - 1 x 2
3
15.6% - 60 - 1
2
3
15.6% - 90 - 1
2+
3
% of U.C.S.
84%* 90%* 93%*
85%* 90%* 84%*
90%* 85%* 73%*
61% 35% 22% " " 65% 20% 60% 13%
50% 22% 14% 26% 26%
Ef (GPa)
0.244 0.200 0.221
0.206 0.232 0.186
0.195 0.305 0.419
0.338 0.186 0.104 0.346 0.046 0.417 0.045
0.305 0.365 0.077 0.128 0.303
Residual Strength
2.142
1.836
1.24
1.165
1.703 1.571
* Rate of loading was increased after ultimate compressive strength has been obtained.
+ Value anomalously low

Appendix II AII5 - 2
Table AII5.2 Post failure modulus and residual strength results of
C C W R specimens (12.5%C-13.0%W, mix 2).
Specimen
12.5% - 1 - 1 2 3
12.5% - 7 - 1 2 3
12". 5% - 14 - 1 2 3
12.5% - 28 - 1 2 3
12.5% - 60 - 1 2 3
12.5% - 90 - 1 2 3
% of U.C.S.
84% 90%
88% 85% 80%
60% 58% 71%
56% ' ' 55% 40%
10% 10% 16%
8% 18% 13%
Ef (MPa)
205* 208.4*
450* 492* 464*
1554.0* 1934.2* 687.4*
1782* 6839* 1254*
137.5 87.4 135.0
66,53 272.15 486.94
Residual Strength (MPa)
1.212 1.341 1.224
1.591 1.657 1.657
Rate of loading was increased after ultimate compressive strength has been obtained.

Appendix II AB.5 - 3
Table AII5.3 Post failure modulus and residual strength results of
C C W R specimens (10.0%C-13.8%W, mix 3).
Specimen
10% - 7 - 1 2 3
10% - 14 - 1 2 3
10% - 28 - 1 2 3
10% - 60 - 1 2 3
10% - 90 - 1 2 3
% of U.C.S.
89% 89% 86%
88% 81% 84%
70% 77% 72%
35% 39% 36%
42% 33% 33%
Ef
(MPa)
79.05* 77.94* 95.51*
115.97* 116.21 115.97*
220.73* 239.71 229.49*
114.57 149.37 130.02
182.49 169.91 186.14
Residual Strength
(MPa)
0.612 0.979 0.612
0.428 • 0.428 0.490
* Rate of loading was increased after ultimate compressive strength has been obtained.

Appendix II AII5 - 4
Table AII5.4 Post failure modulus and residual strength results of
C C W R specimens (7.5%C-12.6%W, mix 4).
Specimen
7.554-1-1
2
3
7.5%-7-l
7.554-14-1
2
3
7.554-28-1
** 2
3
7,554-60-1
2
3
7.554-90-1
2
3
V, of w.c.s.
9154®
9354®
8954®
9354®
73%®
8154®
7354®
7354®
7654®
7654®
4354
1354
1554
2854
4054
15%
CMPaD
13.55
14.04
15.05
54.81
84.02
74.51
12.88
78.02
91.81
90.05
80.90
27.78
27.00
84.99
99.58
130.75
Residual
Strength
(MPa)
—
—
—
—
0.17
0.19
0.42
0.30
0.31
® Rate of loading was increased after ultimate compressive
strength has been obtained.

Appendix II AII5 - 5
Table AII5.5 Post failure modulus and residual strength results of
C C W R specimens (5.0%C-12.0%W, mix 5).
Specimen
554-14-1
2
3
554-28-1
2
3 .*
554-60-1
2
3
554-90-1
2
3
54 of U.C.S.
6954®
7254®
7154®
7554®
. 7754®
7654®
26.54 _
3954
2854
2654
2954
8954
CMPaO
57.21
45.74
56.32
50.90
51.91
37.90
24.97
40.50
42.59
54.28
71.91
58.86
Residual
Strength
Off»a>
—
—
0-22
0.15
0.43
0.25
® Rate of loading was increased after ultimate compressive
strength has been obtained.

Appendix II A Q 6 - 1
vx
Cfi
X
< >
H I—I
U O >
Q
D O
3000
2750-
2500-
2250"
2000
1750
1500 —r—r-
10
2 = 2088.2016 *x*0.0427 R = 0.93
y = 2012.8304 *x^.0342 R = 0.95
y = 1745.4116 * x*0.0376 R = 0.97 I • ' I — 1 — i — i — i — i — i — J — i — i — 1 — > — ' — I — * — • I r
20 30 40 50 60 70
n MIX1
• MIX 2
n MIX 3
« MIX 4
• MIX 5
80 90 100
C U R I N G T I M E (DAYS)
Figure AH6.1 Sonic velocity-curing time graph of C C W R specimens for
mixes 1 through 5.

Appendix II AII6 - 2
H > — i
U O w >
u z o
3250
3000 -
2000 -
1750
y = 2674.9 *xA3.8743e-2 y = 2129.1 *xA6.1134e-2 y = 2026.8 *xA6.7100e-2 y = 2460.9 *xA5.70l0e-2 y = 2159.0 *x*7.5131e-2 y = 2192.1 * xA6.0946e-2 y = 1983.0 *xA5.9173e-2 y = 1914.7 * xA7.2376e-2
RA2= R*2 = R*2 = R*2 = R*2 = R*2 = R*2 = R*2
0.933 0.920 0.902 0.960
= 0.936 = 0.965 = 0.870 = 0.882
• D
0 •
•
A
A
MK6 MK7 MEX8 MK9 MIX 10 MKll MIX 12 MIX 13
T T T T-r~ 1—f T" 10 20 30--40 50 60 70 80 90 100
CURING TIME (DAYS)
Figure AII6.2 Sonic velocity-curing time graph of C C W R specimens for
mixes 6 through 13.

Appendix II A H 6 - 3
co
J* H
u o > Q
O tZJ
JUUU -
2750 -
2500 -
2250-
2000 -
1750 -
1500 -
a o i
•
- ^
0 • an * o •
1 i i - r • « i
o
' i ' i
o «
n MKi • MIX2 D MEX3 o MK4 • MIX5
i i i i i | i •
0 2 4 6 8 10 12 14 16 18 20
STRENGTH (MPa)
Figure AH6.3 Sonic velocity-strength graph of CCWR specimens for mixes 1
through 5.
m
H > — i
U
o >
l-H
o CZJ
JiiOU -
3000 -
2750-
2500 -
2250-
2000 -
1750 -
1500-
n
A* B
A A •
•
O
A*
O B
o • D 0
° o- Q
n • • n m o
* • 0
a • • a o
j — i — i — i — i — r - -i i | i i i i
D •
a 9
•
•
A
A
EI
MK6 MIX7 MK8 MK9 MIX 10 MKll MK12 MK13
— i , r — r - -t • •
0.0 2.5 5.0 7.5 10.0 12.5 15.0
S T R E N G T H (MPa)
Figure AH6.4 Sonic velocity-strength graph of C C W R specimens for mixes 6
through 13.

Appendix II AII6 - 4
<*>
U
o p >
Q P
o tZJ
3000
2900
2800
2700--
2600-
2500
2400
2300
2200
2100
2000
•
•
-
"""""—L
1
< y
i
:
i
= 1582.2752
;
;
1
By
" jr a
X 3 !
i — ' — X—r -X—i—
i
i •
244 R !
/in
I i
? = 1.00
W w w —
1
vx^y
" " • *•'
r — t
0 MKI
5 6 7 8 9 10 11 12
STRENGTH (MPa)
Figure AII6.5 Sonic velocity-strength graph of C C W R specimens (mix 1).
jti
r-i
u o w >
P
o tZJ
3000
2900
2800
2700 ""
2600
2500
2400
2300
i y =
••
— i —
1779.415
•
;
5 1 * x^O.lS
i
:
64 R = C
B
f
•
).98
1 '
s
^*"
:
•
0
MK2
8 10 12 14
STRENGTH (MPa)
16 18
Figure AII6.6 Sonic velocity-strength graph of C C W R specimens (mix 2).

Appendix II A H 6 - 5
y = 1169.0627 + 664.8273x - 118.7912x*2 + 7.4571xA3 R = 0.99
2500
I* fc
CJ
o p
w >
X X
o tfi
2450-
2400-
2350-'
2300-
1.0 1.5 2.0 2.5 3.0 3.5 4.0 4.5 5.0 5.5 6.0 STRENGTH (MPa)
Figure AII6.7 Sonic velocity-strength graph of CCWR specimens (mix 3).
y = - 70.6704 + 2382.6012x - 926.677xA2 + 159.7606x^3 - 10.0684xM R = 1.00
2400
tn
fc
u o p p >
X
z p
o C/3
0.5 1.0 1.5 2.0 2.5 3.0 3.5 4.0 4.5
STRENGTH (MPa)
Figure AH6.8 Sonic velocity-strength graph of C C W R specimens (mix 4).

Appendix II AD.6 - 6
J»
2100
2050
2000
1950
V O P P > X
z, X
o tfi
— i 1 1 j r y = 1307.7705 + 432.l804x - 63.3008xA2 R = 0.98
1900
1850
1800"
1750-
1700
S T R E N G T H (MPa)
Figure AII6,9Sonic velocity-strength graph of C C W R specimens (mix 5).
tn
H
o o p p > r-i
o
3200
3100
3000
2900
2800
2700
2600
y = -1530.9 + 1010.9x - 67.866xA2 + 13640xA3 RA2 = 0.926
S T R E N G T H (MPa)
Figure AII6.10 Sonic velocity-strength graph of C C W R specimens (mix 6).

Appendix II AII6 - 7
cc
H i — i
U O P P >
u I — I
z; o C/3
y = 1281.6 + 741.41x - 135.22xA2 + 8.7490xA3 RA2 = 0.981
2800
1.0 1.5 2.0 2.5 3.0 3.5 4.0 4.5 5.0 5.5 6.0
STRENGTH (MPa)
Figure AII6.11 Sonic velocity-strength graph of CCWR specimens (mix 7).
_W3
H r-i
V
o p p >
u z. o CZ3
2800
2700
2600
2500
2400 -
2300
2200
2100 -
2000-
1900
1800
-
-
-
-
•
•
.
.
, I
y = 143'
£
\ .2 + 805.9
1
I 2x-133.7*
1 ?xA2 RA2
ns
1 = 0.991
__^3___^
B
• 1
r
MK8
k
0.4 1.6 2.0 2.4
STRENGTH (MPa)
2.8
Figure AH6.12 Sonic velocity-strength graph of C C W R specimens (mix 8).

Appendix II AII6 - 8
CO
I* H l-H
u o p p >
o t-H
z o CZJ
3200
2300-
S T R E N G T H (MPa)
Figure AH6.13 Sonic velocity-strength graph of C C W R specimens (mix 9).
1 H l-H
u o p p u HH
z o CZJ
3000
2900
2800
2700
2600
2500
2400
2300
2200
2100
2000
STRENGTH (MPa)
Figure AII6.14 Sonic velocity-strength graph of C C W R specimens (mix 10).

Appendix II AII6 - 9
tn
H t-H
5J
o p p >
u t-H
z o C/J
3000
S T R E N G T H (MPa)
Figure AII6.15 Sonic velocity-strength graph of C C W R specimens (mix 11).
tn
fc
u o p p >
u t-H
z o C/3
2600
2500
1 J y = 1387.5 + 1775.5x - 904.43xA2 + 146.52xA3 RA2 = 0.998 T
00 0.25 0.50 0.75 1.00 1.25 1.50 1.75 2.00
STRENGTH (MPa)
Figure AII6.16 Sonic velocity-strength graph of C C W R specimens (mix 12).
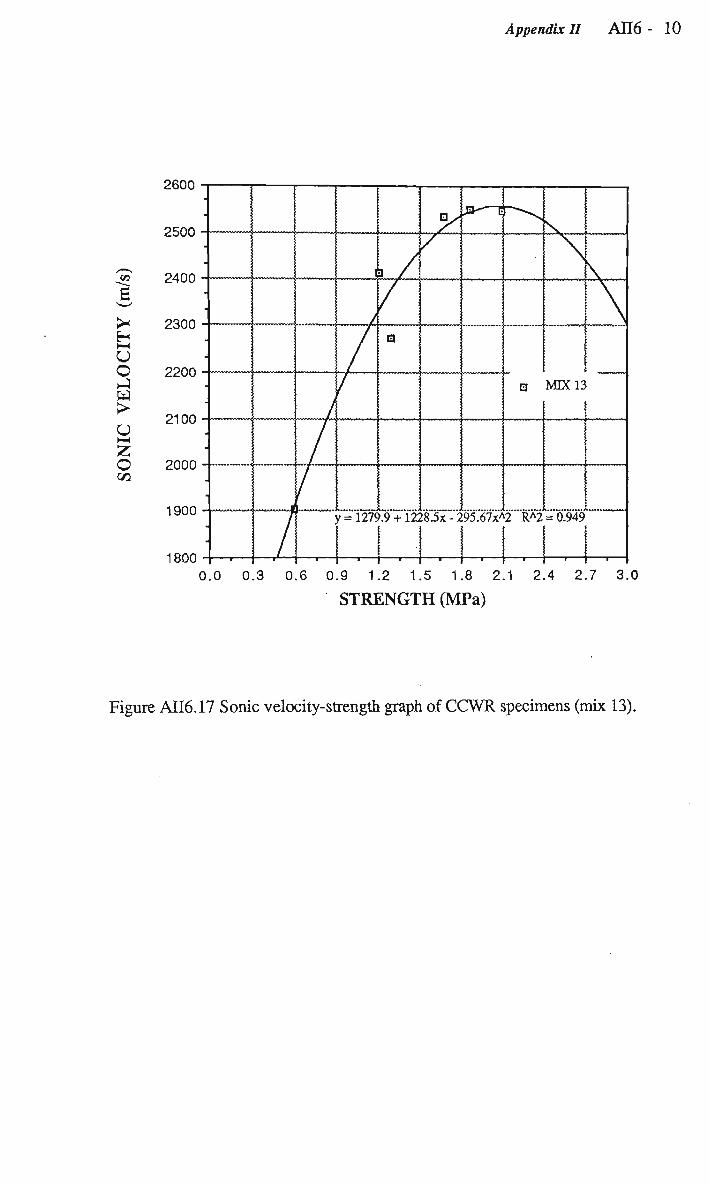
Appendix II AR6 - 10
S T R E N G T H (MPa)
Figure AII6.17 Sonic velocity-strength graph of C C W R specimens (mix 13).

Appendix II AII7 - 1
Table AH7.1 Flow test results of C W R .
Water
Content
<%>
2
5
10
15
Run
NO.
1
2
3
4
5 ,
X
Flow Factor
8
2.04
2.72
2.42
2.31
2.17
Slope of
Flow-tube
(•)
38.5°
Temp, of
Atmosphere
O C )
23°
2.33 o =0.23 o =0.2*5 n n-1
*lowaJbilxt.y = 4Z.88
1
2
3
38.5 o
25
NO friow
1
2
3 4 5
X
1
2
3
4
5
X
2.54
2.61
2.44 2.15 2.48
38.5" o
18
2.44 a =0.16" a =0.18 n n-1
Flowa
9.46
8.13
10.31®
11.22
8.75
bility = 40.92
38.5° 18.5°
9.S7 an=1.10 an_1=1.23
Flowability = 10.44
Remarks
A. ver y ,dr y mv x and hence ver y
r api d f I o v.
The fIov-
abvlity is
amoungst
t he hi ghest
A. ver y stiff mi x as v»l I as . a ver y cohesivs mix
obs er ved.
Rel at i vet y
r apv d ft ov
vas observed
The. tni x, is. on the t v mi t of s at ur at -i on. ® Ft ov I i Ice
a sol i d pi ug
Typi cal of
c allea
Bi ngham
fluid.
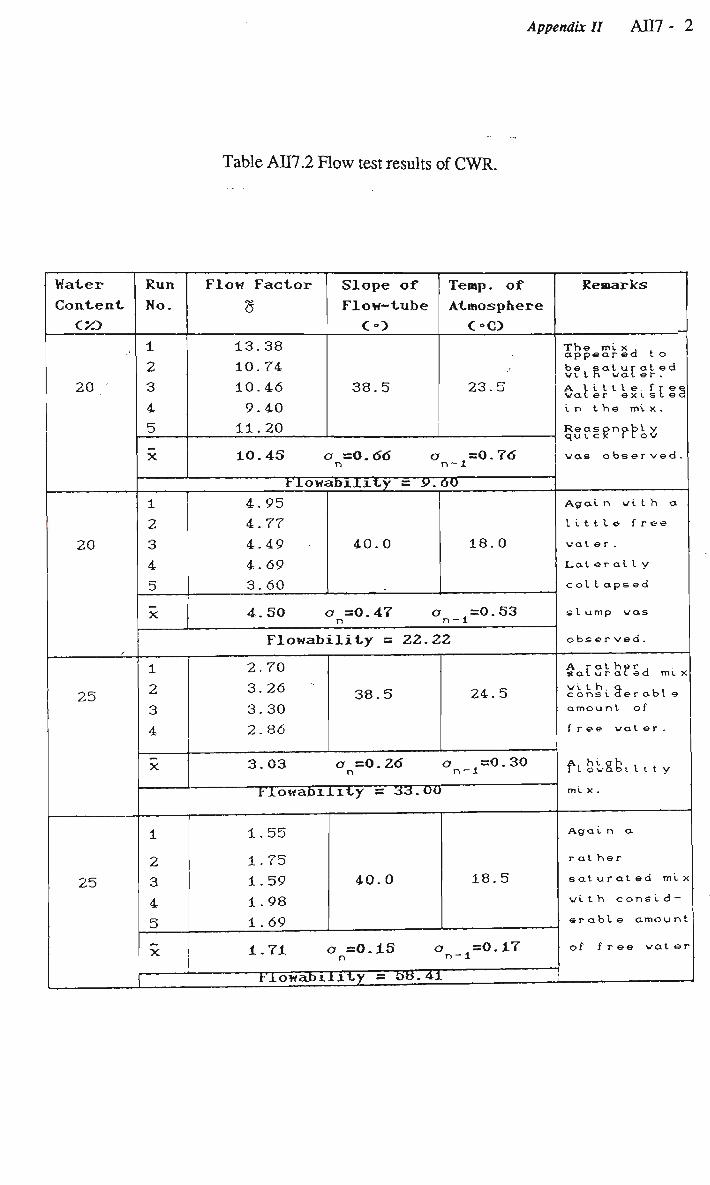
Appendix II AIT7 - 2
Table AH7.2 Flow test results of C W R .
Water Content
C50
,
20
20
25
25
Run No.
1
2 3 4 5
X
Flow Factor
8
13.38
10.74 10.46 9.40 11.20
Slope of Flow-tube (•)
38.5
Temp, of Atmosphere O O
23.5
10.43 a =0.66 a =0.76 n n-1
Flowability = 9. 60 1 2 3 4 5
X
4.95 4.77 4.49 4.69 3.60
40.0 18.0
4.SO o =0.47 o =0.53 n n-1
Flowability = 22.22
1 2
3 4
X
1
2 3
4 5
X
2.70
3.26
3.30 2.86
38.5 24.5
3.03 a =Q.Z6 a =0.30 n n-1
Flowabxixty = 33.00
1.55
1.75 1.59 1.98 1.69
40.0 18.5
1.71 a =0.15 o =0.17 n n-1
Flowabxixty = bB.4i
Remarks
The tni x . . appear ed t o be saturated vi t n vat er. A l i t t l e . f r e e vater existed in t he mi x .
Reaspnabl y quicK flov vas observed.
Agai n vi t h a
little free
vater.
Lai er at I y
cot Iapsed
slump vas
observed.
A r at her , saturated mix vit h. a , considerabi e amount of
free vat er .
ft ovabi I i t y
mi x .
Agai n a
rat her
saturated mix
vi t h const d -
erable amount
of f r ee vat er

Appendix II A H 7 - 3
Table AH7.3 Flow test results of C W R .
Water Content
30
30
Run No.
1 2 3 4 5
X
Flow Factor
<5
1.98 1.59
1.81 1.79 1.70
Slope of
Flow-tube
o>
38.5
Temp, of Atmosphere
O O
23.0
1.77 <7n=0.13 OTn-l=0.14
Flowability- = 56. 50
1 2 3 4 5
X
1.79 1.39 1.47 1.72 1.58
40.0 20.0
1.59 o =0.15 o =0.177 n n-1
Flowability = 62.89
Remarks
An e x t r e m e l y saturated mix vi t h pient y oi l r ee vac er
fe ffgssaed
ver v rapidly. Ther e vas a const derabl e amount of separ at i pp bet veen Che t aiIi ngs and t he vat er. Agai n pi ent y or f r ee vat ©r vav observed. 11 . is. t he mi x vi t h t he highest mass per cent ol vater content and consequent I y. it is at so Che mi x vi t h I he hi ghes t f t ovabiIi t y.

Appendix II A H 7 - 4
Table AH7.4 Flow test results of C W R .
Water Content C'/O
2
5
/
10
Run No.
1 2
3 4 5
X
•
1 2 3 4 5
X
Flow Factor
s
1.04 1.14 1.15 1.27 1.27
Slope of Flow-tube
C O
45
Temp, of Atmosphere
O O
18.0
1.17 a =0.09 a =0.10 n n-1
Flowability = 85.47
l.Od
1.47 1.36 1.36 1.37
™- ~
45 18.0
1.45 o =0.12 o =0.14 n Tr - 1
Flowability = ov.< 1 2 3 4 5
X
1.62 1.52 1.49 1.50 1.36
45
>6
18.0
1.50 a =0.08 o =0.09 n n-1
Flowabxlxty = o6.ro
Remarks
Thi s is by
f ar t he besI
slope for the
fIov t es t s. A
consi derably
qui c k er fIov vas e x p e r i e n ced at t hi s s t ope, c.f. 38. 5°.
A ver y stiff
mat er i al .
It ft oved
quite rapidly
at this
s I ope.
A r api d t l o u -
i ng mat er i al .
It has a Iov
siump value
of . 15 mm.

Appendix II AII7 - 5
Table AH7.5 Flow test results of C W R .
Water
Content OO
' 15
20
s
25
30
Run No.
1 2 3 4 5
X
1 2 3 4 5
X
Flow Factor
g
2.96 3.54 2.35 2.70 2.30
Slope of Flow-tube
0 >
45
Temp, of
Atmosphere O O
18.5
2.77 a =0.45 a =0.51 r> n - 1
Flowabxlity =36.10 " 1.90 1.95 2.10 2.19 2.12
45 18.0
2.05 a =0.11 o =0.53 n n-1
FiowabxliLy- = 48.73 1 2 3 4 5
X
1.36 1.31 1.34 1.34 1.50
45 18.5
1.37 o =0.07 o =0.08 n n -1
Flowability ~ 72.99 1 2 3 4 5
X
1.18 1.22 1.33 1.30 1.39
45 18.5
1.28 a =0.08 a =0.08 n n-1
Flowability = 77.88
Remarks
Thi s mat er i al
has I he I o v -
est f I o v -
abiIi t y.
H o v e v e r , it
is a. f ai rly cons i stent mi x .
A l m o s t has
t he s am&
fIovabi t i t y
vai u e as the
1 5 % vater
c ont ent mi x .
T h e mi x had
const der abt e
amount of
f r ee vat er. A
rapid f loving
mi x .
T h e mi x had
a high l a t e r
al c olIaps e
s l u m p value
of 200mm.
Ver y little
c o hes i ve
p r o p e r t y of
the mat er i al
vas observed.

Appendix II AIT7 - 6
Table AII7.6 Flow test results of C W R .
Water Content
C*>
2
5
•
10
15
Run
No.
1 2 3
4 5
X
Flow Factor
<s
1.20 1.49
1.12 1.10 1.12
Slope of Flow-tube
C O
50
Temp, of
Atmosphere O O
18.0
1.21 o =0.15 o =0.16 n n-1
Flowabxlxty = »2.i>5
1 2 3 4 5
X
1.62 1.06 1.15 1.06 1.03
50 18.0
1.18 o =0.22 o = 0.25 n n -1
rlowabiiit,y = 8 4 . 40
1 2 3
4 5
X
0.99 1.16 1.18
1.12
1.10
50 18.0
i.ii a =0.07 o =0.07 n n-1
" " 1-1 oVab I ii ty • = ~VO . o 9
1 2 3 4 5
X
1.96 1.65 1.97 1.60 1.71
50 18.5
1.78 o =0.16 o =0.18 n n-1
Flowability = 56.24
Remarks
Ver y little
cohesi ve
p r o p e r t y vas
observed of
t he mat e r -
i al .
A ver y stiff
mat er i al
vi t h zero
slump value.
Thi s .mat err
hk?% 3eg. sI ope.
The f I o v -
abi lily
val ue of
t hi s, mi x is si mi I ar t o t hat .of the pr evious mix at I hi s
angle.
Thi s mi x has
a t ypi cal I y
Iov f I o v -
abiI i t y
val ue, i nd — cat i ng a par t i c u l a r l y hi gh i nt er — nal shear , str engt h of t he m a l er i al
vat er cont ent .

Appendix II AII7 - 7
Table AH7.7 Flow test results of C W R .
Water Content
c>o
20
25
y
30
Run No.
1 2 3 4 5
X
1
2 3 4 5
X
1 2
3
4 5
X
Flow Factor
8
1.81 1.68 1.80 1.76 1.66
Slope of Flow-tube
C O
50
Temp. of Atmosphere
O O
18.0
1.74 a =0.06 a =0.07 n n — 1
Flowabxlxty = bY.41
1.21
1.42 1.17 1.20 1.24
50 18.5
1.25 a -0.09 a =0.10 n n-1
Flowa
0. 99 0.95 1.02
0.84 0.82
bility = 80.13
50 18.0
0.92 a =0.08 o =O.09 n n — 1
1 Flowabxlxty = 108.23
Remarks
A col I aps ed
sIump vas
obs er ved.
FIovabi I i t y
val up is, si mi I ar t o t he pr e v -ious mix.
A, c o n s i d e r able amount of f r ee
vat er vqs obs er vea. A hi gh
fIovabi Ii t y
is e v i d e n t .
Ag a i n a lot
of f r ee
vat er vas
obs er ved.
The
ma. terial I Ioved
rat her qui cRly.

Appendix II AII7 - 8
H Z
w H Z o u PS
35
30
2 25
20
15
10
0
•
•
-
k,r
......
J
J 1 S'
^y^ ^
^r*~f
. 1_ 1 1 •
I M J W W M W W
j
• ' 1
:
0 10 20 30 40 50 60 70 80 90
FLOWABILITY (Flow factor x 100)
Figure AII7.1 Water content-flowability graph of C W R at 38.5° Slope.

Appendix II AW - 9
0 10 20 30 40 50 60 70 80 90 100
FLOWABILITY (Flow factor^ 100)
Figure AH7.2 Water content-flowability graph of C W R at 45.0° Slope.

Appendix II AII7 - 10
35
30
£ ^ 25
H Z H H Z O u as a
20
15
10
0
I ! !
'
: i
:
! .
.
:
i
_
.. i_ _ ,
'••
i
i
i
i
'
-
| . i . l .
j
'•
•
:
!
.
|
_.L_. « _ 1 ' t
0 10 20 30 40 50 60 70 80 90 100 110 120
FLOWABILITY (Flow factofxx 100)
Figure AH7.3 Water content-flowability graph of CWR at 50.0° Slope.

Appendix II A H 7
100000
tfi
u r*
H i — i tfi
o u tfi u H
z > — i
10000
1000
FLOW FACTOR
Average values of each of the five runs for each oil at 38.5° slope were used to plot this graph.
Figure AH7.4 Graph of kinematic viscosity-flow factor of different
calibration oils at 38.5° Slope.

Appendix II AH7 - 12
100000 7
tfi
H rM tfi
O u tfi
u l-H
H S w z I — I
10000 -
1000
FLOW FACTOR
Average values of each of the five runs for each oil at 45° slope were used to plot this graph.
Figure AIT7.5 Graph of kinematic viscosity-flow factor of different
calibration oils at 45.0° Slope.

Appendix II ATI7 - 13
100000 1
10000
1000-
FLOW FACTOR
Average values of each of the five runs for each oil at 50° slope were used to plot this graph.
Figure AH7.6 Graph of kinematic viscosity-flow factor of different
calibration oils at 50.0° Slope.