1h18 results presentationmicromechanics.listedcompany.com/newsroom/2018012… · ·...
TRANSCRIPT
1H18 Results Presentation29 January 2018
Micro-Mechanics 1H18 Results Presentation 2
Chris Borch, CEO
Low Ming Wah, COO
Business & Industry
perfect parts and tools, on time, every time
Micro-Mechanics 1H18 Results Presentation 3
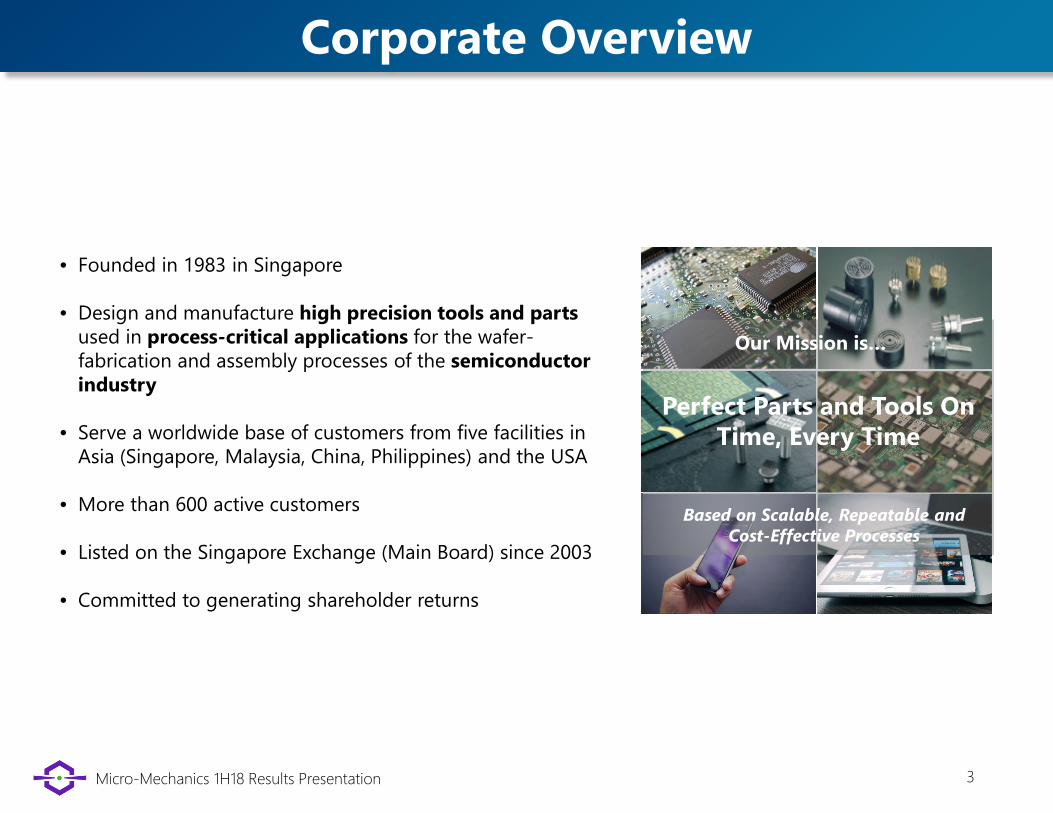
• Founded in 1983 in Singapore
• Design and manufacture high precision tools and parts used in process-critical applications for the wafer-fabrication and assembly processes of the semiconductor industry
• Serve a worldwide base of customers from five facilities in Asia (Singapore, Malaysia, China, Philippines) and the USA
• More than 600 active customers
• Listed on the Singapore Exchange (Main Board) since 2003
• Committed to generating shareholder returns
Our Mission is…
Based on Scalable, Repeatable and Cost-Effective Processes
Perfect Parts and Tools On Time, Every Time
Corporate Overview
Micro-Mechanics 1H18 Results Presentation 4
Business Model
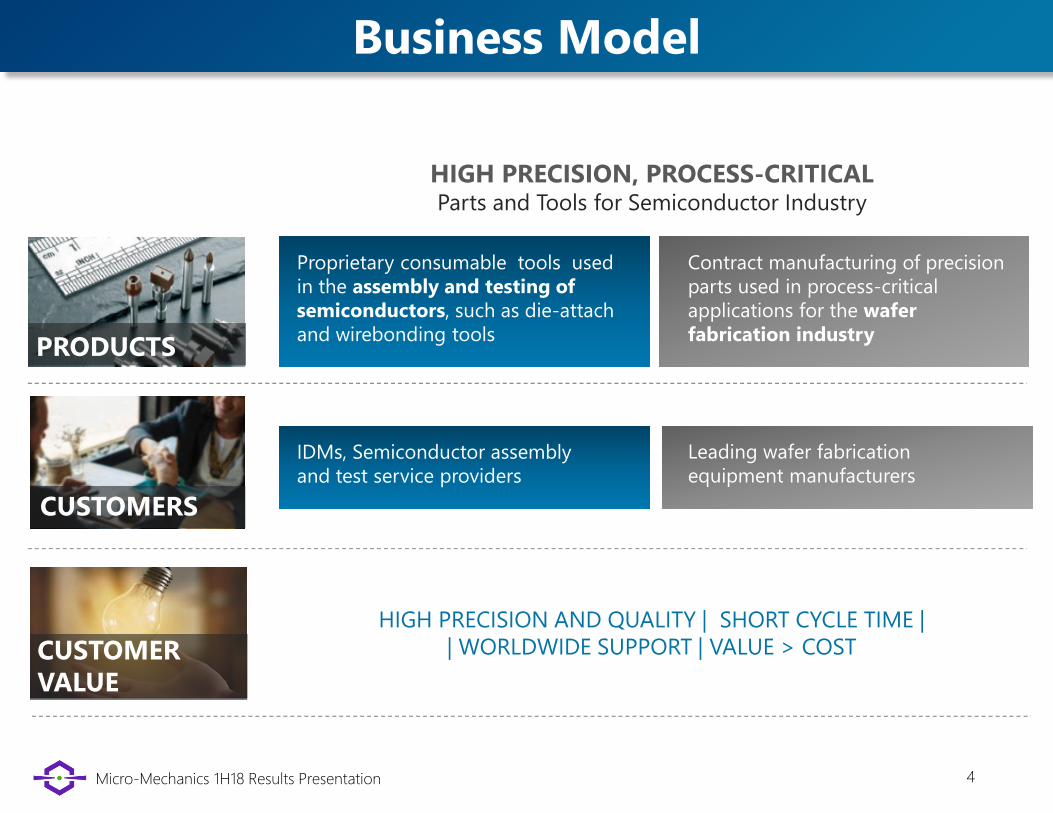
HIGH PRECISION, PROCESS-CRITICAL Parts and Tools for Semiconductor Industry
Proprietary consumable tools used in the assembly and testing of semiconductors, such as die-attach and wirebonding tools
Contract manufacturing of precision parts used in process-critical applications for the wafer fabrication industry
IDMs, Semiconductor assembly and test service providers
Leading wafer fabrication equipment manufacturers
HIGH PRECISION AND QUALITY | SHORT CYCLE TIME | | WORLDWIDE SUPPORT | VALUE > COSTCUSTOMER
VALUE
PRODUCTS
CUSTOMERS
Micro-Mechanics 1H18 Results Presentation 5
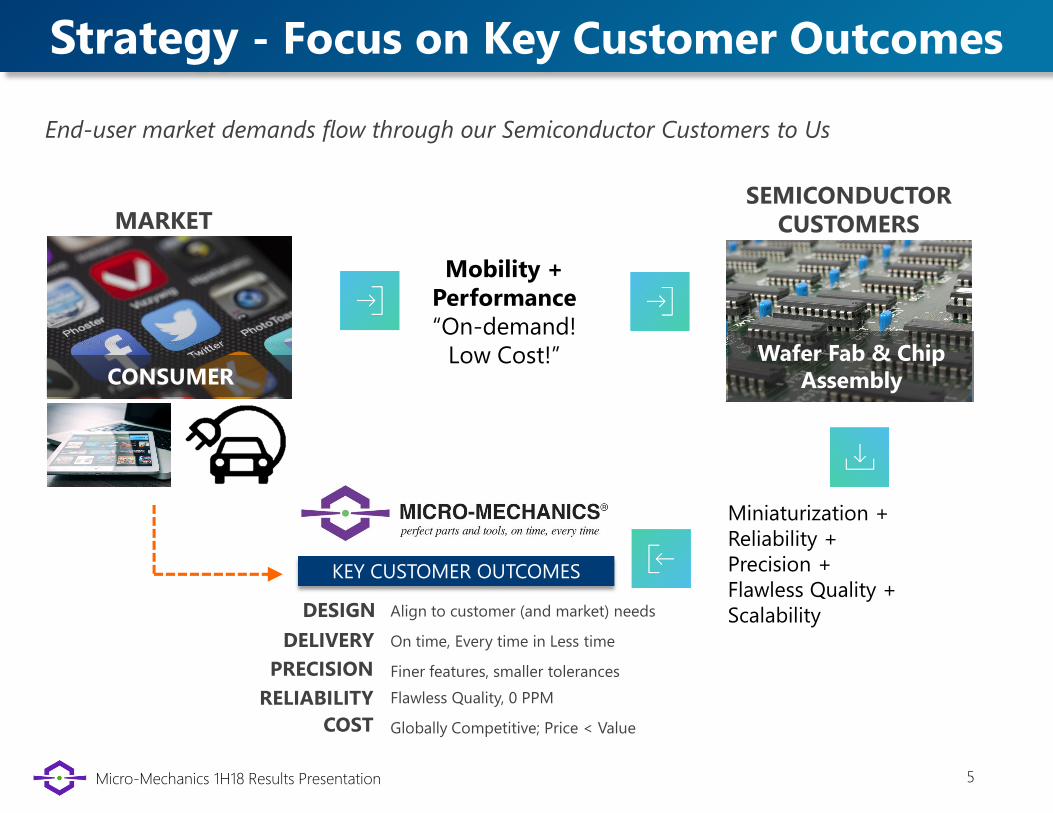
Strategy - Focus on Key Customer Outcomes
End-user market demands flow through our Semiconductor Customers to Us
Mobility + Performance“On-demand!
Low Cost!”
MARKETSEMICONDUCTOR
CUSTOMERS
Miniaturization + Reliability + Precision + Flawless Quality + Scalability
KEY CUSTOMER OUTCOMES
DESIGN Align to customer (and market) needs
DELIVERY On time, Every time in Less time
PRECISION Finer features, smaller tolerances
RELIABILITY Flawless Quality, 0 PPM
COST Globally Competitive; Price < Value
CONSUMERWafer Fab & Chip
Assembly
Micro-Mechanics 1H18 Results Presentation 6
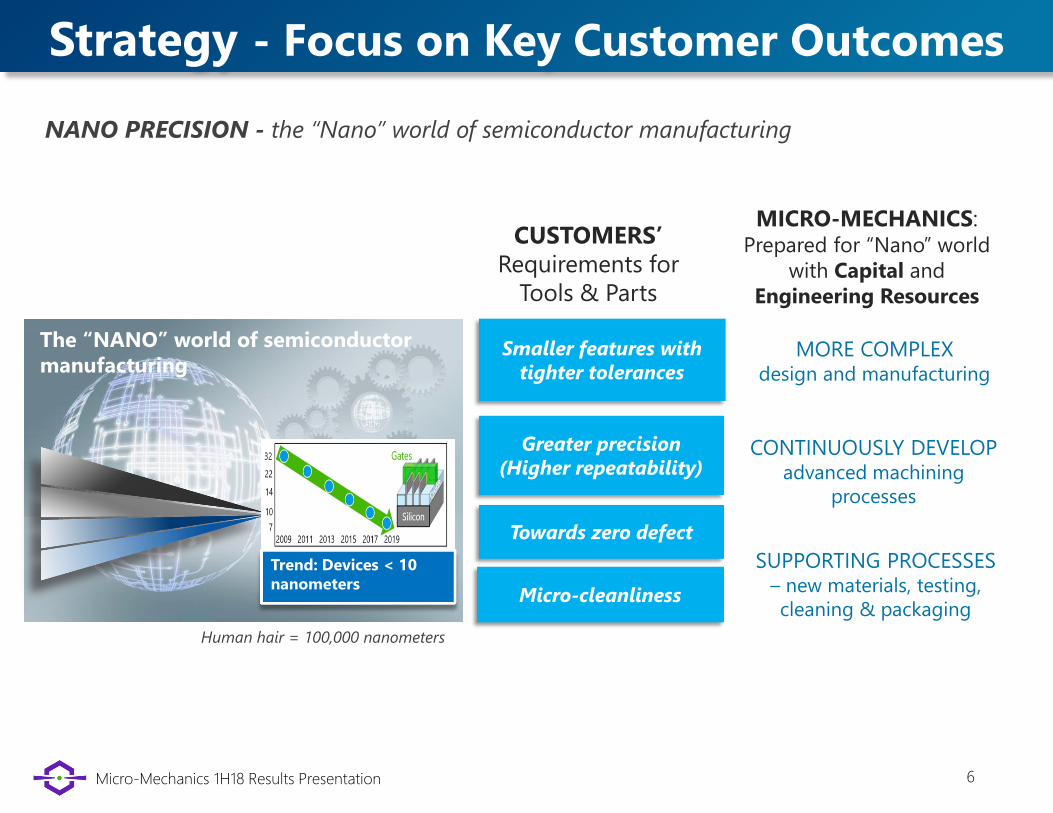
Strategy - Focus on Key Customer Outcomes
The “NANO” world of semiconductor manufacturing
Trend: Devices < 10 nanometers
NANO PRECISION - the “Nano” world of semiconductor manufacturing
MICRO-MECHANICS: Prepared for “Nano” world
with Capital and Engineering Resources
MORE COMPLEX design and manufacturing
CONTINUOUSLY DEVELOP advanced machining
processes
SUPPORTING PROCESSES – new materials, testing, cleaning & packaging
Smaller features with tighter tolerances
CUSTOMERS’ Requirements for
Tools & Parts
Greater precision (Higher repeatability)
Towards zero defect
Micro-cleanliness
Human hair = 100,000 nanometers
Micro-Mechanics 1H18 Results Presentation 7
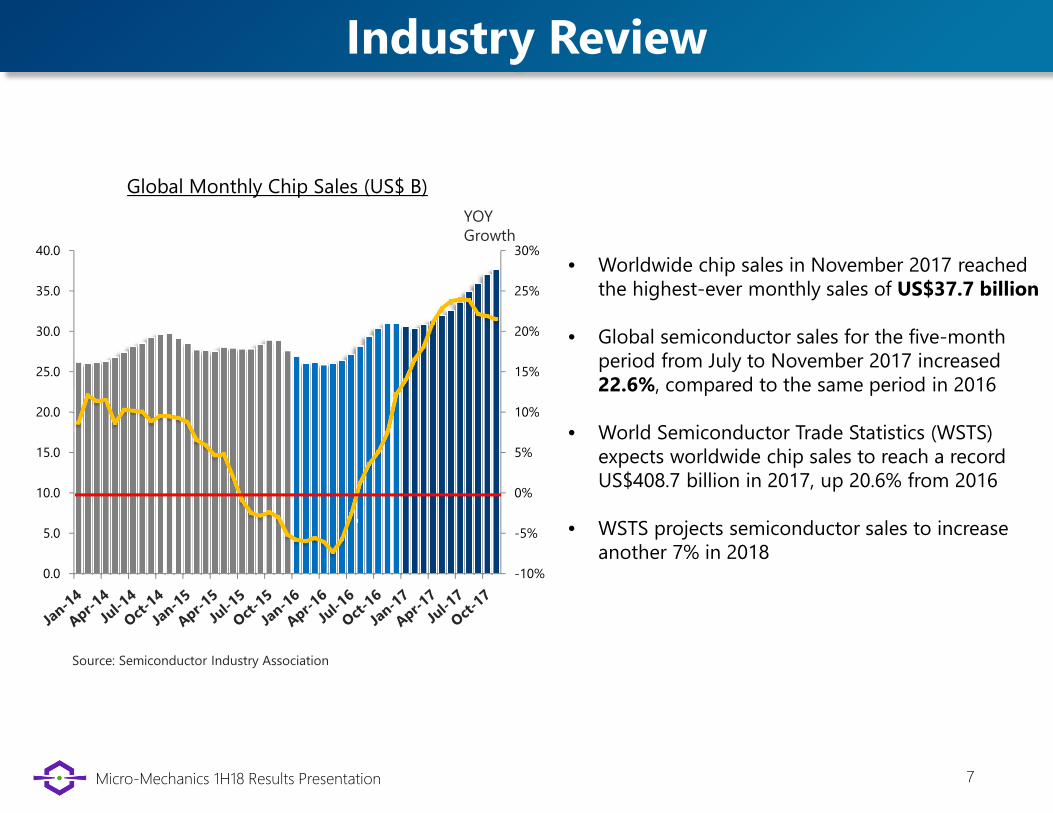
Industry Review
Global Monthly Chip Sales (US$ B)
-10%
-5%
0%
5%
10%
15%
20%
25%
30%
0.0
5.0
10.0
15.0
20.0
25.0
30.0
35.0
40.0
YOY Growth
Source: Semiconductor Industry Association
• Worldwide chip sales in November 2017 reached the highest-ever monthly sales of US$37.7 billion
• Global semiconductor sales for the five-month period from July to November 2017 increased 22.6%, compared to the same period in 2016
• World Semiconductor Trade Statistics (WSTS) expects worldwide chip sales to reach a record US$408.7 billion in 2017, up 20.6% from 2016
• WSTS projects semiconductor sales to increase another 7% in 2018
Micro-Mechanics 1H18 Results Presentation 8
0%
10%
20%
30%
40%
50%
60%
70%
80%
0.0
0.5
1.0
1.5
2.0
2.5
Jan-17 Mar-17 May-17 Jul-17 Sep-17 Nov-17
YOY Growth
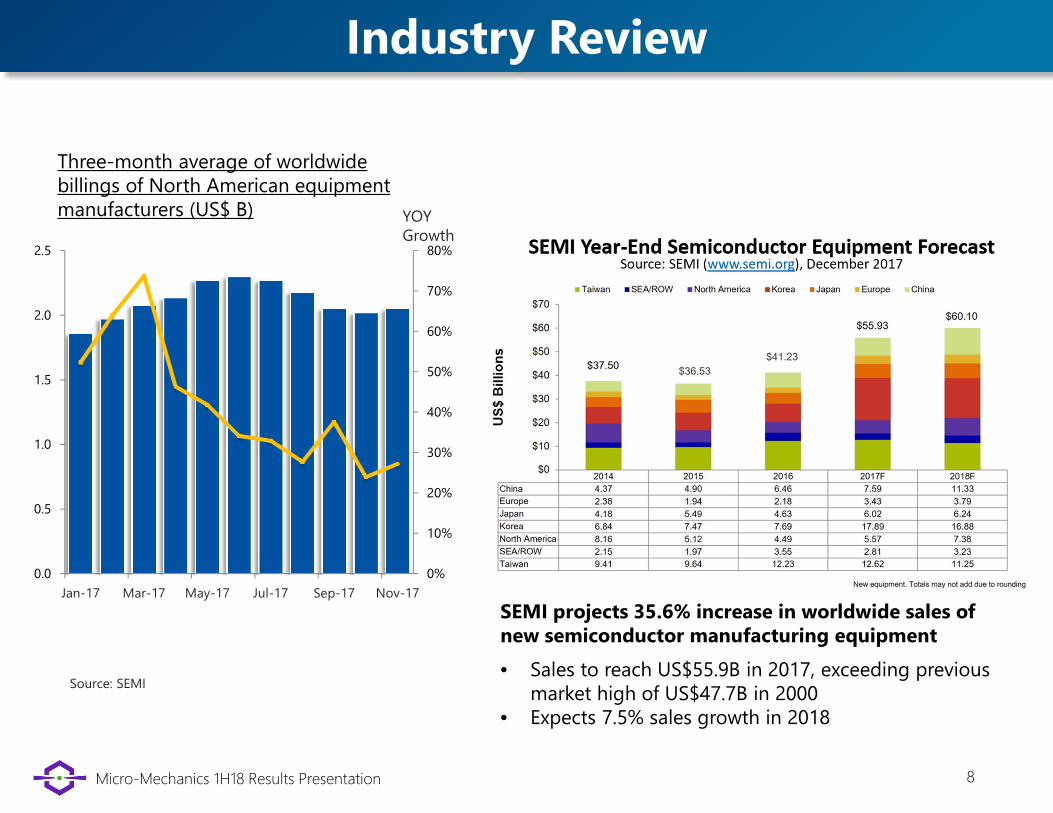
Industry Review
Three-month average of worldwide billings of North American equipment manufacturers (US$ B)
Source: SEMI• Sales to reach US$55.9B in 2017, exceeding previous
market high of US$47.7B in 2000• Expects 7.5% sales growth in 2018
SEMI projects 35.6% increase in worldwide sales of new semiconductor manufacturing equipment
Micro-Mechanics 1H18 Results Presentation 9
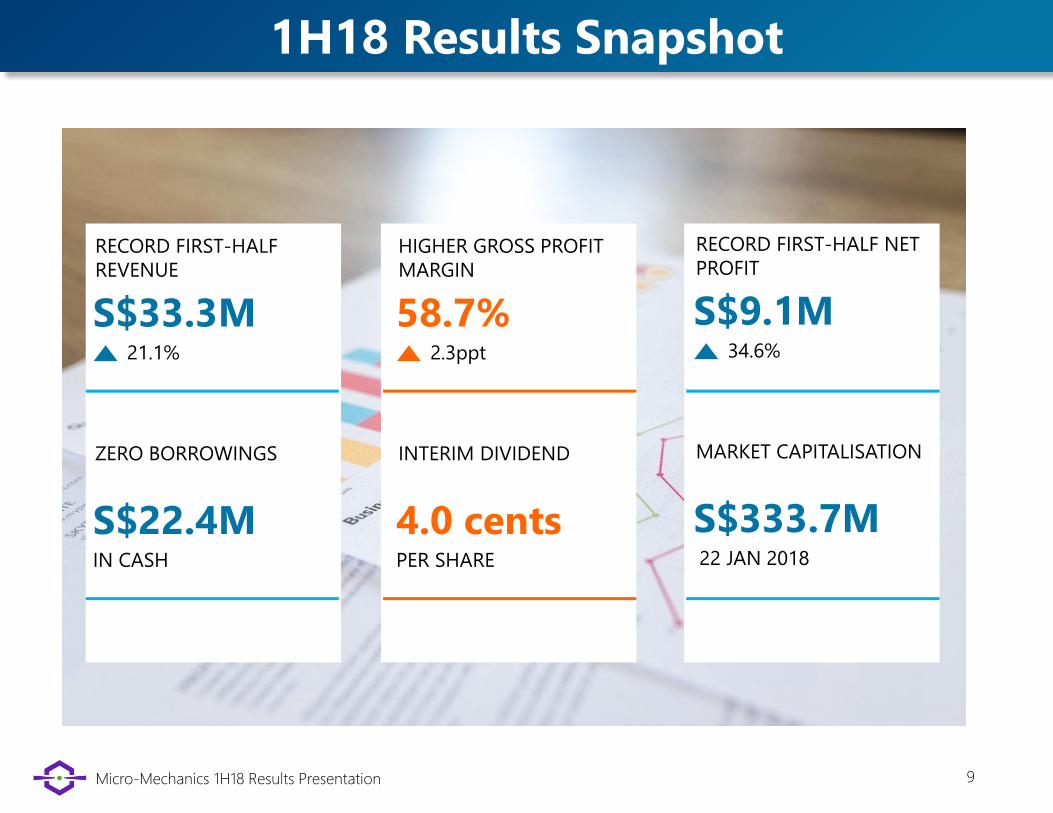
1H18 Results Snapshot
RECORD FIRST-HALF REVENUE
S$33.3M21.1%
HIGHER GROSS PROFIT MARGIN
58.7%2.3ppt
RECORD FIRST-HALF NET PROFIT
S$9.1M34.6%
ZERO BORROWINGS
S$22.4MIN CASH
INTERIM DIVIDEND
4.0 centsPER SHARE
MARKET CAPITALISATION
S$333.7M22 JAN 2018
Micro-Mechanics 1H18 Results Presentation 10
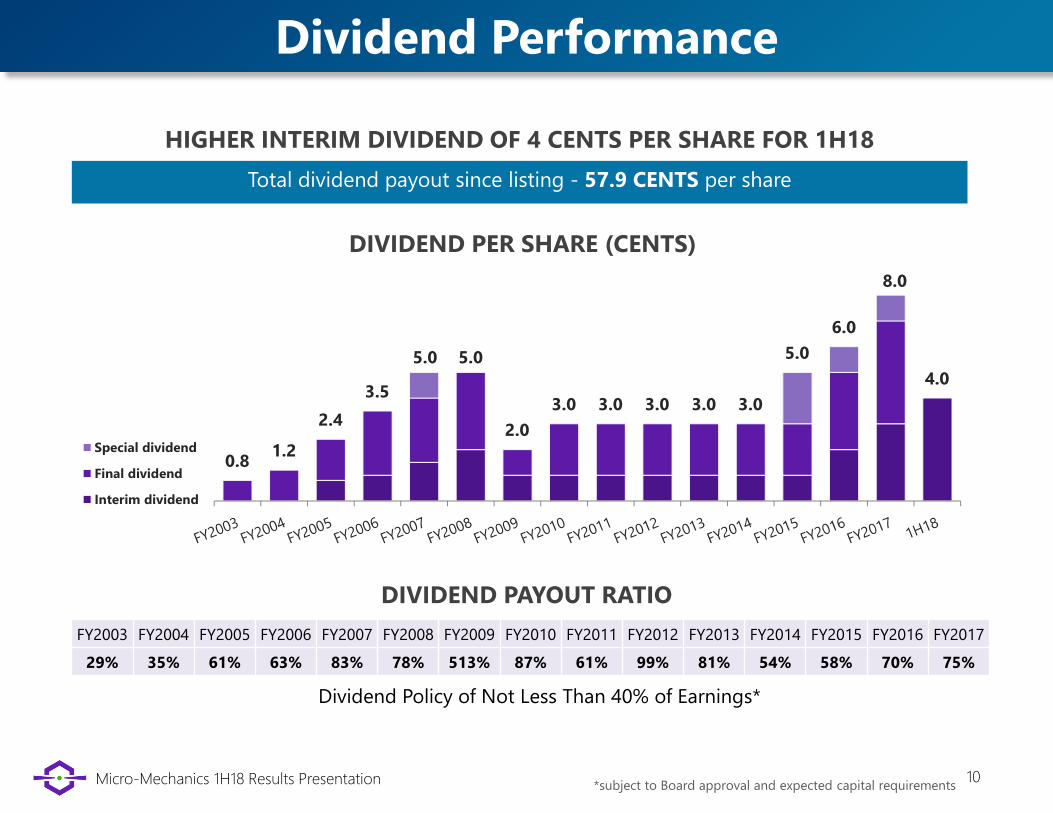
Dividend Policy of Not Less Than 40% of Earnings*
Total dividend payout since listing - 57.9 CENTS per share
*subject to Board approval and expected capital requirements
Dividend Performance
FY2003 FY2004 FY2005 FY2006 FY2007 FY2008 FY2009 FY2010 FY2011 FY2012 FY2013 FY2014 FY2015 FY2016 FY2017
29% 35% 61% 63% 83% 78% 513% 87% 61% 99% 81% 54% 58% 70% 75%
DIVIDEND PAYOUT RATIO
0.81.2
2.4
3.5
5.0 5.0
2.0
3.0 3.0 3.0 3.0 3.0
5.0
6.0
8.0
4.0
Special dividend
Final dividend
Interim dividend
DIVIDEND PER SHARE (CENTS)
HIGHER INTERIM DIVIDEND OF 4 CENTS PER SHARE FOR 1H18
Micro-Mechanics 1H18 Results Presentation 11
Chow Kam Wing, CFO
Financial Review
perfect parts and tools, on time, every time
Micro-Mechanics 1H18 Results Presentation 12
33.3
19.5
0
11.69.1
13.8
0.3
8.3
2.6
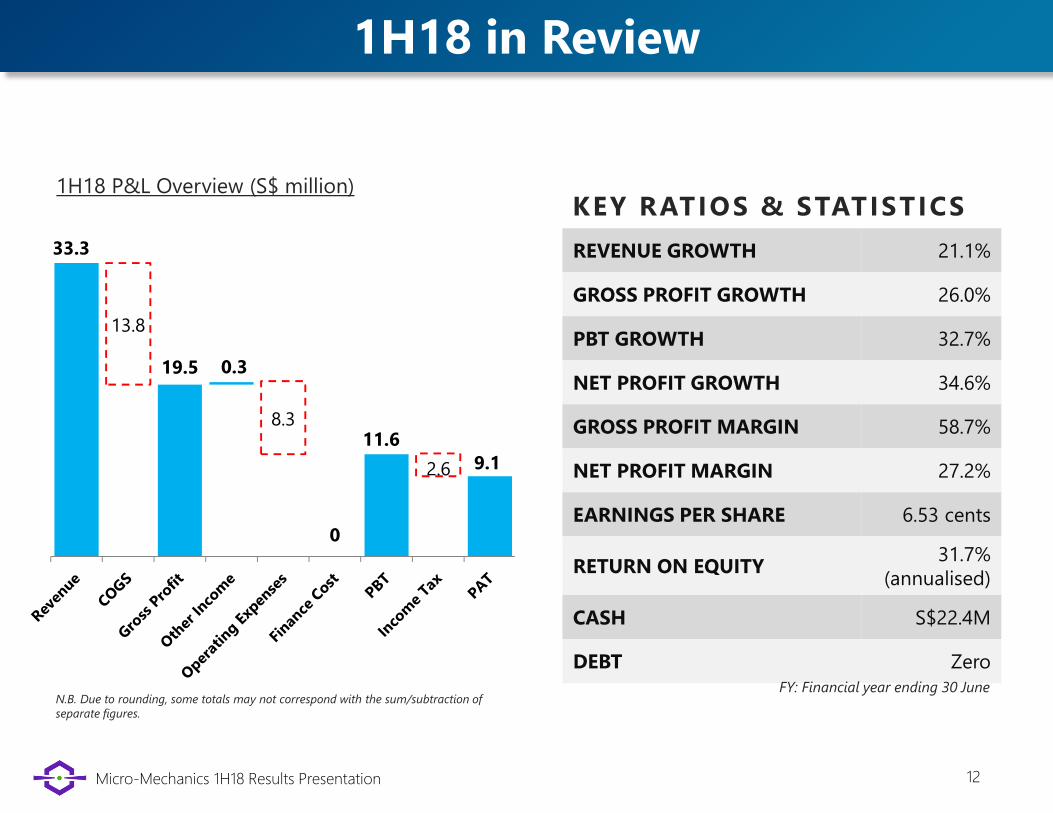
1H18 P&L Overview (S$ million)KEY RATIOS & STATISTICS
REVENUE GROWTH 21.1%
GROSS PROFIT GROWTH 26.0%
PBT GROWTH 32.7%
NET PROFIT GROWTH 34.6%
GROSS PROFIT MARGIN 58.7%
NET PROFIT MARGIN 27.2%
EARNINGS PER SHARE 6.53 cents
RETURN ON EQUITY31.7%
(annualised)
CASH S$22.4M
DEBT Zero
1H18 in Review
N.B. Due to rounding, some totals may not correspond with the sum/subtraction of separate figures.
FY: Financial year ending 30 June
Micro-Mechanics 1H18 Results Presentation 13
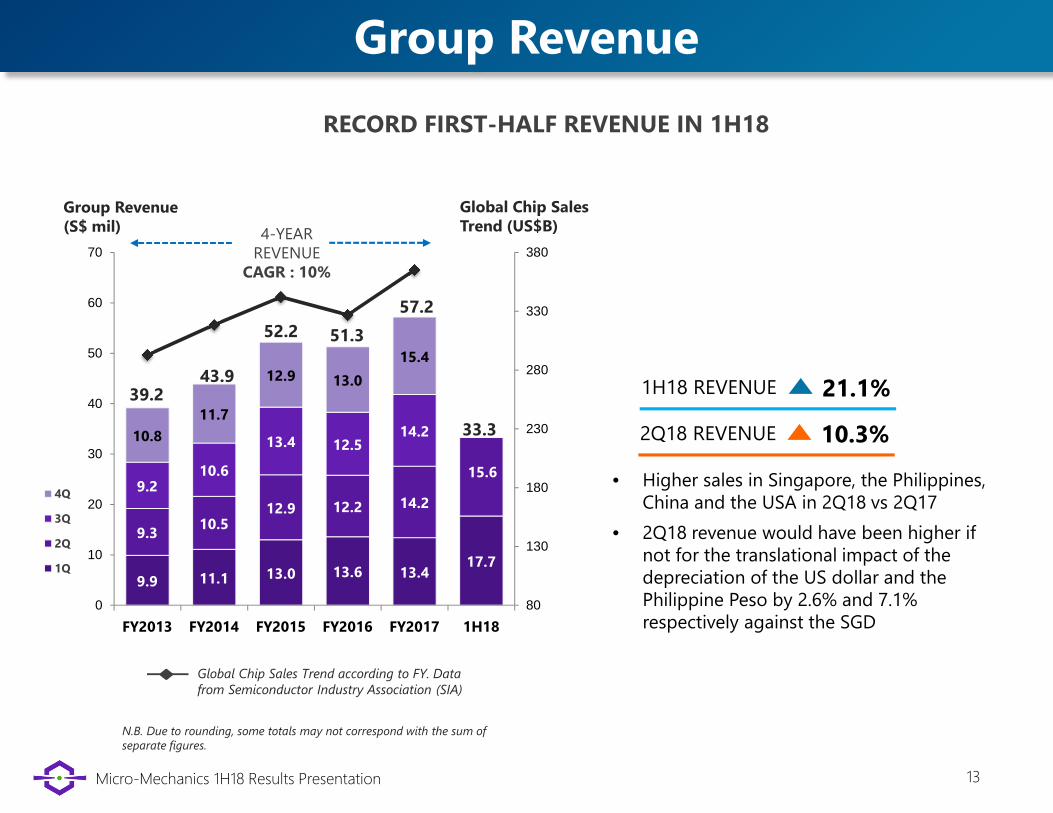
9.9 11.1 13.0 13.6 13.417.7
9.310.5
12.9 12.2 14.2
15.69.2
10.6
13.4 12.514.210.8
11.7
12.9 13.0
15.4
80
130
180
230
280
330
380
0
10
20
30
40
50
60
70
FY2013 FY2014 FY2015 FY2016 FY2017 1H18
4Q
3Q
2Q
1Q
39.2
Group Revenue (S$ mil)
Global Chip Sales Trend (US$B)
Global Chip Sales Trend according to FY. Data from Semiconductor Industry Association (SIA)
43.9
52.2 51.3
Group Revenue
57.2
• Higher sales in Singapore, the Philippines, China and the USA in 2Q18 vs 2Q17
• 2Q18 revenue would have been higher if not for the translational impact of the depreciation of the US dollar and the Philippine Peso by 2.6% and 7.1% respectively against the SGD
N.B. Due to rounding, some totals may not correspond with the sum of separate figures.
RECORD FIRST-HALF REVENUE IN 1H18
4-YEAR REVENUE
CAGR : 10%
33.3
1H18 REVENUE 21.1%
2Q18 REVENUE 10.3%
Micro-Mechanics 1H18 Results Presentation 14
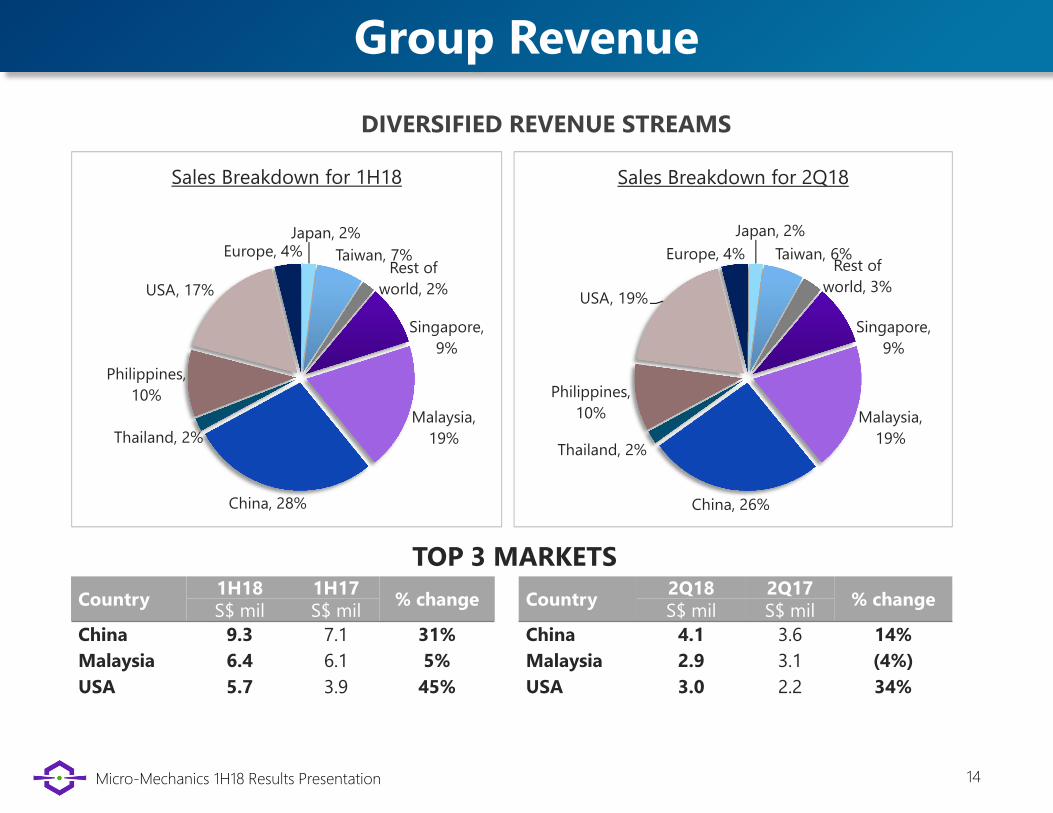
DIVERSIFIED REVENUE STREAMS
Singapore,
9%
Malaysia,
19%
China, 26%
Thailand, 2%
Philippines,
10%
USA, 19%
Europe, 4%
Japan, 2%
Taiwan, 6%Rest of
world, 3%
Sales Breakdown for 2Q18
Group Revenue
Singapore,
9%
Malaysia,
19%
China, 28%
Thailand, 2%
Philippines,
10%
USA, 17%
Europe, 4%Japan, 2%
Taiwan, 7%Rest of
world, 2%
Sales Breakdown for 1H18
Country1H18 1H17
% changeS$ mil S$ mil
China 9.3 7.1 31%
Malaysia 6.4 6.1 5%
USA 5.7 3.9 45%
TOP 3 MARKETS
Country2Q18 2Q17
% changeS$ mil S$ mil
China 4.1 3.6 14%
Malaysia 2.9 3.1 (4%)
USA 3.0 2.2 34%
Micro-Mechanics 1H18 Results Presentation 15
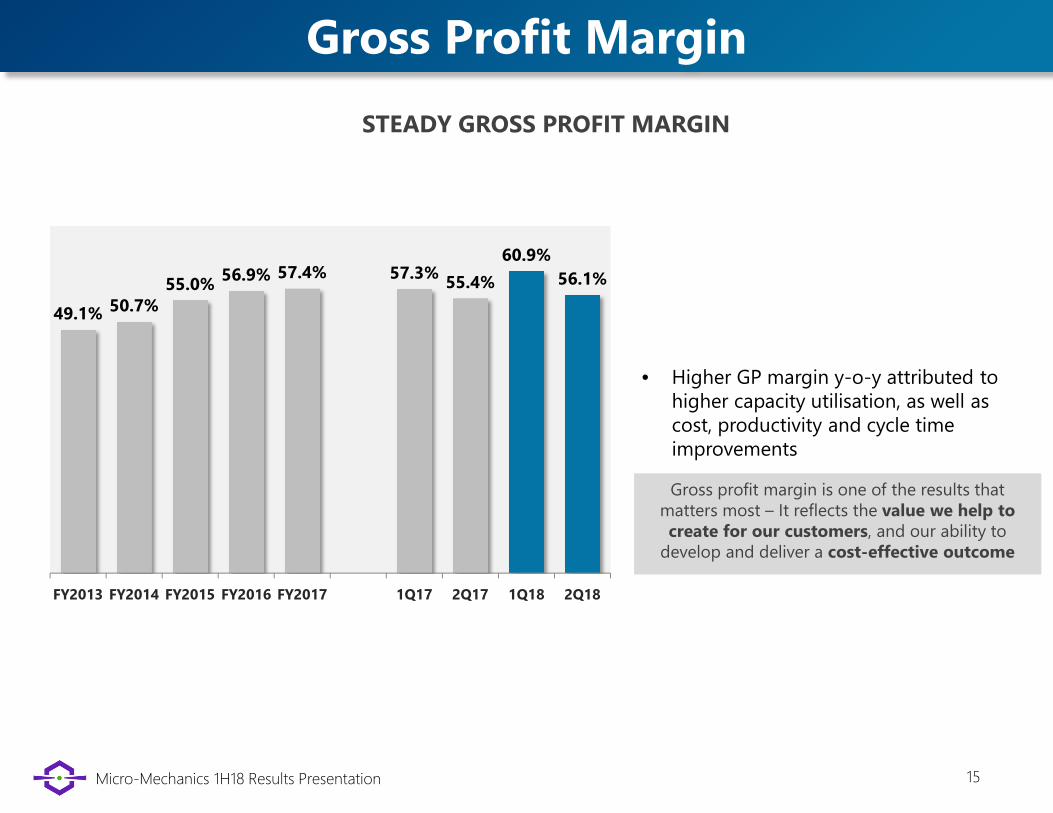
49.1% 50.7%55.0%
56.9% 57.4% 57.3%55.4%
60.9%
56.1%
FY2013 FY2014 FY2015 FY2016 FY2017 1Q17 2Q17 1Q18 2Q18
• Higher GP margin y-o-y attributed to higher capacity utilisation, as well as cost, productivity and cycle time improvements
Gross MarginGross Profit Margin
Gross profit margin is one of the results that matters most – It reflects the value we help to create for our customers, and our ability to
develop and deliver a cost-effective outcome
STEADY GROSS PROFIT MARGIN
Micro-Mechanics 1H18 Results Presentation 16
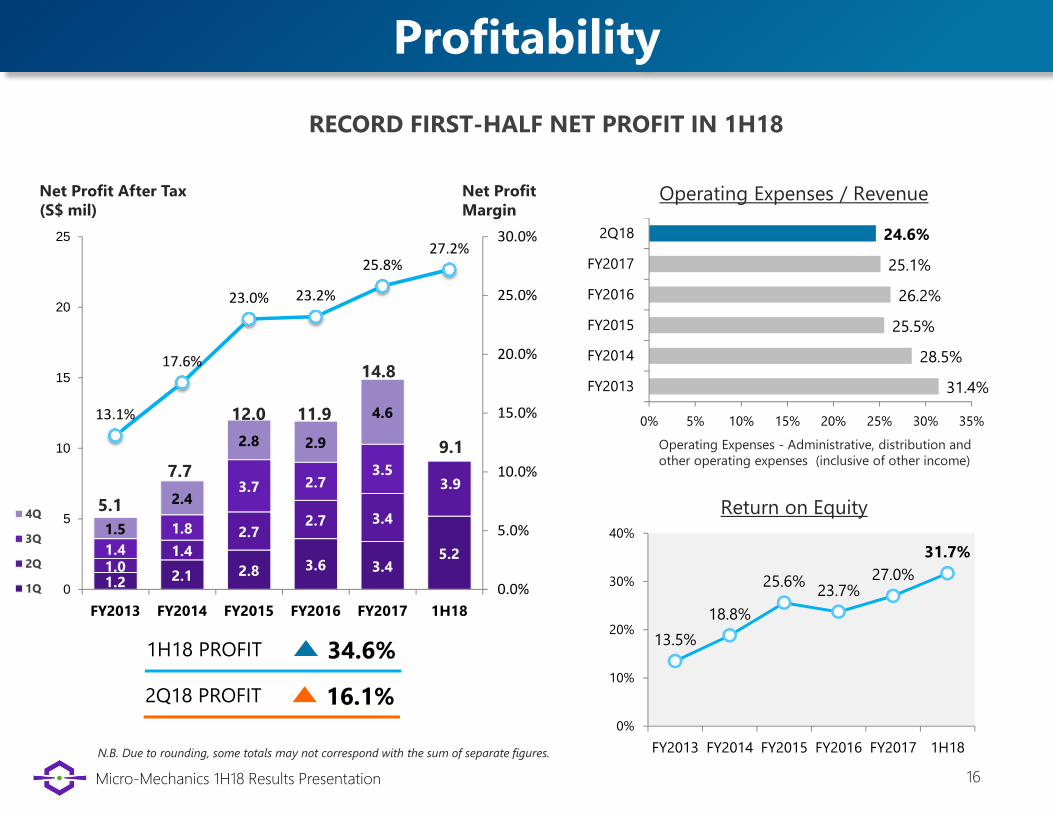
31.4%
28.5%
25.5%
26.2%
25.1%
24.6%
0% 5% 10% 15% 20% 25% 30% 35%
FY2013
FY2014
FY2015
FY2016
FY2017
2Q18
Operating Expenses - Administrative, distribution and other operating expenses (inclusive of other income)
Operating Expenses / Revenue
Profitability
N.B. Due to rounding, some totals may not correspond with the sum of separate figures.
RECORD FIRST-HALF NET PROFIT IN 1H18
1.2 2.1 2.8 3.6 3.45.2
1.01.4
2.72.7 3.4
3.9
1.4
1.8
3.7 2.73.5
1.5
2.4
2.8 2.9
4.613.1%
17.6%
23.0% 23.2%
25.8%
27.2%
0.0%
5.0%
10.0%
15.0%
20.0%
25.0%
30.0%
0
5
10
15
20
25
FY2013 FY2014 FY2015 FY2016 FY2017 1H18
4Q
3Q
2Q
1Q
7.7
12.0 11.9
14.8
5.1
Net Profit After Tax (S$ mil)
Net Profit Margin
13.5%
18.8%
25.6%23.7%
27.0%
31.7%
0%
10%
20%
30%
40%
FY2013 FY2014 FY2015 FY2016 FY2017 1H18
Return on Equity
1H18 PROFIT 34.6%
2Q18 PROFIT 16.1%
9.1
Micro-Mechanics 1H18 Results Presentation 17
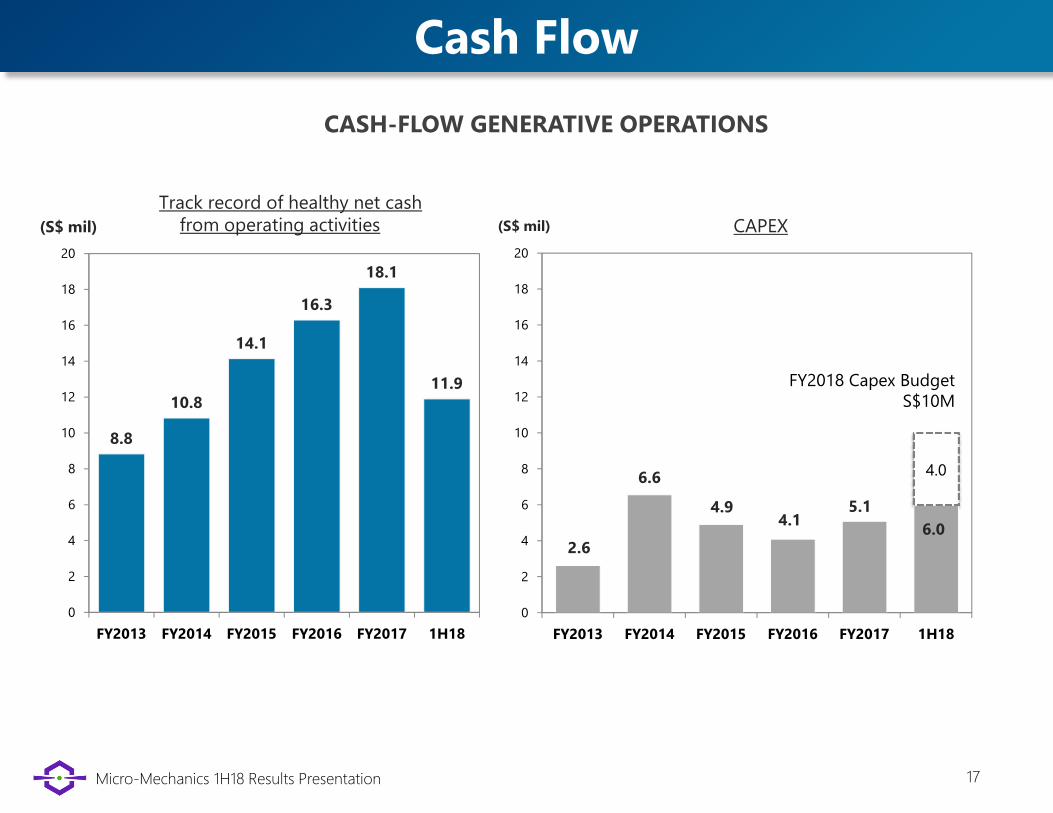
8.8
10.8
14.1
16.3
18.1
11.9
0
2
4
6
8
10
12
14
16
18
20
FY2013 FY2014 FY2015 FY2016 FY2017 1H18
(S$ mil)
2.6
6.6
4.94.1
5.1
6.0
4.0
0
2
4
6
8
10
12
14
16
18
20
FY2013 FY2014 FY2015 FY2016 FY2017 1H18
(S$ mil)
Track record of healthy net cash from operating activities CAPEX
Cash Flow
CASH-FLOW GENERATIVE OPERATIONS
FY2018 Capex Budget S$10M
Micro-Mechanics 1H18 Results Presentation 18
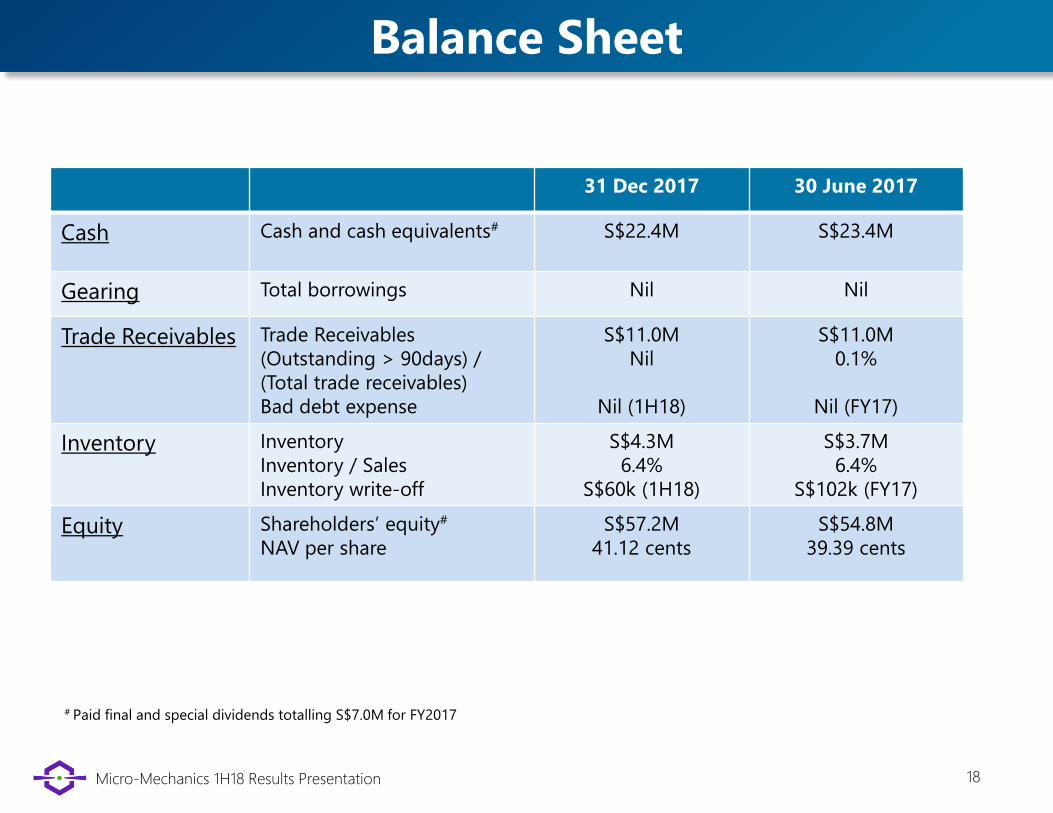
31 Dec 2017 30 June 2017
Cash Cash and cash equivalents# S$22.4M S$23.4M
Gearing Total borrowings Nil Nil
Trade Receivables Trade Receivables(Outstanding > 90days) / (Total trade receivables)Bad debt expense
S$11.0MNil
Nil (1H18)
S$11.0M0.1%
Nil (FY17)
Inventory InventoryInventory / Sales Inventory write-off
S$4.3M6.4%
S$60k (1H18)
S$3.7M6.4%
S$102k (FY17)
Equity Shareholders’ equity#
NAV per shareS$57.2M
41.12 centsS$54.8M
39.39 cents
# Paid final and special dividends totalling S$7.0M for FY2017
Balance Sheet
Micro-Mechanics 1H18 Results Presentation 19
Chris Borch, CEO
Key Takeaway
perfect parts and tools, on time, every time
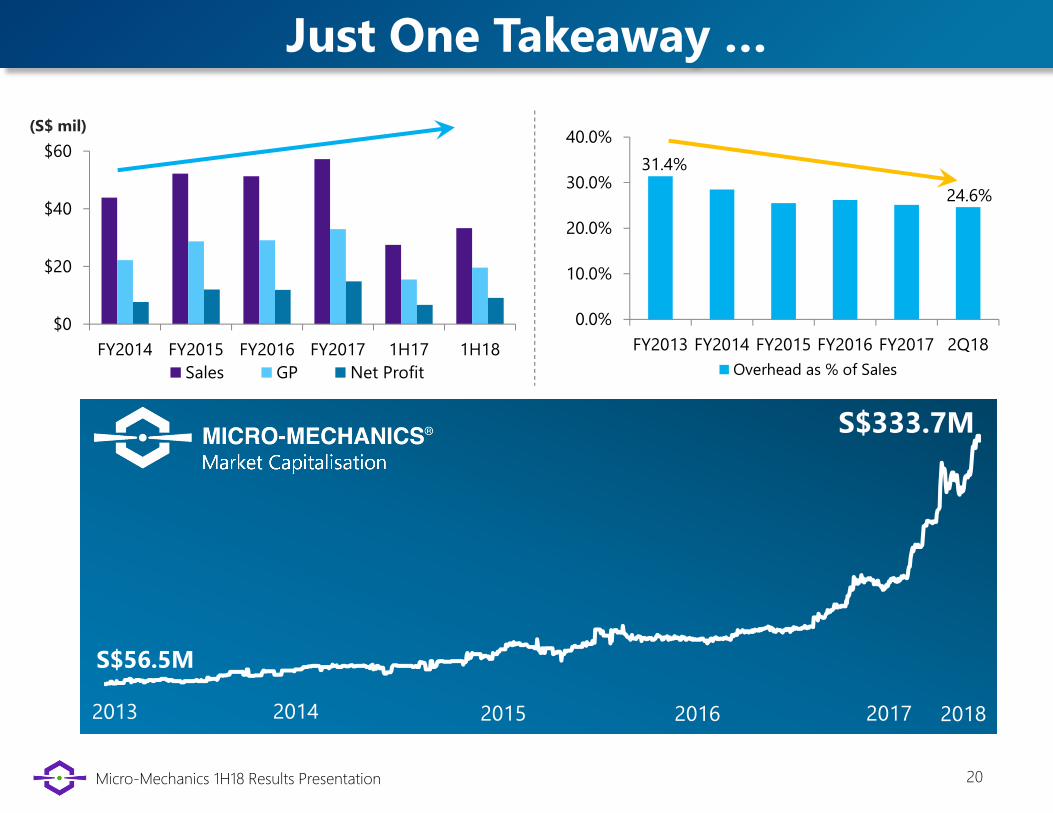
Micro-Mechanics 1H18 Results Presentation 20
$0
$20
$40
$60
FY2014 FY2015 FY2016 FY2017 1H17 1H18
Sales GP Net Profit
31.4%
24.6%
0.0%
10.0%
20.0%
30.0%
40.0%
FY2013 FY2014 FY2015 FY2016 FY2017 2Q18
Overhead as % of Sales
Just One Takeaway …
(S$ mil)
2013 2014 2015 2016 2017 2018
S$56.5M
Market Capitalisation
S$333.7M
Micro-Mechanics 1H18 Results Presentation 21
This presentation contains certain statements that are not statements of historical fact, i.e. forward-looking statements.Investors can identify some of these statements by forward-looking items such as ‘expect’, ‘believe’, ‘plan’, ‘intend’,‘estimate’, ‘anticipate’, ‘may’, ‘will’, ‘would’, and ‘could’ or similar words. However, you should note that these words arenot the exclusive means of identifying forward-looking statements. These forward-looking statements are based oncurrent expectations, projections and assumptions about future events. Although Micro-Mechanics (Holdings) Ltd.believes that these expectations, projections, and assumptions are reasonable, these forward-looking statements aresubject to the risks (whether known or unknown), uncertainties and assumptions about Micro-Mechanics (Holdings) Ltd.and its business operations.
Some of the key factors that could cause such differences are, among others, the following:• changes in the political, social and economic conditions and regulatory environment in the jurisdictions where weconduct business or expect to conduct business;• the risk that we may be unable to realise our anticipated growth strategies and expected internal growth;• changes in and new developments in technologies and trends;• changes in currency exchange rates;• changes in customer preferences and needs;• changes in competitive conditions in the semiconductor industry and our ability to compete under these conditions;• changes in pricing for our products; and• changes in our future capital needs and the availability of financing and capital to fund these needs.
Given these risks, uncertainties and assumptions, the forward-looking events referred to in this presentation may notoccur and actual results may differ materially from those expressly or impliedly anticipated in these forward-lookingstatements. Investors are advised not to place undue reliance on these forward-looking statements.
Investors should assume that the information in this presentation is accurate only as of the date it is issued. Micro-Mechanics (Holdings) Ltd.’s business, financial conditions, results of operations and prospects may have changed sincethat day. Micro-Mechanics (Holdings) Ltd. has no obligation to update or revise any forward-looking statement, whetheras a result of new information, future events or otherwise, except as required by law.
Safe Harbour for Forward-Looking Statements
31 Kaki Bukit PlaceEunos TechparkSingapore 416209www.micro-mechanics.com
Octant ConsultingTel (65) 6296 [email protected] / [email protected]
INVESTOR RELATIONS CONTACT