1h2017 financial results analyst & media...
TRANSCRIPT

1H2017 Financial Results
Analyst & Media Briefing
Datuk Seri TajuddinAtanChief Executive Officer
Rosidah BaharomChief Financial Officer
26 July 2017

2
Agenda
Key Financial Highlights & Market Performance
Financial Review
Highlights & Conclusion
Appendices

3
Key Financial Highlights & Market Performance
Financial Highlights for 1H2017
Half Yearly Financial Trend
Securities Market Overview
Derivatives Market Overview
Islamic Capital Market Overview

4
Financial Highlights for 1H2017Stellar financial results driven by better performance from Securities Market
Higher operating revenue contributed by higher trades in the Securities Market.
Higher operating expenses mainly due to increase in staff cost and technology cost.
Interim and special dividends of 20 sen and 15 sen respectively. The entitlement and
payment dates for the dividends are 10th and 23rd August 2017.
1H2017 vs. 1H2016:
Financial Items 1H2017 1H2016
1H2017
vs.
1H2016
Operating Revenue (RM million) 269.4 248.4 8.5%
Operating Expenses (RM million) 124.9 123.6 1.0%
PATAMI (RM million) 116.2 99.4 16.9%
EPS (sen) 21.7 18.6 16.7%
Cost to Income Ratio 44% 47% 3 percentage points
Annualised ROE 26% 25% 1 percentage point

5
18
16
18
17
21
19
23
27
25 26
25
22
26
50
52
48
50
45
52
48
44
46 46 47
46
44
200
181 197 191
224 216
231 241
240 247 248
225
269
77 67
78 72
93
80
92 106
97 102 99 95
116
1H2011 2H2011 1H2012 2H2012 1H2013 2H2013 1H2014 2H2014 1H2015 2H2015 1H2016 2H2016 1H2017
Half Yearly Financial TrendHighest first half operating revenue since listing
Operating Revenue
(RM mil)
PATAMI
(RM mil)
Cost to Income
Ratio (%)ROE (%)

6
965
1,383
413
593532
522
1H2016 1H2017
1,910
2,498
28
35
1,660
1,838
1H2016 1H2017
10.7%
Securities Market OverviewHigher trades backed by improved market sentiments
Average Daily Value (“ADV”)
(OMT)(RM mil)
Market Capitalisation (RM bil) Fund Raised from New Listings &
Secondary Market (RM bil)
Velocity (%)
1,654
1,764
FBMKLCI
0.4
3.5
7.0
5.0
1H2016 1H2017
7.4
8.5
No. of New Listing
Fund raised from new listings
Fund raised from secondary market
ADV - Domestic Institutions
ADV - Retail
ADV - Foreign Institutions Market Capitalisation
5
8
14.9%30.8%

7
12,057 9,095
47,475
50,482
258 241
1H2016 1H2017
ADC - Crude Palm Oil Futures
Volatility of Crude Palm Oil
Prices
Derivatives Market Overview6% growth in FCPO contracts Y-o-Y
ADC - OthersADC – FBMKLCI Futures
Volatility of FBMKLCI
11%7%
79%
20%
Average Daily Contracts (“ADC”)
& VolatilityOpen Interest (No. of Contract)
84%
15%
0.1%
30 June
2016
292,81731 Mar
2017
262,155
30 June
2017
263,260
1 Sept 2010
111,548
31 Dec 2015
230,376
1%
59,81859,790
1%
19%20%

8
Islamic Capital Market OverviewStronger growth in trade value from foreign participants
24.1 24.5
29.230.6
30 JUNE 2016 30 JUNE 2017
53.355.1
14.4 14.3
2.63.8
1H2016 1H2017
17.0
18.1
6.5%
116
135
No. of Shariah Compliant
Stocks (%)
No. of Trading
Participants
Bursa Suq Al-Sila’ (“BSAS”)
ADV (RM bil)
Market Capitalisation of
Shariah Compliant Stocks
(RM bil)
No. of Sukuk
Value of Listed Sukuk (USD bil)
74%75%
23 25
3.4%
Domestic ForeignMarket Capitalisation of
Shariah Compliant Stocks
Domestic Foreign
1,0341,131
9.4%
30 JUNE 2016 30 JUNE 2017

9
Financial Review
Financial Snapshot
Operating Revenue
Operating Expenses
Dividends

10
49.559.5
99.4
116.2
2Q2016 2Q2017 1H2016 1H2017
122.2134.8
248.4
269.4
2Q2016 2Q2017 1H2016 1H2017
16.9%
8.5%
10.3%
60.3 61.1
123.6 124.9
2Q2016 2Q2017 1H2016 1H2017
1.3%
Financial SnapshotImproved performance for first half of 2017
Operating revenue (RM mil) Operating expenses (RM mil)
PATAMI (RM mil)
46
43
47
44
2Q2016 2Q2017 1H2016 1H2017
Cost to income ratio (%)
3 percentage points
1.0%
3 percentage points
20.3%

11
Operating RevenueGrowth contributed by higher securities trading revenue
Increase in securities trading revenue mainly contributed by domestic trades.
Decrease in derivatives trading revenue was due to lower FKLI trades and also the
downward revision in the guarantee fee rate from 0.5% to 0.3%.
Lower BSAS trading revenue despite growth in its ADV due to volume discount
incentives given.
(RM mil)
112.6138.8
46.1
40.78.8
7.827.0
28.319.6
20.317.9
17.110.6
10.45.8
6.0
1H2016 1H2017
8.5%
Total
RM269.4mil
Total
RM248.4 milGrowth contribution by revenue streams:
248.4
269.4
+ 26.2 - 5.4
- 1.0
4.9%
+ 0.7 - 0.8 - 0.2 + 0.2
1H2016 1H2017
+ 1.3
23.3%
11.9%
3.7%11.7% 1.8%
4.5%4.4%
Securities Trading Revenue
Derivatives Trading Revenue
Listing & Issuer Services
Depository Services
Market Data
Member Services & Connectivity
BSAS Trading Revenue
Conference Fee & Exhibition
Related Income

12
66.6 68.5
12.1 12.1
6.5 5.58.4 9.8
11.813.4
18.2 15.6
1H2016 1H2017
Total
RM123.6 mil
Total
RM124.9 mil
1.0%
(RM mil)
Operating Expenses1H2017 operating expenses increased marginally by 1%
Movement of expenses:
Note^ - Other operating expenses include building maintenance, administrative expenses and CDS expenses.
Increase in staff cost due to annual salary increment.
Increase in service fees due to higher exchange rate.
Higher IT maintenance subsequent to commencement of maintenance for new
enterprise systems.
Lower other operating expenses as 1H2016 included a one-off consultancy fees.
1H2016 1H2017
123.6
+ 1.9 - 1.0 + 1.4 124.9
+ 1.6 - 2.6
2.8%15.5% 16.0%
13.3% 13.8%
Staff costs
Depreciation & amortisation
Marketing & development
IT maintenance
Service fees
Other operating expenses^

13
0.0
1.0
2.0
3.0
4.0
5.0
6.0
7.0
YT
L C
orp
Bri
tish
Am
eri
can T
obacco
Mala
yan B
ankin
g
KLC
CP S
taple
d G
roup
DiG
i.C
om
HA
P S
eng C
onso
lidate
d
West
port
s H
old
ings
Ast
ro M
ala
ysi
a H
old
ings
Maxis
AM
MB H
old
ings
Petr
onas
Gas
CIM
B G
roup H
old
ings
Tele
kom
Mala
ysi
a
Petr
onas
Dagangan
MIS
C
Sim
e D
arb
y
Tenaga N
asi
onal
Petr
onas
Chem
icals
Gro
up
Public B
ank
Hong L
eong B
ank
RH
B B
ank
IJM
Corp
Hong L
eong F
inancia
l G
roup
PPB G
roup
Kuala
Lum
pur
Kepong
IOI C
orp
Axia
ta G
roup
Genti
ng M
ala
ysi
a
Genti
ng
IHH
Healt
hcare
BU
RSA
MA
LA
YSIA
Dividend Yield (annualised) – Bursa vs. FBMKLCI Constituents
@ 30 June 2017
5.4
Source: Bloomberg and Bursa Malaysia
16.0 16.0 16.5 17.0 20.0
16.0 18.0 18.0 17.0
20.020.0
15.0
2013 2014 2015 2016 1H2017
Payout
98% *
Special Dividend (sen)Final Dividend (sen)
* Exclude special dividend
Payout
94%
Payout
92% *
Payout
93%
Interim and special dividend of 20 sen and 15 sen respectively. The entitlement and payment dates for the
dividends are on the 10th and 23rd of August 2017.
Interim Dividend (sen)
DividendsSpecial dividend for our valued shareholders
%
Payout
93%*

14
Highlights & Conclusion
Highlights of 1H2017 Initiatives
Moving Forward
15
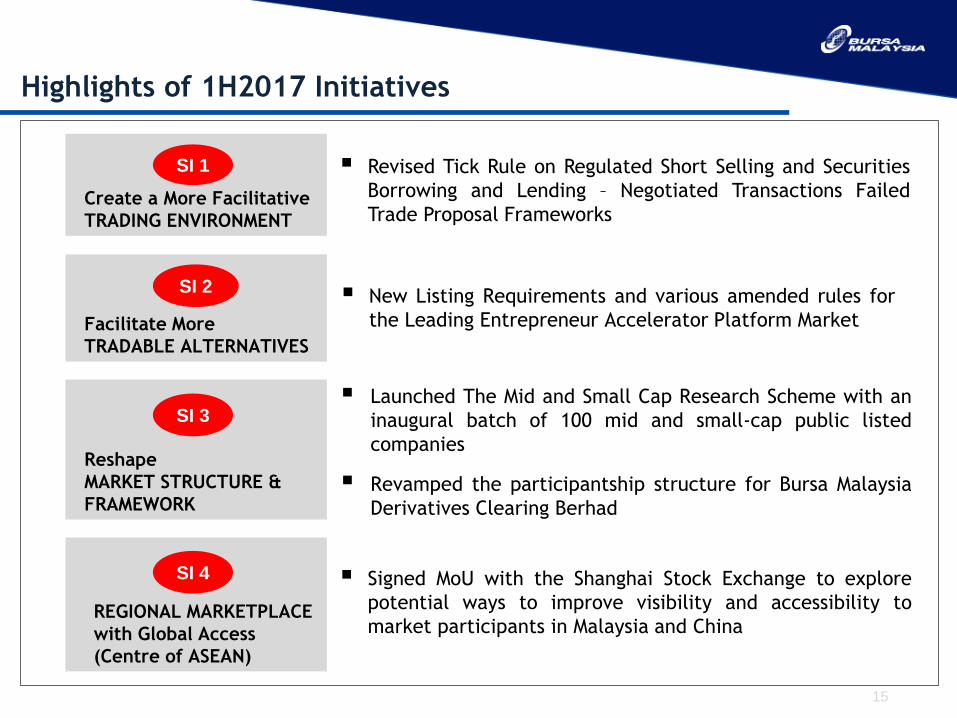
Highlights of 1H2017 Initiatives
Create a More Facilitative
TRADING ENVIRONMENT
SI 1
REGIONAL MARKETPLACE
with Global Access
(Centre of ASEAN)
Revised Tick Rule on Regulated Short Selling and Securities
Borrowing and Lending – Negotiated Transactions Failed
Trade Proposal Frameworks
Facilitate More
TRADABLE ALTERNATIVES
New Listing Requirements and various amended rules for
the Leading Entrepreneur Accelerator Platform Market
Launched The Mid and Small Cap Research Scheme with an
inaugural batch of 100 mid and small-cap public listed
companies
Revamped the participantship structure for Bursa Malaysia
Derivatives Clearing Berhad
Reshape
MARKET STRUCTURE &
FRAMEWORK
SI 2
SI 3
SI 4 Signed MoU with the Shanghai Stock Exchange to explore
potential ways to improve visibility and accessibility to
market participants in Malaysia and China

16
Moving Forward
SECURITIES MARKET• The Securities Market trading activities for the first half of 2017 registered strong Average Daily Trading
Value.
• The momentum of Securities Market performance is forecasted to continue with the expected
improvements in the global as well as domestic economic conditions.
DERIVATIVES MARKET• Improved oil palm fruit harvest and volatility in the FBMKLCI will continue to underpin trading and
hedging of FCPO and FKLI contracts respectively.
ISLAMIC CAPITAL MARKET• Bursa Suq Al-Sila’ continues to show progress with new participants from financial institutions in Africa,
Central Asia and South America. Bursa Malaysia will continue with its efforts to expand its niche in these
regions and globally.
• Bursa Malaysia-i will further intensify its efforts to promote Shariah investing and to focus on forging
collaborations with capital market participants to spur the growth and vibrancy of Islamic Capital Market
domestically and regionally.
Bursa Malaysia will continue its efforts to make the Malaysian capital markets attractive and anticipates an
improved performance for the current financial year.

17
1H2017 Financial Results Analyst & Media Briefing
Q&A

18
Appendices
Securities Market Trading Activity
Securities Market Trading Participation
Securities Market Foreign Ownership
Foreign Inflow/Outflow
Derivatives Market Activity
Derivatives Market Demography
Islamic Capital Market Activity

19
1,435
1,209 1,387
1,793
2,161
1,579 1,732
1,341
1,841
1,439 1,595
1,430
1,643
2,308
2,002
1,686
2,068 2,053 2,196
1,901 2,081
1,913 1,933 2,042 1,981
1,842 1,740 1,690
2,378
2,621
1Q10 2Q10 3Q10 4Q10 1Q11 2Q11 3Q11 4Q11 1Q12 2Q12 3Q12 4Q12 1Q13 2Q13 3Q13 4Q13 1Q14 2Q14 3Q14 4Q14 1Q15 2Q15 3Q15 4Q15 1Q16 2Q16 3Q16 4Q16 1Q17 2Q17
35
2831
3742
3034
27
34
27 2825
28
3731
2530 29 30 28 30 28 29 30 29 27 26 25
34 35
53
34 34 33 3328 30 29 30 27
35
2,179
1,181 1,129 1,454
1,699 1,573 1,915
2,053 1,991 1,812
2,498
2007 2008 2009 2010 2011 2012 2013 2014 2015 2016 1H17
Turnover Velocity (%)
Quarterly ADV Traded & Velocity
Average Daily Value Traded (OMT, RM mil)
Average Daily Value Traded (OMT, RM mil)Turnover Velocity (%)
Annual ADV Traded & Velocity
Securities Market Trading Activity
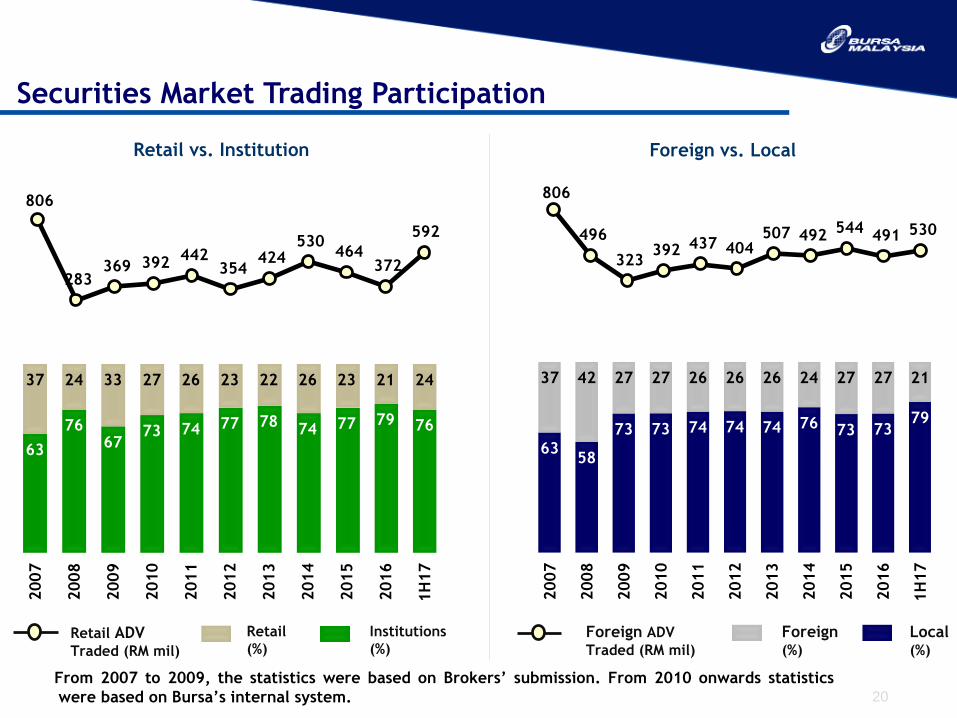
20
806
283 369 392
442 354
424 530
464 372
592
63
7667
73 74 77 7874 77 79 76
37 24 33 27 26 23 22 26 23 21 24
2007
2008
2009
2010
2011
2012
2013
2014
2015
2016
1H
17
6358
73 73 74 74 74 76 73 7379
37 42 27 27 26 26 26 24 27 27 21
2007
2008
2009
2010
2011
2012
2013
2014
2015
2016
1H
17
From 2007 to 2009, the statistics were based on Brokers’ submission. From 2010 onwards statistics
were based on Bursa’s internal system.
Retail
(%)
Institutions
(%)Local(%)
Foreign(%)
Retail ADVTraded (RM mil)
Foreign ADV
Traded (RM mil)
Retail vs. Institution Foreign vs. Local
Securities Market Trading Participation
806
496
323 392 437 404
507 492 544
491 530

21
Securities Market Foreign Ownership
22.3
23.1
24.4
24.0
24.3
22.8
22.3
22.5
23.0 23.0 23.022.8
23.023.1
22.8 22.8
22.6
22.3 22.3 22.3 22.4
22.7
22.923.0
Based on Market Capitalisation (%)

22
Foreign Inflow/Outflow
Monthly foreign inflow/outflow from 2012 to June 2017
-1,760
1,021 1,605
-315-450
-3,934
-972
420 942
4,355
2,6101,977
359
-5,000
-4,000
-3,000
-2,000
-1,000
0
1,000
2,000
3,000
4,000
5,000Monthly foreign inflow/outflow from June 2016 to June 2017(RM mil)
2016
TNFO: RM3.2 bil
-10,000
-5,000
0
5,000
10,000
2015
TNFO: RM19.7 bil
2012
TNFI: RM13.6 bil
2013
TNFI: RM2.6 bil2014
TNFO: RM6.9 bil
TNFI: Total Net Foreign Inflow
(RM mil)
TNFO: Total Net Foreign Outflow
1H2017
TNFI: RM10.7 bil

23
2007
2008
2009
2010
2011
2012
2013
2014
2015
2016
1H
17
1Q
10
2Q
10
3Q
10
4Q
10
1Q
11
2Q
11
3Q
11
4Q
11
1Q
12
2Q
12
3Q
12
4Q
12
1Q
13
2Q
13
3Q
13
4Q
13
1Q
14
2Q
14
3Q
14
4Q
14
1Q
15
2Q
15
3Q
15
4Q
15
1Q
16
2Q
16
3Q
16
4Q
16
1Q
17
2Q
17
15
%
129
115 114
132
136
162
171
152
174
146
172
214
196
213204
196
218
239
288
196
207
229235
283
293
226237
262263
230
40
Quarterly Average Daily Contracts (’000)
31
42
35
60
Total Annual Contract (mil)
Crude Palm Oil FuturesOthersOpen Interest (’000)
15%
84%
6.2 6.1 6.1 6.2
8.4
9.6
FMBKLCI Futures
37
`
`
84
%32
34
444542
4642
10.7
50
12.5
44
54
Derivatives Market Activity
55
14.2
62
51
62
56
7.2
5856
62
55
as
125
156
123132
152
214196 196
230237
263
14.1
2423
2528
57
1%
1%

24
15 15 20 21 19 15 18 20 18 14 11
4146
5244
42
2828 24
23
1917
2
2
3
22
21 2
5
3
3
4237
2633
37
55 53 54 55
6469
2007 2008 2009 2010 2011 2012 2013 2014 2015 2016 1H17
(%)FKLI
25 27
36 34 34 36 33 34 31 28 26
3438
2726 24 19
17 1515
16 17
11
11
1 11
1
22 15 17
1513
12
10 15 2121 22
18 20 1925 28
3239
35 32 34 34
2007 2008 2009 2010 2011 2012 2013 2014 2015 2016 1H17
(%)FCPO
1
Local
Domestic Retail
Domestic
Institutions
Foreign Institutions Local
Domestic RetailDomestic
Institutions
Foreign Institutions Foreign Retail
Derivatives Market Demography

25
2011 2012 2013 2014 2015 2016 1H2017
BSAS Annual Average Daily Value
Local ADV Foreign ADV
1.22.3 3.9
6.9
15.2 16.3 18.1
14.3
3.8
13.3
(RM bil)
13.413.5
1.61.0
2.91.7
1.4
1.20.70.2
BSAS ADV (RM bil)
13.5
0.9
0.8 0.9 1.1 1.1 1.3 1.5 1.6 1.8 2.6 2.4 2.7 3.2 3.7 3.7 5.9
8.5 10.4
12.0 14.4
16.9 16.1
12.7 12.2 12.6 13.6 15.1
0.2 0.2 0.2 0.3 0.3 0.7 0.9 1.2
1.1 1.0 1.1 1.5 1.4 1.5
1.4
1.4
1.5
1.6
1.6
2.1 2.6
2.7 3.0 3.2 3.8
3.7
1Q
11
2Q
11
3Q
11
4Q
11
1Q
12
2Q
12
3Q
12
4Q
12
1Q
13
2Q
13
3Q
13
4Q
13
1Q
14
2Q
14
3Q
14
4Q
14
1Q
15
2Q
15
3Q
15
4Q
15
1Q
16
2Q
16
3Q
16
4Q
16
1Q
17
2Q
17
BSAS Quarterly Average Daily Value(RM bil)
5.5
2.7
Islamic Capital Market Activity

DISCLAIMER:
Bursa Malaysia and its Group of Companies (the Company) reserve all proprietary rights to the contents of this presentation. Whilst the company endeavors to ensure that
the contents in this presentation are accurate, complete or have been obtained from sources believed by the Company to be accurate and reliable, neither the Company
nor the presenter make any warranty, express or implied, nor assume any legal liability or responsibility for the accuracy, completeness or currency of the contents of this
presentation. In no event shall the Company be liable for any claim, howsoever arising, out of or in relation to this presentation.
Copyright Bursa Malaysia Berhad 2017 (30632-P)
www.bursamalaysia.com
RASMONA ABDUL RAHMAN
603-2034 7175
E-mail : [email protected]
RAFIDAH AZIZ
603-2034 7262
ADAM ISKANDAR AHMAD ZAHAR
603-2034 7351
INVESTOR RELATIONS CONTACT INFORMATION