1ke cotton situation - cornell...
TRANSCRIPT

1ke COTTON SITUATION cs- 186
COTTON: FOREIGN PRODUCTION AND CONSUMPTION
MIL. BALES Consumptio~ Production _E
0 1947-48 '50-51 '53-54 '56-57 '59-60*
YE.A.R BEGINNING AUGUST J SALES OF 500 POUNDS GROSS WEIGHT
CONSUMPTION INCLUDES DESTROYED COTTON *ESTIMA.TED
U.S. DEPARTMENT OF AGRICULTURE
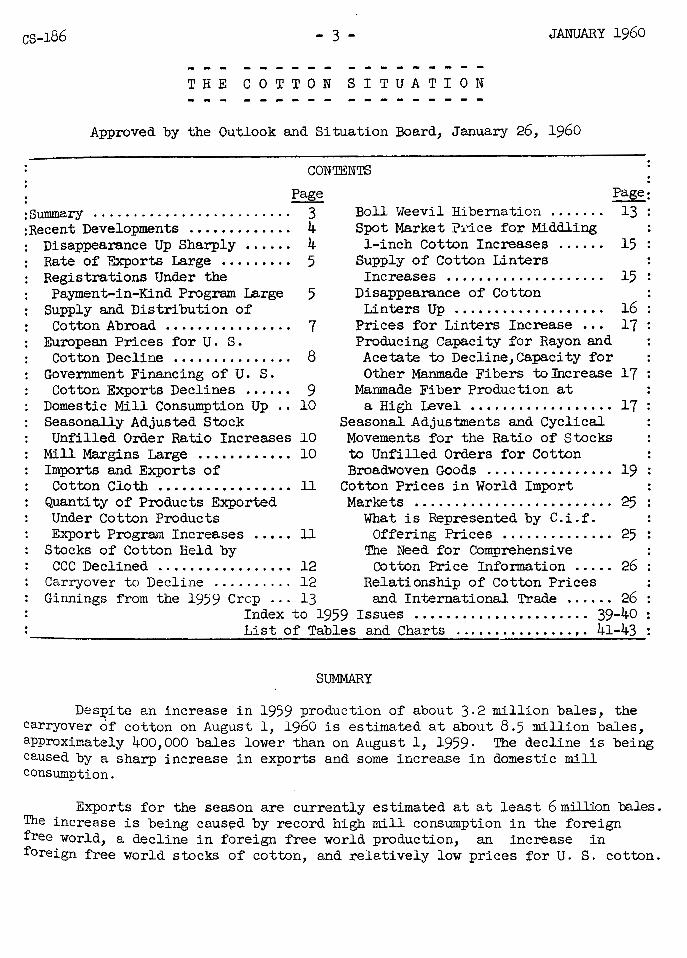
Production of cotton abroad in 1959-60 is decreasing from that of the preceding season for the first time since World War IL At the same time, consumption abroad is increasing to a record high. The,gap
NEG. 7499-59 (9) AGRICULTURAL MARKETING SERVICE
between the large consumption and the smaller production is one factor in sharply larger U. S. exports--up to at least 6 million bales in 1959-60 from 2. 8 million in 1958-59.
Published bimonthly by
AGRICULTURAL MARKETING SERVICE
UNI,TED STATES DEPARTMENT OF AGRICULTURE

Cotton Situation at a Glance
Item
Prices, received by farmers for Am. Upland (mid-month) Parity price for Am. Upland •••••••••••••••••••••••••••• : Farm price as a percentage of parity •••••••••••••••••••• : Average 14 spot market price Middling 1 inch •••••••••••• : Average price for 20 constructions, gray goods •••••••••• : Average price cotton used in 20 constructions ••••••••••• : Mill margins for 20 constructions ••••••••••••••••••••••• :
BLS wholesale price index All ccamnodities ••••••••••••••••••••••••••••••••••••••• : Cotton broadwoven goods ............................... :
Index of industrial production : Overall, including utilities (adjusted) 2/ •••.••• : •••• : Textiles, products and apparel (adJusted) •••••••••••• :
Personal income payments (adjusted)., •••••••• , •••••••••• : Retail store sales (apparel group adJusted) •••••••••••• :
Mill cons~tion of all kinds of cotton 3/ .•••••.••••••• : Mill cons~tion, daily rate (unadjusted) zJ ............ : Mill cons~tion, daily rate (adjusted) zJ .............. : Spindles in place end of month in cotton system ••••••••• :
Spindles consuming 100 percent cotton ••••••••••••••••• : Spindles idle ......................................... :
Gross hourly earnings in broadwoven goods£~ •••••••••••• : Mill stocks * unfilled orders,cotton broadwoven goods 1/:
E~orts of cotton ....................................... : Exports of cotton since August 1 •••••••••••••••••••••••• : Illqlorts of cotton ....................................... : Illqlorts of cotton since August 1 •••••••••••••••••••••••• :
Unit
Cents Cents
Percent Cents Cents Cents Cents
1947-49 = 100 do.
1947-49 = 100 do.
Billion dolla,rs Million dollars
1,000 bales 1,000 bales 1,000 bales
ThoUsands Thousands' Thousands
Dollars Percent
1,000 bales 1,000 bales
Bales Bales
Mill stocks end of month ................................ : 1,000 bales Stocks, public storage, etc ... , .......................... : 1,000 bales
Linters prices §/ Grade 2, Staple 2 ..................................... : Cents Grade 4, Staple 4 ..................................... : Cents Grade 6, Staple 6 ..................................... : Cents
Rayon prices Viscose yarn, 150 denier .............................. : Staple fiber, viscose~ denier ••••••••••••••••••••••• : Acetate yarn, 150 denier •••••••••••••••••••••••••••••• :
Cents Cents Cents
October
33.26 38.80 86 34.75 57.14 34.98 22.16
ll9.0 84.3
146 ll1 364.3
1,068
!:t/839.1 33.6 31.8
20,697 17,650 1,418
1.44 52
181.4 602.0
12,356 :120,648
1,348.6 10,316.6
8.42 6.25 4.36
76 31 77
1958
November
32.38 38.93 83 34.75 58.13 34.77 23.36
119.2 84.6
150 110 367.5
1,033
671.6 33.6 31.9
20,726 17,611 1,457
1.45 42
313.9 915.9 472
121,120
1,428.2 12,035·7
8.40 6.06 5.34
76 31 77
December
30.29 38.93 78 34.41 58.98 33.92 25.06
119.2 85.6
151 110 366.9
1,101
l.J:/720.2 28.8
20,681 17,616 1,405
1.45 38
297.8 1,213.7
809 121,929
1,545·5 12,795.8
8.11 5·97 4.31
76 31 77
October
32.51 37.80 86 31.66 64.81 32.20 32.61
119.1 90.7
155 . 122 382.3
1,079
732.2 36.6 34.7
20,269 17,648
996
1..54 21
392.1 720.4
1,550 123,288
976.3 12,468.4
7.88 5.88 3.94
82 33 74
1959
November
30.84 37.93 81 31.61 65.59 32.55 33.04
118.9 92.2
156 121 384.8
725.5 36.3 34.5
20,317 17,696 1,009
20
651.5 1,371.9
216 123,504
1,263.6 14,235·5
7.89 5.90 3.91
82 33 74
December !J
30.03 37·93 79
66.37 33.17 33.20
ll8.9
165
l.J:/799•9 32.0 34.3
20,111 17,709
785
1,572· 7 13,690.6
7·96 6.08 4.12
1/ Preliminary. 2/ Revised indexes. }/ 4..:-wee:k periocCexcept as noted.---!£1 5-week period. 7r-End of month. 87 Average of specified grades and staples at four markets.
5/ 5-day week. b/ Cotton, silk and synthetic fibers
() u.>
~
1\)
~ I<;
1-' '8, 0
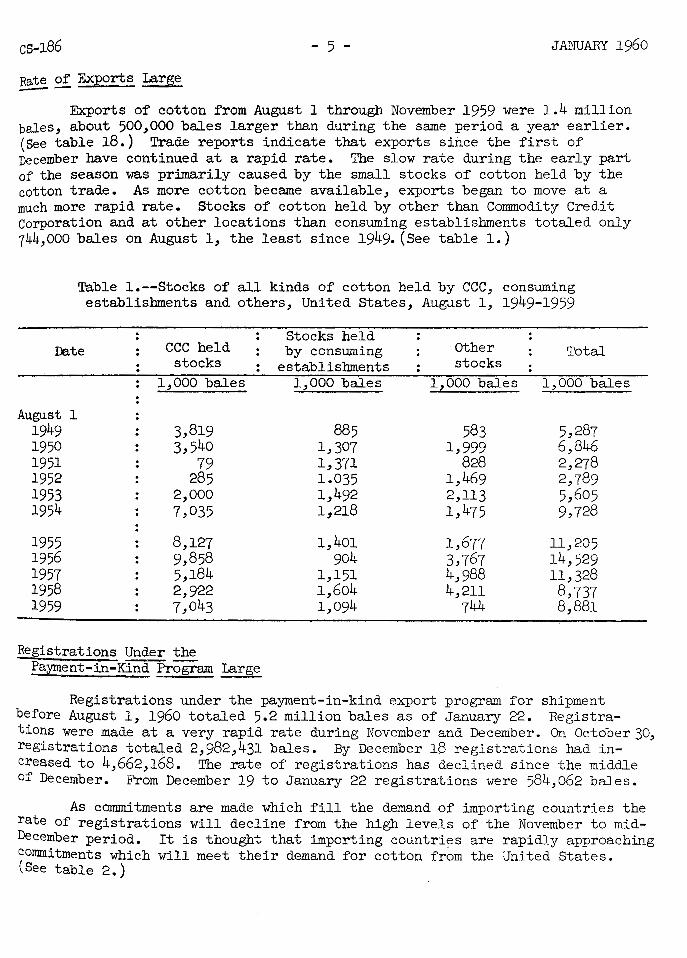
cs-186 - 3 - JANUARY 1960
THE COTTON SITUATION - - ~ - - - - - - - - - - - -
Approved by the Outlook and Situation Board, January 26, 1960
CONTENTS . . Page Page:
:Summary . · .. · ·. · · · · · · · · · · · · · · · · · · 3 :Recent Developments •••••••••.••• 4
Disappearance Up Sharply • • • . . • 4 Rate of Exports Large •.••.••.• 5 Registrations Under the Payment-in-Kind Program Large 5
Supply and Distribution of Cotton Abroad • . • • . • • • • . • • • • . • 7
European Prices for u. S. Cotton Decline •••••.•••.•..•• 8
Government Financing of u. s. Cotton Exports Declines • • • • • • 9
Domestic Mill Consumption Up • . 10 Seasonally Adjusted Stock Unfilled Order Ratio Increases 10
Mill Margins Large •••••••••••• 10 Imports and Exports of Cotton Cloth • • • • • • . • • • • . . • • • • ll
Quantity of Products Exported Under Cotton Products
Boll Weevil Hibernation ••••.•• Spot Market P:dce for Middling l-inch Cotton Increases •....•
Supply of Cotton Linters Increases ................... .
Disappearance of Cotton
13
15
15
Linters Up • • • • . • • . . • • • • . • • • • . 16 Prices for Linters Increase • • • 17 Producing Capacity for Rayon and Acetate to Decline,Capacity for Other Manmade Fibers to Increase 17
Manmade Fiber Production at a High Level • • • . • . . . • . • • • • • • . • 17
Seasonal Adjustments and Cyclical Movements for the Ratio of Stocks to Unfilled Orders for Cotton Broadwoven Goods .••••••••••••••• 19
Cotton Prices in World Import Markets . . . . . . • . . . . . . . . . . • . . . . . . . 25
What is Represented by C. i. f. Export Program Increases •.•.. ll Offering Prices •.•.•.••.••••• 25
Stocks of Cotton Held by The Need for Comprehensive CCC Declined ••••.•••••••••••• 12 Cotton Price Information •.••. 26
Carryover to Decline .......... 12 Relationship of Cotton Prices Ginnings from the 1959 Crop . . . 13 and International Trade • . . . . • 26
Index to 1959 Issues •.•••••••.••..••.•.••• 39-40 List of Tables and Charts ...•••••••••... ,. 41-43
SUMMARY
Despite an increase in 1959 production of about 3.2 million bales, the carryover of cotton on August 1, 1960 is estimated at about 8.5 million bales, approximately 400,000 bales lower than on August 1, 1959. The decline is being caused by a sharp increase in exports and some increase in domestic mill consumption.
Exports for the season are currently estimated at at least 6miLUDn bales. The increase is being caus~d by record high mill consumption in the foreign free world, a decline in foreign free world production, an increase in foreign free world stocks of cotton, and relatively low prices for u. S. cotton.

cs-186 - 4 - JANUARY 1960
The decline in foreign free world production is occurring principally in Mexico and Central America because of smaller acreage. The increase in foreign free world cotton consumption reflects larger sales of textiles than a year earlier, a replenishment of textile stocks in some countries, and lower cotton prices at the start of the season. Prices for cotton abroad have increased recently. The high level of cotton consumption and the relatively low prices for u. S. cotton are being accompanied by an increase in cotton stocks in the foreign free world from the low level of 1959.
Domestic mill consumption of cotton is estimated at about 9 million bales for the 1959-60 season compared with 8.7 million in 1958-59· This is a projection of the seasonally adjusted rate of consumption during the first 5 months of the current season. frices for gray goods and the mill margins are at high levels and the ratio of stocks to unfilled orders for broadwoven goods is relatively low. However, the seasonally adjusted stock-unfilled order ratio turned upward in November. If the rise continues, it may foreshadow some decline in mill activity later in 1960.
Stocks of cotton held by CCC (owned and held as collateral against outstanding price support loans) totaled about 6 million bales as of January 15. This compares with about 7 million bales a year earlier and on August 1, 1959. As of January 15, CCC had purchased about 8.2 million bales under the Choice A program of price support and had sold about 5.8 million of such cotton.
The average 14 spot market price for Middling l-inch cotton on January 22 had increased to 31.91 cents per pound from the seasonal low of 31.58 cents per pound at the end of October. However, the January 22 price was well below the 34.30 cents per pound on the same date a year earlier. Discounts for the lower grades of white cotton and for the colored grades have narrowed considerably during the current season and some of this cotton is selling for prices well above a year earlier.
RECENT DEVELOPMENTS
Disappearance Up Sharply
Disappearance of cotton during the 1959-60 marketing year is estimated to be at least 15 million bales. This is at least 3·5 million bales or 30 percent above disappearance in the preceding marketlng year. Except for 1956-57, disappearance during 1959-60 will be the largest since 1928.
The increase in disappearance is resulting primarily from larger exports, though domestic mill consumption also is expected to increase. Exports during 1959-60 are expected to be at least 6 million bales, compared with 2.8 million a year earlier. Domestic mill consumption is expected to be about 9 million bales compared with 8.7 million a year earlier.
cs-186 - 5 - JANUARY 1960
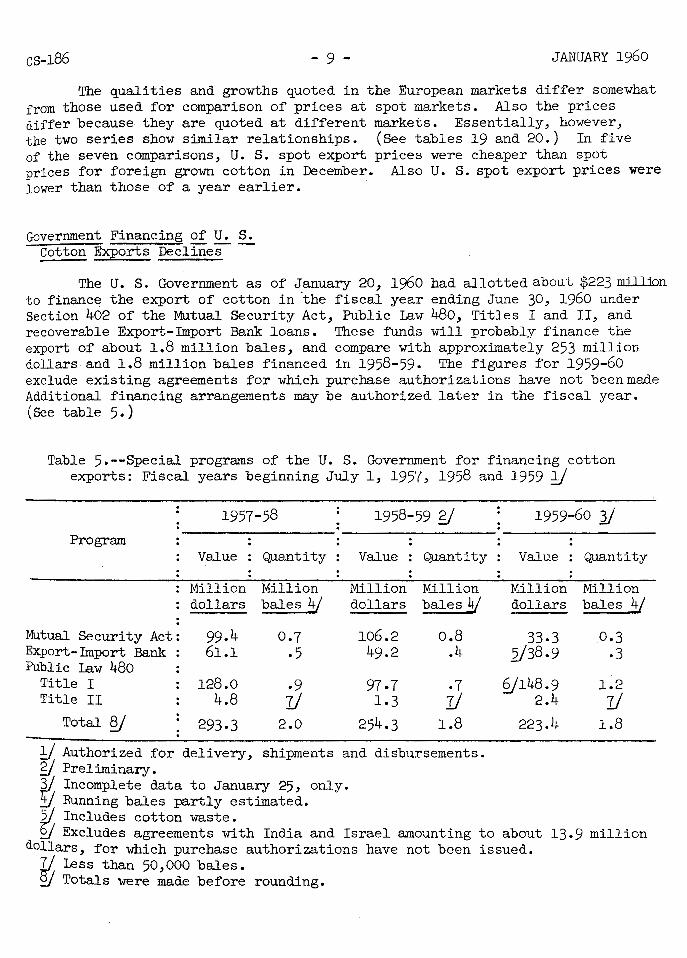
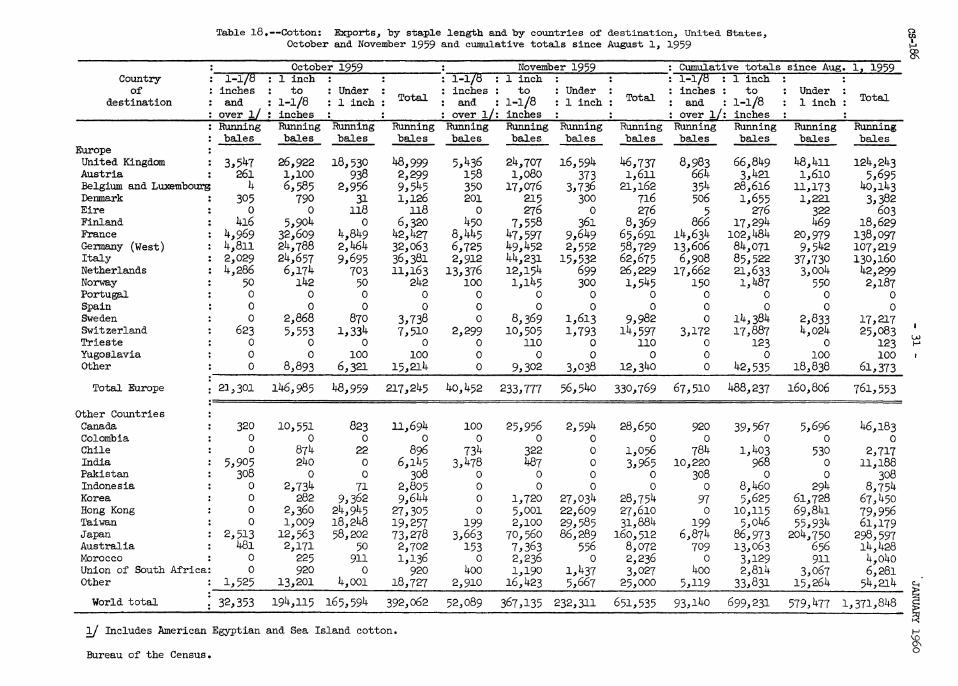
Rate of Exports Large --Exports of cotton from August 1 through November 1959 were 1.4 million
bales, about 500,000 bales larger than during the same period a year earlier. (See table 18.) Trade reports indicate that exports since the first of December have continued at a rapid rate. The slow rate during the early part of the season was primarily caused by the small stocks of cotton held by the cotton trade. As more cotton became available, exports began to move at a much more rapid rate. Stocks of cotton held by other than Commodity Credit Corporation and at other locations than consuming establishments totaled only 744,000 bales on August l, the least since 1949. (See table l.)
Table 1.--Stocks of all kinds of cotton held by CCC, consuming establishments and others, United States, August l, 1949-1959
Date
August l 1949 1950 1951 1952 1953 1954
1955 1956 1957 1958 1959
CCC held stocks
1,000 bales
3,819 3,540
79 285
2,000 7,035
8,127 9,858 5,184 2,922 7,043
Registrations Under the . Payment-in-Kind Program Large
Stocks held by consuming
establishments 1,000 bales
885 1,307 1,371 1.035 1,492 1,218
1,401 904
1,151 1,604 1,094
other Total stocks
1,000 bales 1,000 bales
583 5,287 1,999 6,846
828 2,278 1,469 2,789 2,113 5,605 1,475 9,728
1,677 11,205 3,767 14,529 4,988 11,328 4,211 8, 737
744 8,881
Registrations under the payment-in-kind export program for shipment before August l, 1960 totaled 5.2 million bales as of January 22. Registrations were made at a very rapid rate during November and December. On October30, registrations totaled 2,982,431 bales. By December 18 registrations had increased to 4,662,168. The rate of registrations has declined since the middle of December. From December 19 to January 22 registrations were 584,062 bales.
As commitments are made which fill the demand of importing countries the rate of registrations will decline from the high levels of the November to midDecember period. It is thought that importing countries are rapidly approaching c(ommitments which will meet their demand for cotton fr~m the United States. See table 2. )

CS-186 - 6 - JANUARY 1960
Table 2 .--Registrations under cotton export program: Payment-in-kind
Date
1959 May 7 - May 11 May 12 - May 25 May 26 - June 1
June 2 - June 12 June 13 - June 26 June 29 - July 10
July 13 - July 31
Aug. 1 - Aug. 7 Aug. 8 - Aug. 14 Aug. 15 - Aug. 21 Aug. 22 - Aug. 28 Aug. 29 - Sept. 4
Sept. 5 - Sept. 11 Sept. 12 - Sept. 18 Sept. 19 - Sept. 25 Sept. 26 - Oct. 2
Oct. 3 - Oct. 9 Oct. 10 - Oct. 16 Oct. 17 - Oct. 23 Oct. 24 - Oct. 30 Oct. 31 - Nov. 6
Nov. 7 - Nov. 13 Nov. 14 - Nov. 20 Nov. 21 - Nov. 27 Nov. 28 -Dec. 4
Dec. ,4 - Dec. 11 Dec. 12 -Dec. 18 Dec. 19 - Dec. 25 Dec.26 -Jan. 1, 1960
1960 Jan. 2 - Jan. 8, 1960 Jan. 9 -Jan. 15, 1960 Jan.l6 - Jan. 22-
Commodity Stabilization Service.
Bales registered
19 ,18!~ 153,671 132,989
128,286 144,055 164,902
270,000
80,657 101,810
90,317 149,329 198,196
109,594 223,628 178,330 164,335
154,236 144,929 191,599 185,384 181,154
179,198 257,150 224,754 317,777
200,554 319,150 137,811 186,778
95,431 61,788
102,254
Cumulative from
May 7, 1959
19,184 172,855 305,844
!~3!~ ,130 575,185 740,087
1,010,087
1,090, 74~-1,192,554 1,282,871 1,432,200 1,630,396
1,739,990 1,963,618 2,141,948 2,306,283
2,460,519 2,605 ,!~48 2,797,047 2,982,431 3,163,585
3,342,783 3,599,933 3,824,687 4,142,464
4,343,018 4,662,168 4,799,979 4,986,757
5,082,188 5,143,976 5,246,230

cs-186
supply ~ Distribution -of Cotton Abroad
- 7 - JANUARY 1960
Consumption of cotton in the foreign free world during the 1959-60 season is expected to increase more than a mill:ion bales over that of 1959. The increase is being caused by a recovery from a textile recession of a year earlier and by lower world cotton prices. Along with the increase in consumption of cotton, production of cotton in the foreign free world declined slightly for the first time since World War II, and starting stocks of cotton were the lowest since 1956.
The high level of cotton consumption and the relatively low prices for U. S. cotton are being accompanied by an increase in cotton stocks in the foreign free world between August 1, 1959 and August 1, 1960. Because of the gap between foreign production and consumption, the increase in stocks is contributing to the increase in U. S. exports.
Table 3.--Cotton: Supply and distribution in the foreign free world, 1956-57 to date
Item 1956-57 1957-58 1958-59 y
Million Million Million bales bales bales
Starting carryover 8.1 9.6 10.1 Production 15.9 16.8 17.3 Imports from U. S. 7·6 5·7 2.8
Total supply 31.6 32.1 30.2
Consumption 21.0 20.4 20.2 Exports to U.S. , net exports
to Communist countries, and destroyed 1.0 ]/1.6 1.2
Total disappearance 22.0 22.0 21.4 Ending carryover 9.6 10.1 8.8
y Preliminary. Y Estimated. ~ Includes 0.1 million bales to correct for rounding of figures.
Foreign Agricultural Service.
1959-60 ygj
Million bales
8.8 16.9 6.0
31.7
21.5
l.l 22.6
9.1

CS-186
European Prices for U.S. Cotton DeCline
- 8 - JANUARY 1960
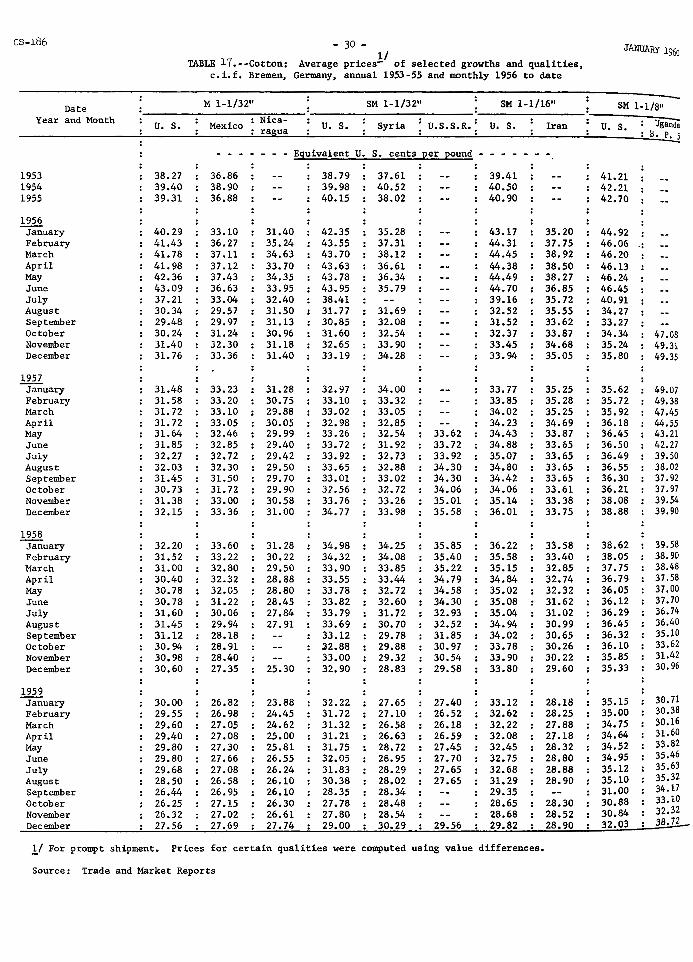
C.i.f. prices for United States Upland cotton at Liverpool and Bremen in December ~nerally were below those of a year earlier and below those for comparable qualities of foreign grown cotton. A year earlier, prices for U. s. cotton at these markets were generally above those for comparable qualities of foreign grown cotton. Prices for cotton abroad have increased recently. (See table 4.)
Table 4.--C.i.f. price: Liverpool and Bremen, United States and foreign grown cotton, December 1959 and 1958
Liverpool M 1 11 M l-lZ32" . SM l-lZ32 11 .
Date Pakistan u. s. u. s. u. s. Mexico . Nicaragua 289 F . (Cont.)
Equivalent £· s. cents per pound
Dec. 1959 26.87 31.75 28.04 28.10 27.98 29.41 Dec. 1958 29-58 29.00 31.18 26.29 25.17 32.51
Bremen Equivalent U. S. cents per pound
Dec. 1959 27.56 27.69 27 ·74 29.00 Dec. 1958 30.60 27.35 25.30 32.90
Liverpool SM l-lZ32 11 SM 1-Jj lb" SM 1-lZB" . . Uganda Syria U.S.S.R. u. s. Iran u. s. B.P. 52
Equivalent £· s. cents ~ pound
Dec. 1959 29.69 29.88 29.88 30.66 31.15 39-ll Dec. 1958 27.82 28.41 33·33 28.85 34.94 30.21
Bremen Equivalent U. S. cents ~ pound
Dec. 1959 30.29 29-56 29.82 28.90 32.03 38-72 Dec. 1958 28.83 29-58 33.80 29.60 35·33 30-96
The C.i.f. prices quoted above are a new price series, publication of which is started with this issue of The Cotton Situation. (See pa~ 25.)
cs-186 - 9 - JANUARY 1960
The qualities and growths quoted in the European markets differ somewhat from those used for comparison of prices at spot markets. Also the prices differ because they are quoted at different markets. Essentially, however, the two series show similar relationships. (See tables 19 and 20.) In five of the seven comparisons, U. S. spot export prices were cheaper than spot prices for foreign grown cotton in December. Also U. S. spot export prices were lower than those of a year earlier. ·
Government Financing of U. S. Cotton Exports Declines -
The U. S. Government as of January 20, 1960 had allotted about $223 million ·to finance the export of cotton in the fiscal year ending June 30, 1960 under Section 402 of the Mutual Security Act, Public law 480, Titles I and II, and recoverable Export-Import Bank loans. These funds will probably finance the export of about 1.8 million bales, and compare with approximately 253 million dollars and 1.8 million bales financed in 1958-59. The figures for 1959-60 exclude existing agreements for which purchase authorizations have not beenmade Additional financing arrangements may be authorized later in the fiscal year. (See table 5·)
Table 5.--Special programs of the u. S. Government for financing cotton exports: Fiscal years beginning July 1, 1957, 1958 and 1959 !/
1957-58 1958-59 gj Program
Value Quantity Value Quantity
Million Million Million Million dollars bales J;J dollars bales!;/
Mutual Security Act: 99.4 0.7 106.2 0.8 Export-Import Bank 61.1 ·5 49.2 .4 Public Law 480
Title I 128.0 -9 97·7 -7 Title II 4.8 II 1.3 II
Total ?) 293-3 2.0 254.3 1.8
!/ Authorized for delivery, shipments and disbursements. Y Preliminary. · 3/ Incomplete data to January 25, only. Tf.J Running bales partly estimated.
1959-60 Jl
Value Quantity
Million Million dollars bales!±/
33-3 0.3 2/38.9 ·3
§/148.9 1.2 2.4 II
223.4 1.8
5/ Includes cotton waste. ~ Excludes agreements with India and Israel amounting to about 13.9 million
dollars, for which purchase authorizations have not been issued. 7/ Less than 50,000 bales. rJ/ Totals were made before rounding.

CS-186 - 10 - JANUARY 1960
Domestic Mill Consumption ~
Consumption of cotton by domestic mills in the 1959-60 marketing year probably will be about 9 million bales. This compares with 8.7 million bales in 1958-59 and 8.0 in 1957-58.
Consumption from August 1 through January 2, 1959 was about 3.8 million bales, compared with about 3.5 million for approximately the same period a year earlier.
The rate of cotton consumption during the second half of the 1958-59 marketing year vms well above the rate during the first half of the season. The seasonally adjusted rate for tl1e first 5 months of the 1959-60 marketing year was about the same as the rate for the February-July 1959 period. During the February-July 1960 period, consumption is expected to be about the same as that for the same period a year earlier, about 4.5 million bales.
Seasonally Adjusted Stock-Unfilled Order Ratio Increases
The seasonally adjusted stock-unfilled order ratio for the end of November increased over a month earlier for the first time since August 1958. At the end of November this ratio stood at 0.23 compared vnth 0.21 from June through October. The average stock-unfilled order ratio for the postwar period was 0.42. When the stock-unfilled order ratio for broadwoven goods increases, cotton mill consumption can be expected to decline several months in the future, and vice versa.
The seasonal adjustment of this ratio is introduced for the first time in this issue of The Cotton Situation. An explanation of the seasonal adjustment and its implications are given in the article starting on page 19.
Mill Margins Large
The average mill margin (20 constructions) for gray goods for the amount of fabric made from a pound of cotton was at a peak of 33.20 cents in December. This compares with 33.04 cents in November and 25.06 cents for the same month a year earlier. The series for 20 constructions of fabrics started in August 1954 and the mill margin for December 1959 was the highest during this period. Prior to August 1954 data are available for 17 constructions of fabric but these data are not comparable with data for 20 constructions.
The larger margin in December vms caused by a greater increase in the value of fabrics than in the price of cotton. Fabric value increased to about 66.37 cents for the amount of fabri~s (average 20 constructions) made from a pound of cotton. Again, this was the highest since August 1954 and compares with 65.59 cents in November and 58.98 cents for the same month a year earlier.
The price of cotton used in manufacturing the 20 constructions increased in December over November. The December average was 33.17 cents a pound, compared with 32.55 cents in November. In December 1958 the average price was 33.92 cents per pound. (See table 21.)

cs-186 - 11 - JANUARY 1960
!Pports and Exports of Cotton Cloth
Imports of cotton fabric during October 1959 totaled about 27.7 million square yards. This was the largest monthly total since January 1947 and compares with 8.1 million square yards the same month a year earlier. Total imports for January-October 1959 were 167.3 million square yards, compared with 117.1 million a year earlier.
Exports of cotton fabric during October 1959 totaled 44.8 million square yards compared with 41.6 million in October 1958. Tne cumulative total from January 1 through October 1959 was 392.2 million square yards, compared with 426.4 million during the same period a year earlier. (See table 6.)
Table 6.--Cotton broadwoven goods: Imports and exports, United States, January-August, 1958 and 1959
Imports Exports 1958 1959 1958 1959
Month : . . Monthly :cumu- . Monthly :cumu- . Monthly :cumu- : Monthly :cumu-
:1ative: :1ative: :lative: :1ati ve
Mil. Mil. Mil. Mil. Mil. Mil. Mil. Mil. sg,.;td. sg,.yd. sq.~d. ss.yd. sq.yd. sq.~d. SSl,o;td• sq.yd.
January 13.2 13.2 9.1 9-1 4o.8 40.8 42.5 42.5 February 11.2 24.4 16.7 25.8 45.2 86.0 34.1 76.6 March 10.2 34.6 13-7 39-5 2~5. 0 131.1 41.7 118.3 April 9-2 43.7 12.3 51.8 57.6 188.7 38.0 156.3 May 14.7 58.5 16.4 68.1 46.8 235.5 39.9 196.2 June 13.6 72.1 16.6 84.7 37.4 272.9 42.9 239.1 July 15.2 87.3 18.3 103.1 29.2 302.1 33.1 272.1 August 10.4 97.6 17.2 120.3 43.5 345.6 38.2 310.3 September 11.4 109.1 20.3 140.6 39.1 382~ .8 37-1 347.4 October 8.1 117.1 27-7 167.3 41.6 426.4 44.8 . 392.2
Bureau of the Census.
Quantit~ of Products Exported Under Cotton Products Export -Program Increases
Registrations under the Cotton Products Export Program from August 1 through December 1959 amounted to 85.7 million pounds. This compares with about 83.1 million pounds during the same period a year earlier and 88.9 million in the .August-December 1957 period. Increases \vere noted in 8 classes. The classes for which decreases \vere noted are classes A, D, F, J, and K. (See table 22. )

CS-186
Stocks of Cotton Held by CCC ~clin~
- 12 - JANUARy l96o
Stocks of cotton held by CCC (owned and held as collateral against outstanding price support loans) totaled about 6 million bales on January 15. This compares with about 7 million bales approximately a year earlier and on August l, 1959.
Of the total on January 15 less than 200,000 bales was under loan, the balance was owned by CCC. Outstanding loans on upland cotton under the current support price program were about 176,000 bales. (See table 23.)
As of January 15, CCC had purchased about 8. 2 million bales under the Choice A price support program. About 5 million of this had been sold by local sales agencies and about 0.4 million had been sold by the CCC Commodity Office in NevT Orleans.
Carryover To ~cline
The estimated supply for the 1959-60 marketing year is 23.7 million bales, about 3.4 million bales larger than a year earlier. The 1959 crop was up 3.2 million bales, and the carryover was up about 144,000 bales. (See table 7.) The estimated supply for 1959-60 is the largest since 1956-57·
Table 7.--All kinds of cotton: Supply, United States, 1953 to date
Year beginning
August l
1953 1954
1955 1956 1957 1958 1959 2/
Carryover beginning of season
1,000 bales g/
5,604.8 9' 727.9
11,205.4 14,528.8 11,322.6
8, 737 .o 8,881. 2
Production };.!
1,000 bales '?)
16,359·5 13,545.0
14,632-9 12,977-l 10,862.2 11,373-2 14,640.0
~ Includes in-season ginnings.
Net imports City crop Total
1,000 bales g/
1,000 1,000 bales g/ bales gj
141.6 43.0 22,148.9 146.3 46.0 23,465.2
136.6 47.0 26,021.9 3/136.4 :Yl4l.2
136.5
50.0 3/27,643.9 58.0 ~/22,384.0 51.0 20,297·7
140.0 50.0 23,711.2
~ Running bales except imports which are in bales of 500 pounds. ]/ Imports include but total supply excludes 48,213 bales of stockpile cotton
entered under the long-staple cotton import quota. ~ Includes 50,000 bales of long-staple cotton released from the strategic
stockpile and offered for sale by CCC for unrestricted use. 2} Preliminary, partly estimated.

cs-186 - 13 - JANUARY 19(50
Despite this large increase in supply, the sharp increase in exports and the smaller increase in domestic mill consumption is expected to reduce the carryover on August 1, 1960 about 400,000 bales. The carryover of' about 8.5 million bales on August 1, 1960 probably will be the smallest since 1953.
Ginnings ~ ~ 1959 Crop
Harvesting of' the 1959 crop proceeded at a rapid rate and as of' January 16, 14.4 million bales or about 98 percent of' the estimated 1959 crop had been ginned. During the preceding 5 years an average of' 98.7 percent of' the crop had been ginned by this date. In 1958, 99.2 percent of' the crop had been ginned by January 16.
As of' December 1, the 1959 crop was estimated at 14,640,000 running bales (14,701,000 bales of' 500 pounds each). The estimate of' harvested acreage was increased almost 200,000 acres from the previous estimate to 15,164,000. Primarily because of' this increase and, to a lesser extent, because the estimate of the size of the crop declined slightly from previous estimates, the estimated yield declined from the 474 pounds previously estimated to 465 pounds per harvested acre, 1 pound below the record high yield of 1958. (Tables 24 and 25.)
Boll Weevil Hibernation
Surveys of boll weevil hibernation of the Agricultural Research Service indicate that such hibernation has increased in most ~f the areas for which comparisons with 1958 are available. Increases are noted in Tennessee, Louisiana, two areas of Mississippi, and certain areas of' North and South Carolina.
Table 8.--Results of fall surface trash examinations for hibernating boll weevils, specified States, November and December 1958 and 1959
State
Texas Tennessee Missouri Louisiana
Mississippi
Georgia North and South Carolina North Carolina South Carolina
Area or District
Central McNairy County Dunklin County (northern)
: Northeastern :)Lower delta :)Central delta : ) North delta :)Hill Section . . :)Coastal Plains :)Piedmont Section : North Central Section : South Central Section
Agricultural Research Service.
Live weevils per acre
1958 1959
Number Number
6,631 1,214 1,882
6,292 5,756 8,097 4,242 4,215 4,909 8,513 2,960 4,787 3,057 2,991 1,133 716 4,625 5,082 2,635 1~' 383
968 834 995 1,318
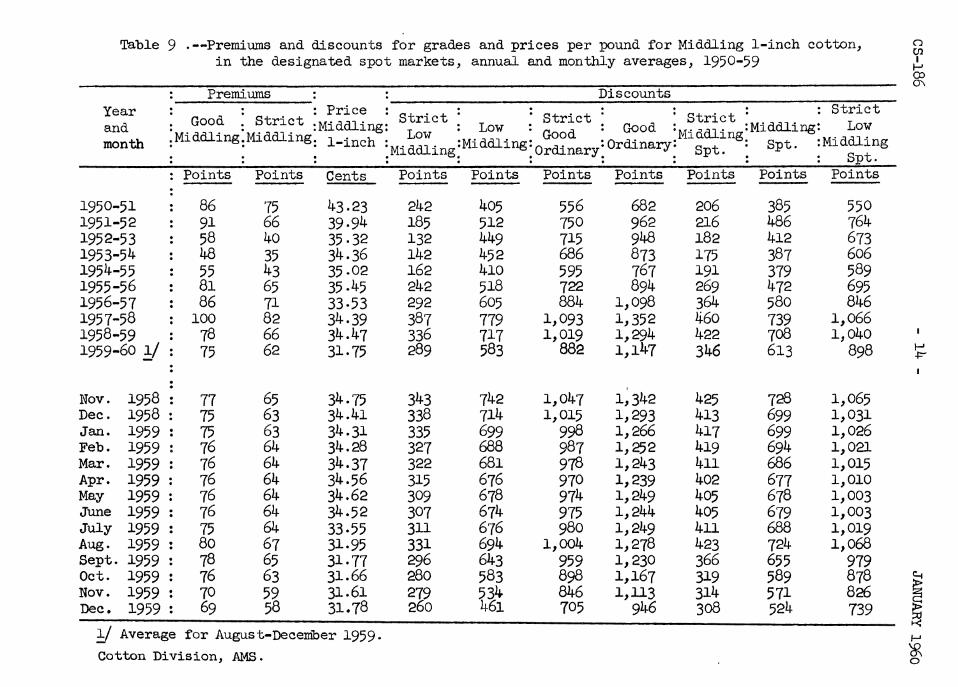
Table 9 .--Premiums and discounts for grades and prices per pound for Middling l-inch cotton, in the designated spot markets, annual and monthly averages, 1950-59
Premiums Discounts Year and month
. . : Strict : : . : Price : Strict : : Strict : ; Stri'_!t ;Middling: Low . Good . StrJ.ct :Middling: L : Low · Good · CJ<_'od .MiddlJ.ng. S t :Middling ;Middling;Middling: l-inch :Mid~ing:Middling~Ordinary~Ordinary; Spt. ; P · : Spt.
Points Points Cents Points Points Points Points Points Points Points
1950-51 1951-52 1952-53 1953-54 1954-55 1955-56 1956-57 1957-58 1958-59 1959-60 !.1
Nov. Dec. Jan. Feb. Mar. Apr. May June July Aug. Sept. Oct. Nov. Dec.
1958 : 1958 : 1959 : 1959 : 1959 : 1959 : 1959 : 1959 : 1959 1959 1959 : 1959 : 1959 : 1959 :
86 91 58 48 55 81 86
100 78 75
77 75 75 76 76 76 76 76 75 80 78 76 70 69
75 66 40 35 43 65 71 82 66 62
65 63 63 64 64 64 64 64 64 67 65 63 59 58
43.23 39-94 35·32 34-36 35.02 35.45 33-53 34-39 34.47 31.75
34-75 34.41 34-31 34.28 34.37 34-56 34.62 34-52 33-55 31.95 31·77 31.66 31.61 31.78
!/ Average for August-December 1959. Cotton Division, AMS.
242 185 132 142 162 242 292 387 336 289
343 338 335 327 322 315 309 307 311 331 296 280 279 260
405 512 449 452 410 518 605 779 717 583
742 714 699 688 681 676 678 674 676 694 643 583 534 461
556 750 715 686 595 722 884
1,093 1,019
882
1,047 1,015
998 987 978 970 974 975 980
1,004 959 898 846 705
682 962 948 873 767 894
1,098 1,352 1,294 1,147
1,342 1,293 1,266 1,252 1,243 1,239 1,249 1,244 1,249 1,278 1,230 1,167 1,113
946
206 216 182 175 191 269 364 lj.6o 422 346
425 413 417 419 411 402 405 405 411 423 366 319 314 3o8
385 486 412 387 379 472 580 739 7o8 6l3
728 699 699 694 686 677 678 679 688 724 655 589 571 524
550 764 673 606 589 695 846
1,066 1,040
898
1,065 1,031 1,026 1,021 1,015 1,010 1,003 1,003 1,019 1,068
979 878 826 739
(')
Ul I
1-' CP 0'\
1-' -!=""
~ ~ 1-'
'cR 0

cs-186
Spot Market Price For Middling !-Inch Cotton Increases
- 15 - JANUARY 1960
The average 14 spot market price for Middling l-inch cotton on January 22 was 31.91 cents per pound, up 0.06 cent from the same date a month earlier. However, the January 8 price was well below the 34.30 cents per pound of January 22, 1959. The low for the season's date was reached on October 29 and 30 when the price was 31.58 cents per pound. Discounts for the lower grades of cotton have been narrowing during the current season. The discount for Strict Low Middling spotted from Middling l-inch was 7.39 cents per pound in December. During 1958-59 the discount averaged 10.40 cents. other lower qualities also have shown a narrowing in the discount as indicated in table 9·
Supply of Cotton Linters Increases
The supply of cotton linters in the U. S. in the 1959-60 marketing year is estimated at about 2.5 million bales. This compares with about 2.3 million in 1958-59 and 2.2 million in 1957-58.
The increase is being caused by a larger production associated with the larger cotton crop. Production of cotton linters is estimated at about 1.7 million bales for the current season. This is 0.4 million above 1958-59 and the largest since 1955-56. (See table 10.) Imports of cotton linters are not expected to be greatly different from those of a year earlier when about 172,000 bales were imported.
Table 10.--Cotton linters: Supply.and disappearance, United States, 1955 to date
Year begin
ning Aug. 1
1955 1956 1957 1958 1959 y
Stocks Aug. 1
1,000 bales
g; 1,491 1,025
824 810 569
Supply Produc-: tion Imports:
11 1,000 1,000 bales bales
g; ]}
1,703 204 1,507 135 1,256 139 1,335 172 1,700 170
Disappearance . . Total :consump-: Exports: De- Total tion strayed:
1,000 1,000 1,000 1,000 1,000 bales bales bales bales bales
g; '§ y s/ g; 3,382 1,789 396 2,185 2,667 1,438 334 1,772 2,218 1,102 185 1,287 2,318 1,210 243 1,453 2,500 1,400 300 1,700
~ Includes production at gins and delinting plants. ~ Running bales through September 1958; 600-pound equivalent gross weight bales thereafter. ]/ Bales of 500 pounds. Y Preliminary, partly estimated.
Bureau of the,Census.
CS-186
Disappearance of Cotton Linters Up
- 16 - JANUARY 1960
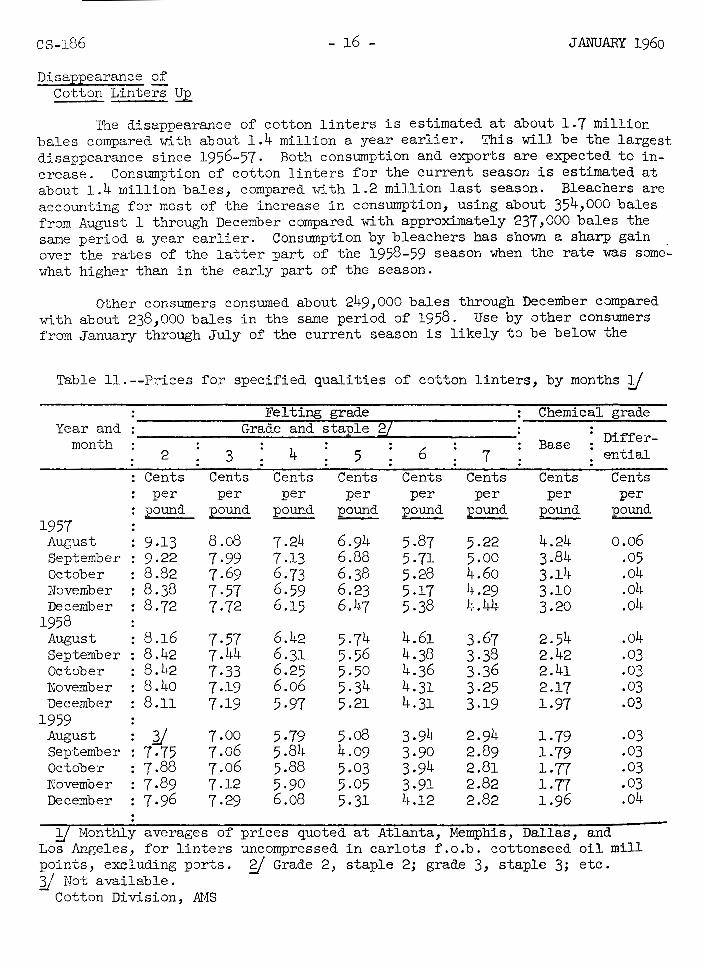
The disappearance of cotton linters is estimated at about 1.7 million bales compared l·r.i. th about 1.4 million a year earlier. This will be the largest disappearance since 1956-57· Both consumption and exports are expected to increase. Consumption of cotton linters for the current season is estimated at about l. 4 million bales, compared 1d th l. 2 million last season. Bleachers are accounting for most of the increase in consumption, using about 354,000 bales from August l through December compared "idth approximately 237,000 bales the same period a year earlier. Consumption by bleachers has shown a sharp gain over the rates of the latter part of the 1958-59 season when the rate was some~ vrhat higher than in the early part of the season.
other consumers consumed about 249,000 bales through December compared with about 238,000 bales in the same period of 1958. Use by other consumers from January through July of the current season is likely to be below the
Table 11.--Prices for specified qualities of cotton linters, by months !(
Year and month
1957 August September October November December
1958 August September October November December
1959 August September October November December
2 Cents per
pound
9-13 9.22 8.82 8.38 8.72
8.16 8.42 8.42 8.40 8.11
Felting grade Grade and staple gj
3 Cents per
pound
8.o8 7·99 7.69 7·57 7.72
7·57 7.44 7·33 7-19 7.19
7.00 7.06 7.06 7.12 7.29
4 5 Cents per
pound
7.211 7-13 6.73 6.59 6.15
6.42 6.31 6.25 6.o6 5.97
5·79 5.84 5.88 5.90 6.o8
Cents per
pound
6 .91~ 6.88 6.38 6.23 6.47
5.74 5.56 5-50 5-34 5.21
5.o8 4.09 5.03 5.05 5.31
6 Cents per
pound
5.87 5.71 5.28 5·17 5.38
4.61 4.38 4.36 4.31 4.31
3 ·9~-3·90 3.94 3.91 1~ .12
7 Cents per
pound
5.22 5.00 4.60 4.29 4.44
3.67 3.38 3.36 3.25 3.19
2.94 2.89 2.81 2.82 2.82
Chemical grade
Base
Cents per
pound
4.24 3 .81~ 3.14 3.10 3.20
2.54 2.42 2.41 2.17 1.97
1.79 1.79 1.77 1.77 1.96
Differential
Cents per
pound
o.o6 .05 .04 . o1~ . o1~
.04
.03
.03
.03
.03
.03
.03
.03
.03
.04
f/ Monthly averages of prices quoted at Atlanta, Memphis, Dallas, and Los Angeles, for linters uncompressed in carlots f.o.b. cottonseed oil mill points, excluding ports. g( Grade 2, staple 2; grade 3, staple 3; etc. 1} Not available.
Cotton Division, M~S

cs-186 - 17 - JPl'WARY 1960
relatively high level of a year earlier, and the total for the 1959-60 season is not expected to shovr much gain, if any, over that of 1958-59.
prices for Linters Increase
Prices for some felting grade linters have shown a slight rise in recent months. The average price for Grade 3' Staple 3 felting linters rose from 6.83 cents in July to 7.29 cents in December. In December 1958 the price for this quality of linters was 7.19 cents per pound. Prices for most other felting grades have increased from those of a month earlier. (See table 11.)
Prices of chemical linters, 73 percent cellulosic content, were quoted at 1.96 cents per pound in December. This compared with 1.77 cents in November and 1.97 cents in December 1958. The cellulose 'differential was at 0.03 cent per pound from September 1958 through November 1959, but increased to 0.04 cent in December.
Producing Capacity for Rayon and Acetate to Decline, ca;pacity for!Jther Manmade Fibers to Increase
According to the Textile Organon of December 1959, the producing capacity for rayon and acetate in November 1961 is scheduled to de~line to 1,367 million pounds from 1,376 million in November 1959. The reduction is scheduled to take place principally in high tenacity rayon. (See table 12.)
The producing capacity for the noncellulosic mar~ade fibers in November 1961 is estimated at 1,343 million pounds, compared vnth 969 million pounds in November 1959. Large increases are scheduled for all categories of noncellulosic manmade fibers.
' It is estimated that the total pr6ducing capacity for all manmade fibers
vall increase from 2,31~5 million pounds in November 1959 to 2, 710 million in November 1961.
Manmade Fiber Production At ~ High Level
U. S. manmade fiber production during the first 3 quarters of 1959 was well above the same period of 1958. Production January-September 1959 totaled about 1.4 billion pounds, 27 percent or l.l.billion above the same period a year earlier. Production of rayon and acetate totaled about 835.8 million pounds, up about 20 percent. Production of other manmade fiber vras about 591.1 million pounds, up about 42 percent over the 1958 period.
Data for November for production of all manmade fibers are not available, but shipments to domestic consumers of rayon and acetate declined. Shipments during November were about 78.9 million pounds compared with 81}. 3 million in October and 87.9 million in November 1958. Shipments in both October and November 1959 were below those for the same months in 1958. For 1959 shipments during these months totaled 163.2 million pounds and in the same 2 months in 1958 they \vere 179.6 million pounds .
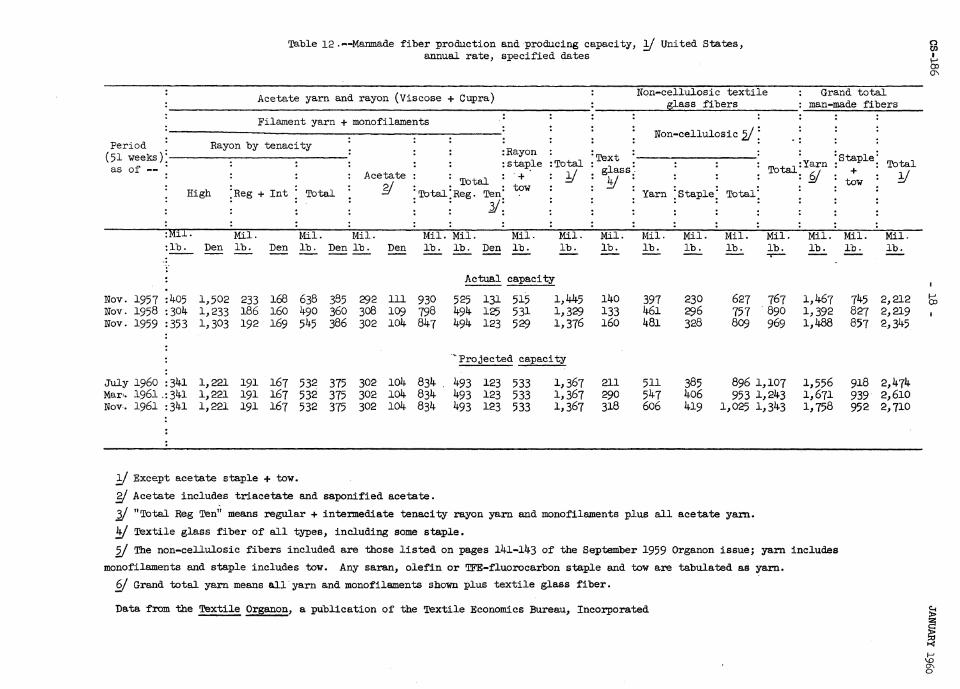
Table 12.~-Manmade fiber production and producing capacity,!( United States, annual rate, specified dates
Acetate yarn and rayon (Viscose + Cupra) ; Non-cellulosic textile : Grand total : glass fibers : man-made fibers
Filament yarn + monofilaments : : : : : Non-cellulosic 2/ ~ : : : : : : : ..
Period Rayon by tenacity : (51 weeks): : : :Rayon : :Text : : : =sta le:
as of --: : : : : :sta~le :Total : lass=. : : : Total:Yarn : +p : Total
Acetate · · · + · y · g · · · · • §/ · · !( · · Total · · · !Y · · · · · · tow · ~ :Total:Re . Ten: tow : : : Yarn =stale: Total: High :Reg + Int Total . . g . . . . . p . . . . JJ; . . . . .
: : : : : : :Mll. Mil. Mil. Mil. Mil. Mil. Mil. Mil. Mil. Mil. Mil. Mil.·· .. Mil-. :lb. Den lb. Den lb. Den lb. Den lb. lb. Den lb. lb. lb. lb. lb. lb. lb. -- -- -- ---- ---- ...--.. :
Actual capacity
Nov. 1957 :405 1,502 233 168 638 385 292 lll 930 525 131 515 1,445 140 397 230 627 767 Nov. 1958 : 304 1,233 186 160 490 360 3o8 109 798 494 125 531 1,329 133 461 296 757 890 Nov. 1959 :353 1,303 192 169 545 386 302 104 847 494 123 529 1,376 160 481 328 809 969
·Projected capacity
July 1960 :341 1,221 191 167 532 375 302 104 834 493 123 533 1,367 211 5li 385 896 1,107 Mar•. 1961 . : 341 1,221 191 167 532 375 302 104 834 493 123 533 1,367 290 547 406 953 1,243 Nov·. 1961 : 341 1,221 191 167 532 375 302 104 834 493 123 533 1,367 318 606 419 1,025 1,343
y Exce.pt acetate staple + tow.
~ Acetate includes triacetate and saponified acetate.
]} "Total Reg Ten'; means regular + intermediate tenacity rayon yarn and monofilaments plus all acetate yarn.
}jj Textile glass fiber of all types, including some staple.
Mil. lb.
1,467 1,392 1,488
1,556 1,671 1,758
2f The non-cellulosic fibers included are those listed on pages 141-143 of the September 1959 Organon issue; yarn includes
monofilaments and staple includes tow. Any saran, olefin or TFE-fluorocarbon staple and tow are tabulated as yarn.
§/Grand total yarn means all' yarn and monofilaments shown plus textile glass fiber.
Data from the Textile Organon, a publication of the Textile Economics Bureau, Incorporated
Mil. lb.
745 827 857
918 939 952
Mil. lb.
2,212 2,219 2,345
2,474 2,610 2,710
0 en I f-' ():) 0\
f-' ():)
~
~ ·....: f-' \D a--0

cs-186 - 19 - JANUARY 1960
Seasonal Adjustments and Cyclical Movements for the Ratio of Stocks to Unfilled Orders for Cotton Broadwoven Goods
By Frank Lowenstein
A study published in October 1954 !/ showed the strong association between the ratio of stocks to unfilled orders for cotton broadwoven goods and mill consumption of cotton. It was found that the ratio moves in an inverse direction to cotton mill consumption. In other words, when the ratio is low fUture mill consumption tends to be high and vice versa. Changes in
the ratio usually show an optimum lead over changes in mill consumption of cotton by about 5 months.
In the past, annual or 12-month averages of this ratio have been used in analyzing cotton mill consumption. As long as analysis and forecasting are based on annual averages, it is not necessary to adjust the data for seasonality.
The ratio also can be used as an aid in forecasting month-to-month changes in mill activity. However, this poses the problem of seasonal variation since the ratio for some months tends to be higher or lower than the ratios tor other months, year after year. Unless the seasonal movement is identified so that it can be separated from the cyclical, irregular, and trend movements of the ratio, the importance of month-to-month changes in the ratio cannot be evaluated.
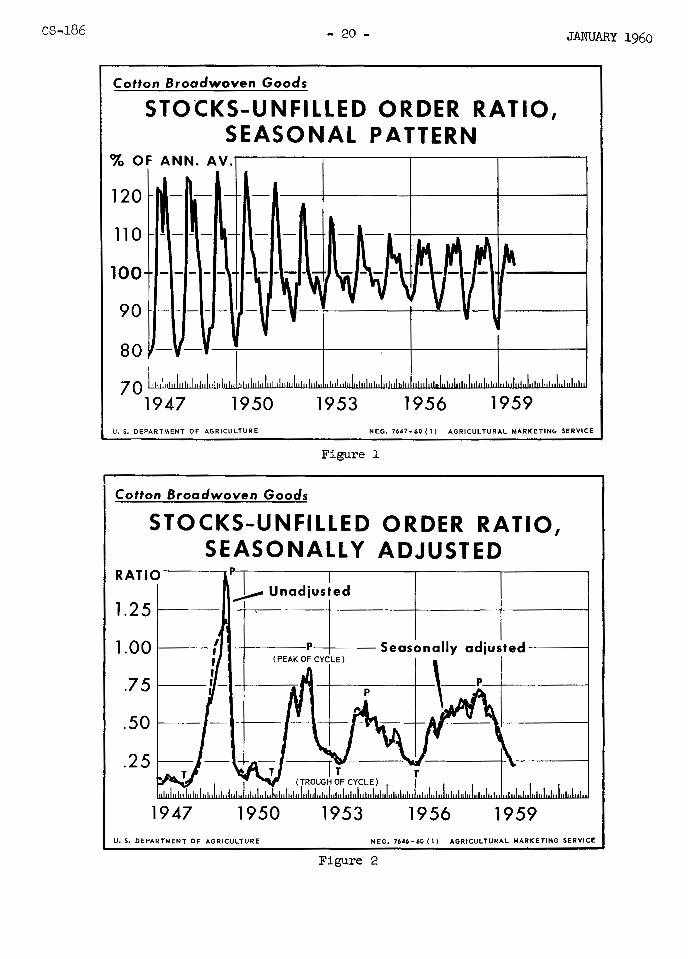
Seasonal changes in the monthly ratios for the period January 1947 through July 1959 have been analyzed and seasonal patterns of the adjustment fac~ors determined. gj These are illustrated in figure 1. The seasonal pattern for the series was basically the same from 1949 through 1953. Then the seasonal pattern went through a period of transition in 1954 and 1955. A rather consistent but different pattern appeared for the 1956-59 period.
The seasonal factors for adjusting the series are shown in table 13. Jh recent years the highest seasonal factors have tended to occur in August and the lowest in December.
Y Lowenstein, Frank and Simon, Martin s., "Analyses of Factors That Affect Mill Consumption of Cotton in the United States," Agricultural Economics Research, October 1954, Vol. VI, No. 4.
gj For description of the method and its development, see a paper entitled "Seasonal Adjustments by Census Methods I and II," presented by Shiskin, J. and Eisenpress, H. at a joint meeting of the American Statistical Association and the Econometric Society on December 27, 1955 in New York, N. Y.
CS-186 - 20 -
Cotton Broadwoven Goods
STOCKS-UNFILLED ORDER RATIO, SEASONAL PATTERN
JANUARY 1960
% 0 F ANN. A V . ..------.-------r------,-------,
120
110 -- --
100 -- ---
90 -- ---
80 - -
70 1947 1950 1953 1956 1959
U.S. DEPARTMENT OF AGRICULTURE NEG. 7647-60 ( 1) AGRICULTURAL MARKETINu SERVICE
Figure 1
Cotton Broaclwoven Goods
STOCKS-UNFILLED ORDER RATIO, SEASONALLY ADJUSTED
RAT I 0 -----.P•--r------,-----r------,------,
~ Unadjusted 1.25 t------
1.00 1---
.75 t---
.50 f------
.25
1947
-1-----P'---t-(PEAK OF CYCLE)
1950 1953 1956 1959 U.S. DEPARTMENT OF AGRICULTURE NEG. 7646-60 ( 1) AGRICULTURAL MARKETING SERVICE
Figure 2
cs-1.86 - 2l - JANUARY 1960
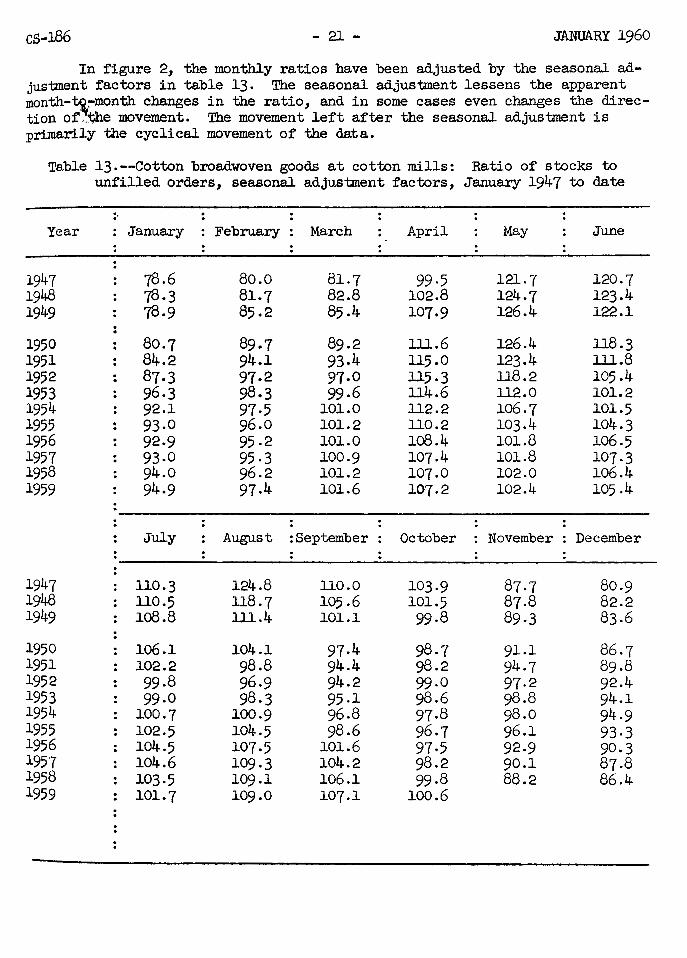
In figure 2, the monthly ratios have been adjusted by the seasonal ad-justment factors in table 13. The seasonal adjustment lessens the apparent roonth-~:-month changes in the ratio, and in some cases even changes the direc-tion of .. :t;he movement. The movement left after the seasonal adjustment is primarily the cyclical movement of the data.
Table 13.--Cotton broadwoven goods at cotton mills: Ratio of stocks to unfilled orders, seasonal adjustment factors, January 1947 to date
: Year January February : March April May June
1947 78.6 80.0 81.7 99·5 12l.7 120.7 1948 78·3 81.7 82.8 102.8 124.7 123.4 1949 78.9 85.2 85.4 107·9 126.4 122.1
1950 80.7 89-7 89.2 lll.6 126.4 ll8.3 1951 84.2 94.1 93.4 ll5.0 123.4 lll.8 1952 87·3 97·2 97-0 115-3 ll8.2 105.4 1953 96.3 98·3 99-6 114.6 112.0 101.2 1954 92.1 97·5 101.0 112.2 106.7 101.5 1955 93.0 96.0 101.2 110.2 103.4 104.3 1956 92.9 95·2 101.0 108.4 101.8 106.5 1957 93.0 95·3 100.9 107.4 101.8 107-3 1958 94.0 96.2 101.2 107.0 102.0 106.4 1959 94-9 97.4 101.6 107.2 102.4 105.4
July August :September October November December
1947 110.3 124.8 llO.O 103·9 87 ·7 80.9 1948 ll0.5 118.7 105.6 101.5 87.8 82.2 1949 108.8 lll.4 101.1 99.8 89·3 83.6
1950 106.1 104.1 97·4 98·7 91.1 86.7 1951 102.2 98.8 94.4 98.2 94-7 89.8 1952 99.8 96·9 94.2 99·0 97·2 92.4 1953 99.0 98·3 95·1 98.6 98.8 94.1 1954 100.7 100.9 96.8 97-8 98.0 94-9 1955 102.5 104.5 98.6 96-7 96.1 93·3 1956 104.5 107-5 101.6 97 ·5 92-9 90.3 1957 104.6 109.3 104.2 98.2 90.1 87.8 1958 103·5 109.1 106.1 99-8 88.2 86.4 1959 101.7 109.0 107.1 100.6

CS-186 - 22- JANUARY 1960
TO illustrate the effect of the seasonal adjustment, data for some recent months were examined. In January 1959 the unadjusted ratio increased to 0.39 from 0.38 in December 1958. If there had been no seasonal effect, such a change would have suggested the start of an upward movement in the ratio after several months of decline. But the seasonally adjusted ratios for the two months showed a continuation of the steady decline. In actuality, both the adjusted and unadjusted ratios continued to decline after January 1959.
The unadjusted ratios for June through October 1959 showed both increases and declines. The seasonally adjusted ratios indicate that most of the variation in these months was seasonal and there was practically no change in the level after adjustment for such changes. (See table 14.)
Table 14. --Cotton broadwoven goods at cotton mills: Ratio of stocks to unfilled orders, seasonally adjusted, January 1947 to date 1/
Year
1947 1948 1949
1950 19~1 1952 1953 1954 1955 1956 1957 1958 1959
1947 1948 1949
1950 1951 1952 1953 1954 1955 1956 1957 1958 1959
January
0.13 .10 ·99
.17
.11
.76 ·32 .60 ·37 .24 ·57 .64 .41
July
0.12 ·29 .80
.15
.49
.41
.25
.52
.32
.46 ·59 ·55 .21
y End of month.
February
0.13 .11
1.04
.14
.13
.81
.27 ·57 ·38 .23 .58 ·70 ·33
March
0.11 .13
1.10
.18
.13 ·78 ·30 .54 .38 .27 .56 .69 ·29
August :September
O.ll .38 .41
.13 ·59 ·37 .28 ·53 .27 ·50 .60 ·56 .21
0.10 .49 .24
.12 ·70 .34 ·37 .44 .26 .50 .60 ·55 .21
April
0.12 .16
1.13
.20
.14 • 76 .24 .58 ·37 .28 .58 .67 .25
October
0.10 .61 .20
.12 ·74 ·33 .42 .47 .26 .42 .66 .52 .21
May
0.13 .16
1.18
.19
.18 ·70 .23 .49 ·37 ·33 .54 .69 .22
June
0.12 .20
1.14
.20
.30
.48
.24
.51 ·35 .41 .56 .65 .21
November December
0.09 ·72 .18
.13
.64 ·32 .50 .48 .24 ·50 .61 .48
0.09 .83 .19
.12
.60
.31
.58
.41
.25
.54 ·59' .44
cs-186 - 23 - JANUARY 1960
Cotton Broadwoven Goods
STOCKS, SEASONAL PATTERN %OF ANN. AV.
120~----~------r------r------r-----~
110
100
90
so~-----+------+------4------~----~
70~~~~~~~~~~~~~~~~~~
1947 1950 1953 1956 1959 U.S. DEPARTMENT OF AGRICULTURE NEG. 7644-60 (1) AGRICULTURAL MARKETING SERVICE
Figure 3
Cotton Broadwoven Goods
UNFILLED ORDERS, SEASONAL PATTERN
%OF ANN. AV . .-------~------~------~----~
120
110-
100
90
so~~~~------~------~-----4-------
70~~~~~~~~~~~~~~~~~
1947 1950 1953 1956 1959 U. S. DEPARTMENT OF AGRICULTURE NEG. 7645-60 ( 1) AGRICULTURAL MARKETING SERVICE
Figure l~
CS-186 - 24 - JANUARY 1960
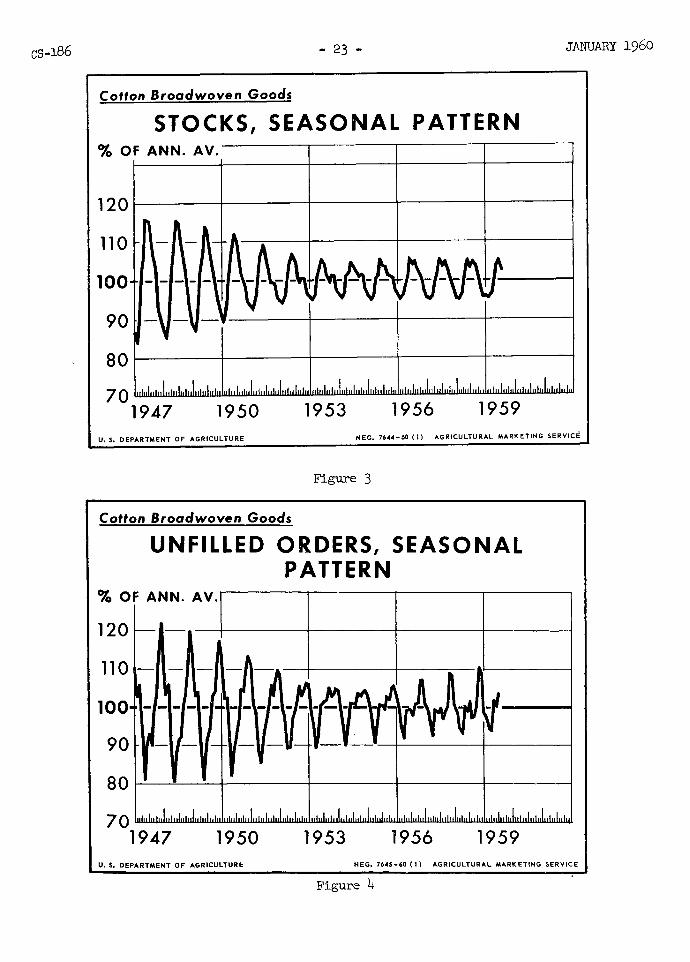
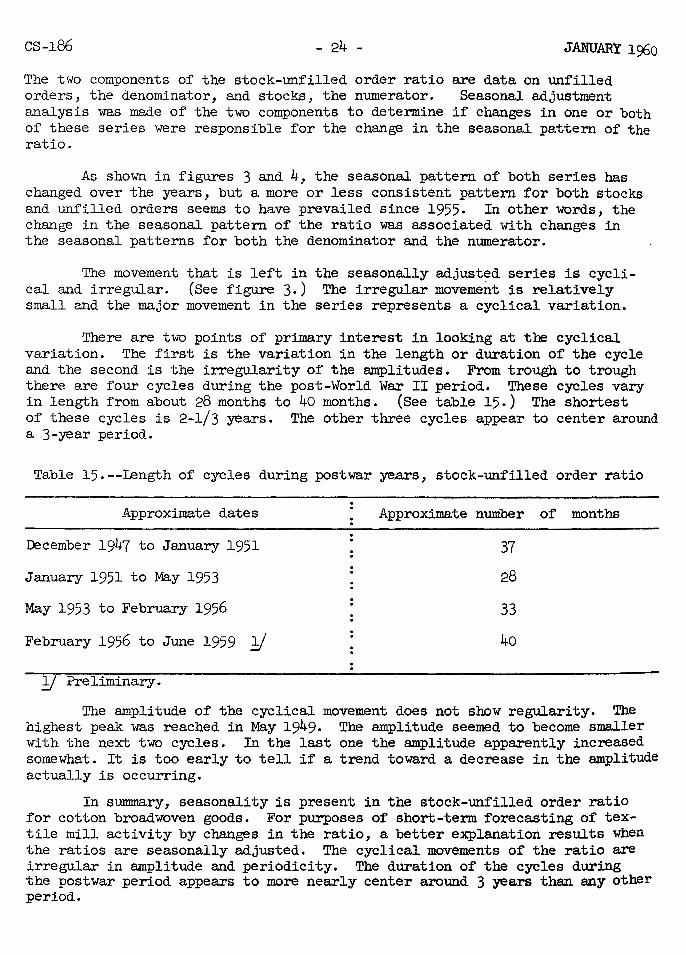
The two components of the stock-unfilled order ratio are data on unfilled orders, the denominator, and stocks, the numerator. Seasonal adjustment analysis was made of the two components to determine if changes in one or both of these series were responsible for the change in the seasonal pattern of the ratio.
As shown in figures 3 and 4, the seasonal pattern of both series has changed over the years, but a more or less consistent pattern for both stocks and unfilled orders seems to have prevailed since 1955. In other words, the change in the seasonal pattern of the ratio was associated with changes in the seasonal patterns for both the denominator and the numerator.
The movement that is left in the seasonally adjusted series is cyclical and irregular. (See figure 3.) The irregular movement is relatively small and the major movement in the series represents a cyclical variation.
There are two points of primary interest in looking at the cyclical variation. The first is the variation in the length or duration of the cycle and the second is the irregularity of the amplitudes. From trough to trough there are four cycles during the post-World War II period. These cycles vary in length from about 28 months to 40 months. (See table 15.) The shortest of these cycles is 2-1/3 years. The other three cycles appear to center around a 3-year period.
Table 15.--Length of cycles during postwar years, stock-unfilled order ratio
Approximate dates
December 1947 to January 1951
January 1951 to May 1953
May 1953 to February 1956
February 1956 to June 1959 y
y Preliminary.
Approximate number of months
37
28
33
40
The amplitude of the cyclical movement does not show regularity. The highest peak was reached in May 1949. The amplitude seemed to become smaller with the next two cycles. In the last one the amplitude apparently increased somewhat. It is too early to tell if a trend toward a decrease in the amplitude actually is occurring.
In summary, seasonality is present in the stock-unfilled order ratio for cotton broadwoven goods. For purposes of short-term forecasting of textile mill activity by changes in the ratio, a better explanation results when the ratios are seasonally adjusted. The cyclical movements of the ratio are irregular in amplitude and periodicity. The duration of the cycles during the postwar period appears to more nearly center around 3 years than any other period.

cs-186 - 25 -
COI'TON PRICES IN 1ilORLD IMPORT MARKETS
By R. T. Baggett Agricultural Economist
Foreign Agricultural Service
JANUARY 1960
Regular publication in The Cotton Situation of a new series of c.i.f. prices of selected growths and qualities of cotton in representative European markets is inaugurated with this issue. Annual and monthly prices shown in table 16 ~or Liverpool, England and table 17 for Bremen, Germany are averages of quotations on a specified day each week received by the Foreign Agricultural Service through special arrangements with trade and market sources. The weekly quotations are averages of prices at vThich specified growths and qualities of cotton moving in international trade are being firmly offered by representative exporters or their agents. The terms are c.i.f., that is, cost, insurance, freight, and other charges paid to the docks in the specified market, with actual shipment to take place generally within the succeeding 30-day period.
What is Represented ~ c.i.f. Offering Prices
Several important requirements are met by quotations of prices of the many growths of cotton moving in international trade, taken at dockside in an import market which supplies mills in a large consuming area. Quotations at this point are the most representative of prices actually paid for cotton by mills in consuming centers. When reduced to a common denominator qualitywise {the Uhiversal Standards for Uhited States upland Cotton), such prices permit comparisons of the competitiveness of the many growths now available to mills. Quotations are in a single currency and apply to cotton available for shipment within a specified period.
C.i.f. prices have certain limitations that should be recognized. Like all regular market price quotations, averages of offering prices on a specif~ed day of each week do not necessarily represent the specific prices and terms under which any actual transaction took place. Classifications assigned by exporters to u. s. cotton under the Uhiversal Standards may differ from official classifications. Most foreign cottons do not lend themselves to precise classification under the Universal Standards, since these standards were promulgated for exclusive use on u. s. upland cotton. Consequently, a price quotation for a given grade and staple length of foreign cotton under these standards may not be strictly comparable. In addition, certain quality characteristics, such as Micronaire tests for fiber fineness now commonly used in market transactions, are not measureable under the standards. However, the c.i.f. quotations do reflect general market levels, trends, and the competitive position of specified growths of cotton within closer limits than data available from other sources.
cs-186
The Need for Comprehensive --cotton Price Information
- 26 - JANUARY 1960
The need for more current and comprehensive cotton price information in foreign consuming centers has increased in recent years. Prewar series of Liverpool spot prices were more useful for showing market levels and trends than for measuring the competitive position of specified growths. Spot prices f.o.b. domestic and foreign export markets, used since World War II, following the closing of the Liverpool Cotton Exchange, to reflect the level and trends in "world" prices are not satisfactory price comparisons of cotton of like commercial quality in a specified consuming market on a given date. In addition, conversion translation of f.o.b. prices in export markets into prices paid by importers or mills in consuming centers has always been difficult. It has become even more so since World Ttlar II with the advent of government measures such as currency manipulation, special price discounts, bilateral trade agreements, export taxes, fees, etc.
The number of foreign growths and qualities that are substitutable at smaller price discounts for traditionally-preferred United States cotton has increased steadily. More than 50 producing countries are marketing countless qualities and descriptions of cotton. Analyses of "world" price levels, movements, and trends can have meaning only when comparisons can be made of elements that are alike in point of time, place, and end use quality or spinning utility. The term "world price" of cotton can mean as little as the "world price" of women's hats. On the other hand, prices at which similar qualities of u.s. and foreign cotton, in a specified currency, ar~offered in a designated market in an importing country on a given data are highly useful for purposes of determining market levels and relative prices for competing growths in cotton importing countries.
Relationship of Cotton Prices and International Trade
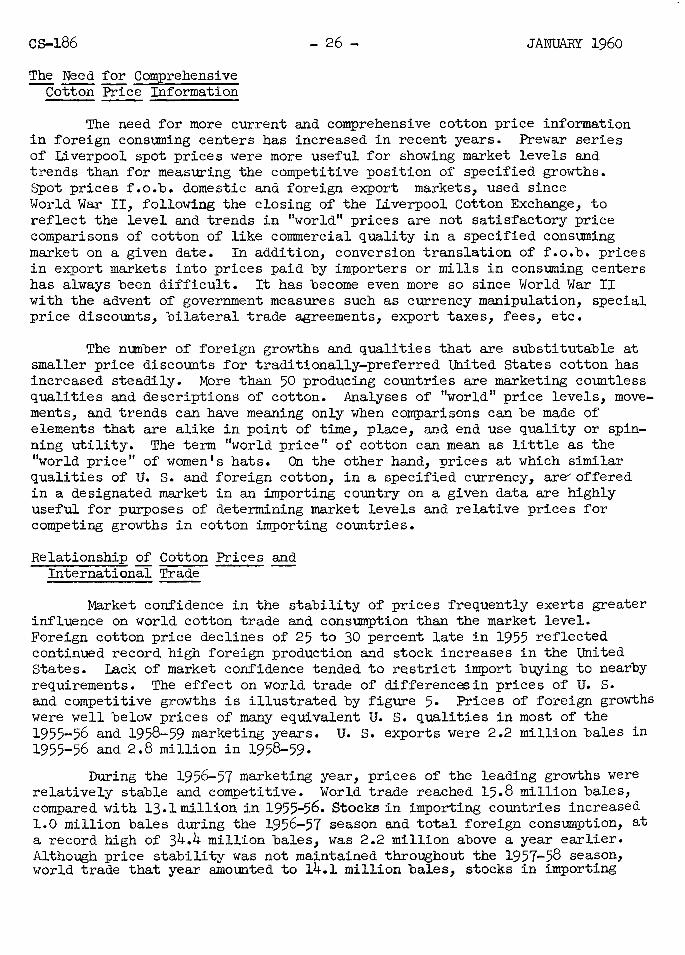
Market confidence in the stability of prices frequently exerts greater influence on world cotton trade and consumption than the market level. Foreign cotton price declines of 25 to 30 percent late in 1955 reflected continued record high foreign production and stock increases in the United States. Lack of market confidence tended to restrict import buying to nearby requirements. The effect on world trade of differencesin prices of U. s. and competitive growths is illustrated by figure 5· Prices of foreign growths were well below prices of many equivalent u. s. qualities in most of the 1955-56 and 1958-59 marketing years. u. s. exports were 2.2 million bales in 1955-56 and 2.8 million in 1958-59.
During the 1956-57 marketing year, prices of the leading growths were relatively stable and competitive. World trade reached 15.8 million bales, compared with 13.1 million in 1955-56. Stocks in importing countries increased 1.0 million bales during the 1956-57 season and total foreign consumption, at a record high of 34.4 million bales, was 2.2 million above a year earlier. Although price stability was not maintained throughout the 1957-58 season, world trade that year amounted to 14.1 million bales, stocks in importing
cs-186 - 27 - JANUARY 1960
Cotton Prices Competitive and Rising On World Markets
~ PER LB. I
35~-----
Liverpool C.I.F. Prices Monthly Average Dec.l955 to Date
25~~~~~~~~~~~~~
45
35~-----
3 0 t-----+--
25 Jan
1955 1956 1957 1958 1959 FAS·2
Figure 5

cs-186 - 28 -TABLE 16.--Cotton:
1/ Average prices- of selected growths and qualities,
c. i.f. Liverpool, England, annual 1952-55 and monthly 1956 to date
Date M 1" M 1-1/32" SM 1-1/32" SM 1-1/16" SM 1-1/8" Year and Month :Pakistan:
; Mexico Nica-
Syria :u.s.s.R.: : Uganda u. s. 289F u. s. ra ua u. s. u. s. Iran u. s. : B. P.
- Eguivalent U. S. cents 12er 12ound
1952 46.50 ': 46.83 45.15 47.39 45.08 47.84 49.66: 1953 38.42 37.70 38.85 37.63 39.34 37.21 39.79 41.67: 41.38 1954 39.13 41.39 39.60 38.59 39.99 39.58 40.36 42.08: 44.62 1955 38.91 36.91 39.72 36.04 40.36 36.13 33.60 40.99 33.04 42.74: 43.07
1956 January 39.00 33.44 40.12 32.88 42.62 34.96 34.00 42.51 34.70 43.00 41.24 February 39.31 36.60 40.19 35.57 41.77 37.15 37.21 42.86 35.98 44.05 43.70 March 40.06 35.25 40.53 36.42 41.54 37.74 37.66 42.41 36.86 43.73 43.37 April 38.42 35.69 38.83 35.46 39.76 35.68 36.64 40.55 35.54 41.75 44.17 May 32.22 38.13 33.10 32.64 ·: 34.10 34.51 33.75 34.80 35.68 36.50 47.78 June 30.32 35.76 31.09 31.09 32.01 32.62 34.45 32.62 35.62 34.15 46.49 July 29.58 33.49 30.17 29.99 31.30 31.96 32.76 31.88 32.93 44.36 August 29.17 32.17 29.82 29.44 30.95 31.25 31.22 31.46 32.93 32.40 43.50 September 28.82 31.47 29.44 29.64 30.60 30.80 31.08 31.14 31.89 32.36 41.85 October 29.61 31.82 30.19 30.15 31.33 32.02 31.42 31.85 32.08 33.72 43.11 November 30.36 33.45 31.23 31.45 32.32 32.32 32.85 33.19 33.55 35.30 45.87 December 31.12 36.38 31.91 32.42 33.07 33.65 33.44 33.87 35.10 36.27 47.44
1957 """'Jimuary 30.57 37.24 31.15 31.79 32.72 34.06 33.43 33.32 35.05 35.58 48.39
February 30.31 36.64 31.12 32.79 32.85 31.55 33.12 33.26 32.50 35.85 48.09 March 30.40 35.82 31.27 32.44 33.02 33.60 33.25 33.86 33.02 36.22 44.22 April 30.30 35.72 31.24 32.18 33.06 32.69 33.40 34.41 32.69 36.26 43.30 May 30.58 34.40 31.51 32.10 31.92 33.14 32.10 33.57 34.42 32.56 36.34 41.63 June 30.60 32.05 31.51 31.18 31.32 32.96 32.54 33.40 34.08 32.84 36.41 40.7l July 30.57 32.53 31.52 30.90 31.37 33.11 32.49 33.38 33.94 33.13 36.46 39.00 August 30.73 34.05 31.53 31.48 31.48 33.45 33.16 33.56 34.32 36.87 38.38 Septormber 30.52 34.57 31.35 31.40 31.32 33.22 32.84 33.77 34.22 32.78 36.76 37.56 October 30.51 34.55 31.50 31.74 31.56 33.65 32.61 34.14 35.00 32.96 37.28 37.63 November 31.06 33.93 32.27 32.34 31.70 34.90 32.85 34.86 36.21 33.29 38.33 38.75 !
December 31.27 33.12 32.54 33.02 31.56 34.88 33.22 35.65 36.53 33.81 38.58 39.55
1958 January 31.82 34.00 33.19 33.38 31.70 35.76 34.39 36.03 37.05 34.74 39.08 39.30 February 30.72 33.49 32.11 32.19 30.86 34.72 34.61 35.42 36.10 34.24 37.98 38.93 March 30.00 32.55 31.18 31.38 30.35 34.02 34.46 34.97 34.94 33.58 36.37 38.39 April 29.92 33.65 31.16 31.76 30.29 34.00 34.62 34.62 35.10 33.81 36.60 37.57 May 30.33 34.30 31.50 31.61 30.08 34.36 34.61 34.61 35.45 33.96 36.63 36.58 June 30.89 34.08 32.06 30.99 29.40 34.30 33.90 34.56 35.24 33.23 36.38 36.73 July 31.06 34.11 32.59 29.55 28.97 34.23 32.07 32.71 35.10 31.95 36.24 36.11 August 31.03 34.72 32.26 29.36 28.78 33.79 31.99 32.28 34.64 32.14 36.08 36.20 September 30.42 35.12 31.39 28.54 28.25 32.88 31.24 31.97 33.72 31.39 35.24 35.22 October 30.17 32.13 31.38 29.24 28.13 33.28 30.18 31.35 33.97 30.17 35.31 32.79 November 29.87 29.60 31.27 27.91 27.33 33.17 29.08 30.11 33.95 29.38 35.26 30.92 December 29.58 29.00 31.18 26.29 25.17 32.51 27.82 28.41 33.33 28.85 34.94 30.21
1959 30.08 --:TiUiuary 29.05 30.09 30.98 26.68 24.55 32.33 27.24 27.53 33.22 27.87 34.48
February 28.72 30.01 30.21 26.58 25.16 31.69 27.43 26.16 32.61 27.72 33.81 29.41
March 28.34 29.50 30.17 26.95 25.19 31.60 26.81 25.78 32.44 27.46 33.67 30.22
April 28.80 28.12 30.51 27.46 25.49 32.10 27.64 25.58 32.86 27.99 34.15 31.75
May 29.24 29.33 31.30 27.85 26.53 33.34 29.24 28.69 33.34 29.54 33,72 34.74
June 24.61 29.94 25.72 27.16 27.30 27.36 28.80 28.56 28.27 29.52 29.68 36'.55
July 25.07 30.00 26.36 26.20 26.07 27.77 26.80 28.12 28.47 28.29 29.99 34.82 August 25.54 27.66 26.56 26.49 25.76 27.95 26.59 28.17 28.54 27.88 30.07
September 25.41 27.74 26.42 26.81 26.01 27.82 26.65 28.33 28.48 28.40 30.04 35.04 33.68 October 25.42 27.42 26.28 27.18 26.24 27.69 27.~4 28.53 28.64 28.70 29.74 33.72 November 25.96 28.89 26.96 27.46 27.02 28.32 27.46 29.14 29.17 28.83 30.15
December 26.87 31.75 28.04 28.10 27. 98 29.41 29.69 29.88 29.88 30.66 31.15 3~
]J Generally for prompt shipment. Prices for certain qualities were computed using value di£:ferences.
Source: Dudley Windel

cs-186 - 29 - JANUARY 1960
countries were maintained at relatively high levels, and consumption in importing countries again set a new record. U. s. exports of 7.6 million bales in 1956-57 and 5·7 million in 1957-58 constituted 48 percent and 40 percent, respectively, of total world trade. Foreign exporters, contrary to earlier fears, generally were able to dispose of surpluses of upland type cotton in 1956-)7 and 1957-58 at prices higher than those prevailing in late 1955.
With world consumption reaching a record level again in 1957-58 and with world production declining for the second successive year, due to smaller u.s. crops, prices in import markets increased about 2.5 cents per pound by the end of 1957 from the level at whicb foreign cotton sold late in 1955· However, the Liverpool price of around 33.00 cents per pound for U. s. Middling 1-1/32 inches cotton at the end of 1957 was about 6.50 cents lower than the price of this cotton at the end of 1955.
The 1957 world cotton crop outside the U. S. rose to record highs of 30.5 million bales. At the same time, a textile recession was developing in foreign consuming countries. As a result, mill inventories of textiles increased, cotton consumption declined, and the demand for cotton weakened. By spring of 1959, prices of most foreign growths reached the lowest point in many years as the 1958 foreign crop was again at a record high and offerings continued to increase in a declining market. (See figure 5 and tables 16 and 17.) Prices of most qualities of U. s. cotton showed only moderate declines until June of 1959 when sales for shipment beginning August 1 of that year began. Again, as in 1955-56, cotton stocks and consumption had declined in 1958-59 in foreign free world importing countries. Even with prices of many foreign growths at long-time low levels, cotton purchases generally were held to nearby requirements. World trade in 1958-59 declined to the 1955-56 level of 13.1 million bales and u. s. exports of 2.8 million amounted to 21 percent of world trade.
Export movement of u. s. cotton increased in the early months of the 1959-60 season as prices remained competitive. World trade in 1959-60 is expected to be the largest since the postwar high of 15.8 million bales in 1956-57, reflecting rising domestic and foreign consumption, rebuilding of stocks in major importing countries to more normal levels, and increasing demand for textiles as shown by mill orders extending well past mid-1960. Surplus supplies from foreign e~~orting countries were marketed in international trade early in the 1959-60 season at prices which did not reflect these strengthening influences. By late fall of 1959, as exportable supplies in a number of the larger surplus-producing countries abroad became depleted, prices strengthened and importers turned increasingly to a wider range of u. s. qualities. If U. s. exports in 1959-60 are at least 6.0 million bales as expected, the 4-year 1956-59 average of 5.5 million per year will constitute about 38 percent of total world trade in cotton. Exports in 1959-60 from Foreign Free World Countries, estimated at 7·5 million bales, will be close to the average of the last 5 years and will comprise most of the cotton these countries have available for export.
C.i.f. prices of additional growths and qualities of cotton in other import markets are available from the Foreign Agricultural Service on request.
CS-186 - 30 - JANUARy 1960 1/ TABLE 17.--Cotton: Average prices- of selected growths and qualities,
c. i. f, Bremen, Germany, annual 1953-55 and monthly 1956 to date
Date M 1-1/32" SM 1-1/32" SM 1-1/16" SM 1·1/8" Year and Honth u. s. Mexico Nica- u. s. Syria u.s.s.R.: u. s. Iran u. Uganda s. ragua B. p~
Eguiva1ent U. S. cents 12er 12ound -
1953 38.27 36.86 38.79 37.61 39.41 41.21 1954 39.40 38.90 39.98 40.52 40.50 42.21 1955 39.31 36.88 40.15 38.02 40.90 42.70
1956 January 40.29 33.10 31.40 42.35 35.28 43.17 35.20 44.92 February 41.43 36.27 35.24 43.55 37.31 44.31 37.75 46.06 .. March 41.78 37.11 34.63 43.70 38.12 44.45 38.92 46.20 April 41.98 37.12 33.70 43.63 36.61 44.38 38.50 46.13 May 42.36 37.43 34.35 43.78 36.34 44.49 38.27 46.24 June 43.09 36.63 33.95 43.95 35.79 44.70 36.85 46.45 July 37.21 33.04 32.40 38.41 39.16 35.72 40.91 August 30.34 29.57 31.50 31.77 31.69 32.52 35.55 34.27 September 29.48 29.97 31.13 30.85 32.08 31.52 33.62 33.27 October 30.24 31.24 30.96 31.60 32.54 32.37 33.87 34.34 47.08 November 31.40 32.30 31.18 32.65 33.90 33.45 34.68 35.24 49.31 December 31.76 33.36 31.40 33.19 34.28 33.94 35.05 35.80 49.35
1957 January 31.48 33.23 31.28 32.97 34.00 33.77 35.25 35.62 49.07 February 31.58 33.20 30.75 33.10 33.32 33.85 35.28 35.72 49.38 March 31.72 33.10 29.88 33.02 33.05 34.02 35.25 35.92 47.45 April 31.72 33.05 30.05 32.98 32.85 34.23 34.69 36.18 44.55 May 31.64 32.46 29.99 33.26 32.54 33.62 34.43 33.87 36.45 43.21 June 31.85 32.85 29.40 33.72 31.92 33.72 34.88 33.65 36.50 42.27 July 32.27 32.72 29.42 33.92 32.73 33.92 35.07 33.65 36.49 39.50 August 32.03 32.30 29.50 33.65 32.88 34.30 34.80 33.65 36.55 38.02 September 31.45 31.50 29.70 33.01 33.02 34.30 34.42 33.65 36.30 37.92 October 30.73 31.72 29.90 32.56 32.72 34.06 34.06 33.61 36.21 37.97 November 31.38 33.00 30.58 33.76 33.26 35.01 35.14 33.38 38.08 39.54 December 32.15 33.36 31.00 34.77 33.98 35.58 36.01 33.75 38.88 39.90
1958 January 32.20 33.60 31.28 34.98 34.25 35.85 36.22 33.58 38.62 39.58 February 31.52 33.22 30.22 34.32 34.08 35.40 35.58 33.40 38.05 38.90 March 31.00 32.80 29.50 33.90 33.85 35.22 35.15 32.85 37.75 38.48 April 30.40 32.32 28.88 33.55 33.44 34.79 34.84 32.74 36.79 37.58 May 30.78 32.05 28.80 33.78 32.72 34.58 35.02 32.32 36.05 37.00 June 30.78 31.22 28.45 33.82 32.60 34.30 35.08 31.62 36.12 37.70 July 31.60 30.06 27.84 33.79 31.72 32.93 35.04 31.02 36.29 36.74 August 31.45 29.94 27.91 33.69 30.70 32.52 34.94 30.99 36.45 36.40 September 31.12 28.18 33.12 29.78 31.85 34.02 30.65 36.32 35.10 October 30.94 28.91 .32.88 29.88 30.97 33.78 30.26 36.10 33.62 November 30.98 28.40 33.00 29.32 30.54 33.90 30.22 35.85 31.42 December 30.60 27.35 25.30 32.90 28.83 29.58 33.80 29.60 35.33 30.96
1959 30.71 January 30.00 26.82 23.88 32.22 27.65 27.40 33.12 28.18 35.15
February 29.55 26.98 24.45 31.72 27.10 26.52 32.62 28.25 35.00 30.38 March 29.60 27.05 24.62 31.32 26.58 26.18 32.22 27.88 34.75 30.16 April 29.40 27.08 25.00 31.21 26.63 26.59 32.08 27.18 34.64 31,60 May 29.80 27.30 25.81 31.75 28.72 27.45 32.45 28.32 34.52 33.82 June 29.80 27.66 26.55 32.05 28.95 27.70 32.75 28.80 34.95 35.46 July 29.68 27.08 26.24 31.83 28.29 27.65 32.68 28.88 35.12 35.63 August 28.50 26.58 26.10 30.38 28.02 27.65 31.29 28.90 35.10 35.32 September 26.44 26.95 26.10 28.35 28.34 29.35 31.00 34.17 October 26.25 27.15 26.30 27.78 28.48 28.65 28.30 30.88 33.10 November 26.32 27.02 26.61 27.80 28.54 28.68 28.52 30.84 32.32 December 27.56 27.69 27.74 29.00 30.29 29.56 29.82 28.90 32.03 38.7~
lf For prompt shipment. Prices for certain qualities were computed using value differences.
Source: Trade and Market Reports
Country o:f
destination
Europe United Kingdom Austria Belgium and Lwcembourg Denmark Eire Finland France Germany (West) Italy Netherlands Norway Portugal Spain Sweden Switzerland Trieste Yugoslavia other
Total Europe
other Countries Canada Colombia Chile India Pakistan Indonesia Korea Hong Kong Taiwan Japan Australia Morocco Union o:f South A:frica: other
World total
Table lB.--cotton: Exports, by staple length and by countries of destination, United States, October and November 1959 and cumulative totals since August 1, 1959
October 1959 November 1959 Cumulative totals since Aug. 1, 1959 1-1/8 l inch : 1-l/8 l inch : : l-l/8 : l inch
inches to : Under inches to : Under : inches : to and l-1/8 : l inch Total : and l-l/8 : 1 inch : Total and : 1-l/8
over JJ inghes : : : over 1/: inches : . _:_ : over 1/: inches Running Running Running Running Running Running Running Running Running Running ~ bales bales bales bales bales bales bales bales ~
3,547 261
4 305
0 416
4,969 4,811 2,029 4,286
50 0 0 0
623 0 0 0
21,301
320 0 0
5,905 308
0 0 0 0
2,513 481
0 0
1,525
32,353
26,922 1,100 6,585
790 0
5,904 32,609 24,788 24,657 6,174
142 0 0
2,868 5,553
0 0
8,893
146,985
10,551 0
874 240
0 2,734
282 2,360 1,009
12,563 2,171
225 920
13,201
194,115
18,530 938
2,956 31
118 0
4,849 2,464 9,695
703 50 0 0
870 1,334
0 100
6,321
48,959
823 0
22 0 0
71 9,362
24,945 18,248 58,202
50 911
0 4,001
165,594
48,999 2,299 9,545 1,126
118 6,320
42,427 32,063 36,381 11,163
242 0 0
3,738 7,510
0 100
15,214
217,245
11,694 0
896 6,145
308 2,805 9,644
27,305 19,257 73,278 2,702 1,136
920 18,727
392,062
5,436 158 350 201
0 450
8,445 6,725 2,912
13,376 100
0 0 0
2,299 0 0 0
40,452
100 0
734 3,478
0 0 0 0
199 3,663
153 0
4oo 2,910
52,089
24,707 1,080
17,076 215 276
7,558 47,597 49,452 44,231 12,154 1,145
0 0
8,369 10,505
110 0
9,302
233,777
25,956 0
322 487
0 0
1,720 5,001 2,100
70,560 7,363 2,236 1,190
16,423
367,135
16,594 373
3,736 300
0 361
9,649 2,552
15,532 699 300
0 0
1,613 1,793
0 0
3,038
56,540
2,594 0 0 0 0 0
27,034 22,609 29,585 86,289
556 0
1,437 5,667
232,311
46,737 1,611
21,162 716 276
8,369 65,691 58,729 62,675 26,229 1,545
0 0
9,982 14,597
110 0
12,340
330,769
28,650 0
1,056 3,965
0 0
28,754 27,610 31,884
160,512 8,072 2,236 3,027
25,000
651,535
8,983 664 354 506
5 866
14,634 13,606 6,908
17,662 150
0 0 0
3,172 0 0 0
67,510
920 0
784 10,220
308 0
97 0
199 6,874
709 0
400 5,119
93,140
66,849 3,421
28,616 1,655
276 17,294
102,484 84,071 85,522 21,633 1,487
0 0
14,384 17,887
123 0
42,535
488,237
39,567 0
1,403 968
0 8,460 5,625
10,115 5,046
86,973 13,063
3,129 2,814
33,831
699,231
Under : l inch :
Running ~
48,411 1,610
11,173 1,221
322 469
20,979 9,542
37,730 3,004
550 0 0
2,833 4,024
0 100
18,838
160,806
5,696 0
530 0 0
294 61,728 69,841 55,934
204,750 656 911
3,067 15,264
Total
Running bales
124,243 5,695
40,143 3,382
603 18,629
138,097 107,219 130,160
42,299 2,187
0 0
17,217 25,083
123 100
61,373
761,553
46,183 0
2,717 11,188
308 8,754
67,450 79,956 61,179
298,597 14,428 4,o4o 6,281
54,214
579,477 1,371,848
!f Includes American Egyptian and Sea Island cotton.
Bureau o:f the Census.
0 til I
~
VJ 1-'
~ ~ 1-'
~ 0
cs-186 - 32 - JANUARY 1960
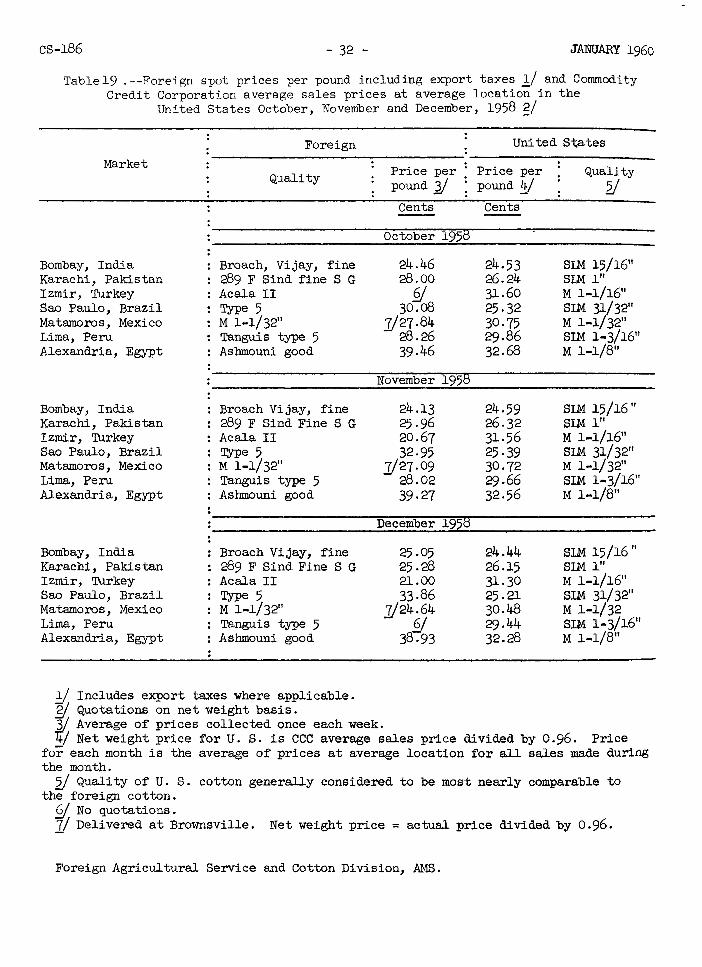
Tablel9 .--Foreign spot prices per pound including export taYes l/ and Commodity Credit Corporation average sales prices at average location in the
United States October, November and December, 1958 g/
Foreign Market
Quality
Bombay, India Broach, Vijay, fine Karachi, Pakistan 289 F Sind fine S G Izmir, Turkey Acala II Sao Paulo, Brazil Type5 Matamoros, Mexico M 1-1/32" Lima, Peru Tanguis type 5 Alexandria, Egypt Ashmouni good
Bombay, India Broach Vijay, fine Karachi, Pakistan 289 F Sind Fine S G Izmir, Turkey Acala II Sao Paulo, Brazil Type5 Matamoros, Mexico M 1-1/32" Lima, Peru Tanguis type 5 Alexandria, Egypt Ashmouni good
Bombay, India Broach Vijay, fine Karachi, Pakistan 289 F Sind Fine S G Izmir, Turkey Acala II Sao Paulo, Brazil Type 5 Matamoros, Mexico M 1-1/32" Lima, Peru Tanguis type 5 Alexandria, Egypt Ashmouni good
~ Includes export taxes where applicable. W, Quotations on net weight basis.
United Si;ates
Price per Price per Quality pound '1J pound!!/ 2/
Cents Cents
October 1958
24.46 24.53 SLM 15/1611
28.00 26.24 SIM 111
§/ 31.60 M 1-1/16" 30.08 25-32 SIM 31/32"
J./27.84 30-75 M 1-1/32" 28.26 29.86 SIM 1-3/16" 39-46 32.68 M 1-1/8"
November 1958
24.13 24.59 SIM 15/16" 25-96 26.32 SIM l" 20.67 31.56 M 1-1/16" 32-95 25-39 SLM 31/32"
J./27.09 30-72 M 1-1/32" 28.02 29-66 SIM 1·3/16" 39-27 32-56 M 1-1/8"
December 1958
25-05 24.44 SLM 15/16" 25.28 26.15 SIM 1" 21.00 31-30 M 1-1/16" 33-86 25.21 SIM 31/32"
J./24.64 30.48 M 1-l/32 §/ 29-44 SIM 1-3/16"
38.93 32.28 M 1-1/8"
3/ Average of prices collected once each week. 1jj Net weight price for U. S. is CCC average sales price divided by 0. 96. Price
for each month is the average of prices at average location for all sales made during the month.
2/ Quality of U. S. cotton generally considered to be most nearly comparable to the foreign cotton.
£/. No quotations. 1/ Delivered at Brownsville. Net weight price = actual price divided by 0.96.
Foreign Agricultural Service and Cotton Division, AMS.
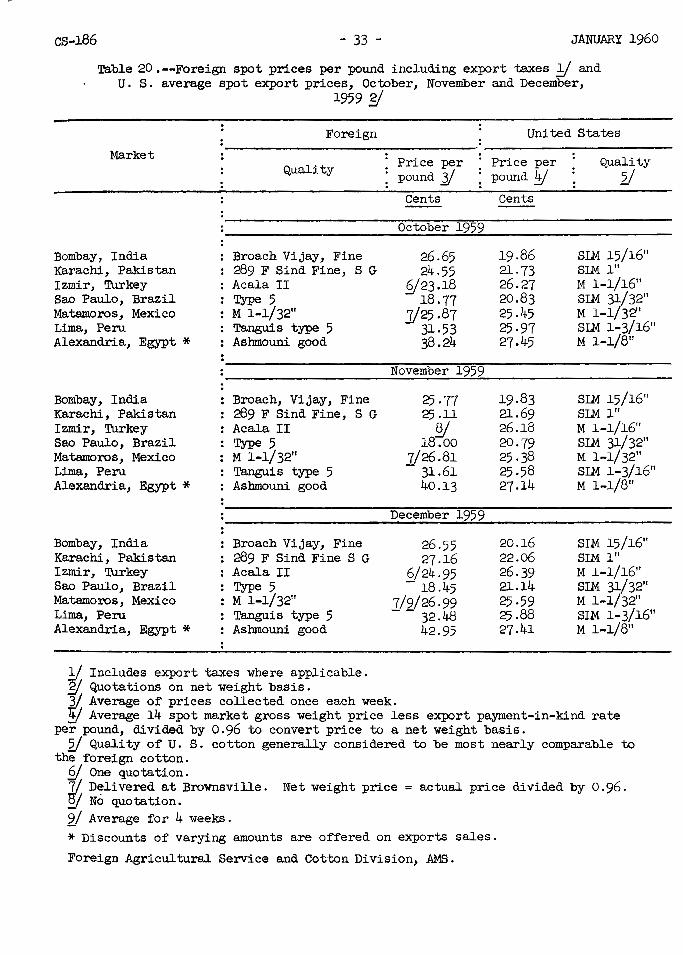
cs-186 - 33 - JANUARY 1960
Table 20 . --Foreign spot prices per pound including export taxes y and u. S. average spot export prices, October, November and December,
1959 '31
Foreign United States
Market
Bombay, India Karachi, Pakistan Izmir, Turkey Sao Paulo, Brazil Matamoros, Mexico Lima, Peru Alexandria, Egypt *
Bombay, India Karachi, Pakistan Izmir, Turkey Sao Paulo, Brazil Matamoros, Mexico Lima, Peru Alexandria, Egypt *
Bombay, India Karachi, Pakistan Izmir, Turkey Sao Paulo, Brazil Matamoros, Mexico Lima, Peru Alexandria, Egypt *
Quality
Broach Vijay, Fine 289 F Sind Fine, S G Acala II Type 5 M 1-1/32" Tanguis type 5 Ashmouni good
Broach, Vijay, Fine 289 F Sind Fine, S G Acala II Type5 M 1-1/32" Tanguis type 5 Ashmouni good
Broach Vijay, Fine 289 F Sind Fine S G Acala II Type 5 M 1-1/32" Tanguis type 5 Ashmouni good
1/ Includes export taxes where applicable. 3/ Quotations on net weight basis.
Price per pound 1/
Cents
October 1959
26.65 24.55
§/23.18 18.77
]/25.87 31.53 38.24
November 1959
25 ·77 25.ll
§I 18.00
]/26.81 31.61 40.13
December 1959
26.55 27.16
§/24.95 18.45
7/9/26.99 -- 32.48
42.95
Price per pound Y
Cents
19.86 21.73 26.27 20.83 25.45 25·97 27.45
19.83 21.69 26.18 20.79 25.38 25.58 27.14
20.16 22.06 26.39 21.14 25 ·59 25.88 27.41
Quality
21
SI.M 15/16" SI.M 1" M 1-1/16" SI.M 31/32" M 1-1/32" SI.M 1-3/16" M 1-1/8"
SI.M 15/16" SI.M 1" M 1-1/16" SI.M 31/32" M 1-1/32" SIM 1-3/16" M 1-1/8"
SIM 15/16" SIM l" M l-1/16" SIM 31/32" M 1-1/32" SIM l-3/16" M l-l/8"
3/ Average of prices collected once each week. fjj Average 14 spot market gross weight price less export payment-in-kind rate
per pound, divided by 0.96 to convert price to a net weight basis. 2/ Quality of U. S. cotton generally considered to be most nearly comparable to
the foreign cotton. §/. One quotation. 7/ Delivered at Brownsville. Net weight price = actual price divided by 0.96. ~ No quotation. 2/ Average for 4 weeks.
*Discounts of varying amounts are offered on exports sales.
Foreign Agricultural Service and Cotton Division, AMS.

Table 21.--Unfinished cloth prices, cotton prices, and mill margins on 20 selected constructions, 0 United States, by months, 1954 to date Ul
I
~ ()'\
Year begin- : : : : : : Feb. : : Apr. : May : June : July : Aver-Aug. Sept. : Oct. Nov. Dec. Jan. Mar. ning : : : : : : : : : : : : age August : : : :
Cents Cents Cents Cents Cents Cents Cents Cents Cents Cents Cents Cents Cents
Cloth prices y 1954 : 60.75 60.98 61.48 61.13 61.24 62.19 62.42 62.04 61.47 61.27 61.58 61.89 61.54 1955 : 62.35 62.86 63-71 64.40 65.30 65.49 65.46 64.88 64.33 63.96 63.33 62.51 64.05 1956 : 61.78 61.74 63.21 62.93 62.54 62.00 61.11 60.52 60.18 59.74 59-52 59.42 61.22 1957 : 59.17 58.86 58.36 58.13 58.55 58.57 58.24 57.86 57.45 56.72 56.74 56.79 57.97 1958 : 56.98 56.99 57.14 58.13 58.98 59.41 60.50 61.63 62.22 62.69 63.25 63.78 60.14 1959 : 64.09 64.38 64.81 65.59 66.37
Cotton prices g(
1954 : 35.88 36 1~7 36.36 35.90 36.25 36.29 36.41 34.65 35-78 36.54 36.61 36.48 36.22 1955 : 36.29 35-30 35-33 36.07 35-78 36.32 37.12 37-05 36.69 36.76 36.85 35-72 36.27 1956 : 33.93 33.93 34.09 34.35 34.43 34.79 35.07 34.70 34.68 34.71 34.74 34.75 34.51 I..<)
+="" 1957 : 31~.08 33.78 34.34 35.77 35.74 35-13 34.98 34.75 34.70 34.92 35.03 35-14 34.86 1958 : 34.68 34.75 34.98 34.77 33-92 34.40 34.53 34.72 35.04 35.02 35.05 35.03 34.74 1959 : 33.73 32.97 32.20 32.55 33.17
Mill margins 'lJ I
1954 : 24.87 24.51 25.12 25.23 24.99 25.90 26.01 25.39 25.69 24.73 24.97 . 25.41 25.32 1955 : 26.o6 27.56 28.38 28.33 29.52 29.17 28.34 27.83 27.64 27.20 26.48 26.79 27.78 1956 : 27.85 27.81 29.12 28.58 28.11 27.21 26.04 25.82 25.50 25.03 24.78 24.67 26.71 1957 : 25.09 25.o8 24.02 22.36 22.81 23.44 23.26 23.11 22.75 22.00 21.71 21.65 23.11 1958 : 22.30 22.24 22.16 23.36 25.06 25.01 25.97 26.91 27.18 27.67 28.20 28.75 25.40 1959 : 30.36 31.41 32.61 33.04 33.20
!/ Average Wholesale price for 20 selected constructions. 1:-j
Prices per yard are converted to the approximate value of clotb I obtain~ble from a pound·of cotton.
g( Average monthly price based on landed quotations (Group 201 mill points) for four growths - Southeastern, Memphis Terri-..... tory, Texas -Oklahoma and California. \() ()'\
1( Difference between cloth prices and prices for the average qualities of cotton used in the 20 constructions. 0
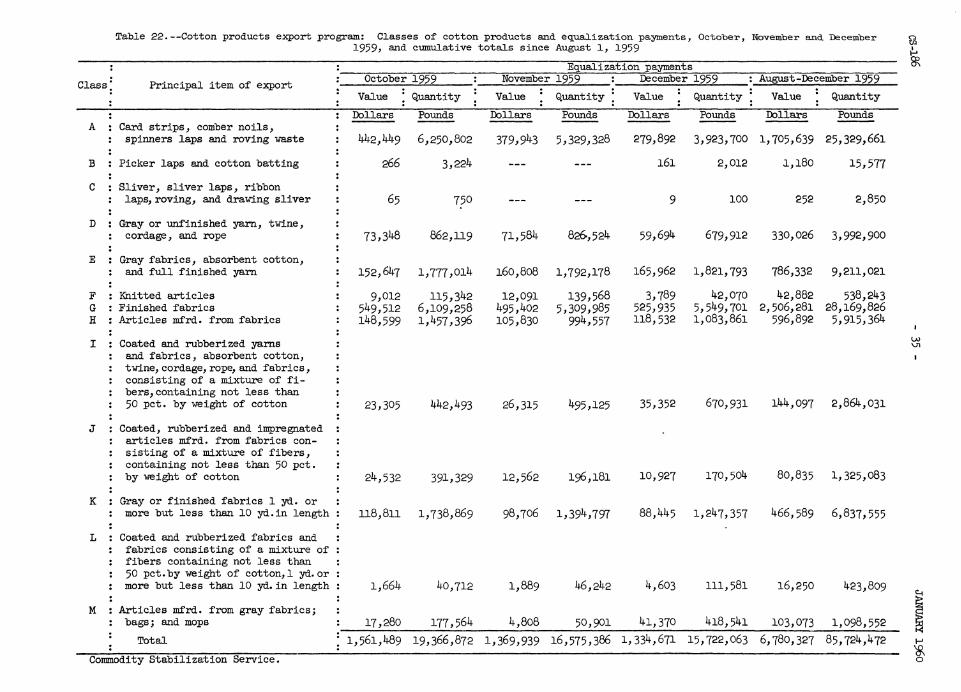
Table 22.--Cotton products export program: Classes of cotton products and equalization payments, October, November and December Q m 1959, and cumulative totals since August l, 1959 I 1-'
E~ualization payments ~
Class: Principal item of export : October 1959 : November 1959 December 1959 : August-December 1959 : Value : Quantity : Value : Quantity Value : Quantity ~ Value : Quantity
: : : : Dollars Pounds Dollars Pounds Dollars Pounds Dollars Pounds
A : Card strips, comber noils, : spinners laps and roving waste : 442,449 6,250,802 379,943 5,329,328 279,892 3,923,700 1,705,639 25,329,661
B : Picker laps and cotton batting : 266 3,224 --- --- 161 2,012 ~,180 15,577 : :
c : Sliver, sliver laps, ribbon laps, roving, and draWing sliver : 65 750 --- --- 9 100 252 2,850
: D : Gray or unfinished yarn, tWine,
cordage, and rope : 73,348 862,119 71,584 826-,524 59,694 679,912 330,026 3,992,900 : :
E : Gray fabrics, absorbent cotton, and full finished yarn : 152,647 1,777,014 160,808 1,792,178 165,962 1,821,793 786,332 9,2ll,021
F : Knitted articles : 9,012 ll5,342 12,091 139,568 3,789 42,070 42,882 538,243 G : Finished fabrics : 549,512 6,109,258 495,402 5,309,985 525,935 5,549,701 2,506,281 28,169,826 H : Articles mfrd. from fabrics : 148,599 1,457,396 105,830 994,557 ll8,532 1,083,861 596,892 5,915,364
I : Coated and rubberized yarns : w \Jl
and fabrics, absorbent cotton, tWine, cordage, rope, and fabrics, consisting of a mixture of fi-bers,containing not less than 50 pet. by weight of cotton : 23,305 442,493 26,315 495,125 35,352 670,931 144,097 2,864,031
: J : Coated, rubberized and impregnated
articles mfrd. from fabrics con-sisting of a mixture of fibers, containing not less than 50 pet. by weight of cotton : 24,532 391,329 12,562 196,181 10,927 170,504 80,835 1,325,083
: K : Gray or finished fabrics l yd. or
more but less than 10 yd.in length : ll8,8ll 1,738,869 98,706 1,394,797 88,445 1,247,357 466,589 6,837,555 :
L : Coated and rubberized fabrics and fabrics consisting of a mixture of fibers containing not less than 50 pct.by weight of cotton,l yd. or more but less than 10 yd. in length : 1,664 40,712 1,889 46,242 4,603 lll,581 16,250 423,809
~ M : Articles mfrd. from gray fabrics; : bags; and mops : 17,280 177,564 4,808 50,901 41,370 418,541 103,073 1,098,552 ~
Total : 1,561,489 19,366,872 1,369,939 16,575,386 1,334,671 15,722,063 6,780,327 85,724,472 1-'
'8-Commodity Stabilization Service. 0
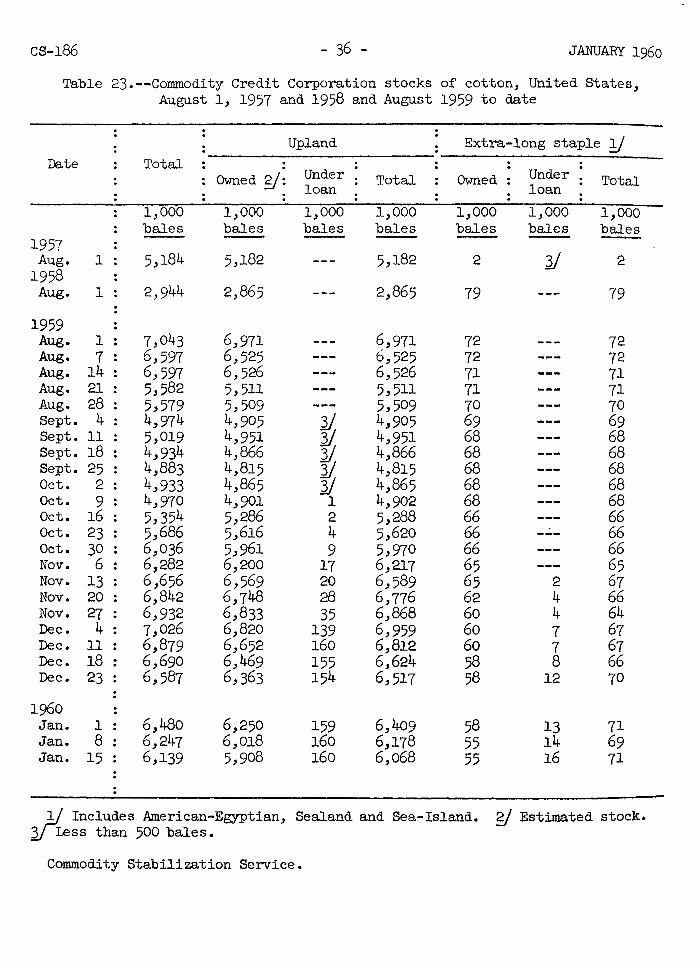
CS-186 - 36 - JANUARY 1960
Table 23.--Commodity Credit Corporation stocks of cotton, United States, August 1, 1957 and 1958 and August 1959 to date
Upland Extra-long staple !J Date Total . .
Owned gj: Under Total Owned : Under Total loan loan 1,000 1,000 1,000 1,000 1,000 1,000 1,000 bales bales bales bales bales bales bales
1957 Aug. l 5,184 5,182 5,182 2 ~ 2
1958 Aug. l 2,944 2,865 2,865 79 79
1959 Aug. 1 7,043 6,971 6,971 72 72 Aug. 7 6,597 6,525 6,525 72 72 Aug. 14 6,597 6,526 6,526 71 71 Aug. 21 5,582 5,511 5,511 71 71 Aug. 28 5,579 5,509 5,509 70 70 Sept. 4 4,974 4,905 :Y 4,905 69 69 Sept. 11 5,019 4,951 I/ 4,951 68 68 Sept. 18 4,934 4,866 I/ 4,866 68 68 Sept. 25 4,883 4,815 I/ 4,815 68 68 Oct. 2 4,933 4,865 ~ 4,865 68 68 Oct. 9 4,970 4,901 1 4,902 68 68 Oct. 16 5,354 5,286 2 5,288 66 66 Oct. 23 5,686 5,616 4 5,620 66 --- 66 Oct. 30 6,036 5,961 9 5,970 66 66 Nov. 6 6,282 6,200 17 6,217 65 65 Nov. 13 6,656 6,569 20 6,589 65 2 67 Nov. 20 6,842 6,748 28 6,776 62 4 66 Nov. 27 6,932 6,833 35 6,868 60 4 64 Dec. 4 7,026 6,820 139 6,959 60 7 67 Dec. 11 6,879 6,652 160 6,812 60 7 67 Dec. 18 6,690 6,469 155 6,624 58 8 66 Dec. 23 6,587 6,363 154 6,517 58 12 70
1960 Jan. 1 6,480 6,250 159 6,409 58 13 71 Jan. 8 6,247 6,018 160 6,178 55 14 69 Jan. 15 6,139 5,908 160 6,068 55 16 71
1/ Includes American-Egyptian, Sealand and Sea-Island. gj Estimated stock. 'Jr"I~ss than 500 bales.
Commodity Stabilization Service.
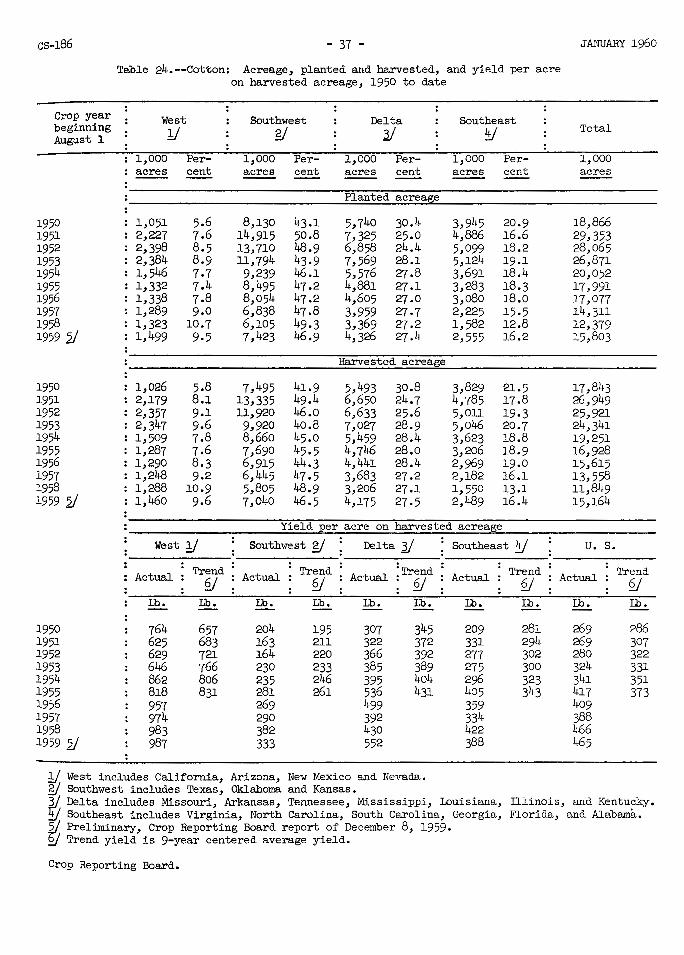
cs-186 - 37 - JANUARY 1960
Table 24.--Cotton: Acreage, planted and harvested, and yield per acre on harvested acreage, 1950 to date
Crop year West Southwest Delta Southeast beginning y gj 2/ y Total August 1
1,000 Per- 1,000 Per- 1,000 Per- 1,000 Per- 1,000 acres cent acres cent acres cent acres cent acres
Planted acrea!lie
1950 1,051 5.6 8,130 43.1 5,740 30.4 3,945 20.9 18,866 1951 2,227 7.6 14,915 50.8 7,325 25.0 4,886 16.6 29,353 1952 2,398 8.5 13,710 48.9 6,858 24.4 5,099 18.2 28,065 1953 2,384 8.9 11,794 43.9 7,569 28.1 5,124 19.1 26,871 1954 1,546 7·7 9,239 46.1 5,576 27.8 3,691 18.4 20,052 1955 1,332 7.4 8,495 47.2 4,881 27.1 3,283 18.3 17,991 1956 1,338 7.8 8,054 47.2 4,605 27.0 3,o8o 18.0 17,077 1957 1,289 9.0 6,838 47.8 3,959 27.7 2,225 15.5 14,311 1958 1,323 10.7 6,105 49.3 3,369 27.2 1,582 12.8 12,379 1959 2/ 1,499 9·5 7,423 46.9 4,326 27.4 2,555 16.2 15,803
Harvested acreage
1950 1,026 5.8 7,495 41.9 5,493 30.8 3,829 21.5 17,843 1951 2,179 8.1 13,335 49.4 6,650 24.7 4,785 17.8 26,949 1952 2,357 9·1 11,920 46.0 6,633 25.6 5,011 19.3 25,921 1953 2,347 9.6 9,920 40.8 7,027 28.9 5,046 20.7 24,341 1954 1,509 7.8 8,660 45.0 5,459 28.4 3,623 18.8 19,251 1955 1,287 7.6 7,690 45.5 4,746 28.0 3,206 18.9 16,928 1956 1,290 8.3 6,915 44.3 4,441 28.4 2,969 19.0 15,615 1957 1,248 9.2 6,445 47 ·5 3,683 27.2 2,182 16,1 13,558 1958 1,288 10.9 5,805 48.9 3,206 27.1 1,550 13.1 11,849 1959 2/ 1,460 9.6 7,040 46.5 4,175 27.5 2,489 16.4 15,164
Yield per acre on harvested acreage West y Southwest g) Delta 1J Southeast !3) u. s.
Actual Trend Actual Trend Actual :Trend Actual Trend Actual Trend y y ·y y y
Lb. Lb. Lb. Lb. Lb. Lb. ill. ill. Lb. ill.
1950 764 657 204 195 307 345 209 281 269 286 1951 625 683 163 211 322 372 331 294 269 307 1952 629 721 164 220 366 392 277 302 280 322 1953 646 766 230 233 385 389 275 300 324 331 1954 862 806 235 246 395 404 296 323 341 351 1955 818 831 281 261 536 431 405 343 417 373 1956 957 269 499 359 409 1957 974 290 392 334 388 1958 983 382 430 422 466 1959 2/ 987 333 552 388 465
!/ West includes California, Arizona, New Mexico and Nevada. gj Southwest includes Texas, Oklahoma and Kansas. ~ Delta includes Missouri, Arkansas, Tennessee, Mississippi, Louisiana, Illinois, and Kentucky. ~ Southeast includes Virginia, North Carolina, South Carolina, Georgia, Florida, and Alabama. ~ Preliminary, Crop Reporting Board report of December 8, 1959. §/ Trend yield is 9-year centered average yield.
Crop Reporting Board.

CS-186 - 38 - JANUARY 1900
Table 25~--Production of cotton by regions, United States, 1930 to date
Crop Production Percentage of U. S. crop year . .
begin- : West South- : Delta South- United West : South- : Delta : South-ning : y west States east : States y west · States: east
Aug. 1 gj J/ J!f gj J/ : y : 1,000 1,000 1,000 1,000 1,000 : bales bales bales bales bales : 500 500 500 500 500 : lb. lb. lb. lb. lb. : gr.wt. gr.wt. gr.wt. gr.wt. gr.wt. Pet. Pet. Pet. Pet. -
1930 519 4,892 3,589 4,933 13,932 4 35 26 35 1931 393 6,582 5,464 4,658 17,097 2 39 32 27 1932 270 5,584 3,921 3,228 13,003 2 43 30 25 1933 i.Jo7 5,694 3,389 3,556 13,047 3 44 26 27 1934 466 2,722 3,157 3,291 9,636 5 28 33 34 1935 449 3,523 3,1'7J. 3,495 10,638 4 33 30 33 1936 774 3,223 4,724 3,708 12,399 6 26 38 30 1937 1,214 5,927 6,787 5,017 18,946 6 31 36 27 1938 716 3,649 4,572 3,001 11,943 6 31 38 25 1939 747 3,372 4,645 3,052 11,817 6 29 39 26
l94o 868 4,036 4,122 3,51Jo 12,566 1 32 33 28 1941 .691 3,310 4,266 2,417 10,744 6 31 4o 23 1942 7o6 3,746 5,108 3,256 12,817 6 29 lJo 25 1943 580 3,207 4,502 3,138 11,427 5 28 39 28 1944 579 3,28o 4,939 3,432 12,230 5 27 4o 28 1945 576 2,079 3,644 2,716 9,015 1 23 4o 30 1946 . 758 1,931 3,413 2,539 8,64o 9 22 39 30 1947 : 1,185 3,161 4,192 2,716 11,860 10 32 35 23 1948 : 1,532 3,527 6,282 3,536 14,877 10 24 42 24 1949 : 2,087 6,650 4,878 2,512 16,128 13 41 30 16
. 1950 : 1,639 3,188 3,518 1,667 10,014 16 32 35 17 1951 : 2,842 4,536 4,467 3,304 15,Jh.8 19 30 29 22 1952 : 3,098 4,072 5,068 2,901 15,139 21 27 33 19 1953 : 3,167 4,754 5,646 2,899 16,465 19 29 34 18 1954 : 2,716 4,233 4,507 2,21Jo 13,697 20 31 33 16 1955 : 2,201 4,502 5,313 2,705 14,721 15 31 36 18 1956 : 2,578 3,876 4,629 2,227 13,310 19 29 35 17 1957 : 2,539 3,895 3,011 1,520 10,964 23 36 27 14 1958 21. : 2,644' 4,621 2,883' 1,364' 11,512' 23 4o 25 12 1 . 00 4 88 4 802 2011 14 01 20 3 33 14 .
l West includes California, Arizona, New Mexico end Nevada. gj Southwest includes Texas, Oklahoma and Kansas. ~ Delta includes Missouri, Arkansas, Tennessee, Mississippi, Louisiana, Illinois,
and Kentucky. J!f Southeast includes Virginia, North Carolina, South Carolina, Georgia, Florida,
and Alabama. 2/ Crop Reporting Board report of December 8, 1959·
Crop Reporting Board.

cs-186
Item
Acreage: Allotments
Harvested: Foreign countries United States
Planted
Carryover
Commodity Credit Corporation: Acquisitions Sales Program Stocks
Consumption: Foreign countries
United States: Annual Daily ra. te Military Monthly Per capita.
Cottonseed and products
Exports: Cotton products Government financed Program for 1959-60 Total, lint
Imports
Linters: Prices Supply and distribution
Loan rates:
Manmade fibers: Production Consumption
- 39 - JANUARY l9l?O
Index to 1959 Issues
Issue
Mar . , May, Nov.
Nov. May, July, Nov.
July
Jan., Sept., Nov.
Jan. , May, Sept. May, July Jan. , Mar. , May, July, Sept. , Nov. -
Jan., Mar., Nov.
Jan., Mar., May Jan., Mar., May, July, Sept., Nov. Mar. , May, July, Sept. , Nov. Jan., Ma.r. , May Mar., Nov.
Nov.
Ja.n., Mar., May, Ja.n., Mar., May, May Ja.n., Mar., May,
Jan., Mar., May,
Jan., July, Nov. July, Nov.
Mar. , July, Nov. Mar., Nov.
July, Sept., Nov. July, Sept., Nov.
July, Sept., Nov.
July
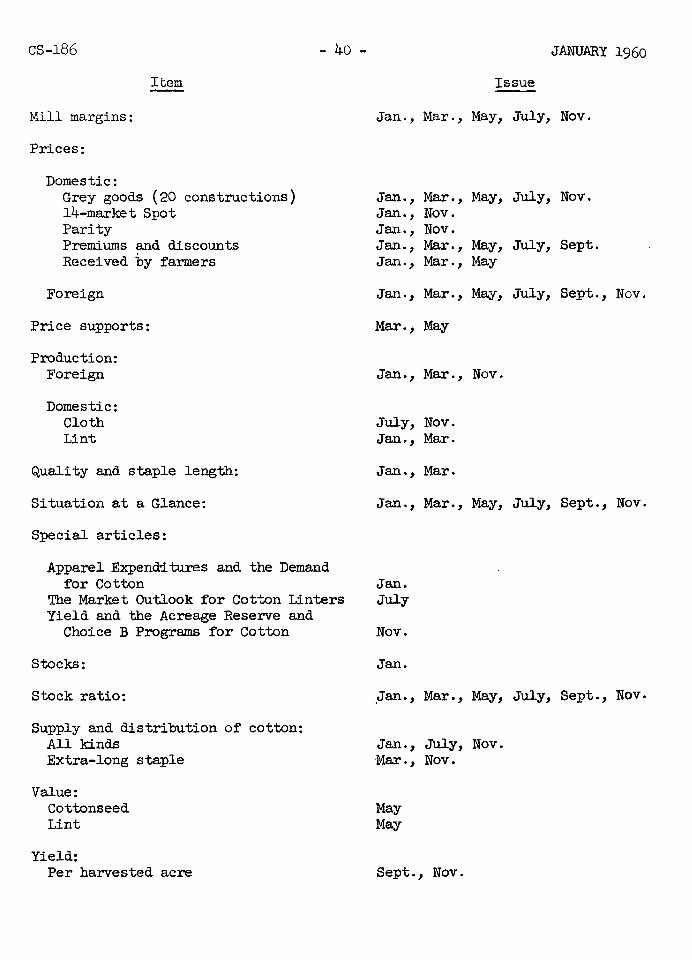
CS-186
Item
Mill margins:
Prices:
Domestic: Grey goods (20 constructions) 14-market Spot Parity Premiums and discounts Received by farmers
Foreign
Price supports:
Production: Foreign
Domestic: Cloth Lint
Quality and staple length:
Situation at a Glance:
Special articles:
- 40 -
Apparel Expenditures and the Demand for Cotton
The Market Outlook for Cotton Linters Yield and the Acreage Reserve and
Choice B Programs for Cotton
Stocks:
Stock ratio:
Supply and distribution of cotton: All kinds Extra-long staple
Value: Cottonseed Lint
Yield: Per harvested acre
JANUARY 1960
Issue
Jan. , Mar. , May, July, Nov.
Jan., Mar., May, Jan., Nov. Jan., Nov. Jan., Mar., May, Jan., Mar., May
Jan., Mar., May,
Mar., May
Jan., Mar., Nov.
July, Nov. Jan., Mar.
Jan., Mar.
July, Nov.
July, Sept.
July, Sept., Nov.
Jan., Mar., May, July, Sept., Nov.
Jan. July
Nov.
Jan .
. Jan., Mar., May, July, Sept., Nov.
Jan., July, Nov. ·Mar., Nov.
May May
Sept., Nov.
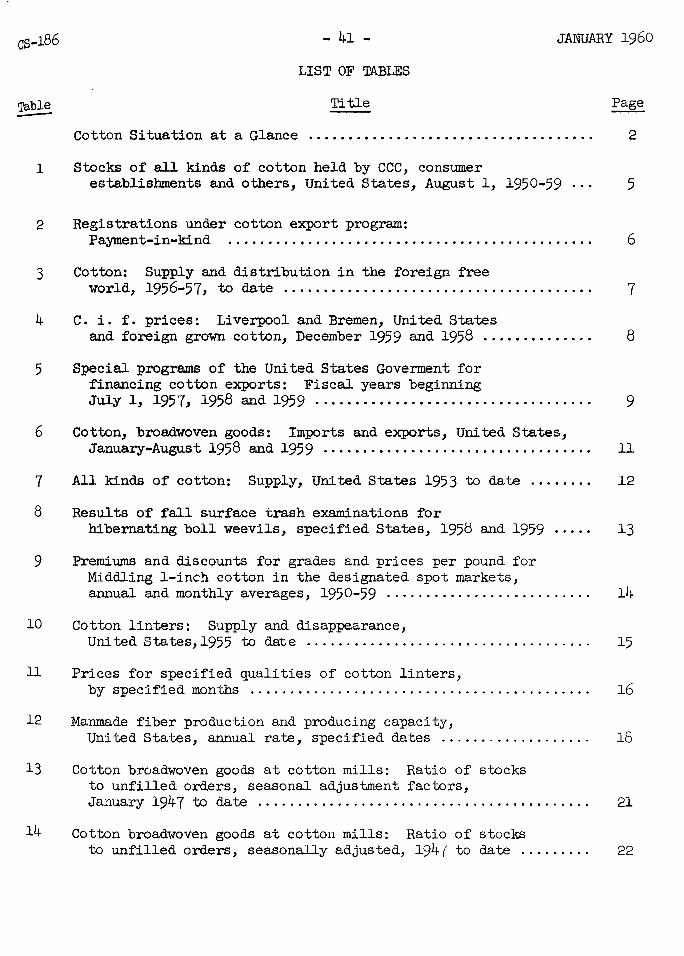
cs-186
Table -1
2
3
4
5
6
7
8
9
10
11
12
13
14
- 41 - JANUARY 1960
LIST OF TABLES
Title
Cotton Situation at a Glance
Stocks of all kinds of cotton held by CCC, consumer establishments and others, United States, August 1, 1950-59 ...
Registrations under cotton export program: PaYJilent-in-kind .•...•.•.•........•.••........................
Cotton: Supply and distribution in the foreign free wor 1d, 1956-5 7, to date •••..•.•...•.............•.............
C • i. f. prices: Liverpool and Bremen, United States and foreign grown cotton, December 1959 and 1958 ............. .
Special programs of the United States Goverment for financing cotton exports: Fiscal years beginning July l, 1957, 1958 and 1959 ................................. ..
Cotton, broadwoven goods: Imports and exports, United States, January-August 1958 and 1959 .......•..........................
All kinds of cotton: Supply, United States 1953 to date ....... .
Results of fall surface trash examinations for hibernating boll weevils, specified States, l95b and 1959
Premiums and discounts for grades and prices per pound for Middling l-inch cotton in the designated spot markets, annual and monthly averages, 1950-59 ......................... .
Cotton linters: Supply and disappearance, United States,l955 to date ................................... .
Prices for specified qualities of cotton linters, by specified months .......................................... .
Manmade fiber production and producing capacity, United States, annual rate, specified dates .................. .
Cotton broadwoven goods at cotton mills: Ratio of stocks to unfilled orders, seasonal adjustment factors, January 194 7 to date ......................................... .
Cotton broadwoven goods at cotton mills: Ratio of stocks to unfilled orders, seasonally adjusted, 194( to date ........ .
2
5
6
7
8
9
ll
12
13
14
15
16
18
21
22
CS-186 - 42 - JANUARY 1960
LIST OF TABLES -Continued
Table Title Page
15 Length of cycles during postwar years, stock-unfilled order ratio . . . . . . . . . . . . . . . . . . . . . . . . . . . . . . . . . . . . . . . . . . . . . . . . . . 24
16 Cotton: Average prices of selected growths and qualities c. i. f. Liverpool, England, annual 1952-55 and montlll.y 1956 "to date . • • . • • • • • • • • • . • • • • • • • • • • • • • • • • • • • • • • • • • • • 28
17 Cotton: Average prices of selected growths and qualities, c. i. f. Bremen, Germany, annual 1953-55 and monthly 1956 "to date . . . . . . . . . . . • . . . . . . . . . . . . . . . . . . . • . . . . . • . . . 30
18 Cotton: Exports, by staple length and by countries of destination, United States, October and November 1959 and cumulative totals since August 1, 1959 ............•...... 31
19 Foreign spot prices per pound including export taxes and CCC average sales prices at average location in the United States, October, November and December 1958 . . . . . . . . . . . . . . . . . . . . . . . . . . . . . . . . . . . . . . . . . . . . . . . . 32
20 Foreign spot prices per pound including export taxes and u. S.
21
22
23
24
25
average spot export prices, October, November and December 195 9 . . . . . . . . . . . . . . . . . . . . . . . . . . . . . . . . . . . . . . . . . . . . 33
Unfinished cloth prices, cotton prices, and mill margins on 20 selected constructions, United States, by months, 1954 to da'te .......•.•...•.•.•...•....•..•...•..•..•.•..•••..
Cotton products export program: Classes of cotton products and equalization payments October, November and December 1959, and cumulative totals since August 1, 1959 .........•.........
Connnodi ty Credit Corporation stoc:ks of cotton, United States, August 1, 1957 and 1958 and August 1959 to date ••••••••••••••
Cotton: Acreage, planted and harvested, and yield per acre on harvested acreage, 1950 to date ......•.•.....•.......
Production of cotton by regions, United States, 1930 to da.""te •••••••••••••••••••••••••••••••••••••••••••••••••
34
35
37
cs-186 - 43 - JANUARY 1960
LIST OF CHAR'IS
Cotton: Foreign Production and Consumption Cover
Cotton Broadwoven Goods
Stocks-Unfilled Order Ratio, Seasonal Pattern . . . . . . . . . . . . . . . . . . . . . . . . . . . . . . . 20
Stocks-Unfilled Order Ratio, Seasonally Adjus "ted . . . . . . . . . . . . . . . . . . . . . . . . . . . . . . 20
Stocks, Seasonal Pattern................ 23
Unfilled Orders, Seasonal Pattern 23
Cotton Prices Competitive and Rising on World Markets • • . • • . • • • • • • • • . • • . • • • • • . • . . . . . 27
The supplement for 1959 to Statistics on Cotton and: Related Data (Statistical Bulletin No. 99) is now avail-: able on request from the Agricultural Marketing Service.:
The next issue of The Cotton Situation is scheduled for release: on March 25.

U. S. Department of Agriculture Washington 25, D.C.
OFFICIAL BUSINESS
NO'nCE If you no l~er {ed this publlcatlODt check here return this sheet, and your name w 11 be dropped from the mailing list.
If your address should be cban&ed, write the new address on this sheet and return the whole sheet to:
~'.inistrattve Services Division (ML) Agr,1cultural ·Marketing Service U.s. Department of Agriculture Washington 25, D. C.
POSTAGE AND FEES PAID u.s. DEPARTMENT OF AGRICULTURE