2006-10 infrastructure roi 3 infrastructure roi ... the network infrastructure in place beginning fy...
TRANSCRIPT

10/30/10 2 Infrastructure ROI
Table of Contents
EXECUTIVE SUMMARY ................................................................................................................................................... 3 INTRODUCTION ............................................................................................................................................................... 4
METHODOLOGY TO SUPPORT STUDENT AFFAIRS, ACADEMIC AND ADMINISTRATIVE COMPUTING ............................ 4 FISCAL YEAR 2006 .......................................................................................................................................................... 4
Local Area Network Replacement .............................................................................................................................................. 4 Additional Expenditures .................................................................................................................................................................. 5 Return on Investment ....................................................................................................................................................................... 5
FISCAL YEAR 2007 .......................................................................................................................................................... 6 Servers ..................................................................................................................................................................................................... 6 SAN ........................................................................................................................................................................................................... 7 Return on Investment ....................................................................................................................................................................... 7
DEFINING THE GROWTH .............................................................................................................................................. 8 FISCAL YEAR 2008 .......................................................................................................................................................... 8
Servers ..................................................................................................................................................................................................... 9 Network Equipment .......................................................................................................................................................................... 9 Wireless Network ............................................................................................................................................................................... 9 Pay for Print ......................................................................................................................................................................................... 9 Return on Investment .................................................................................................................................................................... 10
FY 2009 ............................................................................................................................................................................. 10 Server Management ....................................................................................................................................................................... 11 VoIP Telephony Expansion .......................................................................................................................................................... 11 Servers .................................................................................................................................................................................................. 11 Return on Investment .................................................................................................................................................................... 12
FY 2010 ............................................................................................................................................................................. 13 CONCLUSION .............................................................................................................................................................................. 13
APPENDIX A – FISCAL YEAR 2006 ............................................................................................................................ 14 Additional Network Expenditures Justification ................................................................................................................. 14 $500,000 Allocation Expenditures ........................................................................................................................................... 15 Network Monitoring Software Functionality ..................................................................................................................... 16
APPENDIX B – APPLICATION DEVELOPMENT 2004‐10 ................................................................................... 17 Spreadsheet of active applications .......................................................................................................................................... 17
APPENDIX C – WIRELESS NETWORK ASSESSMENT 2007‐08 .......................................................................... 20 APPENDIX D .................................................................................................................................................................... 23
List of Servers .................................................................................................................................................................................... 23 Virtual Server Monitoring ........................................................................................................................................................... 25

10/30/10 3 Infrastructure ROI
Executive Summary Capital dollars were allocated each year to Information Technology (IT) infrastructure, part of IRTS, for FY’s 2006-10 for a campus-wide network switch replacement, wireless network deployment, Storage Area Network (SAN), VoIP Telephony, and server replacements. Infrastructure Resources and Technology Support (IRTS) supports student, academic and administrative computing by providing a secure network, wired and wireless, for faculty, students and staff with servers, associated server file storage space, instructional and administrative applications, web and database development, application development, SIS reporting and computer operation functions that are necessary to support the campus infrastructure, Campus Switchboard and the Campus Helpdesk for students, faculty and staff. A total of $850,314 of capital technology dollars, annual differing amounts, was allocated from FY2006 to FY2010. Of that, $746,282 has been judiciously spent. Some results are
• Network uptime from 75% to 99%
• 17,000 feet of data cabling replaced
• No wireless network to 1 appliance and 65 access points
• File and application storage available from 4 Terabytes to 20 Terabytes
• Server growth from 19 servers deployed in FY2006 to 58 in FY2010
• Server virtualization savings (hardware) of $120,750
PVCC is getting a high return from IRTS on its capital investment. The technologies deployed and innovative use of relatively limited resources has led to an upturn in availability, reliability and a more service oriented technology infrastructure without adding more staff.
10/30/10 4 Infrastructure ROI
Paradise Valley Community College
Information Resources and Technology Services FY 2006-10 Technology Infrastructure Capital Funding Return on Investment
Technology Focused Support of Student, Academic and Administrative Computing
Respectfully Submitted by Carol Myers
Introduction Capital dollars were allocated each year to Information Technology (IT) infrastructure, part of IRTS, for FY’s 2006-10 for a campus-wide network switch replacement, wireless network deployment, Storage Area Network (SAN), VoIP Telephony, and server replacements. This document will discuss the methodology for use of allocated dollars, actual purchases, the effect on PVCC’s computing environment, and future positioning of IRTS based on support of student, academic and business computing.
Methodology to Support Student Affairs, Academic and Administrative Computing Infrastructure Resources and Technology Support (IRTS) supports student, academic and administrative computing by providing a secure network, wired and wireless, for faculty, students and staff with servers, associated server file storage space, instructional and administrative applications, web and database development, application development, SIS reporting and computer operation functions that are necessary to support the campus infrastructure and a Campus Helpdesk for students, faculty and staff. Without the core technologies that allow for dispersed and flexible student/faculty/staff interactions, computing activities would be limited to face-to-face or one-on-one communication. Assessing infrastructure resources support activities must be based on services offered and time factored technology. Basically the more hours during the 24-hour 7-day work week technical infrastructure resources are robust, available, reliable and accurate, the more computing activities which support the college’s mission and vision continue to grow and develop.
Fiscal Year 2006
Local Area Network Replacement The network infrastructure in place beginning FY 2006 was 8 to 10 years old with the bulk of the equipment being a sister college’s Cabletron brand hand-me-downs. Network up time was only 75% given ports and blades within the hardware were failing daily. The lack of stability had a serious impact on administrative, instructional and student services. Five hundred thousand dollars of the 2004 capital bond monies were allocated to replace PVCC’s entire network infrastructure. This was to replace 24 network edge switches across the campus, include consulting for installation and a geographic re-design of the layout of the Local Area Network (LAN).

10/30/10 5 Infrastructure ROI
At that time, the LAN was 1 large network and not appropriately segmented into Virtual LAN’s (VLAN’s) to ensure security and efficiency of operations. Virtual LANS are like small building specific individual networks that are part of the whole campus network. The Infrastructure Team (2 technical (David Preston/Corey Weidner) and their manager Carol Myers) took on the task of re-designing the LAN, programming and installing the new network without the benefit of consultants. This decision kept network replacement costs at $364,237.90. Consultant fees would have totaled more than $50,000. Five buildings on campus (G, J, F, A & D) were wired with Category 3 cabling. The cabling that was necessary to meet standards and provide reliable speed and delivery of information was Category 5e. Total cost was $34,069.89, and work was completed in November 2005. Seventeen thousand feet of cabling was necessary to install the network switches at a cost of $8,701.10. A local Tempe company was used to ensure quality and a lower cost per foot of cable. Re-design work and a complete network equipment inventory began in September 2005 and completed in early December. The physical installation took 17 straight days, 10 to 12 hours a day, (December 7 – 23, 2005) with no interruption in service to the college’s core function and service.
Additional Expenditures The Technology Coordinating Team (TCT) and PVCC Administration agreed to allow IRTS to use the remaining funds for critical network software and servers. Purchasing and installing new network hardware will not mitigate the risks associated with a complex and highly distributed computing environment. A good analogy would be a pilot given a brand new state-of-the-art jet with no visible controls or cockpit windows. Staff would literally be flying blind if there were a network problem. This was the current state of PVCC’s network infrastructure environment. Appropriate hardware and toolsets for monitoring, troubleshooting and maintaining a reliable, secure environment is a necessity. The whitepaper submitted, as justification for additional expenditures is included in Appendix A. Additional dollars were spent on servers, server rack, network connection testers, network administrator laptop for remote on and off site use, partial campus wireless network solution, VoIP telephony switch infrastructure and an upgrade to the network authentication (desktop login) software. All network monitoring and security software was free by leveraging mature open source solutions. A complete budget list of expenditures is included in Appendix A.
Return on Investment PVCC’s network has an average available time of 99% from the previous 75%. It cannot be 100% due to power outages or planned maintenance. When maintenance or system upgrades to the switches is needed, it is completed between 3:00 am and 5:00 am in the morning to minimize the impact on users.
10/30/10 6 Infrastructure ROI
The knowledge gained by the infrastructure team cannot be learned via traditional training methods, thus, hands-on knowledge dramatically improved network operational efficiency. The additional expenditures for network monitoring and testing hardware has contributed to the 99% uptime by allowing staff to work efficiently and proactively in discovering potential problems before there is a negative impact to campus services. Sample graphs of one network monitoring tools are available in Appendix A. The VoIP telephony switch infrastructure has positioned PVCC to move towards a convergence of voice, video and data in a more cost effective manner. Purchasing the VoIP infrastructure before it became a needed infrastructure commodity allowed PVCC to take advantage of reduced costs per hardware piece and implement a successful pilot. The infrastructure costs associated with opening a new building (L) was reduced by one-third simply by not pulling additional cabling and copper for traditional telephony. The partial campus-wide wireless network proved very successful by allowing students to connect to computing resources from their own laptops. The wireless network was installed in the main student hub areas such as inside and outside of KSC and E buildings, outdoor courtyards and classroom buildings. This allowed for spontaneous learning opportunities for students and faculty to fully engage outside of the traditional classroom or office. The tutoring center was able to expand its services by utilizing general hallway seating for student group tutoring. Older, still functioning, desktops have been strategically placed in E building hallway for students who have no laptop available to use. The wireless network expenditure created efficiencies and learning flexibility for other areas of the campus and that is part of the mission of information technology, to support college strategic initiatives.
Fiscal Year 2007 Work began FY2007 on additional server consolidation and removing the remaining hand-built servers. There were three Dell servers and two Apple servers that had to be replaced. Thirty thousand dollars was requested for server obsolescence and TCT approved $20,000. Due to network reliability and upgraded network authentication and file server software, more faculty and staff began using resources for instructional and administrative computing. File server and web server space had become a premium and there was no room for growth, especially in the instructional area. Fifty thousand dollars was requested to purchase a Storage Area Network (SAN). A SAN is a collection of large disk space that can be utilized by multiple servers to store files and applications. TCT approved funding for $35,000.
Servers There were not enough funds allocated to be able to replace what was needed. It was decided to replace the main file server and authentication server. The server that housed administrative applications like APB would need to run another year without maintenance. If a failure occurred then another older, unsupported, server would have to be employed to make up the loss. The two file and network authentication servers cost $18,795.75.

10/30/10 7 Infrastructure ROI
Two additional servers were added to the growing server farm but they were funded from other sources and were application specific. One was for the student goal setting application, developed in-house, called iGoal. The other was funded by the tutoring center to move the off-site hosted application Tutor Trac on site. The two Apple servers to be replaced were used for running backup software and if needed, Mac desktops could be used. While this was not the best decision, it was the only decision given the funding circumstances.
SAN With only $35,000 allocated out of the $50,000 requested, there was very little sophisticated SAN technology with any substantial storage space to select and utilizing the money for servers with larger storage capacity would only exacerbate file and application storage problems in the future. (It is important to note that server drive storage capacity was far more limited than it is today.) One entry level, lower scale SAN was chosen that seemed to be reliable and, if proven worthwhile, could be augmented with more storage to grow with the environment. The SAN cost $35,300 and would provide 4 Terabytes of space. The 4 Terabytes would become 2 Terabytes of usable space given all the data would need to be mirrored as a backup from one SAN shelf of disks to another. The Infrastructure Team waived professional training on the equipment in order to save on total costs.
Return on Investment The quantitative return on investment may seem negligible given the small amount of funding allocated; however, it was not given more file space could be allocated to the campus’ main file server. The file server was attached to the SAN allowing for more storage space and more users. Faculty took advantage of the additional space by augmenting in-class activities with course materials available via their individual web sites. The authentication server allowed for an upgrade to Novell (the maintenance contract had expired in 2000) that resulted in a more secure and reliable network authentication mechanism. Expanding space did cause an issue with 1 backup system. The system could no longer backup all the data due to size. A new tape drive, $4,300, was ordered out of FY2007 operational funds to be able to ensure the integrity of the data backup. During the spring semester of FY2007 the key server, providing the bulk of desktop software for campus administrative and instructional use, stopped functioning. (A key server allows for centralizing of applications that can be served to the desktop users. Examples are CS4 used by employees and also for instruction.) A higher end desktop was held from deployment and used for the key server. The desktop did not function as well as proper server hardware, so there were service interruptions.
10/30/10 8 Infrastructure ROI
The SAN provided an opportunity for the infrastructure team to learn the technology and experiment with an optimal configuration that would support PVCC. The lower scale SAN proved its worthiness on a small scale but could not be used to expand computing services at PVCC.
Defining the Growth Thus far there have been references to growing file server and application storage space that required additional capital dollars. In order to fully understand the need for capital, and even operational, dollars to support the growth in academic, administrative and student computing it is necessary to understand the root causes. As PVCC’s infrastructure became resilient and available, opportunities to support the college’s mission and strategic initiatives were presented to other areas in Information and Instructional Technology, such as instructional and administrative application development. As alternative course offerings and enrollment grew, there was a need for more complex and robust web and application development. As a new Maricopa SIS system was implemented, there was a need for enhanced reporting tools and web based applications that augmented functionality. With a greater focus on learning assessment and the student learning experience, there was a need for toolsets that assisted with enrollment and retention strategies. In four years, web sites and application development exploded at PVCC. See Appendix B for a list of active applications developed within the 2004-08 timeline. File and web server space needs exploded as well. Faculty and staff have always been encouraged to store and work with documents on the file server to ensure their data is backed up. This methodology is considered a best practice in an enterprise-computing environment. When space became a premium, many began storing their information locally simply because quotas could not be increased. Once the infrastructure could again accommodate the best practice, faculty and staff came back to utilize the file servers. Faculty was incorporating more technology into their classes, and robust alternative course offerings increased the need for web server space. Faculty was developing videos, online interactive tutorials, and flash animations that required web-based delivery. File server use space grew from 100 Gigabytes to 500 Gigabytes. Instructional web server space grew from 150 Gigabytes to 450 Gigabytes of usable data. To get a perspective on size, an average size document is approximately 80 kilobytes. There are 1,000 kilobytes to 1 Megabyte, 1,000 Megabytes to 1 Gigabyte and 1,000 Gigabytes to 1 Terabyte. This equals about 12,500,000 documents for 1 Terabyte. With an average web page at 130 kilobytes, it would be 7,692,307.6 html pages for 1 Terabyte. Some mileage may vary.
Fiscal Year 2008 The focus this year, outside of obsolescence replacement, was finishing the campus wireless network, securing another network switch for an instructional building that had run out of ports, and acquiring spare network switch equipment to be utilized while waiting for the
10/30/10 9 Infrastructure ROI
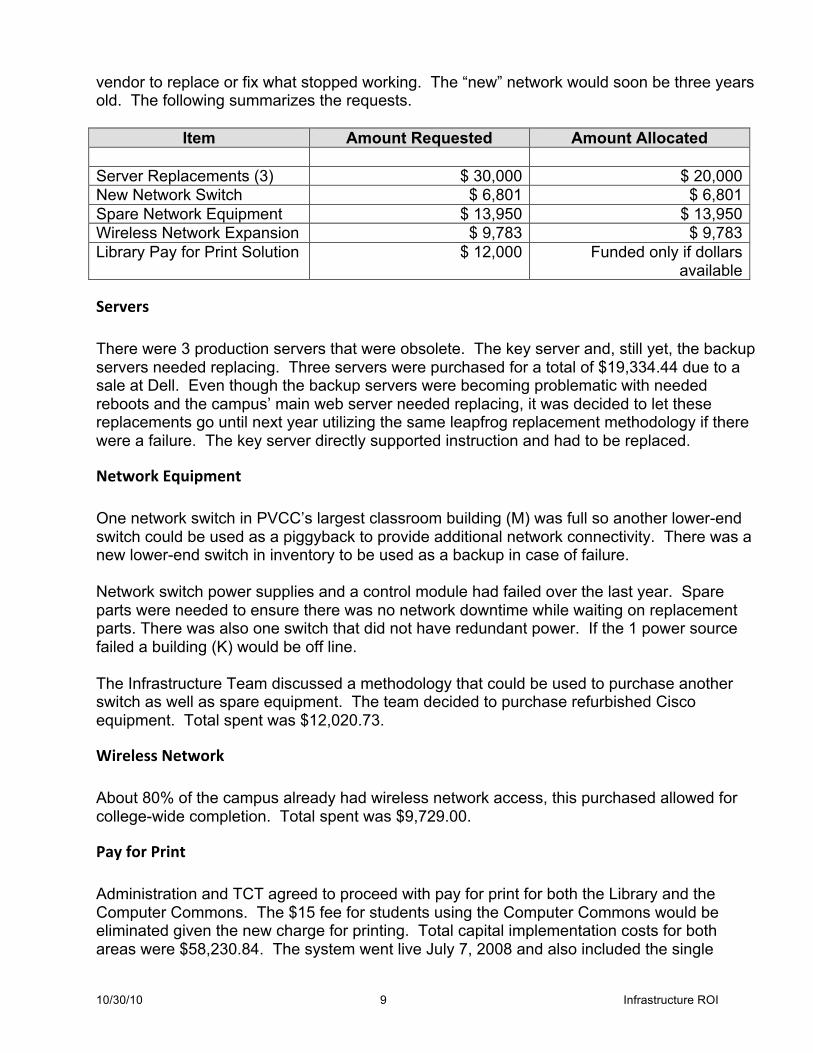
vendor to replace or fix what stopped working. The “new” network would soon be three years old. The following summarizes the requests.
Item Amount Requested Amount Allocated Server Replacements (3) $ 30,000 $ 20,000 New Network Switch $ 6,801 $ 6,801 Spare Network Equipment $ 13,950 $ 13,950 Wireless Network Expansion $ 9,783 $ 9,783 Library Pay for Print Solution $ 12,000 Funded only if dollars
available
Servers There were 3 production servers that were obsolete. The key server and, still yet, the backup servers needed replacing. Three servers were purchased for a total of $19,334.44 due to a sale at Dell. Even though the backup servers were becoming problematic with needed reboots and the campus’ main web server needed replacing, it was decided to let these replacements go until next year utilizing the same leapfrog replacement methodology if there were a failure. The key server directly supported instruction and had to be replaced.
Network Equipment One network switch in PVCC’s largest classroom building (M) was full so another lower-end switch could be used as a piggyback to provide additional network connectivity. There was a new lower-end switch in inventory to be used as a backup in case of failure. Network switch power supplies and a control module had failed over the last year. Spare parts were needed to ensure there was no network downtime while waiting on replacement parts. There was also one switch that did not have redundant power. If the 1 power source failed a building (K) would be off line. The Infrastructure Team discussed a methodology that could be used to purchase another switch as well as spare equipment. The team decided to purchase refurbished Cisco equipment. Total spent was $12,020.73.
Wireless Network About 80% of the campus already had wireless network access, this purchased allowed for college-wide completion. Total spent was $9,729.00.
Pay for Print Administration and TCT agreed to proceed with pay for print for both the Library and the Computer Commons. The $15 fee for students using the Computer Commons would be eliminated given the new charge for printing. Total capital implementation costs for both areas were $58,230.84. The system went live July 7, 2008 and also included the single
10/30/10 10 Infrastructure ROI
printer in the Learning Support Center and KSC Advisement area. Charges are .10 cents per black and white inked page and $1 per color inked page.
Return on Investment Software technology was deployed that assisted the team with the shortage of physical servers. Maricopa’s District Office ITS had licensed software that would allow for the creation of virtual servers. Virtual server software allows for the creation of multiple servers on the same physical hardware. Not all applications and services needing a physical server are candidates for virtualization. The virtualization was particularly useful when an application like Equitrac, IKON controlled copier software, needs to be implemented and there is no physical server to use for an install. Candidacy for virtualization is based on system load and number of users, powerful enough processors and memory on the physical server, and disk space for storage of data. At this time virtualization helped with the out-of-band, more simple server applications that would be used by very few. Unfortunately, the old backup servers were not candidates for virtualization. Purchasing refurbished network equipment to use as spares for switch operation until a replacement from the maintenance contract can be shipped and installed, proved to be valuable. The lower price for equipment allowed for all critical parts for any of the network switches to be in stock, ready for use. The methodology saved $8,730.27 of precious capital dollars and allowed for immediate replacement of critical network parts as well as deployment of a new switch at half the cost to replace the one in inventory. The pay for print system realized savings in its first 10 months. Costs for toner and printer maintenance kits were literally cut in half. While revenue from the system has not yet paid for the system, it did allow improved service by purchasing a change machine for students and paying for paper for both the Library and Computer Commons. While the purchase of the remaining infrastructure for a college-wide wireless network only saved $54.04, the value of wireless connectivity for students and faculty continued to rise. The return on investment for the wireless network is more qualitative than quantitative. An Out-of-Class Wireless Network Assessment is included in Appendix C.
FY 2009 In the spirit of fairness, something had to give this year so infrastructure services could be maintained at the high level now expected of IRTS’ infrastructure resources. The lessened funding for obsolescence put the infrastructure area in a position of future diminished services. There were now six servers, not including the yet to be replaced backup servers, that were obsolete. Some were over 6 years old and performed critical functions like the college’s main web server, instructional web server and the server that held many administrative applications.
10/30/10 11 Infrastructure ROI
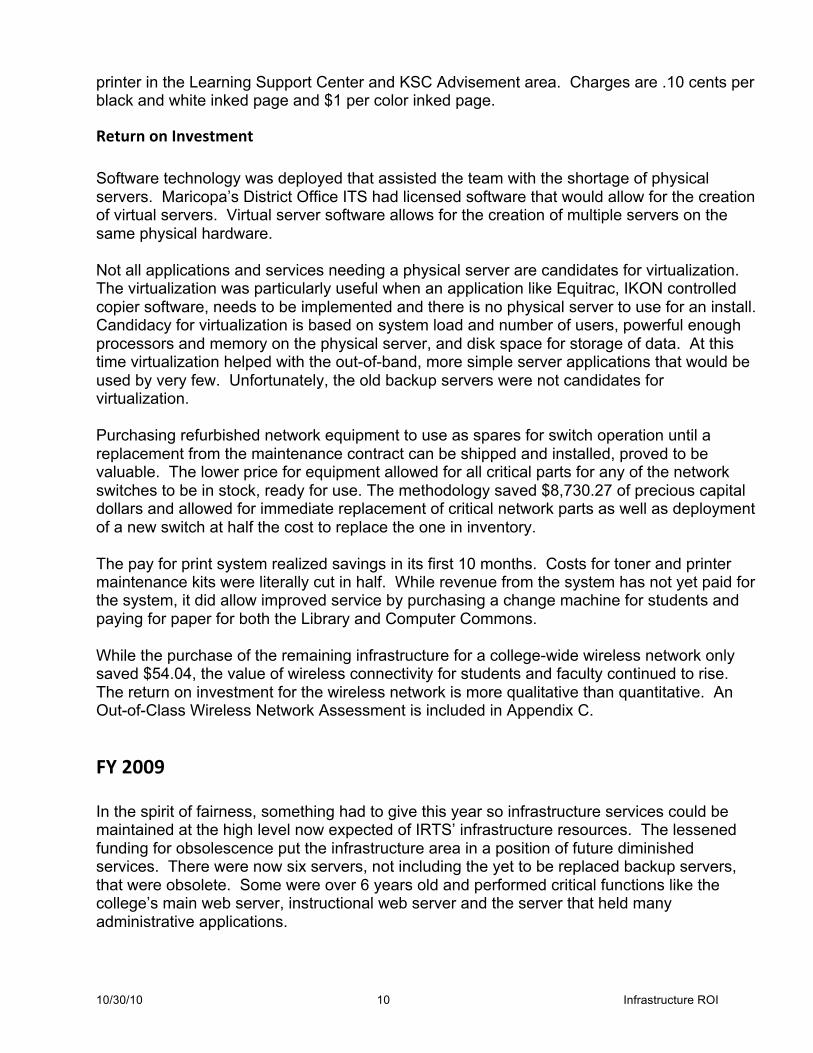
The Enterprise System Administrator had been conducting load testing, over a period of three months, on the servers that needed replacing to see if they were candidates for virtualization. Some seemed prime candidate for virtualization. The following is what was submitted for FY2009.
Item Amount Requested Amount Allocated Server Replacements $ 30,000 $ 30,000 Server Management $ 16,444 $ 16,444 VoIP Telephony Expansion $ 45,784 $ 45,784 Student Logins and Server Space
$ 38,116 0
A place holder for Commons pay for print costs was included to show what was spent for 08-09 capital funds
30,221 29,266.30
Server Management Remote server management had improved drastically over the last 4 years; however, the Infrastructure Team did not have the ability to remotely reboot servers. This was a critical function to be able to perform to ensure issues could be fixed around the clock in the least amount of time possible. New technology in network based server access tools provided this functionality. Amount spent was $15,045 out of $16,444 allocated.
VoIP Telephony Expansion There was 1 new building and 1 new satellite campus coming on board for occupancy by staff at the end of FY 2009 or beginning of FY2010. It was important to have VoIP handsets in stock to be able to bring those areas online. Maricopa’s District Office IT had recently gotten a “starter package” approved for the colleges to move to VoIP Telephony. The amount from the District Office would be $80,000 and would pay for all the software, licensing and servers needed to support VoIP. PVCC needed to be ready for the new buildings but would only need to purchase handsets. TCT agreed to allocate the entire amount so 50 handsets could be purchased. Total amount spent was $39,396 out of the $45,784 allocated. Subsequent technology dollars were allocated for the 2 new areas and handsets purchased from those funds. The 50 handsets previously purchased were placed in stock for the full campus migration.
Servers The number of servers had grown from 19 in 2005 to 58 in FY 2010. The server farm was a constant shuffle of old to older servers in order to accommodate what was necessary to run the area. The Infrastructure Team worked though various scenarios and decided the most cost effective way to try and solve the funding and growth problems were to purchase a robust, enterprise-level SAN, utilize two newer existing servers as the “Controllers”, and

10/30/10 12 Infrastructure ROI
virtualize all servers that were candidates for virtualization. A complete list of servers and their function is in Appendix D. Several demonstrations from vendors were scheduled and different SAN’s (large disk storage and software) and their functionality were reviewed. The Infrastructure Team chose NetApp. Gartner considers NetApp as the industry leader in SAN appliances. The optimal starter configuration at 10 Terabytes was $45,390. Only $30,000 of capital funds was allocated. The Vice-president of Administrative Services, Dean of Information Technology and TCT agreed to increase the capital server obsolescence allocation to accommodate the request. The backup servers were replaced using desktop obsolescence dollars. Higher end desktops were purchased to function as servers for the data backups. It is hoped that for 2009-10 capital dollars will be approved for a consolidated backup solution.
Return on Investment Remote server management has drastically improved response time for issues with server given reboots can be completed from offsite. It has also contributed to employee morale given no one need make a trip to the campus for a simple reboot and with only 2 individuals supporting the infrastructure. Its cost was well worth the return. The NetApp SAN has made the biggest impact on the infrastructure and the potential for growth and support. It has allowed the virtualization of servers, provided full redundancy for those servers in the environment and allows for snapshots of data to be recorded hourly, daily and weekly to ensure higher levels of customer service for file recovery. Server virtualization goes beyond saving capital hardware costs. It also saves on cooling and power. There are 23 servers virtualized at this writing. Below are the calculations of energy savings.
10/30/10 13 Infrastructure ROI
Monitoring tools are also sophisticated and allow for greater support and availability of services. Example screen shots are in Appendix D. The lower-end SAN is still being utilized as well for some of the virtual servers that may not be classified as mission critical.
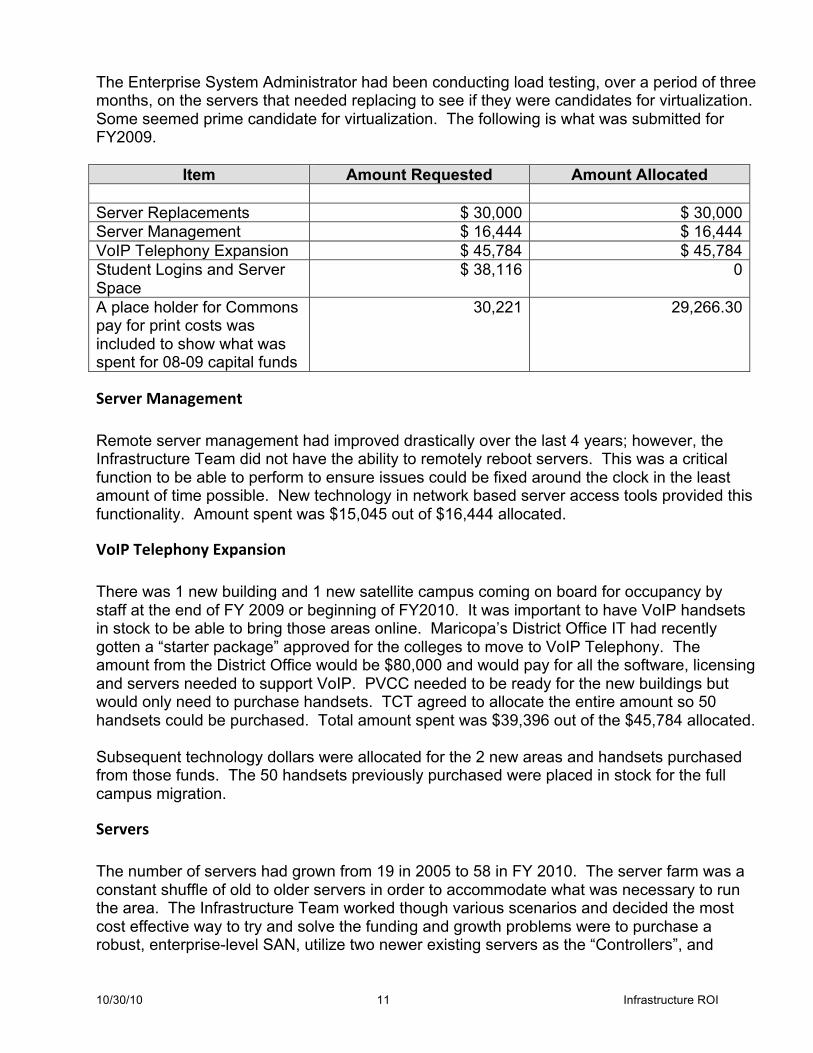
FY 2010 FY10 requests and purchases focused on the nuts and bolts of the infrastructure. Higher end servers were needed to be able to handle the increase in requests for services, most instructional software now requiring a key management licensing server (1 for each type of software), batteries in the server rooms backup emergency power device (UPS) were only holding, and audio/visual equipment efficiencies gained through controlling equipment remotely, to name just a few. IRTS submitted a $95,000 APB request for obsolescence equipment replacement, and 2 new servers for student logins back end operations. The following is what was allocated and what was spent.
Item Amount Allocated Amount Spent Amount Left Infrastructure Obsolescence
$ 95,000 $ 58, 566 $ 36,434
Active Directory (student logins)
$ 25,000 $ 11,283 $ 13,716
Items replaced through obsolescence include UPS (backup power for computer room) battery replacement, 3 obsolete servers, one 7 Terabyte storage shelf for the SAN, and Active Directory File/Print servers. The remaining VoIP handsets needed to fully migrate the campus was funded out of operational dollars. The tape backup solution was part of the $95,000 infrastructure obsolescence but man-power issues prevented its purchase and installation. PVCC’s Technology Coordinating Team (TCT) agreed to allow IRTS to move the backup tape solution to Fall 2010.
Conclusion Clearly the college is getting a high return from IRTS on its capital investment. The technologies deployed and the innovative use of relatively limited resources has led to an upturn in availability, reliability and a more service oriented technology infrastructure.

10/30/10 14 Infrastructure ROI
Appendix A – Fiscal Year 2006
Additional Network Expenditures Justification Introduction With the opportunity to replace the existing campus network infrastructure come new challenges with monitoring, maintenance and resource allocation. The one piece of software that was purchased for monitoring the current network is more than 3 years old, no longer covered by maintenance, and has limited functionality with no reporting capabilities. There is appropriate network and systems software freely available via open source development projects. These tools are robust, thorough and provide for troubleshooting, maintaining and reporting on bandwidth and system usage trends. An example of freely available network infrastructure software is OpenNMS. It is used to monitor the entire computing environment. OpenNMS is an enterprise-grade network management platform. The software has three main functions. First, it monitors the firewall and intrusion detection system environment including web servers, software applications, and databases. Second, it collects and displays server performance data so that issues can be detected before a failure. Third, it actively monitors services being provided on the network. This can be used to generate service level reports and notifications to alert personnel of server or network outages. NetFlow (network log analysis), Nagios and MRTG (reporting/high level monitoring tool) are other tools to be used in this environment. Each piece compliments the other. All the software is free but the infrastructure necessary to support its use is not. NetFlow requires massive amounts of disk space to store log files. Ok, How Much? The current available capital dollars for the network bond funds is $102,462.78. The following is an itemized list with approximate pricing that includes 1 software package that is not open source:
1. Servers $40,000 2. Rack $3,300 3. Portable Network Tester $15,000 4. Laptop w/ RJ45 Interface $3,000 5. Wireless Access Points $8,000 6. ZenWorks/Novell and associated licensing $20,000
Total approximate expenditures are $89,300. The only non-hardware item is number 6. Part of maintaining a secure network is the ability to keep Windows desktop computers appropriately patched against worms, Trojans and viruses. While there is anti-virus installed on each machine, it does not address the Windows operating system, Internet Explorer or other Windows applications that require regular care and feeding. Currently Microsoft’s SUS server is being used, but Microsoft will begin charging licensing fees next year. After the initial upgrade/purchase, annual renewal for the ZenWorks/Novell is $5,000. Without the appropriate toolset to push patches over the network to Windows workstations, the risk of network degradation and security breaches is high. The Macintosh patch management solution is approximately $300 and can be purchased through regular operational dollars. Conclusion Purchasing and installing a new network will not mitigate the risks associated with a complex and highly distributed computing environment. A good analogy would be a pilot given a brand new state-of-the-art jet with no visible controls or cockpit windows. Staff would literally be flying blind if there were a network problem. This is the current state of PVCC’s network infrastructure environment. Appropriate hardware and toolsets for monitoring, troubleshooting and maintaining a reliable, secure environment is a necessity.

10/30/10 15 Infrastructure ROI
$500,000 Allocation Expenditures
Item PO # Vendor Description Total
1 273957 Corporate Technology Solutions
Rewire Cat3 buildings w/ Cat6; G, J, F, A & D
$34,069.89
2 284311 Calence Replace all network edge
switches $347,253.33
3 283755 American
Cablemasters 17,000 Feet of Cat 6, Black
cable $8,701.10
4 284712 Titan Power 220 Power and cabling for
Switch $1,357.92
5 286177 Dell Rack $2,596.79 289375 Dell PO Increase for exchange $1,898.63
6 289717 Dell Syslog Server $6,234.26
7 289716 Apple Network Distribution Server $8,444.77
8 288189 Source Qsig card for PBX (VoIP) $3,004.82
9 289368 WWT 6513 Comm module for VoIP $20,783.63 10 7970 VoIP Phones
10 288205 nVision Network Tools Laptop $2,702.50
11 284311 Calence PO Increase for switches $16,984.90
12 291934 Novell 05-06 Network Access Soft Upgrade
$2,086.05
13 291933 Novell 06-07 Network Access Soft
Upgrade $5,006.52
14 298546 Anixter (Fluke
Networks) Network Tester/Reporting $13,453.05
15 295703 WWT BlueSocket Wireless Network $20,610.89
Total: $495,189.05

10/30/10 16 Infrastructure ROI
Network Monitoring Software Functionality Weekly network traffic flow analysis – graph 1
Extended period network traffic flow analysis – graph 2