2006 status of rural texas - wrangling with change
DESCRIPTION
A demographic report on conditions and trends in rural Texas.TRANSCRIPT

Status of Rural Texas Series, 2006
Rural Texas: Wrangling with Change


OFFICE OF RURAL COMMUNITY AFFAIRS
Rick Perry
Governor
Executive Committee
Michael Waters, Chair
Charles S. (Charlie) Stone
Executive Director David Alders
Nicki Harle Carol Harrel l William Jeter
Wallace Klussmann Lydia Rangel Saenz
Ike Sugg Patrick Wallace
January 1, 2007
The Honorable Rick Perry
Governor, State of Texas
The Honorable Tom Craddick
Speaker of the House of Representatives, State of Texas
The Honorable David Dewhurst
Lieutenant Governor, State of Texas
The Honorable Members
80th Legislature
House Bill 7 (77th Legislature) created the Office of Rural Community Affairs (ORCA) and set forth the
following requirement:
“The office shall…compile an annual report describing and
evaluating the condition of rural communities.”
The following report is offered in fulfillment of the requirement and provides a snapshot of where rural
Texas stands today. The report speaks to the broad spectrum of issues that affect rural communities across
our state.
Currently, the population of rural Texas exceeds the population of 22 individual states and is greater than
the combined populations of Alaska, North Dakota, Vermont, Wyoming, and the District of Columbia.
Each rural community contributes significantly to the people of the state of Texas and Texas’ economy. In
addition to offering a vast array of tourism and recreational opportunities, rural Texas is the primary source
of agricultural products, livestock, water, and mineral wealth that enhance the vitality of the Texas
economy.
In every sense of the word, rural communities are partners in the past, present, and future successes of
Texas. Indeed, the viability of rural Texas is critical to the viability of Texas as a state. And because rural,
suburban, and urban areas of Texas are inextricably linked, successes in rural Texas are successes for all
Texans.
It is our hope that this fifth report on the status of rural Texas will contribute to the ongoing dialogue that is
shaping Texas’ future. The report highlights some of the complex and diverse issues affecting rural Texas.
We will continue to monitor developments with all interested parties to maintain an objective focus on the
status of life in rural communities.
Thank you on behalf of the Executive Committee and the staff of the agency for the opportunity to
contribute to the future of our rural communities.
Respectfully submitted,
Charles S. (Charlie) Stone
Executive Director


Rural Texas: Wrangling with Change
Table of Contents
RURAL TEXAS ........................................................................................................................................... 6
Characteristics of Texas' rural population
Rural Texas continues to grow (slowly) .................................................................................................. 3 Rural population as a percentage of Texas’ population decreases .......................................................... 3 Recent growth among young adults (ages 18 to 24)................................................................................ 4 Racial and ethnic makeup of rural Texas shows little change ................................................................. 5 Net migration increases in rural Texas .................................................................................................... 5 Fastest growth rural areas are adjacent to urban areas; nonadjacent rural areas show improved growth
too ............................................................................................................................................................ 6 Overall rural poverty decreases, urban poverty remains constant ........................................................... 6 Educational attainment in rural Texas ..................................................................................................... 7
Economy
Employment and unemployment ............................................................................................................. 8 Rural per capita income up, still lags behind state average ..................................................................... 8 Median income has decreased in many rural counties ............................................................................ 8
Healthcare in rural Texas
Disparities in number of healthcare providers highlight ongoing need for rural-focused recruitment and
retention programs ................................................................................................................................... 9 Rural Texans more likely to be uninsured ..............................................................................................10
Housing
Rural Texas has a higher percentage of older housing stock ..................................................................11 Fewer rural Texans have housing with available phone service.............................................................11
Focus on rural youth
While rural childhood poverty decreases, rates remain high ..................................................................12 Number and percentage of rural children receiving TANF down .........................................................13 Rural Medicaid enrollment increases .....................................................................................................13 Texas Children’s Health Insurance Program ..........................................................................................14 Juvenile violent crimes decrease in rural Texas .....................................................................................14 More rural children are living in single parent families .........................................................................14 Higher rates of rural children live in family violence shelters ...............................................................15 Number of confirmed victims of child abuse increases markedly ..........................................................15 Child deaths in rural Texas .....................................................................................................................15

Texas’ rural and urban counties
Legend
Rural
Urban
What is rural? For the purposes of this report, we use the 1993 U.S. Office
of Management and Budget classification scheme for counties. If, under this classification, a county is considered to be part of a Metropolitan Statistical Area, in this report the county is “urban.” If, under the 1993 classification, a county is outside of a Metropolitan Statistical Area or Nonmetropolitan, in this report the county is “rural.” In some cases, the 2003 U.S. Office of Management and Budget classification scheme is used. In these instances, we indicate that the 2003 classification is being used.
1
Housing units with no telephone service
available, 2000
0%
2%
4%
6%
8%
10%
12%
Owner occupied 3.1% 1.3% 1.6%
Renter occupied 10.6% 5.3% 5.9%
Rural Urban Texas
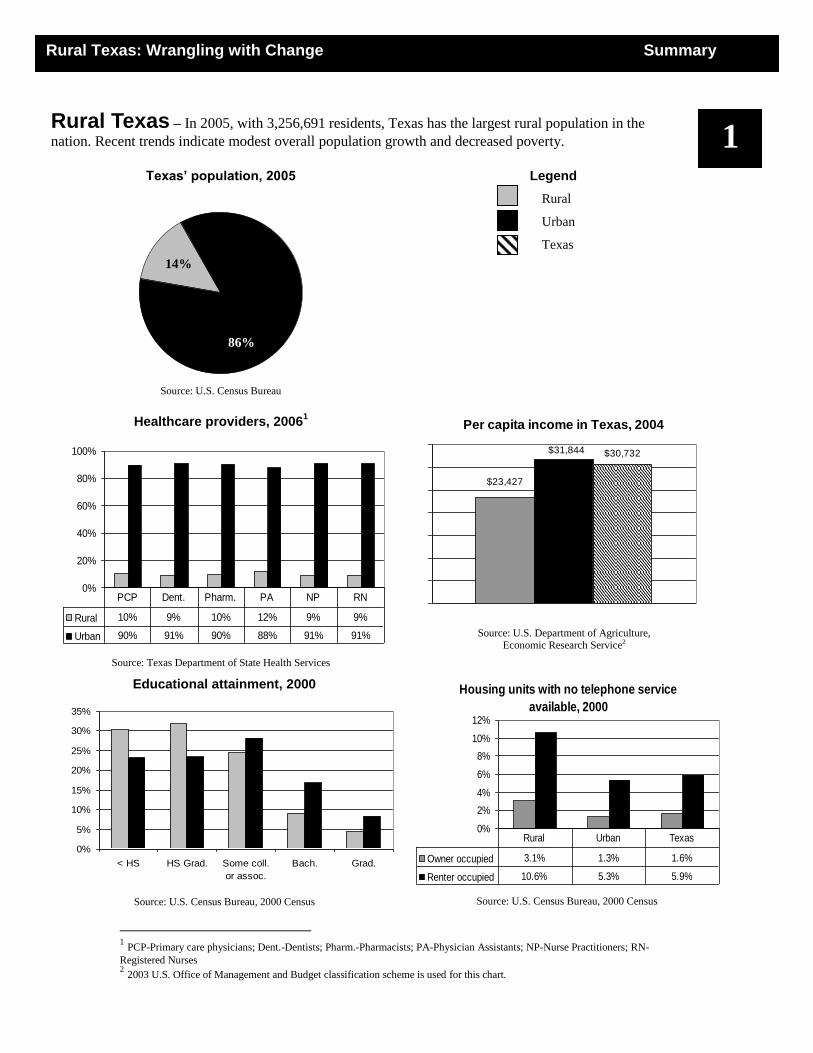
Rural Texas – In 2005, with 3,256,691 residents, Texas has the largest rural population in the
nation. Recent trends indicate modest overall population growth and decreased poverty.
Texas’ population, 2005
Source: U.S. Census Bureau
Legend
Rural
Urban
Texas
Healthcare providers, 20061
0%
20%
40%
60%
80%
100%
Rural 10% 9% 10% 12% 9% 9%
Urban 90% 91% 90% 88% 91% 91%
PCP Dent. Pharm. PA NP RN
Source: Texas Department of State Health Services
Per capita income in Texas, 2004
$30,732
$23,427
$31,844
Source: U.S. Department of Agriculture,
Economic Research Service2
Educational attainment, 2000
0%
5%
10%
15%
20%
25%
30%
35%
< HS HS Grad. Some coll.
or assoc.
Bach. Grad.
Source: U.S. Census Bureau, 2000 Census
1 PCP-Primary care physicians; Dent.-Dentists; Pharm.-Pharmacists; PA-Physician Assistants; NP-Nurse Practitioners; RN-
Registered Nurses 2 2003 U.S. Office of Management and Budget classification scheme is used for this chart.
14%
%%
86%
Rural Texas: Wrangling with Change Summary
Source: U.S. Census Bureau, 2000 Census
2
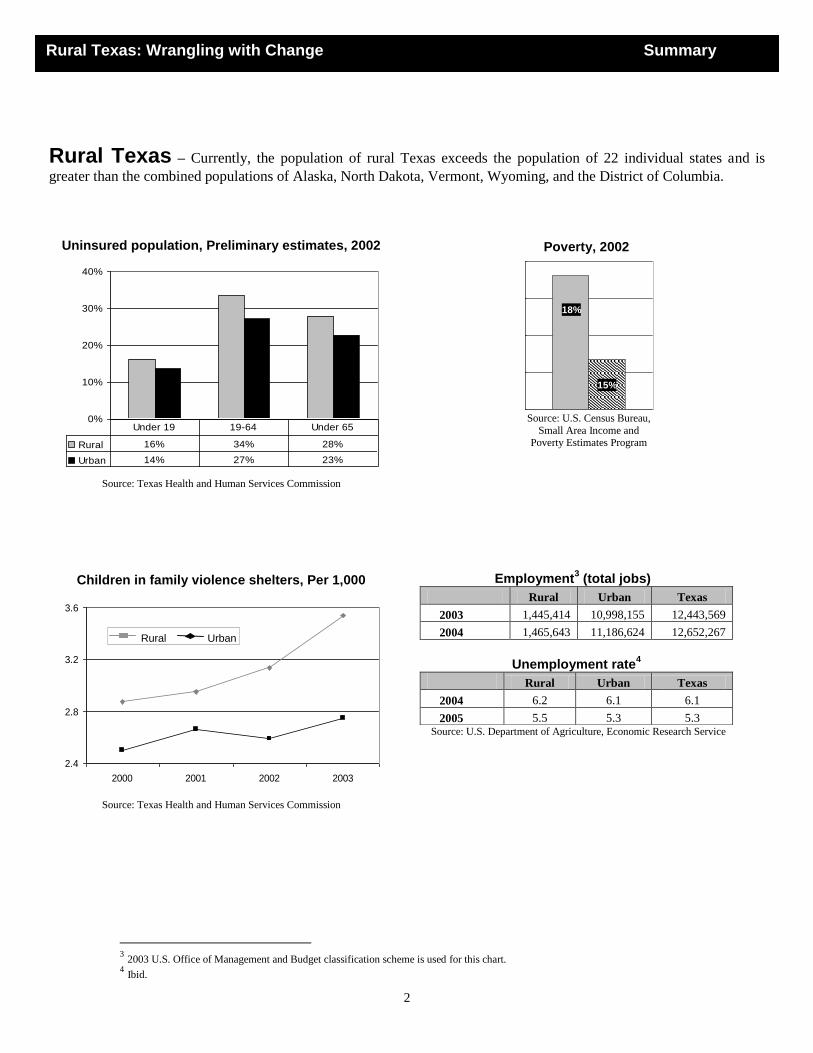
Rural Texas – Currently, the population of rural Texas exceeds the population of 22 individual states and is
greater than the combined populations of Alaska, North Dakota, Vermont, Wyoming, and the District of Columbia.
Uninsured population, Preliminary estimates, 2002
0%
10%
20%
30%
40%
Rural 16% 34% 28%
Urban 14% 27% 23%
Under 19 19-64 Under 65
Source: Texas Health and Human Services Commission
Poverty, 2002
18%
15%
Source: U.S. Census Bureau,
Small Area Income and Poverty Estimates Program
Children in family violence shelters, Per 1,000
2.4
2.8
3.2
3.6
2000 2001 2002 2003
Source: Texas Health and Human Services Commission
Source: U.S. Department of Agriculture, Economic Research Service
Employment3 (total jobs)
Rural Urban Texas
2003 1,445,414 10,998,155 12,443,569
2004 1,465,643 11,186,624 12,652,267
Unemployment rate
4
Rural Urban Texas
2004 6.2 6.1 6.1
2005 5.5 5.3 5.3
3 2003 U.S. Office of Management and Budget classification scheme is used for this chart.
4 Ibid.
Rural Urban
Rural Texas: Wrangling with Change Summary

3
Population growth in Texas, 2000 to 2005
(in thousands)
3,100
3,120
3,140
3,160
3,180
3,200
3,220
3,240
3,260
3,280
2000 2001 2002 2003 2004 2005
16,500
17,000
17,500
18,000
18,500
19,000
19,500
20,000
Texas, 2000
83%
17%
Texas, 2005
86%
14%
Rural Texas continues to grow (slowly) In 2005, with 3,256,691 residents, Texas has the largest rural population in the nation. Between
1990 and 2005, the population of rural Texas grew by 15 percent (Texas’ overall population
grew by 35 percent).
Rural population as a percentage of Texas’ population decreases
From 2000 to 2005, according to Census estimates, the population of rural Texas as a portion of
Texas’ overall population decreased from 17 to 14 percent as urban areas grew rapidly.
Between 2000 and 2005, population growth in rural Texas slowed down, according to Census
estimates. From 2000 to 2005, rural Texas accounted for 7 percent of Texas’ overall population
growth. From 1990 to 2000, rural Texas accounted for 9 percent of Texas’ overall population
growth.
Legend
Rural
Urban
Texas' total population,
all ages Rural Urban Texas
2005 (est.) 3,256,691 19,603,277 22,859,968
2000 3,159,940 17,691,880 20,851,820
1990 2,820,852 14,165,658 16,986,510
Change 2000-2005, no. (%)
96,751 (3%)
1,911,397 (11%)
2,008,148 (10%)
Change 1990-2005 435,839 (15%)
5,437,619 (38%)
5,873,458 (35%)
1990-2000 339,088 (12%)
3,526,222 (25%)
3,865,310 (23%)
Source: U.S. Census Bureau
Rural Texas: Wrangling with Change Characteristics of Rural Texas’ Population
Source: U.S. Census Bureau,
2000 Census Source: U.S. Census Bureau, 2005
Census Estimates
Source: U.S. Census Bureau
Rural Urban

4
Recent growth among young adults (ages 18 to 24) Between 2000 and 2005, rural Texas accounted for 24 percent of the state’s growth in young
adults (those between the ages of 18 to 24). Between 1990 and 2005, the number of young adults
in rural Texas grew by 30 percent, slightly outpacing overall growth among young adults in
Texas (28 percent).
Texas’ 18 to 24 population Rural Urban Texas
2005 (est.) 343,432 2,073,193 2,416,625
2000 292,225 1,906,656 2,198,881
1990 263,392 1,627,452 1,890,844
Change 1990-2005, no. (%) 80,040 (30%)
445,741 (27%)
525,781 (28%)
2000-2005 51,207 (18%)
166,537 (9%)
217,744 (10%)
1990-2000 28,833 (11%)
279,204 (17%)
308,037 (16%)
Source: U.S. Census Bureau
This trend accelerated between 2000 and 2005—from 1990 to 2000, the percentage of young
adults in rural Texas grew by 11 percent; from 2000 to 2005, the percentage of young adults in
rural Texas grew by 18 percent. The reasons for this trend are not immediately clear.
Rural Texas: Wrangling with Change Characteristics of Rural Texas’ Population

5
Race/Ethnicity, Percent change, 1990 to 2000
-8
-4
0
4
8
State of Texas -7.5 0.0 6.4 1.1
Rural Adjacent -3.7 -0.2 3.8 0.1
Rural Nonadjacent -4.8 0.3 4.3 0.2
AngloAfrican
AmericanHispanic Other
Urban Central City. Each urban area begins with an urbanized area. To be part of the urban central city, 50 percent or more of the county or tract population must be within the urbanized area (e.g., Harris County). Urban Suburban. Once the urban central city is established, nearby counties or tracts are examined to determine whether a “high degree of economic and social integration” exists with the core. Commuting flows to and from the urban central city (the number commuting in either direction as a percentage of resident workers) are used to measure integration (e.g., Waller County). Rural adjacent. These are nonmetropolitan counties that are physically adjacent to urban areas (e.g., Burnet County). Rural nonadjacent. These counties are not physically adjacent to urban areas. These counties can be considered “deeply rural” (e.g., Loving County).
Racial and ethnic makeup of rural Texas shows little change From 1990 to 2000, the changes in the racial and ethnic makeup of rural Texas’ population showed no
significant differences from Texas overall. Following statewide trends, the Anglo population, as a
percentage of the overall population decreased slightly, while the Hispanic population increased.
Net migration increases in rural Texas Between 1990 and 2000, rural areas of Texas (both adjacent and
nonadjacent to urban areas) saw an increase in net migration5.
Between 1990 and 2000, rural areas adjacent to urban areas saw the
largest influx and achieved a net migration rate of 10 percent. During
the 1980s, migration to rural areas adjacent to urban areas had been
negligible.
5 Net migration is the difference of immigrants and emigrants of an area in a period of time. A positive value indicates that more people are entering an area than leaving it.
Proportion of the Population in each Race/Ethnicity Group in 1990 and 2000 for the State of Texas and by Rural/Urban Status
Percent of Population
Anglo African
American Hispanic Other
Area Name 1990 2000 1990 2000 1990 2000 1990 2000
State of Texas
61 53 12 12 26 32 2 3
Urban Central City
55 46 13 13 29 37 3 4
Urban Suburban
78 73 8 8 12 16 2 4
Rural Adjacent
67 63 9 9 23 27 1 1
Rural Nonadjacent
70 65 7 7 23 27 1 1
Source: Texas State Data Center and the Office of the State Demographer
Net Migration, Net Migration Rates, and Annualized Net Migration Rates 1980-1990 and 1990-2000, and the Percent of Population Change Due to Migration for Urban and Rural Areas in
Texas, 1990-2000
Net Migration Net Migration Rate (Percent)
Annualized Net Migration Rate (Percent)
Percent Change Due to
Net Migration
Area 1980-1990
1990-2000
1980-1990
1990-2000
1980-1990
1990-2000
1990-2000
Urban Central City 460,477 835,380 5 7 0.5 0.7 35
Urban Suburban 511,956 879,913 28 35 2.8 3.5 77
Rural Adjacent 4,466 190,692 0 10 0.0 1.0 70
Rural Nonadjacent -35,250 40,044 -4 5 -0.4 0.5 59
Source: Texas State Data Center and the Office of the State Demographer
Rural Texas: Wrangling with Change Characteristics of Rural Texas’ Population
Source: Texas State Data Center and the Office of the State Demographer
Between 1990 and 2000, nonadjacent
rural areas reversed the population loss
experienced during the 1980s. Still,
net migration rates were lower in
nonadjacent rural areas when
compared to adjacent rural areas—the
net migration rate for nonadjacent
rural areas was half that of adjacent
rural areas during the 1990s.
The higher net migration rates of rural
areas adjacent to urban areas reflect
the ongoing suburbanization and
exurbanization1 of Texas.

6
While the fastest growth rural areas are adjacent to urban areas, nonadjacent rural areas show improved growth too
Between 1980 and 1990, rural areas adjacent to urban areas grew more than three times faster
than nonadjacent rural areas. Between 1990 and 2000, this trend continued with rural areas
adjacent to urban areas growing by 14 percent. From 1990 to 2000, nonadjacent rural areas
showed increased strength by gaining population at a rate four times higher than in the previous
decade.
Overall rural poverty decreases, urban poverty remains constant Rural Texas continues to have higher poverty rates when compared to both urban Texas and
Texas as a whole. Between 1998 and 2002, poverty in rural Texas decreased by 1.5 percent.
During that same time, urban poverty remained constant. In 2002, rural Texans accounted for 17
percent of Texas’ population living in poverty.
Percentage of rural Texans living in poverty, 1998-2002
Year Total poverty
population Total population Percent of population
Rural 1998 587,445 3,076,638 19.1%
2002 565,344 3,210,609 17.6%
Urban 1998 2,515,125 16,682,976 15.1%
2002 2,775,901 18,569,284 14.9%
Texas 1998 3,102,570 19,759,614 15.7%
2002 3,341,245 21,779,893 15.3%
Source: Texas State Data Center and the Office of the State Demographer
Population and Population Change for Urban and Rural Areas in Texas, 1980-1990 and 1990-2000
Population Numerical Change Percent Change
Area 1980 1990 2000 1980-1990 1990-2000 1980-1990
1990-2000
Urban Central City 9,731,481 11,615,291 13,993,705 1,883,810 2,378,414 19 20
Urban Suburban 1,811,073 2,550,367 3,698,175 739,294 1,147,808 41 45
Rural Adjacent 1,841,723 1,962,353 2,234,027 120,630 271,674 7 14
Rural Nonadjacent 844,914 858,499 925,913 13,585 67,414 2 8
Source: Texas State Data Center and the Office of the State Demographer
Rural Texas: Wrangling with Change Characteristics of Rural Texas’ Population

7
Educational attainment in Texas (2000)
0%
10%
20%
30%
40%
Rural 14% 17% 32% 20% 4% 9% 4%
Urban 11% 12% 24% 23% 5% 17% 8%
< 9th 9th to 12th HS graduateSome
college
Associate
degree
Bachelor's
degree
Graduate
degree
Educational attainment in Texas, 2000
0%
10%
20%
30%
40%
Rural 30% 32% 24% 9% 4%
Urban 23% 24% 28% 17% 8%
< HS HS Grad.Some coll.
or assoc.Bach. Grad.
Educational attainment in rural Texas
Source: U.S. Census Bureau, 2000 Census
Compared to urban areas, rural Texas has a higher percentage of individuals without a high
school education and fewer individuals that obtain bachelor’s or graduate degrees. These
percentages may be skewed due to rural Texas’ older population, but also reflect differences in
access to institutions of higher education.
Source: U.S. Census Bureau, 2000 Census
Rural Texas: Wrangling with Change Characteristics of Rural Texas’ Population
8
Unemployment in Texas 1990-2004
0
20
40
60
80
100
120
1990
1991
1992
1993
1994
1995
1996
1997
1998
1999
2000
2001
2002
2003
2004
Th
ou
sa
nd
s
0
100
200
300
400
500
600
700
Th
ou
sa
nd
s
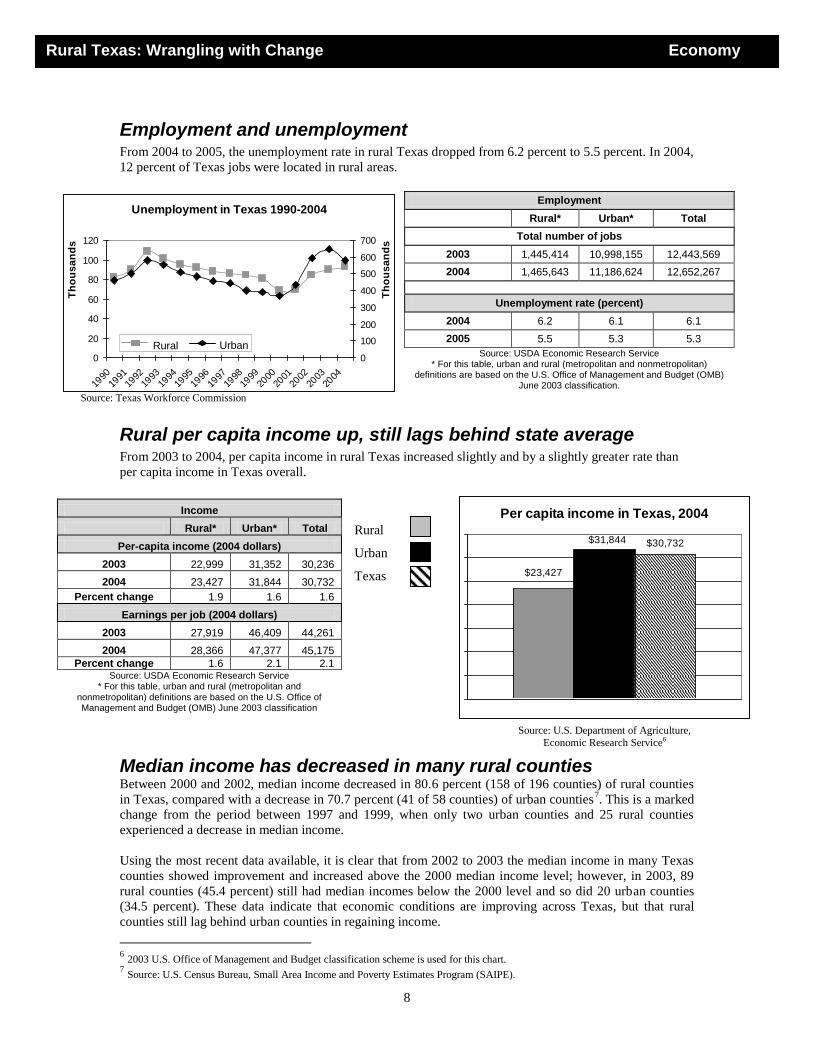
Employment and unemployment From 2004 to 2005, the unemployment rate in rural Texas dropped from 6.2 percent to 5.5 percent. In 2004,
12 percent of Texas jobs were located in rural areas.
Rural per capita income up, still lags behind state average From 2003 to 2004, per capita income in rural Texas increased slightly and by a slightly greater rate than
per capita income in Texas overall.
Rural
Urban
Texas
Source: U.S. Department of Agriculture,
Economic Research Service6
Median income has decreased in many rural counties Between 2000 and 2002, median income decreased in 80.6 percent (158 of 196 counties) of rural counties
in Texas, compared with a decrease in 70.7 percent (41 of 58 counties) of urban counties7. This is a marked
change from the period between 1997 and 1999, when only two urban counties and 25 rural counties
experienced a decrease in median income.
Using the most recent data available, it is clear that from 2002 to 2003 the median income in many Texas
counties showed improvement and increased above the 2000 median income level; however, in 2003, 89
rural counties (45.4 percent) still had median incomes below the 2000 level and so did 20 urban counties
(34.5 percent). These data indicate that economic conditions are improving across Texas, but that rural
counties still lag behind urban counties in regaining income.
6 2003 U.S. Office of Management and Budget classification scheme is used for this chart.
7 Source: U.S. Census Bureau, Small Area Income and Poverty Estimates Program (SAIPE).
Employment
Rural* Urban* Total
Total number of jobs
2003 1,445,414 10,998,155 12,443,569
2004 1,465,643 11,186,624 12,652,267
Unemployment rate (percent)
2004 6.2 6.1 6.1
2005 5.5 5.3 5.3
Source: USDA Economic Research Service * For this table, urban and rural (metropolitan and nonmetropolitan)
definitions are based on the U.S. Office of Management and Budget (OMB) June 2003 classification.
Income
Rural* Urban* Total
Per-capita income (2004 dollars)
2003 22,999 31,352 30,236
2004 23,427 31,844 30,732
Percent change 1.9 1.6 1.6
Earnings per job (2004 dollars)
2003 27,919 46,409 44,261
2004 28,366 47,377 45,175
Percent change 1.6 2.1 2.1 Source: USDA Economic Research Service
* For this table, urban and rural (metropolitan and nonmetropolitan) definitions are based on the U.S. Office of Management and Budget (OMB) June 2003 classification
Per capita income in Texas, 2004
$30,732
$23,427
$31,844
Rural Texas: Wrangling with Change Economy
Rural Urban
Source: Texas Workforce Commission

9
Distribution of Texas healthcare providers (2006)
0%
20%
40%
60%
80%
100%
Rural 10% 9% 10% 12% 9% 9%
Urban 90% 91% 90% 88% 91% 91%
PCP Dent. Pharm. PA NP RN
Number of Texas healthcare providers (2006)
0
50,000
100,000
150,000
Rural 1,580 764 1,719 436 417 13,679
Urban 13,718 7,689 16,057 3,194 4,055 136,269
PCP Dent. Pharm. PA NP RN
Texas healthcare providers per 100,000 (2006)
0
100
200
300
400
500
600
700
800
Rural 47 23 51 13 12 406
Urban 68 38 80 16 20 678
Texas 65 36 76 15 19 639
PCP Dent. Pharm. PA NP RN
Disparities in number of healthcare providers highlight ongoing need for rural-focused recruitment and retention programs
This chart shows the number and
distribution of healthcare providers8 in
rural and urban areas of Texas in 2006.
Source: Texas Department of State Health Services
In 2006, rural Texans accounted for 14
percent of the state’s total population. The
percentage of healthcare professionals is
lower than the overall population in six
key categories: primary care physicians,
dentists, pharmacists, physician assistants,
nurse practitioners, and registered nurses.
Source: Texas Department of State Health Services
When looking at healthcare providers per
100,000 persons, rural Texas is below the
state average in six key categories:
primary care physicians, dentists,
pharmacists, physician assistants, nurse
practitioners, and registered nurses.
Rural Texas comes closest to matching
state and urban levels for physician
assistants.
Source: Texas Department of State Health Services
8 PCP-Primary care physicians; Dent.-Dentists; Pharm.-Pharmacists; PA-Physician Assistants; NP-Nurse Practitioners; RN-
Registered Nurses
Rural Texas: Wrangling with Change Healthcare in Rural Texas

10
Rural Texans are more likely to be uninsured In Texas, according to preliminary estimates from 2002, Texas had the following rates of
uninsured: Under 19 years, 14 percent; 19 to 64 years, 28 percent; and Under 65, 24 percent.
Uninsured Texans, 2002 preliminary estimates
0%
5%
10%
15%
20%
25%
30%
35%
40%
Rural 16% 34% 28%
Urban 14% 27% 23%
Age 19 19 - 64 Under Age 65
Source: Texas Health and Human Services Commission
In 2002, in all ages groups, rural Texans were more likely to be uninsured when compared to
urban Texans and Texans overall.
Rural Texas: Wrangling with Change Healthcare in Rural Texas

11
Owner occupied housing,
by period of construction
0%
10%
20%
30%
40%
50%
Rural 17% 44% 39%
Urban 10% 44% 46%
Pre 1950 1950-1979 1980 to present
Renter occupied housing,
by period of construction
0%
10%
20%
30%
40%
50%
60%
Rural 18% 52% 30%
Urban 9% 48% 43%
Pre 1950 1950-1979 1980 to present
Rural Texas has a higher percentage of older housing stock Rural Texas contains 15 percent of Texas’ occupied housing stock. Compared with urban areas of
Texas, rural areas have a higher percentage of occupied housing stock built prior to 1950 for both
renter- and owner-occupied housing (Renter-occupied: rural, 18 percent rural; urban, 9 percent.
Owner-occupied: rural, 17 percent; urban, 10 percent).
Source: U.S. Census Bureau, 2000 Census Source: U.S. Census Bureau, 2000 Census
Fewer rural Texans have housing with available phone service Homeowners, in rural and urban areas, are
more likely than renters to occupy housing
with available telephone service. Two percent
of homeowners in Texas live in housing that
lacks available telephone service compared
with 6 percent of renters.
Renters in rural areas are least likely to live in
housing units with available phone service
(more than twice as likely as renters in urban
areas). Eleven percent of renters in rural
counties, and 5 percent of renters in urban
counties, occupy housing that lacks available
telephone service. Source: U.S. Census Bureau, 2000 Census
Rural Texas: Wrangling with Change Housing
Housing units with no telephone service
available, 2000
0%
2%
4%
6%
8%
10%
12%
Owner occupied 3.1% 1.3% 1.6%
Renter occupied 10.6% 5.3% 5.9%
Rural Urban Texas

12
While rural childhood poverty decreases, rates remain high
From 1998 to 2002, child9 poverty in rural Texas decreased from 29 percent to 25
percent.
Texas children living in poverty, 1998-2002
Year
Child poverty
population
Total childhood population
Percent of population
Rural 1998 234,145 805,701 29.1%
2002 206,384 835,123 24.7%
Urban 1998 1,064,348 4,886,521 21.8%
2002 1,119,225 5,216,810 21.5%
Texas 1998 1,298,493 5,692,222 22.8%
2002 1,325,609 6,051,933 21.9%
U.S. Census Bureau, Small Area Income and Poverty Estimates Program
In 1998, rural Texas children in poverty accounted for 40 percent of the rural Texas’ total
poverty population. By 2002, rural children made up 37 percent of rural Texas’ total
poverty population.
Percentage of rural Texans living in poverty, 1998-2002
Year Total poverty
population Total population Percent of population
Rural 1998 587,445 3,076,638 19.1%
2002 565,344 3,210,609 17.6%
Urban 1998 2,515,125 16,682,976 15.1%
2002 2,775,901 18,569,284 14.9%
Texas 1998 3,102,570 19,759,614 15.7%
2002 3,341,245 21,779,893 15.3%
U.S. Census Bureau, Small Area Income and Poverty Estimates Program
9 Those individuals between the ages of 0 and 17.
Rural Texas: Wrangling with Change Focus on rural youth
13
Percentage of children receiving TANF
0%
2%
4%
6%
8%
10%
12%
1993 1994 1995 1996 1997 1998 1999 2000 2001 2002 2003
Children enrolled in Medicaid, percent change
from previous year
-10%
0%
10%
20%
30%
40%
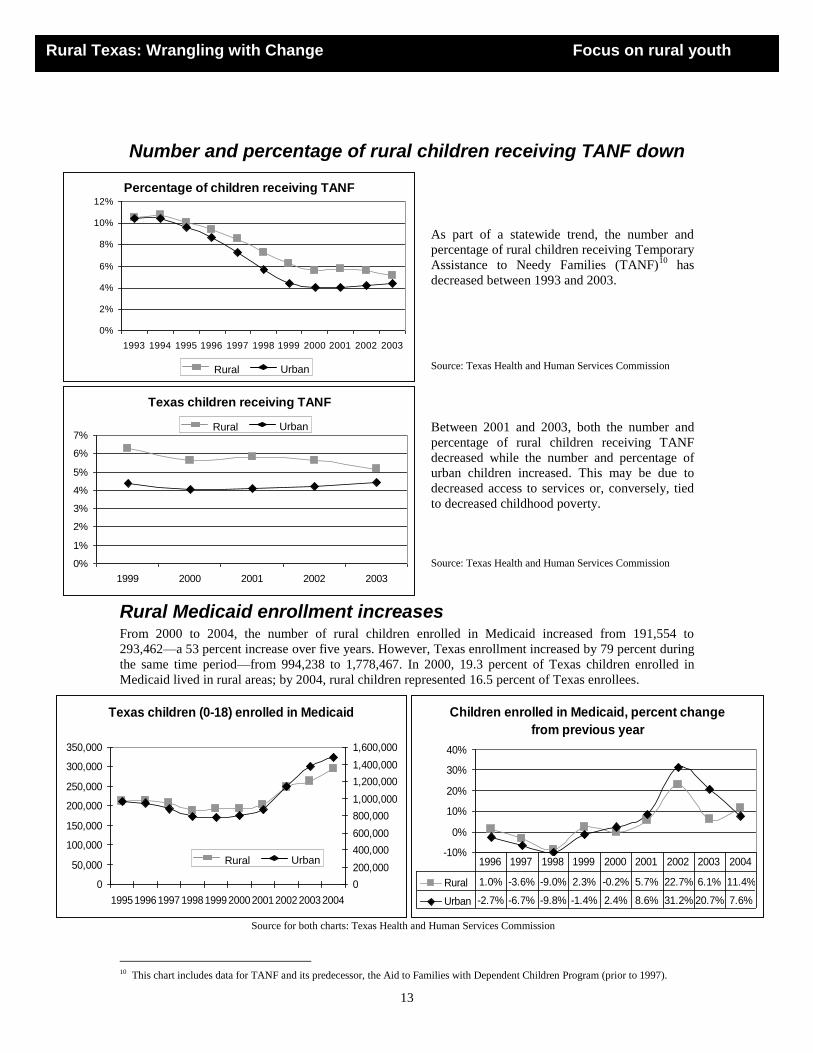
Rural 1.0% -3.6% -9.0% 2.3% -0.2% 5.7% 22.7% 6.1% 11.4%
Urban -2.7% -6.7% -9.8% -1.4% 2.4% 8.6% 31.2% 20.7% 7.6%
1996 1997 1998 1999 2000 2001 2002 2003 2004
Texas children (0-18) enrolled in Medicaid
0
50,000
100,000
150,000
200,000
250,000
300,000
350,000
1995 1996 1997 1998 1999 2000 2001 20022003 2004
0
200,000
400,000
600,000
800,000
1,000,000
1,200,000
1,400,000
1,600,000
Texas children receiving TANF
0%
1%
2%
3%
4%
5%
6%
7%
1999 2000 2001 2002 2003
Number and percentage of rural children receiving TANF down
As part of a statewide trend, the number and
percentage of rural children receiving Temporary
Assistance to Needy Families (TANF)10
has
decreased between 1993 and 2003.
Source: Texas Health and Human Services Commission
Between 2001 and 2003, both the number and
percentage of rural children receiving TANF
decreased while the number and percentage of
urban children increased. This may be due to
decreased access to services or, conversely, tied
to decreased childhood poverty.
Source: Texas Health and Human Services Commission
Rural Medicaid enrollment increases From 2000 to 2004, the number of rural children enrolled in Medicaid increased from 191,554 to
293,462—a 53 percent increase over five years. However, Texas enrollment increased by 79 percent during
the same time period—from 994,238 to 1,778,467. In 2000, 19.3 percent of Texas children enrolled in
Medicaid lived in rural areas; by 2004, rural children represented 16.5 percent of Texas enrollees.
Source for both charts: Texas Health and Human Services Commission
10 This chart includes data for TANF and its predecessor, the Aid to Families with Dependent Children Program (prior to 1997).
Rural Texas: Wrangling with Change Focus on rural youth
Rural Urban
Rural Urban
Rural Urban

14
Number of juvenile violent crimes
540
550
560
570
580
590
600
610
620
2001 2002 2003
4,400
4,450
4,500
4,550
4,600
4,650
Texas Children’s Health Insurance Program
From 2002 to 2003, the number of rural
children enrolled in the Children’s Health
Insurance Program decreased.
Source: Texas Health and Human Services Commission
Juvenile violent crimes decrease in rural Texas
In rural Texas, between 2001 and 2003, the
number of arrests of children ages 10 to 17
for violent offenses decreased by seven
percent.
Source: Texas Department of Public Safety
More rural children are living in single parent families
Percentage of Texas children living in single parent families
Year Rural Urban Texas
Number Percent Number Percent Number Percent
2000 166,673 20% 1,060,519 21% 1,227,192 21%
1990 125,355 16% 759,865 19% 885,220 18%
Change 41,318 4% 300,654 2% 341,972 3%
Source: U.S. Census Bureau
Texas children enrolled in CHIP
0
10,000
20,000
30,000
40,000
50,000
60,000
70,000
80,000
90,000
100,000
2000 2001 2002 2003
0
50,000
100,000
150,000
200,000
250,000
300,000
350,000
400,000
450,000
Rural Texas: Wrangling with Change Focus on rural youth
In 1990, 16 percent of rural
children (0-17 years) lived in
families headed by a parent
without a spouse present in the
home. Between 1990 and
2000, the percentage of such
children grew to 20 percent.
Rural Urban
Rural Urban

15
Children in family violence shelters, per 1,000
2.4
2.8
3.2
3.6
2000 2001 2002 2003
Confirmed victims of child abuse (0-17)
0
2,000
4,000
6,000
8,000
10,000
12,000
1990
1991
1992
1993
1994
1995
1996
1997
1998
1999
2000
2001
2002
2003
2004
0
10,000
20,000
30,000
40,000
50,000
60,000
Child deaths, Ages 1 to 14, 1990 to 2003
0
50
100
150
200
250
300
1990
1991
1992
1993
1994
1995
1996
1997
1998
1999
2000
2001
2002
2003
0
200
400
600
800
1,000
1,200
Higher rates of rural children live in family violence shelters
From 2000 to 2003, the rate of rural
children living in family violence shelters
increased from 2.9 children per 1,000 to
3.5 children per 1,000.
Source: Texas Health and Human Services Commission
Number of confirmed victims of child abuse increases markedly
From 2001 to 2004, the number of
confirmed victims of child abuse in rural
Texas grew by 25 percent (nearly 1,800
children). The numerical increase was from
7,281 in 2001 to 9,068 in 2004.
Source: Texas Department of Family and Protective Services
Child deaths in rural Texas
The number of child deaths in rural Texas
fluctuates annually, but has shown an
overall decrease since 1990. In 2003, 19
percent of child deaths in Texas took place
in rural areas. In 2003, rural children
represented 13 percent of Texas’ overall
child population (824,217 of 6,108,755).
Source: Texas Department of State Health Services
Rural Texas: Wrangling with Change Focus on rural youth
Rural Urban
Rural Urban
Rural Urban

16
About this report
This report was prepared by Kim White and
Eric Beverly, Governmental Relations,
Research, and Policy Specialists with the
Office of Rural Community Affairs
Map prepared by Dave Darnell, Rural
Health Specialist, with the Office of
Rural Community Affairs
Other reports on the Status of Rural Texas Series
The Status of Rural Texas, 2002
The Status of Rural Texas, 2003
The Status of Rural Texas, 2004
Small Town Texas, 2005


1700 N. Congress, Suite 220, Austin, Texas 78701
P.O. Box 12877, Austin, Texas 78711
Phone: 512-936-6701 Toll Free: 800-544-2042 Fax: 512-936-6776
Email: [email protected] Web: www.orca.state.tx.us
Field Offices
Alice Field Office (Jim Wells County)
Jim Wells County Courthouse
200 N. Almond Alice, TX 78332
Phone: 361-661-1665 Fax: 361-661-1675
Levelland Field Office (Hockley County)
1611 FM 300
Levelland, TX 79336 Phone: 806-897-1113 Fax: 806-897-1114
Bedias Field Office (Grimes County)
3512 E. Main Street
Bedias, TX 77831 Phone: 936-395-2456 Fax: 936-395-2457
Nacogdoches Field Office (Nacogdoches County)
202 East Pilar, Room 303
Nacogdoches, TX 75961 Phone: 936-560-4188 Fax: 936-560-9182
Carrizo Springs Field Office (Dimmit County)*
307 W. Nopal Street
Carrizo Springs, TX 78834
Phone: TBA Fax: TBA * To open early 2007.
Sweetwater Field Office (Nolan County) 201 Elm Street
Sweetwater, TX 79556
Phone: 325-236-9672 Fax: 325-236-9722
Kountze Field Office (Hardin County)
Hardin County Courthouse Annex 440 Monroe (Highway 326)
Kountze, TX 77625
Phone: 512-914-3723 Fax: TBA
Vernon Field Office (Wilbarger County)
Vernon College
4400 College Drive Vernon, TX 76384
Phone: 940-553-3556 Fax: 940-553-3560
LaGrange Field Office (Fayette County)
254 North Jefferson Street, Room 100 LaGrange, TX 78945
Phone: 979-968-6764 Fax: 979-968-8714
Hard copies of this report are printed on 30% recycled paper.
To obtain copies of this report, contact us or access the report online at www.orca.state.tx.us