2009 status of rural texas
DESCRIPTION
A demographic report on conditions and trends in rural Texas.TRANSCRIPT
THE STATUS OF RURAL TEXAS, 2009
Texas Department of Rural Affairs Charles S. (Charlie) Stone, Executive Director

December 31, 2009 The Honorable Rick Perry Governor, State of Texas
The Honorable Joe Straus Speaker of the House of Representatives, State of Texas
The Honorable David Dewhurst Lieutenant Governor, State of Texas
The Honorable Members 81st Legislature
House Bill 7 (77th Legislature) created the Office of Rural Community Affairs (ORCA), which is now known as the Texas Department of Rural Affairs (TDRA), and set forth the following requirement:
“The office shall…compile an annual report describing and evaluating the condition of rural communities.”
The following report is offered in fulfillment of the aforementioned requirement and provides a snapshot of where rural Texas stands today. The report speaks to the broad spectrum of issues that affect rural communities across our state. Currently, the population of rural Texas (3,261,298 persons according to July 1, 2008 Census estimates) exceeds the population of 22 individual states and is greater than the combined populations of Alaska, North Dakota, Vermont, Wyoming, and the District of Columbia. Each rural community contributes significantly to the people of the state of Texas and Texas’ economy. In addition to offering a vast array of tourism and recreational opportunities, rural Texas is the primary source of agricultural products, livestock, water, and mineral wealth that enhance the vitality of the Texas economy. In every sense of the word, rural communities are partners in the past, present, and future successes of Texas. Indeed, the viability of rural Texas is critical to the viability of Texas as a state. And because rural, suburban, and urban areas of Texas are inextricably linked, successes in rural Texas are successes for all Texans. It is our hope that this eighth report on the status of rural Texas will contribute to the ongoing dialogue that is shaping Texas’ future. The report highlights some of the complex and diverse issues affecting rural Texas. We will continue to monitor developments with all interested parties to maintain an objective focus on the status of life in rural communities. Thank you on behalf of the TDRA Governing Board and the staff of the agency for the opportunity to contribute to the future of our rural communities. Respectfully submitted,
Charles S. (Charlie) Stone Executive Director

THE STATUS OF RURAL TEXAS, 2009 This report contains statistics and data regarding rural Texas, including: Population
Estimate of rural Texas’ population (January 1, 2008)
Census estimate of rural Texas’ population (July 1, 2008)
Estimates for the race, ethnicity, and age of the rural population (2007)
New population projections for rural Texas by race/ethnicity (2000-2040)
Migration to and from rural Texas
Fast growth areas in rural Texas from 2000 to 2008 Economy
Updated per capita income and earnings per job (2006-2007)
Rural employment change (2005-2006 through 2007-2008)
Updated rural unemployment rates (2008 annual averages)
Updated Census Small Area Income and Poverty Estimates (SAIPE) county poverty rate estimates for 2007 (and a comparison to 2005 poverty estimates).
Entrepreneurship indicators (2006)
Small businesses in rural Texas
Farm income (2007 and 2008) Housing
New Census estimates for rural housing units (2008)
Survey on the local perception of housing needs (2006)
New estimates of foreclosures in rural Texas Healthcare
Physicians in rural Texas (September 2008)
New Census American Community Survey estimates for the percentage of rural Texans without health insurance (2008)

2
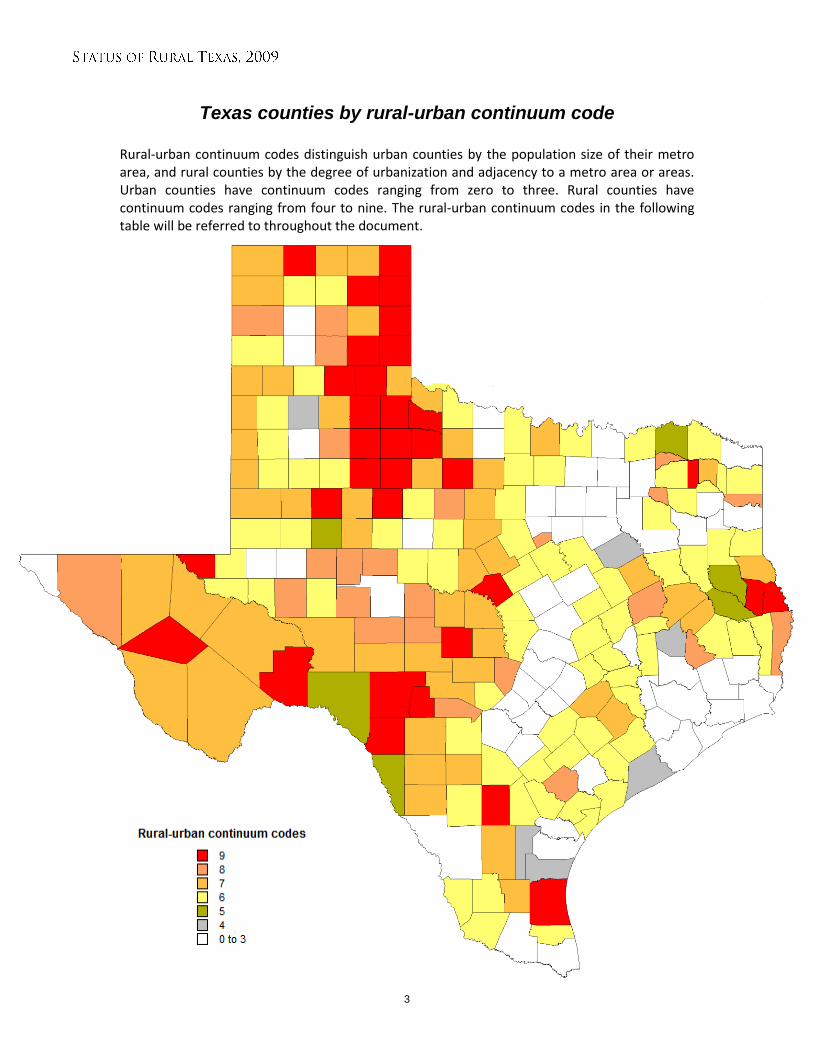
Rural and urban counties in Texas In this report, a “rural county” is a county that is outside of a Metropolitan Statistical Area (or nonmetropolitan) under the 1993 U.S. Office of Management and Budget (OMB) classification scheme for counties. An “urban county” is a county that is part of a Metropolitan Statistical Area (or metropolitan) under the 1993 OMB classification scheme for counties.
Legend
Rural (Codes 4-9)
Urban (Codes 0-3)
3
Texas counties by rural-urban continuum code Rural-urban continuum codes distinguish urban counties by the population size of their metro area, and rural counties by the degree of urbanization and adjacency to a metro area or areas. Urban counties have continuum codes ranging from zero to three. Rural counties have continuum codes ranging from four to nine. The rural-urban continuum codes in the following table will be referred to throughout the document.

4
Rural-urban continuum codes
Rural-urban continuum codes
Code Description
Urban counties
0 Central counties of metro areas of 1 million population or more.
1 Fringe counties of metro areas of 1 million population or more.
2 Counties in metro areas of 250,000 to 1 million population.
3 Counties in metro areas of fewer than 250,000 population.
Rural counties
4 Urban population of 20,000 or more, adjacent to a metro area.
5 Urban population of 20,000 or more, not adjacent to a metro area.
6 Urban population of 2,500 to 19,999, adjacent to a metro area.
7 Urban population of 2,500 to 19,999, not adjacent to a metro area.
8 Completely rural or less than 2,500 urban population, adjacent to a metro area.
9 Completely rural or less than 2,500 urban population, not adjacent to a metro area.
Source: U.S. Department of Agriculture, Economic Research Service
Urban 0 Bexar Collin Dallas Denton Fort Bend Galveston Harris Rockwall Tarrant
1 Brazoria Chambers Comal Ellis Guadalupe Henderson Hood Hunt Johnson
Kaufman Liberty Montgomery Parker Waller Wilson
2 Bastrop Bell Caldwell Cameron Coryell El Paso Hardin Hays Hidalgo
Jefferson Nueces Orange San Patricio Travis Williamson
3 Archer Bowie Brazos Ector Grayson Gregg Harrison Lubbock McLennan
Midland Potter Randall Smith Taylor Tom Green Upshur Victoria
Webb Wichita
Rural 4 Hale Jim Wells Kleberg Matagorda Navarro Walker
5 Angelina Howard Lamar Maverick Nacogdoches Val Verde
6 Anderson Andrews Aransas Atascosa Austin Bee Bosque Burleson Burnet
Calhoun Callahan Camp Cass Cherokee Clay Coleman Cooke
Crane Deaf Smith DeWitt Erath Falls Fannin Garza Gonzales
Grimes Hamilton Hill Hockley Hopkins Hutchinson Jack Jackson
Jasper Jim Hogg Jones Karnes Kendall La Salle Lamb Lampasas
Lavaca Lee Limestone Live Oak Lynn Madison Martin Medina
Milam Moore Morris Nolan Palo Pinto Panola Polk Reagan
Red River Refugio Robertson Runnels Rusk Starr Swisher Terry
Tyler Van Zandt Ward Washington Wharton Wilbarger Willacy Winkler
Wise Wood Zapata
7 Bailey Baylor Brewster Brooks Brown Castro Childress Cochran Colorado
Comanche Crockett Culberson Dallam Dawson Dimmit Duval Eastland
Fayette Floyd Freestone Frio Gaines Gillespie Gray Hansford
Hardeman Hartley Haskell Houston Kerr Kimble Llano McCulloch
Mitchell Montague Ochiltree Parmer Pecos Presidio Reeves San Saba
Scurry Shelby Stephens Sutton Titus Trinity Uvalde Yoakum
Young Zavala
8 Armstrong Bandera Blanco Carson Coke Concho Crosby Delta Glasscock
Goliad Hudspeth Irion Leon Marion Menard Newton Oldham
Rains San Jacinto Schleicher Shackelford Somervell Sterling Upton
9 Borden Briscoe Collingsworth Cottle Dickens Donley Edwards Fisher Foard
Franklin Hall Hemphill Jeff Davis Kenedy Kent King Kinney
Knox Lipscomb Loving Mason McMullen Mills Motley Real
Roberts Sabine San Augustine Sherman Stonewall Terrell Throckmorton Wheeler
5
Population
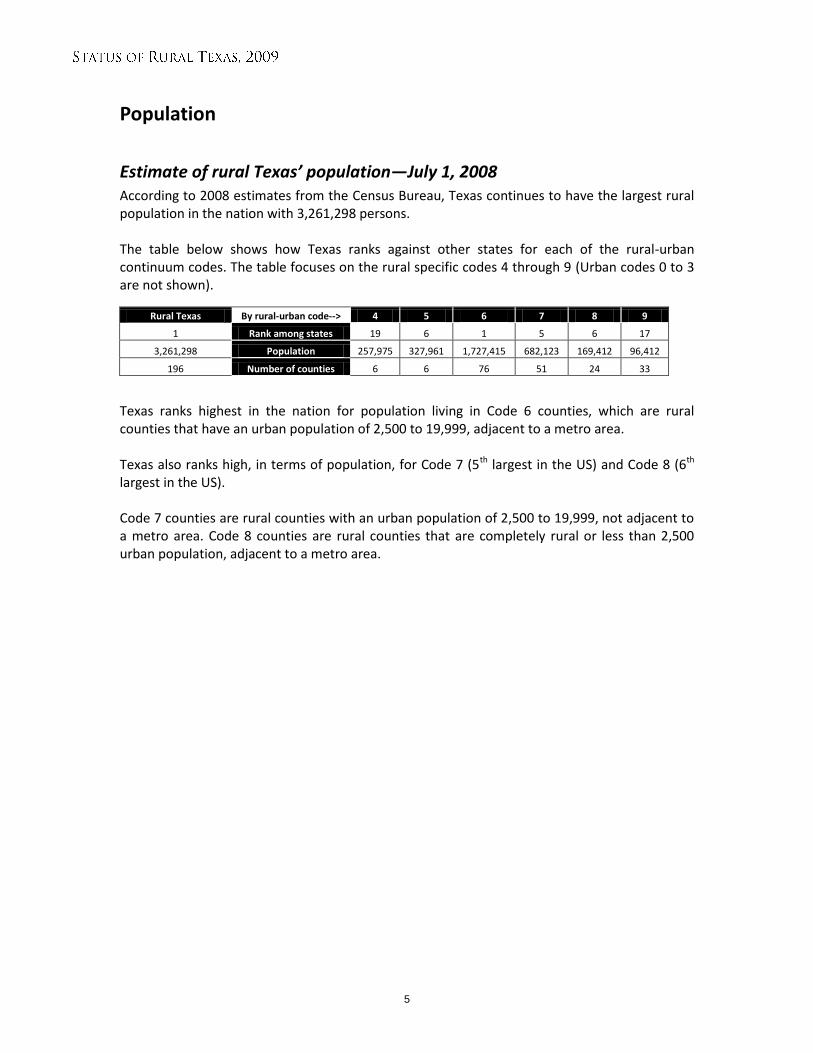
Estimate of rural Texas’ population—July 1, 2008 According to 2008 estimates from the Census Bureau, Texas continues to have the largest rural population in the nation with 3,261,298 persons. The table below shows how Texas ranks against other states for each of the rural-urban continuum codes. The table focuses on the rural specific codes 4 through 9 (Urban codes 0 to 3 are not shown).
Rural Texas By rural-urban code--> 4 5 6 7 8 9
1 Rank among states 19 6 1 5 6 17
3,261,298 Population 257,975 327,961 1,727,415 682,123 169,412 96,412
196 Number of counties 6 6 76 51 24 33
Texas ranks highest in the nation for population living in Code 6 counties, which are rural counties that have an urban population of 2,500 to 19,999, adjacent to a metro area. Texas also ranks high, in terms of population, for Code 7 (5th largest in the US) and Code 8 (6th largest in the US). Code 7 counties are rural counties with an urban population of 2,500 to 19,999, not adjacent to a metro area. Code 8 counties are rural counties that are completely rural or less than 2,500 urban population, adjacent to a metro area.
6
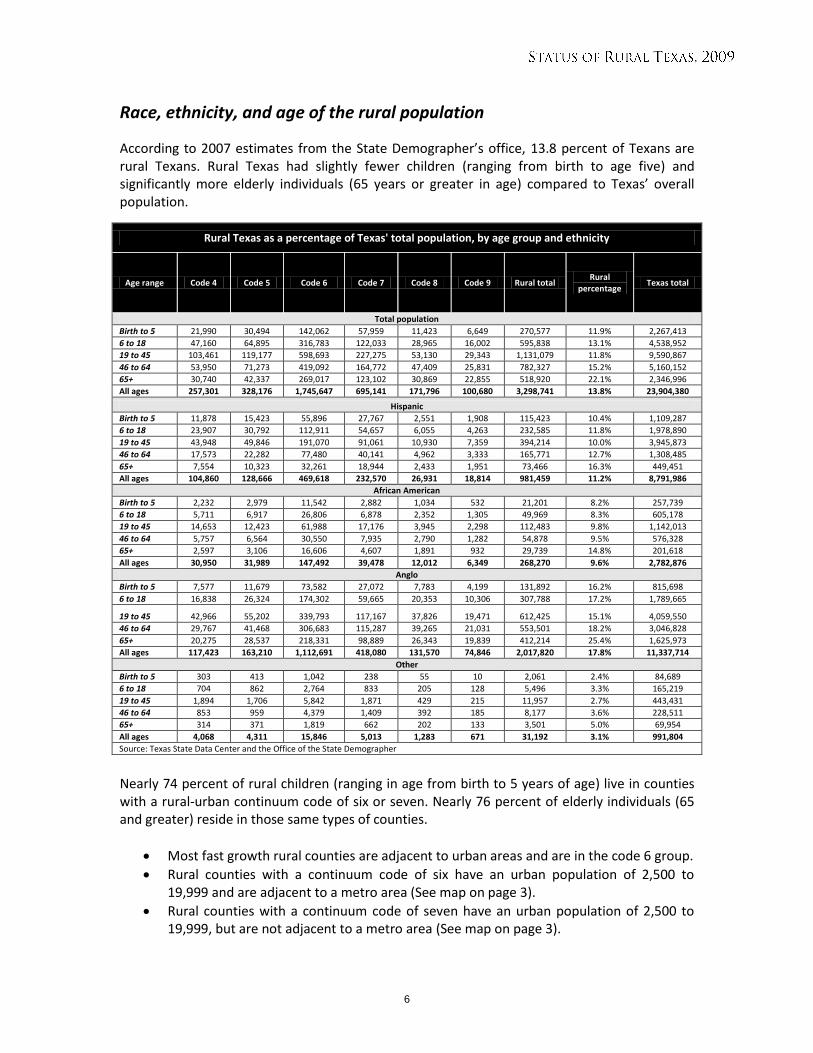
Race, ethnicity, and age of the rural population
According to 2007 estimates from the State Demographer’s office, 13.8 percent of Texans are rural Texans. Rural Texas had slightly fewer children (ranging from birth to age five) and significantly more elderly individuals (65 years or greater in age) compared to Texas’ overall population.
Rural Texas as a percentage of Texas' total population, by age group and ethnicity
Age range Code 4 Code 5 Code 6 Code 7 Code 8 Code 9 Rural total Rural
percentage Texas total
Total population
Birth to 5 21,990 30,494 142,062 57,959 11,423 6,649 270,577 11.9% 2,267,413
6 to 18 47,160 64,895 316,783 122,033 28,965 16,002 595,838 13.1% 4,538,952
19 to 45 103,461 119,177 598,693 227,275 53,130 29,343 1,131,079 11.8% 9,590,867
46 to 64 53,950 71,273 419,092 164,772 47,409 25,831 782,327 15.2% 5,160,152
65+ 30,740 42,337 269,017 123,102 30,869 22,855 518,920 22.1% 2,346,996
All ages 257,301 328,176 1,745,647 695,141 171,796 100,680 3,298,741 13.8% 23,904,380
Hispanic
Birth to 5 11,878 15,423 55,896 27,767 2,551 1,908 115,423 10.4% 1,109,287
6 to 18 23,907 30,792 112,911 54,657 6,055 4,263 232,585 11.8% 1,978,890
19 to 45 43,948 49,846 191,070 91,061 10,930 7,359 394,214 10.0% 3,945,873
46 to 64 17,573 22,282 77,480 40,141 4,962 3,333 165,771 12.7% 1,308,485
65+ 7,554 10,323 32,261 18,944 2,433 1,951 73,466 16.3% 449,451
All ages 104,860 128,666 469,618 232,570 26,931 18,814 981,459 11.2% 8,791,986
African American
Birth to 5 2,232 2,979 11,542 2,882 1,034 532 21,201 8.2% 257,739
6 to 18 5,711 6,917 26,806 6,878 2,352 1,305 49,969 8.3% 605,178
19 to 45 14,653 12,423 61,988 17,176 3,945 2,298 112,483 9.8% 1,142,013
46 to 64 5,757 6,564 30,550 7,935 2,790 1,282 54,878 9.5% 576,328
65+ 2,597 3,106 16,606 4,607 1,891 932 29,739 14.8% 201,618
All ages 30,950 31,989 147,492 39,478 12,012 6,349 268,270 9.6% 2,782,876
Anglo
Birth to 5 7,577 11,679 73,582 27,072 7,783 4,199 131,892 16.2% 815,698
6 to 18 16,838 26,324 174,302 59,665 20,353 10,306 307,788 17.2% 1,789,665
19 to 45 42,966 55,202 339,793 117,167 37,826 19,471 612,425 15.1% 4,059,550
46 to 64 29,767 41,468 306,683 115,287 39,265 21,031 553,501 18.2% 3,046,828
65+ 20,275 28,537 218,331 98,889 26,343 19,839 412,214 25.4% 1,625,973
All ages 117,423 163,210 1,112,691 418,080 131,570 74,846 2,017,820 17.8% 11,337,714
Other
Birth to 5 303 413 1,042 238 55 10 2,061 2.4% 84,689
6 to 18 704 862 2,764 833 205 128 5,496 3.3% 165,219
19 to 45 1,894 1,706 5,842 1,871 429 215 11,957 2.7% 443,431
46 to 64 853 959 4,379 1,409 392 185 8,177 3.6% 228,511
65+ 314 371 1,819 662 202 133 3,501 5.0% 69,954
All ages 4,068 4,311 15,846 5,013 1,283 671 31,192 3.1% 991,804
Source: Texas State Data Center and the Office of the State Demographer
Nearly 74 percent of rural children (ranging in age from birth to 5 years of age) live in counties with a rural-urban continuum code of six or seven. Nearly 76 percent of elderly individuals (65 and greater) reside in those same types of counties.
Most fast growth rural counties are adjacent to urban areas and are in the code 6 group.
Rural counties with a continuum code of six have an urban population of 2,500 to 19,999 and are adjacent to a metro area (See map on page 3).
Rural counties with a continuum code of seven have an urban population of 2,500 to 19,999, but are not adjacent to a metro area (See map on page 3).
7
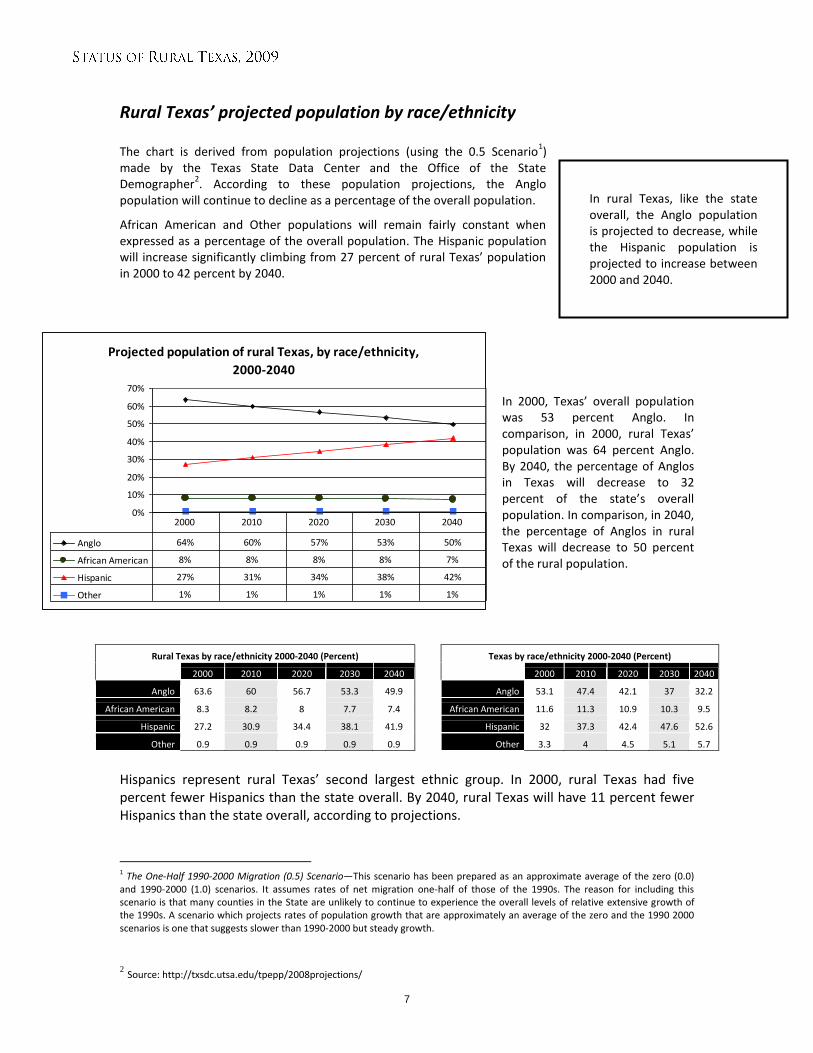
Rural Texas’ projected population by race/ethnicity The chart is derived from population projections (using the 0.5 Scenario
1)
made by the Texas State Data Center and the Office of the State Demographer
2. According to these population projections, the Anglo
population will continue to decline as a percentage of the overall population.
African American and Other populations will remain fairly constant when expressed as a percentage of the overall population. The Hispanic population will increase significantly climbing from 27 percent of rural Texas’ population in 2000 to 42 percent by 2040.
In 2000, Texas’ overall population was 53 percent Anglo. In comparison, in 2000, rural Texas’ population was 64 percent Anglo. By 2040, the percentage of Anglos in Texas will decrease to 32 percent of the state’s overall population. In comparison, in 2040, the percentage of Anglos in rural Texas will decrease to 50 percent of the rural population.
Rural Texas by race/ethnicity 2000-2040 (Percent) Texas by race/ethnicity 2000-2040 (Percent)
2000 2010 2020 2030 2040 2000 2010 2020 2030 2040
Anglo 63.6 60 56.7 53.3 49.9 Anglo 53.1 47.4 42.1 37 32.2
African American 8.3 8.2 8 7.7 7.4 African American 11.6 11.3 10.9 10.3 9.5
Hispanic 27.2 30.9 34.4 38.1 41.9 Hispanic 32 37.3 42.4 47.6 52.6
Other 0.9 0.9 0.9 0.9 0.9 Other 3.3 4 4.5 5.1 5.7
Hispanics represent rural Texas’ second largest ethnic group. In 2000, rural Texas had five percent fewer Hispanics than the state overall. By 2040, rural Texas will have 11 percent fewer Hispanics than the state overall, according to projections.
1 The One-Half 1990-2000 Migration (0.5) Scenario—This scenario has been prepared as an approximate average of the zero (0.0) and 1990-2000 (1.0) scenarios. It assumes rates of net migration one-half of those of the 1990s. The reason for including this scenario is that many counties in the State are unlikely to continue to experience the overall levels of relative extensive growth of the 1990s. A scenario which projects rates of population growth that are approximately an average of the zero and the 1990 2000 scenarios is one that suggests slower than 1990-2000 but steady growth.
2 Source: http://txsdc.utsa.edu/tpepp/2008projections/
In rural Texas, like the state overall, the Anglo population is projected to decrease, while the Hispanic population is projected to increase between 2000 and 2040.
Projected population of rural Texas, by race/ethnicity,
2000-2040
0%
10%
20%
30%
40%
50%
60%
70%
Anglo 64% 60% 57% 53% 50%
African American 8% 8% 8% 8% 7%
Hispanic 27% 31% 34% 38% 42%
Other 1% 1% 1% 1% 1%
2000 2010 2020 2030 2040
8
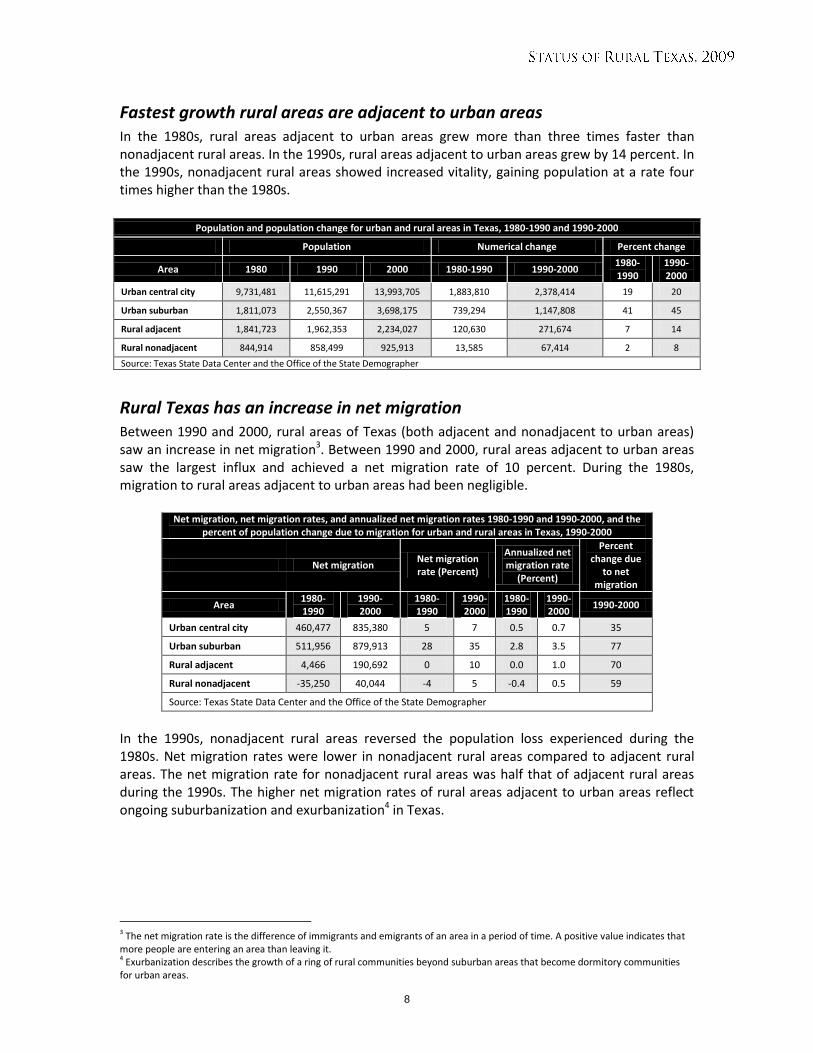
Fastest growth rural areas are adjacent to urban areas In the 1980s, rural areas adjacent to urban areas grew more than three times faster than nonadjacent rural areas. In the 1990s, rural areas adjacent to urban areas grew by 14 percent. In the 1990s, nonadjacent rural areas showed increased vitality, gaining population at a rate four times higher than the 1980s.
Rural Texas has an increase in net migration Between 1990 and 2000, rural areas of Texas (both adjacent and nonadjacent to urban areas) saw an increase in net migration3. Between 1990 and 2000, rural areas adjacent to urban areas saw the largest influx and achieved a net migration rate of 10 percent. During the 1980s, migration to rural areas adjacent to urban areas had been negligible.
Net migration, net migration rates, and annualized net migration rates 1980-1990 and 1990-2000, and the percent of population change due to migration for urban and rural areas in Texas, 1990-2000
Net migration Net migration rate (Percent)
Annualized net migration rate
(Percent)
Percent change due
to net migration
Area 1980-1990
1990-2000
1980-1990
1990-2000
1980-1990
1990-2000
1990-2000
Urban central city 460,477 835,380 5 7 0.5 0.7 35
Urban suburban 511,956 879,913 28 35 2.8 3.5 77
Rural adjacent 4,466 190,692 0 10 0.0 1.0 70
Rural nonadjacent -35,250 40,044 -4 5 -0.4 0.5 59
Source: Texas State Data Center and the Office of the State Demographer
In the 1990s, nonadjacent rural areas reversed the population loss experienced during the 1980s. Net migration rates were lower in nonadjacent rural areas compared to adjacent rural areas. The net migration rate for nonadjacent rural areas was half that of adjacent rural areas during the 1990s. The higher net migration rates of rural areas adjacent to urban areas reflect ongoing suburbanization and exurbanization4 in Texas.
3 The net migration rate is the difference of immigrants and emigrants of an area in a period of time. A positive value indicates that more people are entering an area than leaving it. 4 Exurbanization describes the growth of a ring of rural communities beyond suburban areas that become dormitory communities for urban areas.
Population and population change for urban and rural areas in Texas, 1980-1990 and 1990-2000
Population Numerical change Percent change
Area 1980 1990 2000 1980-1990 1990-2000 1980-1990
1990-2000
Urban central city 9,731,481 11,615,291 13,993,705 1,883,810 2,378,414 19 20
Urban suburban 1,811,073 2,550,367 3,698,175 739,294 1,147,808 41 45
Rural adjacent 1,841,723 1,962,353 2,234,027 120,630 271,674 7 14
Rural nonadjacent 844,914 858,499 925,913 13,585 67,414 2 8
Source: Texas State Data Center and the Office of the State Demographer
9
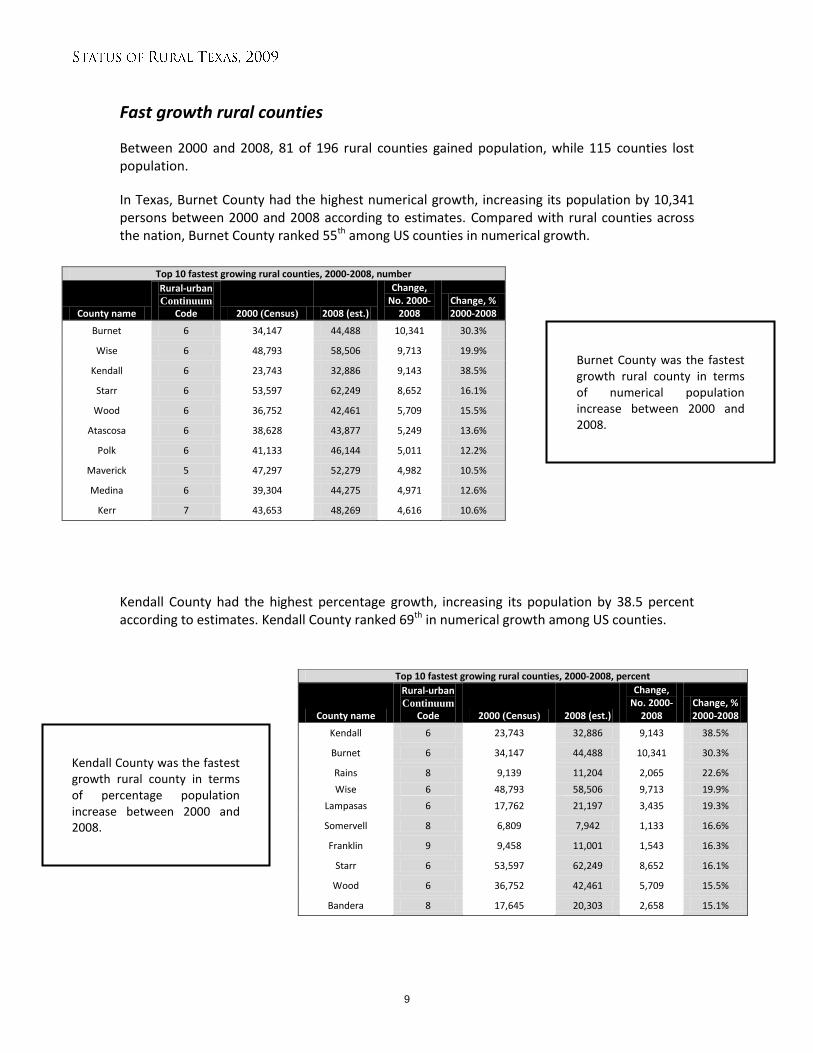
Fast growth rural counties
Between 2000 and 2008, 81 of 196 rural counties gained population, while 115 counties lost population.
In Texas, Burnet County had the highest numerical growth, increasing its population by 10,341 persons between 2000 and 2008 according to estimates. Compared with rural counties across the nation, Burnet County ranked 55th among US counties in numerical growth.
Top 10 fastest growing rural counties, 2000-2008, number
County name
Rural-urban Continuum
Code 2000 (Census) 2008 (est.)
Change, No. 2000-
2008 Change, % 2000-2008
Burnet 6 34,147 44,488 10,341 30.3%
Wise 6 48,793 58,506 9,713 19.9%
Kendall 6 23,743 32,886 9,143 38.5%
Starr 6 53,597 62,249 8,652 16.1%
Wood 6 36,752 42,461 5,709 15.5%
Atascosa 6 38,628 43,877 5,249 13.6%
Polk 6 41,133 46,144 5,011 12.2%
Maverick 5 47,297 52,279 4,982 10.5%
Medina 6 39,304 44,275 4,971 12.6%
Kerr 7 43,653 48,269 4,616 10.6%
Kendall County had the highest percentage growth, increasing its population by 38.5 percent according to estimates. Kendall County ranked 69th in numerical growth among US counties.
Top 10 fastest growing rural counties, 2000-2008, percent
County name
Rural-urban Continuum
Code 2000 (Census) 2008 (est.)
Change, No. 2000-
2008 Change, % 2000-2008
Kendall 6 23,743 32,886 9,143 38.5%
Burnet 6 34,147 44,488 10,341 30.3%
Rains 8 9,139 11,204 2,065 22.6%
Wise 6 48,793 58,506 9,713 19.9%
Lampasas 6 17,762 21,197 3,435 19.3%
Somervell 8 6,809 7,942 1,133 16.6%
Franklin 9 9,458 11,001 1,543 16.3%
Starr 6 53,597 62,249 8,652 16.1%
Wood 6 36,752 42,461 5,709 15.5%
Bandera 8 17,645 20,303 2,658 15.1%
Burnet County was the fastest growth rural county in terms of numerical population increase between 2000 and 2008.
Kendall County was the fastest growth rural county in terms of percentage population increase between 2000 and 2008.
10
Economy
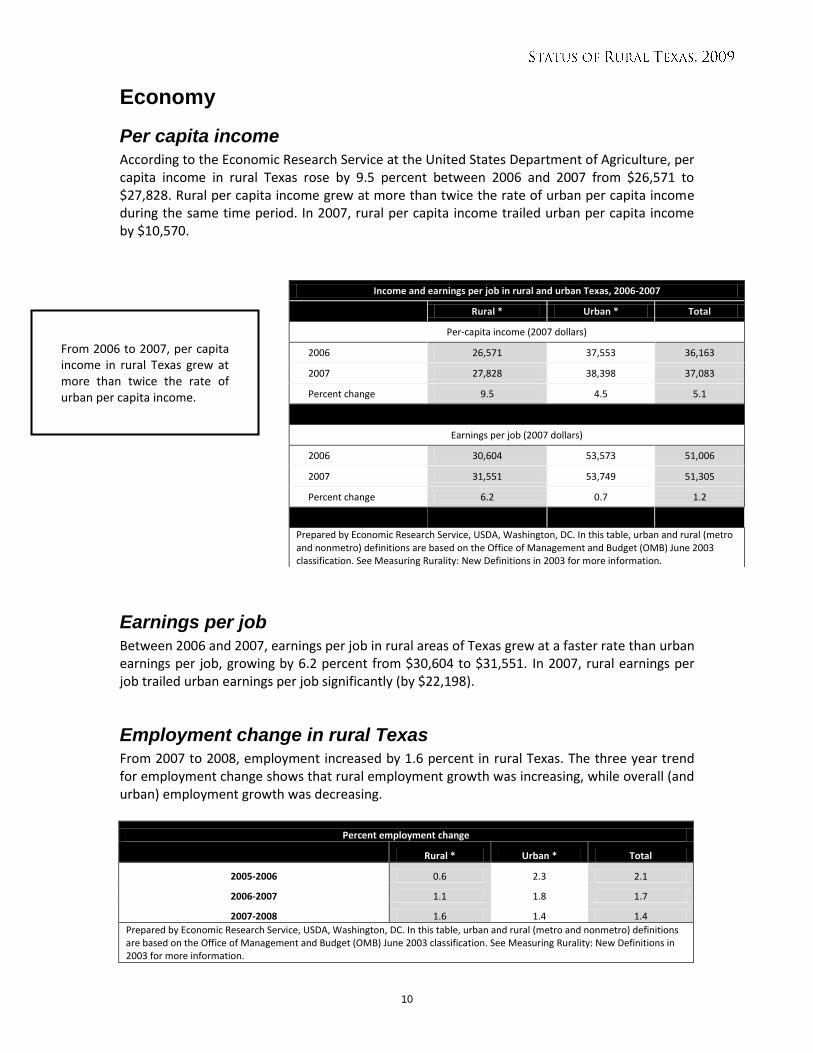
Per capita income According to the Economic Research Service at the United States Department of Agriculture, per capita income in rural Texas rose by 9.5 percent between 2006 and 2007 from $26,571 to $27,828. Rural per capita income grew at more than twice the rate of urban per capita income during the same time period. In 2007, rural per capita income trailed urban per capita income by $10,570.
Earnings per job
Between 2006 and 2007, earnings per job in rural areas of Texas grew at a faster rate than urban earnings per job, growing by 6.2 percent from $30,604 to $31,551. In 2007, rural earnings per job trailed urban earnings per job significantly (by $22,198).
Employment change in rural Texas From 2007 to 2008, employment increased by 1.6 percent in rural Texas. The three year trend for employment change shows that rural employment growth was increasing, while overall (and urban) employment growth was decreasing.
Percent employment change
Rural * Urban * Total
2005-2006 0.6 2.3 2.1
2006-2007 1.1 1.8 1.7
2007-2008 1.6 1.4 1.4
Prepared by Economic Research Service, USDA, Washington, DC. In this table, urban and rural (metro and nonmetro) definitions are based on the Office of Management and Budget (OMB) June 2003 classification. See Measuring Rurality: New Definitions in 2003 for more information.
Income and earnings per job in rural and urban Texas, 2006-2007
Rural * Urban * Total
Per-capita income (2007 dollars)
2006 26,571 37,553 36,163
2007 27,828 38,398 37,083
Percent change 9.5 4.5 5.1
Earnings per job (2007 dollars)
2006 30,604 53,573 51,006
2007 31,551 53,749 51,305
Percent change 6.2 0.7 1.2
Prepared by Economic Research Service, USDA, Washington, DC. In this table, urban and rural (metro and nonmetro) definitions are based on the Office of Management and Budget (OMB) June 2003 classification. See Measuring Rurality: New Definitions in 2003 for more information.
From 2006 to 2007, per capita income in rural Texas grew at more than twice the rate of urban per capita income.
11
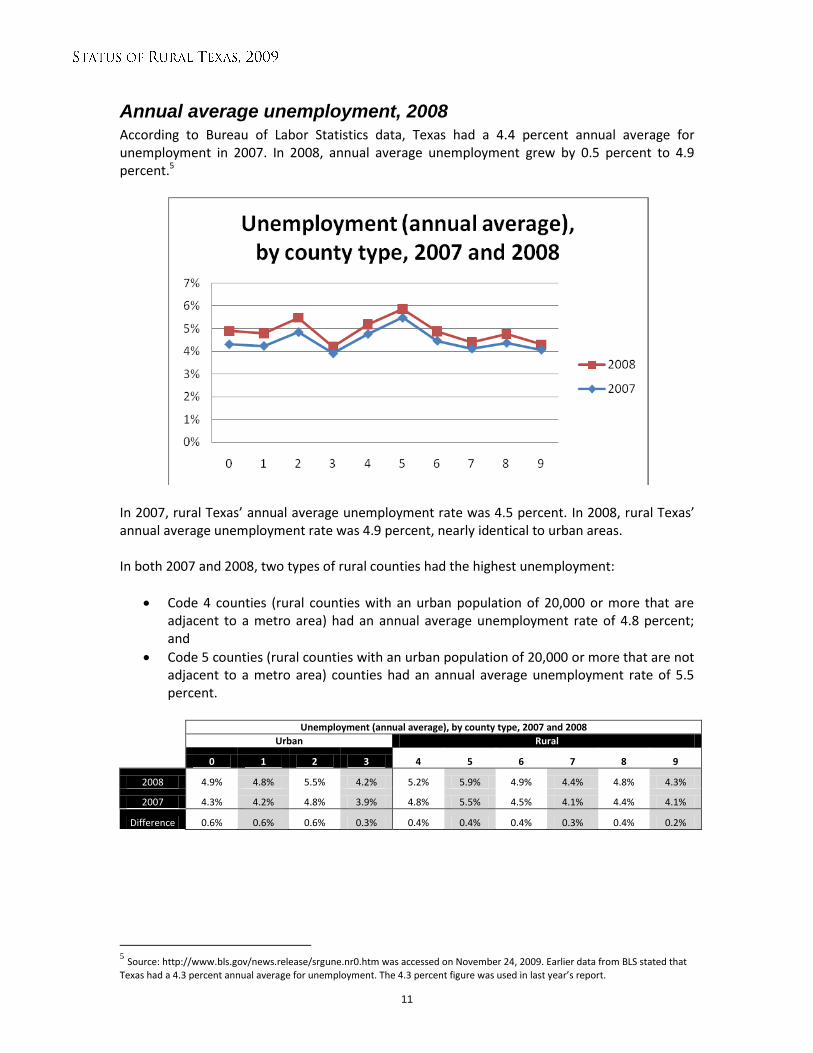
Annual average unemployment, 2008 According to Bureau of Labor Statistics data, Texas had a 4.4 percent annual average for unemployment in 2007. In 2008, annual average unemployment grew by 0.5 percent to 4.9 percent.5
In 2007, rural Texas’ annual average unemployment rate was 4.5 percent. In 2008, rural Texas’ annual average unemployment rate was 4.9 percent, nearly identical to urban areas. In both 2007 and 2008, two types of rural counties had the highest unemployment:
Code 4 counties (rural counties with an urban population of 20,000 or more that are adjacent to a metro area) had an annual average unemployment rate of 4.8 percent; and
Code 5 counties (rural counties with an urban population of 20,000 or more that are not adjacent to a metro area) counties had an annual average unemployment rate of 5.5 percent.
Unemployment (annual average), by county type, 2007 and 2008
Urban Rural
0 1 2 3 4 5 6 7 8 9
2008 4.9% 4.8% 5.5% 4.2% 5.2% 5.9% 4.9% 4.4% 4.8% 4.3%
2007 4.3% 4.2% 4.8% 3.9% 4.8% 5.5% 4.5% 4.1% 4.4% 4.1%
Difference 0.6% 0.6% 0.6% 0.3% 0.4% 0.4% 0.4% 0.3% 0.4% 0.2%
5 Source: http://www.bls.gov/news.release/srgune.nr0.htm was accessed on November 24, 2009. Earlier data from BLS stated that
Texas had a 4.3 percent annual average for unemployment. The 4.3 percent figure was used in last year’s report.
12
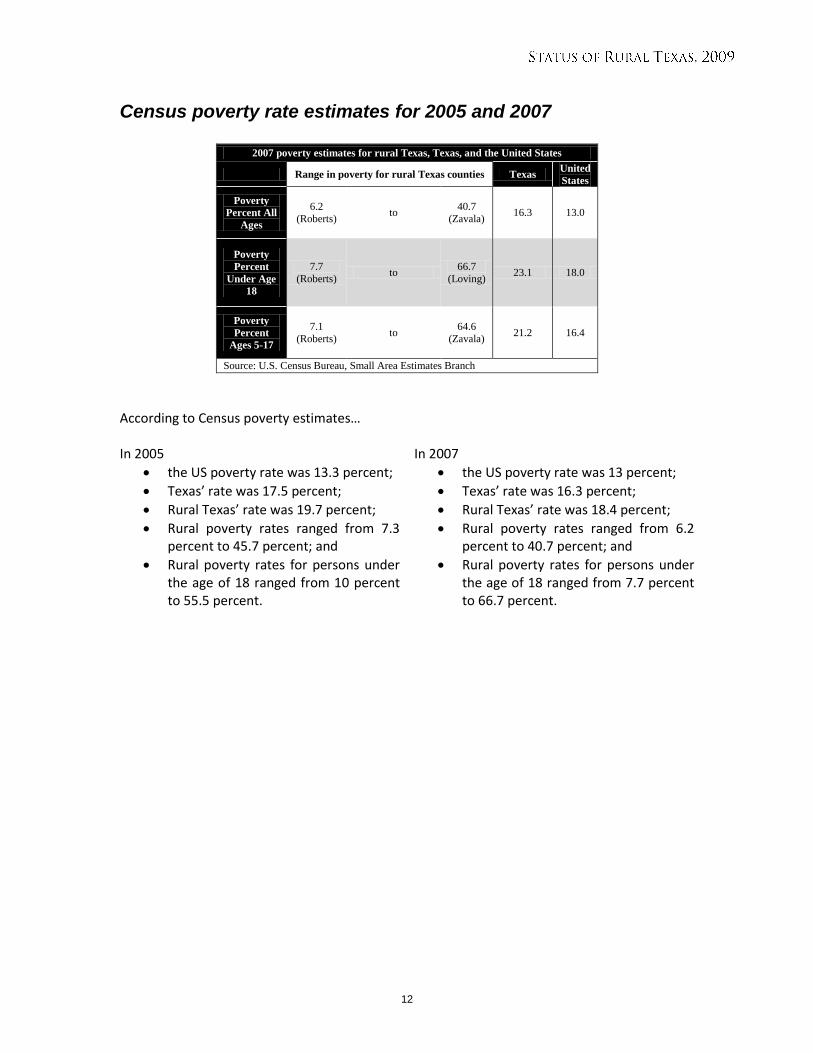
Census poverty rate estimates for 2005 and 2007
2007 poverty estimates for rural Texas, Texas, and the United States
Range in poverty for rural Texas counties Texas United
States
Poverty
Percent All
Ages
6.2
(Roberts) to
40.7
(Zavala) 16.3 13.0
Poverty
Percent
Under Age
18
7.7
(Roberts) to
66.7
(Loving) 23.1 18.0
Poverty
Percent
Ages 5-17
7.1
(Roberts) to
64.6
(Zavala) 21.2 16.4
Source: U.S. Census Bureau, Small Area Estimates Branch
According to Census poverty estimates… In 2005
In 2007
the US poverty rate was 13.3 percent; the US poverty rate was 13 percent;
Texas’ rate was 17.5 percent; Texas’ rate was 16.3 percent;
Rural Texas’ rate was 19.7 percent; Rural Texas’ rate was 18.4 percent;
Rural poverty rates ranged from 7.3 percent to 45.7 percent; and
Rural poverty rates ranged from 6.2 percent to 40.7 percent; and
Rural poverty rates for persons under the age of 18 ranged from 10 percent to 55.5 percent.
Rural poverty rates for persons under the age of 18 ranged from 7.7 percent to 66.7 percent.
13
Non-farm proprietors as a percentage of
total non-farm employment
0%
5%
10%
15%
20%
25%
30%
35%
40%
0 1 2 3 4 5 6 7 8 9
rural-urban continuum
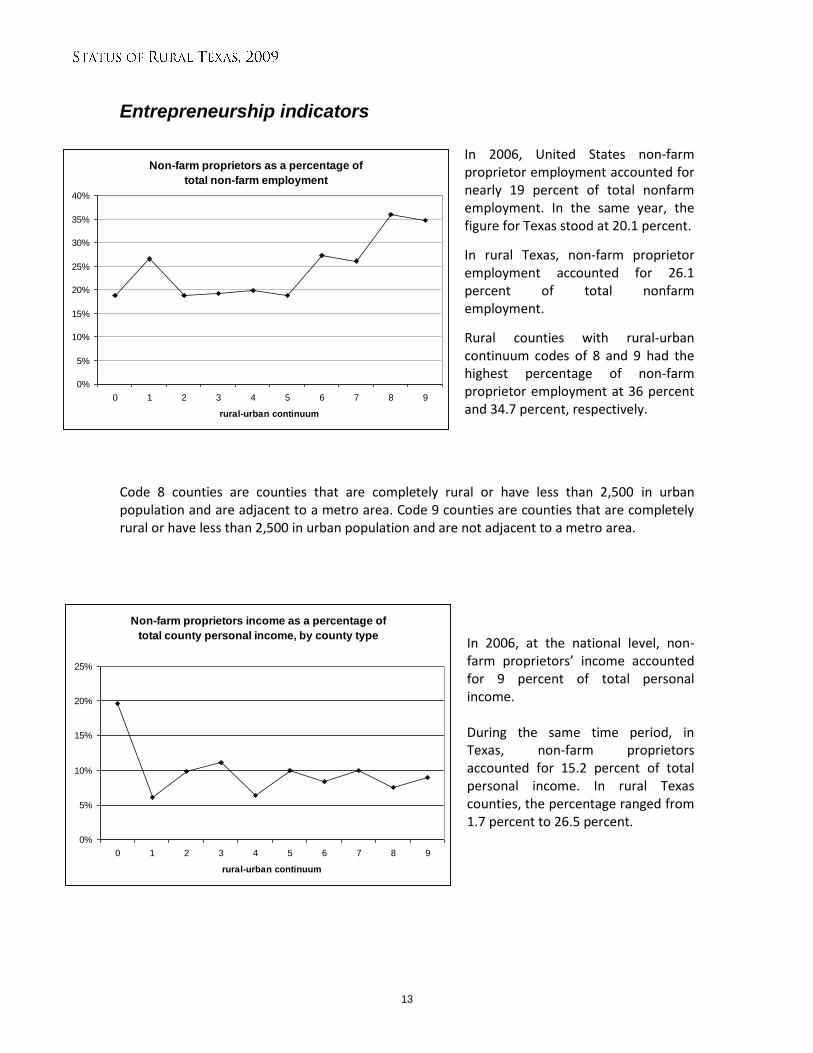
Entrepreneurship indicators
In 2006, United States non-farm proprietor employment accounted for nearly 19 percent of total nonfarm employment. In the same year, the figure for Texas stood at 20.1 percent.
In rural Texas, non-farm proprietor employment accounted for 26.1 percent of total nonfarm employment.
Rural counties with rural-urban continuum codes of 8 and 9 had the highest percentage of non-farm proprietor employment at 36 percent and 34.7 percent, respectively.
Code 8 counties are counties that are completely rural or have less than 2,500 in urban population and are adjacent to a metro area. Code 9 counties are counties that are completely rural or have less than 2,500 in urban population and are not adjacent to a metro area.
In 2006, at the national level, non-farm proprietors’ income accounted for 9 percent of total personal income. During the same time period, in Texas, non-farm proprietors accounted for 15.2 percent of total personal income. In rural Texas counties, the percentage ranged from 1.7 percent to 26.5 percent.
Non-farm proprietors income as a percentage of
total county personal income, by county type
0%
5%
10%
15%
20%
25%
0 1 2 3 4 5 6 7 8 9
rural-urban continuum
14
2006 income per non-farm proprietor, by county type
$-
$10,000
$20,000
$30,000
$40,000
$50,000
$60,000
$70,000
$80,000
0 1 2 3 4 5 6 7 8 9
rural-urban continuum
Income per non-farm proprietor, 2006 Texas U.S.
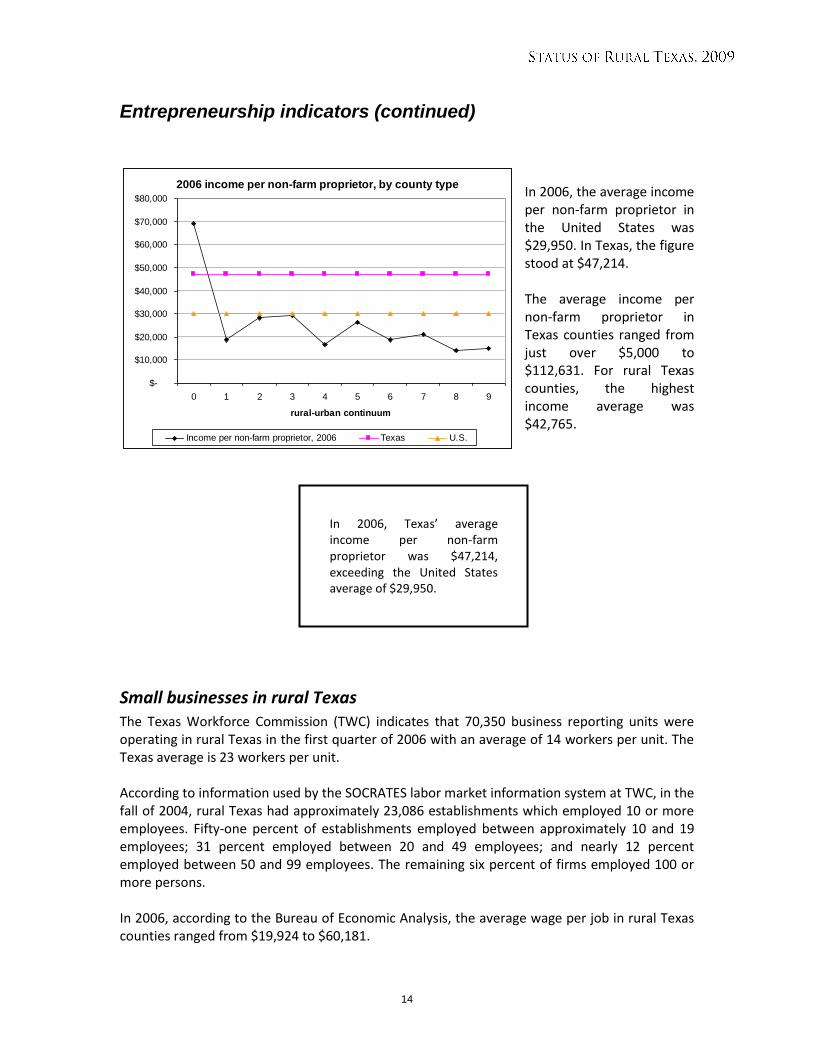
Entrepreneurship indicators (continued)
In 2006, the average income per non-farm proprietor in the United States was $29,950. In Texas, the figure stood at $47,214. The average income per non-farm proprietor in Texas counties ranged from just over $5,000 to $112,631. For rural Texas counties, the highest income average was $42,765.
Small businesses in rural Texas The Texas Workforce Commission (TWC) indicates that 70,350 business reporting units were operating in rural Texas in the first quarter of 2006 with an average of 14 workers per unit. The Texas average is 23 workers per unit. According to information used by the SOCRATES labor market information system at TWC, in the fall of 2004, rural Texas had approximately 23,086 establishments which employed 10 or more employees. Fifty-one percent of establishments employed between approximately 10 and 19 employees; 31 percent employed between 20 and 49 employees; and nearly 12 percent employed between 50 and 99 employees. The remaining six percent of firms employed 100 or more persons. In 2006, according to the Bureau of Economic Analysis, the average wage per job in rural Texas counties ranged from $19,924 to $60,181.
In 2006, Texas’ average income per non-farm proprietor was $47,214, exceeding the United States average of $29,950.
15
Farm income, 2007 and 2008
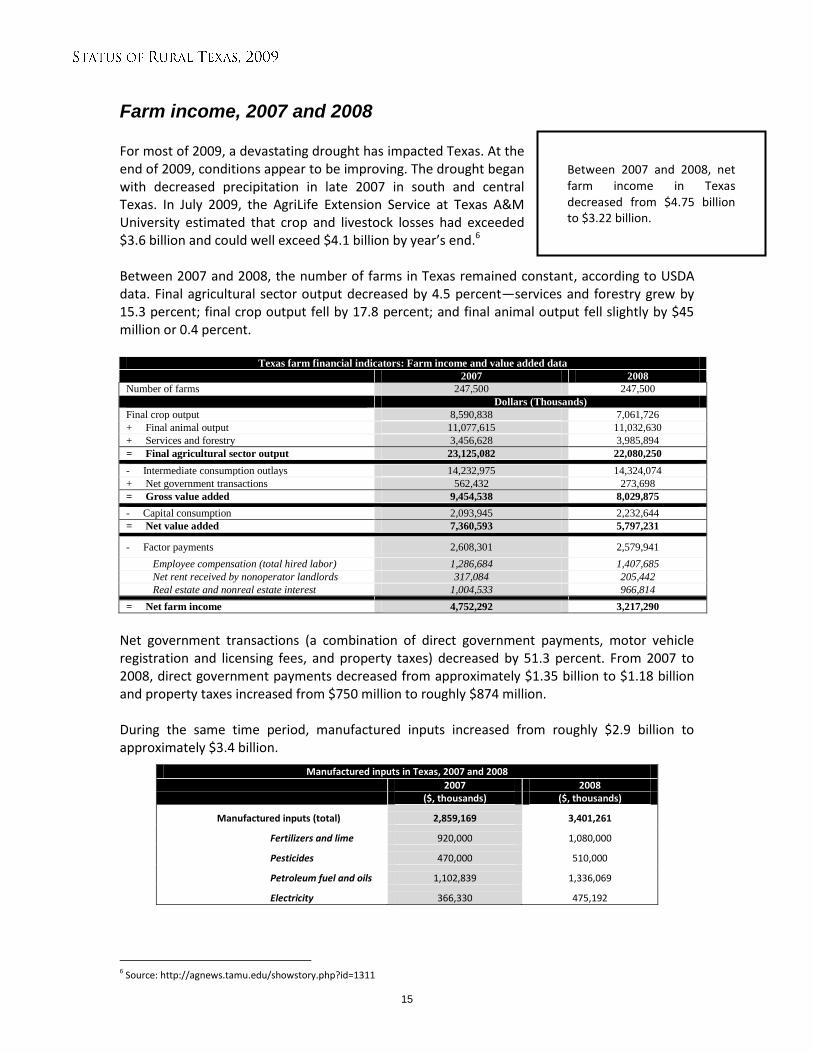
For most of 2009, a devastating drought has impacted Texas. At the end of 2009, conditions appear to be improving. The drought began with decreased precipitation in late 2007 in south and central Texas. In July 2009, the AgriLife Extension Service at Texas A&M University estimated that crop and livestock losses had exceeded $3.6 billion and could well exceed $4.1 billion by year’s end.6 Between 2007 and 2008, the number of farms in Texas remained constant, according to USDA data. Final agricultural sector output decreased by 4.5 percent—services and forestry grew by 15.3 percent; final crop output fell by 17.8 percent; and final animal output fell slightly by $45 million or 0.4 percent.
Texas farm financial indicators: Farm income and value added data
2007 2008
Number of farms 247,500 247,500
Dollars (Thousands)
Final crop output 8,590,838 7,061,726
+ Final animal output 11,077,615 11,032,630
+ Services and forestry 3,456,628 3,985,894
= Final agricultural sector output 23,125,082 22,080,250
- Intermediate consumption outlays 14,232,975 14,324,074
+ Net government transactions 562,432 273,698
= Gross value added 9,454,538 8,029,875
- Capital consumption 2,093,945 2,232,644
= Net value added 7,360,593 5,797,231
- Factor payments 2,608,301 2,579,941
Employee compensation (total hired labor) 1,286,684 1,407,685
Net rent received by nonoperator landlords 317,084 205,442
Real estate and nonreal estate interest 1,004,533 966,814
= Net farm income 4,752,292 3,217,290
Net government transactions (a combination of direct government payments, motor vehicle registration and licensing fees, and property taxes) decreased by 51.3 percent. From 2007 to 2008, direct government payments decreased from approximately $1.35 billion to $1.18 billion and property taxes increased from $750 million to roughly $874 million. During the same time period, manufactured inputs increased from roughly $2.9 billion to approximately $3.4 billion.
Manufactured inputs in Texas, 2007 and 2008
2007 2008
($, thousands) ($, thousands)
Manufactured inputs (total) 2,859,169 3,401,261
Fertilizers and lime 920,000 1,080,000
Pesticides 470,000 510,000
Petroleum fuel and oils 1,102,839 1,336,069
Electricity 366,330 475,192
6 Source: http://agnews.tamu.edu/showstory.php?id=1311
Between 2007 and 2008, net farm income in Texas decreased from $4.75 billion to $3.22 billion.
16
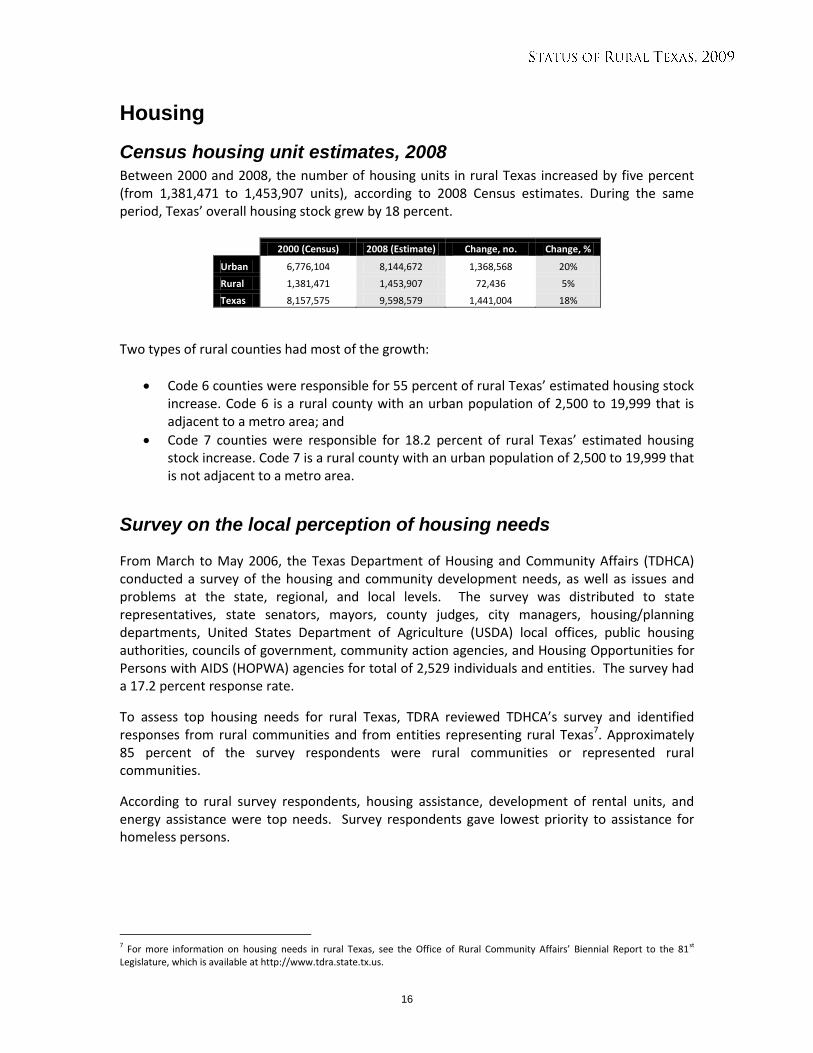
Housing
Census housing unit estimates, 2008 Between 2000 and 2008, the number of housing units in rural Texas increased by five percent (from 1,381,471 to 1,453,907 units), according to 2008 Census estimates. During the same period, Texas’ overall housing stock grew by 18 percent.
2000 (Census) 2008 (Estimate) Change, no. Change, %
Urban 6,776,104 8,144,672 1,368,568 20%
Rural 1,381,471 1,453,907 72,436 5%
Texas 8,157,575 9,598,579 1,441,004 18%
Two types of rural counties had most of the growth:
Code 6 counties were responsible for 55 percent of rural Texas’ estimated housing stock increase. Code 6 is a rural county with an urban population of 2,500 to 19,999 that is adjacent to a metro area; and
Code 7 counties were responsible for 18.2 percent of rural Texas’ estimated housing stock increase. Code 7 is a rural county with an urban population of 2,500 to 19,999 that is not adjacent to a metro area.
Survey on the local perception of housing needs
From March to May 2006, the Texas Department of Housing and Community Affairs (TDHCA) conducted a survey of the housing and community development needs, as well as issues and problems at the state, regional, and local levels. The survey was distributed to state representatives, state senators, mayors, county judges, city managers, housing/planning departments, United States Department of Agriculture (USDA) local offices, public housing authorities, councils of government, community action agencies, and Housing Opportunities for Persons with AIDS (HOPWA) agencies for total of 2,529 individuals and entities. The survey had a 17.2 percent response rate.
To assess top housing needs for rural Texas, TDRA reviewed TDHCA’s survey and identified responses from rural communities and from entities representing rural Texas7. Approximately 85 percent of the survey respondents were rural communities or represented rural communities.
According to rural survey respondents, housing assistance, development of rental units, and energy assistance were top needs. Survey respondents gave lowest priority to assistance for homeless persons.
7 For more information on housing needs in rural Texas, see the Office of Rural Community Affairs’ Biennial Report to the 81st Legislature, which is available at http://www.tdra.state.tx.us.
17
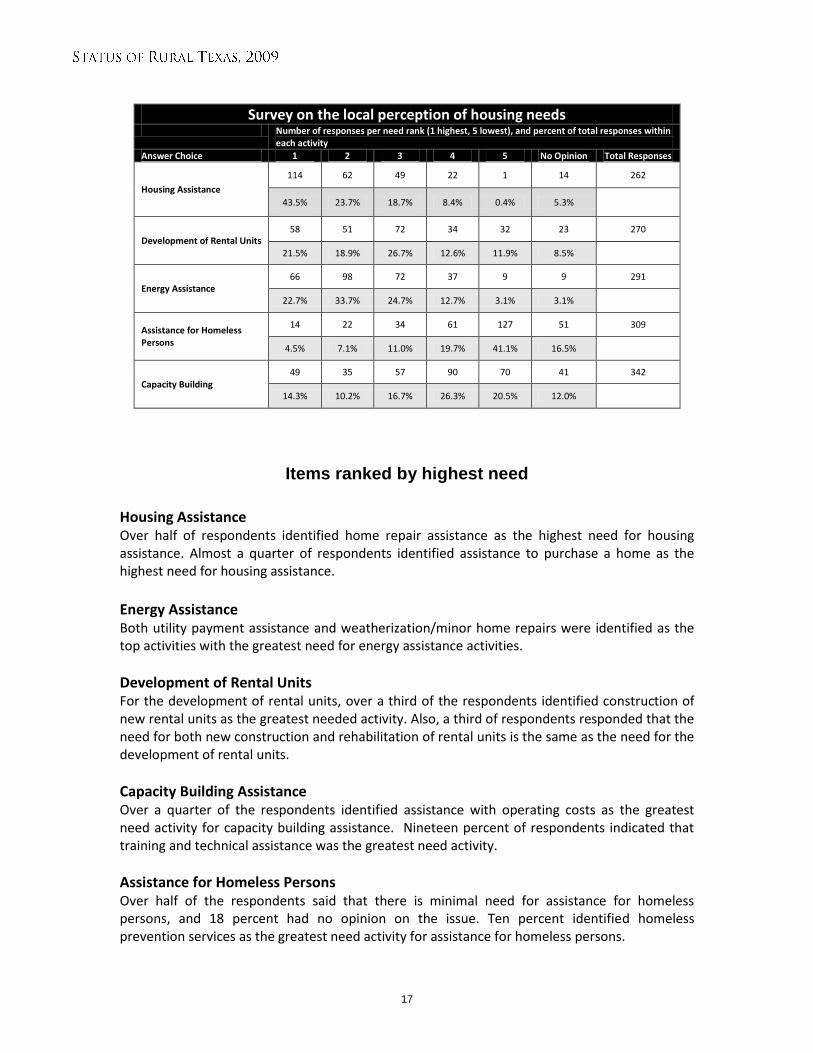
Survey on the local perception of housing needs Number of responses per need rank (1 highest, 5 lowest), and percent of total responses within
each activity
Answer Choice 1 2 3 4 5 No Opinion Total Responses
Housing Assistance
114 62 49 22 1 14 262
43.5% 23.7% 18.7% 8.4% 0.4% 5.3%
Development of Rental Units 58 51 72 34 32 23 270
21.5% 18.9% 26.7% 12.6% 11.9% 8.5%
Energy Assistance 66 98 72 37 9 9 291
22.7% 33.7% 24.7% 12.7% 3.1% 3.1%
Assistance for Homeless Persons
14 22 34 61 127 51 309
4.5% 7.1% 11.0% 19.7% 41.1% 16.5%
Capacity Building 49 35 57 90 70 41 342
14.3% 10.2% 16.7% 26.3% 20.5% 12.0%
Items ranked by highest need
Housing Assistance Over half of respondents identified home repair assistance as the highest need for housing assistance. Almost a quarter of respondents identified assistance to purchase a home as the highest need for housing assistance.
Energy Assistance Both utility payment assistance and weatherization/minor home repairs were identified as the top activities with the greatest need for energy assistance activities.
Development of Rental Units For the development of rental units, over a third of the respondents identified construction of new rental units as the greatest needed activity. Also, a third of respondents responded that the need for both new construction and rehabilitation of rental units is the same as the need for the development of rental units.
Capacity Building Assistance Over a quarter of the respondents identified assistance with operating costs as the greatest need activity for capacity building assistance. Nineteen percent of respondents indicated that training and technical assistance was the greatest need activity.
Assistance for Homeless Persons Over half of the respondents said that there is minimal need for assistance for homeless persons, and 18 percent had no opinion on the issue. Ten percent identified homeless prevention services as the greatest need activity for assistance for homeless persons.
18
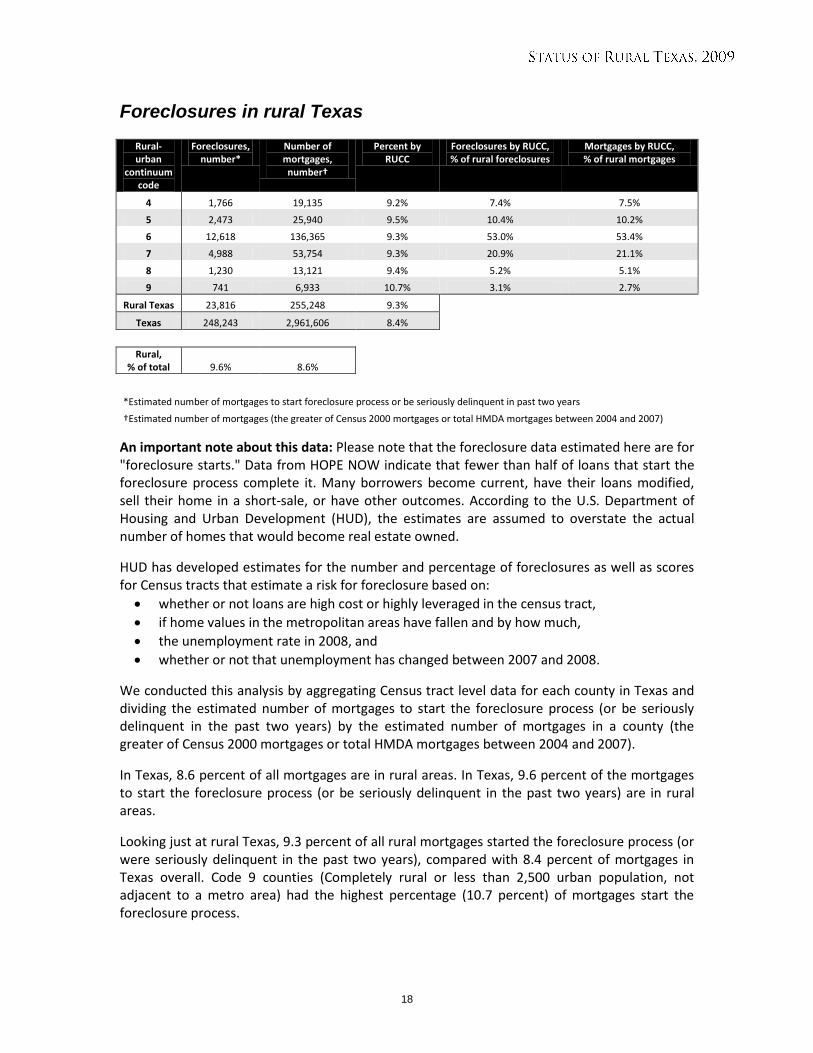
Foreclosures in rural Texas
Rural-urban
continuum code
Foreclosures, number*
Number of mortgages, number†
Percent by RUCC
Foreclosures by RUCC, % of rural foreclosures
Mortgages by RUCC, % of rural mortgages
4 1,766 19,135 9.2% 7.4% 7.5%
5 2,473 25,940 9.5% 10.4% 10.2%
6 12,618 136,365 9.3% 53.0% 53.4%
7 4,988 53,754 9.3% 20.9% 21.1%
8 1,230 13,121 9.4% 5.2% 5.1%
9 741 6,933 10.7% 3.1% 2.7%
Rural Texas 23,816 255,248 9.3%
Texas 248,243 2,961,606 8.4%
Rural, % of total 9.6% 8.6%
*Estimated number of mortgages to start foreclosure process or be seriously delinquent in past two years
†Estimated number of mortgages (the greater of Census 2000 mortgages or total HMDA mortgages between 2004 and 2007)
An important note about this data: Please note that the foreclosure data estimated here are for "foreclosure starts." Data from HOPE NOW indicate that fewer than half of loans that start the foreclosure process complete it. Many borrowers become current, have their loans modified, sell their home in a short-sale, or have other outcomes. According to the U.S. Department of Housing and Urban Development (HUD), the estimates are assumed to overstate the actual number of homes that would become real estate owned.
HUD has developed estimates for the number and percentage of foreclosures as well as scores for Census tracts that estimate a risk for foreclosure based on:
whether or not loans are high cost or highly leveraged in the census tract,
if home values in the metropolitan areas have fallen and by how much,
the unemployment rate in 2008, and
whether or not that unemployment has changed between 2007 and 2008.
We conducted this analysis by aggregating Census tract level data for each county in Texas and dividing the estimated number of mortgages to start the foreclosure process (or be seriously delinquent in the past two years) by the estimated number of mortgages in a county (the greater of Census 2000 mortgages or total HMDA mortgages between 2004 and 2007).
In Texas, 8.6 percent of all mortgages are in rural areas. In Texas, 9.6 percent of the mortgages to start the foreclosure process (or be seriously delinquent in the past two years) are in rural areas.
Looking just at rural Texas, 9.3 percent of all rural mortgages started the foreclosure process (or were seriously delinquent in the past two years), compared with 8.4 percent of mortgages in Texas overall. Code 9 counties (Completely rural or less than 2,500 urban population, not adjacent to a metro area) had the highest percentage (10.7 percent) of mortgages start the foreclosure process.
19
Male and female doctors, by county type
0%
10%
20%
30%
40%
50%
60%
70%
80%
90%
100%
0 1 2 3 4 5 6 7 8 9
Rural-urban continuum
Male
Female
Percent of Texas' physicians compared with percent of Texas'
population, by county type, 2008
0%
10%
20%
30%
40%
50%
60%
70%
0 1 2 3 4 5 6 7 8 9
Rural-urban continuum code
Percent of Texas' physicians, by county type Percent of Texas' population, by county type
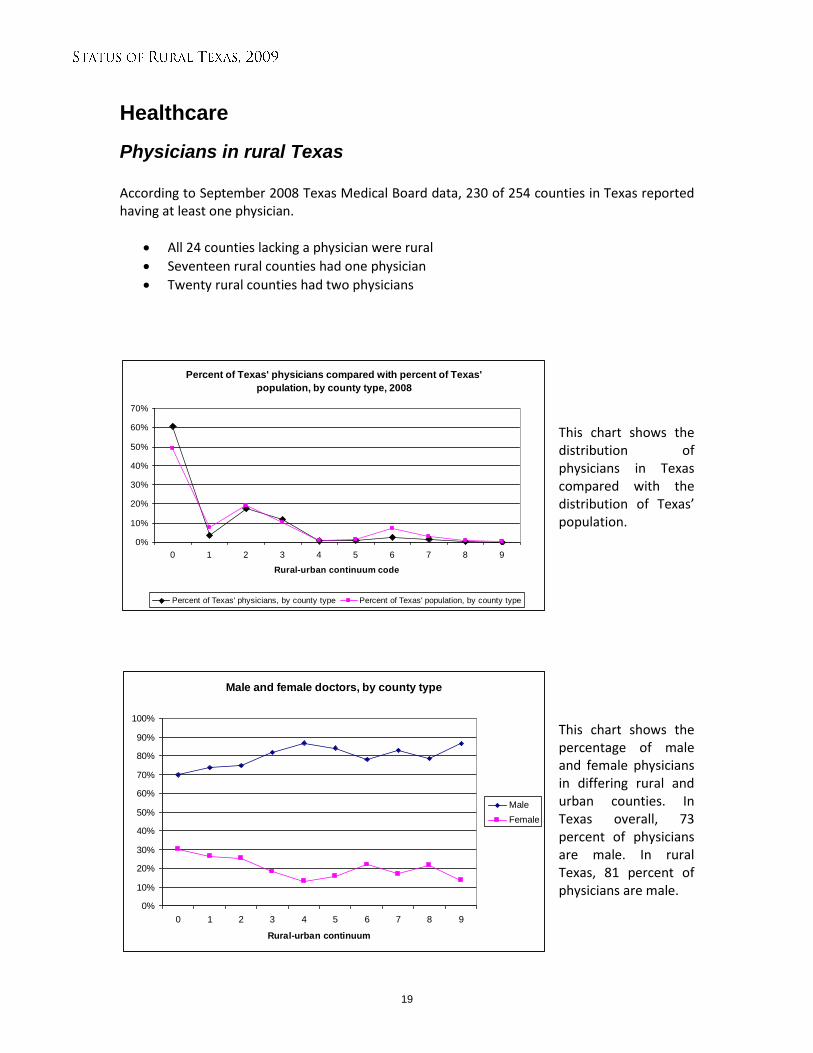
Healthcare
Physicians in rural Texas According to September 2008 Texas Medical Board data, 230 of 254 counties in Texas reported having at least one physician.
All 24 counties lacking a physician were rural
Seventeen rural counties had one physician
Twenty rural counties had two physicians
This chart shows the distribution of physicians in Texas compared with the distribution of Texas’ population.
This chart shows the percentage of male and female physicians in differing rural and urban counties. In Texas overall, 73 percent of physicians are male. In rural Texas, 81 percent of physicians are male.
20
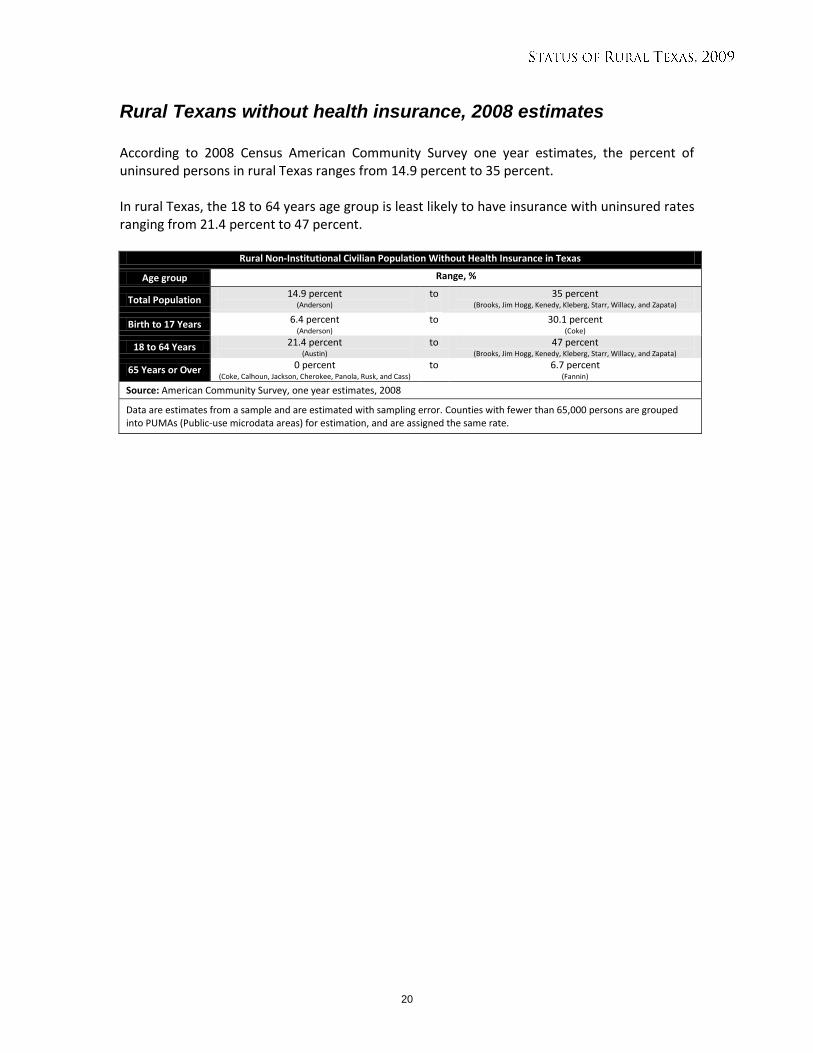
Rural Texans without health insurance, 2008 estimates According to 2008 Census American Community Survey one year estimates, the percent of uninsured persons in rural Texas ranges from 14.9 percent to 35 percent. In rural Texas, the 18 to 64 years age group is least likely to have insurance with uninsured rates ranging from 21.4 percent to 47 percent.
Rural Non-Institutional Civilian Population Without Health Insurance in Texas
Age group Range, %
Total Population 14.9 percent
(Anderson)
to
35 percent (Brooks, Jim Hogg, Kenedy, Kleberg, Starr, Willacy, and Zapata)
Birth to 17 Years 6.4 percent (Anderson)
to 30.1 percent (Coke)
18 to 64 Years 21.4 percent (Austin)
to 47 percent (Brooks, Jim Hogg, Kenedy, Kleberg, Starr, Willacy, and Zapata)
65 Years or Over 0 percent (Coke, Calhoun, Jackson, Cherokee, Panola, Rusk, and Cass)
to 6.7 percent (Fannin)
Source: American Community Survey, one year estimates, 2008
Data are estimates from a sample and are estimated with sampling error. Counties with fewer than 65,000 persons are grouped into PUMAs (Public-use microdata areas) for estimation, and are assigned the same rate.
21
Appendix A.
Rural Sustainability Project: Brainstorming Ideas
DISCUSSION The Office of Rural Community Affairs (ORCA), which is now the Texas Department of Rural Affairs (TDRA), hosted three one-hour brainstorming webinars on Tuesday, July 14 and Wednesday, July 15, 2009. Attendance exceeded eighty (80) log-on participants for the webinars but more were actually in attendance since several communities reported multiple participants in the room. Executive Director, Charlie Stone, Genora Young and Kim White welcomed participants, explained the purpose of the webinars and listed the four ORCA focus areas: community development, economic development, healthcare and housing. Participants with suggested ideas were asked to provide more detailed information in the form of “white papers” by Thursday, July 23, 2009. In addition to the webinars, the ORCA Think Tank met several times to brainstorm and develop internal recommendations for potential projects. The diversity and number of ideas from the brainstorming webinars are more than can be funded; however, there is the possibility of funding one or more projects in each of the focus areas as the Board chooses. Based upon information from communities, community development projects appear to follow existing CDBG guidelines so at this stage there may be no need for a new program to be developed. Economic development and healthcare proposed ideas appear to be best addressed by the development of a new ORCA program based upon funding awarded for job creation. The housing ideas would require revisions to CDBG guidelines and new programs developed to address the various proposed uses.
22
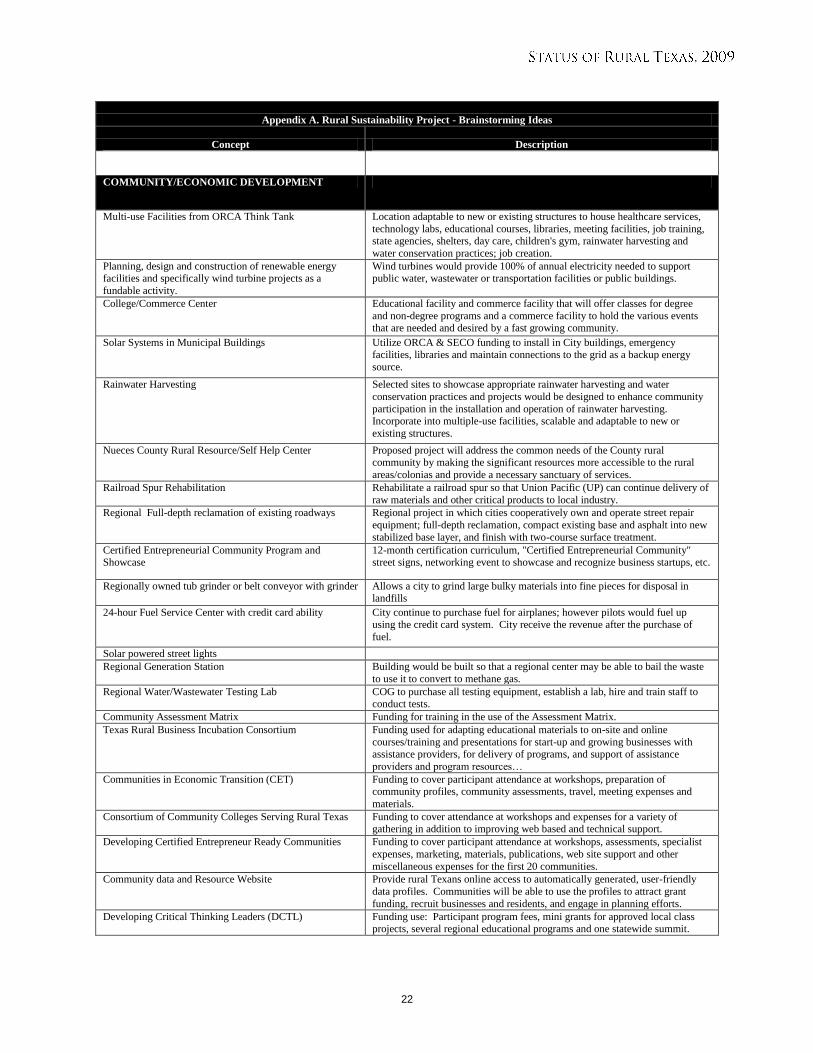
Appendix A. Rural Sustainability Project - Brainstorming Ideas
Concept Description
COMMUNITY/ECONOMIC DEVELOPMENT
Multi-use Facilities from ORCA Think Tank Location adaptable to new or existing structures to house healthcare services,
technology labs, educational courses, libraries, meeting facilities, job training, state agencies, shelters, day care, children's gym, rainwater harvesting and
water conservation practices; job creation.
Planning, design and construction of renewable energy facilities and specifically wind turbine projects as a
fundable activity.
Wind turbines would provide 100% of annual electricity needed to support public water, wastewater or transportation facilities or public buildings.
College/Commerce Center Educational facility and commerce facility that will offer classes for degree
and non-degree programs and a commerce facility to hold the various events that are needed and desired by a fast growing community.
Solar Systems in Municipal Buildings Utilize ORCA & SECO funding to install in City buildings, emergency facilities, libraries and maintain connections to the grid as a backup energy
source.
Rainwater Harvesting Selected sites to showcase appropriate rainwater harvesting and water
conservation practices and projects would be designed to enhance community
participation in the installation and operation of rainwater harvesting. Incorporate into multiple-use facilities, scalable and adaptable to new or
existing structures.
Nueces County Rural Resource/Self Help Center Proposed project will address the common needs of the County rural community by making the significant resources more accessible to the rural
areas/colonias and provide a necessary sanctuary of services.
Railroad Spur Rehabilitation Rehabilitate a railroad spur so that Union Pacific (UP) can continue delivery of
raw materials and other critical products to local industry.
Regional Full-depth reclamation of existing roadways Regional project in which cities cooperatively own and operate street repair
equipment; full-depth reclamation, compact existing base and asphalt into new
stabilized base layer, and finish with two-course surface treatment.
Certified Entrepreneurial Community Program and Showcase
12-month certification curriculum, "Certified Entrepreneurial Community" street signs, networking event to showcase and recognize business startups, etc.
Regionally owned tub grinder or belt conveyor with grinder Allows a city to grind large bulky materials into fine pieces for disposal in landfills
24-hour Fuel Service Center with credit card ability City continue to purchase fuel for airplanes; however pilots would fuel up using the credit card system. City receive the revenue after the purchase of
fuel.
Solar powered street lights Regional Generation Station Building would be built so that a regional center may be able to bail the waste
to use it to convert to methane gas.
Regional Water/Wastewater Testing Lab COG to purchase all testing equipment, establish a lab, hire and train staff to conduct tests.
Community Assessment Matrix Funding for training in the use of the Assessment Matrix.
Texas Rural Business Incubation Consortium Funding used for adapting educational materials to on-site and online
courses/training and presentations for start-up and growing businesses with assistance providers, for delivery of programs, and support of assistance
providers and program resources…
Communities in Economic Transition (CET) Funding to cover participant attendance at workshops, preparation of community profiles, community assessments, travel, meeting expenses and
materials.
Consortium of Community Colleges Serving Rural Texas Funding to cover attendance at workshops and expenses for a variety of gathering in addition to improving web based and technical support.
Developing Certified Entrepreneur Ready Communities Funding to cover participant attendance at workshops, assessments, specialist
expenses, marketing, materials, publications, web site support and other
miscellaneous expenses for the first 20 communities.
Community data and Resource Website Provide rural Texans online access to automatically generated, user-friendly
data profiles. Communities will be able to use the profiles to attract grant
funding, recruit businesses and residents, and engage in planning efforts.
Developing Critical Thinking Leaders (DCTL) Funding use: Participant program fees, mini grants for approved local class projects, several regional educational programs and one statewide summit.

23
Expert Assistance List of 25 needs/ideas, personal thoughts and Three tiered concept 1) State; 2)
Regional and 3) Local. Suggestions: Funds should be invested in three ways
1) "Expert" assistance and liaisons; 2) Grant Match Funds; and 3) a statewide
Revolving Loan Fund that will either 1) do direct loans or b) guarantee loans.
Motorcycle Service Technology (MST) Training Program Harley-Davidson Motor Company to implement, which would create positions
for technical instructors, and create opportunities for students enrolled in the
program.
"Overall List of Needs" - Participant volunteers to serve on
"any committee to assist in the continued development of
above programs."
Entry level housing for middle class for lease or purchase, main street
programs without a heavy drain on local financial commitments, affordable
child care centers for all shifts. Employment/housing needs ranging from oilfield/wind energy laborers, school teachers, correctional officers, health
care, College Professors and all supporting personnel for these occupations.
Telecom Mapping (received after deadline) Integrate the $8 million with federal stimulus money
HOUSING
Home Repair Revolving Loan Fund Provide an outlet for those with 50% Area Median Income (AMI), but still considered low-to-moderate income, a resource to fund minor home repairs.
Regional Housing Plan Use the existing TXCDBG distribution formula to distribute funds to the 24
Councils of Government for use with non-entitlement units of local government for single or multi-family housing projects. Tailored projects to
specific needs to "prevent/eliminate slums and/or blight.
Affordable, Energy Efficient Housing Program Two scenarios: One specific pilot project home or three pilot project homes in different climate areas of Texas - South Plains/Panhandle, East Texas and Gulf
Coast.
Multi-regional Affordable Housing Proposal Three components: Pilot projects based with qualifying Regional Council of
Governments, Texas Rural Foundation be the central agency, and establish a revolving fund.
HEALTHCARE
Regional Cancer Care Medical Center Raise $5 million to build a Regional Cancer Care Medical Center to provide radiation therapy for cancer patients and medical specialty services for patients
who now must travel long distances at great expense to receive care.
Home Visits Mobile Agent Mobile tool will communicate with a server and give the caregiver information to perform their task and receive data for reporting and further analysis to the
client, service provider, and government agencies.
Elder Care Clinic Build a facility to provide services that could/would be operated by a/or a collaboration of health care provider(s) (hospital, nursing home, FQHC, etc) to
address the delivery and maintenance of healthy lifestyles, in collaboration
with local health departments, churches, AARP clubs, and other local civic
organizations.
"Playstation 3" Telemedicine Allow telemedicine of a simple kind for the purpose of real time visits with the
use of DSL.
Mobile Unit to Deliver Health Care Services and Communication Disorders Diagnostics and Therapy
Funds to be used to purchase a motor home, complete customization required for the adapted use, and purchase equipment and supplies for the mobile clinic.
Rural Community Women, Infants, and Children Expedited
Exchange
Facilitate information delivery to the mothers on breastfeeding and healthy diet
prior to giving birth and accelerate demographic and health information
transmission to the WIC program to enable benefit pre-qualification.
Education Center Train staff, area for public education in CPR, safe-sitters, farm safety,
etc.,provide a covered area for annual health fairs and other community benefit
and wellness programs, alternative care site in multi-casualty situations.
Community Outreach, Resource and Education (CORE) Centers
Implement a comprehensive regional training, service and collaboration model in one isolated area of the state, through the creation of a single CORE Center
located on or adjacent to a rural hospital campus. Designed with local
community input, equipped with the latest video conferencing technology, broadband and remote diagnostic tools related to telemedicine practice, feature
an array of computer workstations, public access lab, ADA compliant, ample
meeting space.
Wound Clinic Facility includes 4 patient examination rooms, two hyperbaric chambers, with
liquid oxygen, added concrete pad
Repair Mortar Repair the mortar between the brick and winterize the window outside the
building - $250, 000
Parking Lot Construction and Paving and Rural Health Clinic Expansion
The number of parking spaces built during construction of new hospital are inadequate to meet our needs today. Estimate $100,000. Rural Health Clinic
Expansion - Expand to accommodate 6 providers, visiting physician
specialists, waiting room space and restrooms. Estimate $1.75M
Upgrade 40 year old hospital Renovation of the facility exterior and parking lot, entire 3rd floor (acute and
ICU patient floor)
Build larger clinic and Add a neuro-psych unit to the
hospital
Build a larger rural health clinic/add a neuro-psych unit to the hospital

24
Remodel Hospital Rooms Remodel hospital rooms for in-house CT scanner - Estimated $10K - $15K
Build Physical Medicine Facility Adjacent to Hospital Physical medicine facility adjacent to our hospital to better care for physical therapy, occupational therapy, and speech therapy patients.
Construct Permanent Storage Facility Construction of fixed storage facility for Emergency Management Mobile
Command Center
ER Renovation Project ER Renovation Project including the addition of CT
Outside Modernization and Improvement Project Outside modernization of 1952 hospital, improve energy efficiency
Clinic Expansion and Physical Therapy/Wellness Center
Remodel
Clinic Expansion needed to accommodate new (6th) physician, added space for
patient visits; estimated cost $400,000. Physical Therapy/Wellness Center
Remodel - Remodel a vacant building owned by the hospital and relocate physical therapy department and fitness center to accommodate the growing
number of patients. Additional goal to reduce obesity and improve health and
fitness for our population.
New Clinic Construction Estimated 5,000 sqf clinic would be main clinic for the community.
Construct Facility To House Multiple Health Related
Services
Facility where Meals on Wheels, local non-profit food pantry and several local
churches with food pantries can combine efforts; a site of consolidated point of social service access.
New Construction for Emergency Medical Service
(received after deadline)
Living quarters, Ambulance storage, maintenance facility and records storage.
Estimated costs $175,000 - $250,000
Coastal Providers' Safe Haven (received after deadline) facility reserved for agencies needing to evacuate personnel and equipment to a safe place; responders and and personnel to be housed for longer periods of
time. Examples are: Virtual City Halls, Court House, etc. Sleeping, eating and
hygiene facilities, Information acquisition and dissemination center, Communications hub for relocated officials/staff, Staging area for disaster
teams to return to their jurisdictions.
Geriatric Psychiatric Remodel (received after deadline) Existing hospital facility to include 10 bed Geriatric Psychiatric remodel;
Remodel 5 existing semi-private patient bedrooms and adjacent ancillary space into 10 bed unit with support functions. Estimated costs $250,000 - $300,000

Credits and acknowledgements
This report is written and researched by Eric Beverly and Kim White from the Texas Department of Rural Affairs, with the exception of
“Survey on the local perception of housing needs,” written by Alexandra Gamble in consultation with Brenda Hull (of the Texas Department of Housing and Community Affairs).
Maps by: Dave Darnell and Eric Beverly
Layout and design by: Eric Beverly
Special thanks to: SOCRATES, Texas Workforce Commission
Texas State Data Center and the Office of the State Demographer

Texas Department of Rural Affairs 1700 N. Congress, Suite 220, Austin, Texas 78701
P.O. Box 12877, Austin, Texas 78711 Phone: 512-936-6701 Toll Free: 800-544-2042 Fax: 512-936-6776
Web: www.tdra.state.tx.us
Field Offices
Bedias (Grimes County) 3512 E. Main Street
Bedias, TX 77831 Phone: 936-395-2456 Fax: 936-395-2457
Bishop (Nueces County)
115 South Ash Suite 106B Bishop, Texas 78343
Phone: 361-584-8928 Fax: 361-584-8949
Carrizo Springs (Dimmit County) 307 W. Nopal
Carrizo Springs, Texas 78834 Phone: 830-876-3082 Fax: 830-876-3096
Kountze (Hardin County)
Hardin County Courthouse Annex 440 Monroe (Highway 326)
Kountze, TX 77625 Phone: 512-914-3723 Fax: TBA
La Grange (Fayette County)
254 North Jefferson Street, Room 100 LaGrange, TX 78945
Phone: 979-968-6764 Fax: 979-968-8714
Levelland (Hockley County) 1611 FM 300
Levelland, TX 79336 Phone: 806-897-1113 Fax: 806-897-1113
Nacogdoches (Nacogdoches County) 202 East Pilar, Room 303 Nacogdoches, TX 75961
Phone: 936-560-4188 Fax: 936-560-9182
Rusk (Cherokee County) 165 East Sixth Street, Suite 301
Rusk, Texas 78785 Phone: 903-683-4251 Fax: 903-683-4261
Trent (Taylor County) 117 North Main Street
Trent, Texas 79561 Phone: 325-862-6000 Fax: 325-862-6003
Vernon (Wilbarger County)
Vernon College 4400 College Drive Vernon, TX 76384
Phone: 940-553-3556 Fax: 940-553-3560
Weslaco (Hidalgo County) Weslaco City Hall
255 South Kansas Ave., Suite 169 Weslaco, Texas 78596
Phone: 956-854-4053 Fax: 956-854-4044
Hard copies of this report are printed on 30% recycled paper. To obtain copies of this report, contact us or access the report online at www.orca.state.tx.us