small rural school district consolidation in texas
TRANSCRIPT
AD
MI
NI
ST
RA
TI
VE
I
SS
UE
S
JO
UR
NA
L:
E
DU
CA
TI
ON
,
PR
AC
TI
CE
,
AN
D
RE
SE
AR
CH
45 Cooley & FloydDOI: 10.5929/2013.3.1.2
VOLUME 3, ISSUE 1
b
SMALL RURAL SCHOOL DISTRICT CONSOLIDATION IN TEXAS: AN ANALYSIS OF ITS IMPACT ON COST AND STUDENT ACHIEVEMENT
Dwight A. Cooley, Ed.D.University of Texas at Arlington
Koy A. Floyd, Ph.D.Tarleton State University
Historically, the number of public school districts in the United States has decreased despite a dramatic increase in the number of students enrolled. Although public school district consolidation has impacted districts of all sizes, since the late 1930’s smaller rural districts facing dwindling community resources have merged or consolidated with each other, resulting in fewer school districts. When school districts consolidate, all aspects of the newly-formed district are affected. Each year, lawmakers and rural public school district officials face dwindling finances, and each year these decision makers question whether to consolidate to avoid fiscal perils. Proponents tout the benefits of fiscal efficiency, a broadened curriculum, and a projected increase in student achievement. Critics argue that the community suffers when the community school closes, students are burdened with new transportation issues, increased academic opportunities do not necessarily impute to greater student performance, and a host of tangible and non-tangible arguments are put forth.
This ex post facto quantitative study examines the fiscal efficiency of small, rural, consolidated school districts by comparing per-pupil expenditures with matched non-consolidated school districts in the state of Texas. The study also examines student achievement levels by comparing passing rate percentages on all Texas state assessment tests for 3rd, 5th, and 8th grade students attending these schools. For before and after consolidation comparison purposes, rural community public schools were matched according to Texas state designated “paired” protocol. Districts meeting Texas Education Agency (TEA) Snapshot criterion for Absorbing districts were matched with Joining districts. Expenditure and student achievement data for Absorbing and Joining districts were collected for the ten-year period from 1999 to 2009. A paired samples t-test measured differences in the district’s efficiency, and the Lawshe-Baker Normative t-test measured differences in student achievement. Four null hypotheses were examined with an a priori alpha level = 0.05. This study, when the data for the joining and absorbing districts was subjected to appropriate t-tests, supports other research that suggests per-pupil expenditures increased and student achievement decreased for the absorbing district.
Keywords: per-pupil expenditures, student achievement, joining and absorbing districts
INTRODUCTION
Public school district consolidation has been and continues to be a nation-wide phenomenon that elicits the attention of a multitude of shareholders, including parents, students, teachers, administrators, lawmakers, and a host of other groups. It has been a lightening rod for the nation for over eight decades.
The highest number of public school districts in the United States was, on record, for the school year 1929-30, with 117,108 (Digest of Education Statistics, 2011, Table 91). Today, the number of public school districts in the United
AD
MI
NI
ST
RA
TI
VE
I
SS
UE
S
JO
UR
NA
L:
E
DU
CA
TI
ON
,
PR
AC
TI
CE
,
AN
D
RE
SE
AR
CH
46Cooley & FloydDOI: 10.5929/2013.3.1.2
a
States has decreased by more than 79% to 13,629 (Table 91). For the same time frame, students enrolled in public elementary and secondary schools has increased by 190%, growing from 25,678,000 in the 1929-30 school year to 49,306,000 for the 2010 school year. For the fall 2012 school year, an estimated 49,642,000 students will have enrolled in public elementary and secondary schools (Table 3).
Setting a new record, in December of 2011, the Memphis City Schools and the Shelby County Schools were combined to become the largest school district consolidation in American history (New York Times, December 5, 2011). This mammoth effort followed an eight-decade trend to consolidate school districts throughout the nation, as pressures have increased to address issues of efficiency and, in recent years, for increased academic accountability.
Although the Memphis/Shelby County consolidation set a high mark for large district consolidation, the reduction in small rural school districts merging or consolidating with each other has been a more common cause for fewer school districts nationwide. Regardless of district size, when school districts consolidate, all aspects of the districts’ operations are impacted. Proponents tout the benefits of fiscal efficiency, a broadened curriculum, and an increase in student achievement. However, there is a growing body of literature questioning the assumptions inherent in the preceding statement. For example, two studies by Duncombe and Yinger (2003 and 2005) concluded that per-pupil expenditures reach cost-to-benefit maximums when the size of the district exceeds 1,500 students, and per-pupil spending begins to increase when district size reaches 6,000 students.
With a continual push for greater efficiencies because of economic and political pressures, school boards have opted to increase class size and to seek ways to increase overall numbers of students attending the district. Although both economic and political agendas have focused on cost variables for delivery of educational services, recent efforts have targeted academic achievement, particularly with respect to state performance accountability standards for students.
In Texas, there are 1,037 public school districts, with 877 identified as rural districts. These rural districts scattered across the state are responsible for providing a quality education for 474,000 students. In addition to the typically shared traits, including sparse population, low property wealth, small student populations, poor quality infrastructure, and geographic isolation (Mathis, 2006), small rural districts share other common challenges. These include a larger migrant student population, higher than state-wide averages for students with special education needs, students with limited English proficiency skills, higher than average teacher turnover rates, and a higher incidence of out-of-field teaching assignments (Jimerson, 2004).
This ex post facto, quantitative study examines the fiscal efficiency of small, rural consolidated school districts by comparing per-pupil expenditures with matched non-consolidated school districts in the state of Texas. Further, the study examines student academic achievement levels by comparing passing rate percentages on state assessment tests for small, rural, consolidated districts with matched non-consolidated small, rural school districts in Texas. For before and after consolidation comparison purposes, rural communities were matched according to a state designated “paired” protocol. Districts meeting Texas Education Agency (TEA) Snapshot criterion for Absorbing Districts were matched with Joining Districts. Then districts were paired with communities with similar profiles, as structured by the TEA Snapshot criterion.
Expenditure and student achievement data were collected before and after consolidation. A paired samples t-test measured differences in efficiency, and the Lawshe-Baker Nomograph t-test measured differences in student achievement. The t-tests reveal a statistical difference in expenditures and in student achievement. Per-pupil expenditures increased and student achievement decreased for the absorbing district.
THE TEXAS DILEMMA“There is substantial evidence…that the public education system has reached the point where continued improvement will not be possible absent significant change, whether that change takes the form of increased funding, improved efficiencies, or better methods of education.” These words, echoed from the Texas Supreme Court in the 1990 ruling, West Orange-Cove Consolidated, served as a warning that unless fundamental changes in public education took place, the state would fall short of fulfilling its obligation under the U. S. Constitution (Patterson, 2006).
AD
MI
NI
ST
RA
TI
VE
I
SS
UE
S
JO
UR
NA
L:
E
DU
CA
TI
ON
,
PR
AC
TI
CE
,
AN
D
RE
SE
AR
CH
47 Cooley & FloydDOI: 10.5929/2013.3.1.2
VOLUME 3, ISSUE 1
b
Currently, there is still the threat of Texas falling short of the obligation to provide public education to its student population that grows by about 80,000 students per year. Texas lawmakers, in the 82nd Legislative Session, passed a drastic reduction of $4 billion in the education budget in efforts to balance the State budget. This cut in funding has caused school districts to reduce personnel, eliminate programs, and is forcing school districts, both large and small, to make significant changes in how they will provide a quality education to their students.
During difficult economic times, school districts’ officials, specifically those located in rural communities have to make difficult decisions on how to change. These decisions include the reduction of costs. Faced with increased pressures to be accountable, especially through federal mandates and guidelines from the No Child Left Behind Act of 2001 (NCLB), small rural school districts are also challenged with the task of increasing their students’ achievement levels. To become more efficient and to increase student achievement, a number of these small rural school districts have chosen to consolidate or to merge with other small rural school districts to form one larger consolidated school district. “Bigger is better” is the assumption made about school district consolidation, also known as district reorganization (Bard, Gardener, & Wieland, 2006).
Most school district consolidations, including those in Texas districts, involve small rural school districts. In the past, however, published research about rural education issues has been limited, with relatively few scholars studying rural education issues found specifically in small rural settings. This research void is of particular concern because rural students represent a significant population that is, and has been, affected by local, state, and federal level educational decisions. With the passage of NCLB, the need to enhance the education of rural students has become even more evident. Moreover, small rural school districts require sound guidance on how to improve their students’ academic outcomes (Arnold, 2004). In his study, Arnold (2004) found that school finance is one area where rural education policymakers have sought assistance through research.
Historically, Texas lawmakers have sought strategies to adequately finance public schools. The option of school district consolidation is commonly under consideration. The data from small rural school districts included in this study are important to expand the understanding of school district consolidation in Texas, its failures and its successes, specifically since the districts chose to consolidate after the passage of NCLB. Studies of this nature could serve to inform and provide guidance to district leaders and to other key decision makers currently contemplating school district consolidation. However, is there clear evidence that small-school consolidation makes a real and measureable difference in the areas of financial savings and student achievement for the school districts involved? A review of the literature seems inconclusive. There is research dating from 1960 through 2004 that found no evidence that consolidation has reduced fiscal expenditures per pupil. Contrarily, Bard and his associates (2006) found that school consolidation was a worthy undertaking. Researchers have also conducted a number of studies revealing that small schools have “strengths of smallness” not evident in large schools, which does not support the assumption that the quality of school life is better when small rural schools consolidate with larger ones (Nachtigal, 1982).
Throughout the history of American education, school district consolidation has been a way to solve issues surrounding small rural schools. As early as the mid 1800’s, school district consolidation was thought to provide students a more thorough education. In their report, Herzog and Pittman (1995) wrote that school district consolidation had been the most frequently implemented educational trend of the 20th century as a means of both cutting costs and improving quality.
Advocates for consolidation touted efficiency and a lack of breadth in available course offerings (Brent, Sipple, Killeen, & Wischnowski, 2004). The U.S. Department of Education, in a 1930 pamphlet with information from 105 consolidated schools, detailed several reasons for considering consolidation, including increasing demand on the school, state encouragement, increasing opportunities for students, and efficiency (Self, 2001). School district consolidation could result in a greater specialization of teachers, and districts could save on administrative cost by merging (Self, 2001).
Conversely, further research has found the economic and educational advantages of some large schools and districts has been exaggerated by suggesting that money and resources could be saved by combining two smaller districts into a larger organizational unit. Further, district consolidation could prove to be cost-effective in some cases. However, no compelling evidence exists that school district consolidation is a cost-effective alternative to small rural schools (Brent, et al., 2004). A number of studies found that, in some cases, school district consolidation even worsened
AD
MI
NI
ST
RA
TI
VE
I
SS
UE
S
JO
UR
NA
L:
E
DU
CA
TI
ON
,
PR
AC
TI
CE
,
AN
D
RE
SE
AR
CH
48Cooley & FloydDOI: 10.5929/2013.3.1.2
a
financial, academic, and social outcomes (Patterson, 2006).
Regarding academics, a growing body of literature has reported that small, community schools had positive effects on educational achievement (Mathis, 2006). Students in some rural areas were achieving at high levels despite the challenges faced by rural communities. A number of research studies have indicated that students in small schools and districts appear to have better achievement, particularly students from less affluent communities. On the other hand, in a number of states where consolidation has occurred, standardized test scores were among the lowest in the nation (Silverman, 2005). Studies have shown that larger school districts were found to have more bureaucracy, lower standardized test scores, higher dropout rates, and more problems with violence and drug abuse.
“Critics of school consolidation argue that many places that once provided school no longer do; for they have been improved out of existence” (DeYoung & Howley, 1992). School district consolidation could also create higher transportation costs. Students attending larger consolidated schools received less attention, endured long bus rides, and had fewer chances to participate in extra-curricular activities.
The literature does not provide a clear and distinct set of conclusions about the functions and dysfunctions of consolidation of small rural school districts. It remains unclear whether consolidation improves efficiency and student learning. Educational policy makers have relied solely on the “economies of scale” model from the Industrial Age when deciding whether to consolidate. Their primary goals were to increase fiscal efficiency. Despite uncertainty over the impact of consolidation and growing evidence in support of small schools and districts, due to declining enrollment and budget constraints, small rural schools in Texas constantly face the possibility of consolidation.
The purpose of this study was twofold: to determine if small school districts that made the decision to consolidate actually saved money, and whether these districts had an increase in student achievement. Comparisons were conducted with non-consolidated districts similar in size, classification, property wealth, and tax rate. Before and after consolidation comparisons among consolidated school districts were conducted.
This study used a select sample of small, rural Texas school districts to analyze cost efficiency and to examine the impact on student achievement related to consolidation. The basic research questions were as follows: (1) How does the amount of money spent per pupil in consolidated school districts compare with the amount spent in non-consolidated school districts with similar characteristics? (2) How do these expenditures after consolidation compare with the expenditures before consolidation? (3) How do passing rate percentages on state assessment tests compare between consolidated and matching non-consolidated school districts? (4) How do these indicators of student achievement compare in consolidated school districts before and after consolidation?
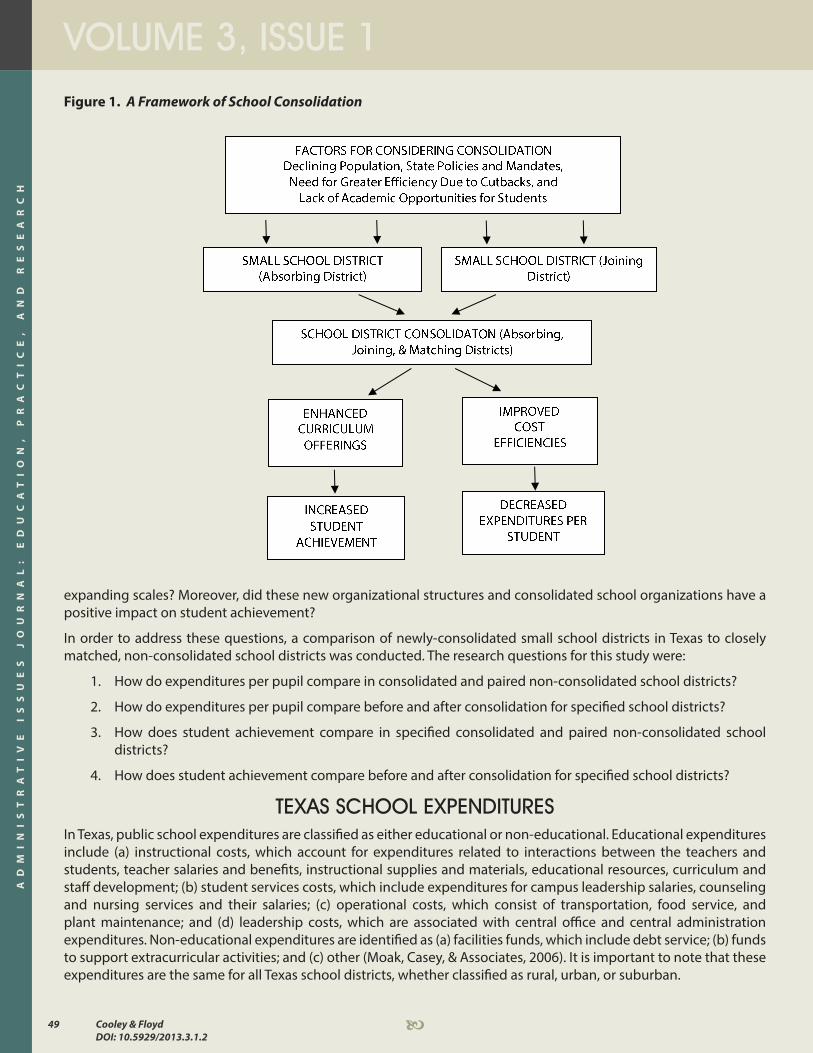
THEORETICAL FRAMEWORKDeclining community and student population, state policies and mandates that force small rural school districts to consolidate, the need for greater efficiency due to budgetary cutbacks, and the lack of academic opportunities for students are contributing factors that causes small rural school districts to consider consolidation. Proponents of consolidation argue that the newly combined larger district has the potential for offering a more advanced and diverse curriculum than either of the two pre-consolidation school districts can deliver. The new, larger school district will be able to offer broader opportunities for learning and will be able to increase the number of school activities for students. Such results as increased passing rates on the Texas Assessment of Academic Skills (TAAS) and the Texas Assessment of Knowledge and Skills (TAKS) would validate claims that consolidation leads to increased learning and greater student achievement. (See Figure 1)
RESEARCH QUESTIONSThis study addressed two issues related to the analysis of post-consolidation of small school districts in Texas. One issue examined whether the consolidation of school districts led to increased cost efficiencies. The other issue focused on whether the consolidation of school districts resulted in increased student achievement. Stated differently, were these newly- consolidated small Texas school districts able to save money, lower the cost of delivery of educational programs, consolidate personnel, and reduce a variety of costs through capturing the benefits of the economies of
AD
MI
NI
ST
RA
TI
VE
I
SS
UE
S
JO
UR
NA
L:
E
DU
CA
TI
ON
,
PR
AC
TI
CE
,
AN
D
RE
SE
AR
CH
49 Cooley & FloydDOI: 10.5929/2013.3.1.2
VOLUME 3, ISSUE 1
b
Figure 1. A Framework of School Consolidation
expanding scales? Moreover, did these new organizational structures and consolidated school organizations have a positive impact on student achievement?
In order to address these questions, a comparison of newly-consolidated small school districts in Texas to closely matched, non-consolidated school districts was conducted. The research questions for this study were:
1. How do expenditures per pupil compare in consolidated and paired non-consolidated school districts?
2. How do expenditures per pupil compare before and after consolidation for specified school districts?
3. How does student achievement compare in specified consolidated and paired non-consolidated school districts?
4. How does student achievement compare before and after consolidation for specified school districts?
TEXAS SCHOOL EXPENDITURESIn Texas, public school expenditures are classified as either educational or non-educational. Educational expenditures include (a) instructional costs, which account for expenditures related to interactions between the teachers and students, teacher salaries and benefits, instructional supplies and materials, educational resources, curriculum and staff development; (b) student services costs, which include expenditures for campus leadership salaries, counseling and nursing services and their salaries; (c) operational costs, which consist of transportation, food service, and plant maintenance; and (d) leadership costs, which are associated with central office and central administration expenditures. Non-educational expenditures are identified as (a) facilities funds, which include debt service; (b) funds to support extracurricular activities; and (c) other (Moak, Casey, & Associates, 2006). It is important to note that these expenditures are the same for all Texas school districts, whether classified as rural, urban, or suburban.
AD
MI
NI
ST
RA
TI
VE
I
SS
UE
S
JO
UR
NA
L:
E
DU
CA
TI
ON
,
PR
AC
TI
CE
,
AN
D
RE
SE
AR
CH
50Cooley & FloydDOI: 10.5929/2013.3.1.2
a
When The Elementary and Secondary Education Act (ESEA) was reauthorized as NCLB, its primary function became to close the achievement gap among student groups while simultaneously raising the achievement level for all students. This function would be accomplished through greater accountability, increased flexibility, and parent choice. NCLB imposed new requirements and stiff sanctions for states, districts, and schools that failed to meet required goals. However, in exchange, NCLB gave school districts greater flexibility in using federal funds to meet the new requirements. Key components affecting Texas school districts dealt with assessments, accountability, and teacher qualifications.
• Assessments: NCLB required states to develop and implement achievement tests in reading, writing, mathematics, science, and social studies aligned with state academic and achievement standards. Students were tested annually in grades 3-8 and in high school.
• Accountability: NCLB required states to develop and implement a single, statewide accountability system that measured progress in test results from year to year.
• Teacher Qualifications: NCLB required that teachers in all core subject areas and paraprofessionals met their definition of being “highly qualified” (House Research Organization, 2004).
THE RURAL SITUATIONMore than 45% of school districts in the United States are located in rural areas, representing over 11.4 million students. In Texas, nearly half a million (474,000) students attend school in rural communities. With approximately 200 counties and 877 of the 1,037 Texas school districts designated as being rural, approximately 24% of students in Texas public schools are enrolled in districts with fewer than 4,999 students. These statistics conclude that approximately 76% of Texas students are enrolled in 160 school districts, with a total of more than 5,000 students (Patterson, 2006). Since the rural population represents less than one-fourth of the state’s total student population, rural students are often disregarded and overlooked in educational policy discussions (Jimerson, 2004).
NCLB posed another set of unique challenges to small, rural, and isolated schools. Provisions that were particularly challenging to Texas rural districts were provisions regarding highly qualified teachers and paraprofessionals and annual yearly progress (Ashford, 2002). A “Braintrust” consisting of members of the Council of Chief State School Officers identified three challenges facing rural and isolated schools in implementing NCLB: annual yearly progress, highly qualified teachers, and the implementation of consequences, specifically public school choice and supplemental educational services (Peabody, 2003).
EFFECT ON STUDENT ACHIEVEMENTResearchers have offered no convincing evidence that students from small rural schools receive a less effective educational program than children in larger schools. Several studies offered evidence that favored small rural schools over larger consolidated systems (Brent, et al., 2004). A preponderance of data showed that small schools provide greater educational benefit than larger schools (Patterson, 2006). Researchers also found small rural schools equal to, or superior to, larger schools on most student behavior measures. Truancy rates, classroom disruption, vandalism, theft, substance abuse, and gang participation were lower in small rural schools (Cushman, 2000). Several other studies confirmed that large schools and districts have more bureaucratic and administrative costs, lower attendance, lower grade point averages, higher dropout rates, and more problems with violence, security and drug abuse (Patterson, 2006). Conversely, Nelson (1985) identified several liabilities to consolidation, including more red tape, teacher disconnectedness, increased discipline problems, and decreased parental involvement.
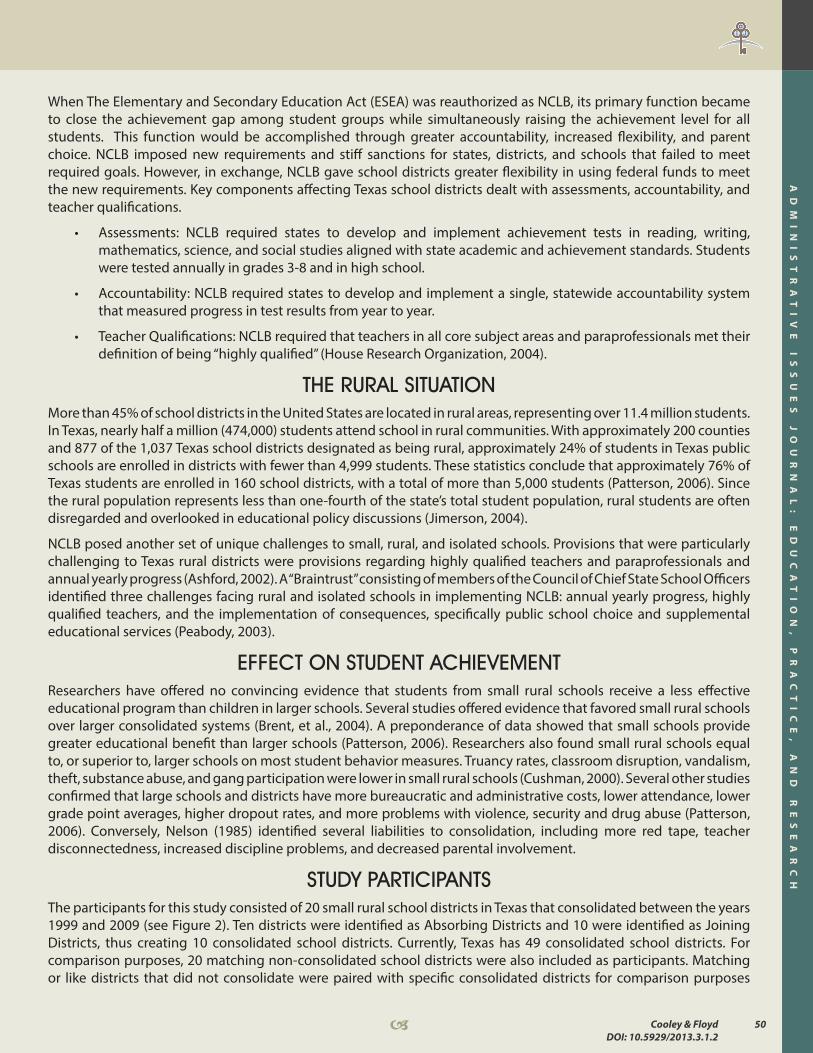
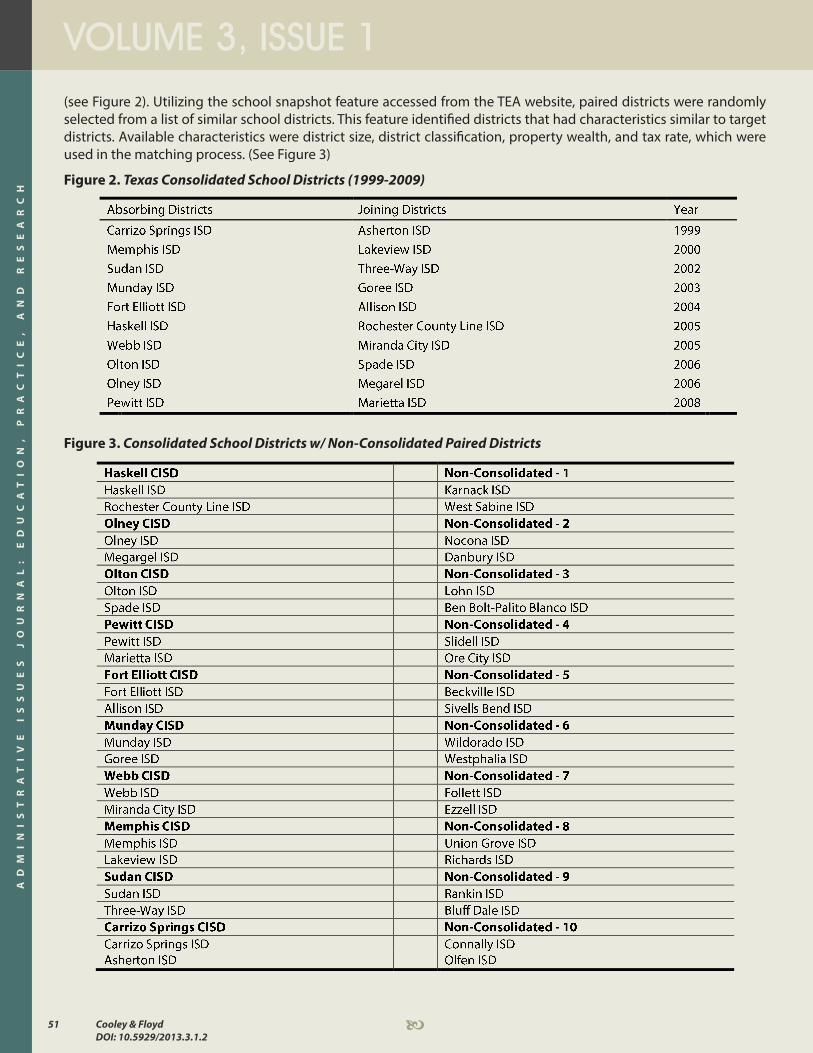
STUDY PARTICIPANTSThe participants for this study consisted of 20 small rural school districts in Texas that consolidated between the years 1999 and 2009 (see Figure 2). Ten districts were identified as Absorbing Districts and 10 were identified as Joining Districts, thus creating 10 consolidated school districts. Currently, Texas has 49 consolidated school districts. For comparison purposes, 20 matching non-consolidated school districts were also included as participants. Matching or like districts that did not consolidate were paired with specific consolidated districts for comparison purposes
AD
MI
NI
ST
RA
TI
VE
I
SS
UE
S
JO
UR
NA
L:
E
DU
CA
TI
ON
,
PR
AC
TI
CE
,
AN
D
RE
SE
AR
CH
51 Cooley & FloydDOI: 10.5929/2013.3.1.2
VOLUME 3, ISSUE 1
b
(see Figure 2). Utilizing the school snapshot feature accessed from the TEA website, paired districts were randomly selected from a list of similar school districts. This feature identified districts that had characteristics similar to target districts. Available characteristics were district size, district classification, property wealth, and tax rate, which were used in the matching process. (See Figure 3)
Figure 2. Texas Consolidated School Districts (1999-2009)
Figure 3. Consolidated School Districts w/ Non-Consolidated Paired Districts
AD
MI
NI
ST
RA
TI
VE
I
SS
UE
S
JO
UR
NA
L:
E
DU
CA
TI
ON
,
PR
AC
TI
CE
,
AN
D
RE
SE
AR
CH
52Cooley & FloydDOI: 10.5929/2013.3.1.2
a
DATA COLLECTION PROCEDURESTo analyze school district efficiency and student achievement, it was necessary to collect and interpret data from before and after consolidation. The Public Education Information Management System (PEIMS) contains all data requested and received by the Texas Education Agency (TEA) about public education. PEIMS contains only the data necessary for the legislature and TEA to perform their function of overseeing public education. PEIMS data includes student demographics and academic performance, personnel, financial, and organizational information.
The Academic Excellence Indicator System (AEIS) includes a wide range of information on the performance of students in each school and district in Texas every year. This information is put into the annual AEIS reports, which are available each year in the fall. For the purpose of this study, the AEIS will provide
• Results of Texas Assessment of Academic Skills (TAAS)
• Results of Texas Assessment of Knowledge and Skills (TAKS)
• Actual School District Financial Data
• Student Enrollment Data
The Snapshot is a TEA product that provides general information about the characteristics of public school districts in Texas. Topics include a variety of demographic information about students and staff, as well as financial information about school district budgets, property values, and state financial assistance. School district expenditures, as well as student performance data, are also included. The districts’ expenditures per pupil were used to measure school district efficiency. Overall, passing rate percentages on the state assessment were indicators of student achievement.
Expenditures and student performance data were collected for the 10 absorbing school districts, as well as for the 10 districts that merged with them, beginning three years prior to their consolidation through 2009. Expenditures and achievement data for the 20 matching non-consolidated paired-districts were also collected. The numerical data for each variable was represented by the mean of the paired-districts for that variable. For example, District A and District B had expenditures per pupil of $7,000 and $9,000 respectively. The mean of $8,000 represented expenditures per pupil for these non-consolidated paired-districts. Numerical data from the non-consolidated paired-districts were collected and analyzed for the same time as the consolidated school districts.
RESEARCH DESIGN QUESTIONSResearch Question 1How do expenditures per pupil compare in consolidated and paired non-consolidated school districts? The dependent variable was the district expenditures per pupil beginning three years prior to their consolidation through 2009. The independent variable was the type of district, consolidated or non-consolidated. Using SPSS, the paired-samples t-test was utilized to make comparisons and test for significant differences in the group means.
Research Question 2How do expenditures per pupil compare before and after consolidation in specified school districts? The dependent variable was the post-consolidation expenditures per pupil beginning three years prior to their consolidation until 2009. The independent variable was the pre-consolidation expenditures per pupil. The paired-samples t-test using SPSS was utilized to make comparisons and test for significant differences in the group means.
Research Question 3How does student achievement compare in consolidated and paired non-consolidated school districts? Dependent variables were the passing rate percentages beginning three years prior to their consolidation through 2009. The independent variable was the type of district, consolidated or non-consolidated. The Lawshe-Baker Nomograph t-test was used to test the significance of the differences between the two percentages.
AD
MI
NI
ST
RA
TI
VE
I
SS
UE
S
JO
UR
NA
L:
E
DU
CA
TI
ON
,
PR
AC
TI
CE
,
AN
D
RE
SE
AR
CH
53 Cooley & FloydDOI: 10.5929/2013.3.1.2
VOLUME 3, ISSUE 1
b
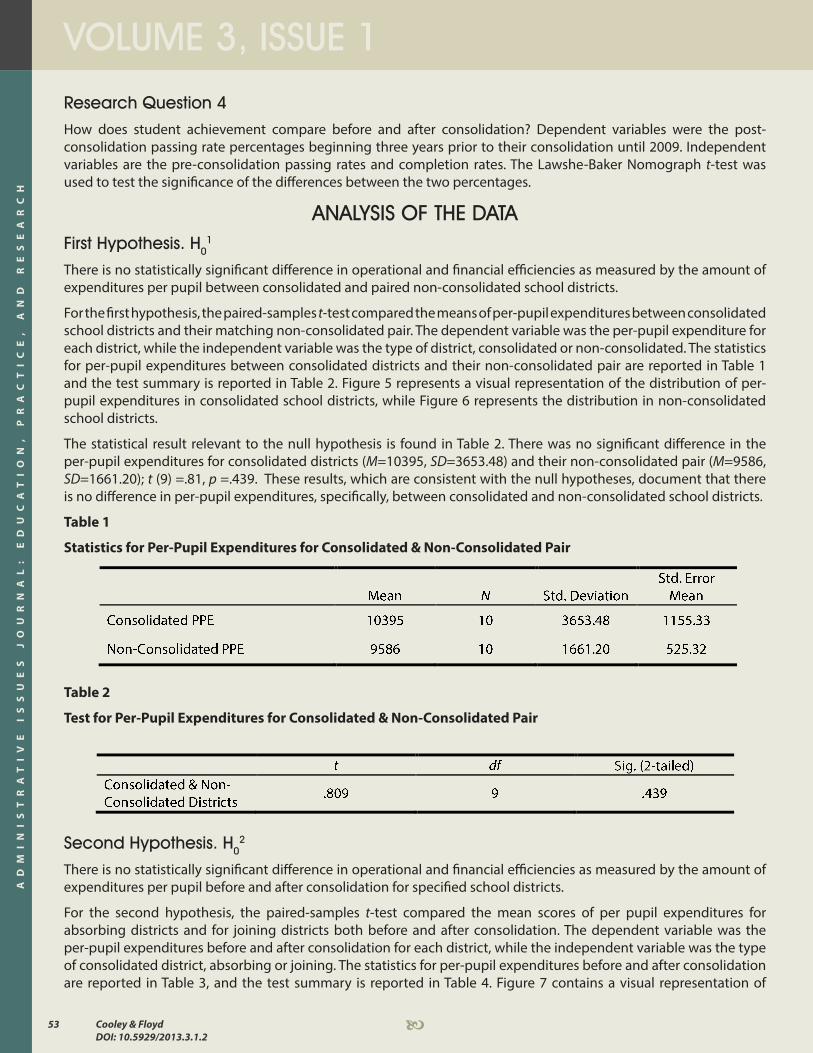
Research Question 4How does student achievement compare before and after consolidation? Dependent variables were the post-consolidation passing rate percentages beginning three years prior to their consolidation until 2009. Independent variables are the pre-consolidation passing rates and completion rates. The Lawshe-Baker Nomograph t-test was used to test the significance of the differences between the two percentages.
ANALYSIS OF THE DATAFirst Hypothesis. H0
1
There is no statistically significant difference in operational and financial efficiencies as measured by the amount of expenditures per pupil between consolidated and paired non-consolidated school districts.
For the first hypothesis, the paired-samples t-test compared the means of per-pupil expenditures between consolidated school districts and their matching non-consolidated pair. The dependent variable was the per-pupil expenditure for each district, while the independent variable was the type of district, consolidated or non-consolidated. The statistics for per-pupil expenditures between consolidated districts and their non-consolidated pair are reported in Table 1 and the test summary is reported in Table 2. Figure 5 represents a visual representation of the distribution of per-pupil expenditures in consolidated school districts, while Figure 6 represents the distribution in non-consolidated school districts.
The statistical result relevant to the null hypothesis is found in Table 2. There was no significant difference in the per-pupil expenditures for consolidated districts (M=10395, SD=3653.48) and their non-consolidated pair (M=9586, SD=1661.20); t (9) =.81, p =.439. These results, which are consistent with the null hypotheses, document that there is no difference in per-pupil expenditures, specifically, between consolidated and non-consolidated school districts.
Table 1
Statistics for Per-Pupil Expenditures for Consolidated & Non-Consolidated Pair
Table 2
Test for Per-Pupil Expenditures for Consolidated & Non-Consolidated Pair
Second Hypothesis. H02
There is no statistically significant difference in operational and financial efficiencies as measured by the amount of expenditures per pupil before and after consolidation for specified school districts.
For the second hypothesis, the paired-samples t-test compared the mean scores of per pupil expenditures for absorbing districts and for joining districts both before and after consolidation. The dependent variable was the per-pupil expenditures before and after consolidation for each district, while the independent variable was the type of consolidated district, absorbing or joining. The statistics for per-pupil expenditures before and after consolidation are reported in Table 3, and the test summary is reported in Table 4. Figure 7 contains a visual representation of
AD
MI
NI
ST
RA
TI
VE
I
SS
UE
S
JO
UR
NA
L:
E
DU
CA
TI
ON
,
PR
AC
TI
CE
,
AN
D
RE
SE
AR
CH
54Cooley & FloydDOI: 10.5929/2013.3.1.2
a
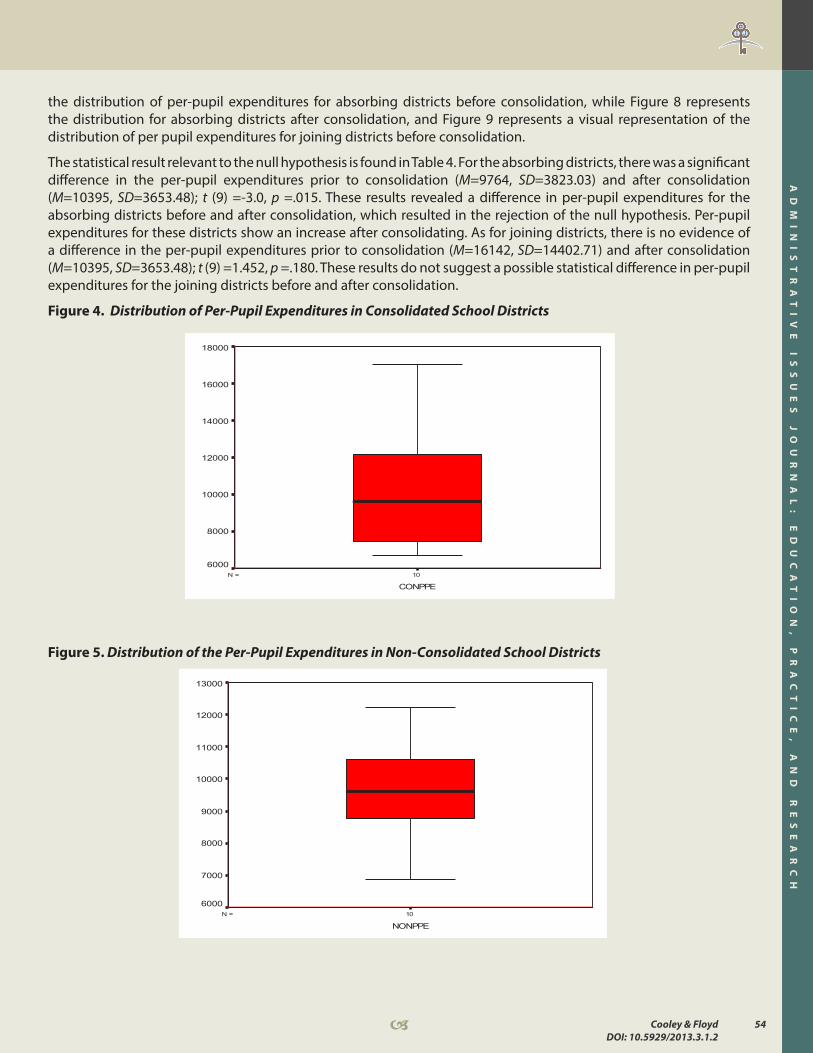
the distribution of per-pupil expenditures for absorbing districts before consolidation, while Figure 8 represents the distribution for absorbing districts after consolidation, and Figure 9 represents a visual representation of the distribution of per pupil expenditures for joining districts before consolidation.
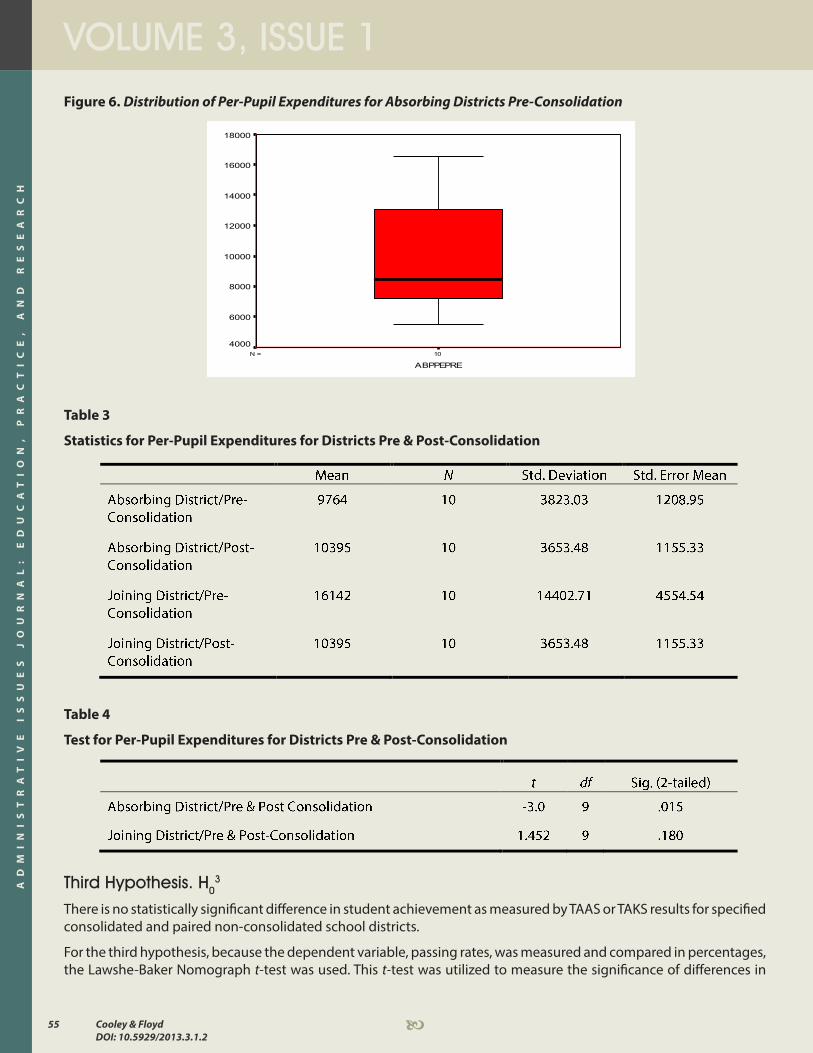
The statistical result relevant to the null hypothesis is found in Table 4. For the absorbing districts, there was a significant difference in the per-pupil expenditures prior to consolidation (M=9764, SD=3823.03) and after consolidation (M=10395, SD=3653.48); t (9) =-3.0, p =.015. These results revealed a difference in per-pupil expenditures for the absorbing districts before and after consolidation, which resulted in the rejection of the null hypothesis. Per-pupil expenditures for these districts show an increase after consolidating. As for joining districts, there is no evidence of a difference in the per-pupil expenditures prior to consolidation (M=16142, SD=14402.71) and after consolidation (M=10395, SD=3653.48); t (9) =1.452, p =.180. These results do not suggest a possible statistical difference in per-pupil expenditures for the joining districts before and after consolidation.
Figure 4. Distribution of Per-Pupil Expenditures in Consolidated School Districts
10N =
CONPPE
18000
16000
14000
12000
10000
8000
6000
Figure 5. Distribution of the Per-Pupil Expenditures in Non-Consolidated School Districts
10N =
NONPPE
13000
12000
11000
10000
9000
8000
7000
6000
AD
MI
NI
ST
RA
TI
VE
I
SS
UE
S
JO
UR
NA
L:
E
DU
CA
TI
ON
,
PR
AC
TI
CE
,
AN
D
RE
SE
AR
CH
55 Cooley & FloydDOI: 10.5929/2013.3.1.2
VOLUME 3, ISSUE 1
b
Figure 6. Distribution of Per-Pupil Expenditures for Absorbing Districts Pre-Consolidation
10N =
ABPPEPRE
18000
16000
14000
12000
10000
8000
6000
4000
Table 3
Statistics for Per-Pupil Expenditures for Districts Pre & Post-Consolidation
Table 4
Test for Per-Pupil Expenditures for Districts Pre & Post-Consolidation
Third Hypothesis. H0
3
There is no statistically significant difference in student achievement as measured by TAAS or TAKS results for specified consolidated and paired non-consolidated school districts.
For the third hypothesis, because the dependent variable, passing rates, was measured and compared in percentages, the Lawshe-Baker Nomograph t-test was used. This t-test was utilized to measure the significance of differences in
AD
MI
NI
ST
RA
TI
VE
I
SS
UE
S
JO
UR
NA
L:
E
DU
CA
TI
ON
,
PR
AC
TI
CE
,
AN
D
RE
SE
AR
CH
56Cooley & FloydDOI: 10.5929/2013.3.1.2
a
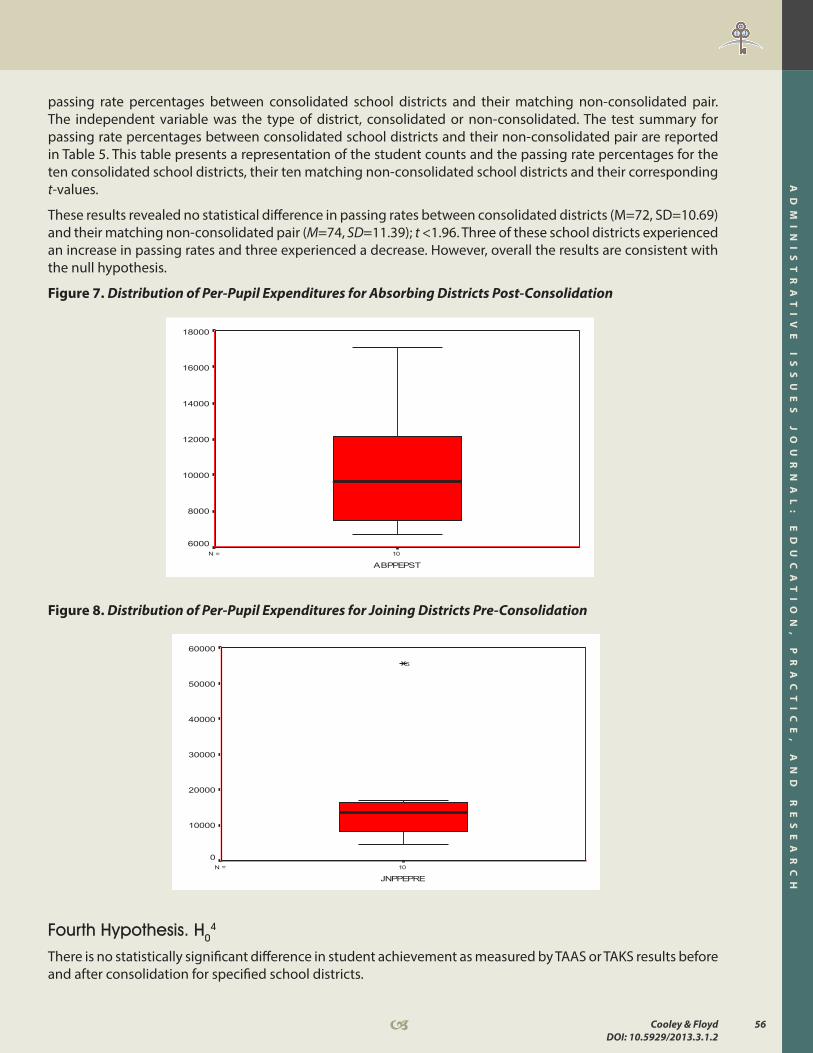
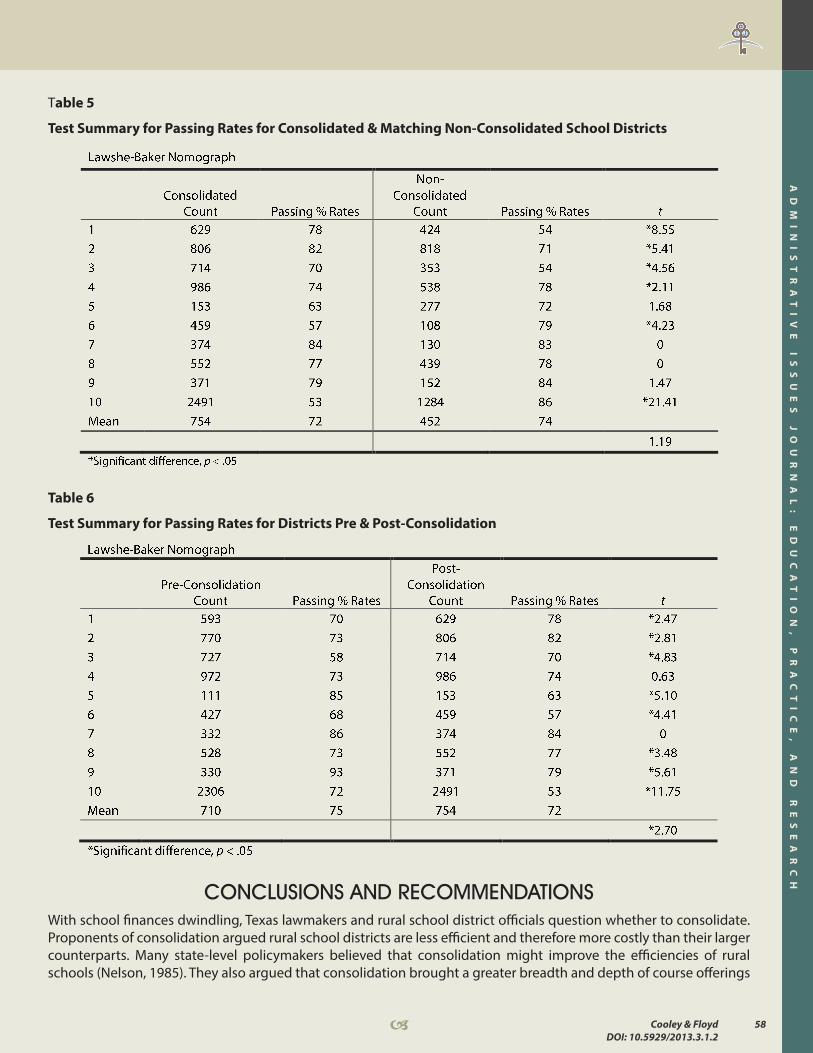
passing rate percentages between consolidated school districts and their matching non-consolidated pair. The independent variable was the type of district, consolidated or non-consolidated. The test summary for passing rate percentages between consolidated school districts and their non-consolidated pair are reported in Table 5. This table presents a representation of the student counts and the passing rate percentages for the ten consolidated school districts, their ten matching non-consolidated school districts and their corresponding t-values.
These results revealed no statistical difference in passing rates between consolidated districts (M=72, SD=10.69) and their matching non-consolidated pair (M=74, SD=11.39); t <1.96. Three of these school districts experienced an increase in passing rates and three experienced a decrease. However, overall the results are consistent with the null hypothesis.
Figure 7. Distribution of Per-Pupil Expenditures for Absorbing Districts Post-Consolidation
10N =
ABPPEPST
18000
16000
14000
12000
10000
8000
6000
Figure 8. Distribution of Per-Pupil Expenditures for Joining Districts Pre-Consolidation
10N =
JNPPEPRE
60000
50000
40000
30000
20000
10000
0
5
Fourth Hypothesis. H04
There is no statistically significant difference in student achievement as measured by TAAS or TAKS results before and after consolidation for specified school districts.
AD
MI
NI
ST
RA
TI
VE
I
SS
UE
S
JO
UR
NA
L:
E
DU
CA
TI
ON
,
PR
AC
TI
CE
,
AN
D
RE
SE
AR
CH
57 Cooley & FloydDOI: 10.5929/2013.3.1.2
VOLUME 3, ISSUE 1
b
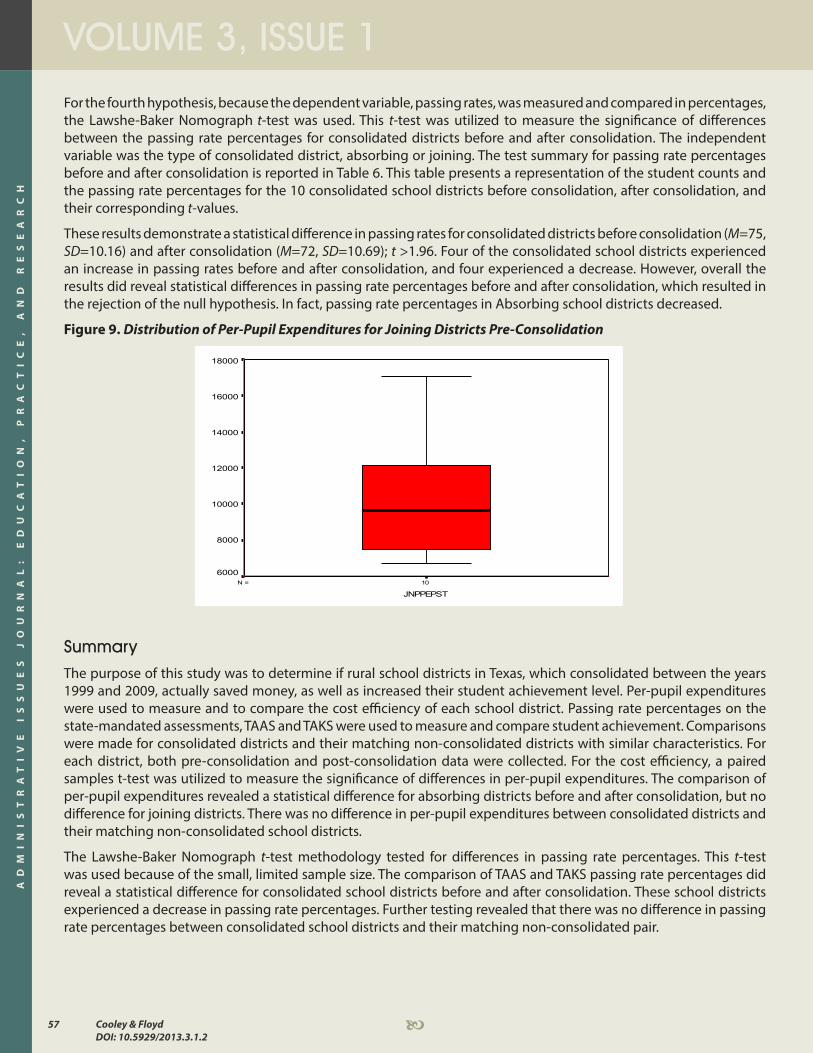
For the fourth hypothesis, because the dependent variable, passing rates, was measured and compared in percentages, the Lawshe-Baker Nomograph t-test was used. This t-test was utilized to measure the significance of differences between the passing rate percentages for consolidated districts before and after consolidation. The independent variable was the type of consolidated district, absorbing or joining. The test summary for passing rate percentages before and after consolidation is reported in Table 6. This table presents a representation of the student counts and the passing rate percentages for the 10 consolidated school districts before consolidation, after consolidation, and their corresponding t-values.
These results demonstrate a statistical difference in passing rates for consolidated districts before consolidation (M=75, SD=10.16) and after consolidation (M=72, SD=10.69); t >1.96. Four of the consolidated school districts experienced an increase in passing rates before and after consolidation, and four experienced a decrease. However, overall the results did reveal statistical differences in passing rate percentages before and after consolidation, which resulted in the rejection of the null hypothesis. In fact, passing rate percentages in Absorbing school districts decreased.
Figure 9. Distribution of Per-Pupil Expenditures for Joining Districts Pre-Consolidation
10N =
JNPPEPST
18000
16000
14000
12000
10000
8000
6000
SummaryThe purpose of this study was to determine if rural school districts in Texas, which consolidated between the years 1999 and 2009, actually saved money, as well as increased their student achievement level. Per-pupil expenditures were used to measure and to compare the cost efficiency of each school district. Passing rate percentages on the state-mandated assessments, TAAS and TAKS were used to measure and compare student achievement. Comparisons were made for consolidated districts and their matching non-consolidated districts with similar characteristics. For each district, both pre-consolidation and post-consolidation data were collected. For the cost efficiency, a paired samples t-test was utilized to measure the significance of differences in per-pupil expenditures. The comparison of per-pupil expenditures revealed a statistical difference for absorbing districts before and after consolidation, but no difference for joining districts. There was no difference in per-pupil expenditures between consolidated districts and their matching non-consolidated school districts.
The Lawshe-Baker Nomograph t-test methodology tested for differences in passing rate percentages. This t-test was used because of the small, limited sample size. The comparison of TAAS and TAKS passing rate percentages did reveal a statistical difference for consolidated school districts before and after consolidation. These school districts experienced a decrease in passing rate percentages. Further testing revealed that there was no difference in passing rate percentages between consolidated school districts and their matching non-consolidated pair.
AD
MI
NI
ST
RA
TI
VE
I
SS
UE
S
JO
UR
NA
L:
E
DU
CA
TI
ON
,
PR
AC
TI
CE
,
AN
D
RE
SE
AR
CH
58Cooley & FloydDOI: 10.5929/2013.3.1.2
a
Table 5
Test Summary for Passing Rates for Consolidated & Matching Non-Consolidated School Districts
Table 6
Test Summary for Passing Rates for Districts Pre & Post-Consolidation
CONCLUSIONS AND RECOMMENDATIONSWith school finances dwindling, Texas lawmakers and rural school district officials question whether to consolidate. Proponents of consolidation argued rural school districts are less efficient and therefore more costly than their larger counterparts. Many state-level policymakers believed that consolidation might improve the efficiencies of rural schools (Nelson, 1985). They also argued that consolidation brought a greater breadth and depth of course offerings
AD
MI
NI
ST
RA
TI
VE
I
SS
UE
S
JO
UR
NA
L:
E
DU
CA
TI
ON
,
PR
AC
TI
CE
,
AN
D
RE
SE
AR
CH
59 Cooley & FloydDOI: 10.5929/2013.3.1.2
VOLUME 3, ISSUE 1
b
to provide more opportunities for increased student achievement (Brantley, 1983).
Two research questions were addressed in this study. One question analyzed whether the consolidation of school districts would lead to increased cost efficiencies. The other research question focused on whether the consolidation of school districts resulted in increased student achievement. Stated differently, were these rural Texas school districts saving money because of being consolidated, and were their new organizational structures having a positive impact on student achievement?
Methodology To determine if school district consolidation affected cost efficiencies and student achievement, data were collected before and after consolidation. To make comparisons between consolidated and non-consolidated school districts, consolidated districts were matched with non-consolidated districts of similar characteristics. The districts’ per pupil expenditures measured efficiency. Passing rate percentages on the state assessment measured student achievement.
To analyze district cost efficiency and to examine the impact on student achievement, this study addressed questions as follows: How does the amount of money spent per pupil in consolidated school districts compare with the amount spent in non-consolidated school districts with similar characteristics? Furthermore, how do these expenditures after consolidation compare with the expenditures before consolidation? How do passing rates on the state assessment compare between consolidated and matching non-consolidated school districts? As with cost efficiency, how does student achievement compare in school districts before and after consolidation?
ResultsFor the first research question, results of the paired-samples t-test revealed that per-pupil expenditures are no different in consolidated school districts as they are in non-consolidated school districts with similar or matching organizational characteristics. For the second research question, results of the paired-samples t-test did reveal a statistical difference in per-pupil expenditures before and after consolidation. Evidence revealed that absorbing districts experienced a statistically significant increase in per-pupil expenditures after consolidating; however, joining districts did not. These districts did experience a decrease in per pupil expenditures, but the decrease was not statistically significant.
The results suggests that based on per-pupil expenditures, rural Texas school districts did not save money by consolidating. The absorbing districts actually spent more on a per-pupil basis after consolidating. Even though per-pupil expenditures decreased for joining districts, the savings were minimal and, therefore, not statistically significant.
For the third and fourth research questions, results from the Lawshe-Baker Nomographt-test revealed no difference in student achievement, as measured by passing rate percentages on the TAAS and TAKS between consolidated school districts and non-consolidated school districts with similar or matching organizational characteristics. However, the Lawshe-Baker Nomograph t-test did reveal a statistical difference in student achievement, as measured by passing rate percentages on the state assessment before and after consolidation. The passing rate percentages decreased.
These findings suggest that based on passing rate percentages on the state assessment, rural Texas school districts did not show an increase in student achievement by consolidating, when compared to non-consolidated school districts with similar characteristics. These results also revealed that small rural Texas school districts, after consolidating, actually experienced a decrease in student achievement based on passing rate percentages on the state assessment after consolidating.
ConclusionsThis study suggests that per-pupil expenditures are no different in consolidated school districts than they are in non-consolidated school districts with similar characteristics. Conversely, the evidence revealed that per-pupil expenditures in consolidated schools are statistically different before and after districts consolidate. Per-pupil expenditures increased for the absorbing districts, while per-pupil expenditures decreased minimally for the joining districts. These findings support the results from previous studies that even though consolidation could prove to be cost-effective in some cases, there has been no compelling evidence that consolidation is a cost-effective alternative to small rural schools (Brent, et al., 2004).

AD
MI
NI
ST
RA
TI
VE
I
SS
UE
S
JO
UR
NA
L:
E
DU
CA
TI
ON
,
PR
AC
TI
CE
,
AN
D
RE
SE
AR
CH
60Cooley & FloydDOI: 10.5929/2013.3.1.2
a
The second part of this study suggests that, based on passing rate percentages on the TAAS and TAKS, student achievement levels are no different in consolidated school districts than they are in non-consolidated school districts with similar characteristics. On the other hand, the evidence did reveal a statistical difference in student achievement after rural Texas school districts consolidated. Overall, student achievement in these consolidated school districts decreased. These findings support previous studies claims that no convincing evidence that students from small rural schools received a less effective educational program than children in larger schools (Patterson, 2006).
ImplicationsWhen school districts consolidate, smaller rural schools close, which can adversely affect the community. For rural areas, community is a core value, and to rural citizens, consolidation creates a loss of community and culture (Mathis, 2006). The rural school is often the center of community social activities, including recreational, cultural, and civic events. According to Jimerson (2006), local schools serve as the community-centering institution, a repository of local history, and the locus of community pride.
When consolidation occurs, many rural communities because of their geographical isolation, become financially strangled and lose population. Eventually, some communities cease to exist. Consolidation could result in the loss of a sizable employer, a loss that subsequently fosters a decline in retail sales, property values, and tax revenues (Brent, et al., 2004).
As Texas lawmakers and educational leaders contemplate school district consolidation, saving money and raising student achievement should not be their only concerns. Instead, they should take into serious consideration the economic and the social impact that consolidating small school districts could have on the communities they serve.
LimitationsThe sample size of 10 consolidated school districts to analyze student achievement could present a potential threat to the internal validity of this study. The potential concern could be that, from the 56 currently consolidated school districts in Texas, most of the districts have been consolidated since the 1950’s and 1960’s. Due to the constraints of this study, these districts would not be represented.
During the timeframe between 1999 and 2009, Texas school districts administered either the Texas Assessment of Academic Skills (TAAS) or the Texas Assessment of Knowledge and Skills (TAKS) to measure student achievement. This change in assessment presented a challenge because two different state assessments would be used to make comparisons. To alleviate this concern, the researcher used the percentage of students who “passed all tests taken,” which is a common measure for both assessments.
RecommendationsSchool consolidation presents many unique challenges. Consolidation requires planning that should include the identification of needs, goals and objectives, the establishment of procedures, and evaluation or feedback. Most consolidations had a plan, but few followed up with evaluation. The educational needs must be combined with the needs of the community (Self, 2001). There should be no statewide mandates forcing school district consolidation.
Because there is no compelling evidence suggesting that school consolidation is a cost-effective or achievement-effective alternative to small rural schools, state policymakers should take into consideration the quality of education that rural students will receive before moving to consolidation (Silverman, 2005). Claims about the presumed benefits of school district consolidation should be closely questioned.
Instead of consolidating small schools and districts, other measures should be considered to improve fiscal efficiency or educational outcomes. This phenomenon, referred to as “shared services,” allow schools and districts to band together to eliminate duplication and streamline functions and services (Patterson, 2006). Shared services can yield real efficiencies around facilities, transportation, food service, real estate management, procurement, human resources, information technology, security and instruction (Deloitte, 2005). For example, in Lubbock, Texas, the Regional Service Center 17 provides payroll and accounting services to several rural districts. These districts report savings between 50-80 percent annually (Patterson, 2006).
AD
MI
NI
ST
RA
TI
VE
I
SS
UE
S
JO
UR
NA
L:
E
DU
CA
TI
ON
,
PR
AC
TI
CE
,
AN
D
RE
SE
AR
CH
61 Cooley & FloydDOI: 10.5929/2013.3.1.2
VOLUME 3, ISSUE 1
b
This study focused on how per pupil expenditures and student achievement are affected when rural Texas school districts consolidate. Statistical tests indicated that small rural districts in Texas do not save money by consolidating, and there is no positive impact on student achievement levels. In cases where there were cost savings, the amount saved was minimal. With this in mind, is there a correlation between how small rural school districts spend their money and the achievement level of their students? For instance, how do transportation costs affect student achievement? In Oklahoma, lawmakers and lead educators are currently debating the issue of consolidating small districts to reduce administrative costs and use the savings in other ways such as in the classrooms (Burton, 2010).
The data in this study revealed that overall, students experience a decrease in student achievement after small school districts consolidate. How did students, specifically from joining districts, perform academically after consolidating? Did more of these students graduate from high school and pass the TAAS or TAKS as a result of merging with an absorbing district? Furthermore, how are small rural school districts that chose shared services instead of consolidation performing in the areas of cost efficiency and student achievement? Finally, what are the total economic and social impacts on the community when school districts consolidate? People who live in rural communities fear that when their schools are closed a sense of community is also lost. Critics of consolidation say that, if decision makers focus only on numbers, they miss the value of a school and the community to which it belongs (Burton, 2010).
REFERENCESArnold, M. (2004). Guiding rural schools and districts: A research agenda. Regional Educational Laboratory, USDOE, Washington, DC, February, 2004. Retrieved from http://www.mcrel.org/topics/RuralEducation/ products /164
Ashford, E. (2002). Rural school districts particularly challenged by NCLB law. School Board News, Alexandria, VA, October, 2002. Retrieved from http://www.nsba.org/HPC/About/SBN/October2002.html
Augenblick, J., & Myers, J. (2001). A comprehensive study on the organization of Kansas school districts. Augenblick and Myers, Inc. Retrieved from http://www.ksde.org/LinkClick.aspx?
Bard, J., Gardener, C., & Wieland, R. (2006). Rural school district consolidation. Academic Leadership Journal, 4(2).
Brantley, W. (1983, Spring). Consolidating high schools: One district’s answer. Spectrum I, pp.15-22. Retrieved from http://www.academic leadership.org/emprical_research/444.shtml
Brent, B., Sipple, J., Killeen, K., & Wischnowski, M. (2004). Stalking cost-effective practices in rural schools. Journal of Education Finance, 29, 237-56. Retrieved from http://www.keep2.sjfc.edu/faculty/ mwischnowski/research.htm
Burton, W. (2010, October). Consolidation would free up funds. MuskogeePhoenix.com. Muskogee. Retrieved from http://muskogeephoenix.com/local/x1850236538/Consolidation
Cravey, R. (2008). An analysis of the relationship of educational technology implementation level and student achievement. Stephenville, TX.
Cushman, K. (2000). Shrink big schools for better learning. The Education Digest, 65(6), 36-39. Retrieved from http://www.slc.southsaxons. com/Documents/SLCInfo.htm
DeYoung, A., & Howley, C. (1992). The political economy of rural school consolidation (Report No. RC-018-660). (ERIC Document Reproduction Service No. ED 347-018).
Downie, N. M., & Heath, R. W. (1965) Basic statistical methods. Harper & Row, (2).
Duncombe, W., & Yinger, J. (2001) Does school district consolidation cut costs? Syracuse, NY: Center for Policy Research.
Herzog, M., & Pittman, R. (1995). Home, family, and community: Ingredients in the rural education equation. Phi Delta Kappan, 77. Retrieved from http://www.education.com/reference/article/ RefParentCommunity
House Research Org. (2004). Texas adapts to requirements of No Child Left Behind Act. Interim News, 78(10). Retrieved from http://www.house.state.tx.us/analyses/hro/research.php
AD
MI
NI
ST
RA
TI
VE
I
SS
UE
S
JO
UR
NA
L:
E
DU
CA
TI
ON
,
PR
AC
TI
CE
,
AN
D
RE
SE
AR
CH
62Cooley & FloydDOI: 10.5929/2013.3.1.2
a
Howley, C. (1996, December). Ongoing dilemmas of school size: A short story. WV: ERIC Digest, ERIC Clearinghouse on Rural Education and Small Schools, ED401 089.
Howley, C. (2000). School district size and school performance. Rural Education Issue Digest. Retrieved from http://www.ael.org/rel/rural / pdf/digest3.pdf
Jimerson, L. (2004). Teachers and teaching conditions in rural Texas. ARlington, VA: Rural School and Community Trust, Arlington, VA. Retrieved from http:// www.ruraledu.org/articles.php?id=2035
Jimerson, L. (2006, February). Breaking the fall: Cushioning the impact of rural declining enrollment. Arlington, VA: Rural School and Community Trust. Retrieved from http://www.ruraledu.org/user_uploads/ file/teachers_texas.pdf
Mathis, W. (2006, March). Anything but research-based: State initiatives to consolidate schools and districts. Arlington, VA: Rural School and Community Trust. Retrieved from http://www.ruraledu.org/search.php?kw= Vermont&pager_view
Mitchell, S. (2002, Februray). The answer is smaller schools. Education Report. Retrieved from http//www.educationreport.org/pubs/mer/article.aspx
Moak, Casey, & Associates. (2006, February). A Cost Analysis of Texas Schools. Retrieved from http://www.moakcasey.com/publications/ article.aspx?id=734
Nachtigal, P. (1982). In search of a better way. Boulder, CO: Westview Press. Retrieved from http//www.academicleadership.org/article
National Center for Education Statistics. Digest of Education Statistics (2011), Tables 3, 19, Washington, D.C.
Nelson, E. (1985). School consolidation (Report No. 1985-00-00). Eugene, OR: Clearinghouse on Educational Management. Retrieved from http://www.ericdigests.org/pre-925/school.htm
New York Times (December 5, 2011).
Patterson, C. (2006, February). School district consolidation and public school efficiency. Policy Perspective: Texas Public Policy Foundation. Retrieved from http://www.texaspolicy.com/pdf/2006-02-PP-consolidation-cp.pdf
Peabody, N. (2003, June). The No Child Left Behind Act: A blueprint on NCLB issues affecting small, rural and isolated schools and districts. Council of Chief State School Officers. Retrieved from http://www.ccsso.org/ Federal_Programs/nclb/4214.cfm
Raywid, M. A. (1995, April). Taking stock: The movement to create mini-schools, schools-within-schools, and separate small schools. Madison,WI: Center on Organization and Restructuring of Schools, and New York: ERIC Clearinghouse in Urban Education, ED393 958.
Raywid, M. A. (1999). Current literature on small schools. ERIC Digest EDO-RC-98-8. Retrieved from http//ael.org
Reynolds, D. (2001). Rural school consolidation in early twentieth century Iowa: Lessons for the early twenty-first century. University of Iowa, Iowa City. Retrieved from http://www.wik.ed.uiuc.edu/index.php/ RuralSchoolConsolidation
Self, T. (2001). A post-consolidation evaluation-The effects eight years later. Ashland University. (ERIC Document Reproduction Service No. 475 492)
Silverman, F. (2005). All alone. District Administration, pp. 32-35. Retrieved from http://www.thefreelibrary.com/2005/October/
Texas Education Agency (2010). Snapshot: School district profiles. Austin, TX. Retrieved from http://ritter.tea.state.tx.us/perfreport/snapshot/index.html
Texas Education Agency (2010). Academic Excellence Indicator System. Austin, TX. Retrieved from http://ritter.tea.state.tx.us/aeis/
AD
MI
NI
ST
RA
TI
VE
I
SS
UE
S
JO
UR
NA
L:
E
DU
CA
TI
ON
,
PR
AC
TI
CE
,
AN
D
RE
SE
AR
CH
63 Cooley & FloydDOI: 10.5929/2013.3.1.2
VOLUME 3, ISSUE 1
b
ABOUT THE AUTHORSDwight A. Cooley is the Executive Director of Mathnasium Learning Center of SW FT. Worth, Adjunct Professor at the University of Texas at Arlington, and Math Instructional Coach in Crowley ISD.
Koy M. Floyd ([email protected] ) is Research Professor, Department of Educational Administration and Policy Studies, Tarleton State University, Stephenville, Texas.