2011 afma operations survey report operations... · 2011 afma operations survey report ......
TRANSCRIPT
2011 AFMA Operations Survey Report
2011 AFMA OperAtiOns survey repOrt
This report presents the summary results of the 2011 Australian Financial
Markets Association (AFMA) Operations Committee Member Survey.
The results of the survey give a strong picture of operations in Australia, the
successes over the past two years and the current trends and challenges.

AustrAliAn FinAnciAl MArkets AssOciAtiOn
3
2011 Contents
Executive Summary ................................................................................................................ 4
The Survey ............................................................................................................................. 5
Method .............................................................................................................................. 5
Confidentiality ................................................................................................................... 5
Participants ............................................................................................................................ 6
Results .................................................................................................................................... 7
1. Organisational Functions ............................................................................................ 7
2. Knowledge / Education / Human Resources .............................................................. 8
2.1 Knowledge and Education Levels ..................................................................... 8
2.2 Human Resources ........................................................................................... 13
2.3 Recruitment / Retention / Salary ..................................................................... 15
3. Operations Activity – Products and Functions ......................................................... 18
4. Products .................................................................................................................... 21
4.1 Agricultural Commodities ................................................................................ 21
4.2 Debt ................................................................................................................. 24
4.3 Energy .............................................................................................................. 27
4.4 Equities ............................................................................................................ 30
4.5 Futures ............................................................................................................. 33
4.6 Precious and Base Metals ............................................................................... 36
4.7 OTC Financial Markets .................................................................................... 39
4.8 OTC Equities.................................................................................................... 42
4.9 OTC Credit Derivatives .................................................................................... 45
4.10 OTC Interest Rate Derivatives ......................................................................... 48
4.11 Money Market .................................................................................................. 51
4.12 Managed Funds ............................................................................................... 54
5. Off-shoring ................................................................................................................ 54
About AFMA ......................................................................................................................... 58

2011 AFMA OperAtiOns survey repOrt
4
The results of the survey give a comprehensive picture of operations in Australia, the successes over the past two years and the current trends and challenges.
The 2011 survey collected data on products, organisational functions and processes, and education and human resources issues. This survey also included questions on the off-shoring of traditional operations functions; the drivers for such change; and what initiatives might entice organisations to retain, or in fact centralise, operations here in Australia.
Off-shoring of IT functions is common practice throughout the industry: pressure to cut costs and improve service quality has led to many organisations moving, or at least considering moving, traditional operations functions off-shore. It is also recognised that there is considerable availability of skilled resources throughout Asia and organisations are keen to use these resources to enhance the effectiveness of their entire operations.
Survey results suggest that while specialist risk functions are still based in Australia, there is a declining trend in the percentage of traditional back office functions being undertaken in Australia. There is an increase in the percentage of organisations who undertake market risk, credit risk and operational risk functions in Australia. Eighty percent of respondents indicate that these functions are based on-shore compared to 66 percent in the 2008 survey. This demonstrates organisations’ recognition of, and commitment to, these critical functions. For example, the percentage of organisations with staff supporting the processing of financial markets products in Australia has dropped from 83 percent to 61 percent since the 2008 survey. Similarly, the percentage of organisations with a nostro reconciliations and investigations function on-shore has dropped from 63 percent to 32 percent.
Staff numbers across operations in Australia have declined noticeably since the previous survey. Total staff working in operations in Australia is reported as 2,734 compared to 3,509 in 2008 and comprises: 1,900 staff for Australia/New Zealand operations; 409 staff supporting Asian operations; 342 staff supporting European operations; and 80 supporting North American operations. Reduced staff numbers in Australia may be attributed in part to the offshoring of specific functions or alternatively less volume of business being conducted. Fewer organisations are undertaking some product businesses, for example precious and base metals, OTC credit derivatives and OTC interest rate derivatives.
There are fewer organisations processing agricultural commodities in Australia; however the majority of these organisations are undertaking these functions for the Asian and global markets as well as the Australian market. This suggests that Australia is seen as a preferred centre for this specialist product type.
Thirty-six percent of respondents have Australian-based staff supporting selected functions for the Asian and global operations.
Recruitment and retention in operations is strong. Of the organisations that responded, 39 percent report a turnover of equal to or less than five percent. Compared to the previous survey, significantly fewer staff – 53 percent – have left operations because of a lack of opportunity. This figure was above 80 percent in 2008.
Survey respondents report a strong commitment to training and development of staff; however there are now higher skills expectations on recruitment. There is evidence of an increased requirement for customer service skills particularly at the clerk/data entry level. The ability to work as a team member remains a key skill requirement for staff.
There is a notable increase in the expectation that staff at the Supervisor level and above have a bachelor degree. Eighty-three percent of respondents expect that staff at the Senior Operations Manager and Executive level have at least a bachelor degree on recruitment. An average of 35 percent of organisations expect staff to attain the AFMA Operations Accreditation at the Supervisor to Senior Manager level; however the expectation decreases at the lower levels.
In line with increased regulatory and compliance obligations, most respondents support additional regulatory training for operations staff including AML, KYC and AUSTRAC training. Almost two-thirds of respondents provide this training internally. These results are consistent with the results in the last survey with the exception of training on Basel II with organisations are now more likely to seek an external provider for this training.
There is a wide range in the size of respondents’ operations and transaction volumes. There has been a decrease in the number of organisations processing some product groups, in line with a decline in overall staff numbers. The number of Australian operations processing precious and base metals has more than halved since the 2008 survey – now 5 compared to 12. The number of Australian operations processing OTC credit derivatives has dropped from 13 in 2008 to 4 in this survey. The number of Australian operations processing OTC interest rate derivatives has dropped from 33 to 14. Staff numbers range from 4 to more than 300 for any one product group.
With the exception of agricultural commodities, most respondents expect that the level of staff resources will remain unchanged over the coming 12 months.
The level of straight-through processing across most product areas has increased, albeit slightly, since the 2008 survey. This is particularly evident for equities and futures.
Australia continues to be a major processing centre for this region.
Executive Summary
This report presents the summary results of the 2011 Australian Financial Markets Association (AFMA) Operations
Committee Member Survey. Survey data was collected over a three-month period from November 2010 to
January 2011. A total of 59 organisations participated with a demographic breakdown of 17 foreign banks, 7
domestic banks, 16 utilities and 20 ‘other’ institutions (e.g. treasury corporations).

AustrAliAn FinAnciAl MArkets AssOciAtiOn
5
The SurvEy
The AFMA Operations Committee conducted the operations survey to identify the markets serviced by Australian-based operations for financial markets products and markets. Feedback on staff recruitment and retention, education and training was also gathered as was data on the functions carried out within Australia and off-shore.
This is the third AFMA survey of this nature. The last survey was conducted in 2008 and distributed to the AFMA membership base with results being made available to all participating organisations. AFMA thanks participants for their time and effort to complete the survey.
The method
In November 2010, the survey was uploaded in an online format and distributed to AFMA members, many of which had taken part in the 2008 survey. Completion of the survey was voluntary.
The survey structure was:
1. Organisational Functions
2. Knowledge, Education and Human Resources
3. Operations Activity – Products and Functions
4. Off-shoring
Confidentiality
All participating organisations were assured confidentiality of responses. As a result, only aggregated data is reported and responses are not linked back to the responding organisation.

2011 AFMA OperAtiOns survey repOrt
6
The ParTiCiPanTS
The following organisations participated in this survey:
Acciona Energy Oceania Pty Ltd
Alinta Energy
AMP Capital Investors Limited
AMP Services Limited
ANZ Banking Group Limited
Aurora Energy
Australian Office of Financial Management
Bank of Queensland
BGC Partners (Australia) Pty Ltd
BNP Paribas
Commonwealth Bank of Australia
CLSA Australia Pty Ltd
Colonial First State Global Asset Management
Credit Agricole CIB Australia Pty Limited
CS Energy
Delta Electricity
Energy Australia
ERM Power
Goldman Sachs & Partners Australia Pty Ltd
HSBC Bank Australia Limited
IG Markets Limited
IMC Pacific Pty Ltd
ING Bank (Australia) Limited
Integral Energy
International Power (Australia) Pty Ltd
Investec Bank (Australia) Limited
Kuwait Finance House (Australia) Pty Ltd
Loy Yang Marketing Management Company Pty Ltd
Macquarie Generation
Macquarie Group Limited
MF Global Australia Limited
Morgan Stanley Australia Limited
National Australia Bank Limited
Northern Territory Treasury Corporation
NSW Treasury Corporation
OCBC Bank
Optiver Australia Pty Ltd
Origin Energy
QIC
Queensland Treasury Corporation
Rabobank
Reserve Bank of Australia
RMB Australia Limited
Royal Bank of Canada
Snowy Hydro Limited
South Australian Government Financing Authority
Stanwell Corporation Limited
State Electricity Commission of Victoria
State Street Australia Limited
StoneBridge Group Limited
Sumitomo Mitsui Banking Corporation, Sydney Branch
Suncorp Metway Ltd
The Royal Bank of Scotland, Plc
The Toronto Dominion Bank, Australia Branch
Treasury Corporation of Victoria
TRUenergy Pty Ltd
United Overseas Bank Limited
Western Australian Treasury Corporation
Westpac Banking Corporation

AustrAliAn FinAnciAl MArkets AssOciAtiOn
71. Organisational Functions
From the following list please indicate the functions your organisation undertakes in Australia. (Data based on 59 organisations)
There has been an increase in the percentage of organisations that undertake the functions of market risk, credit risk and operational risk in Australia. Eighty percent of respondents indicate that these functions are based on-shore compared to 66 percent in the last survey.
There is a decline in the percentage of traditional back office functions currently undertaken in Australia. For example, the percentage of organisations with staff supporting the processing of financial markets products on-shore has dropped from 83 percent to 61 percent since the last survey. The percentage of organisations with a nostro reconciliations and investigations function on-shore has dropped from 63 percent to 32 percent.
These results suggest that while the specialist risk functions are still based in Australia, some of the traditional back office or operational functions are being moved off-shore.
Other functions reported are:
» shariah advisory
» broker
» CFD trading
» market making
» middle office
» funding
The rESulTS
0%
10%
20%
30%
40%
50%
60%
70%
80%
90%
Back o
ffice s
ervice
prov
ider
Trad
e fina
nce p
roce
ssing
Other
Stock b
rokin
g
Accou
nting
Staff s
uppo
rting f
inanc
ial m
arkets
prod
uct p
roce
ssing
Operat
ional
risk
Futur
es cl
earin
g serv
ices
Equity
clea
ring s
ervice
s
Margin
lendin
g
Custod
ial se
rvice
s (glo
bal, m
aster
& su
b cus
tody)
Credit r
isk
Market
risk
Nostro
reco
ncilia
tions
& in
vesti
gatio
ns

2011 AFMA OperAtiOns survey repOrt
8 2.1 Knowledge and Education levels
In your organisation, what are the expected educational qualifications of a new recruit into the following levels? (Data
based on 39 organisations)
There is a notable increase in the expectation that staff at the level of Supervisor and above have a bachelor degree. Eighty-three percent of respondents expect that a Senior Operations Manager or an Executive has a bachelor level degree on recruitment.
Only 8 percent of organisations accept a Year 10 qualification for a clerk/data entry role, down from 29 percent in 2008. All respondents expect a minimum of Year 12 for Manager level and above.
An average of 35 percent of organisations expect staff to attain the AFMA Operations Accreditation at the Supervisor to Senior Manager level; however the expectation decreases at the Associate level and the Executive level. This pattern also applies to the requirement to hold a UK Securities and Investment IAQ accreditation.
TAFE qualifications are recognised by 42 percent of organisations for Clerk/Data Entry roles; however this figure decreases for the more senior roles.
0%
10%
20%
30%
40%
50%
60%
70%
80%
90%
Clerk / Data Entry Supervisor Manager Senior Operations Manager Executive
Year 10 Qualification
Year 12 Qualification
TAFE Qualification / College Course / Diploma / VET
Bachelor Degree
Kaplan Qualification
AFMA Operations Accreditation
UK Securities & Investment IAQ Accreditation
Other
Knowledge / Education / Human resources

AustrAliAn FinAnciAl MArkets AssOciAtiOn
9Considering the following role levels, which knowledge / skills are essential requirements to work at these levels
effectively? (Data based on 39 organisations)
All staff are required to have a sound knowledge of financial markets products, particularly at the Manager level where 92 percent of respondents expect high levels of product knowledge and skills.
In 89 percent of the organisations surveyed, the Manager level is also required to have the highest level of operational risk knowledge and industry and related knowledge.
Required knowledge of payments is high at all levels particularly at the Clerk/Data Entry and Supervisor levels, decreasing slightly at the Manager level and above.
The requirement for staff to have a strong knowledge of the compliance and regulatory environment is consistent across all levels particularly at the Senior Manager level (85 percent).
Executive staff are expected to have strong skills and knowledge in all areas, notably in compliance and regulation.
Knowledge of operational risk is a key requirement for all staff levels.
Compared to the previous survey there appears to be an increased requirement for customer service skills particularly at the Clerk/Data Entry level.
One respondent reported ‘leadership’ as another essential skill for operations personnel.
0%
10%
20%
30%
40%
50%
60%
70%
80%
90%
100%
Clerk/ Data Entry Supervisor Manager Senior Operations Manager Executive
Payments
Compliance and regulation
Customer service
Operational risk
PC literacy
Basic accounting/ reconciliation
Industry experience or related
Other
Knowledge and Education levels

2011 AFMA OperAtiOns survey repOrt
10Thinking about the candidates for operations roles in your organisation: Are the following knowledge areas essential
requirements on recruitment? (Data based on 39 organisations)
The most important requirement across all areas is that of being a team player. Eighty-five percent of respondents consider that the ability to work effectively in a team is an essential skill expected at recruitment. The remaining 15 percent believe that this skill can be developed after commencement.
There is a low requirement for specialised system knowledge at recruitment, with 84 percent of organisations providing this training after commencement.
The requirement to have strong product knowledge at recruitment is 46 percent with 51 percent of respondents providing this training. This is consistent with the previous surveys.
All organisations require staff to have a minimum level of compliance knowledge. Seventy-four percent of respondents will provide this training.
Compared to the previous surveys, there is an increased requirement for basic accounting and reconciliation knowledge and the ability to prepare basic reports. Currently almost 60 percent of respondents believe that these are essential skills on recruitment.
Of the organisations surveyed, 43 percent do not believe that a knowledge of legal documentation and master agreements is necessary and only 16 percent require this knowledge on recruitment.
Knowledge of payments is expected on recruitment by 37 percent of respondents, with 55 percent of respondents able to develop this knowledge after commencement.
0% 10% 20% 30% 40% 50% 60% 70% 80% 90% 100%
Financial markets and products
Legal documentation and Master Agreements
Dealing process
Legal implications of errors
Basic accounting and reconciliation techniques
Prepare basic reports
Payments systems
CHESS
SYCOM functions
ITS functions
Electronic confirmation and settlement systems
Credit risk
Processing corporate actions
Working effectively in a team
Preparing client reports
International Accounting Standards
Unit pricing principles
Specialised systems knowledge
Broad understanding of custody
Compliance and regulation
Essential on recruitment
Not essential but developed after commencement
Not required to perform effectively Other
Knowledge / Education / Human resources
AustrAliAn FinAnciAl MArkets AssOciAtiOn
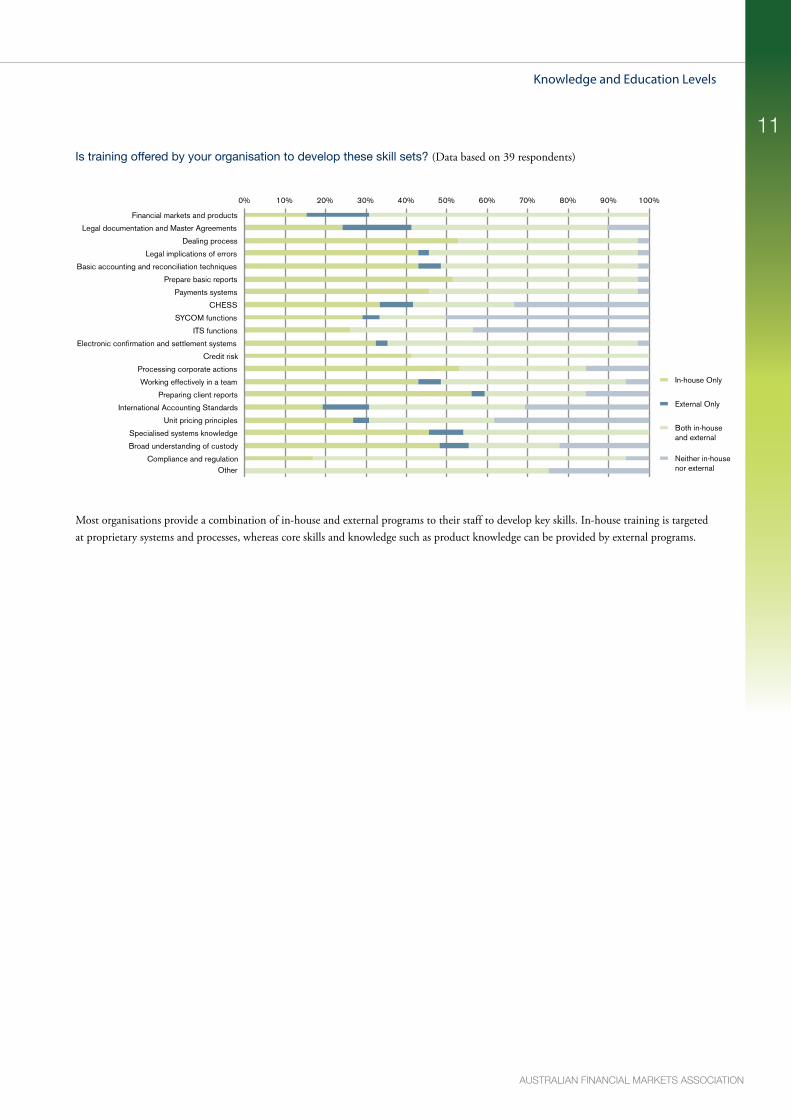
11Is training offered by your organisation to develop these skill sets? (Data based on 39 respondents)
Most organisations provide a combination of in-house and external programs to their staff to develop key skills. In-house training is targeted at proprietary systems and processes, whereas core skills and knowledge such as product knowledge can be provided by external programs.
0% 10% 20% 30% 40% 50% 60% 70% 80% 90% 100%
Financial markets and products
Legal documentation and Master Agreements
Dealing process
Legal implications of errors
Basic accounting and reconciliation techniques
Prepare basic reports
Payments systems
CHESS
SYCOM functions
ITS functions
Electronic confirmation and settlement systems
Credit risk
Processing corporate actions
Working effectively in a team
Preparing client reports
International Accounting Standards
Unit pricing principles
Specialised systems knowledge
Broad understanding of custody
Compliance and regulation Other
In-house Only
External Only
Both in-house and external
Neither in-house nor external
Knowledge and Education levels
2011 AFMA OperAtiOns survey repOrt
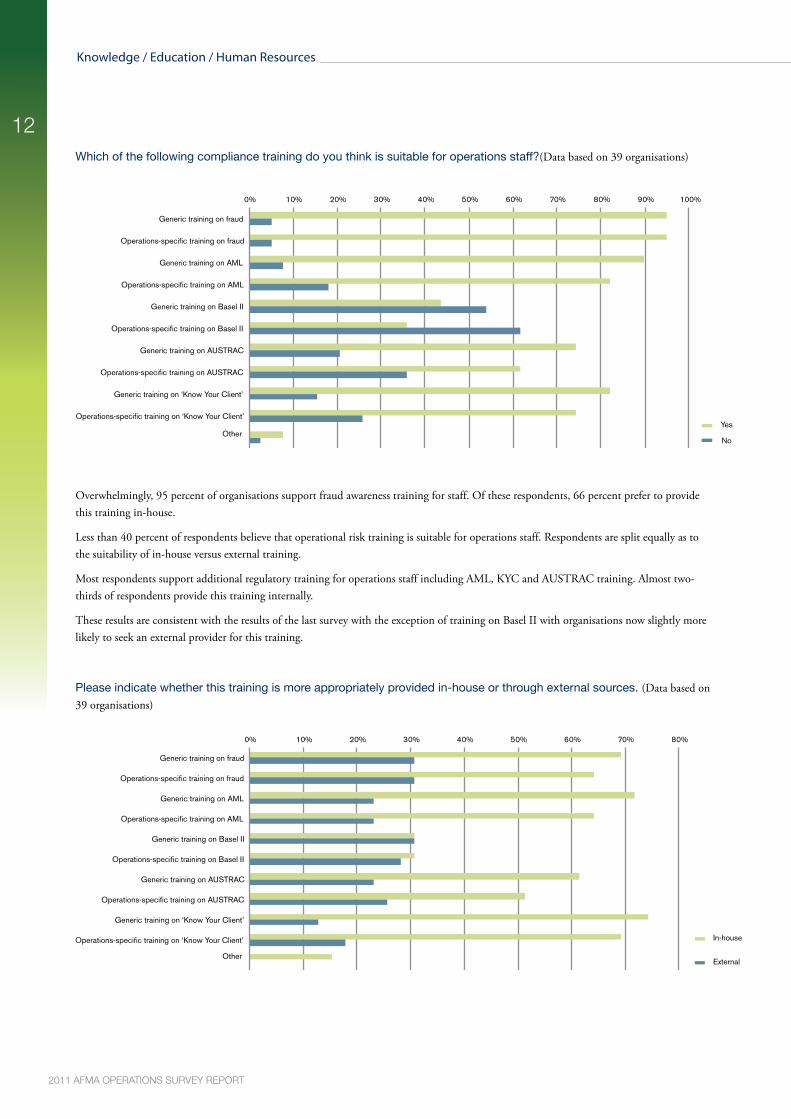
12Which of the following compliance training do you think is suitable for operations staff?(Data based on 39 organisations)
Overwhelmingly, 95 percent of organisations support fraud awareness training for staff. Of these respondents, 66 percent prefer to provide this training in-house.
Less than 40 percent of respondents believe that operational risk training is suitable for operations staff. Respondents are split equally as to the suitability of in-house versus external training.
Most respondents support additional regulatory training for operations staff including AML, KYC and AUSTRAC training. Almost two-thirds of respondents provide this training internally.
These results are consistent with the results of the last survey with the exception of training on Basel II with organisations now slightly more likely to seek an external provider for this training.
Please indicate whether this training is more appropriately provided in-house or through external sources. (Data based on 39 organisations)
0% 10% 20% 30% 40% 50% 60% 70% 80% 90% 100%
Generic training on fraud
Operations-specific training on fraud
Generic training on AML
Operations-specific training on AML
Generic training on Basel II
Operations-specific training on Basel II
Generic training on AUSTRAC
Operations-specific training on AUSTRAC
Generic training on ‘Know Your Client’
Operations-specific training on ‘Know Your Client’ Yes
No Other
0% 10% 20% 30% 40% 50% 60% 70% 80%
Generic training on fraud
Operations-specific training on fraud
Generic training on AML
Operations-specific training on AML
Generic training on Basel II
Operations-specific training on Basel II
Generic training on AUSTRAC
Operations-specific training on AUSTRAC
Generic training on ‘Know Your Client’
Operations-specific training on ‘Know Your Client’ In-house
External Other
Knowledge / Education / Human resources

AustrAliAn FinAnciAl MArkets AssOciAtiOn
132.2 Human resources
Many organisations have concerns about high employee turnover in operations across the financial services industry.
What is the average annual turnover of staff within operations at your organisation? Please include staff that remain
within your organisation but transfer out of operations. (Data based on 39 organisations)
Of the organisations that responded, 39 percent report a turnover of equal to or less than five percent. This is a notable change from the last survey where only 20 percent of organisations reported such a low turnover.
Fifty percent of respondents report turnover of between 6 and 25 percent. Only one organisation reported a turnover of greater than 30 percent.
What do you feel are the primary contributors to employee turnover within your organisation’s operations team? (Data based on 39 organisations)
Significantly fewer staff leave operations because of a lack of opportunity, although at 53 percent, it is the most prevalent reason given for leaving. This figure was above 80 percent in the last survey.
Another key factor in staff departures is remuneration, with 41 percent of leavers also reporting this as a key factor in their decision to leave an organisation or department.
Fewer staff are leaving because they believe they are overqualified.
0-5%
6-10%
11-15%
16-20%
21-25%
26-30%
More than 30%
0%
10%
20%
30%
40%
50%
60%
Unsuited to operations or
inaccurate perception of
the role
Work pressure Lack of opportunities
for career advancement/ progression
Level of remuneration
Dissatisfaction with manager/ work culture
Travel Overqualified Unsocial hours
Lack of training opportunities
to assist career development
Competitor poaching
General decline in loyalty to
employers
Other
Human resources

2011 AFMA OperAtiOns survey repOrt
14From your selections in the previous question, what do you feel is the main contributor to employee turnover within your
organisation’s operations team? (Data based on 39 organisations)
Organisations report that staff primarily leave due to lack of opportunities for career advancement. Again this appears to be a declining trend at only 39 percent compared to 50 percent in the last survey.
Respondents did not believe that training, work pressure or over-qualification contribute to turnover.
One respondent comments that a certain level of turnover is healthy and desirable.
Unsuited to operations or inaccurate perception of the role
Lack of opportunities for career advancement/progression
Level of remuneration Dissatisfaction with manager/work culture
Travel
Unsocial hours
Competitor poaching
General decline in loyalty to employers
Other
17.9%
2.6%
7.7%
2.6%
7.7%
2.6%12.8%
38.5%
7.7%
Knowledge / Education / Human resources

AustrAliAn FinAnciAl MArkets AssOciAtiOn
152.3 recruitment / retention / Salary
Many operations teams experience difficulties in sourcing staff. Where do you currently source most of your operations
staff from (irrespective of whether you utilise external recruitment agencies or in-house recruitment resources)? (Data based on 39 organisations)
With the exception of the Supervisor level, staff are primarily sourced from other financial institutions, so they have prior experience.
Staff at all levels above Clerk/Data Entry are sourced primarily from other financial institutions or internally.
Staff straight from high school were accepted into Clerk/Data Entry roles only. A small percentage of staff from TAFE or university are accepted into Supervisor and Manager roles.
What other channels and sources is your organisation considering for future recruitment? ((Data based on 39 organisations)
Respondents cite a number of sources including:
» graduates of the TAFE Cert IV of Financial Markets – Operations
» overseas agencies
» other industries e.g. accounting and IT
0%
10%
20%
30%
40%
50%
60%
70%
80%
Clerk/Data Entry Supervisor Manager Senior Operations Manager Executive
High school
TAFE/College
University
In-house
Other financial markets organisations
Non-financial markets organisations
Off-shore
Other
recruitment / retention / Salary

2011 AFMA OperAtiOns survey repOrt
16Please indicate which of the following are provided by your organisation as part of the induction process for new
operations staff? (Data based on 39 organisations)
Ninety-seven percent of organisations report that they provide organisational induction for all staff. Seventy-one percent provide operational-specific induction.
In-house mentoring programs are provided as part of the induction program in 64 percent of organisations, slightly up from 58 percent in the last survey.
Are there training and development opportunities in place that support career progression within operations for staff in
your organisation? (Data based on 39 organisations)
Overwhelmingly, 92 percent of organisations surveyed offer training and development opportunities to staff in operations.
0%
10%
20%
30%
40%
50%
60%
70%
80%
90%
100%
Organisational induction Operations-specific induction
AFMA Operations accreditation
Other private sector providers (e.g. Kaplan,
UK Securities & Investment IAQ accreditation)
Specific product training In-house mentoring Other
8%
Yes
92%
No
Knowledge / Education / Human resources

AustrAliAn FinAnciAl MArkets AssOciAtiOn
17If you answered ‘Yes’ to the previous question, do you believe that these programs are effective in retaining staff in
operational roles? (Data based on 39 organisations)
All organisations that offer training opportunities for staff report that the training programs are effective in retaining staff.
The purpose of asking salary ranges is to provide the Department of Innovation, Industry, Science and Research with
information that can be used to promote Australia as a regional operations and processing centre. Indicate the lowest
and highest salary packages (base + super) offered within your organisation? (Data based on 39 organisations)
Salary packages reported ranged from $25,000 for clerks/data entry staff to over $155,00 for operations executives. The salary ranges reported for different operations roles was too various to allow any meaningful statistics to be prepared.
recruitment / retention / Salary
8%
Yes
92%
No
2011 AFMA OperAtiOns survey repOrt
18 3. Operations activity – Products and Functions
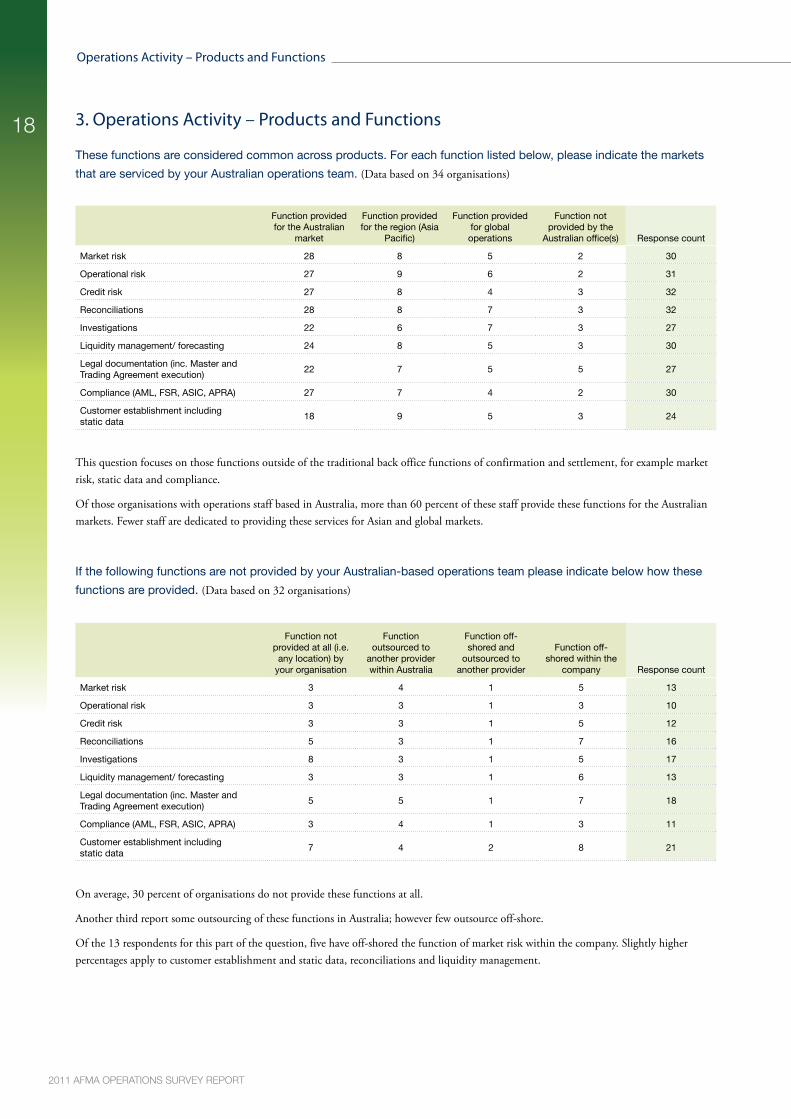
These functions are considered common across products. For each function listed below, please indicate the markets
that are serviced by your Australian operations team. (Data based on 34 organisations)
Function provided for the Australian
market
Function provided for the region (Asia
Pacific)
Function provided for global operations
Function not provided by the
Australian office(s) Response count
Market risk 28 8 5 2 30
Operational risk 27 9 6 2 31
Credit risk 27 8 4 3 32
Reconciliations 28 8 7 3 32
Investigations 22 6 7 3 27
Liquidity management/ forecasting 24 8 5 3 30
Legal documentation (inc. Master and Trading Agreement execution)
22 7 5 5 27
Compliance (AML, FSR, ASIC, APRA) 27 7 4 2 30
Customer establishment including static data
18 9 5 3 24
This question focuses on those functions outside of the traditional back office functions of confirmation and settlement, for example market risk, static data and compliance.
Of those organisations with operations staff based in Australia, more than 60 percent of these staff provide these functions for the Australian markets. Fewer staff are dedicated to providing these services for Asian and global markets.
If the following functions are not provided by your Australian-based operations team please indicate below how these
functions are provided. (Data based on 32 organisations)
Function not provided at all (i.e.
any location) by your organisation
Function outsourced to
another provider within Australia
Function off-shored and
outsourced to another provider
Function off-shored within the
company Response count
Market risk 3 4 1 5 13
Operational risk 3 3 1 3 10
Credit risk 3 3 1 5 12
Reconciliations 5 3 1 7 16
Investigations 8 3 1 5 17
Liquidity management/ forecasting 3 3 1 6 13
Legal documentation (inc. Master and Trading Agreement execution)
5 5 1 7 18
Compliance (AML, FSR, ASIC, APRA) 3 4 1 3 11
Customer establishment including static data
7 4 2 8 21
On average, 30 percent of organisations do not provide these functions at all.
Another third report some outsourcing of these functions in Australia; however few outsource off-shore.
Of the 13 respondents for this part of the question, five have off-shored the function of market risk within the company. Slightly higher percentages apply to customer establishment and static data, reconciliations and liquidity management.
Operations activity – Products and Functions

AustrAliAn FinAnciAl MArkets AssOciAtiOn
19Please indicate the markets and number of Australian-based operations employees ONLY servicing these. (Data based on 39 organisations)
Thirty percent of respondents have Australian-based staff supporting off-shore markets. Five organisations report total staff numbers of more than 200.
Forty-four percent of the total number of operations employees support off-shore markets. One organisation reported a significant number of Australian-based staff supporting Asian and European markets.
What is the total number of allocated resources within your Australian-based operations team by function? We are
interested in the equivalent number of fully allocated resources (100% utilisation of a person) rather that the number of
people that work on each function. For example 1 employee may work across 2 functions. Therefore, this person would
be a 0.5 resource on each. Please provide your best estimate of how your resources are divided across functions. (Data based on 34 organisations)
While some organisations report that the reconciliations function is now carried out off-shore, there are still considerable resources dedicated to this function in Australia. Two organisations have more than 15 staff dedicated to the function of reconciliations.
One organisation reports more than 15 staff undertaking market risk operations. Almost 35 percent of respondents have one or fewer staff allocated in Australia to the function of legal documentation.
0
5
10
15
20
25
Market risk Operational risk Credit risk Reconciliations Investigations Liquidity management/ forecasting
Legal documentation (inc. Master and Trading
Agreement execution)
Compliance (AML, FSR, ASIC, APRA)
Customer establishment
including static data
0-1
2-5
6-15
>15
0
5
10
15
20
25
30
35
40
Australian / NZ market Asian market European market North American market
0-10 Staff
11-25 Staff
26-50 staff
51-100 staff
100+ staff
Operations activity – Products and Functions

2011 AFMA OperAtiOns survey repOrt
20How do you expect these resource numbers to change in the next 12 months? ((Data based on 34 organisations)
A large majority of respondents expect the resource numbers to remain the same over the next 12 months. Twenty percent of respondents expect that more staff will be allocated to the management of operational risk.
This is generally consistent with in the results of the last survey; however in the last survey there was greater optimism about increasing staff numbers.
0% 10% 20% 30% 40% 50% 60% 70% 80% 90% 100%
Market risk
Operational risk
Credit risk
Reconciliations
Investigations
Liquidity management/forecasting
Legal documentation (inc. Master and Trading Agreement execution)
Compliance (AML, FSR, ASIC, APRA)
Customer establishment including static data
Increase
Stay the same
Decrease
Not applicable
Operations activity – Products and Functions

AustrAliAn FinAnciAl MArkets AssOciAtiOn
214. Products
4.1 agricultural Commodities
Does your organisation process agricultural commodities products in its operations area in Australia? (Data based on 33 organisations)
Five of 33 respondents report that they process agricultural commodities products in the operations team in Australia, slightly down from 8 in the last survey.
For each function listed below, please indicate which markets are serviced by the Australian operations team. (Data based on 5 organisations)
All respondents report that they carry out these functions in Australia for the Australian market and all but one also carry out these functions for the Asian and global markets. This suggests that Australia is seen as the preferred centre for the processing of this specialist product type.
85%
15%
Yes
No
0%
10%
20%
30%
40%
50%
60%
70%
80%
90%
Customer establishment including static data
Transactions capture Confirmation/ affirmation Rate sets Transaction settlement
Function provided for the Australian market
Function provided for the region (Asia Pacific)
Function provided for global operations
Function not provided by the Australian office
agricultural Commodities

2011 AFMA OperAtiOns survey repOrt
22If the following functions are not provided by your Australian Operations team please indicate below how these
functions are provided. (Data based on 2 organisations)
Only two of the five respondents who process agricultural commodities responded to this question. Both respondents report that functions not carried out in Australia are carried out at off-shore offices in the organisation. This is slightly inconsistent with the responses in the previous question; however it appears that one organisation that processes agricultural commodity products off-shores the above three functions.
What is the total number of allocated resources within your Australian-based operations team by function? (Data based on 4 organisations)
Only four organisations responded to this question. Three organisations report more than five staff in their Australian-based operations allocated to any one function.
0%
20%
40%
60%
80%
100%
120%
Customer establishment including static data
Transaction capture Confirmation/ affirmation Rate sets Transaction settlement
Function not provided at all (i.e. any location) by your organisation
Function outsourced to another provider within Australia
Function off-shored and outsourced to another provider
Function off-shored within the company
0
1
2
3
4
5
Customer establishment including static data
Transaction capture Confirmation/ affirmation Rate sets Transaction settlement
0-1
2-5
>5
Products

AustrAliAn FinAnciAl MArkets AssOciAtiOn
23How do you expect these numbers to change in the next 12 months? (Data based on 5 organisations)
No respondents expect these numbers to decrease in the next 12 months. Most expect that the numbers will either remain the same or increase.
Please indicate your annual transaction volume (1 July 2009 to 30 June 2010) for agricultural commodities. (Data based on 4 organisations)
The five respondents who process agricultural commodity transactions reported volumes range from 150 to 130,000 transactions per annum.
What level of STP (straight through processing) did you achieve with this volume? (Data based on 3 organisations)
Only one respondent reported an STP rate of higher than 90 percent. Others reported less than 50 percent. This is an increase from the previous survey where no respondents reported an STP rate of above 90 percent.
0% 10% 20% 30% 40% 50% 60% 70% 80% 90% 100%
Customer establishment including static data
Transaction capture
Confirmation/ affirmation
Rate sets
Transaction settlement
Increase
Stay the same
Decrease
Not Applicable
67%
33%
Less than 50%
91 – 100%
agricultural Commodities

2011 AFMA OperAtiOns survey repOrt
24 4.2 Debt
Does your organisation process debt products in its operations area in Australia? (Data based on 32 organisations)
Sixty-nine percent of respondents, or 22 organisations, process debt products in the operations area in Australia. This is a decrease from the last survey which reported 30 organisations.
For each function listed below, please indicate which markets are serviced by the Australian operations team. (Data based on 21 organisations)
Nearly all organisations undertake all functions for the Australian operations.
Almost half of the respondents also provide these functions for one or more off-shore offices.
0%
10%
20%
30%
40%
50%
60%
70%
80%
90%
100%
Customer establishment including static data
Transactions capture Confirmation/ affirmation Rate sets Transaction settlement
Function provided for the Australian market
Function provided for the region (Asia Pacific)
Function provided for global operations
Function not provided by the Australian office
69%
31%
Yes
No
Products
AustrAliAn FinAnciAl MArkets AssOciAtiOn
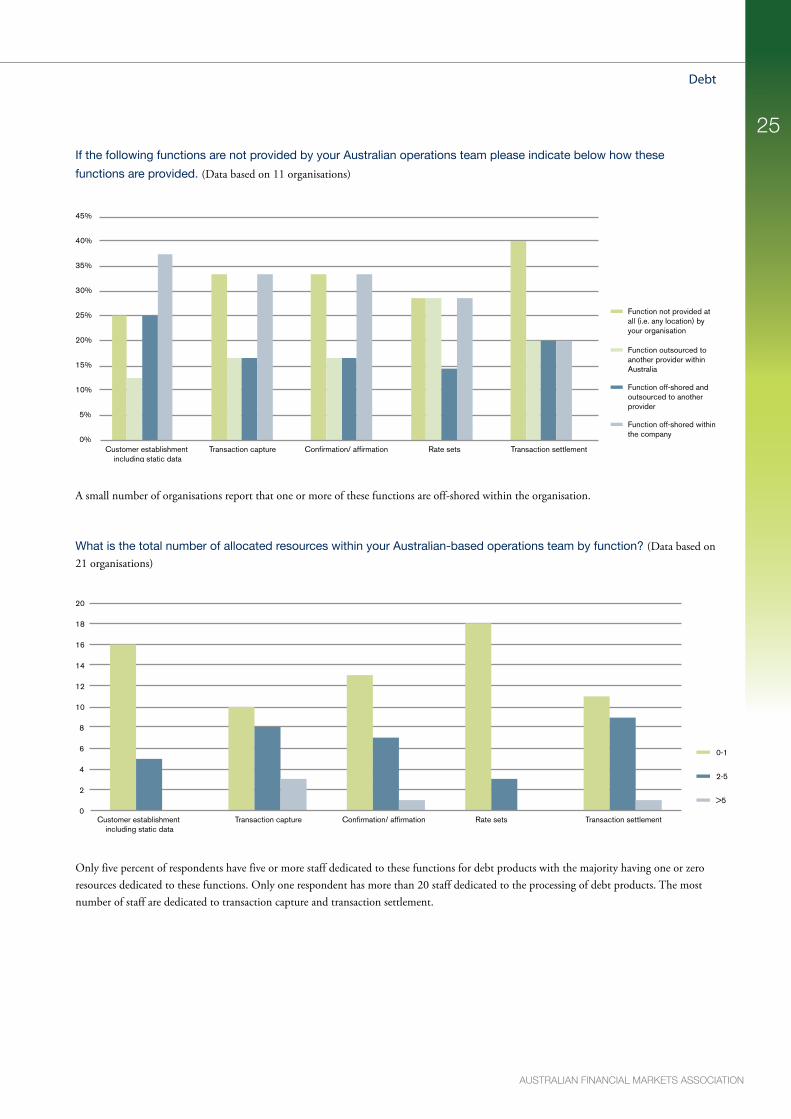
25If the following functions are not provided by your Australian operations team please indicate below how these
functions are provided. (Data based on 11 organisations)
A small number of organisations report that one or more of these functions are off-shored within the organisation.
What is the total number of allocated resources within your Australian-based operations team by function? (Data based on 21 organisations)
Only five percent of respondents have five or more staff dedicated to these functions for debt products with the majority having one or zero resources dedicated to these functions. Only one respondent has more than 20 staff dedicated to the processing of debt products. The most number of staff are dedicated to transaction capture and transaction settlement.
0%
5%
10%
15%
20%
25%
30%
35%
40%
45%
Customer establishment including static data
Transaction capture Confirmation/ affirmation Rate sets Transaction settlement
Function not provided at all (i.e. any location) by your organisation
Function outsourced to another provider within Australia
Function off-shored and outsourced to another provider
Function off-shored within the company
0
2
4
6
8
10
12
14
16
18
20
Customer establishment including static data
Transaction capture Confirmation/ affirmation Rate sets Transaction settlement
0-1
2-5
>5
Debt

2011 AFMA OperAtiOns survey repOrt
26How do you expect these numbers to change in the next 12 months? (Data based on 20 organisations)
A large majority of respondents expect that these numbers will not change. Fifteen percent of respondents however believe that resources allocated to transaction capture will increase.
Please indicate your annual transaction volume (1 July 2009 to 30 June 2010) for debt. (Data based on 21 organisations)
Volumes range from 50 to more than 100,000,000 transactions per annum.
What level of STP (straight through processing) did you achieve with this volume? (Data based on 20 organisations)
The majority of respondents achieve less than 50 percent STP for this product and volume. This is consistent with the results of the last survey.
0% 10% 20% 30% 40% 50% 60% 70% 80% 90% 100%
Customer establishment including static data
Transaction capture
Confirmation/ affirmation
Rate sets
Transaction settlement
Increase
Stay the same
Decrease
Not Applicable
65%
10%
15%
10%
Less than 50%
50 – 75%
76 – 90%
91 – 100%
Products

AustrAliAn FinAnciAl MArkets AssOciAtiOn
274.3 Energy
Does your organisation process energy (electricity, oil, gas) products in its operations area in Australia? (Data based on 31 organisations)
Forty-two percent of respondents, or 13 out of 31, process these products in Australia. This is consistent with the results of the last survey.
For each function listed below, please indicate which markets are serviced by the Australian operations team. (Data based on 13 organisations)
This question focuses on the traditional back office functions.
These functions are primarily carried out in Australia for the Australian activities.
Yes
No
42%
58%
0%
20%
40%
60%
80%
100%
120%
Customer establishment including static data
Transactions capture Confirmation/ affirmation Rate sets Transaction settlement
Function provided for the Australian market
Function provided for the region (Asia Pacific)
Function provided for global operations
Function not provided by the Australian office
Energy

2011 AFMA OperAtiOns survey repOrt
28If the following functions are not provided by your Australian operations team please indicate below how these
functions are provided. (Data based on 11 organisations)
Two organisations outsource these functions to another provider in Australia.
What is the total number of allocated resources within your Australian-based operations team by function? (Data based on 13 organisations)
All respondents report that the functions of confirmation and transaction settlement are carried out in Australia.
One organisation reports more than five staff dedicated to the function of confirmation.
0%
10%
20%
30%
40%
50%
60%
70%
80%
Customer establishment including static data
Transaction capture Confirmation/ affirmation Rate sets Transaction settlement
Function not provided at all (i.e. any location) by your organisation
Function outsourced to another provider within Australia
Function off-shored and outsourced to another provider
Function off-shored within the company
0
2
4
6
8
10
12
14
Customer establishment including static data
Transaction capture Confirmation/ affirmation Rate sets Transaction settlement
0-1
2-5
>5
Products

AustrAliAn FinAnciAl MArkets AssOciAtiOn
29How do you expect these numbers to change in the next 12 months? (Data based on 13 organisations)
Significantly, all respondents expect the numbers to remain the same.
Two respondents expect that staff numbers will increase specifically for transaction capture and transaction settlement.
Please indicate your annual transaction volume (1 July 2009 to 30 June 2010) for energy (electricity, oil, gas). (Data based on 10 organisations)
Volumes range from three transactions per week to more than 200,000,000 per annum.
What level of STP (straight through processing) did you achieve with this volume? (Data based on 10 organisations)
Six respondents report less than 50 percent STP for this product, with three reporting STP of higher than 91 percent. This is an increase from the last survey where no respondents reported an STP of greater than 91 percent.
0% 10% 20% 30% 40% 50% 60% 70% 80% 90% 100%
Customer establishment including static data
Transaction capture
Confirmation/ affirmation
Rate sets
Transaction settlement
Increase
Stay the same
Decrease
Not Applicable
60%
10%
30% Less than 50%
50 – 75%
91 – 100%
Energy
2011 AFMA OperAtiOns survey repOrt
30 4.4 Equities
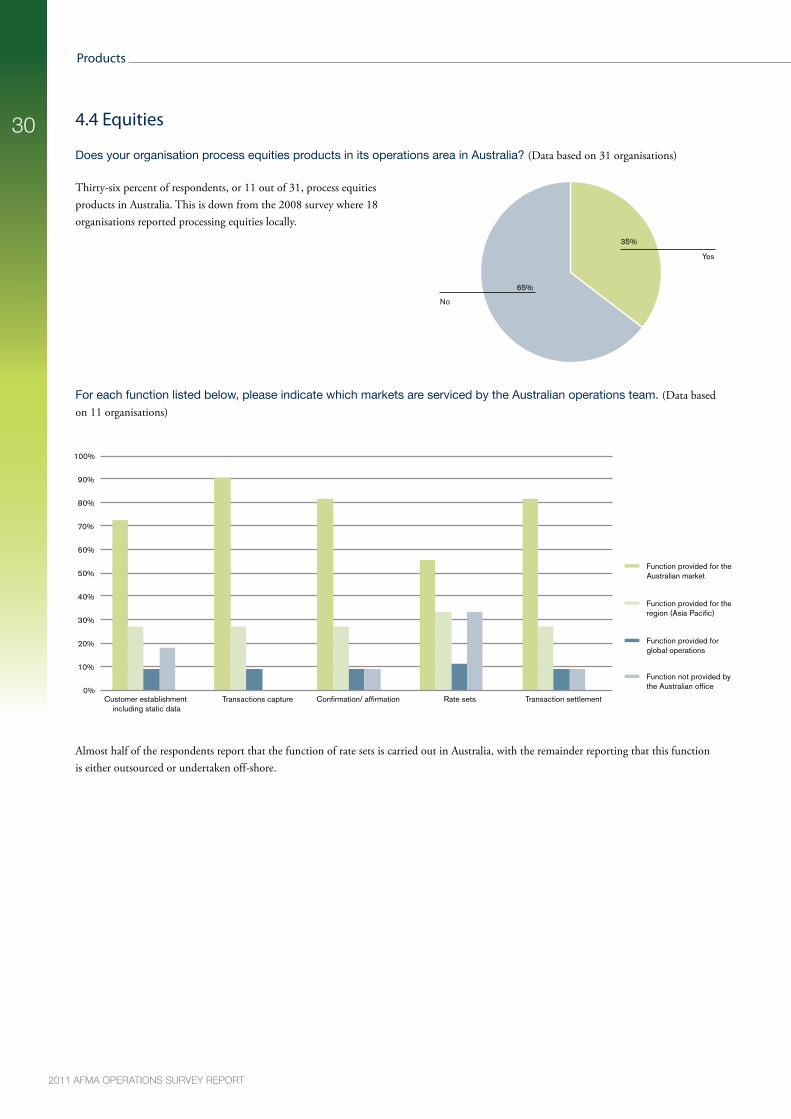
Does your organisation process equities products in its operations area in Australia? (Data based on 31 organisations)
Thirty-six percent of respondents, or 11 out of 31, process equities products in Australia. This is down from the 2008 survey where 18 organisations reported processing equities locally.
For each function listed below, please indicate which markets are serviced by the Australian operations team. (Data based on 11 organisations)
Almost half of the respondents report that the function of rate sets is carried out in Australia, with the remainder reporting that this function is either outsourced or undertaken off-shore.
35%
65%
Yes
No
0%
10%
20%
30%
40%
50%
60%
70%
80%
90%
100%
Customer establishment including static data
Transactions capture Confirmation/ affirmation Rate sets Transaction settlement
Function provided for the Australian market
Function provided for the region (Asia Pacific)
Function provided for global operations
Function not provided by the Australian office
Products

AustrAliAn FinAnciAl MArkets AssOciAtiOn
31If the following functions are not provided by your Australian operations team please indicate below how these
functions are provided. (Data based on 6 organisations)
One organisation reports that customer establishment is carried out off-shore but within the organisation. One organisation reports that customer establishment is off-shored and outsourced to another provider. Four organisations report that rate sets are not carried out in Australia.
What is the total number of allocated resources within your Australian-based operations team by function? (Data based on 11 organisations)
The highest number of staff are dedicated to static data despite three respondents reporting that this function is not carried out by the Australian operations. Few staff are allocated to the function of rate sets. This is consistent with results from the previous survey.
0%
20%
40%
60%
80%
100%
120%
Customer establishment including static data
Transaction capture Confirmation/ affirmation Rate sets Transaction settlement
Function not provided at all (i.e. any location) by your organisation
Function outsourced to another provider within Australia
Function off-shored and outsourced to another provider
Function off-shored within the company
0
1
2
3
4
5
6
7
8
9
Customer establishment including static data
Transaction capture Confirmation/ affirmation Rate sets Transaction settlement
0-1
2-5
<5
Equities

2011 AFMA OperAtiOns survey repOrt
32How do you expect these numbers to change in the next 12 months? (Data based on 11 organisations)
Most respondents expect these numbers to stay the same or to increase. No organisation expects a decrease in resources.
Please indicate your annual transaction volume (1 July 2009 to 30 June 2010) for equities. (Data based on 10 organisations)
Transaction volumes range from 100 per annum to 20,000,000 per annum.
What level of STP (straight through processing) did you achieve with this volume? (Data based on 10 organisations)
Sixty percent of respondents report STP of greater than 90 percent. This is an increase of 100 percent on the results of the last survey. Only two respondents (or 20 percent) report STP of less than 50 percent.
0% 10% 20% 30% 40% 50% 60% 70% 80% 90% 100%
Customer establishment including static data
Transaction capture
Confirmation/ affirmation
Rate sets
Transaction settlement
Increase
Stay the same
Decrease
Not Applicable
20%
20%
60%
Less than 50%
76 – 90%
91 – 100%
Products

AustrAliAn FinAnciAl MArkets AssOciAtiOn
334.5 Futures
Does your organisation process futures products in its operations area in Australia? (Data based on 31 organisations)
Sixty-eight percent of respondents, or 21 out of 31, process futures transactions in the Australian operations. This is considerably less than the previous survey where 30 organisations processed futures in the Australian operations.
For each function listed below, please indicate which markets are serviced by the Australian operations team. (Data based on 20 organisations)
Three of the 20 respondents provide transaction settlement for the Australian, Asian and global operations. None of the respondents provide any of the other functions for the global operations.
68%
32%
Yes
No
0%
10%
20%
30%
40%
50%
60%
70%
80%
90%
100%
Customer establishment including static data
Transactions capture Confirmation/ affirmation Rate sets Transaction settlement
Function provided for the Australian market
Function provided for the region (Asia Pacific)
Function provided for global operations
Function not provided by the Australian office
Futures

2011 AFMA OperAtiOns survey repOrt
34If the following functions are not provided by your Australian operations team please indicate below how these
functions are provided. (Data based on 15 organisations)
Of the 15 respondents, three outsource all of these functions to a provider in Australia.
What is the total number of allocated resources within your Australian-based operations team by function? (Data based on 20 organisations)
None of the respondents has more than five staff carrying out the function of operations for futures transactions. Seven of the 20 respondents report one or zero person undertaking all functions.
0%
10%
20%
30%
40%
50%
60%
70%
80%
Customer establishment including static data
Transaction capture Confirmation/ affirmation Rate sets Transaction settlement
Function not provided at all (i.e. any location) by your organisation
Function outsourced to another provider within Australia
Function off-shored and outsourced to another provider
Function off-shored within the company
0
2
4
6
8
10
12
14
16
Customer establishment including static data
Transaction capture Confirmation/ affirmation Rate sets Transaction settlement
0-1
2-5
>5
Products

AustrAliAn FinAnciAl MArkets AssOciAtiOn
35How do you expect these numbers to change in the next 12 months? (Data based on 20 organisations)
Nearly all respondents expect these numbers to remain the same in the next 12 months.
Please indicate your annual transaction volume (1 July 2009 to 30 June 2010) for futures. (Data based on 18 organisations)
Transaction volumes range from zero to 50,000,000 per annum.
What level of STP (straight through processing) did you achieve with this volume? (Data based on 17 organisations)
Slightly more than half of the organisations processing futures transactions have an STP rate of less than 50 percent. Four of the 17 respondents report STP of above 90 percent, which is an increase of 100 percent over the previous survey.
0% 10% 20% 30% 40% 50% 60% 70% 80% 90% 100%
Customer establishment including static data
Transaction capture
Confirmation/ affirmation
Rate sets
Transaction settlement
Increase
Stay the same
Decrease
Not Applicable
53%
6%
18%
23%
Less than 50%
50 – 75%
76 – 90%
91 – 100%
Futures

2011 AFMA OperAtiOns survey repOrt
36 4.6 Precious and Base metals
Does your organisation process precious and base metals products in its operations area in Australia? (Data based on 30 organisations)
Five of the 30 respondents process precious and base metals in Australia. This is a significant decline on the results of the previous survey where 12 organisations processed precious and base metals in Australia.
For each function listed below, please indicate which markets are serviced by the Australian operations team. (Data based on 5 organisations)
All functions are carried out in Australia with one or two organisations also carrying out this function for the Asian and global operations.
17%
83%
Yes
No
0%
20%
40%
60%
80%
100%
120%
Customer establishment including static data
Transactions capture Confirmation/ affirmation Rate sets Transaction settlement
Function provided for the Australian market
Function provided for the region (Asia Pacific)
Function provided for global operations
Function not provided by the Australian office
Products

AustrAliAn FinAnciAl MArkets AssOciAtiOn
37If the following functions are not provided by your Australian operations team please indicate below how these
functions are provided. (Data based on 3 organisations)
One organisation only reports that these functions are carried out by an off-shore team.
What is the total number of allocated resources within your Australian-based operations team by function? (Data based on 5 organisations)
Team sizes range from less than one full-time person to a team of seven in one organisation covering all processes.
0%
20%
40%
60%
80%
100%
120%
Customer establishment including static data
Transaction capture Confirmation/ affirmation Rate sets Transaction settlement
Function not provided at all (i.e. any location) by your organisation
Function outsourced to another provider within Australia
Function off-shored and outsourced to another provider
Function off-shored within the company
0
0.5
1
1.5
2
2.5
3
3.5
Customer establishment including static data
Transaction capture Confirmation/ affirmation Rate sets Transaction settlement
0-1
2-5
>5
Precious and Base metals

2011 AFMA OperAtiOns survey repOrt
38How do you expect these numbers to change in the next 12 months? (Data based on 5 organisations)
The expectation is that these numbers will remain unchanged in the coming 12 months.
Please indicate your annual transaction volume (1 July 2009 to 30 June 2010) for precious and base metals. (Data based on 5 organisations)
Volumes range from zero to 8,000 transactions per annum.
What level of STP (straight through processing) did you achieve with this volume? (Data based on 4 organisations)
Of the four respondents, one has STP of greater than 90 percent. The remainder are less than 50 percent.
0% 10% 20% 30% 40% 50% 60% 70% 80% 90% 100%
Customer establishment including static data
Transaction capture
Confirmation/ affirmation
Rate sets
Transaction settlement
Increase
Stay the same
Decrease
Not Applicable
75%
25%
Less than 50%
91 – 100%
Products

AustrAliAn FinAnciAl MArkets AssOciAtiOn
394.7 OTC Financial markets
Does your organisation process OTC financial markets products in its operations area in Australia? (Data based on 30 organisations)
Twenty-two of the 30 respondents report that they process OTC products in their Australian operations.
For each function listed below, please indicate which markets are serviced by the Australian operations team. (Data based on 22 organisations)
Three organisations report that customer establishment is carried out off-shore. The majority of the functions are carried out in Australia with one organisation basing the Asian and global operations in Australia.
73%
27%
Yes
No
0%
20%
40%
60%
80%
100%
120%
Customer establishment including static data
Transactions capture Confirmation/ affirmation Rate sets Transaction settlement
Function provided for the Australian market
Function provided for the region (Asia Pacific)
Function provided for global operations
Function not provided by the Australian office
OTC Financial markets

2011 AFMA OperAtiOns survey repOrt
40If the following functions are not provided by your Australian operations team please indicate below how these
functions are provided. (Data based on 17 organisations)
Of those organisations that do not provide these functions in Australia, all but one have off-shore operations for the processing of OTC financial markets products.
What is the total number of allocated resources within your Australian-based operations team by function? (Data based on 22 organisations)
Many team sizes are small, that is less than five persons, although two organisations report large teams processing OTC financial products.
0%
10%
20%
30%
40%
50%
60%
70%
80%
Customer establishment including static data
Transaction capture Confirmation/ affirmation Rate sets Transaction settlement
Function not provided at all (i.e. any location) by your organisation
Function outsourced to another provider within Australia
Function off-shored and outsourced to another provider
Function off-shored within the company
0
2
4
6
8
10
12
14
16
18
Customer establishment including static data
Transaction capture Confirmation/ affirmation Rate sets Transaction settlement
0-1
2-5
>5
Products

AustrAliAn FinAnciAl MArkets AssOciAtiOn
41How do you expect these numbers to change in the next 12 months? (Data based on 22 organisations)
The expectation is that the resource numbers will remain the same.
Please indicate your annual transaction volume (1 July 2009 to 30 June 2010) for OTC financial markets. (Data based on 21 organisations)
Volumes in OTC financial markets products range from 50 transactions per annum to 1,000,000,000 per annum.
What level of STP (straight through processing) did you achieve with this volume? (Data based on 20 organisations)
Seventy-five percent of respondents report STP of less than 50 percent. None of the organisations that answered this question has STP of 90 percent.
0% 10% 20% 30% 40% 50% 60% 70% 80% 90% 100%
Customer establishment including static data
Transaction capture
Confirmation/ affirmation
Rate sets
Transaction settlement
Increase
Stay the same
Decrease
Not Applicable
75%
15%
10%
Less than 50%
50 – 75%
76 – 90%
OTC Financial markets

2011 AFMA OperAtiOns survey repOrt
42 4.8 OTC Equities
Does your organisation process OTC equity derivatives products in its operations area in Australia? (Data based on 30 organisations)
Five organisations report that they process OTC equity derivatives products in Australia.
For each function listed below, please indicate which markets are serviced by the Australian operations team. (Data based on 6 organisations)
All respondents carry out these functions in Australia with one organisation also processing transactions for Asian and global operations.
Yes
No
17%
83%
0%
10%
20%
30%
40%
50%
60%
70%
80%
Customer establishment including static data
Transactions capture Confirmation/ affirmation Rate sets Transaction settlement
Function provided for the Australian market
Function provided for the region (Asia Pacific)
Function provided for global operations
Function not provided by the Australian office
Products

AustrAliAn FinAnciAl MArkets AssOciAtiOn
43If the following functions are not provided by your Australian operations team please indicate below how these
functions are provided. (Data based on 3 organisations)
One organisation reported that customer establishment is carried out off-shore by another provider.
What is the total number of allocated resources within your Australian-based operations team by function? (Data based on 6 organisations)
Staff numbers range from 1 person to a team of 13 in one organisation.
0%
20%
40%
60%
80%
100%
120%
Customer establishment including static data
Transaction capture Confirmation/ affirmation Rate sets Transaction settlement
Function not provided at all (i.e. any location) by your organisation
Function outsourced to another provider within Australia
Function off-shored and outsourced to another provider
Function off-shored within the company
0
1
2
3
4
5
6
Customer establishment including static data
Transaction capture Confirmation/ affirmation Rate sets Transaction settlement
0-1
2-5
>5
OTC Equities

2011 AFMA OperAtiOns survey repOrt
44How do you expect these numbers to change in the next 12 months? (Data based on 6 organisations)
All six respondents expect resources to remain largely unchanged.
Please indicate your annual transaction volume (1 July 2009 to 30 June 2010) for OTC equity derivatives. (Data based on 5 organisations)
Transaction volumes range from 60 per annum to 2,500 per annum.
What level of STP (straight through processing) did you achieve with this volume? (Data based on 5 organisations)
All respondents report STP of less than 50 percent.
0% 10% 20% 30% 40% 50% 60% 70% 80% 90% 100%
Customer establishment including static data
Transaction capture
Confirmation/ affirmation
Rate sets
Transaction settlement
Increase
Stay the same
Decrease
Not Applicable
Less than 50%
100%
Products
AustrAliAn FinAnciAl MArkets AssOciAtiOn
454.9 OTC Credit Derivatives
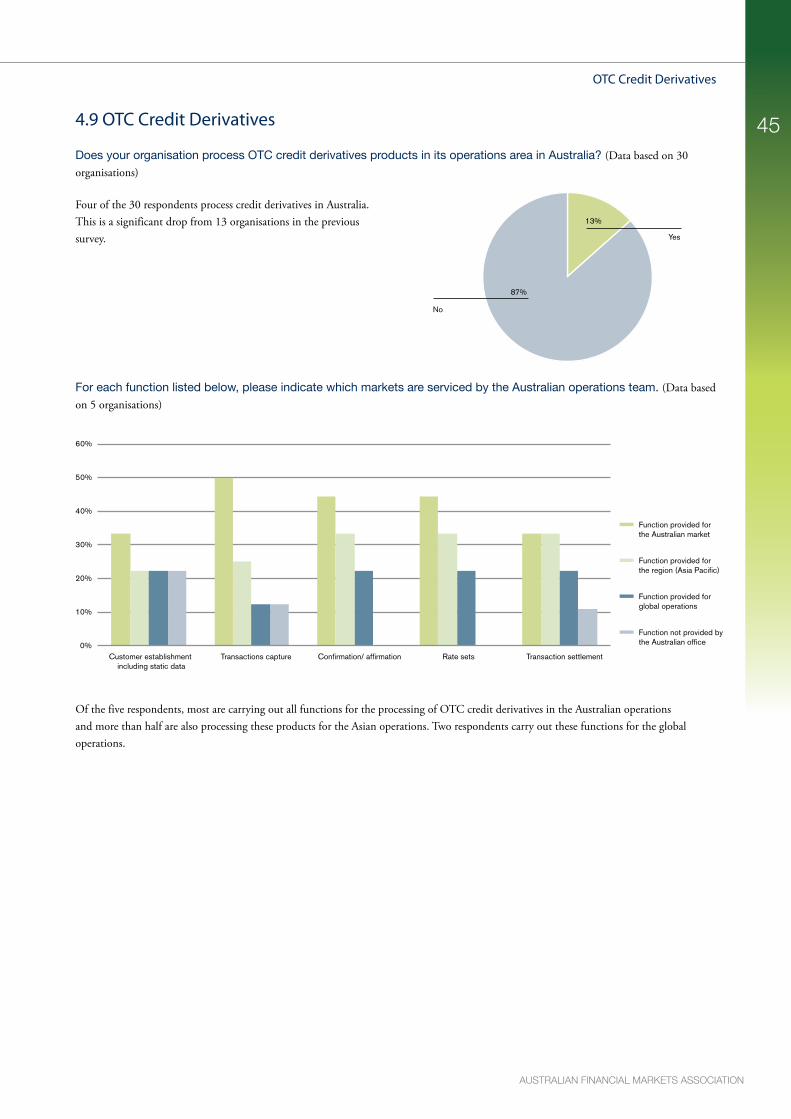
Does your organisation process OTC credit derivatives products in its operations area in Australia? (Data based on 30 organisations)
Four of the 30 respondents process credit derivatives in Australia. This is a significant drop from 13 organisations in the previous survey.
For each function listed below, please indicate which markets are serviced by the Australian operations team. (Data based on 5 organisations)
Of the five respondents, most are carrying out all functions for the processing of OTC credit derivatives in the Australian operations and more than half are also processing these products for the Asian operations. Two respondents carry out these functions for the global operations.
Yes
No
13%
87%
0%
10%
20%
30%
40%
50%
60%
Customer establishment including static data
Transactions capture Confirmation/ affirmation Rate sets Transaction settlement
Function provided for the Australian market
Function provided for the region (Asia Pacific)
Function provided for global operations
Function not provided by the Australian office
OTC Credit Derivatives

2011 AFMA OperAtiOns survey repOrt
46If the following functions are not provided by your Australian operations team please indicate below how these
functions are provided. (Data based on 3 organisations)
In line with the previous question, most functions for credit derivatives are being carried out in Australia. One organisation reports that some of these functions occur in an off-shore location.
What is the total number of allocated resources within your Australian-based operations team by function? (Data based on 5 organisations)
Three of the five respondents report that they have three or more staff in credit derivatives operations.
0%
20%
40%
60%
80%
100%
120%
Customer establishment including static data
Transaction capture Confirmation/ affirmation Rate sets Transaction settlement
Function not provided at all (i.e. any location) by your organisation
Function outsourced to another provider within Australia
Function off-shored and outsourced to another provider
Function off-shored within the company
0
1
2
3
4
5
6
Customer establishment including static data
Transaction capture Confirmation/ affirmation Rate sets Transaction settlement
0-1
2-5
>5
Products

AustrAliAn FinAnciAl MArkets AssOciAtiOn
47How do you expect these numbers to change in the next 12 months? (Data based on 4 organisations)
All respondents report that they believe these numbers will not change in the next 12 months.
Please indicate your annual transaction volume (1 July 2009 to 30 June 2010) for OTC credit derivatives. (Data based on 5 organisations)
Transaction volumes range from 50 per annum to 1,000 per annum.
What level of STP (straight through processing) did you achieve with this volume? (Data based on 4 organisations)
One organisation reports an STP rate of more than 90 percent.
0% 10% 20% 30% 40% 50% 60% 70% 80% 90% 100%
Customer establishment including static data
Transaction capture
Confirmation/ affirmation
Rate sets
Transaction settlement
Increase
Stay the same
Decrease
Not Applicable
Less than 50%
50 – 75%
91 – 100%
50%
25%
25%
OTC Credit Derivatives

2011 AFMA OperAtiOns survey repOrt
48 4.10 OTC interest rate Derivatives
Does your organisation process OTC interest rate derivatives products in its operations area in Australia? (Data based on 30 organisations)
Fourteen of the 30 respondents process OTC interest rate derivatives in Australia. This is a decrease from 2008 when 33 organisations reported that they tprocess OTC interest rate derivatives in their Australian operations.
For each function listed below, please indicate which markets are serviced by the Australian operations team. (Data based on 14 organisations)
Four of the 14 respondents report that customer establishment for interest rate derivatives is carried out off-shore. Processing for other functions is predominantly carried out in Australia with two to three organisations also processing transactions for the Asian and global operations.
Yes
No 47%
53%
0%
10%
20%
30%
40%
50%
60%
70%
80%
Customer establishment including static data
Transactions capture Confirmation/ affirmation Rate sets Transaction settlement
Function provided for the Australian market
Function provided for the region (Asia Pacific)
Function provided for global operations
Function not provided by the Australian office
Products

AustrAliAn FinAnciAl MArkets AssOciAtiOn
49If the following functions are not provided by your Australian operations team please indicate below how these
functions are provided. (Data based on 9 organisations)
Those functions not carried out in Australia are carried out off-shore for the Australian operation.
What is the total number of allocated resources within your Australian-based operations team by function? (Data based on 14 organisations)
Four organisations report team sizes in excess of 17 staff. The least amount of staff are assigned to customer establishment and static data. This is consistent with previous question(s) that report this function has been moved off-shore in some organisations.
0%
20%
40%
60%
80%
100%
120%
Customer establishment including static data
Transaction capture Confirmation/ affirmation Rate sets Transaction settlement
Function not provided at all (i.e. any location) by your organisation
Function outsourced to another provider within Australia
Function off-shored and outsourced to another provider
Function off-shored within the company
0
2
4
6
8
10
12
Customer establishment including static data
Transaction capture Confirmation/ affirmation Rate sets Transaction settlement
0-1
2-5
>5
OTC interest rate Derivatives

2011 AFMA OperAtiOns survey repOrt
50How do you expect these numbers to change in the next 12 months? (Data based on 14 organisations)
The majority of respondents believe that the numbers will remain the same.
Please indicate your annual transaction volume (1 July 2009 to 30 June 2010) for OTC interest rate derivatives. (Data based on 14 organisations)
Transaction volumes range from 144 per annum to 5,000,000,000 per annum.
What level of STP (straight through processing) did you achieve with this volume? (Data based on 13 organisations)
Only five of the eight respondents report STP of greater than 50 percent.
0% 10% 20% 30% 40% 50% 60% 70% 80% 90% 100%
Customer establishment including static data
Transaction capture
Confirmation/ affirmation
Rate sets
Transaction settlement
Increase
Stay the same
Decrease
Not Applicable
Less than 50% 50 – 75%
76 – 90%
62% 23%
15%
Products

AustrAliAn FinAnciAl MArkets AssOciAtiOn
514.11 money market
Does your organisation process money market products in its operations area in Australia? (Data based on 30 organisations)
Seventeen out of 30 respondents process money market transactions in Australia.
For each function listed below, please indicate which markets are serviced by the Australian operations team. (Data based on 16 organisations)
Most functions are carried out in Australia by the Australian operations team. Of the 16 respondents, two to three organisations also provide these services for Asian and global operations.
Yes
No
57%
43%
0%
10%
20%
30%
40%
50%
60%
70%
80%
Renegotiation Transaction capture Confirmation/ affirmation Transaction settlement
Function provided for the Australian market
Function provided for the region (Asia Pacific)
Function provided for global operations
Function not provided by the Australian office
money market

2011 AFMA OperAtiOns survey repOrt
52If the following functions are not provided by your Australian operations team please indicate below how these
functions are provided. (Data based on 6 organisations)
Two of the six respondents report that transaction capture and confirmation is carried out off-shore for the Australian function.
What is the total number of allocated resources within your Australian-based operations team by function? (Data based on 15 organisations)
Three organisations report a team size of more than 10 staff covering all functions. Fewer staff are assigned to the function of renegotiation.
0%
20%
40%
60%
80%
100%
120%
Renegotiation Transaction capture Confirmation/ affirmation Transaction settlement
Function not provided at all (i.e. any location) by your organisation
Function outsourced to another provider within Australia
Function off-shored and outsourced to another provider
Function off-shored within the company
0
2
4
6
8
10
12
14
Renegotiation Transaction capture Confirmation/affirmation Transaction settlement
0-1
2-5
>5
Products
AustrAliAn FinAnciAl MArkets AssOciAtiOn
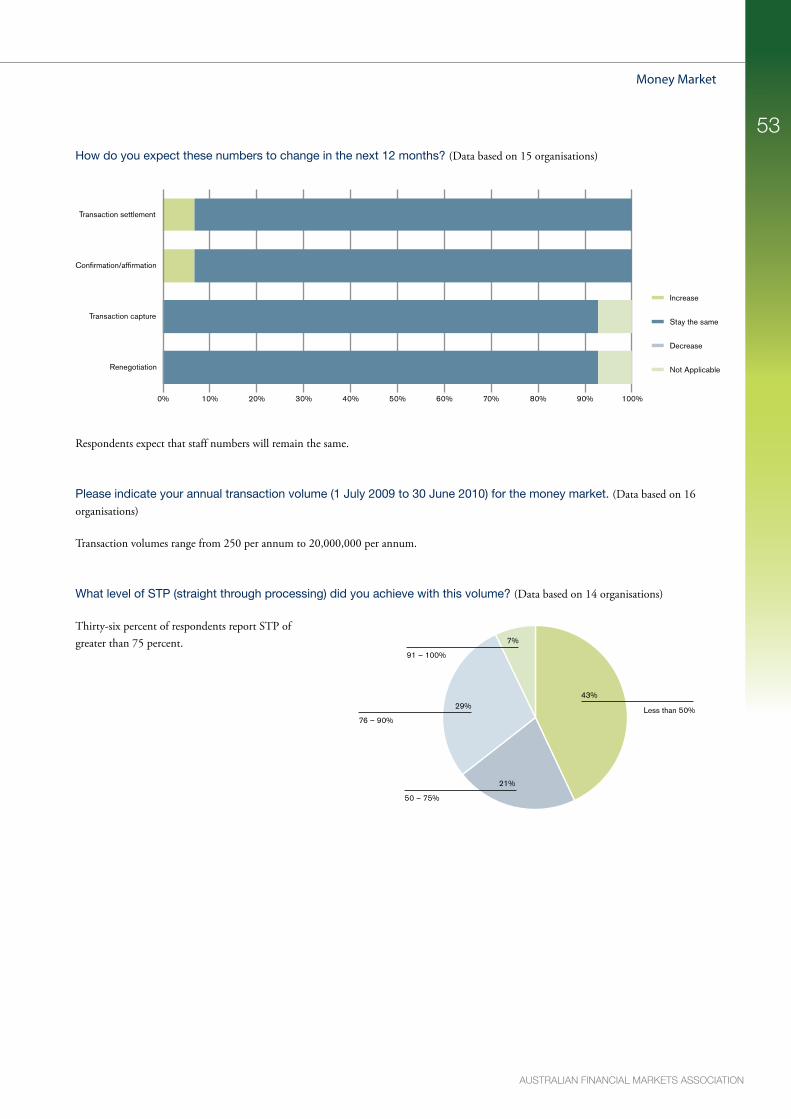
53How do you expect these numbers to change in the next 12 months? (Data based on 15 organisations)
Respondents expect that staff numbers will remain the same.
Please indicate your annual transaction volume (1 July 2009 to 30 June 2010) for the money market. (Data based on 16 organisations)
Transaction volumes range from 250 per annum to 20,000,000 per annum.
What level of STP (straight through processing) did you achieve with this volume? (Data based on 14 organisations)
Thirty-six percent of respondents report STP of greater than 75 percent.
0% 10% 20% 30% 40% 50% 60% 70% 80% 90% 100%
Renegotiation
Transaction capture
Confirmation/affirmation
Transaction settlement
Increase
Stay the same
Decrease
Not Applicable
Less than 50%
50 – 75%
76 – 90%
91 – 100%
43%
21%
29%
7%
money market

2011 AFMA OperAtiOns survey repOrt
54 4.12 managed Funds
Does your organisation process managed funds products in its operations area in Australia? (Data based on 30 organisations)
None of the surveyed respondents processes managed funds products in Australia.
5. Off-shoring
Has your organisation sought to off-shore any operations functions within the past five years? (Data based on 30 organisations)
Eighty-three percent of respondents reported that they had sought to off-shore operations functions in the last five years.
Five of the 30 respondents state that they have sought to off-shore operations functions to various Asian locations including Mumbai, Singapore and China.
No
83%
17%
Yes
Less than 50%
100%
Products

AustrAliAn FinAnciAl MArkets AssOciAtiOn
55What factors do you believe to be the most important in determining an off-shoring location? (Data based on 30 organisations)
The following table lists the key comments sorted in themes as provided by respondents. Cost appears to be the dominant driver for determining whether functions can be undertaken in an off-shore location.
Cost » Costs of operations
» Tax advantages
People » Skill set
» Sustainable educated workforce
» Language skills
» Vast recruitment opportunities
» Expert service opportunity
» Quality customer service
Stability / Infrastructure » Technology development
Location and Time Zone » Location of key third parties
» Global support
» Political and economic stability
Process Improvement » Accuracy
» Efficiency
» Standardisation of processes
Considering those factors you listed above, what do you believe are Australia’s greatest strengths as a location for
operations activities? (Data based on 30 organisations)
The following table lists the key comments sorted in themes as provided by respondents. The availability of an educated and skilled workforce is recognised as a driver for moving functions off-shore; however the quality, experience and expertise of staff available in Australia is presented as a key strength for the Australian market.
People » Availability of knowledgeable and skilled staff
» Sustainable and educated workforce
» Quality candidates
» Ability to provide quick response times
» Language skills
» Work ethic
» Lifestyle
Stability / Infrastructure » Well-developed legal and regulatory framework
Location and Time Zone » Time zone advantages
» Proximity
Process Improvement » Service delivery
Off-shoring

2011 AFMA OperAtiOns survey repOrt
56
Considering those factors you listed above, what do you believe are the greatest inhibitors to conducting operations
activities in Australia? (Data based on 30 organisations)
Consistent with the answers above respondents cite costs as the key inhibitor for conducting operations in Australia. It is also recognised that the need to have a greater, more time-effective and efficient presence in Asia presents an additional inhibiting factor to conducting operations activities in Australia.
Cost » Costs
» Tax rates
» Cost of labour
» Strong AUD
People » Knowledge of overseas markets
» Relatively small number of resources available compared to other locations
Time Zone » Time zone
» Proximity
» Competition with Hong Kong
Is your organisation considering off-shoring operations functions (in addition to any that are already off-shore) in the
coming 12 months? (Data based on 30 organisations)
Ten percent or 3 out of 30 respondents report that they are considering off-shoring in the next 12 months.
What are the primary reasons for seeking to off-shore these functions? (Data based on 3 organisations)
The three organisations that responded to this question all cite costs and tax savings as key drivers.
Yes
No
10%
90%
Off-shoring

AustrAliAn FinAnciAl MArkets AssOciAtiOn
57What factors would incentivise your organisation to maintain those operations functions in Australia? (Data based on 3 organisations)
The three organisations suggest that tax advantages would incentivise the organisation to maintain operations functions in Australia. One respondent cites the need to develop a super regional centre in Australia with extended operations.
Is your organisation considering establishing any new operations functions in Australia, or bringing functions currently
conducted off-shore to Australia, in the coming 12 months? (Data based on 30 organisations)
Only one of the 30 respondents is considering establishing new operations functions in Australia.
What factors do you believe to be the most important in determining whether to establish operations functions in
Australia? (Data based on 1 organisation)
This single respondent states that costs and time zone are the important determinants. This response is consistent with the feedback above.
Yes
No
3%
97%
Off-shoring

2011 AFMA OperAtiOns survey repOrt
58
about aFma
The dynamic financial markets in Australia reflect many years of innovation and development, and are among the fastest growing and most sophisticated in Asia. Australia’s financial markets collectively turned over approximately $128 trillion in 2011. The major markets in the Australian financial system include the capital markets (shares and bonds), money market and derivatives markets. There are also other markets in the financial system that facilitate the trading of specific financial products such as electricity derivatives.
AFMA represents over 140 members, including Australian and international banks, leading brokers, securities companies, state government treasury corporations, fund managers, traders in electricity and other specialised markets and industry service providers.
Promoting market Efficiency
market Governance
AFMA’s key mandate is to promote best practice in financial markets so they can continue to maximise their contribution to the economic health of Australia. One of the key tasks we perform to achieve this objective is to ensure the sound management of Australia’s $78 trillion off-exchange or over-the-counter (OTC) markets.We achieve this by promoting effective self-regulation of the OTC markets through efficient and ethical market practices, conventions and standard documentation.
Financial Operations
AFMA’s market governance role is complemented by the development of widely-accepted industry standards for transactional processing. This ensures that operational aspects of financial transactions, in particular confirmation, settlement, reconciliation and risk management processes are globally recognised best practice.
Promoting market integrity
AFMA recognises the importance of efficient regulation to inspire investor confidence in our markets, and in this regard plays a leading role in providing industry input to the government and regulators on public policy matters relevant to the financial
markets. We seek to ensure that government regulation of the financial sector is firm enough to inspire investor confidence yet flexible enough to allow the markets to grow to their full potential. Official regulation is under-pinned by AFMA’s conventions and other standards which promote best practice.
Promoting market Professionalism
AFMA encourages high standards of professional conduct in financial markets by delivering professional development and accreditation programs to improve individual expertise in OTC and exchange-traded markets. AFMA accords accreditation, recognised by the markets regulator ASIC, to individuals who achieve the required levels of competence.
aFma’s mission
To advance the interests of our members, AFMA’s mission is to:
– Lead and sustain effective self regulation of the over-the-counter financial markets
– Represent market participants in exchange-traded markets to ensure market processes and their regulation are effective and efficient
– Encourage high standards of professional conduct in financial markets
– Deliver professional development and accreditation programs to improve individual expertise
– Develop new markets for financial products and encourage existing markets to reach their full potential
– Promote Australia as a significant global centre for financial services, including operations service centres
– Promote government policies and business conditions that support a strong financial sector
– Maximise opportunities for members to grow their business and contribute to the economic well being of Australia
The Australian Financial Markets Association (AFMA) is the leading industry association promoting efficiency,
integrity and professionalism in Australia’s exchange traded and OTC financial markets and provides leadership
in advancing the interests of all market participants. These markets are an essential element of the economy and
perform the vital function of facilitating the efficient use of capital and management of risk. Market participants
perform a range of important roles within these markets, including financial intermediation and market making.

59
Disclaimer: Whilst every care has been taken by aFma in preparing the content of this report, the content covered is not intended nor should it be relied upon as a
substitute for other appropriate professional advice, and aFma will not be liable for errors or omissions in the content, or for any consequences resulting from any errors
or omissions, including any loss resulting from reliance on this content.
Copyright: © australian Financial markets association – 2011. This report is subject to copyright. all or part of it can be reproduced for bona fide research or public policy
purposes with appropriate acknowledgement of the australian Financial markets association.
level 3, 95 Pitt Street Sydney nSW 2000 GPO Box 3655 Sydney nSW 2001Telephone: + 61 2 9776 7955 Fascimile: + 61 2 9776 4488 Email: [email protected]
australian Financial markets association

www.afma.com.au