2011 fish dependence
TRANSCRIPT
8/6/2019 2011 Fish Dependence
http://slidepdf.com/reader/full/2011-fish-dependence 1/36
Fish Dependence – 2011 Update
The increasing reliance o the EUon fsh rom elsewhere

8/6/2019 2011 Fish Dependence
http://slidepdf.com/reader/full/2011-fish-dependence 2/36
nef is an independent think-and-do tank that inspires and demonstrates
real economic well-being.
We aim to improve quality o lie by promoting innovative solutions that
challenge mainstream thinking on economic, environmental and social
issues. We work in partnership and put people and the planet frst.
nef (the new economics oundation) is a registered charity ounded in 1986 by the leaders o The Other Economic Summit (TOES),which orced issues such as international debt onto the agenda o the G8 summit meetings. It has taken a lead in helping establishnew coalitions and organisations such as the Jubilee 2000 debt campaign; the Ethical Trading Initiative; the UK Social InvestmentForum; and new ways to measure social and economic well-being.
OCEAN2012 is an alliance o organisations dedicated to transorming
European Fisheries Policy to stop overfshing, end destructive fshingpractices and deliver air and equitable use o healthy fsh stocks.
OCEAN2012 was initiated, and is co-ordinated, by the Pew Environment
Group, the conservation arm o The Pew Charitable Trusts, a non-
governmental organisation working to end overfshing in the world´s
oceans.
The steering group o OCEAN2012 consists o the Coalition or
Fair Fisheries Arrangements, Ecologistas en Acción, The Fisheries
Secretariat, nef (new economics oundation), the Pew Environment
Group and Seas At Risk.

8/6/2019 2011 Fish Dependence
http://slidepdf.com/reader/full/2011-fish-dependence 3/36
Contents
Preface 2
Executive summary 3
Introduction 5
Background 6
Methodology 10
Results 16
Discussion and implications 20
Conclusions 24
Appendix 25
Endnotes 27

8/6/2019 2011 Fish Dependence
http://slidepdf.com/reader/full/2011-fish-dependence 4/36Fish Dependence – 2011 Update 2
This updated report includes:
P a comparison between the 2011 and 2010 results, illustrating the extent towhich the EU is becoming ever more dependent on fsh rom other regions;
P new shares o catch in non-EU waters or the United Kingdom, Denmark,Sweden, Germany and the Netherlands.
All the updated inormation is explained in the relevant sections.
In the coming years it is our intention to provide an annual update and so we wouldwelcome suggestions on how to improve the content and look o this work.
Preface
This is an update o the Fish Dependence report published inJuly 2010. It includes fgures or sel-sufciency levels and fshdependence days in 2011 or all EU27 Member States.
8/6/2019 2011 Fish Dependence
http://slidepdf.com/reader/full/2011-fish-dependence 5/36Fish Dependence – 2011 Update 3
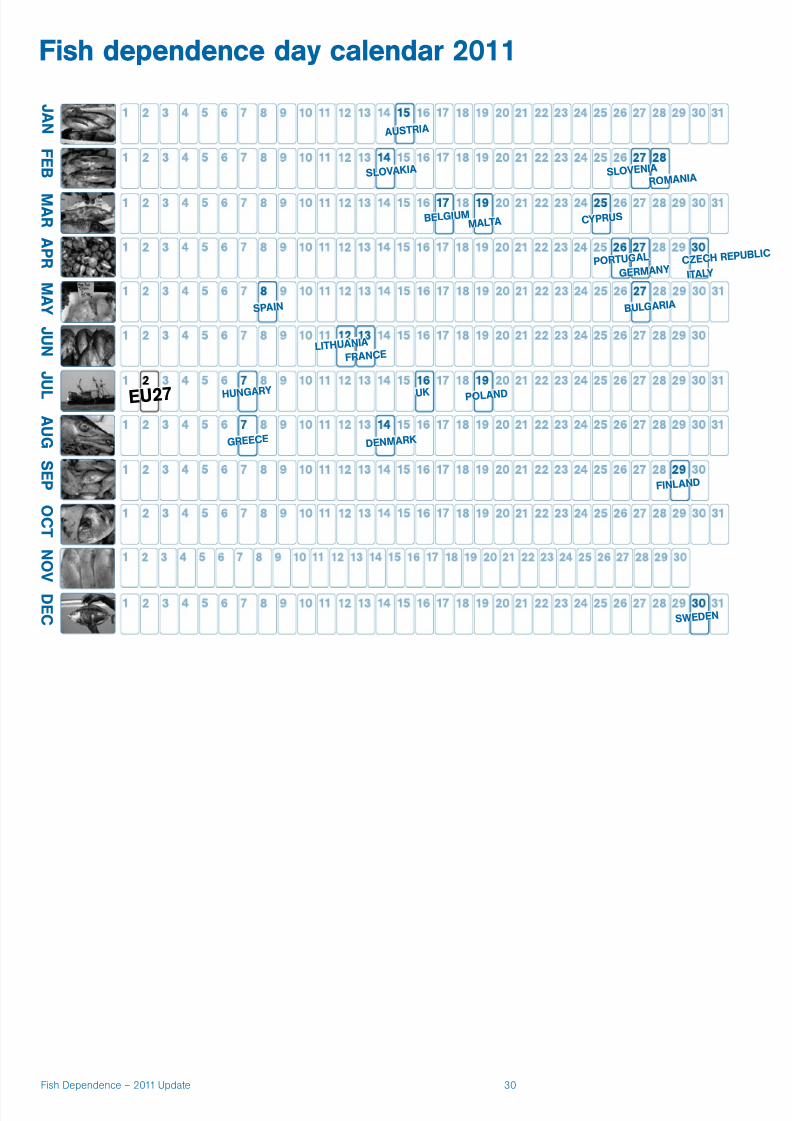
nef (the new economics oundation) has estimated the degree o ‘sel-sufciency’in fsh consumption achieved by the EU as a whole and or each o its MemberStates; sel-sufciency is defned as the capacity o EU Member States to meetdemand or fsh rom their own waters. We have expressed the degree o sel-sufciency in the orm o a ‘fsh dependence day’. Based on a Member State’s orregion’s total annual fsh consumption, the fsh dependency day is the date in thecalendar when it would start to depend on fsh rom elsewhere because its ownsupplies were depleted.
For the EU as a whole this is now 2 July, indicating that one-hal o fsh consumedin the EU is sourced rom non-EU waters. Last year it was 9 July, which indicatesthat there has been a urther decline o almost 200,000 tonnes o fsheries productsover 12 months. Since 2000, the EU’s fsh dependence day has allen earlier andearlier in the year and is now more than one month earlier than in 2000, revealing acontinuously increasing level o fsh dependence.
O course, Member States with little or no access to EU waters, such as Austria,Slovakia and Slovenia, become fsh dependent earlier in the year. Surprisingly,though, this is also the case or some Member States with greater access to EUwaters. These include Spain, Portugal, Italy, Germany and France – all o whomsource more than one-hal o their fsh rom non-EU waters.
Our calculations include domestic aquaculture (fsh arming) in EU countries, agrowing enterprise that has served to marginally oset the overexploitation o EU
fsh stocks but has not halted or reversed the upward trend in fsh dependence.I we discount aquaculture, the EU’s fsh dependence day moves orward to 7June; or big aquaculture producers such as Spain, France, Italy and Greece, theirrespective national fsh dependence day would occur more than one month earlier.
In a context o fnite resources and growing populations, the current EU modelis unsustainable. The EU’s increasing fsh dependence has implications orthe sustainability o fsh stocks globally, which are also overfshed, and or thecommunities that depend on them.
The main message o this report is that rising fsh consumption in a context odeclining stocks is environmentally unviable and socially unair. The EU has highlyproductive waters that have the potential to sustain a long-term and stable supplyo fsh, jobs and related social and economic benefts, but only i its fsh resourcesare managed responsibly.
The reorm o the EU’s Common Fisheries Policy (CFP) oers a perect opportunityto put the structures in place to turn this situation around. To transorm the
Executive summary
European Union (EU) fsh stocks are in an unprecedentedly poorstate yet fsh consumption throughout Europe remains high.The EU has been able to maintain and even expand its levels oconsumption by sourcing fsh rom other regions o the globe, boththrough the catches o its distant-water eet and imports. This reporthighlights Europe’s increasing reliance on fsh products originatingrom external waters or its fsh supplies, and provides pointerstowards a more sustainable uture or dwindling global fsh stocks.

8/6/2019 2011 Fish Dependence
http://slidepdf.com/reader/full/2011-fish-dependence 6/36Fish Dependence – 2011 Update 4
management o the EU’s marine resources, the new CFP needs to provide a policyramework that will restore marine ecosystems to healthy levels and deliver a airallocation o resources. At a minimum this will require the ollowing actions.
P Reduce capacity in line with the available resources; improve data collection,transparency and reporting; and prioritise scientifc advice in determining catchquotas.
P Create a context in which being proftable is aligned with doing the right thing,by making access to resources conditional on social and environmental criteria.
P Promote responsible consumption among all EU consumers, and implementmeasures that are conducive to more responsible fshing outside EU waters.
P Use public unds to deliver social and environmental goods by investing inenvironmentally constructive measures, research, and stakeholder involvement,as well as enorcing sustainable quotas and practices.
In order or this to happen, policy-makers need to look beyond the short-term coststhat could result rom reorm and give priority to the long-term benefts that healthymarine resources will provide.
P h o t o : C o r e y A r n o l d

8/6/2019 2011 Fish Dependence
http://slidepdf.com/reader/full/2011-fish-dependence 7/36Fish Dependence – 2011 Update 5
There is only so much fshing that our oceans can sustain. For fsheries policies tobe sustainable, they need to acknowledge and respect the ecological limits o themarine ecosystems on which they depend. Ultimately, what drives fsheries is fshconsumption and that consumption needs to be commensurate with the biocapacity
o the oceans.
European Union (EU) waters are potentially rich and productive seas capableo delivering a long-term and stable supply o fsh, together with jobs and otherbenefts or coastal communities. Unortunately, years o poor fsheries managementand overexploitation have reduced the biocapacity o its waters. The EU currentlyconsumes much more than its waters produce and increasingly depends on fshrom other countries to satisy its demand.
In a context o fnite resources and a growing population, the EU model isneither sustainable nor replicable on a global scale. Unsustainable levels o fshconsumption are putting pressure on EU waters, and beyond. Having overfshedits own stocks, the EU is now increasing its dependence on non-EU fsh tomeet demand, which we term ‘fsh dependence’. This is reducing the long-termproductivity o marine ecosystems elsewhere and is also undermining the potential opoorer regions to meet their own domestic demand.
The main goal o this report is to illustrate the extent to which the EU – despite itspotentially abundant and productive seas – is increasingly dependent on fsh romelsewhere. We highlight the implications o this trend or the EU and its Member Statesand make the case or the EU to increase its sel-sufciency (i.e. when domestic supplymatches domestic demand) and decrease its fsh dependence through the restorationo its own fsh stocks and more responsible consumption. While fsh dependenceis not in itsel a measure o sustainable fshing, the reduction o fsh dependenceimplicitly requires moving towards more sustainable fsheries management.
Arguments in avour o sel-sufciency are oten misrepresented as argumentsagainst trade and the needs o industry. International trade can be extremelybenefcial and has massive potential to improve people’s lives across the world.However, it needs to take place both in a air way and within the limits o theecosystem. The continuing and increasing reliance o the EU on fsh imports is notdue to a lack o natural endowment but rather the result o gross mismanagement oits own fsh resources.
In the ollowing section we summarise current trends with respect to the state o fshstocks, levels o fsh consumption and EU strategies to source fsh rom abroad. Wealso assess the contribution that aquaculture makes to national sel-sufciency.
Later in the report we describe our methodology or estimating the degree o fshsel-sufciency in EU countries and share the results o our calculations. We thendiscuss the implications o our fndings and end with a series o conclusions andrecommendations.
Introduction
Fisheries play a pivotal role in human health and wellbeing: fshare crucial to the global ood supply, providing one-fth o animalprotein consumption worldwide. Indeed, fsheries are likely tobecome even more important as populations continue to increaseand the pressures on scarce land or agriculture continue to grow,pushing more people towards fsheries as a ‘last-resort’ activity.
8/6/2019 2011 Fish Dependence
http://slidepdf.com/reader/full/2011-fish-dependence 8/36Fish Dependence – 2011 Update 6
Declining sh stocks
EU catches have steadily declined since 1993 at an average rate o 2percent per year; almost all demersal stocks have declined in recent years.2 The total landings rom EU fsheries in the northeast Atlantic Ocean and theMediterranean Sea have decreased by 30 percent over the past decade.3
On a global level, the United Nations Food and Agriculture Organization (FAO)reports that 32 percent o stocks are overexploited or depleted, with another53 percent ully exploited.4 Only 15 percent o stocks monitored by FAO areconsidered able to produce more than the current level o catches; the lowestlevel since 1970.5 Around the world 27 percent o fsheries were judged to havecollapsed by 2003, meaning that their annual harvests had allen to less than 90percent o their historical maximum yields.6 I the current trend continues, somescientists have predicted that 100 percent o commercial stocks could collapseby 2048.7
Overexploitation o natural resources is synonymous with lost ‘rents’, themaximum economic yield that could be derived rom fsheries compared tocurrent revenues.8 The World Bank has estimated the annual cost o globaloverfshing at US$50 billion, totalling US$2 trillion over the past three decades.9
Rising levels of consumption
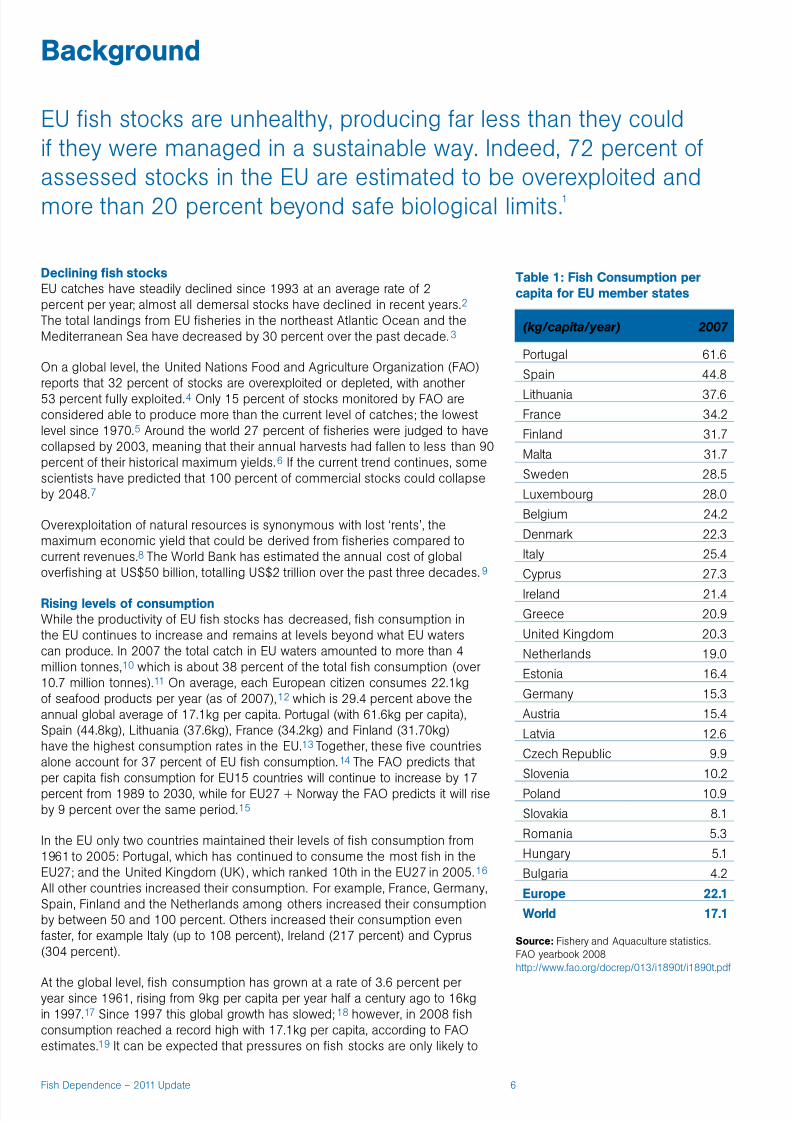
While the productivity o EU fsh stocks has decreased, fsh consumption inthe EU continues to increase and remains at levels beyond what EU waterscan produce. In 2007 the total catch in EU waters amounted to more than 4million tonnes,10 which is about 38 percent o the total fsh consumption (over10.7 million tonnes).11 On average, each European citizen consumes 22.1kgo seaood products per year (as o 2007),12 which is 29.4 percent above theannual global average o 17.1kg per capita. Portugal (with 61.6kg per capita),Spain (44.8kg), Lithuania (37.6kg), France (34.2kg) and Finland (31.70kg)have the highest consumption rates in the EU.13 Together, these fve countriesalone account or 37 percent o EU fsh consumption.14 The FAO predicts thatper capita fsh consumption or EU15 countries will continue to increase by 17percent rom 1989 to 2030, while or EU27 + Norway the FAO predicts it will riseby 9 percent over the same period.15
In the EU only two countries maintained their levels o fsh consumption rom1961 to 2005: Portugal, which has continued to consume the most fsh in theEU27; and the United Kingdom (UK), which ranked 10th in the EU27 in 2005.16 All other countries increased their consumption. For example, France, Germany,Spain, Finland and the Netherlands among others increased their consumptionby between 50 and 100 percent. Others increased their consumption evenaster, or example Italy (up to 108 percent), Ireland (217 percent) and Cyprus(304 percent).
At the global level, fsh consumption has grown at a rate o 3.6 percent peryear since 1961, rising rom 9kg per capita per year hal a century ago to 16kgin 1997.17 Since 1997 this global growth has slowed;18 however, in 2008 fshconsumption reached a record high with 17.1kg per capita, according to FAOestimates.19 It can be expected that pressures on fsh stocks are only likely to
Background
EU fsh stocks are unhealthy, producing ar less than they couldi they were managed in a sustainable way. Indeed, 72 percent oassessed stocks in the EU are estimated to be overexploited andmore than 20 percent beyond sae biological limits.1
Table 1: Fish Consumption per
capita for EU member states
(kg/capita/year) 2007
Portugal 61.6
Spain 44.8
Lithuania 37.6France 34.2
Finland 31.7
Malta 31.7
Sweden 28.5
Luxembourg 28.0
Belgium 24.2
Denmark 22.3
Italy 25.4
Cyprus 27.3
Ireland 21.4Greece 20.9
United Kingdom 20.3
Netherlands 19.0
Estonia 16.4
Germany 15.3
Austria 15.4
Latvia 12.6
Czech Republic 9.9
Slovenia 10.2
Poland 10.9
Slovakia 8.1
Romania 5.3
Hungary 5.1
Bulgaria 4.2
Europe 22.1
World 17.1
Source: Fishery and Aquaculture statistics.FAO yearbook 2008http://www.ao.org/docrep/013/i1890t/i1890t.pd

8/6/2019 2011 Fish Dependence
http://slidepdf.com/reader/full/2011-fish-dependence 9/36Fish Dependence – 2011 Update 7
increase as the global population continues to grow, reaching a projected ninebillion people between 2040 and 2050.20
Sourcing from abroad
Due to its heavily overexploited fsh stocks, the EU has increased its fshconsumption by sourcing more fsh rom abroad. Fish is caught by the EU’s distant-water eet, which operates in other countries’ and international waters; it is also,increasingly, imported.
The distant-water eet is relatively small compared to the EU’s total number o
vessels. In 2006 the EU had 718 vessels fshing in non-EU waters, out o a totalo 88,000 vessels;* yet this small number makes up almost one-quarter o the EUfshing capacity in tonnage. Spain accounted or over one-hal o these vessels;most o the others are rom France, Portugal, Italy, Latvia and Lithuania.21 Overthe 2001–2005 period estimates o the catch size o the EU distant-water eetrange rom 1.06 million to 1.2 million tonnes,22 equivalent to 19–21 percent o totalEU catches.23 These vessels predominantly operate in third countries’ exclusiveeconomic zones (EEZs), under fsheries agreements, and in international waters, yetits catch is classed as EU produce.
The EU is the world’s largest market or fsh and has become increasingly relianton imports to meet its needs. In 2006 it imported 4 million tonnes more fsheriesproducts than it exported,24 a defcit that grew to 4.3 million tonnes in 2007. These
imports help meet its demand or human consumption and processing, as wellas animal eed and aquaculture. In terms o value, the EU imported US$23 billionworth o fsh and fsheries products rom non-EU suppliers in 2007, an increaseo 11 percent on 2006.25 Data rom the EU indicate that imports in tonnes madeup between 59 percent in 2006 and 57 percent in 200726 o the EU’s apparentconsumption† (including domestic aquaculture), while i domestic aquaculture isexcluded, this fgures rises to 67 percent in 2006 and 65 percent the ollowing year.27
Compared to 2007 fgures, EU imports have actually allen by almost 100,000tonnes; export levels have also allen over this period, but by almost our times asmuch. Fish production continues to all (5 percent lower than 2006), mostly due tolower EU catches. This is on top o a 28 percent drop in production in the 12 years
rom 1995 to 2006 (Appendix: Table A1).28
The declining catches – rising importstrend is illustrated in Figure 1.
* 84,909 vessels in 2009 (source: CFP acts and fgures 2010)
† Apparent consumption = catches + imports - exports
Figure 1: EU27 catches (landings) vs imports, 1995–2009 (tonnes live weight)
Source: Eurostat external trade database – http://epp.eurostat.ec.europa.eu/portal/page/portal/external_trade/data/database
9,000,000
8,000,000
7,000,000
6,000,000
5,000,000
4,000,000
3,000,000
2,000,000
1,000,000
0
1995 1997 1999 2001 2003 2005 2007 2009
Imports*
* EU15 for 1995-98 years
Catches
8/6/2019 2011 Fish Dependence
http://slidepdf.com/reader/full/2011-fish-dependence 10/36

8/6/2019 2011 Fish Dependence
http://slidepdf.com/reader/full/2011-fish-dependence 11/36Fish Dependence – 2011 Update 9
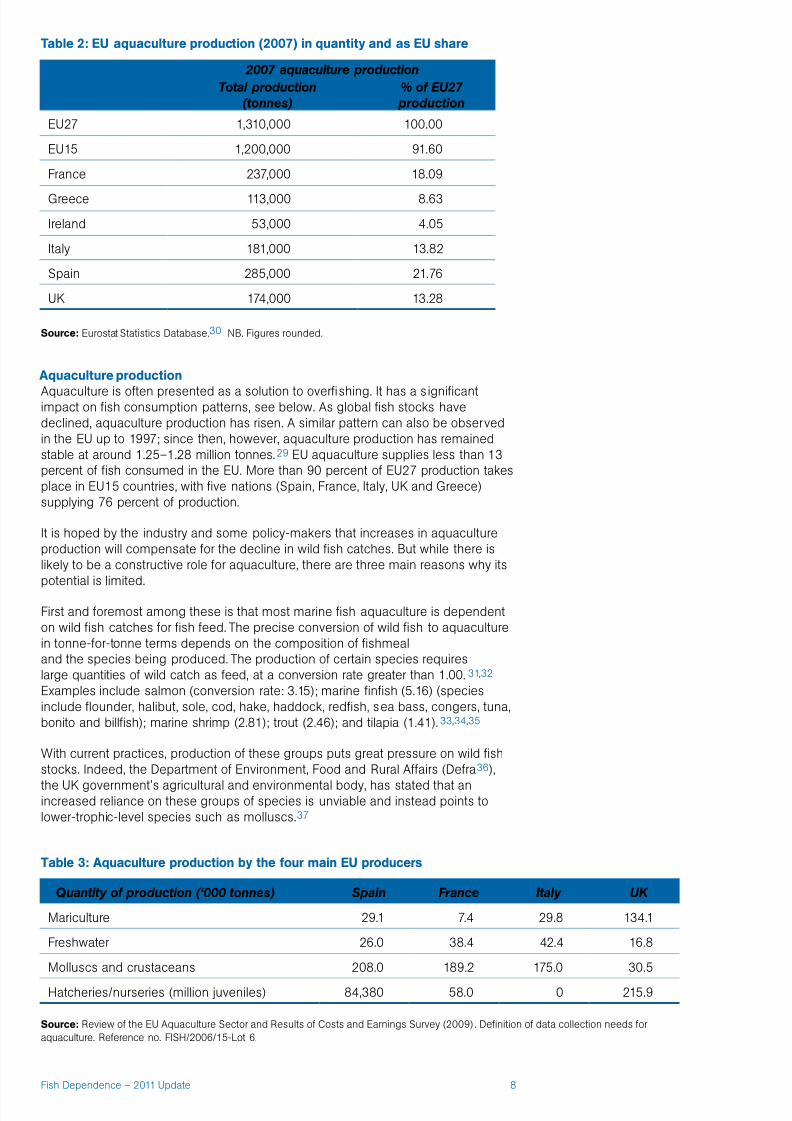
I the direction o aquaculture is determined by consumption behaviour, withpreerence or carnivorous and resource-intensive fsh, then aquaculture will drivethe depletion o fsh stocks even urther. Consequently, the only viable means oosetting depleted fsh stocks and maintaining the same quantity o supply is toincrease the production o seaood such as molluscs and crustaceans, eectivelyreplacing wild fsh with armed molluscs.
EU aquaculture appears to be ollowing this scenario. With EU waters providingewer fsh, EU aquaculture mainly produces molluscs and crustaceans. The EUproduces 152,983 tonnes o marine fsh but 4.5 times that amount o shellfsh
(682,292 tonnes o crustaceans and molluscs). This disparity can be seen clearlyin Table B, below, which details EU aquaculture production categorised intomariculture, reshwater and shellfsh production. Globally, marine fsh contribute lessthan 2.5 percent o total aquaculture production versus 45 percent reshwater fsh(e.g. tilapia) and 24 percent molluscs.38
The second reason why aquaculture’s potential may be limited is its links toa wide range o environmental impacts.39,40 These include the introduction oalien species;41 environmental impacts rom genetically modifed and escapedfsh;42,43,44 habitat modifcation and pollution;45 antibiotic use and other problemswith intensive arming practices;46 and an unsustainable use o resources.47
Thirdly, EU aquaculture’s prioritisation o more resource-efcient groups, such asmolluscs, will do little to satisy the diversity o fsh products oten demanded byconsumers.
In conclusion, aquaculture, on balance, adds to the global supply o fsh. It hasa part to play in the move to optimally managed wild fsh stocks, but only to alimited extent in the case o carnivorous species. Without an improvement in theabundance o wild fsh stocks, aquaculture’s potential or growth is predominantlyin resource-efcient, non-carnivorous species. This ‘business-as-usual’ approachwill see the continued depletion o wild fsh stocks and the eventual replacementor consumption purposes – as is already being seen – o wild fsh with armedmolluscs and crustaceans.
The trend or fsh dependence, with its reliance on fsh stocks rom external sources,cannot be replicated and should not continue.
8/6/2019 2011 Fish Dependence
http://slidepdf.com/reader/full/2011-fish-dependence 12/36Fish Dependence – 2011 Update 10
Sel-sufciency levels are calculated as a ratio o domestic supply (production)over domestic demand (consumption):
A country that is able to produce as much as it consumes will have a ratio o1.00 or more. A ratio o less than 1.00 means that some consumption depends
on non-EU resources, which can be interpreted as an indicator o dependenceon the resources o other countries. Taken over several years, such ratios allowus to identiy trends in the EU’s dependence on other nations’ resources.Thereore, both the degree o sel-sufciency and the changes in the ratio overtime are important. A decreasing ratio means that more consumption is beingsupplied rom outside the EU; an increasing ratio means the EU is becomingmore sel-sufcient.
The sel-sufciency o a country (or the EU) increases i production increasesand/or i consumption decreases. Increases in production can come rom highercatches in national and EU waters and/or rom higher aquaculture production.
The degree o sel-sufciency can be represented as a raction o a year andthen converted into a fsh dependence day: the day in a year when a countrywill have consumed its entire annual supply i it uses only production rom itsown waters. Ater this date the nation becomes dependent on sourcing itsproducts rom elsewhere, hence the date is termed the ‘fsh dependence day’.
For example, a degree o sel-sufciency o 0.4 means that a Member State’sfsh resources provide the equivalent o 146 days o consumption in quantitativeterms (365 days x 0.4). Counting 146 days rom 1 January, we can say thata country with a sel-sufciency rating o 0.4 depends on other countries’resources rom 26 May onward or the rest o the year. Thereore, the earlier thedate, the more dependent is the Member State.
In order to obtain fsh dependence days or all EU Member States, we took theollowing steps.
i. Domestic supply: calculate domestic supply by gathering data on totalcatch per nation in EU waters and trade balances.
ii. Domestic demand: calculate domestic demand by gathering data on totalcatch in all regions and trade balances i.e. exports minus imports.
iii. Sel-sufciency: calculate the degree o sel-sufciency as the ratio odomestic supply over domestic demand.
iv. Fish dependence days: convert the degree o sel-sufciency into calendardays by multiplying by 365 and fnding the corresponding fsh dependenceday in the calendar year.
Methodology
In order to reveal the EU’s dependence on fsh rom non-EU waterswe have estimated sel-sufciency levels or all EU countries. Weexpress these in terms o ‘fsh dependence days’ (see below).
Sel-sufciency = domestic supply
domestic demand

8/6/2019 2011 Fish Dependence
http://slidepdf.com/reader/full/2011-fish-dependence 13/36Fish Dependence – 2011 Update 11
i) Domestic supply
Domestic supply is defned as catches in EU waters plus aquaculture production.At a national level this includes catches by the national eet in its own nationalwaters and in other EU Member States’, plus all domestic aquaculture production(mariculture, reshwater aquaculture, and any other orm). Catches by EU vessels innon-EU waters are excluded, since these depend on non-EU resources.
In equation orm, domestic supply is calculated as:*
Data or catches† rom the EU and Member States were available through Eurostat48
(see Appendix: Table 1 or sample statistics). However, it was not possible to obtaindata on catches by Member States disaggregated by the source location. Thatis, whether the fsh were sourced rom national and EU waters or non-EU fshinggrounds. We thereore used an alternative estimate o domestic supply as:
In the absence o data on non-EU catches by Member States, the catch by aMember State was estimated using the share o gross tonnage that each nationhas in the total EU external eet49 and the assumption that the gross tonnage orall Member States translates into proportional shares o catches (Appendix: Table2 presents data on the tonnage o Member States’ external eets and the EU asa whole). For example, our estimates show that the EU caught 1.2 million tonnesin external waters, so i a Member State had 10 percent o the EU’s external eetcapacity in terms o gross tonnage, we assumed that it was responsible or 10percent o the 1.2 million tonnes caught in non-EU waters (120,000 tonnes).
Thereore, catches in non-EU waters or each Member State (MS) were calculated as:
Our estimate o 2006 non-EU catch was derived rom a simple average o theprevious fve years’ external catch: 1,198,847 tonnes (varying rom 1.06–1.30 milliontonnes).
Our estimate or the 2007 non-EU catch was taken as a fxed 21 percent o thetotal EU catch in that year, derived rom a conservative estimate rom a EuropeanCommission report.50,51 This equals approximately 1.08 million tonnes.
Furthermore, we complemented the 2007 estimates o non-EU catch share with
data on catches by fshing area52 obtained rom Eurostat.
This involved extracting data on catches by the EU and its Member States or FAOfshing areas throughout the globe, then looking at which o these areas wereoutside the EU’s EEZ. Where there was not perect overlap between the EU’s EEZand an FAO sub-division, we conservatively assumed all catches were made in theEU EEZ (conservative, because less external catch means higher sel-sufciency).
* Figure or total catches in all fshing regions is measured in tonnes, includes aquaculture,and covers the period o one year. It relates only to EU waters, but is not distinguished byMember State EEZs. Ideally, we would have liked to restrict domestic production to fshcatches by a country within its own EEZ but under the Common Fisheries Policy, eets areallowed to fsh in other EU States’ waters without registering the origin o the catch. Theconsequences o this will be discussed under ‘Caveats with data and methodology’.
† Ofcial data sources on catches represent recorded landings. Since landings do notinclude bycatch, illegal, unreported or unregulated (IUU) fshing or discards, ofcial catchdata is in eect a large underestimation o the ‘real catch’ that takes place.
catches in nationaland EU waters*
aquacultureproduction
domesticsupply = +
fsh production (total catches inall waters + aquaculture)
catches in non-EUwaters
domesticsupply
= –
catches in non-EUwaters by EU eet
MS share o EUtonnage capacity
catches in non-EUwaters by MS eet = X
8/6/2019 2011 Fish Dependence
http://slidepdf.com/reader/full/2011-fish-dependence 14/36Fish Dependence – 2011 Update 12
This exercise revealed some estimates o external catches that were larger than thenon-EU estimates derived using the method described above. These higher valuesare more directly linked to fshing activity (i.e. they are reported catches in a specifcarea, rather than a eet-based estimate calculated using tonnage capacity and totaleet catches in all non-EU areas) but can still be considered conservative as we didnot include any catches rom regions that overlap EU waters. We used estimatesderived rom this approach most notably or Denmark, Germany, the Netherlandsand the UK.
ii) Domestic demand
Domestic demand is defned by apparent consumption within a country. Itencompasses all demand or fsh products by a country, whether these are usedor human consumption or animal eed or are wasted. Apparent consumption ismeasured as total production (catches and aquaculture), plus imports, minusexports. In equation orm that is:*
Data or catches or the EU and Member States – the same as was used ordomestic production – were taken rom Eurostat statistics53 (see Appendix: Table
1 or sample data). Our trade data were taken rom Eurostat pocketbooks54
(seeAppendix: Table 3 or sample data). These trade data cover trade in all fsh andaquaculture products.
iii) Self-sufciency
The degree o sel-sufciency was calculated by dividing domestic supply bydomestic demand. As noted above, this represents the proportion o consumption ina region (the EU) or nation (EU Member State) that is supplied by its own resources.In equation orm, this is calculated as:
* ‘Total catches’ includes aquaculture production and wild catches by the EU and all Member States,available through Eurostat. From this fgure, or each country, the estimated external catch (derived asabove, in section i) is subtracted. Trade data includes aquaculture trade as well as wild catch, and isin all fshery products, regardless o processing method.
Sel-sufciency = domestic supply
domestic demand
© C o r e y A r n o l d / O C E A N 2 0 1 2
total production (total catches in EUand non-EU waters + aquaculture) imports
apparentconsumption* = + — exports

8/6/2019 2011 Fish Dependence
http://slidepdf.com/reader/full/2011-fish-dependence 15/36Fish Dependence – 2011 Update 13
This is equivalent to:
Net trade (imports minus exports) is included in the domestic demand denominatorand not domestic supply because trade is not production. A positive trade balance(i.e. exports larger than imports) increases the degree o sel-sufciency by reducingthe proportion o production that is consumed domestically, and thereore should be
included in domestic demand.
iv) Fish dependence days
The fnal step o the methodology was to convert sel-sufciency ratios into days.This was done simply by multiplying the sel-sufciency raction by 365 andderiving the corresponding date in the year.
Caveats with data and methodology
While all data used in our estimates were taken rom ofcial sources such asthe FAO, Eurostat and the European Commission, the datasets used had severallimitations that could have aected our results. A key point to highlight is thatwhile all results are derived rom ofcial data sources, our calculations have
been restricted at times by the limited quality and availability o data. Additionalinormation on the share o national catches derived rom national, EU, internationaland other non-EU waters, would help strengthen our results, but this inormation isnot available or difcult to access. This is partly due to poor reporting o fsheriesdata and a lack o transparency among EU Member States. While our results arear rom perect, it is worth pointing out that they are based on the best availableinormation and can be considered as providing the best picture currently available.As explained in the ollowing sections, our estimates are conservative, which meansthat real levels o sel-sufciency are likely to be lower than the results show.
i) Member State catches in EU watersThe Rule o Origin55 criteria dictates that fsh caught by an EU vessel outsideEU waters be classifed as EU produce, unlike produce caught in the same
location under another vessel’s ag. This means that all EU catches by the EUeet in non-EU waters are classifed as EU production, even i they come romother countries’ waters. This makes it difcult to distinguish between what iscaught in a country’s own territorial waters (defned as a country’s EEZ) andcatches in other Member States’ EEZs or EU waters.
The absence o ofcial data that divides catches between national waters,EU waters, international waters and non-EU waters led us to make severalassumptions that could aect the results at Member State level.
ii) EU catches in non-EU watersCatches by the EU’s external fshing eet in our estimates should be
considered the minimum amount o fsh caught by EU vessels in non-EUwaters.
The total non-EU catch by the EU external eet and its gross tonnage is basedon the 718 vessels o the EU external eet that conduct at least 90 percent otheir activity outside EU waters. For example, in the Mediterranean the EEZ onlyextends to 12 nautical miles rom the coast, which means that vessels fshingbeyond this limit are fshing in international waters. But it is unlikely that the718 vessels composing the external eet include those vessels operating inthe Mediterranean, particularly since these 718 vessels must spend at least 90percent o their activity outside the EU. Where vessels rom Mediterranean EUcountries operate beyond their EEZ or less than 90 percent o their activity theircatch is counted as national catch when it should be regarded as sourced romnon-EU waters.
This suggests that the total amount o non-EU catches is much larger than thefgures on which we have based our results.
Sel-sufciency = catches in EU waters + aquaculture production
apparent consumption

8/6/2019 2011 Fish Dependence
http://slidepdf.com/reader/full/2011-fish-dependence 16/36Fish Dependence – 2011 Update 14
iii) Share o national catch sourced rom non-EU watersNon-EU catches or each Member State were calculated based on theassumption that every country’s share o EU external eet capacity (in grosstonnage) was a reection o its share o non-EU catches. For example, the UKmakes up 2 percent o the EU external fshing eet tonnage capacity so weassumed that it is responsible or 2 percent o total catches by the EU externalfshing eet (equivalent to 21,293 tonnes). This quantity was then subtractedrom total UK catches to obtain UK catches in EU waters.
Using capacity as a proxy or catch-size appropriation is equivalent toassuming that all vessels catch the same amount relative to their tonnage.
This could result in underestimated attribution o the share o external catchescommanded by countries with low-capacity vessels, relative to the average, aswell as overestimates or those countries with above-average capacity vessels.
In order to validate our estimates o share o national catches coming rom non-EU waters, we tried to obtain inormation at the national level or each MemberState, but we could only obtain national data or Spain and France. Data romthe Spanish Ministry or Fisheries56 suggested that 54 percent o Spanishcatches were made in non-EU waters, matching the estimates derived usingour methodology (when including aquaculture production in Spanish catches).That is, the raction o Spanish catches sourced rom outside the EU was 54percent,* which is equivalent to 0.55 million tonnes in 2005 when the entireSpanish eet caught 0.99 million tonnes. Using our method, where 52 percento the external eet’s capacity is Spanish and there were 1.06 million tonnes oEU external catches in total, we also arrived at 0.55 million tonnes (or 2005).Likewise, or France the ofcial statistics57 and our own were similar†. For bothcountries we used the fgures rom national sources rather than our estimates,although we view the fndings as support or our methodology.
iv) Lack o data on catches within the EEZs o Member StatesUnder the CFP EU waters are regarded as a common resource that can beexploited by any Member State. Without data on catches within a MemberState’s own waters we cannot comment on how sel-sufcient a MemberState is within its own EEZ. This means that fshing by Member States in other
* This fgure o 54 percent was used time-independently in order to ollow Spanish national data asclosely as possible.
† We calculated France’s fgure by summing its national catch using data rom the reerenced report(rom p. 23 onwards: ‘État du secteur des pêches rançais’) on catches in dierent areas, which cameto 116,819 tonnes in 2008. For the same reason as or Spain, see previous Footnote above, we usedthis fgure time-independently to represent France’s external catch in all years o our analysis.
8/6/2019 2011 Fish Dependence
http://slidepdf.com/reader/full/2011-fish-dependence 17/36Fish Dependence – 2011 Update 15
nations’ waters will increase their sel-sufciency as long as these waters areinside the EU. Spain is clearly a signifcant benefciary o this since a large parto its eet operates in waters outside Spanish jurisdiction but still within EUwaters. This does not, however, aect the sel-sufciency o the EU as a whole.
v) Illegal, unreported and unregulated (IUU) fshing and bycatchOur results do not take into account IUU fshing, discards and bycatch.Estimates o the scale o IUU fshing are only available or specifc stocks oreets, making it impossible to include it in this analysis. However, high levels odiscards and bycatch should have little impact on the analysis as all discards
and most bycatch do not enter the market. Yet, it is worth noting that ofcialdata sources on total catches are estimated rom recorded landings and, giventhat landings do not include bycatch or discards, the catch data used in ouranalysis underestimate the true catch that takes place, urther supporting ourassertion that our results are conservative.
vi) Trade dataData on trade are readily available rom the Eurostat pocketbook on fsheriesstatistics 1990–2006,58 but unortunately this inormation is no longerpublished. Instead, all trade data or 2007 have been extracted rom theEurostat external trade database.59 Trade codes include all seaood products,including live fsh, rozen fsh, fshmeal, fsh oils and processed fsh, and are
exactly the same as those used by Eurostat in previous editions o the fsheriesstatistics pocketbook.
vii) Contemporary dataFinally, it is worth noting that there is a delay o around three years or datareporting. As a consequence, most o our datasets are rom 2007/08. Wethereore make the assumption in this report that similar conditions hold or2011. Given that the trend is o increasing dependence year on year, this islikely to make the EU appear less dependent than it may actually be.
viii) Aquaculture tradeWhen constructing the sel-sufciency dates that exclude aquaculture romthe catch data, we were unable to remove trade in aquaculture products. This
was because o a lack o trade data sufciently detailed to distinguish at the10-digit-code specifcity required at the EU level. This is something that couldbe urther explored in uture editions o this report, but it would require updatingdates or all previous years i we wanted to make them comparable.
ix) AquacultureThe ormula used to estimate sel-sufciency levels includes aquaculture as ameasure o domestic production. Higher levels o aquaculture production willincrease sel-sufciency i it contributes a net gain in seaood produced. This islimited, however, i aquaculture is dependent on more fsh than it produces.
The dependence o aquaculture on wild fsh stocks is already captured in the
wild catches and trade components o the ormula. However, our methodologydoes not capture the act that EU aquaculture production is dominated bymolluscs and that the current trend is one in which we are replacing wild fshwith armed molluscs. Neither does it capture the diminished choices availableto the consumer.
In other words, the depletion and replacement o the diversity o wild fshstocks, with the equivalent quantity o a single species o armed molluscwould not aect sel-sufciency.
Consequently, we present the results with and without aquaculture production.Removing aquaculture production rom the equation results in a decrease insel-sufciency (i.e. fsh dependence will come earlier in the year) as shownin Table E, below. That said, due to the way in which trade data are collected,aquaculture could not be removed rom trade data, which means that eachtonne o traded fsh product is equivalent, regardless o whether it is wild orarmed.

8/6/2019 2011 Fish Dependence
http://slidepdf.com/reader/full/2011-fish-dependence 18/36Fish Dependence – 2011 Update 16
Table 4 shows that the EU’s degree o sel-sufciency is now 50 percent, and thatthis ratio has been decreasing consistently since its ormation. EU15 has alsoshown declining sel-sufciency, rom just over 67 percent in 1990to 50 percent in 2007, a 25 percent drop in 17 years.
Results
When analysing the ratio o domestic supply over domesticdemand, we arrived at estimates o the degree o sel-sufciency othe EU and its Member States (Table 4) and their corresponding fshdependence days (Table 5).
Table 4: Degree of self-sufciency for the EU and its Member States
1990 1995 2000 2005 2006 2007
EU27 0.871 0.590 0.563 0.518 0.500
EU15 0.671 0.670 0.588 0.560 0.519 0.501
Belgium 0.161 0.215 0.287 0.206
Bulgaria 0.401 0.234 0.267 0.402
Czech Republic 0.314 0.313 0.353 0.326
Denmark 1.125 1.197 0.999 0.850 0.787 0.618
Germany 0.328 0.295 0.280 0.421 0.341 0.320
Estonia 1.106 7.072 30.835 2.505
Ireland 2.431 2.197 1.876 1.916 1.776 1.536
Greece 0.635 0.676 0.660 0.597 0.657 0.598
Spain 0.461 0.397 0.404 0.343 0.356 0.349France 0.679 0.565 0.564 0.466 0.468 0.449
Italy 0.491 0.472 0.393 0.340 0.343 0.329
Cyprus 0.819 0.137 0.264 0.228
Latvia 1.094 1.442 1.437 1.339
Lithuania -0.444 0.244 0.233 0.446
Hungary 0.332 0.379 0.482 0.513
Malta * -1.367 -1.102 -0.556 -0.259
Netherlands 1.602 0.887 1.022 1.716 1.681 1.213
Austria 0.057 0.057 0.061 0.039 0.041 0.039
Poland 0.529 0.494 0.467 0.545
Portugal 0.516 0.383 0.205 0.112 0.318 0.317
Romania 0.237 0.122 0.138 0.160
Slovenia 0.207 0.177 0.155 0.159
Slovakia 0.072 0.095 0.102 0.121
Finland 0.603 0.643 0.700 0.669 0.679 0.745
Sweden 0.862 1.053 1.402 1.096 1.350 0.995
UK 0.577 0.674 0.636 0.643 0.592 0.538
* Clearly it is impossible or a Member State to have a negative ratio. This discrepancy arises rom estimates o a country’s external catch being greaterthan the country’s total catch. This is predominantly a problem or countries with small total catches, such as Malta, which are thereore more sensitive toinconsistencies in the data. In 2007 we have addressed this, assuming that Malta’s non-EU catch is 0.
Luxembourg not included because o data limitations

8/6/2019 2011 Fish Dependence
http://slidepdf.com/reader/full/2011-fish-dependence 19/36Fish Dependence – 2011 Update 17
Fish dependence in the EU as a whole shows that its fsh stocks support justunder one-hal o its consumption; its fsh dependence day alls on 2 July, oneweek earlier than in 2009. Member States dier in their levels o sel-sufciency.Unsurprisingly, inland countries or those with little access to the sea (i.e. Austria,Slovenia, Slovakia, Romania and the Czech Republic) become fsh dependentmuch earlier in the year, relative to the EU average. On the other hand, Estonia,Latvia, Ireland and the Netherlands appear to be sel-sufcient and are able toproduce more fsh than they consume.
Others, however, have access to potentially enormously productive waters, yet their
dependence does not seem to reect this, due mostly to the state o their fsheriesand their levels o consumption. In act, many become fsh dependent strikinglyearly in the year: Portugal becomes dependent on 26 April; Spain on 8 May; Franceon 13 June; the UK on 16 July; Italy on 30 April; and Greece on 7 August.
Table 5: Fish dependence days for the EU and its Member States
1990 1995 2000 2005 2006 2007
EU27 - - 4 Aug 25 July 9 July 2 July
EU15 2 Sep 2 Sep 3 Aug 24 July 9 July 3 July
Belgium - - 28 Feb 20 Mar 15 Apr 17 Mar
Bulgaria - - 27 May 27 Mar 08 Apr 27 May
Czech Republic - - 25 Apr 25 Apr 09 May 30 Apr
Denmark >1 year >1 year 31 Dec 7 Nov 15 Oct 14 Aug
Germany 30 Apr 18 Apr 13 Apr 3 June 05 May 27 Apr
Estonia - - >1 year >1 year >1 year >1 year
Ireland >1 year >1 year >1 year >1 year >1 year >1 year
Greece 20 Aug 4 Sep 29 Aug 6 Aug 28 Aug 7 Aug
Spain 18 June 26 May 28 May 6 May 10 May 8 May
France 6 Sep 26 July 25 July 20 June 20 June 13 JuneItaly 29 June 22 June 24 May 5 May 6 May 30 Apr
Cyprus - - 27 Oct 19 Feb 7 Apr 25 Mar
Latvia - - >1 year >1 year >1 year >1 year
Lithuania - - 1 Jan 30 Mar 27 Mar 12 June
Hungary - - 2 May 19 May 26 June 7 July
Malta - - >1 year Undefned* Undefned* 19 Mar
Netherlands >1 year 20 Nov >1 year >1 year >1 year >1 year
Austria 21 Jan 21 Jan 23 Jan 15 Jan 15 Jan 15 Jan
Poland - - 13 July 30 June 20 July 19 JulyPortugal 8 July 20 May 16 Mar 11 Feb 2 Apr 26 Apr
Romania - - 28 Mar 14 Feb 20 Feb 28 Feb
Slovenia - - 17 Mar 6 Mar 26 Feb 27 Feb
Slovakia - - 27 Jan 4 Feb 7 Feb 14 Feb
Finland 9 Aug 23 Aug 13 Sep 2 Sep 5 Sep 29 Sep
Sweden 11 Nov >1 year >1 year >1 year >1 year 30 Dec
UK 30 Jul 04 Sep 21 Aug 23 Aug 4 Aug 16 July
Notes:
‘-’ indicates that estimates could not be made, typically due to lack o data, particularly trade balances.
‘*’ indicates that estimates were unrealistic due to consumption being greater than catches minus external catches, aquaculture production and imports(data limitation). Aquaculture included in the catch data.
Dates not available or some countries prior to joining the EU.
Luxembourg not included because o data limitations

8/6/2019 2011 Fish Dependence
http://slidepdf.com/reader/full/2011-fish-dependence 20/36Fish Dependence – 2011 Update 18
While the degree o sel-sufciency is important, because it reects the currentstate o aairs, trends are also important because they reect the longer-termimplications We see that most countries and the EU as a whole show a declinein sel-sufciency rom 1990 to 2007; that is, the EU and its leading MemberStates are shown to be increasingly dependent on resources rom outside EUwaters. The EU15 Member States have reduced their degree o sel-sufciencyby 25 percent compared to 1995, while the EU27 has reduced its sel-sufciencyby 15 percent compared to the same year.
In other words, in just seven years the EU27 fsh dependence day movedorward in the calendar by over one month – rom 4 August to 2 July. At current
levels o consumption, i EU citizens were to rely solely on fsh caught in EUwaters, the EU would consume its domestic supply by 2 July. This means thatthe EU depends on fsh rom other parts o the world or almost one-hal o theyear.
Table 6: Fish dependence days for the EU and its Member States, excluding aquaculture from domestic supply
1990 1995 2000 2005 2006 2007
EU27 - - 14 July 3 July 14 June 7 June
Belgium - - 25 Feb 19 Mar 15 Apr 16 Mar
Bulgaria - - 22 Apr 1 Mar 16 Mar 23 Apr
Czech Republic - - 30 Jan 27 Jan 3 Feb 30 Jan
Denmark >1 year >1 year 31 Dec 13 Nov 13 Oct 10 Aug
Germany 9 Apr 31 Mar 24 Mar 21 May 25 Apr 13 Apr
Estonia - - >1 year >1 year >1 year >1 year
Ireland >1 year >1 year >1 year >1 year >1 year >1 year
Greece 3 Aug 18 July 27 June 23 May 15 June 22 May
Spain 1 May 27 Apr 18 Apr 30 Mar 25 Mar 24 Mar
France 22 June 19 June 21 June 14 May 15 May 7 May
Italy 3 May 12 May 6 Apr 27 Mar 30 Mar 23 Mar
Cyprus - - 25 Oct 24 Jan 12 Feb 10 Feb
Latvia - - >1 year >1 year >1 year >1 year
Lithuania - - 1 Jan 27 Mar 23 Mar 9 JuneHungary - - 24 Feb 7 Mar 29 Mar 31 Mar
Malta - - >1 year Undefned* Undefned* Undefned*
Netherlands >1 year 13 Nov >1 year >1 year >1 year >1 year
Austria 4 Jan 3 Jan 4 Jan 2 Jan 2 Jan 2 Jan
Poland - - 30 June 7 June 27 May 27 June
Portugal 4 July 18 May 22 Mar 9 Feb 10 Apr 23 Apr
Romania - - 13 Feb 22 Jan 24 Jan 25 Jan
Slovenia - - 20 Feb 4 Feb 29 Jan 29 Jan
Slovakia - - 17 Jan 23 Jan 23 Jan 29 Jan
Finland 11 July 14 Aug 6 Sep 24 Aug 29 Aug 24 Sep
Sweden 31 Oct >1 year >1 year >1 year >1 year 30 Dec
UK 17 Sep 26 Aug 5 Aug 3 Aug 13 July 22 June
Source: Data used were Eurostat data, or national data where available, and aquaculture excluded rom production but included in the trade data.
Notes: ‘-’ indicates that estimates could not be made, typically due to lack o data, particularly trade balances.‘*’ indicates that estimates were unrealistic due to consumption being greater than catches minus external catches, aquaculture production and imports
(data limitation).
Luxembourg not included because o data limitations

8/6/2019 2011 Fish Dependence
http://slidepdf.com/reader/full/2011-fish-dependence 21/36Fish Dependence – 2011 Update 19
There are worrying signs o increasing dependence or several countries. The UK isnow dependent 20 days earlier than last year, the Netherlands’ sel-sufciency allsby 27.8 percent, and Sweden just becomes fsh dependent (on 30 December). Forsome countries, particularly Germany and Denmark, the increase in dependencycan be attributed in some part to the use o data about catches near Greenland (andoutside o the EU) that were not contained in the sources we used or last year’sestimates. However, i we apply this improved method to last year’s data (so thatGreenland catch in that time period is non-EU catch), we fnd that last year Denmarkwould have been dependent rom 7 October (instead o 15 October), and Germanyrom 30 April (instead o 5 May). In comparable terms, thereore, these two countries
still move earlier in the year, to 14 August and 27 April, respectively.
Excluding aquaculture rom domestic production urther reduces the degree o sel-sufciency, as can be seen in Table E, below. Removing aquaculture rom productionmakes the trend o declining sel-sufciency more apparent, moving the EU fshdependence day orward by a little more than three weeks to 7 June, and by morethan one month or the main EU aquaculture producers such as Spain, Italy, Franceand Greece (more than two months).

8/6/2019 2011 Fish Dependence
http://slidepdf.com/reader/full/2011-fish-dependence 22/36Fish Dependence – 2011 Update 20
Interpretation of results
Many actors aect a country’s degree o sel-sufciency. These include the sizeo the eet; fsh catch; external catch relative to total catch; area and productivityo national waters; fsh consumption per capita; the scale o imports andexports; and domestic aquaculture production.
Naturally landlocked countries or those with small eets (relative to consumptiondemand) will have a lower degree o sel-sufciency. Those nations with highlevels o fsh consumption and substantial external fshing, such as Spain andPortugal, reach their fsh dependence days earlier in the year. Others with ahigher proportion o catches in EU waters and lower levels o consumption, suchas Denmark, have a dependence date later in the year. Some EU countries,including Ireland and the Netherlands, are actually sel-sufcient.
Aquaculture increases fsh production and thereore improves sel-sufciencylevels. But this is only the case when it results in a net gain in production, orexample, i fsh outputs are bigger than fsh inputs (i.e. fshmeal). This is not alwaysthe case, as we have seen with carnivorous species. Our results show that theinclusion o aquaculture delays the date o fsh dependence by slightly morethan three weeks. But overall, aquaculture production has not altered the trend oincreasing fsh dependence.
The EU is naturally endowed with potentially rich and productive seas and it hasthe capacity to signifcantly increase its sel-sufciency levels by both managingits marine ecosystems in a sustainable way and changing consumptionpatterns. It is thereore important to emphasise that the trends ound here arenot an unavoidable problem, rather the consequence o poor management o EUfsh resources and consumption patterns.
Fish dependence and sustainability
It is worth highlighting that the degree o sel-sufciency we have calculated
is not a direct commentary on the sustainability o fsheries. For example,according to our results the Netherlands is a sel-sufcient country, but thisdoes not mean that it fshes sustainably. However, the sustainability o acountry’s fsheries is not directly investigated in this report. A direct commentaryon sustainability requires detailed knowledge o the carrying capacities o all
Discussion and implications
Fish dependence is a powerul concept that illustrates how aroverconsumption outstrips domestic resources. As we have shown,one way to illustrate this trend is to represent a country’s degreeo sel-sufciency as a calendar day – the day in the year when acountry has consumed its own supply and must begin sourcing itsproducts rom elsewhere, hence the term ‘fsh dependence day’. Forthe EU this date is currently 2 July, ater which the EU depends onoreign resources.
8/6/2019 2011 Fish Dependence
http://slidepdf.com/reader/full/2011-fish-dependence 23/36Fish Dependence – 2011 Update 21
species and stocks, which requires data on breeding rates, population levelsand parameters, migratory zones, predation pressures, and so on.
Despite this, we believe there is substantial evidence to suggest that increasingdependence on other countries is a powerul indicator o unsustainable fsheriesand overexploitation o EU resources. Our sel-sufciency ratios are an easy-to-understand way o highlighting the impact that the EU’s increasing fshdependence is having on other countries.
Ultimately, our results are consistent with other evidence on the eects o
unsustainable trends in global fsheries. The EU model is not replicable at aglobal scale and, given global trends, is unsustainable.
Implications of the EU’s sh dependence
Food security in developing countries
The interdependence o countries is becoming increasingly complex, not leastin the ood market.60,61 A signifcant proportion o EU fsh imports come romdeveloping countries. At a global level more than one-hal o the US$57.7 billionworth o fsh products traded in 2004 came rom developing countries.62 Thefsh-product trade is more valuable to developing countries than those o tea,rice, cocoa and coee combined.63 It is clear, thereore, that notions o sel-sufciency directly impact on the interdependence and patterns o global trade.
However, while there are potentially large economic benefts to be derived romtrade, the current rules o the game are not necessarily working or the poorercountries. It is challenging or developing countries to get good returns ontheir resources. Trade uels economic development in the exporting countriesand revenues rom fsh exports may, potentially, help combat hunger in thesecountries.64 But trade can lead to problems o ood insecurity, largely because fsh isa major source o protein in developing countries.65
The emergent picture is non-uniorm across and within countries. In at leastsome cases the net eects o the fsh trade are completely unclear, showingneither decreased ood security nor economic development. That said, there are
other cases where the outcomes o trade are clearer. While fsh or export aregenerally dierent, higher-value species than those consumed locally, there isevidence that in some cases fsh supply is being diverted away rom vulnerablepeople in developing countries. For example, in the decade rom 1978/80 to1988/90, per capita fsh consumption in developed regions increased (by 27.7percent in North and Central America and 23 percent in Europe and Asia),while in developing regions it ell (by 2.9 percent in Arica, 7.9 percent in SouthAmerica, and more than 25 percent in at least 24 countries, including Burundi,Libya, Mali, Costa Rica and Colombia).66 Moreover, there is worrying evidencethat this decline is not being oset by other orms o animal protein,67 despitethe region potentially benefting economically rom trade. How this diversionoccurs is not straightorward; it may be due to a combination o local people andexporters targeting the same species, or the knock-on eect o the exploitationo particular but exclusive stocks.
In summary, in order to combat cases o unsustainable trade that unairly damagedeveloping countries, trade regimes need to be more environmentally andsocially responsible.68,69,70 The positive macroeconomic impact o exporting fshproducts and natural resources must be used to drive development, yet alsoweighed against the potential negative consequences or those who depend onthose resources in poor communities. Consumption within sustainable limits is animportant component o any positive trade. The EU, or the sake o its own oodsecurity, employment and ecological health, must replenish its own fsh stocks,with any excess demand being satisfed by well-regulated and mutually benefcialtrade with developing countries.
Vulnerability of the EU shing industry
As EU fsh stocks dwindle, the gap between supply and demand withinEurope continues to widen. This is putting jobs in the fshing industry at riskand also undermining the processing industry that depends on fsheries. The

8/6/2019 2011 Fish Dependence
http://slidepdf.com/reader/full/2011-fish-dependence 24/36Fish Dependence – 2011 Update 22
lower productivity o EU stocks in recent years means that fshing is becoming anincreasingly costly enterprise. The amount o eort and uel needed to land onetonne o fsh is higher than it needs to be, and higher than it would be i stocks wereat a sustainable level. It is estimated that UK trawlers invest 17 times more eortthan they did 118 years ago to land an equivalent catch.71
The prospect o urther increases in uel price can only exacerbate this trend.Fuel is currently subsidised in many countries, and this is oten essential i fshingoperations are to be economically viable. Such subsidies will be more difcultto justiy and maintain, however, as climate change and rising oil prices begin
to make an impact and the pressure to cut carbon emissions intensifes. Forexample, the increasing dependence o the EU processing industry on imports ispushing up societal and environmental costs such as climate change impacts andenvironmental damage.
In order to maintain competitiveness with non-EU producers and processors, theEU fshing industry must use its resources more efciently. Contrary to the currentposition, this requires a large reduction in fshing capacity and or the EU to setlevels o fsh stocks beyond the Maximum Sustainable Yield (MSY) or as long as ittakes or them to recover.
Undersupply or the growing European market is not likely to be a problem in
the immediate uture. The average fsh price in European markets is higher thananywhere else in the world except Japan, which makes Europe a lucrative andattractive market or exporters rom elsewhere. In the long-term, however, unlesswe start improving the productivity o EU waters, the prospects or the EU fshingindustry look bleak.
Some companies, such as the Spanish-based companies Pescanova and Calvo,have responded to shortages in EU fsh stocks by sourcing fsh directly through theirown eet or through joint ventures in developing countries.72 While this is a naturalresponse to a challenging economic environment rom a business strategy point oview, it only serves to increase our dependence on fsh rom elsewhere.
The way forward and opportunities for change
There are many benefts associated with replenishing fsh stocks. A high degreeo sel-sufciency helps to deliver increased ood security, improved resourcemanagement, a healthier environment and long-term employment and socialstability or fshing communities. A decrease in the degree o sel-sufciency meansthe opposite, which is why the EU’s fsh resources and fsheries sector are both insuch a parlous state.
This situation is reversible, however. The current state o EU fsheries must beset against a backdrop o once rich and productive EU waters o considerableeconomic and cultural signifcance.73,74,75 We need to moderate current levelso fsh consumption and restore EU fsh stocks, both o which would reverse ourincreasing levels o fsh dependence. The current reorm o the CFP oers a unique
opportunity to do just that.
To transorm the management o our marine resources we need the new CFP toprovide a policy ramework that will restore marine ecosystems to healthy levels anddeliver a air allocation o resources within the EU and internationally. As a minimumthis will require the ollowing actions.
P Reduce capacity to reconcile it with available resources; improve datacollection, transparency and reporting; and prioritise scientifc advice indetermining catch quotas.
P Create a context in which being proftable is aligned with doing the right thing,by making access to resources conditional on social and environmental criteria.
P Promote responsible consumption among all EU consumers, and implementmeasures that are conducive to more responsible fshing outside EU waters.
8/6/2019 2011 Fish Dependence
http://slidepdf.com/reader/full/2011-fish-dependence 25/36Fish Dependence – 2011 Update 23
P Use public unds to deliver social and environmental goods by investing inenvironmental measures, research, stakeholder involvement and control andenorcement, rather than the current situation o unding the overcapacity othe fshing eet through modernising vessels and ailing to control overfshingi.e. access to fsheries stocks.
In order or this to happen, policy-makers need to look beyond the short-termcosts that could result rom reorm and instead give priority to the medium- andlong-term benefts that healthy marine resources will provide. But action will alsobe required at other levels. Businesses need to respond to the current challenges
by adopting business models that secure their viability in the uture and protectthe scarce resources on which they depend. EU citizens, meanwhile, need toexercise their consumer power to move towards patterns o consumption thatmatch what our oceans are able to produce.
© C o r e y A r n o l d / O
C E A N 2 0 1 2
8/6/2019 2011 Fish Dependence
http://slidepdf.com/reader/full/2011-fish-dependence 26/36Fish Dependence – 2011 Update 24
Conclusions
The EU and many o its leading Member States are becomingincreasingly dependent on fsh resources rom other countries. Thisis down to two main driving actors: EU stocks are in poor healthand EU demand or fsh continues to increase as EU citizens eatmore fsh than their waters produce.
We have seen that the EU now relies on oreign resources or almost one-hal oits consumption, that this dependence has been increasing, and that the impact oaquaculture in reducing this trend is limited. The EU’s fsh dependence day is2 July. Certain Member States, such as Spain, France, Italy and Portugal, reach theirfsh dependence days much earlier, despite their access to productive EU waters.
In the context o a steadily growing population, the trend towards the fshingo stocks to depletion beore moving on to another resource (either throughtargeting distant-water fshing grounds or importing produce) is unsustainable,environmentally ruinous and potentially damaging or poorer countries and theirdevelopment. Many o the costs o EU fsh mismanagement are being exported,with direct consequences on the fsh stocks o non-EU countries, simply to meetEU demand. Change is desperately needed i we are to break this pattern – the EUneeds to ocus eorts on restoring its own marine ecosystems and to move towardsconsumption levels that are commensurate with ecosystem capacity.
The imminent CFP reorm is an ideal opportunity to create a robust policy rameworkthat restores the EU’s marine resources and protects them or uture generations. Tothis end, nef is an active member o the OCEAN2012 coalition, which is dedicatedto transorming European fsheries policy, to stop overfshing, end destructivefshing practices, and deliver air and equitable use o healthy fsh stocks.
I we are to get this reorm o the CFP right, the EU needs to champion the goalso sustainable fshing inside and outside the EU, end destructive fshing practicesand deliver air and equitable use o healthy fsh stocks. All o these policies areconsistent with reversing the EU’s trend towards increased dependence on othercountries’ resources.

8/6/2019 2011 Fish Dependence
http://slidepdf.com/reader/full/2011-fish-dependence 27/36Fish Dependence – 2011 Update 25
Appendix
This section includes supporting tables and data that were used in the text or calculations.
Table A1: Total sheries production in the EU (catch + aquaculture) in tonnes live weight
Member state 1995 2000 2005 2006 2007
EU27 9,275,222 8,192,623 6,895,356 6,689,494 6,443,127EU15 8,336,744 7,458,504 6,229,710 6,035,648 5,716,488
Austria 3,322 3,286 2,790 2,863 2,889
Belgium 36,477 31,678 24,983 23,143 24,667
Bulgaria 12,627 10,652 8,578 10,803 13,307
Cyprus 9,772 69,360 4,267 5,725 5,425
Czech Republic 22,608 24,129 24,697 25,077 24,723
Denmark 2,043,638 1,577,683 949,648 895,752 684,181
Estonia 132,345 113,585 100,136 87,584 100,225Finland 171,874 171,822 146,092 162,334 177,404
France 955,920 970,241 840,349 830,597 795,313
Germany 302,925 271,585 330,352 335,521 293,758
Greece 184,361 194,762 198,461 211,286 208,266
Hungary 16,674 19,987 21,270 22,229 22,946
Ireland 417,012 327,484 322,547 264,235 279,650
Italy 611,522 518,680 479,000 489,540 467,631
Latvia 149,719 136,728 151,160 140,955 156,001
Lithuania 59,082 80,985 141,726 156,775 190,874
Malta 5,539 2,820 2,072 8,513 9,834
Netherlands 522,048 571,005 622,636 478,327 467,011
Poland 454,483 253,481 193,166 174,933 180,271
Portugal 268,852 198,656 218,463 236,990 260,504
Romania 69,105 17,099 13,352 15,773 16,497
Slovakia 3,567 2,255 2,648 2,980 4,071
Slovenia 2,956 3,037 2,573 2,500 2,465
Spain 1,402,906 1,378,193 990,579 1,035,762 1,020,908
Sweden 412,145 343,374 262,236 276,804 243,619
UK 1,003,742 900,055 841,574 792,492 790,687
Croatia 20,275 27,944 45,787 51,432 53,089
Turkey 652,585 582,386 546,063 662,073 772,471
Iceland 1,627,585 2,003,603 1,669,464 1,353,317 1,425,413
Norway 2,801,970 3,190,864 3,054,339 2,965,221 3,208,595
Source: Eurostat, European Commission. Fishery Statistics 1995-2008. Eurostat Pocketbooks. 2009 Edition
8/6/2019 2011 Fish Dependence
http://slidepdf.com/reader/full/2011-fish-dependence 28/36Fish Dependence – 2011 Update 26
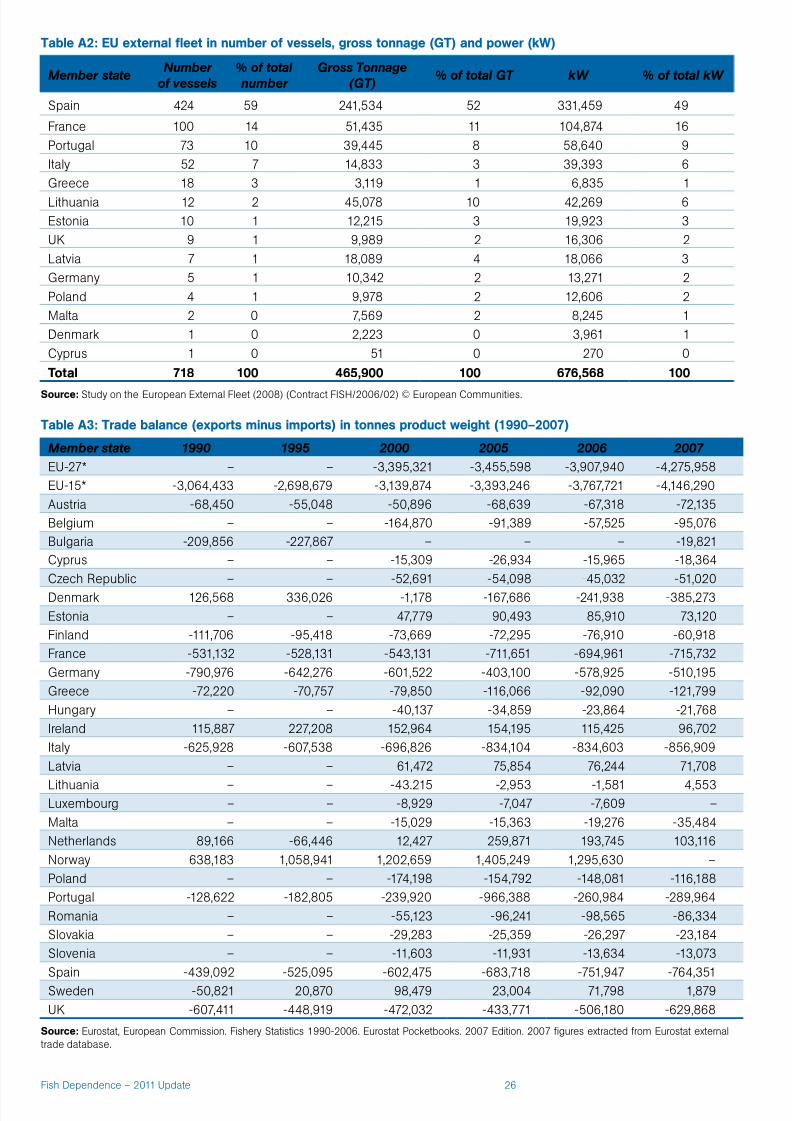
Table A2: EU external eet in number of vessels, gross tonnage (GT) and power (kW)
Member stateNumber
of vessels
% of total
number
Gross Tonnage
(GT)% of total GT kW % of total kW
Spain 424 59 241,534 52 331,459 49
France 100 14 51,435 11 104,874 16
Portugal 73 10 39,445 8 58,640 9
Italy 52 7 14,833 3 39,393 6
Greece 18 3 3,119 1 6,835 1
Lithuania 12 2 45,078 10 42,269 6Estonia 10 1 12,215 3 19,923 3
UK 9 1 9,989 2 16,306 2
Latvia 7 1 18,089 4 18,066 3
Germany 5 1 10,342 2 13,271 2
Poland 4 1 9,978 2 12,606 2
Malta 2 0 7,569 2 8,245 1
Denmark 1 0 2,223 0 3,961 1
Cyprus 1 0 51 0 270 0
Total 718 100 465,900 100 676,568 100
Source: Study on the European External Fleet (2008) (Contract FISH/2006/02) © European Communities.
Table A3: Trade balance (exports minus imports) in tonnes product weight (1990–2007)
Member state 1990 1995 2000 2005 2006 2007
EU-27* – – -3,395,321 -3,455,598 -3,907,940 -4,275,958
EU-15* -3,064,433 -2,698,679 -3,139,874 -3,393,246 -3,767,721 -4,146,290
Austria -68,450 -55,048 -50,896 -68,639 -67,318 -72,135
Belgium – – -164,870 -91,389 -57,525 -95,076
Bulgaria -209,856 -227,867 – – – -19,821
Cyprus – – -15,309 -26,934 -15,965 -18,364
Czech Republic – – -52,691 -54,098 -45,032 -51,020
Denmark 126,568 336,026 -1,178 -167,686 -241,938 -385,273
Estonia – – 47,779 90,493 85,910 73,120
Finland -111,706 -95,418 -73,669 -72,295 -76,910 -60,918
France -531,132 -528,131 -543,131 -711,651 -694,961 -715,732
Germany -790,976 -642,276 -601,522 -403,100 -578,925 -510,195
Greece -72,220 -70,757 -79,850 -116,066 -92,090 -121,799
Hungary – – -40,137 -34,859 -23,864 -21,768
Ireland 115,887 227,208 152,964 154,195 115,425 96,702
Italy -625,928 -607,538 -696,826 -834,104 -834,603 -856,909
Latvia – – 61,472 75,854 76,244 71,708
Lithuania – – -43.215 -2,953 -1,581 4,553Luxembourg – – -8,929 -7,047 -7,609 –
Malta – – -15,029 -15,363 -19,276 -35,484
Netherlands 89,166 -66,446 12,427 259,871 193,745 103,116
Norway 638,183 1,058,941 1,202,659 1,405,249 1,295,630 –
Poland – – -174,198 -154,792 -148,081 -116,188
Portugal -128,622 -182,805 -239,920 -966,388 -260,984 -289,964
Romania – – -55,123 -96,241 -98,565 -86,334
Slovakia – – -29,283 -25,359 -26,297 -23,184
Slovenia – – -11,603 -11,931 -13,634 -13,073
Spain -439,092 -525,095 -602,475 -683,718 -751,947 -764,351
Sweden -50,821 20,870 98,479 23,004 71,798 1,879
UK -607,411 -448,919 -472,032 -433,771 -506,180 -629,868
Source: Eurostat, European Commission. Fishery Statistics 1990-2006. Eurostat Pocketbooks. 2007 Edition. 2007 fgures extracted rom Eurostat externaltrade database.
8/6/2019 2011 Fish Dependence
http://slidepdf.com/reader/full/2011-fish-dependence 29/36Fish Dependence – 2011 Update 27
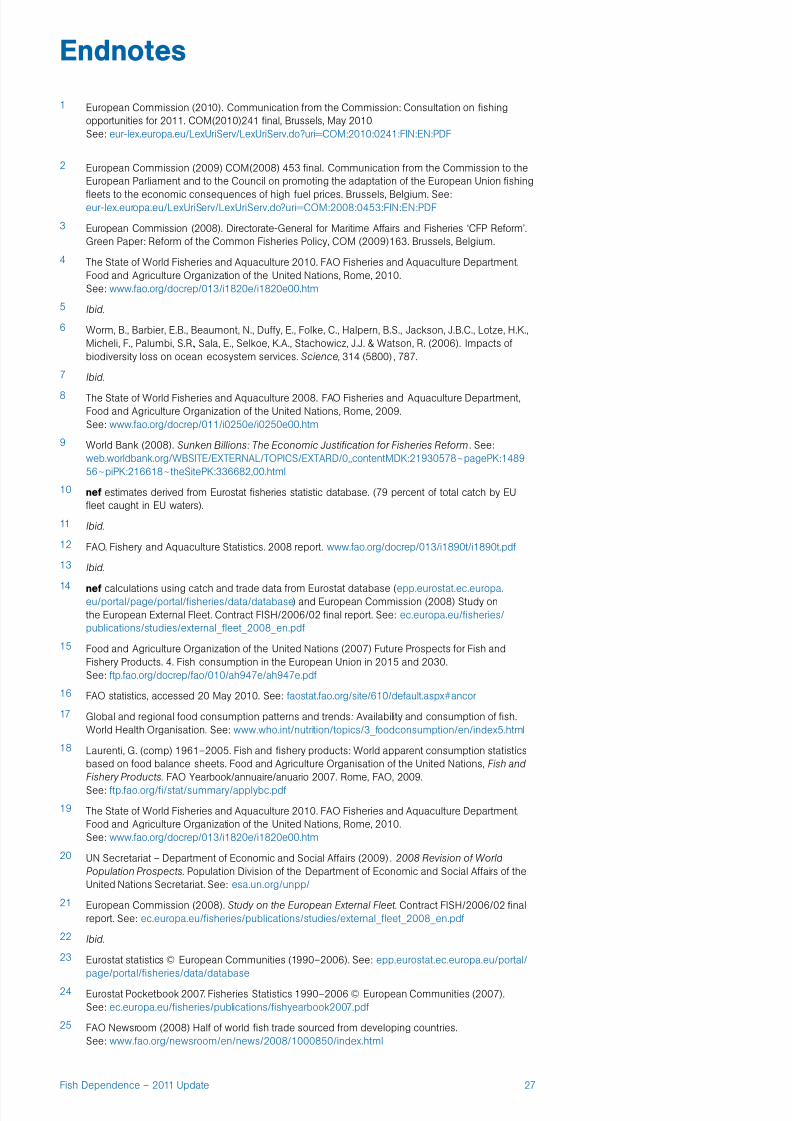
Endnotes
1 European Commission (2010). Communication rom the Commission: Consultation on fshingopportunities or 2011. COM(2010)241 fnal, Brussels, May 2010.See: eur-lex.europa.eu/LexUriServ/LexUriServ.do?uri=COM:2010:0241:FIN:EN:PDF
2 European Commission (2009) COM(2008) 453 fnal. Communication rom the Commission to theEuropean Parliament and to the Council on promoting the adaptation o the European Union fshing
eets to the economic consequences o high uel prices. Brussels, Belgium. See:eur-lex.europa.eu/LexUriServ/LexUriServ.do?uri=COM:2008:0453:FIN:EN:PDF
3 European Commission (2008). Directorate-General or Maritime Aairs and Fisheries ‘CFP Reorm’.Green Paper: Reorm o the Common Fisheries Policy, COM (2009)163. Brussels, Belgium.
4 The State o World Fisheries and Aquaculture 2010. FAO Fisheries and Aquaculture Department,Food and Agriculture Organization o the United Nations, Rome, 2010.See: www.ao.org/docrep/013/i1820e/i1820e00.htm
5 Ibid.
6 Worm, B., Barbier, E.B., Beaumont, N., Duy, E., Folke, C., Halpern, B.S., Jackson, J.B.C., Lotze, H.K.,Micheli, F., Palumbi, S.R., Sala, E., Selkoe, K.A., Stachowicz, J.J. & Watson, R. (2006). Impacts obiodiversity loss on ocean ecosystem services. Science, 314 (5800), 787.
7 Ibid.
8 The State o World Fisheries and Aquaculture 2008. FAO Fisheries and Aquaculture Department,Food and Agriculture Organization o the United Nations, Rome, 2009.See: www.ao.org/docrep/011/i0250e/i0250e00.htm
9 World Bank (2008). Sunken Billions: The Economic Justication for Fisheries Reform. See:web.worldbank.org/WBSITE/EXTERNAL/TOPICS/EXTARD/0,,contentMDK:21930578~pagePK:148956~piPK:216618~theSitePK:336682,00.html
10 nef estimates derived rom Eurostat fsheries statistic database. (79 percent o total catch by EUeet caught in EU waters).
11 Ibid.
12 FAO. Fishery and Aquaculture Statistics. 2008 report. www.ao.org/docrep/013/i1890t/i1890t.pd
13 Ibid.
14 nef calculations using catch and trade data rom Eurostat database (epp.eurostat.ec.europa.eu/portal/page/portal/fsheries/data/database) and European Commission (2008) Study onthe European External Fleet. Contract FISH/2006/02 fnal report. See: ec.europa.eu/fsheries/publications/studies/external_eet_2008_en.pd
15 Food and Agriculture Organization o the United Nations (2007) Future Prospects or Fish andFishery Products. 4. Fish consumption in the European Union in 2015 and 2030.See: tp.ao.org/docrep/ao/010/ah947e/ah947e.pd
16 FAO statistics, accessed 20 May 2010. See: aostat.ao.org/site/610/deault.aspx#ancor
17 Global and regional ood consumption patterns and trends: Availability and consumption o fsh.World Health Organisation. See: www.who.int/nutrition/topics/3_oodconsumption/en/index5.html
18 Laurenti, G. (comp) 1961–2005. Fish and fshery products: World apparent consumption statisticsbased on ood balance sheets. Food and Agriculture Organisation o the United Nations, Fish and
Fishery Products. FAO Yearbook/annuaire/anuario 2007. Rome, FAO, 2009.
See: tp.ao.org/f/stat/summary/appIybc.pd
19 The State o World Fisheries and Aquaculture 2010. FAO Fisheries and Aquaculture Department,Food and Agriculture Organization o the United Nations, Rome, 2010.See: www.ao.org/docrep/013/i1820e/i1820e00.htm
20 UN Secretariat – Department o Economic and Social Aairs (2009). 2008 Revision of World
Population Prospects. Population Division o the Department o Economic and Social Aairs o theUnited Nations Secretariat. See: esa.un.org/unpp/
21 European Commission (2008). Study on the European External Fleet . Contract FISH/2006/02 fnalreport. See: ec.europa.eu/fsheries/publications/studies/external_eet_2008_en.pd
22 Ibid.
23 Eurostat statistics © European Communities (1990–2006). See: epp.eurostat.ec.europa.eu/portal/page/portal/fsheries/data/database
24 Eurostat Pocketbook 2007. Fisheries Statistics 1990–2006 © European Communities (2007).See: ec.europa.eu/fsheries/publications/fshyearbook2007.pd
25 FAO Newsroom (2008) Hal o world fsh trade sourced rom developing countries.See: www.ao.org/newsroom/en/news/2008/1000850/index.html

8/6/2019 2011 Fish Dependence
http://slidepdf.com/reader/full/2011-fish-dependence 30/36Fish Dependence – 2011 Update 28
26 Eurostat – includes EU aquaculture production. Eurostat statistics © European Communities(1990–2006). See: epp.eurostat.ec.europa.eu/portal/page/portal/fsheries/data/database
27 Ibid.– excludes EU aquaculture production.
28 Eurostat statistics © European Communities (1990–2006).See: epp.eurostat.ec.europa.eu/portal/page/portal/fsheries/data/database
29 Eurostat statistics, © European Communities (1990–2006). See: epp.eurostat.ec.europa.eu/tgm/table.do?tab=table&init=1&language=en&pcode=tag00075&plugin=1
30 Eurostat statistics © European Communities (1990–2006). See : epp.eurostat.ec.europa.eu/portal/page/portal/fsheries/data/database.
31 Volpe, J.P. (2005). Dollars without sense: the bait or big-money tuna ranching around the world.BioScience 55 (4): 301–302.
32 James, M.A. & Slaski, R.J. (2009). A Strategic Review of the Potential for Aquaculture to Contribute
to the Future Security of Food and Non-food Products and Services in the UK and Specically
England. Report commissioned by the Department or the Environment and Rural Aairs, UK.
33 Ibid.
34 Naylor, L., Goldberg, R.J., Primavera, J.H., Kautsky, N., Beveridge, M.C.M., Clay, J., Folke, C.,Lubcheno, J., Mooney, H. & Troell, M. (2000). Eect o aquaculture on world fsh supplies. Nature 405: 1017–23. See: www.nature.com/nature/journal/v405/n6790/fg_tab/4051017a0_T2.html
35 Volpe, J.P. (2005). Dollars without sense: the bait or big-money tuna ranching around the world.BioScience 55 (4): 301–302.
36 Dera (Department or Environment, Food and Rural Aairs), UK. See: www2.dera.gov.uk/about/
37 James, M.A. & Slaski, R.J. (2009). A Strategic Review of the Potential for Aquaculture to Contribute
to the Future Security of Food and Non-food Products and Services in the UK and Specically
England. Report commissioned by Department or Environment, Food and Rural Aairs, UK.
38 The State o World Fisheries and Aquaculture 2004. FAO Fisheries and Aquaculture Department,Food and Agriculture Organization o the United Nations, Rome, 2009.See: www.ao.org/docrep/007/y5600e/y5600e00.htm
39 Goldberg, R.J., Elliot, M.S. & Naylor, R.L. (2001). Marine Aquaculture in the United States:
Environmental Impacts and Policy Options. Pew Oceans Commission, Arlington, Virginia.
40 Scottish Executive Central Research Unit (2002). Review and Synthesis of the Environmental
Impacts of Aquaculture. The Scottish Association or Marine Science and Napier University. ScottishExecutive Central Research Unit. Edinburgh: The Stationery Ofce.
41 Pérez, J.E., Alonsi, C., Nirchio, M., Muñon, C. & Gómez, J.A. (2003). The introduction o exotic
species in aquaculture: A solution or part o the problem? Interciencia 28 (4): 234–238.42 Anderson, L. & Greenpeace Genetic Engineering Campaign (2005). Genetically Engineered Fish –
New Threats to the Environment . Amsterdam: Greenpeace.See: www.greenpeace.org/usa/press-center/reports4/genetically-engineered-fsh
43 Naylor, R., Hindar, K., Fleming, I.A., Goldburg, R., Williams, S., Volpe, J., Whoriskey, F., Eagle, J.,Kelso, D., & Mangel, M. (2005). Fugitive salmon: Assessing the risks o escaped fsh rom net-penaquaculture. BioScience 55 (5): 427.
44 Greenpeace and Gene Watch UK (2007). GM Contamination Register .See: www.gmcontaminationregister.org
45 Marine Biological Association (2008). Species and Habitats: Sensitivity assessment rationale.Marine Lie Inormation Network (MarLIN) website. Plymouth: Marine Biological Association o theUK.
46 Tetreault, I. (2006) . Seafood Watch Seafood Report: Farmed Tilapia. Monterey: Monterey BayAquarium. See: www.montereybayaquarium.org
47 Multiple reerences:
Brown, P.B. & Smith, K. (2007). Soybean use – aquaculture (act sheet) Urbandale: Soybean MealInormation Centre. See: www.soymeal.org/pd/aqua.pd
Deutsch, L., Gräslund, S., Folke, C., Troell, M., Huitric, M., Kautsky, N. & Lebel, L. (2007). Feedingaquaculture growth through globalization: Exploitation o marine ecosystems or fshmeal. Global
Environmental Change 17: 238–49.
Huntington, T.C. (2004) . Feeding the Fish: Sustainable sh feed and Scottish aquaculture. Reportto the Joint Marine Programme (Scottish Wildlie Trust and WWF Scotland) and RSPB Scotland.Hampshire: Poseiden Aquatic Resource Management.
Ng, W.K. (2003). The potential use o palm kernel meal in aquaculture eeds Aquaculture Asia 8
(1): 38–39.48 Eurostat statistics © European Communities (1990–2006). See: epp.eurostat.ec.europa.eu/portal/
page/portal/fsheries/data/database
49 European Commission, Contract FISH/2006/02 (2008). Study on the European external eet. Finalreport.

8/6/2019 2011 Fish Dependence
http://slidepdf.com/reader/full/2011-fish-dependence 31/36
8/6/2019 2011 Fish Dependence
http://slidepdf.com/reader/full/2011-fish-dependence 32/36Fish Dependence – 2011 Update 30
J A N
F E B
MA R
A P R
MA Y
J U N
J U L
A U G
S E P
O C T
N OV
D E C
G R E EC E
U K E U2 7
C Z EC H R E P U B L IC
D E N M A R K
S W E D E N
F R A NC E
G E R M A N Y I T A L Y
B E LG I U M M A L T A
L I T H U A N I A
S LO V A K I A S LO V E N I A
RO M A N I A
PO L A N D
S P A I N
F I N L A N D
H U NG A R Y
B U LG A R I A
C Y P R US
A US T R I A
PO R T UG A L
Fish dependence day calendar 2011

8/6/2019 2011 Fish Dependence
http://slidepdf.com/reader/full/2011-fish-dependence 33/36Fish Dependence – 2011 Update 31
© C o r e y A
r n o l d / O C E A N 2 0 1 2

8/6/2019 2011 Fish Dependence
http://slidepdf.com/reader/full/2011-fish-dependence 34/36

8/6/2019 2011 Fish Dependence
http://slidepdf.com/reader/full/2011-fish-dependence 35/36
Connected EconomiesWorking with communities to support practical action or a
just and sustainable uture.
One o the other things we do
nef is working with communities inthe UK and internationally to support
practical action or a more sustainableand just uture.
We believe that local businessesshould be at the heart o allregeneration projects, and produceresearch, policies, programmes andtraining which help communitiesprotect the diversity o their highstreets and the growth o independententerprise. We also help communitiesto reinvent their local economy in
response to climate change, seeking anew low carbon, high well-being modelo local economic development.
Whatever your role is in a community– whether a business leader, a
government ofcial, or a concernedresident – you have a vital role inshaping the local economy. Havea look at our tools which are wellestablished and being used bycommunities across the UK andinternationally.
For more inormation please call020 7820 6300
P h o t o : m u n k t 0 n v i a F l i c k r

8/6/2019 2011 Fish Dependence
http://slidepdf.com/reader/full/2011-fish-dependence 36/36
Written by: Aniol Esteban and Rupert Crilly
Edited by: Martin Cottingham
Design by: the Argument by Design – www.tabd.co.uk
Special thanks to: Markus Knigge, Beatrice Gorez, Helene Bourse, Uta Bellion, Mike Walker, Eleanor Moody, Andy Wimbush,OCEAN2012, and all the people who contributed time and assistance to this project.
I you have any eedback, comments or suggestions to improve this report we would love to hear rom you.E-mail: [email protected]
OCEAN2012
c/o Pew Environment GroupSquare du Bastion 1A
1050 Brussels
new economics foundation
3 Jonathan StreetLondon SE11 5NH
United Kingdom
J A N
F E B
M
A R
A P R
MA Y
J U N
J U L
A U G
S E P
O C T
N OV
D E C
G R E EC E
U K E U2 7
C Z EC H R E P U B L IC
D E N M A R K
S W E D E N
F R A NC E
G E R M A N Y I T A L Y
B E LG I U M M A L T A
L I T H U A N I A
S LO V A K I A S LO V E N I A
RO M A N I A
PO L A N D
S P A I N
F I N L A N D
H U NG A R Y
B U LG A R I A
C Y P R US
A US T R I A
PO R T UG A L
Fish dependence day calendar 2011