2012 2q results presentation - helpe 2q12 results-presentation.pdfsegmental results overview 2q 2012...
TRANSCRIPT
2012 2Q Results Presentation
Athens, 29 August 2012
Energy for life
1
• Executive Summary
• Industry Environment
• Group Results Overview • Segmental Performance
• Financial Results
• Q&A
AGENDA
2
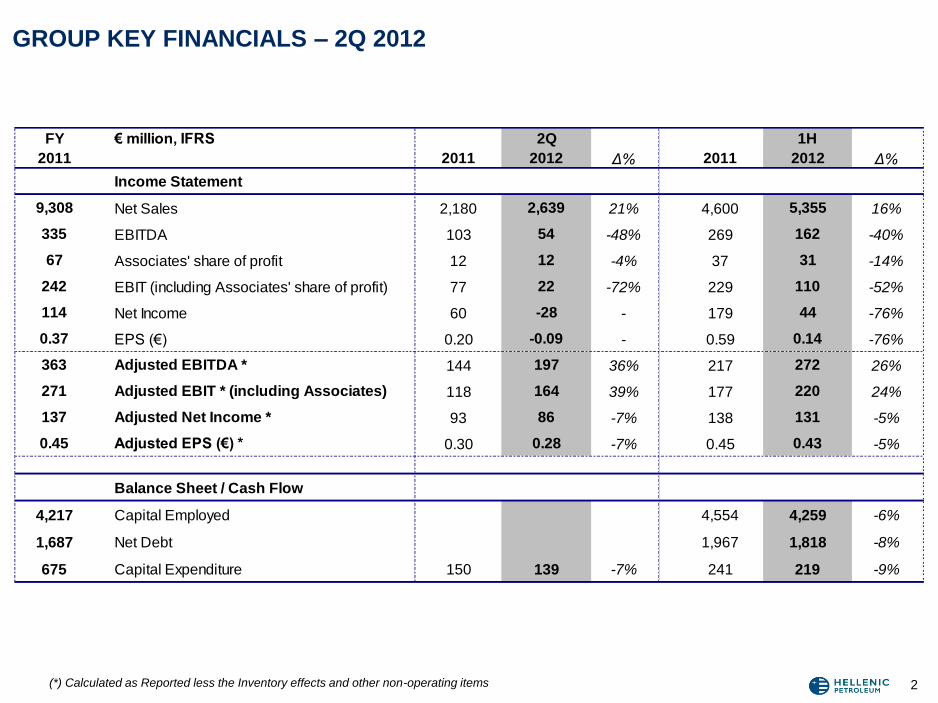
GROUP KEY FINANCIALS – 2Q 2012
(*) Calculated as Reported less the Inventory effects and other non-operating items
FY € million, IFRS 2Q 1H
2011 2011 2012 Δ% 2011 2012 Δ%
Income Statement
9,308 Net Sales 2,180 2,639 21% 4,600 5,355 16%
335 EBITDA 103 54 -48% 269 162 -40%
67 Associates' share of profit 12 12 -4% 37 31 -14%
242 EBIT (including Associates' share of profit) 77 22 -72% 229 110 -52%
114 Net Income 60 -28 - 179 44 -76%
0.37 EPS (€) 0.20 -0.09 - 0.59 0.14 -76%
363 Adjusted EBITDA * 144 197 36% 217 272 26%
271 Adjusted EBIT * (including Associates) 118 164 39% 177 220 24%
137 Adjusted Net Income * 93 86 -7% 138 131 -5%
0.45 Adjusted EPS (€) * 0.30 0.28 -7% 0.45 0.43 -5%
Balance Sheet / Cash Flow
4,217 Capital Employed 4,554 4,259 -6%
1,687 Net Debt 1,967 1,818 -8%
675 Capital Expenditure 150 139 -7% 241 219 -9%
3
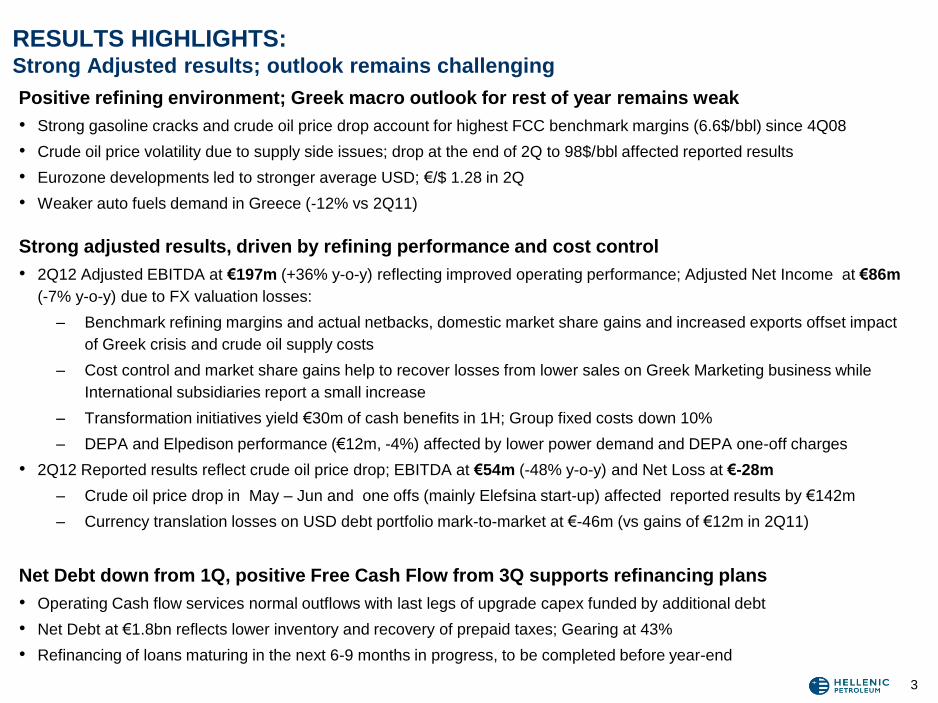
RESULTS HIGHLIGHTS: Strong Adjusted results; outlook remains challenging
Positive refining environment; Greek macro outlook for rest of year remains weak
• Strong gasoline cracks and crude oil price drop account for highest FCC benchmark margins (6.6$/bbl) since 4Q08
• Crude oil price volatility due to supply side issues; drop at the end of 2Q to 98$/bbl affected reported results
• Eurozone developments led to stronger average USD; €/$ 1.28 in 2Q
• Weaker auto fuels demand in Greece (-12% vs 2Q11)
Strong adjusted results, driven by refining performance and cost control
• 2Q12 Adjusted EBITDA at €197m (+36% y-o-y) reflecting improved operating performance; Adjusted Net Income at €86m
(-7% y-o-y) due to FX valuation losses:
– Benchmark refining margins and actual netbacks, domestic market share gains and increased exports offset impact
of Greek crisis and crude oil supply costs
– Cost control and market share gains help to recover losses from lower sales on Greek Marketing business while
International subsidiaries report a small increase
– Transformation initiatives yield €30m of cash benefits in 1H; Group fixed costs down 10%
– DEPA and Elpedison performance (€12m, -4%) affected by lower power demand and DEPA one-off charges
• 2Q12 Reported results reflect crude oil price drop; EBITDA at €54m (-48% y-o-y) and Net Loss at €-28m
– Crude oil price drop in May – Jun and one offs (mainly Elefsina start-up) affected reported results by €142m
– Currency translation losses on USD debt portfolio mark-to-market at €-46m (vs gains of €12m in 2Q11)
Net Debt down from 1Q, positive Free Cash Flow from 3Q supports refinancing plans
• Operating Cash flow services normal outflows with last legs of upgrade capex funded by additional debt
• Net Debt at €1.8bn reflects lower inventory and recovery of prepaid taxes; Gearing at 43%
• Refinancing of loans maturing in the next 6-9 months in progress, to be completed before year-end

4
STRATEGY UPDATE & KEY DEVELOPMENTS Commissioning of new Elefsina refinery completed safely; refinancing process at final
stage
• Start-up of upgraded Elefsina refinery; cash flow from commercial operation in 3Q
• DEPA/DESFA sale process expected to resume and accelerate in 2H12
• Post election environment and start-up of new Elefsina allow refinancing of facilities maturing in
4Q12/1Q13. New loan structure to be in place within 3Q; deleverage over next 12-24 months
• Crude supply chain adjusted to reflect EU sanctions and Elefsina start-up
• Participated in bidding round for exploration licences of Patraikos and Ioannina blocks in Western
Greece in a consortium with Melrose Resources and Edison with equal participation of partners in the
JV and ELPE acting as operator
• Market rationalisation, as a result of excise duty harmonization for auto diesel and heating gasoil,
expected to take place from 15 October 2012, will accrue benefits despite expected impact on
demand

5
• Executive Summary
• Industry Environment
• Group Results Overview • Segmental Performance
• Financial Results
• Q&A
AGENDA
1.10
1.15
1.20
1.25
1.30
1.35
1.40
1.45
1.50
1.55
1.60
€/$
30/6/111.45
30/6/121.26
31/12/111.29
20
40
60
80
100
120
140
160
$/bbl
30/6/11$112.48
30/6/12$97,80
31/12/11$107.38
6
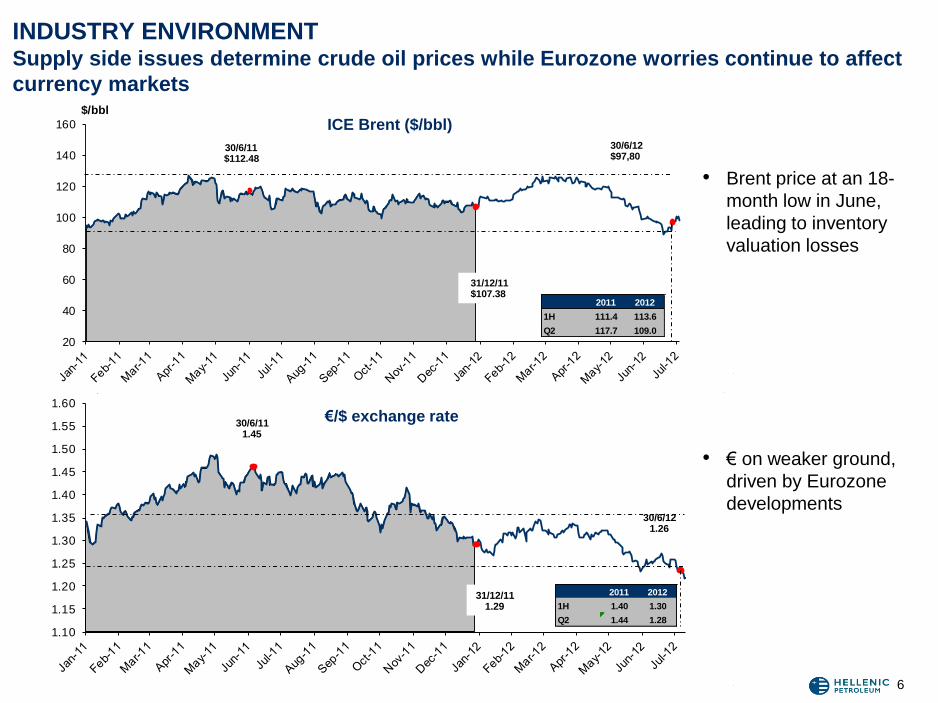
INDUSTRY ENVIRONMENT Supply side issues determine crude oil prices while Eurozone worries continue to affect
currency markets
€/$ exchange rate
ICE Brent ($/bbl)
• Brent price at an 18-
month low in June,
leading to inventory
valuation losses
• € on weaker ground,
driven by Eurozone
developments
2011 2012
1H 111.4 113.6
Q2 117.7 109.0
2011 2012
1H 1.40 1.30
Q2 1.44 1.28
7
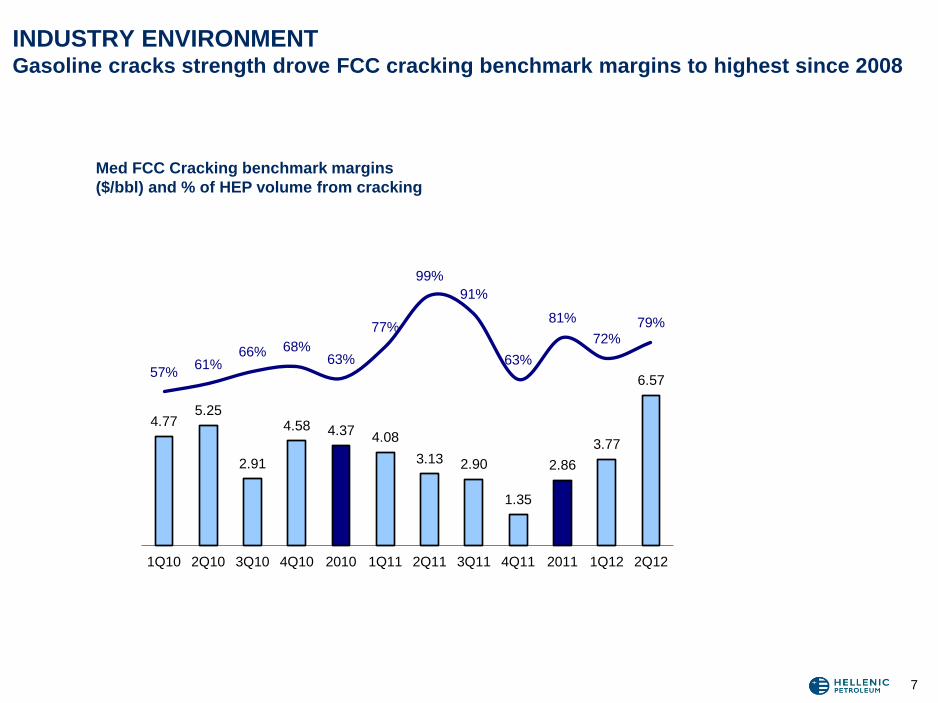
INDUSTRY ENVIRONMENT Gasoline cracks strength drove FCC cracking benchmark margins to highest since 2008
Med FCC Cracking benchmark margins
($/bbl) and % of HEP volume from cracking
4.77 5.25
2.91
4.58 4.37 4.08
3.13 2.90
1.35
2.86
3.77
6.57 57%
61%66% 68%
63%
77%
99%
91%
63%
81%
72%79%
-10%
10%
30%
50%
70%
90%
110%
0.0
2.0
4.0
6.0
8.0
10.0
12.0
1Q10 2Q10 3Q10 4Q10 2010 1Q11 2Q11 3Q11 4Q11 2011 1Q12 2Q12
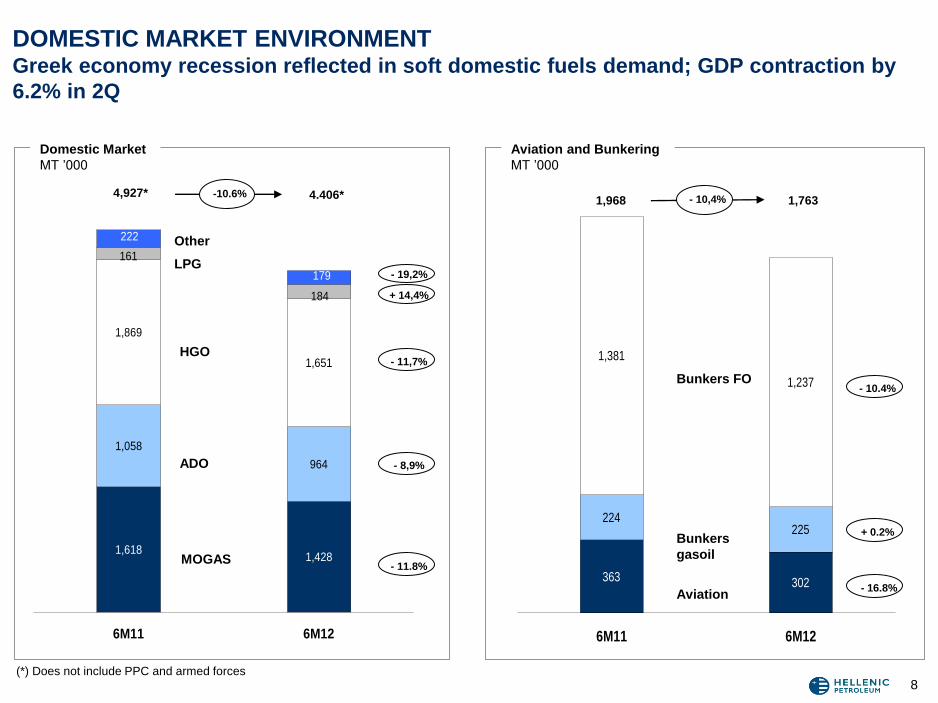
1,6181,428
1,058
964
1,869
1,651
184
161
222
179
6M11 6M12
363 302
224225
1,381
1,237
6M11 6M12
Bunkers FO
Domestic Market
ΜΤ ’000
Aviation and Bunkering
ΜΤ ’000
Bunkers
gasoil
Aviation
4,927* 4.406* -10.6%
- 11.8%
- 8,9%
- 11,7%
+ 14,4%
1,968 1,763
- 16.8%
+ 0.2%
- 10.4%
(*) Does not include PPC and armed forces
DOMESTIC MARKET ENVIRONMENT Greek economy recession reflected in soft domestic fuels demand; GDP contraction by
6.2% in 2Q
- 10,4%
Other
MOGAS
ADO
LPG
HGO
8
- 19,2%

9
• Executive Summary
• Industry Environment
• Group Results Overview • Segmental Performance
• Financial Results
• Q&A
AGENDA

22
16
14
19
55
Petchems Refining Marketing 2Q 11
2
50
6
Other
106
3
Refining
Marketing
Petrochemicals
Other (incl. E&P)
2Q 12
197
156
10
SEGMENTAL RESULTS OVERVIEW 2Q 2012 Strong margins, increased exports and cost control outweigh domestic market impact
and increased supply costs due to Greek crisis and Iran sanctions
Adjusted EBITDA evolution 2Q11 – 2Q12 (€m)
+46% +40%
-29% +53% +35%
EBITDA evolution 1H 1H12 1H11 Δ%
Refining, Supply & Trading 212 150 41%
Marketing 35 35 -
Petrochemicals 22 37 -41%
Other (incl. E&P, intersegment) 3 -5 -
Group Total 272 217 26%
144

11
CASH FLOW & GEARING EBITDA covers operating cash outflows in 1H with Upgrade Capex funded by an
increase in debt
170
162 49
Interest, Tax
& Dividends
28
EBITDA Net Debt
FY 11
1.687
Net Debt
FY 10
1.659
Net Debt 1H12
1.818
Other Cash
Flows
24
Upgrade
Capex
Working
Capital
22
Maintenance
capex
Group Cash flow and Net debt evolution (€m)
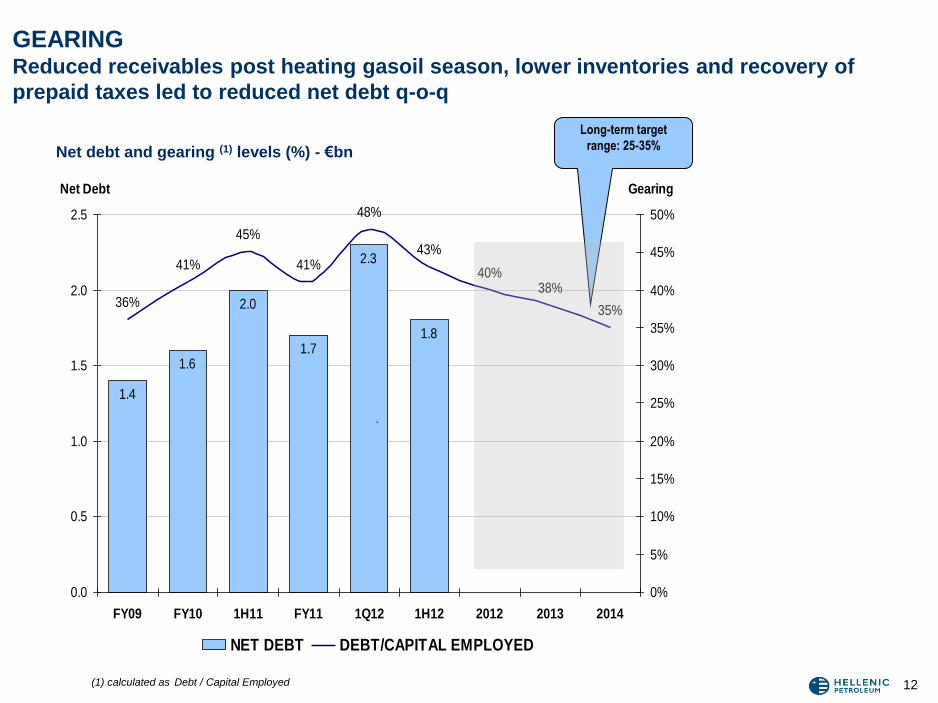
1.4
1.6
2.0
1.7
2.3
1.8
43%
40%38%
35%
48%
41%
45%
36%
41%
0.0
0.5
1.0
1.5
2.0
2.5
FY09 FY10 1H11 FY11 1Q12 1H12 2012 2013 2014
Net Debt
0%
5%
10%
15%
20%
25%
30%
35%
40%
45%
50%
Gearing
NET DEBT DEBT/CAPITAL EMPLOYED
`
GEARING Reduced receivables post heating gasoil season, lower inventories and recovery of
prepaid taxes led to reduced net debt q-o-q
12 (1) calculated as Debt / Capital Employed
Net debt and gearing (1) levels (%) - €bn
Long-term target
range: 25-35%

13
REFINANCING – STRATEGY Refinancing strategy for 40% of Group credit lines formulated based on Elefsina start-up
Group gross debt overview Syndicated €350m Term Loan:
• Repayment upon maturity, as originally planned,
out of existing cash reserves and projected
operating cash flows
Syndicated $1.18bn RCF:
• Partial repayment as above
• New loans of €700-800m will facilitate full
repayment before year end
Facility Maturity Balance 1H12
(EURm)
Syndicated Term Loan €350m Dec 12 350
Syndicated RCF Loan $1.18m Feb 13 925
Bond loan €400m Jun 13 225
EIB Term Loan Jun 22 400
Bilaterals Various 855
Total 2,755
Cash 936

14
REFINANCING - STATUS UPDATE Process accelerated with transaction expected to be launched over the next few weeks
Key refinancing plan Current status
• New loans structures and transaction
documentation completed by appointed
banks
• Selected group of MLAs from existing Greek
and international relationship base, will lead
the syndication process during Sep-Oct.
• Support by MLAs de-risks plan as they
commit a significant part of the targeted
facility amount
• Cost will reflect prevailing market conditions
with a respective impact on average cost of
funding
• Key terms based on existing Group loan
agreements
• Expected drawdown before the year-end
• 2012-15 planned Cash Flow supports
deleveraging
• Refinancing anchored around Greek and
international relationship banks which
supported the Group during the last 5 years
• Structure of new loans matched to cash flow
profile and current environment
• DEPA sale not included in base case
8
6380
9
33
40
4
60
80
9
39
40
-30
20
70
120
170
220
2008 2009 2010 2011 1H2012 Cumulative impact Medium Term Target
15
63
63
24
30 195
240
15
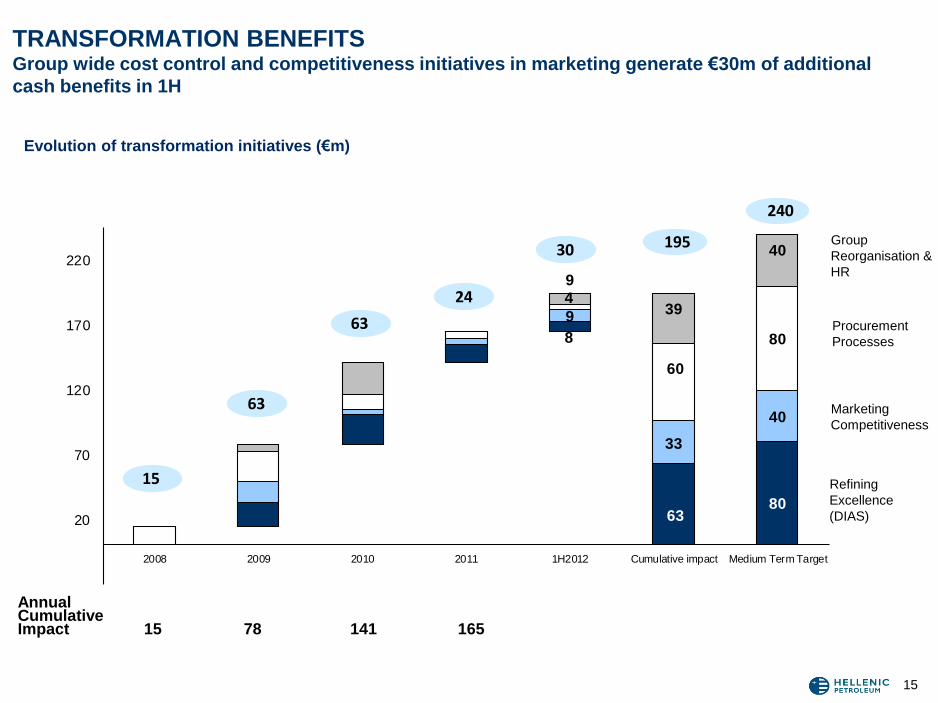
TRANSFORMATION BENEFITS Group wide cost control and competitiveness initiatives in marketing generate €30m of additional
cash benefits in 1H
Evolution of transformation initiatives (€m)
Annual Cumulative Impact 15 78 141 165
Group
Reorganisation &
HR
Procurement
Processes
Marketing
Competitiveness
Refining
Excellence
(DIAS)

16
• Executive Summary
• Industry Environment
• Group Results Overview • Segmental Performance
• Financial Results
• Q&A
AGENDA

17
DOMESTIC REFINING, SUPPLY & TRADING – OVERVIEW Full margin capture due to increased Aspropyrgos utilisation
• Exports and domestic market share gains led to higher sales volume in a declining Greek market
• Increased Naphtha reforming capacity, following Thessaloniki upgrade, allowed capturing of MOGAS-
Naphtha spread and sweet-sour differentials
• Fixed opex down 12% vs last year
• Thessaloniki resumed operation in mid July following scheduled maintenance for CDU and CCR post
upgrade calibration
(*) Calculated as Reported less the Inventory effects and other non-operating items
FY IFRS FINANCIAL STATEMENTS 2Q 1H
2011 € MILLION 2011 2012 Δ% 2011 2012 Δ%
KEY FINANCIALS - GREECE
12,543 Volume (MT '000) 2,815 3,226 15% 6,189 6,570 6%
8,285 Sales 1,883 2,360 25% 4,028 4,891 21%
241 EBITDA 65 16 -75% 197 108 -45%
172 EBIT 48 -6 - 166 66 -60%
652 Capital Expenditure 143 134 5% 230 209 -9%
ADJUSTED RESULTS(*)
249 Adjusted EBITDA 98 152 14% 140 208 49%
KEY INDICATORS
111.3 Average Brent Price ($/bbl) 117.7 109.0 -7% 111.4 113.6 2%
2.86Benchmark FOB MED Cracking
Margin ($/bbl)3.13 6.49 - 3.60 5.13 43%
1.39 Average €/$ Rate (€1 =) 1.44 1.28 -11% 1.40 1.30 -7%

18 (*) Calculated as Reported less the Inventory effects and other non-operating items
Adj. EBITDA evolution 2Q11-2Q12 (€m)
DOMESTIC REFINING, SUPPLY & TRADING – PROFITABILITY Despite exceptional circumstances on crude oil supply, margins, slate optimisation,
domestic market share gains and improved exports drove strong refining performance
49
12
207
152
98
2Q 12 Other Exports Opex
6
Operations, S & T Margins 2Q 11

1,215 1,257
760 742
677
847
2Q 11 2Q 12
19
DOMESTIC REFINING, SUPPLY & TRADING – SALES* Domestic market volumes increase on uninterrupted operation (strikes in 2Q11); higher
exports and reduced imports due to Thessaloniki operation
(*) Ex-refinery sales to end customers or trading companies, excludes crude oil and sales to competitors
Exports
Aviation &
Bunkering
Domestic +3%
-2%
+25%
91% 62%
2Q SALES BY PRODUCT (MT’000) 2Q SALES BY MARKET (MT’000)
% of sales from
production
FO
HGO
MOGAS
Other
+9%
-7%
+14%
-1%
2,846 2,652
+9% ADO
Jet
LPG
+50%
2,846 2,652
20
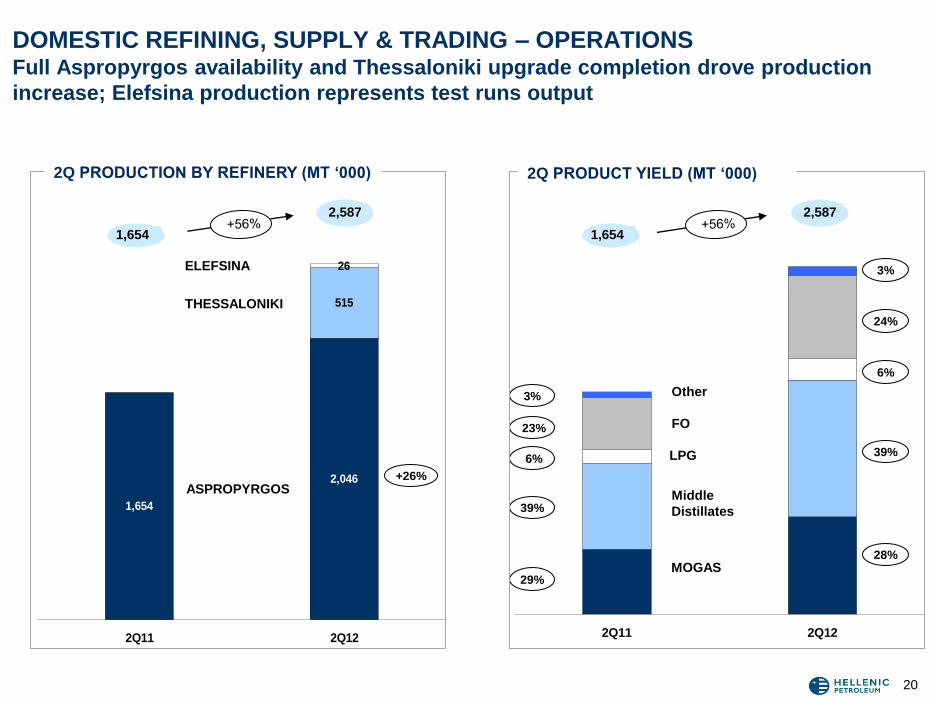
DOMESTIC REFINING, SUPPLY & TRADING – OPERATIONS Full Aspropyrgos availability and Thessaloniki upgrade completion drove production
increase; Elefsina production represents test runs output
2Q11 2Q12
1,654
2,046
515
26
2Q11 2Q12
Other
MOGAS
Middle
Distillates
LPG
ASPROPYRGOS
ELEFSINA
THESSALONIKI
1,654
2,587
FO
39%
28%
24%
3%
39%
29%
23%
3%
6%
+26%
6%
2Q PRODUCT YIELD (MT ‘000) 2Q PRODUCTION BY REFINERY (MT ‘000)
1,654
2,587
21
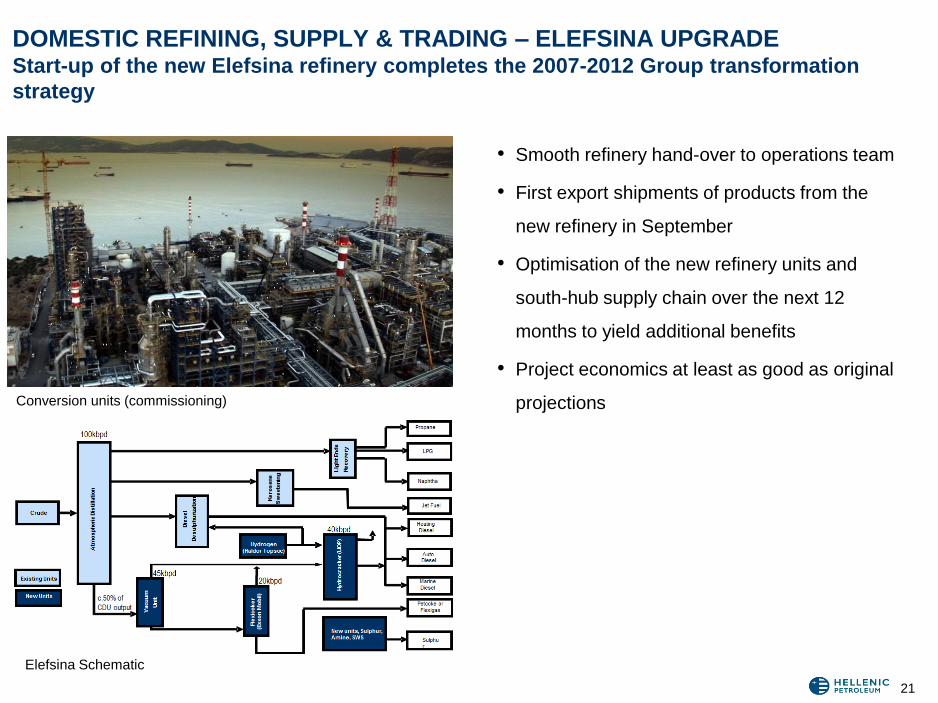
DOMESTIC REFINING, SUPPLY & TRADING – ELEFSINA UPGRADE Start-up of the new Elefsina refinery completes the 2007-2012 Group transformation
strategy
• Smooth refinery hand-over to operations team
• First export shipments of products from the
new refinery in September
• Optimisation of the new refinery units and
south-hub supply chain over the next 12
months to yield additional benefits
• Project economics at least as good as original
projections
Elefsina Schematic
Conversion units (commissioning)
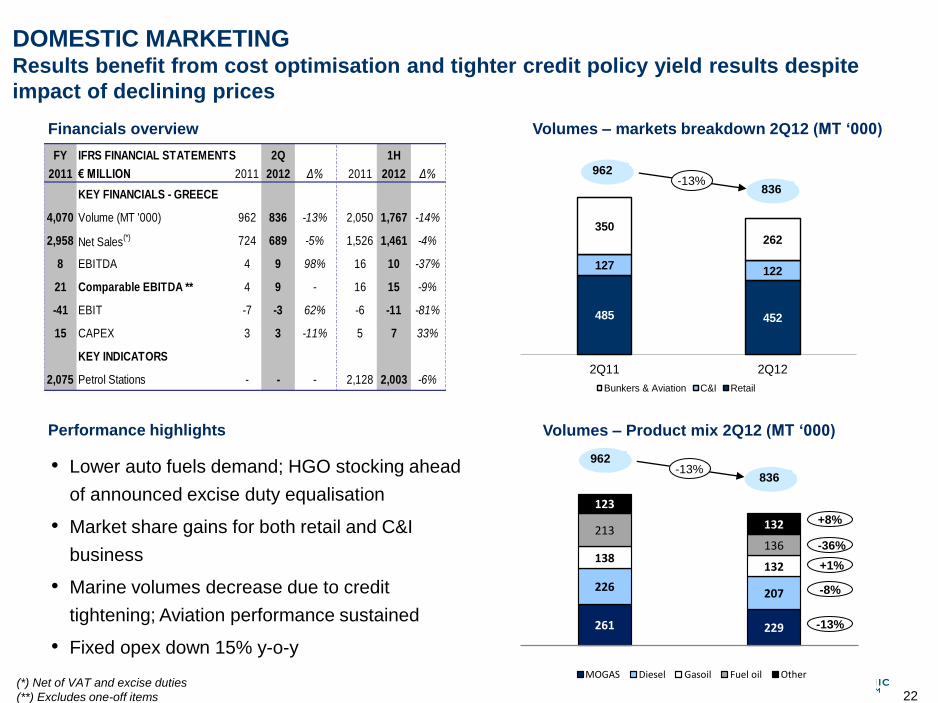
485 452
127122
350262
2Q11 2Q12
Bunkers & Aviation C&I Retail
261 229
226207
138132
213136
123
132
MOGAS Diesel Gasoil Fuel oil Other
22
Volumes – Product mix 2Q12 (MT ‘000)
Volumes – markets breakdown 2Q12 (MT ‘000)
DOMESTIC MARKETING Results benefit from cost optimisation and tighter credit policy yield results despite
impact of declining prices
• Lower auto fuels demand; HGO stocking ahead
of announced excise duty equalisation
• Market share gains for both retail and C&I
business
• Marine volumes decrease due to credit
tightening; Aviation performance sustained
• Fixed opex down 15% y-o-y
962
836 -13%
Financials overview
Performance highlights
962
836 -13%
(*) Net of VAT and excise duties
(**) Excludes one-off items
-8%
-13%
-36%
+8%
+1%
FY IFRS FINANCIAL STATEMENTS 2Q 1H
2011 € MILLION 2011 2012 Δ% 2011 2012 Δ%
KEY FINANCIALS - GREECE
4,070 Volume (MT '000) 962 836 -13% 2,050 1,767 -14%
2,958 Net Sales(*) 724 689 -5% 1,526 1,461 -4%
8 EBITDA 4 9 98% 16 10 -37%
21 Comparable EBITDA ** 4 9 - 16 15 -9%
-41 EBIT -7 -3 62% -6 -11 -81%
15 CAPEX 3 3 -11% 5 7 33%
KEY INDICATORS
2,075 Petrol Stations - - - 2,128 2,003 -6%

72 71
147 161
9721
2166
Gasoline Middle Distillates Fuel Oil LPG - fuel Other
39 29
5555
10199
54 82
70
SERBIA MONTENEGRO CYPRUS BULGARIA OTHER
23
Financials overview
Performance highlights Volumes – product mix 2Q12 (MT ‘000)
Volumes – markets breakdown 2Q12 (MT ‘000)
INTERNATIONAL MARKETING Stronger results, despite weak macros. Improved performance in Bulgaria and Montenegro offset
weaker market in Serbia
• Sales volumes increased driven by wholesale
and market share gains in Bulgaria
• Sustained profitability in Cyprus despite
negative macro and demand slowdown
• Improved margins and market shares
supported profitability in Montenegro
• Serbia affected by economic crisis supressing
demand and margins
256 266 +4%
256 266 +4%
(*) Net of VAT and excise duties
FY IFRS FINANCIAL STATEMENTS 2Q 1H
2011 € MILLION 2011 2012 Δ% 2011 2012 Δ%
KEY FINANCIALS - INTERNATIONAL
1,056 Volume (MT '000) 256 266 4% 489 496 1%
995 Net Sales(*) 247 268 8% 455 500 10%
46 EBITDA 11 11 0% 18 19 2%
-1 One-offs 0 1 - 0 1 -
45 Comparable EBITDA 11 12 11% 18 20 8%
30 EBIT 7 8 4% 11 11 7%
7 CAPEX 3 1 -56% 5 2 -53%
KEY INDICATORS
294 Petrol Stations - - - 283 261 -8%
6 62
2313
1434
48
2
1
-
10
20
30
40
50
60
70
80
90
100
Q2 11 Q2 12
MT '000
Other PP Caustic Soda Solvents BOPP Film
61 9557%
24
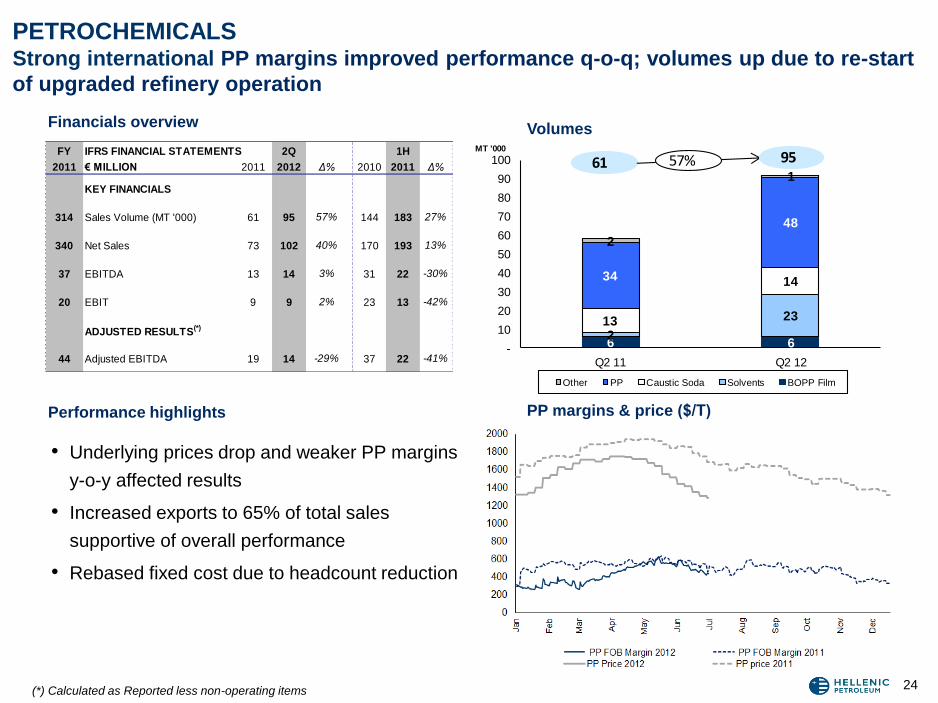
PETROCHEMICALS Strong international PP margins improved performance q-o-q; volumes up due to re-start
of upgraded refinery operation
(*) Calculated as Reported less non-operating items
Financials overview Volumes
PP margins & price ($/Τ) Performance highlights
• Underlying prices drop and weaker PP margins
y-o-y affected results
• Increased exports to 65% of total sales
supportive of overall performance
• Rebased fixed cost due to headcount reduction
FY IFRS FINANCIAL STATEMENTS 2Q 1H
2011 € MILLION 2011 2012 Δ% 2010 2011 Δ%
KEY FINANCIALS
314 Sales Volume (MT '000) 61 95 57% 144 183 27%
340 Net Sales 73 102 40% 170 193 13%
37 EBITDA 13 14 3% 31 22 -30%
20 EBIT 9 9 2% 23 13 -42%
ADJUSTED RESULTS(*)
44 Adjusted EBITDA 19 14 -29% 37 22 -41%

12,74412,353
14,829
12,434
12,925
11,711
14,474
12,761
13,143
11,387
10,000
12,000
14,000
16,000
18,000
1Q 2Q 3Q 4Q
2010 2011 2012
72.2
82.2
63.7
45.3 44.4
58.9
0.0
10.0
20.0
30.0
40.0
50.0
60.0
70.0
80.0
90.0
SMP 2012 €/MWh SMP 2011 €/MWh
53% 54%
28% 29%
8% 7%5% 6%6% 3%
1H 11 1H12
Imports RES Hydro NatGas Lignite
25 Source: HTSO
POWER GENERATION: 50% stake in Elpedison Elpedison EBITDA at €13m (-30% y-o-y) as electricity demand declined on milder weather
conditions and economic crisis
• Consumption down 3% in 2Q y-o-y due to
reduced retail and commercial demand
• Increased RES participation in energy mix y-o-y
vs imports
• Lower production from Elpedison due to weak
demand and scheduled Thisvi maintenance
• Comparison vs last year affected by impact of
PPC strikes
Power consumption (GWh) / SMP (€/MWh)
System energy mix (GWh)
Performance highlights
Financials overview
GWh €/MWh
24,529 24,637 FY FINANCIAL STATEMENTS 2Q 1H
2011 € MILLION 2011 2012 Δ% 2011 2012 Δ%
KEY FINANCIALS
4,279 Net production (MWh '000) 1,141 839 -26% 2,045 1,855 -9%
432 Sales 104 104 0% 185 218 18%
61 EBITDA 19 13 -30% 31 29 -8%
32 EBIT 11 6 -49% 17 14 -15%
1.00
0.730.75
0.84
1.13
0.950.97
1.26
1.50
0.84
0.00
0.20
0.40
0.60
0.80
1.00
1.20
1.40
1.60
Q1 Q2 Q3 Q4
2010 2011 2011
26
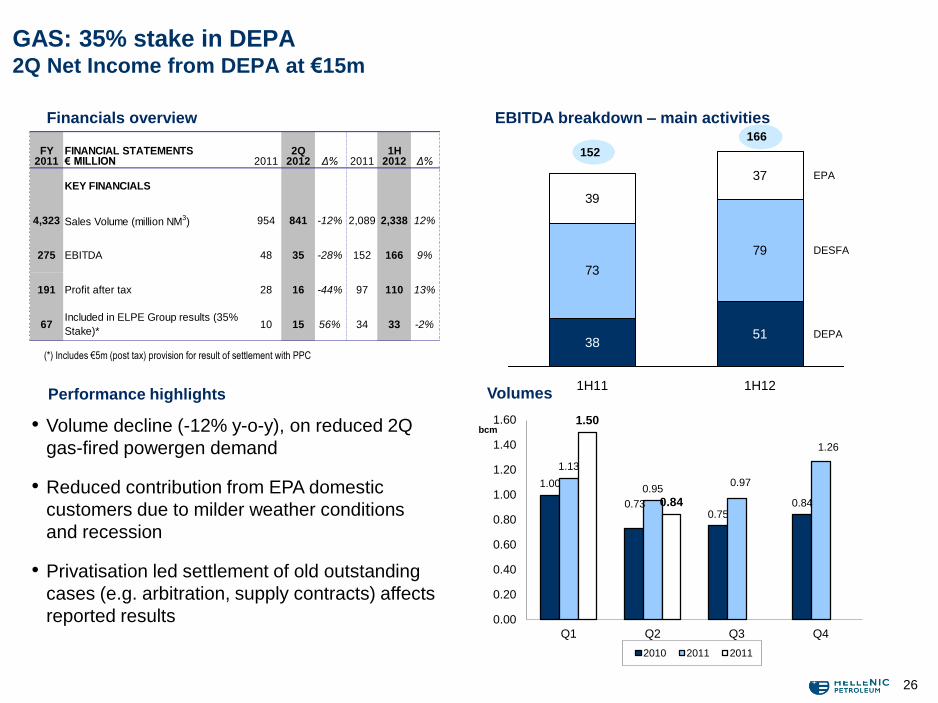
GAS: 35% stake in DEPA 2Q Net Income from DEPA at €15m
• Volume decline (-12% y-o-y), on reduced 2Q
gas-fired powergen demand
• Reduced contribution from EPA domestic
customers due to milder weather conditions
and recession
• Privatisation led settlement of old outstanding
cases (e.g. arbitration, supply contracts) affects
reported results
(*) Includes €5m (post tax) provision for result of settlement with PPC
Volumes Performance highlights
Financials overview EBITDA breakdown – main activities
73
79
39
37
DEPA
DESFA
EPA
1H12
51
1H11
38
FY FINANCIAL STATEMENTS 2Q 1H2011 € MILLION 2011 2012 Δ% 2011 2012 Δ%
KEY FINANCIALS
4,323 Sales Volume (million NM3) 954 841 -12% 2,089 2,338 12%
275 EBITDA 48 35 -28% 152 166 9%
191 Profit after tax 28 16 -44% 97 110 13%
67Included in ELPE Group results (35%
Stake)*10 15 56% 34 33 -2%
166
152
bcm

27
• Executive Summary
• Industry Environment
• Group Results Overview
• Segmental Performance
• Financial Results
• Q&A
AGENDA

28
2Q 2012 FINANCIAL RESULTS GROUP PROFIT & LOSS ACCOUNT
(*) Includes headcount reduction
FY IFRS FINANCIAL STATEMENTS 2Q 1H
2011 € MILLION 2011 2012 Δ % 2011 2012 Δ %
9,308 Sales 2,180 2,639 21% 4,600 5,355 16%
(8,657) Cost of sales (2,012) (2,544) (26%) (4,205) (5,096) (21%)
650 Gross profit 168 95 (44%) 395 260 (34%)
(467) Selling, distribution and administrative expenses (112) (91) 19% (220) (189) 14%
(4) Exploration expenses (1) (1) 0% (2) (1) 27%
(5) Other operating (expenses) / income - net* 10 7 (31%) 19 9 (54%)
175 Operating profit (loss) 65 10 (84%) 193 78 (59%)
(68) Finance costs - net (14) (10) 30% (30) (21) 30%
(11) Currency exchange gains /(losses) 12 (46) - 39 (28) -
67 Share of operating profit of associates 12 12 (4%) 37 31 (14%)
163 Profit before income tax 76 (34) - 238 61 (74%)
(46) Income tax expense / (credit) (13) 5 - (53) (19) 65%
118 Profit for the period 63 (28) - 185 43 (77%)
(4) Minority Interest (3) 1 - (6) 1 -
114 Net Income (Loss) 60 (28) - 179 44 (76%)
0.37 Basic and diluted EPS (in €) 0.20 (0.09) - 0.59 0.14 (76%)
335 Reported EBITDA 103 54 (48%) 269 162 (40%)

29
2Q 2012 FINANCIAL RESULTS REPORTED VS ADJUSTED EBITDA
FY (€ million) 2Q 1H
2011 2011 2012 2011 2012
335 Reported EBITDA 103 54 269 162
28 Inventory effect & one-offs 41 142 -52 110
363 Adjusted EBITDA 144 197 217 272
30
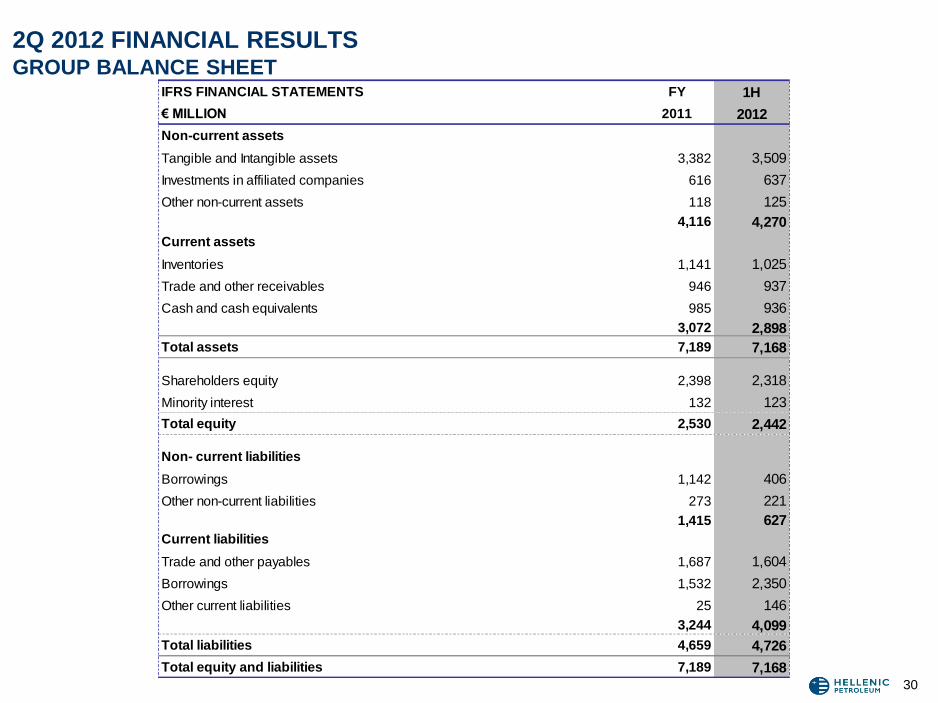
2Q 2012 FINANCIAL RESULTS GROUP BALANCE SHEET
IFRS FINANCIAL STATEMENTS FY 1H
€ MILLION 2011 2012
Non-current assets
Tangible and Intangible assets 3,382 3,509
Investments in affiliated companies 616 637
Other non-current assets 118 125
4,116 4,270
Current assets
Inventories 1,141 1,025
Trade and other receivables 946 937
Cash and cash equivalents 985 936
3,072 2,898
Total assets 7,189 7,168
Shareholders equity 2,398 2,318
Minority interest 132 123
Total equity 2,530 2,442
Non- current liabilities
Borrowings 1,142 406
Other non-current liabilities 273 221
1,415 627
Current liabilities
Trade and other payables 1,687 1,604
Borrowings 1,532 2,350
Other current liabilities 25 146
3,244 4,099
Total liabilities 4,659 4,726
Total equity and liabilities 7,189 7,168

31
2Q 2012 FINANCIAL RESULTS GROUP CASH FLOW
FY IFRS FINANCIAL STATEMENTS 1H 1H
2011 € MILLION 2011 2012
Cash flows from operating activities
843 Cash generated from operations (72) 125
(43) Income and other taxes paid (11) (3)
800 Net cash (used in) / generated from operating activities (82) 122
Cash flows from investing activities
(675) Purchase of property, plant and equipment & intangible assets (241) (219)
3 Sale of property, plant and equipment & intangible assets 1 1
26 Interest received 11 7
(1) Investments in associates (0) (1)
(637) Net cash used in investing activities (228) (212)
Cash flows from financing activities
(91) Interest paid (40) (27)
(88) Dividends paid (3) (2)
933 Proceeds from borrowings 574 349
(702) Repayment of borrowings (109) (283)
219 Net cash generated from / (used in ) financing activities 423 37
383 Net increase/(decrease) in cash & cash equivalents 112 (53)
596 Cash & cash equivalents at the beginning of the period 596 985
5 Exchange losses on cash & cash equivalents 1 3
384 Net increase/(decrease) in cash & cash equivalents 112 (53)
985 Cash & cash equivalents at end of the period 709 936

32 (*) Calculated as Reported less the Inventory effects and other non-operating items
2Q 2012 FINANCIAL RESULTS SEGMENTAL ANALYSIS
FY 2Q 1H
2011 € million, IFRS 2011 2012 Δ% 2011 2012 Δ%
Reported EBITDA
251 Refining, Supply & Trading 71 17 -76% 208 110 -47%
54 Marketing 16 20 27% 35 29 -16%
37 Petrochemicals 13 14 3% 31 22 -30%
343 Core Business 100 51 -49% 274 161 -41%
-8 Other (incl. E&P) 3 3 1% -5 2 -
335 Total 103 54 -48% 269 162 -40%
120 Associates (Power & Gas) share attributable to Group 27 17 -36% 70 69 -1%
Adjusted EBITDA (*)
259 Refining, Supply & Trading 106 156 46% 150 212 41%
66 Marketing 16 22 40% 35 35 0%
44 Petrochemicals 19 14 -29% 37 22 -41%
368 Core Business 142 191 35% 222 269 21%
-5 Other (incl. E&P) 3 5 53% -5 3 -
363 Total 145 197 35% 217 272 26%
120 Associates (Power & Gas) share attributable to Group 27 17 -36% 70 69 -1%
Adjusted EBIT (*)
182 Refining, Supply & Trading 88 132 50% 114 167 47%
1 Marketing 0 7 - 4 5 29%
27 Petrochemicals 15 9 -38% 29 13 -54%
210 Core Business 103 148 44% 146 186 27%
-6 Other (incl. E&P) 3 4 40% -6 2 -
203 Total 106 153 44% 141 188 34%
91 Associates (Power & Gas) share attributable to Group 18 10 -45% 52 54 4%
33
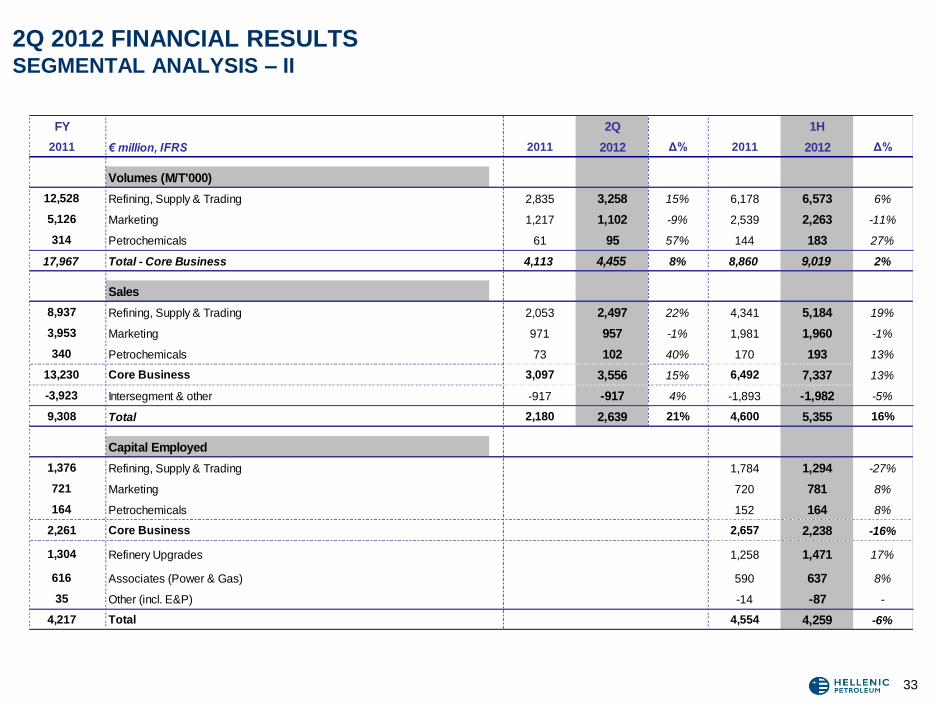
2Q 2012 FINANCIAL RESULTS SEGMENTAL ANALYSIS – II
FY 2Q 1H
2011 € million, IFRS 2011 2012 Δ% 2011 2012 Δ%
Volumes (M/T'000)
12,528 Refining, Supply & Trading 2,835 3,258 15% 6,178 6,573 6%
5,126 Marketing 1,217 1,102 -9% 2,539 2,263 -11%
314 Petrochemicals 61 95 57% 144 183 27%
17,967 Total - Core Business 4,113 4,455 8% 8,860 9,019 2%
Sales
8,937 Refining, Supply & Trading 2,053 2,497 22% 4,341 5,184 19%
3,953 Marketing 971 957 -1% 1,981 1,960 -1%
340 Petrochemicals 73 102 40% 170 193 13%
13,230 Core Business 3,097 3,556 15% 6,492 7,337 13%
-3,923 Intersegment & other -917 -917 4% -1,893 -1,982 -5%
9,308 Total 2,180 2,639 21% 4,600 5,355 16%
Capital Employed
1,376 Refining, Supply & Trading 1,784 1,294 -27%
721 Marketing 720 781 8%
164 Petrochemicals 152 164 8%
2,261 Core Business 2,657 2,238 -16%
1,304 Refinery Upgrades 1,258 1,471 17%
616 Associates (Power & Gas) 590 637 8%
35 Other (incl. E&P) -14 -87 -
4,217 Total 4,554 4,259 -6%

34
2Q 2012 FINANCIAL RESULTS INTERNATIONAL REFINING
FY IFRS FINANCIAL STATEMENTS 2Q 1H
2011 € MILLION 2011 2012 Δ% 2011 2012 Δ%
KEY FINANCIALS - INTERNATIONAL
930 Volume (MT '000) 237 175 -26% 456 378 -17%
653 Sales 170 137 -19% 313 293 -6%
10 EBITDA 6 1 -80% 11 2 -83%
2 EBIT 4 -1 - 7 -2 -
ADJUSTED RESULTS(*)
10 Adjusted EBITDA 8 4 -49% 11 5 -55%
(*) Calculated as Reported less the Inventory effects and other non-operating items

35
• Executive Summary
• Industry Environment
• Group Results Overview
• Segmental Performance
• Financial Results
• Q&A
AGENDA
36
DISCLAIMER
Forward looking statements
Hellenic Petroleum do not in general publish forecasts regarding their future financial
results. The financial forecasts contained in this document are based on a series of
assumptions, which are subject to the occurrence of events that can neither be
reasonably foreseen by Hellenic Petroleum, nor are within Hellenic Petroleum's control.
The said forecasts represent management's estimates, and should be treated as mere
estimates. There is no certainty that the actual financial results of Hellenic Petroleum
will be in line with the forecasted ones.
In particular, the actual results may differ (even materially) from the forecasted ones
due to, among other reasons, changes in the financial conditions within Greece,
fluctuations in the prices of crude oil and oil products in general, as well as fluctuations
in foreign currencies rates, international petrochemicals prices, changes in supply and
demand and changes of weather conditions. Consequently, it should be stressed that
Hellenic Petroleum do not, and could not reasonably be expected to, provide any
representation or guarantee, with respect to the creditworthiness of the forecasts.
This presentation also contains certain financial information and key performance
indicators which are primarily focused at providing a “business” perspective and as a
consequence may not be presented in accordance with International Financial
Reporting Standards (IFRS).