2012 crime victimization survey - thailand institute of ... · 2012 crime victimization survey...
TRANSCRIPT
2012 Crime Victimization
Survey
PHILIPPINE STATISTICS AUTHORITY
1

OUTLINE OF PRESENTATION
• Introduction
• Objectives
• Sampling Design
• Training
• Organizational Set-up
• Quality Assurance
• Budget
• Questionnaire
• Preliminary Results
2
INTRODUCTION
• Crime statistics in the philippines is generated mostly from administrative based reporting system.
• Occasionally, NAPOLCOM conduct crime
related surveys in selected areas
• Crime victimization survey can provide
information that will add up to statistics and
data from police records.
3
INTRODUCTION
The Philippines is signatory to various international
conventions and declarations to promote and
maintain peace and security within its territory and
across nations. These are:
1) the 1985 UN Declaration of Basic Principles of
Justice for Victims of Crime and Abuse of Power,
2) UN Convention Against Transnational Organized
Crime,
4
INTRODUCTION
3) Universal Declaration of Human Rights,
4) Convention on the Rights of Children,
5) Beijing Platform of Action,
6) Millennium Declaration.
5
2012 CRIME VICTIMIZATION SURVEY
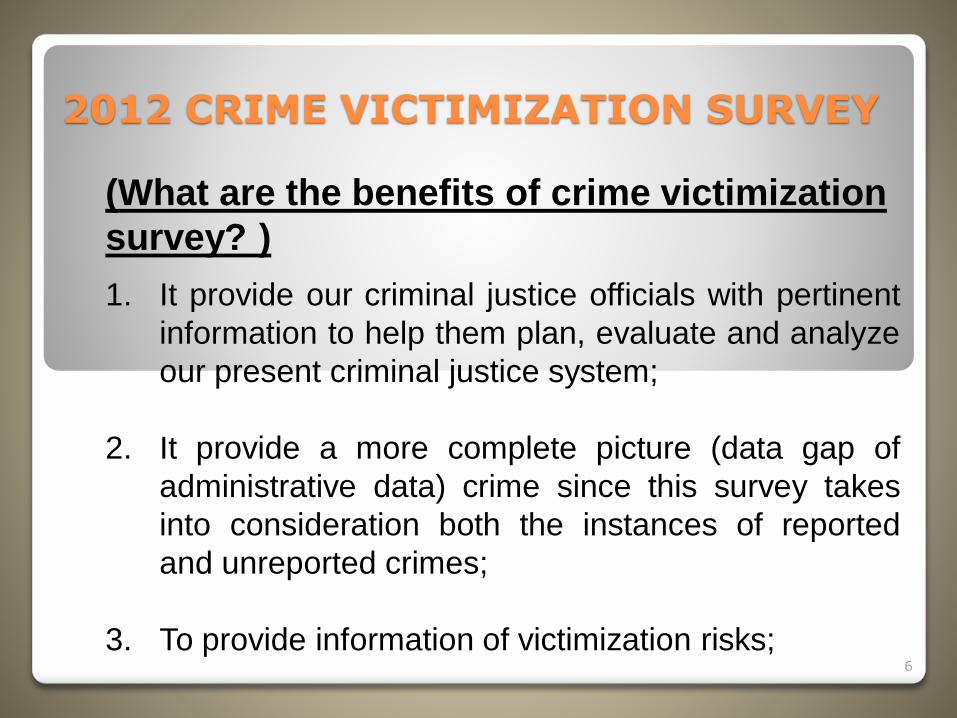
(What are the benefits of crime victimization
survey? )
1. It provide our criminal justice officials with pertinent
information to help them plan, evaluate and analyze
our present criminal justice system;
2. It provide a more complete picture (data gap of
administrative data) crime since this survey takes
into consideration both the instances of reported
and unreported crimes;
3. To provide information of victimization risks;6
2012 CRIME VICTIMIZATION SURVEY
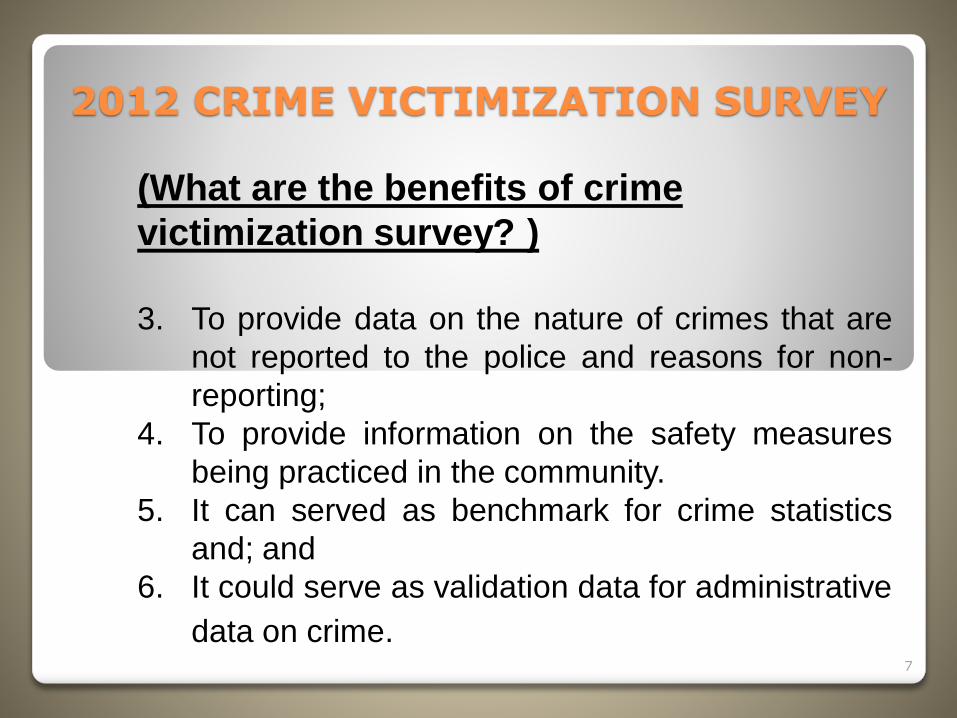
(What are the benefits of crime
victimization survey? )
3. To provide data on the nature of crimes that are
not reported to the police and reasons for non-
reporting;
4. To provide information on the safety measures
being practiced in the community.
5. It can served as benchmark for crime statistics
and; and
6. It could serve as validation data for administrative
data on crime.7
2012 CRIME VICTIMIZATION SURVEY
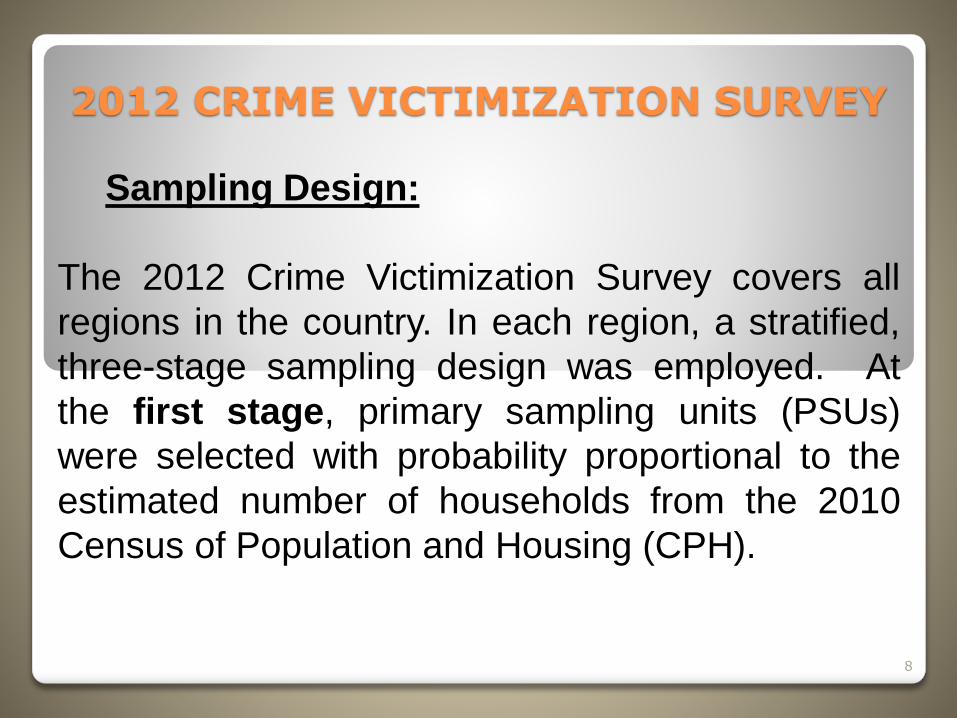
Sampling Design:
The 2012 Crime Victimization Survey covers all
regions in the country. In each region, a stratified,
three-stage sampling design was employed. At
the first stage, primary sampling units (PSUs)
were selected with probability proportional to the
estimated number of households from the 2010
Census of Population and Housing (CPH).
8
2012 CRIME VICTIMIZATION SURVEY
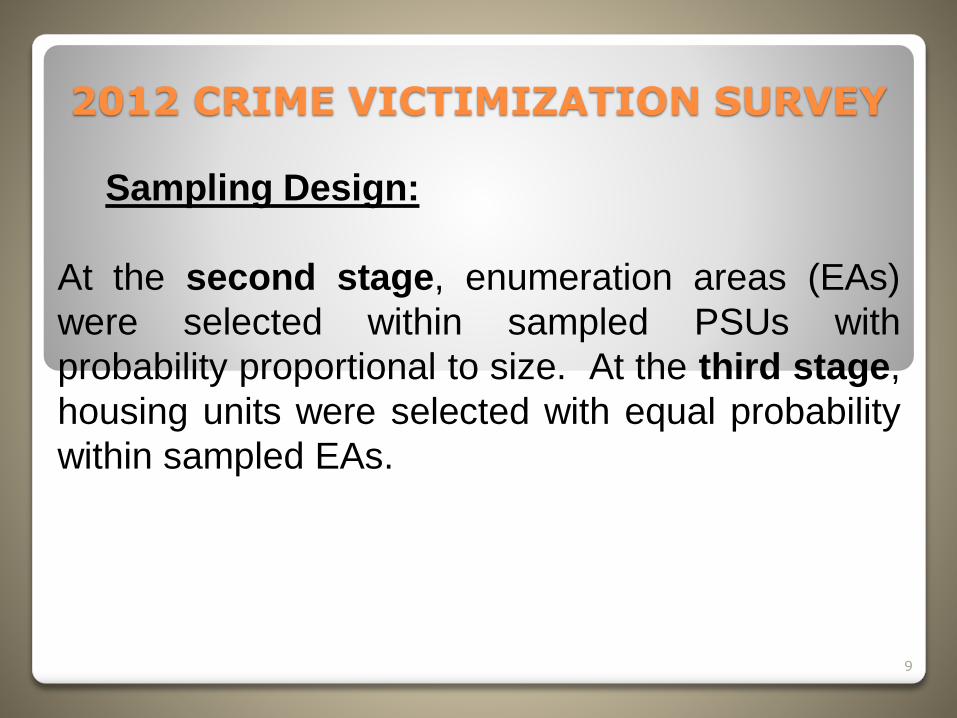
Sampling Design:
At the second stage, enumeration areas (EAs)
were selected within sampled PSUs with
probability proportional to size. At the third stage,
housing units were selected with equal probability
within sampled EAs.
9
2012 CRIME VICTIMIZATION SURVEY
Sampling Design:
Sampling Frame – 2010 Census of
Population and Housing. Each sample hhs was
visited and any responsible member of the hhs
were interviewed using the Labor Force Survey
Questionnaire.
10
2012 CRIME VICTIMIZATION SURVEY
Sampling Design:
At most 30 sample housing units were enumerated
per sample EA. Generally, all sample households
in the sample housing units were interviewed
except for HU with more than 3 households, in
such a case only 3 hhs were interviewed.
The eligible respondent for CVS are members of
the household 15 years old and over who had
been a victim of crime.11
2012 CRIME VICTIMIZATION SURVEY
Respondent Selection (Challenges):
At the household level, two types of selection was done
before October 22, 2012. The following is considered in the
selection of respondent:
1. All household member who are victim of crime were
selected for interview (Certainty).
2. If no household member is a victim of crime only one
respondent is selected for the question in the security
section.
October 22, 2012 onwards all members of the household
15 years old over were interviewed.
12
2012 CRIME VICTIMIZATION SURVEY
Training:
• First Level Training (Manila)
• Second Level Training (17 Regional Offices)
• Third Level Training (Provincial Offices)
13
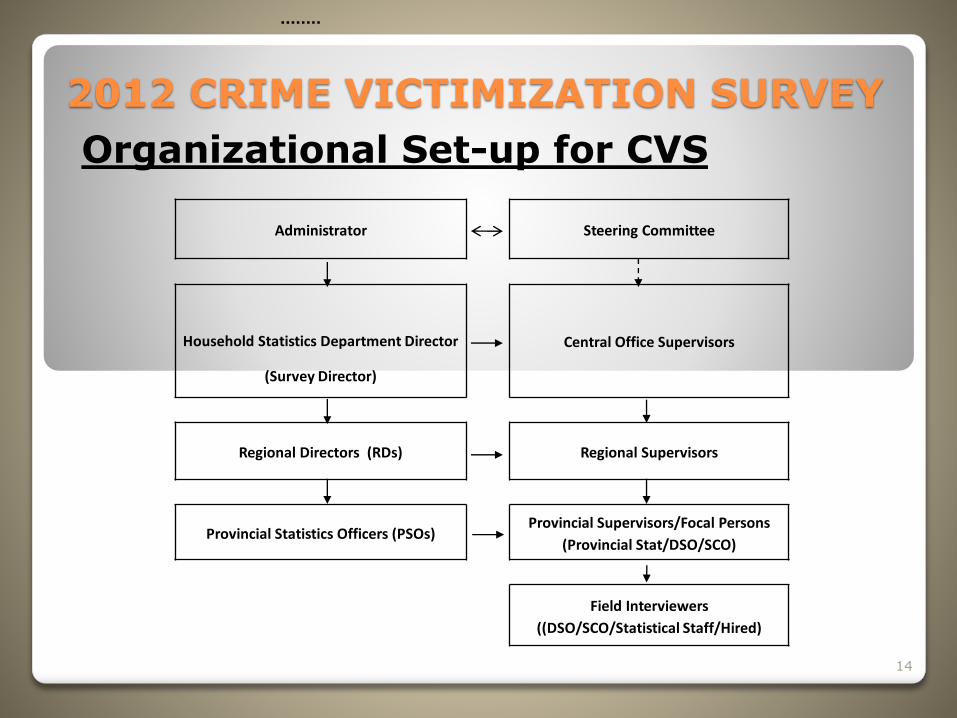
2012 CRIME VICTIMIZATION SURVEY
Organizational Set-up for CVS
Administrator Steering Committee
Household Statistics Department Director
(Survey Director)
Central Office Supervisors
Regional Directors (RDs) Regional Supervisors
Provincial Statistics Officers (PSOs)Provincial Supervisors/Focal Persons
(Provincial Stat/DSO/SCO)
Field Interviewers
((DSO/SCO/Statistical Staff/Hired)
14
2012 CRIME VICTIMIZATION SURVEY
Quality Assurance (Challenges):
The Regional Directors, Provincial Statistics
Officers, and the Regional Supervisors (RS)
supervised the field operation.
The Provincial Statisticians or their designated
alternates who served as trainers in the third-level
training were the CVS focal persons in their
respective provinces. They supervised for the entire
duration of the survey. 15
2012 CRIME VICTIMIZATION SURVEY
Quality Assurance:
While in the sample areas, the Supervisors carried
out the following:
- observed/attended interviews to ensure that
these are properly carried out;
- scrutiny of accomplished questionnaires to
ascertain completeness and consistency of
entries; and
- reinterviewing sample households using
Reinterview/Observation Form16
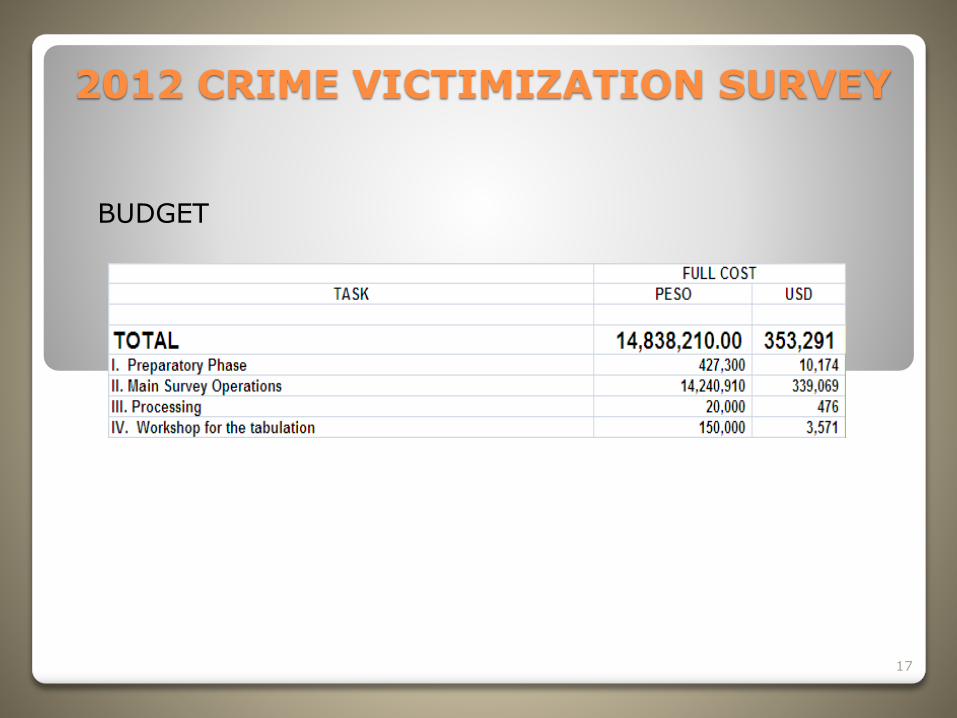
2012 CRIME VICTIMIZATION SURVEY
BUDGET
17
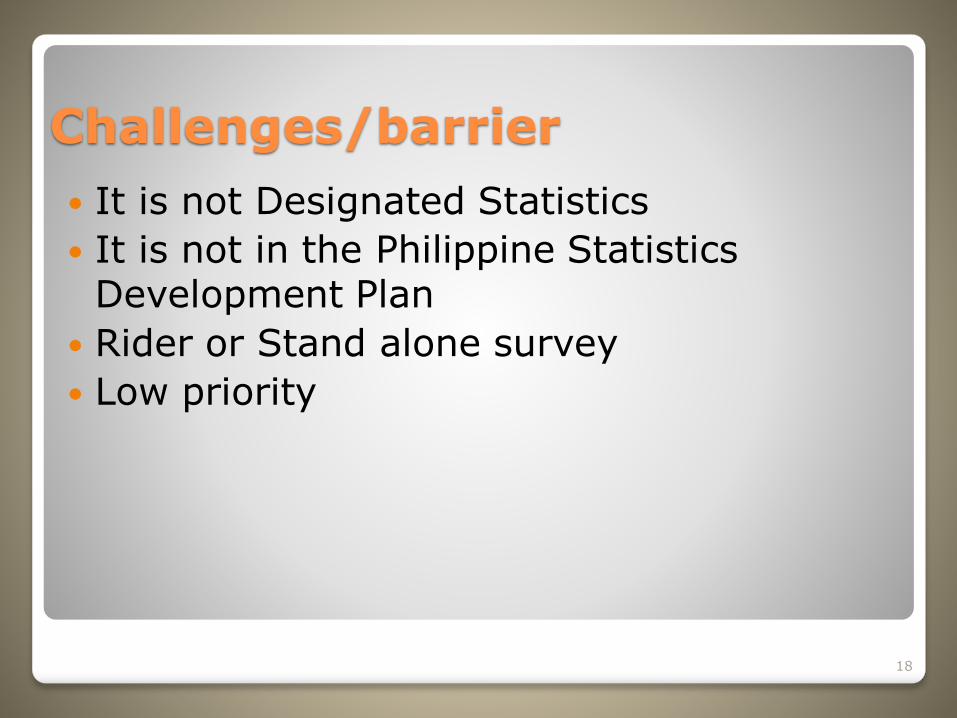
Challenges/barrier
It is not Designated Statistics
It is not in the Philippine Statistics Development Plan
Rider or Stand alone survey
Low priority
18
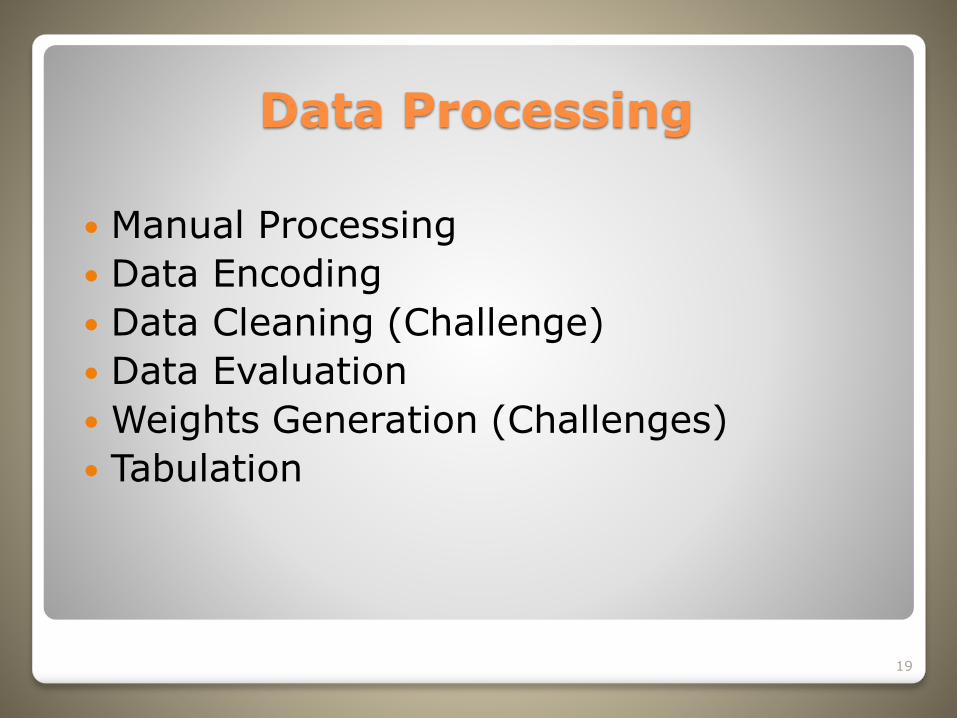
Data Processing
Manual Processing
Data Encoding
Data Cleaning (Challenge)
Data Evaluation
Weights Generation (Challenges)
Tabulation
19
20
21
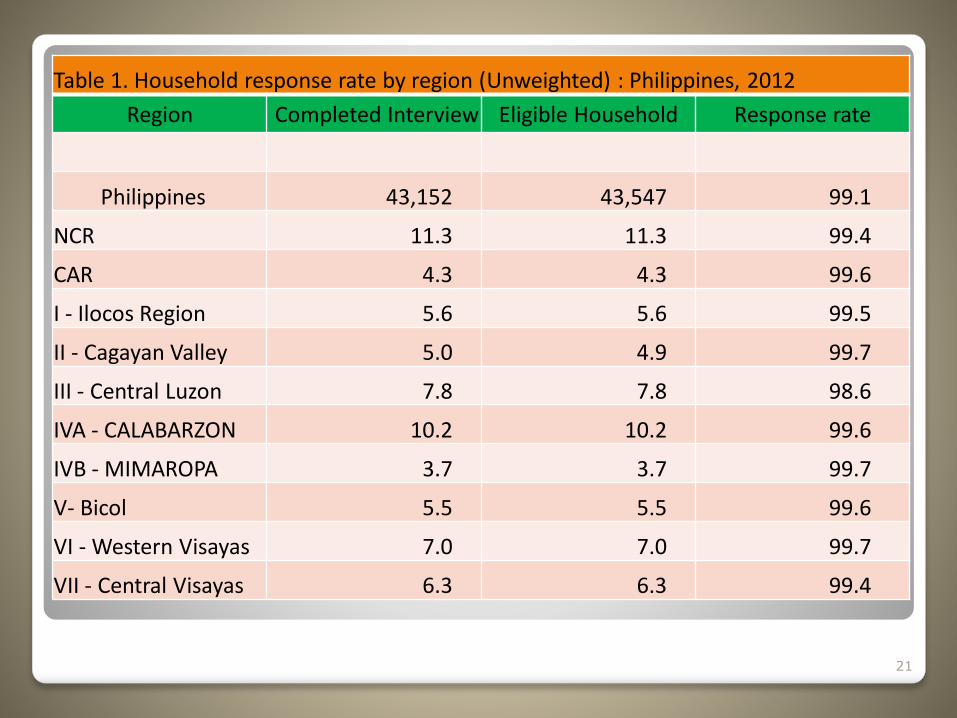
Table 1. Household response rate by region (Unweighted) : Philippines, 2012
Region Completed Interview Eligible Household Response rate
Philippines 43,152 43,547 99.1
NCR 11.3 11.3 99.4
CAR 4.3 4.3 99.6
I - Ilocos Region 5.6 5.6 99.5
II - Cagayan Valley 5.0 4.9 99.7
III - Central Luzon 7.8 7.8 98.6
IVA - CALABARZON 10.2 10.2 99.6
IVB - MIMAROPA 3.7 3.7 99.7
V- Bicol 5.5 5.5 99.6
VI - Western Visayas 7.0 7.0 99.7
VII - Central Visayas 6.3 6.3 99.4
22
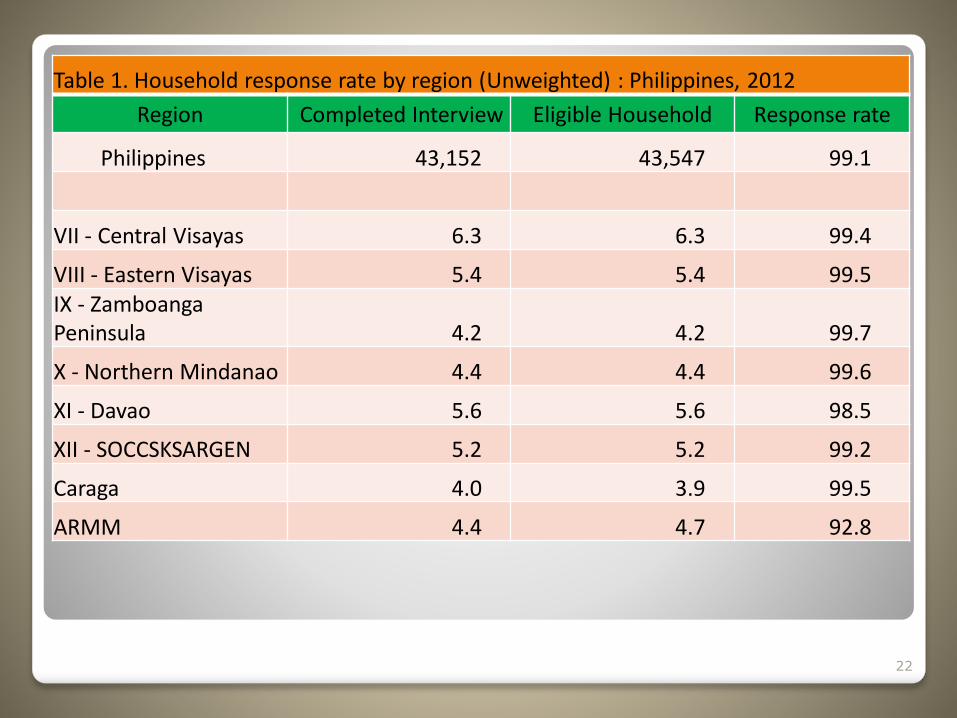
Table 1. Household response rate by region (Unweighted) : Philippines, 2012
Region Completed Interview Eligible Household Response rate
Philippines 43,152 43,547 99.1
VII - Central Visayas 6.3 6.3 99.4
VIII - Eastern Visayas 5.4 5.4 99.5IX - ZamboangaPeninsula 4.2 4.2 99.7
X - Northern Mindanao 4.4 4.4 99.6
XI - Davao 5.6 5.6 98.5
XII - SOCCSKSARGEN 5.2 5.2 99.2
Caraga 4.0 3.9 99.5
ARMM 4.4 4.7 92.8
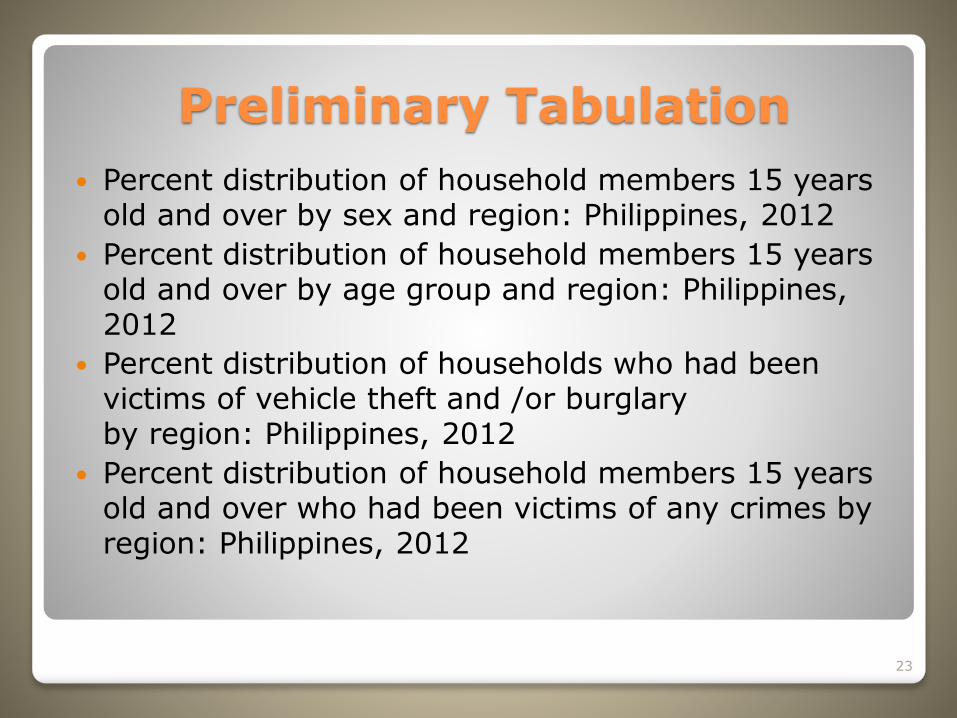
Preliminary Tabulation
23
Percent distribution of household members 15 years old and over by sex and region: Philippines, 2012
Percent distribution of household members 15 years old and over by age group and region: Philippines, 2012
Percent distribution of households who had been victims of vehicle theft and /or burglary by region: Philippines, 2012
Percent distribution of household members 15 years old and over who had been victims of any crimes by region: Philippines, 2012
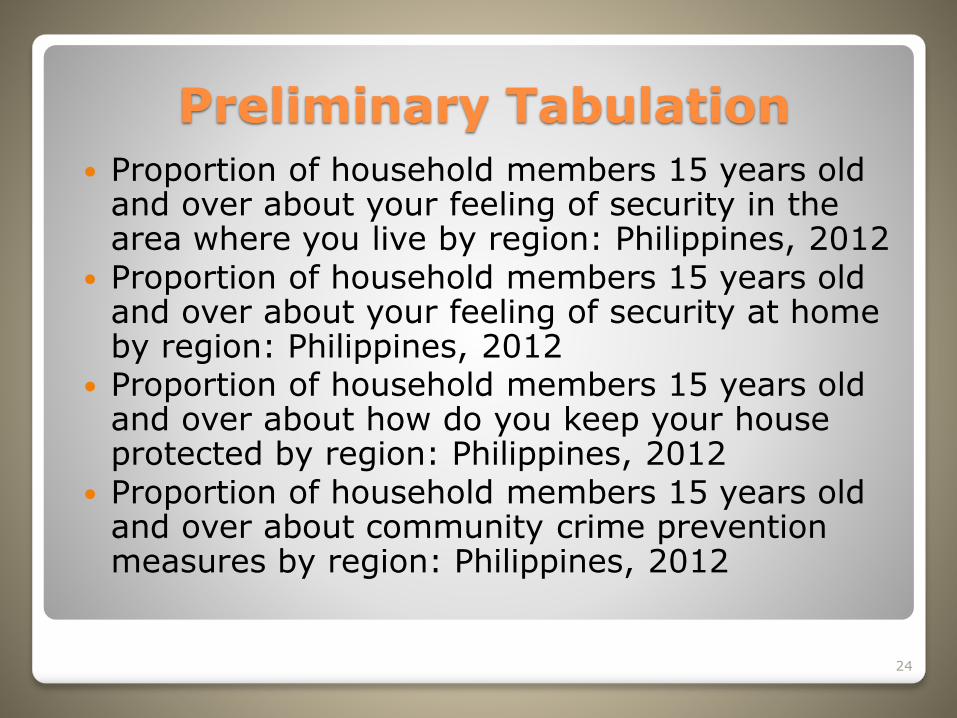
Preliminary Tabulation
Proportion of household members 15 years old and over about your feeling of security in the area where you live by region: Philippines, 2012
Proportion of household members 15 years old and over about your feeling of security at home by region: Philippines, 2012
Proportion of household members 15 years old and over about how do you keep your house protected by region: Philippines, 2012
Proportion of household members 15 years old and over about community crime prevention measures by region: Philippines, 2012
24
RegionNumber of households
Number of household with
Vehicles
Victims of Vehicle theft
Victims of Burglary
Victims of Vehicle Theft and/or
Burglary
Victims of Vehicle Theft and Burglary
Not been victims of any household
crimes
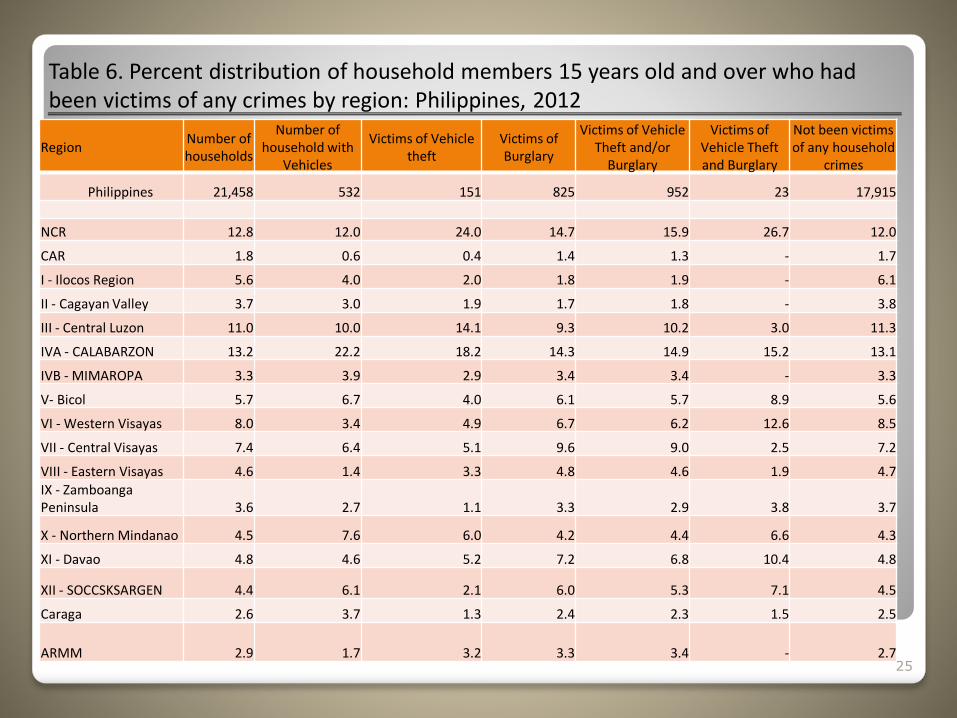
Philippines 21,458 532 151 825 952 23 17,915
NCR 12.8 12.0 24.0 14.7 15.9 26.7 12.0
CAR 1.8 0.6 0.4 1.4 1.3 - 1.7
I - Ilocos Region 5.6 4.0 2.0 1.8 1.9 - 6.1
II - Cagayan Valley 3.7 3.0 1.9 1.7 1.8 - 3.8
III - Central Luzon 11.0 10.0 14.1 9.3 10.2 3.0 11.3
IVA - CALABARZON 13.2 22.2 18.2 14.3 14.9 15.2 13.1
IVB - MIMAROPA 3.3 3.9 2.9 3.4 3.4 - 3.3
V- Bicol 5.7 6.7 4.0 6.1 5.7 8.9 5.6
VI - Western Visayas 8.0 3.4 4.9 6.7 6.2 12.6 8.5
VII - Central Visayas 7.4 6.4 5.1 9.6 9.0 2.5 7.2
VIII - Eastern Visayas 4.6 1.4 3.3 4.8 4.6 1.9 4.7IX - Zamboanga Peninsula 3.6 2.7 1.1 3.3 2.9 3.8 3.7
X - Northern Mindanao 4.5 7.6 6.0 4.2 4.4 6.6 4.3
XI - Davao 4.8 4.6 5.2 7.2 6.8 10.4 4.8
XII - SOCCSKSARGEN 4.4 6.1 2.1 6.0 5.3 7.1 4.5
Caraga 2.6 3.7 1.3 2.4 2.3 1.5 2.5
ARMM 2.9 1.7 3.2 3.3 3.4 - 2.725
Table 6. Percent distribution of household members 15 years old and over who had been victims of any crimes by region: Philippines, 2012
◦ USE of Data For evaluation/comparison of crime statistics that come from administrative data
Served as input on policy and program formulation on unreported crimes,
For research purposes like study on relation between crime rate and perception on security, program of community on crime prevention.
◦ Note: Other characteristics will come from◦ Labor Force Survey (Occupation, Highest Grade Completed)
26
Other survey that produce crime statistics◦ Violence against women
2008 and 2013 National Demographic and Health Survey/Women Safety Module
◦ Corruption (bribery)
2010 and 2013 Annual Poverty Survey
www.psa.gov.ph
27

THANK YOU!
28