national crime victimization survey october 2010, ncj 231327
TRANSCRIPT

BulletinBureau of Justice Statistics
October 2010, NCJ 231327
U.S. Department of JusticeOffice of Justice ProgramsBureau of Justice Statistics
Table 1 Criminal victimization, numbers, rates, and percent change, by type of crime, 2008 and 2009
Number of victimizations Ratesa Percent change 2008-2009bType of crime 2008 2009 2008 2009
All crimes 21,312,400 20,057,180 ~ ~Violent crimec 4,856,510 4,343,450 19.3 17.1 -11.2%*Serious violent crimed 1,595,590 1,483,040 6.3 5.8 -7.7%
Rape/sexual assaulte 203,830 125,910 0.8 0.5 -38.7**Robbery 551,830 533,790 2.2 2.1 -4.0Assault 4,100,850 3,683,750 16.3 14.5 -10.8*
Aggravated 839,940 823,340 3.3 3.2 -2.7Simple 3,260,920 2,860,410 12.9 11.3 -12.9*
Personal theftf 136,710 133,210 0.5 0.5 -3.3%Property crime 16,319,180 15,580,510 134.7 127.4 -5.5%*
Household burglary 3,188,620 3,134,920 26.3 25.6 -2.6Motor vehicle theft 795,160 735,770 6.6 6.0 -8.4Theft 12,335,400 11,709,830 101.8 95.7 -6.0*
Note: Detail may not sum to total because of rounding. Total population age 12 or older was 252,242,520 in 2008 and 254,105,610 in 2009. Total number of households was 121,141,060 in 2008 and 122,327,660 in 2009. See appendix table 1 for standard errors.~Not applicable.*Difference is significant at the 95%-confidence level. Differences are described as higher, lower, or different in text.**Difference is significant at the 90%-confidence level. Differences are described as somewhat, slightly, marginally, or some other indication in text.aVictimization rates are per 1,000 persons age 12 or older or per 1,000 households.bPercent change calculated based on unrounded estimates.cExcludes murder because the NCVS is based on interviews with victims and therefore cannot measure murder.dIncludes rape/sexual assault, robbery, and aggravated assault.eSee Methodology for discussion on changes in the rate of rape/sexual assault between 2008 and 2009.fIncludes pocket picking, completed purse snatching, and attempted purse snatching.
National Crime Victimization Survey
Criminal Victimization, 2009Jennifer L. Truman, Ph.D. Michael R. Rand BJS Statisticians
In 2009, U.S. residents age 12 or older expe-rienced an estimated 20 million violent and property victimizations, according to the
National Crime Victimization Survey (NCVS). These criminal victimizations included an esti-mated 4.3 million violent crimes, 15.6 million property crimes, and 133,000 personal thefts. Rates of violent and property crime in 2009 were at the lowest overall levels recorded since 1973, the first year for which victimization estimates from the survey were produced.
The overall victimization rate for violent crimes declined from 19.3 to 17.1 victimizations per 1,000 persons between 2008 and 2009 (table 1). A decline in simple assault (down 13%) contributed to the overall decline in the violent crime rate during this period. Due to a decline in the rate of theft (down 6%), the overall property crime rate also declined between 2008 and 2009.
Rates for every type of violent and property crime measured by the NCVS declined from 2000 to 2009. During the 10-year period, the violent crime rate declined by 39% and the property crime rate decreased by 29%. Declines ranged from 57% for rape or sexual assault to 19% for household bur-glary among the individual types of crimes.
Highlights � An estimated 4.3 million violent crimes, 15.6 million property crimes, and 133,000 personal thefts were committed against U.S. residents age 12 or older in 2009.
� Rates of violent (down 39%) and property (down 29%) crimes decreased between 2000 and 2009.
� The overall rate of firearm violence declined from 2.4 to 1.4 victimizations per 1,000 persons age 12 or older between 2000 and 2009.
� Armed offenders committed 22% of all violent crime incidents in 2009, including 8% by offenders with a firearm.
� Violence against males, blacks, and persons age 24 or younger oc-curred at higher or somewhat higher rates than the rates of violence against females, whites, and persons age 25 or older in 2009.
� Females knew their offenders in almost 70% of violent crimes committed against them; males knew their offenders in 45% of violent crimes committed against them.
� About half (49%) of all violent crimes and about 40% of all prop-erty crimes were reported to the police in 2009. Violent crimes against females (53%) were more likely to be reported than violent crimes against males (45%).
For a list of publications in this series, go to http://bjs.ojp.usdoj.gov/index.cfm?ty=pbse&sid=6.

2 Criminal Victimization, 2009
The 2008 to 2009 year-to-year decline in violent and property crimes was consistent with find-ings from the Federal Bureau of Investigation’s (FBI) Uniform Crime Reporting (UCR) program, which found declines in the rates of both violent (down 6.1%) and property crimes (down 5.5%) reported to the police. Because the NCVS and UCR measure an overlapping but not identical set of offenses and use different methodologies, exact congruity between the estimates cannot be expected. Both programs have generally demon-strated similar year-to-year increases or decreases in the levels of violent and property crimes during the survey’s 38-year history.
A major difference between the programs is the type of data collected. The NCVS obtains esti-mates of both crimes reported and those not reported to the police. The UCR collects data on reported crimes only. According to victims interviewed for the NCVS, 49% of violent crimes and 39% of property crimes were reported to the police in 2009. (For additional information about the differences and similarities between the NCVS and UCR, see the Nation’s Two Crime Measures, BJS Web, May 2003.)
The NCVS collects information from victims of nonfatal violent crimes and property crimes
The NCVS collects information on nonfatal crimes reported and not reported to the police against persons age 12 or older from a national representative sample of U.S. households. It produces national rates and levels of personal and property victimization, as well as information on the characteristics of crimes and victims, and the consequences of victimization to victims. Infor-mation on homicide presented in this report was obtained from the FBI’s UCR program.
Violent crimes measured by the NCVS include rape, sexual assault, robbery, aggravated assault, and simple assault. Property crimes include household burglary, motor vehicle theft, and theft. The survey also measures personal theft, which includes pocket picking and purse snatching.
In 2009, 38,728 households and 68,665 individu-als age 12 and older were interviewed for the NCVS. Each household was interviewed twice during the year. The response rate was 91.8% of households and 87.0% of eligible individuals.
0
5
10
15
20
25
30
Simple assault
Aggravated assaultRobberyRape/sexual assault
Total violent crime
200920082006200420022000
Rate per 1,000 persons age 12 or older
Figure 1 Violent crime rates overall fell by 39% from 2000 to 2009
Note: Excludes data for 2006. See Methodology.
Table 2 Rates of criminal victimization and percent change, by type of crime, 2000 and 2009
Victimization ratesa
Type of crime 2000 2009 Percent change 2000-2009b
Violent crimec 27.9 17.1 -38.7%*
Rape/sexual assault 1.2 0.5 -56.9*
Robbery 3.2 2.1 -34.9*
Assault 23.5 14.5 -38.3*
Aggravated 5.7 3.2 -43.1*
Simple 17.8 11.3 -36.8*
Personal theftd 1.2 0.5 -56.6%*
Property crime 178.1 127.4 -28.5%*
Household burglary 31.8 25.6 -19.4*
Motor vehicle theft 8.6 6.0 -30.5*
Theft 137.7 95.7 -30.5*
Note: The total population age 12 or older was 226,804,610 in 2000 and 254,105,610 in 2009. The total number of households in 2000 was 108,352,960 and 122,327,660 in 2009. See appendix table 2 for standard errors.*Difference is significant at the 95%-confidence level.aVictimization rates are per 1,000 persons age 12 or older for violent crime or per 1,000 households for property crime.bDifferences between the annual rates shown do not take into account changes that may have occurred during interim years. Percent change calculated on unrounded estimates. cExcludes murder because the NCVS is based on interviews with victims and therefore cannot measure murder.dIncludes pocket picking, completed purse snatching, and attempted purse snatching.

October 2010 3
0
50
100
150
200
Motor vehicle theft
Theft
Burglary
Total property crime
200920082006200420022000
Rate per 1,000 households
Figure 2 Property crime rates overall fell by 29% from 2000 to 2009
Note: Excludes data for 2006. See Methodology.
Violent and property crime rates remain at historic lows in 2009
The rate of every major violent and property crime measured by the NCVS declined between 2000 and 2009 (table 2, figure 1).1 The overall violent crime rate has decreased since 1994, a trend that continued through 2009 (down 39%). Violent crime rates had remained generally stable between 2003 and 2007 and declined from 2007 to 2009.
During the 10-year period from 2000 to 2009, trends in the rates of victimization varied by the type of crime. The rate of rape or sexual assault remained generally stable from 2000 to 2007 before declining between 2007 and 2009 (table 3). Rates of robbery fell in the first 5-year period be-tween 2000 and 2004 and remained stable for the second period. Rates for both aggravated assault and simple assault fell between 2000 and 2009.
The trend in a declining rate of overall property crime that began in 1974 continued through 2009. The rate of overall property crime fell by 29% during the 10-year period (figure 2). Rates of bur-
glary declined from 2000 to 2002 and remained generally stable between 2002 and 2009. The rate for property theft fell in both the first and second half of the 10-year period, with a greater decline from 2005 to 2009 than from 2000 to 2004. Rates of motor vehicle theft remained generally stable between 2000 and 2007, and fell in 2008. There was no change in the rate of motor vehicle theft from 2008 to 2009.
Table 3 National crime victimization rates and percent change in rates, by type of crime, 2007-2009
Rates per 1,000 persons or households Percent changea
Type of crime 2007 2008 2009 2007-2008 2007-2009 2008-2009
Violent crimeb 20.7 19.3 17.1 -6.9% -17.3%* -11.2%*
Rape/sexual assaultc 1.0 0.8 0.5 -18.5 -50.0* -38.7**
Robbery 2.4 2.2 2.1 -8.3 -12.0 -4.0
Assault 17.3 16.3 14.5 -6.0 -16.2* -10.8*
Aggravated 3.4 3.3 3.2 -2.9 -5.6 -2.7
Simple 13.9 12.9 11.3 -6.8 -18.8* -12.9*
Personal theftd 0.8 0.5 0.5 -30.1%* -32.4%* -3.3%
Property crime 146.5 134.7 127.4 -8.1%* -13.1%* -5.5%*
Burglary 26.9 26.3 25.6 -2.2 -4.7 -2.6
Motor vehicle theft 8.2 6.6 6.0 -19.9* -26.6* -8.4
Theft 111.4 101.8 95.7 -8.6* -14.1* -6.0*
Population
Persons age 12 or older 250,344,870 252,242,520 254,105,610
Households headed by persons age 12 or older 119,503,530 121,141,060 122,327,660
Note: See appendix table 3 for standard errors.*Difference is significant at the 95%-confidence level.**Difference is significant at the 90%-confidence level.aPercent change calculated based on unrounded estimates.bExcludes murder because the NCVS is based on interviews with victims and therefore cannot measure murder.cSee Methodology for discussion on changes in the rate of rape/sexual assault.dIncludes pocket picking, completed purse snatching, and attempted purse snatching.
1The discussion of victimization rate trends excludes NCVS estimates for 2006 because of the methodological inconsisten-cies between the data for that year and other years. See Meth-odology and Criminal Victimization, 2006 Technical Notes, BJS Web, December 2007.

4 Criminal Victimization, 2009
Victim characteristics in 2009 remained similar to those in previous years
Similar to previous NCVS findings, males, blacks, and persons age 24 or younger continued to be victimized at higher or somewhat higher rates than females, whites, and persons age 25 or older (table 5). (See statistical differences defined in Methodology.)
Gender of victim
Males were victims of violent crime at rates slightly higher than females, indicating a continu-ing convergence of male and female victimization. Differences between male and female rates of simple assault were not statistically significant in 2009. This has occurred twice since 2000, in 2001 and 2007. Consistent with previous years, males experienced higher rates of robbery and aggravat-ed assault than females. Females were more likely than males to be victims of rape or sexual assault.
Race of victim
Blacks were more likely than whites to be victims of overall violent crime, robbery, and aggravated assault, and somewhat more likely than whites to be victims of rape or sexual assault. Blacks also experienced higher rates than persons of other
races (American Indian, Alaska Native, Asian, Native Hawaiian, and other Pacific Islander) of overall violence, robbery, aggravated assault, and simple assault. Persons of two or more races were victims of overall violent crime at higher rates than whites and persons of other races, and some-what higher rates than blacks.
Hispanic origin of victim
In 2009, Hispanics and non-Hispanics were equally likely to experience overall violent crime, rape or sexual assault, aggravated assault, and simple assault. Similar to NCVS findings for pre-vious years, Hispanics were victims of robbery at rates higher than those of non-Hispanics.
Age of victim
Overall victimization rates for violent crime de-clined with victim age in 2009, a finding consis-tent with previous years. Generally, persons age 25 or older experienced violent victimization at lower rates than younger persons. Persons ages 12 to 15 experienced simple assault at rates higher than persons age 20 or older, and slightly higher rates than persons ages 16 to 19.
Table 4 Percent changes in the rates of crimes reported in the UCR, 2008-2009
Crime measured by the UCRPercent change in the
rates of crimes reportedViolent crime -6.1%
Murder -8.1Forcible rape -3.5Robbery -8.8Aggravated -5.0
Property crime -5.5%Burglary -2.2Larceny theft -4.8Motor vehicle theft -17.8
Note: See Crime in the United States, 2009 at <http://www2.fbi.gov/ucr/cius2009/index.html>.
Federal Bureau of Investigation, Uniform Crime Reports, 2008-2009Violent crime as measured by the FBI through the Uniform Crime Reporting Program (UCR) includes murder and non-negligent manslaughter, forcible rape, robbery, and aggravated assault. Property crimes include burglary, larceny theft, and motor vehicle theft. The UCR measures crimes reported to the police against both persons and businesses. For information about the differences and similarities of the NCVS and UCR, see the Nation’s Two Crime Measures, BJS Web, May 2003.
According to results released by the FBI, the rates of violent crimes reported to police as measured by the UCR declined by 6.1% between 2008 and 2009 (table 4). The rates of property crimes reported to police declined by 5.5% between 2008 and 2009. The UCR reported declines in the numbers of every crime measured.

October 2010 5
Table 5 Rates of violent crime, by gender, race, Hispanic origin, and age of victim, 2009
Violent victimizations per 1,000 persons age 12 or older
Demographic characteristics of victim Population Total
Rape/sexual assault Robbery Total assault
Aggravated assault Simple assault
Gender
Male 124,041,190 18.4 0.2^ 2.7 15.6 4.3 11.3
Female 130,064,420 15.8 0.8 1.6 13.5 2.3 11.2
Race
White 206,331,920 15.8 0.4 1.6 13.7 2.7 11.0
Black 31,046,560 26.8 1.2 5.6 19.9 6.8 13.0
Other race* 13,982,530 9.8 --^ 0.5^ 9.3 1.9^ 7.4
Two or more races 2,744,600 42.1 --^ 5.2^ 36.9 9.3^ 27.5
Hispanic origin
Hispanic 35,375,280 18.1 0.5^ 3.4 14.2 3.2 11.0
Non-Hispanic 218,238,010 17.0 0.5 1.9 14.6 3.3 11.3
Age
12-15 16,230,740 36.8 0.9^ 3.1 32.8 6.9 25.9
16-19 17,203,070 30.3 0.6^ 5.2 24.6 5.3 19.3
20-24 20,620,150 28.1 0.8^ 3.5 23.8 7.5 16.3
25-34 41,073,240 21.5 0.8^ 2.8 17.9 4.5 13.4
35-49 64,323,190 16.1 0.4^ 2.0 13.7 2.6 11.1
50-64 56,651,170 10.7 0.3^ 1.1 9.3 1.9 7.5
65 or older 38,004,060 3.2 0.2^ 0.4^ 2.5 0.3^ 2.2
Note: Violent crimes measured by the National Crime Victimization Survey include rape, sexual assault, robbery, aggravated assault, and simple assault. Because the NCVS interviews persons about their victimizations, murder and manslaughter cannot be included. See appendix table 4 for standard errors. --Rounds to less than 0.05 violent victimizations per 1,000 persons age 12 or older.^Based on 10 or fewer sample cases.*Includes American Indians, Alaska Natives, Asians, Native Hawaiians, and other Pacific Islanders.

6 Criminal Victimization, 2009
Table 6 Property crime rates, by household income and household size, 2009
Victimizations per 1,000 households
Characteristics of household Number of households Total Burglary Motor vehicle theft Theft
Household income
Less than $7,500 4,062,990 201.1 44.4 6.0 150.7
$7,500-$14,999 6,770,380 157.0 46.3 8.3 102.4
$15,000-$24,999 10,188,470 141.6 35.3 6.5 99.8
$25,000-$34,999 10,326,980 134.1 32.3 6.5 95.3
$35,000-$49,999 13,868,310 139.7 26.7 10.2 102.8
$50,000-$74,999 14,818,560 120.0 19.3 4.5 96.2
$75,000 or more 23,765,460 124.9 15.1 4.2 105.6
Number of persons in household
1 35,316,700 91.8 26.8 3.7 61.3
2 or 3 60,992,130 118.6 22.8 5.7 90.1
4 or 5 22,414,460 184.6 26.7 8.6 149.4
6 or more 3,604,360 267.5 55.4 17.1 195.0
Note: See appendix table 5 for standard errors.
Lower income households and larger households experienced higher property crime rates
Lower income households experienced prop-erty crime at higher rates than higher income households. In general, lower income households had higher rates of overall property crime and household burglary, compared to higher income households (table 6). Households in the lowest income category—less than $7,500 per year—had the highest overall property crime rate, and were victims of property crime at a rate that was about 1.6 times higher than households earning $75,000 per year or more.
Household burglary, property theft, and motor vehicle theft rates varied across income catego-ries. Burglary rates of households in the lowest income category were about 3 times higher than households earning $75,000 per year or more. Households earning less than $7,500 per year
were more likely to experience property theft than households in all other income categories. Rates of motor vehicle theft were higher for households earning $35,000 to $49,999 per year than house-holds earning $50,000 per year or more.
Consistent with previous years of the NCVS, larger households experienced property crime at higher rates than smaller households in 2009. Overall property crime rates were greater for larger households compared to smaller house-holds. For property theft and motor vehicle theft, patterns across households of different sizes were similar to that of overall property crime. House-holds with six or more persons experienced more overall property crime, household burglary, motor vehicle theft, and property theft than smaller households. Households with six or more persons were about 3 times more likely to be victims of property crime than single person households.

October 2010 7
Victims knew the offenders in 45% of violent crimes against men and 68% of violent crimes against women in 2009
Females have generally been most often victimized by someone they knew, while males have been more likely or equally likely to be victimized by a stranger. This pattern continued during 2009 (table 7).
Females knew their offenders in almost 70% of violent crimes committed against them. Females who were victims of violence were more likely to be victimized by someone they knew (a non-stranger) than a stranger for all measured violent crimes, except robbery.
The percentages of overall violence, rape or sexual assault, robbery, aggravated assault, and simple assault committed by strangers were higher for males than for females. Male victims of overall violent crime were slightly more likely to have been victimized by strangers than by nonstrang-ers. For rape or sexual assault and robbery, males were more likely to have been victimized by
strangers than nonstrangers. Offenders known to both male and female victims were most often identified as friends or acquaintances. For overall violent crime and assault, males and females were equally likely to have been victimized by an acquaintance. For rape or sexual assault, females were more likely than males to have been victim-ized by an acquaintance. For robbery, males were more likely than females to have been victimized by an acquaintance.
The greatest difference between violent crime committed against males and females was the percentage committed by intimate partners. The NCVS defines intimate partners as current or former spouses, boyfriends, or girlfriends. The percentage of female victims (26%) of intimate partner violence was about 5 times that of male victims (5%). There were no significant differenc-es in the numbers and rates of intimate partner victimizations for males and females from 2008 to 2009 (table 8).
Table 7 Relationship between victim and offender, by gender of victim, 2009
Violent crime Rape/sexual assault Robbery Aggravated assault Simple assault
Relationship to victim Number Percent Number Percent Number Percent Number Percent Number PercentMale victims
Total 2,283,200 100% 19,820 100%^ 329,070 100% 529,550 100% 1,404,760 100%Nonstranger 1,029,710 45% 5,090 26%^ 108,130 33% 247,800 47% 668,690 48%
Intimate partner* 117,210 5 -- --^ -- --^ 33,150 6^ 84,050 6Other relative 130,530 6 -- --^ 22,380 7^ -- --^ 108,150 8Friend/acquaintance 781,980 34 5,090 26^ 85,750 26 214,640 41 476,490 34
Stranger 1,180,000 52% 14,720 74%^ 205,800 63% 275,920 52% 683,560 49%Relationship unknown 73,490 3% -- --%^ 15,140 5%^ 5,840 1%^ 52,510 4%
Female victimsTotal 2,060,250 100% 106,100 100% 204,720 100% 293,790 100% 1,455,650 100%
Nonstranger 1,390,720 68% 84,240 79% 94,890 46% 189,610 65% 1,021,980 70%Intimate partner* 538,090 26 43,200 41 41,590 20 52,350 18 400,950 28Other relative 181,670 9 -- --^ 21,710 11^ 19,850 7^ 140,110 10Friend/acquaintance 670,960 33 41,040 39 31,590 15^ 117,410 40 480,920 33
Stranger 633,850 31% 21,860 21%^ 97,250 48% 104,180 36% 410,550 28%Relationship unknown 35,690 2%^ -- --%^ 12,570 6%^ -- --%^ 23,110 2%^
Note: Percentages may not sum to 100% because of rounding. See appendix table 6 for standard errors.^Based on 10 or fewer sample cases.--Rounds to less than 0.5 percent*Defined as current or former spouses, boyfriends, or girlfriends.
Table 8 Number and rate of intimate partner violence, by victims’ gender, 2008 and 2009
2008 2009
Gender of victim Number Rate* Number Rate*Male 88,120 0.7 117,210 0.9Female 504,980 3.9 538,090 4.1Note: See appendix table 7 for standard errors.*Rate per 1,000 persons age 12 or older.

8 Criminal Victimization, 2009
Table 9 Presence of weapons in violent incidents, by type, 2009
Violent crimeRape/sexual
assault RobberySimple and
aggravated assault
Presence of offender’s weapon Number Percent Number Percent Number Percent Number PercentTotal 4,130,140 100% 125,910 100% 516,060 100% 3,488,160 100%
No weapon 2,999,560 73% 106,660 85% 244,880 48% 2,648,020 76%Weapon 904,820 22% 12,970 10%^ 241,910 47% 649,940 19%
Firearm 326,090 8 -- --^ 142,780 28 183,310 5Knife 235,380 6 10,480 8^ 48,470 9 176,430 5Other 281,420 7 2,490 2^ 39,200 8 239,740 7Type not ascertained 61,930 2 -- --^ 11,470 2^ 50,470 1
Don’t know 225,760 6% 6,280 5%^ 29,270 6%^ 190,200 6%Note: Percentage may not sum to 100% because of rounding. If the offender was armed with more than one weapon, the crime was classified based on the most serious weapon present. See appendix table 8 for standard errors.^Based on 10 or fewer sample cases.--Rounds to less than 0.5 percent.
Table 10 Firearm use in violent crime, 2000 and 2009Firearm use in crime 2000 2009Incidents 428,670 326,090Victimizations 533,470 352,810Rate per 1,000 persons age 12 or older 2.4 1.4*Percent of all violent incidents 7.0% 7.9%*Difference is significant at the 95%-confidence level.
Table 11 Percent of violent and property crimes reported to the police, 2009Type of crime Percent reportedViolent crime 48.6%
Rape/sexual assault 55.4Robbery 68.4Aggravated assault 58.2Simple assault 41.9
Property crime 39.4% Burglary 57.3
Motor vehicle theft 84.6Theft 31.8
Note: See appendix table 9 for standard errors.
Weapons were used in 22% of all violent crimes in 2009
For overall violent crime, firearms, knives, and other weapons were used in about equal propor-tions (table 9). Robbery (47%) was the most likely offense to involve an armed offender. Firearms were the most often used weapon in robberies (28%).
Between 2000 and 2009, the overall rate of firearm violence declined from 2.4 to 1.4 victimizations per 1,000 persons age 12 or older (table 10). Fire-arms were used in about 8% of all violent crime incidents in 2009. During the 10-year period, about 6% to 9% of all violent crime incidents were committed with firearms (not shown in table).
Nearly half of all violent crimes and about 40% of all property crimes were reported to the police in 2009
During 2009, a greater percentage of violent victimizations (49%) were reported to the police, compared to property crimes (39%) (table 11). The percentage of robberies reported to the police
(68%) was somewhat higher than the percentage for aggravated assault (58%), and higher than the percentage for simple assault (42%). For property crimes, motor vehicle theft (85%) was the crime most frequently reported to the police.
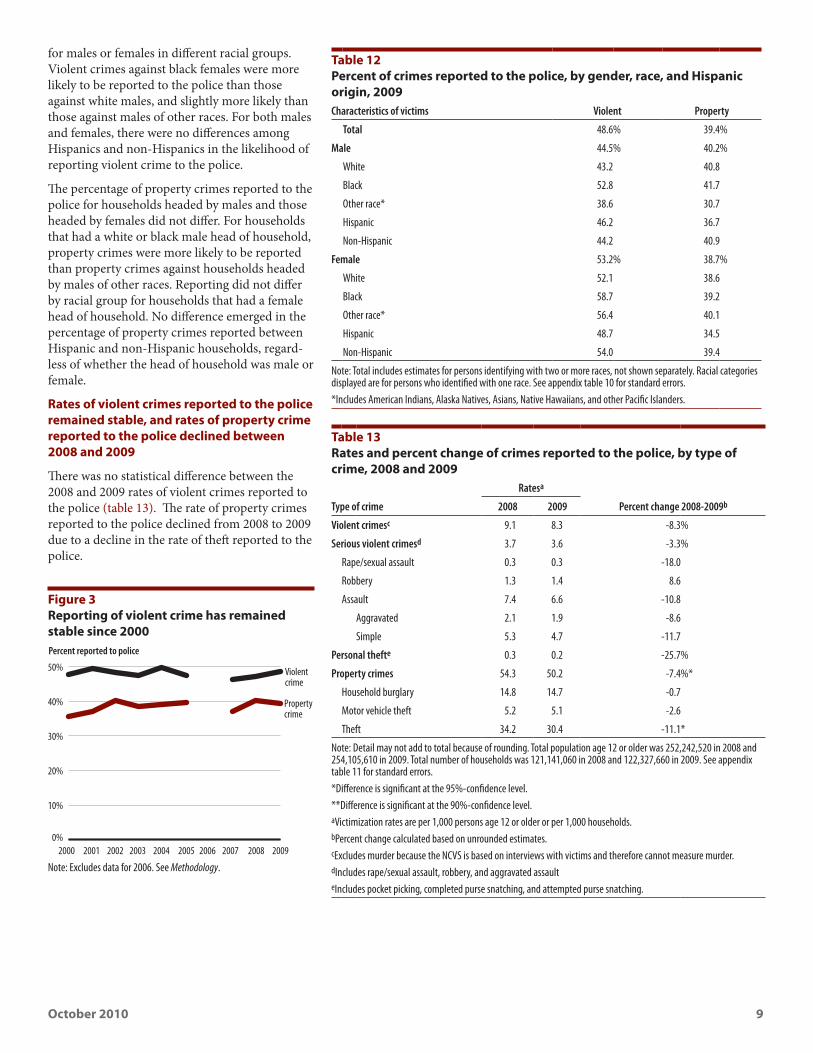
The percentage of violent crimes reported to the police was generally stable from 2000 to 2009 (figure 3). There was no significant difference be-tween the percentage of violent crimes reported in 2000 (48%) and 2009 (49%). For property crime, the percentage reported to the police varied dur-ing the 10-year period. The percentage of prop-erty crimes reported to the police in 2009 (39%) was higher than the percentage reported in 2000 (36%), and somewhat higher than those reported in 2001 (37%) and 2007 (37%).
In 2009, violent crimes against females (53%) were more likely to be reported than violent crimes against males (45%) (table 12). Overall, violent crimes against blacks were slightly more likely to be reported than violent crimes against whites (not shown in table). The percentage of violent crimes reported to the police did not differ
October 2010 9
for males or females in different racial groups. Violent crimes against black females were more likely to be reported to the police than those against white males, and slightly more likely than those against males of other races. For both males and females, there were no differences among Hispanics and non-Hispanics in the likelihood of reporting violent crime to the police.
The percentage of property crimes reported to the police for households headed by males and those headed by females did not differ. For households that had a white or black male head of household, property crimes were more likely to be reported than property crimes against households headed by males of other races. Reporting did not differ by racial group for households that had a female head of household. No difference emerged in the percentage of property crimes reported between Hispanic and non-Hispanic households, regard-less of whether the head of household was male or female.
Rates of violent crimes reported to the police remained stable, and rates of property crime reported to the police declined between 2008 and 2009
There was no statistical difference between the 2008 and 2009 rates of violent crimes reported to the police (table 13). The rate of property crimes reported to the police declined from 2008 to 2009 due to a decline in the rate of theft reported to the police.
Percent reported to police
0%
10%
20%
30%
40%
50%
Property crime
Violent crime
2009200820072006200520042003200220012000
Figure 3 Reporting of violent crime has remained stable since 2000
Note: Excludes data for 2006. See Methodology.
Table 12 Percent of crimes reported to the police, by gender, race, and Hispanic origin, 2009Characteristics of victims Violent Property
Total 48.6% 39.4%
Male 44.5% 40.2%
White 43.2 40.8
Black 52.8 41.7
Other race* 38.6 30.7
Hispanic 46.2 36.7
Non-Hispanic 44.2 40.9
Female 53.2% 38.7%
White 52.1 38.6
Black 58.7 39.2
Other race* 56.4 40.1
Hispanic 48.7 34.5
Non-Hispanic 54.0 39.4
Note: Total includes estimates for persons identifying with two or more races, not shown separately. Racial categories displayed are for persons who identified with one race. See appendix table 10 for standard errors.*Includes American Indians, Alaska Natives, Asians, Native Hawaiians, and other Pacific Islanders.
Table 13 Rates and percent change of crimes reported to the police, by type of crime, 2008 and 2009
Ratesa
Type of crime 2008 2009 Percent change 2008-2009b
Violent crimesc 9.1 8.3 -8.3%
Serious violent crimesd 3.7 3.6 -3.3%
Rape/sexual assault 0.3 0.3 -18.0
Robbery 1.3 1.4 8.6
Assault 7.4 6.6 -10.8
Aggravated 2.1 1.9 -8.6
Simple 5.3 4.7 -11.7
Personal thefte 0.3 0.2 -25.7%
Property crimes 54.3 50.2 -7.4%*
Household burglary 14.8 14.7 -0.7
Motor vehicle theft 5.2 5.1 -2.6
Theft 34.2 30.4 -11.1*
Note: Detail may not add to total because of rounding. Total population age 12 or older was 252,242,520 in 2008 and 254,105,610 in 2009. Total number of households was 121,141,060 in 2008 and 122,327,660 in 2009. See appendix table 11 for standard errors.*Difference is significant at the 95%-confidence level.**Difference is significant at the 90%-confidence level.aVictimization rates are per 1,000 persons age 12 or older or per 1,000 households.bPercent change calculated based on unrounded estimates.cExcludes murder because the NCVS is based on interviews with victims and therefore cannot measure murder.dIncludes rape/sexual assault, robbery, and aggravated assaulteIncludes pocket picking, completed purse snatching, and attempted purse snatching.

10 Criminal Victimization, 2009
Appendix Table 1 Standard errors for criminal victimization, numbers and rates, by type of crime, 2008 and 2009
Standard error of the number of victimizations
Standard error of the rates
Type of crime 2008 2009 2008 2009
All crimes 446,804 396,003 ~ ~
Violent crimesa 201,595 190,805 0.80 0.75
Serious violent crimesb 103,032 99,110 0.41 0.39
Rape/sexual assault 31,719 24,078 0.13 0.10
Robbery 55,479 54,264 0.22 0.21
Assault 181,862 172,398 0.72 0.68
Aggravated 70,674 69,862 0.28 0.27
Simple 158,238 147,615 0.63 0.58
Personal theftc 25,485 24,834 0.10 0.10
Property crimes 385,717 344,331 3.18 2.82
Household burglary 142,834 130,649 1.18 1.07
Motor vehicle theft 60,166 53,639 0.50 0.44
Theft 328,139 291,973 2.71 2.39
Note: Standard errors were calculated using NCVS general variance parameters developed by the U.S. Census Bureau. These standard errors are for estimates in table 1.~Not applicableaExcludes murder because the NCVS is based on interviews with victims and therefore cannot measure murder.bIncludes rape/sexual assault, robbery, and aggravated assault.cIncludes pocket picking, completed purse snatching, and attempted purse snatching.
Methodology
The National Crime Victimization Survey (NCVS) is an annual data collection conducted by the U.S. Census Bureau for the Bureau of Justice Statistics (BJS). The NCVS collects information on nonfatal crimes, reported and not reported to the police, against persons age 12 or older from a nationally representative sample of U.S. households.
Violent crimes measured by the NCVS include rape or sexual assault, robbery, aggravated as-sault, and simple assault. Property crimes include household burglary, motor vehicle theft, and theft.
The survey results presented in this report are based on data gathered from residents living throughout the United States, including persons living in group quarters, such as dormitories, rooming houses, and religious group dwellings. Armed Forces personnel living in military bar-racks and institutionalized persons, such as cor-rectional facility inmates, were not included in the scope of this survey.
Each housing unit selected for the National Crime Victimization Survey (NCVS) remains in the
sample for 3 years, with each of seven interviews taking place at 6-month intervals. An NCVS field representative’s first contact with a household selected for the survey is in person. The field rep-resentative may conduct subsequent interviews by telephone. To elicit more accurate reporting of in-cidents, the NCVS uses a self-respondent method that requires a direct interview with each person 12 years or older in the household—except under certain specific conditions. Proxy interviews ac-counted for about 3% of all NCVS interviews in 2009.
Annual collection year estimates of the levels and rates of victimization are derived by accumulat-ing estimates quarterly. The weights of all crimes reported during the interviews in that year are summed, regardless of when the crime occurred. The base for the collection year rate for personal crimes is the sum of all person weights. The base for the property crime rates is the sum of all household weights. For more detail, see the Meth-odology in Criminal Victimization in the United States, Statistical Tables, BJS Web, March 2010.

October 2010 11
Methodological changes to the NCVS in 2006
As discussed in the previous editions in this bulle-tin series, Criminal Victimization, 2006 and Crim-inal Victimization, 2007, methodological changes implemented in 2006 impacted the estimates for that year to an extent that they were considered to be not comparable to those of previous years. Evaluation of 2007 and later data from the NCVS conducted by BJS and the Census Bureau have found a high degree of confidence that estimates for these years are consistent with and comparable to those for 2005 and previous years. For this reason, discussion of trends in the rates of crime in this report excludes 2006. BJS and the Census Bureau continue to examine the impact of the methodological changes on survey estimates. The reports, Criminal Victimization, 2006 (December 2007), Criminal Victimization, 2007 (December 2008), Criminal Victimization, 2008 (September 2009), are available on the BJS Website at <http://bjs.ojp.usdoj.gov>.
Statistical differences defined
BJS tested the comparisons between the percent-ages and rates for Criminal Victimization, 2009 to determine if observed differences were statisti-cally significant. Differences described as higher, lower, or different passed a test at the 0.05 level
of statistical significance (95%-confidence level). Differences described as somewhat, slightly, marginally, or some indication passed a test at the 0.10 level of statistical significance (90%-confi-dence level). Caution is required when comparing estimates not explicitly discussed in this bulletin.
Change in the rape/sexual assault rate for 2008 to 2009
While the change in the rape/sexual assault rate for 2008 to 2009 is significantly different at the 90%-confidence level, care should be taken in interpreting this change because the estimates of rape/sexual assault are based on a small number of cases reported to the survey. Therefore, small absolute changes and fluctuations in the rates of victimization can result in large year-to-year percent change estimates. For 2009, the estimate of rape/sexual assault is based on 36 unweighted cases compared to 56 unweighted cases in 2008. The measurement of rape and sexual assault rep-resents one of the most serious challenges in the field of victimization research. Rape and sexual assault remain sensitive subjects that are difficult to ask about in the survey context. As part of the on-going redesign of the NCVS, BJS is exploring methods for improving the reporting of these crimes.
Appendix Table 2 Standard errors for rates of criminal victimization, by type of crime, 2000 and 2009
Standard error of the victimization rates
Type of crime 2000 2009Violent crimesa 1.05 0.75
Rape/sexual assault 0.14 0.10Robbery 0.26 0.21Assault 0.94 0.68
Aggravated 0.38 0.27Simple 0.78 0.58
Personal theftb 0.14 0.10Property crimes 3.66 2.82
Household burglary 1.24 1.07Motor vehicle theft 0.51 0.44Theft 3.16 2.39
Note: Standard errors were calculated using NCVS general variance parameters developed by the U.S. Census Bureau. These standard errors are for estimates in table 2.aExcludes murder because the NCVS is based on interviews with victims and therefore cannot measure murder.bIncludes pocket picking, completed purse snatching, and attempted purse snatching.
Appendix Table 3 Standard errors for national crime victimization rates, by type of crime, 2007-2009
Standard error of the rates Type of crime 2007 2008 2009Violent crimea 0.83 0.80 0.75
Rape/sexual assault 0.13 0.13 0.10Robbery 0.22 0.22 0.21Assault 0.74 0.72 0.68
Aggravated 0.27 0.28 0.27Simple 0.65 0.63 0.58
Personal theftb 0.12 0.10 0.10Property crime 2.87 3.18 2.82
Burglary 1.07 1.18 1.07Motor vehicle theft 0.53 0.50 0.44Theft 2.47 2.71 2.39
Note: Standard errors were calculated using NCVS general variance parameters developed by the U.S. Census Bureau. These standard errors are for estimates in table 3.aExcludes murder because the NCVS is based on interviews with victims and therefore cannot measure murder.bIncludes pocket picking, completed purse snatching, and attempted purse snatching.
12 Criminal Victimization, 2009
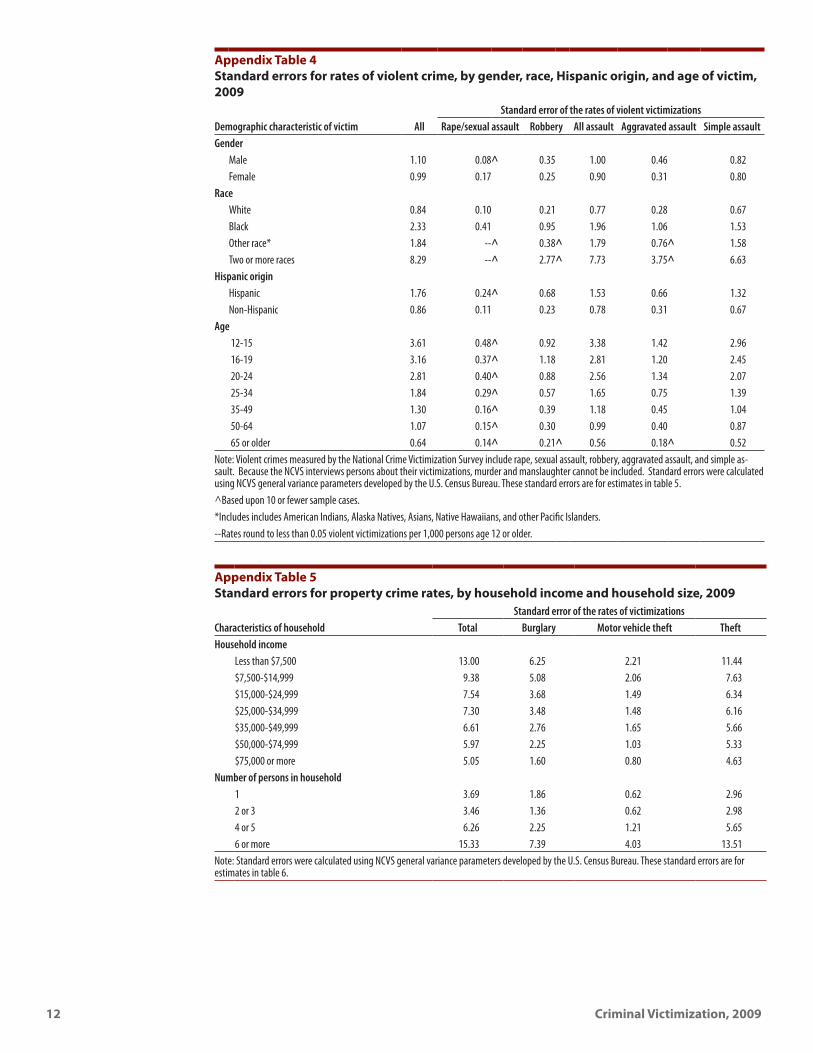
Appendix Table 4 Standard errors for rates of violent crime, by gender, race, Hispanic origin, and age of victim, 2009
Standard error of the rates of violent victimizationsDemographic characteristic of victim All Rape/sexual assault Robbery All assault Aggravated assault Simple assaultGender
Male 1.10 0.08^ 0.35 1.00 0.46 0.82Female 0.99 0.17 0.25 0.90 0.31 0.80
RaceWhite 0.84 0.10 0.21 0.77 0.28 0.67Black 2.33 0.41 0.95 1.96 1.06 1.53Other race* 1.84 --^ 0.38^ 1.79 0.76^ 1.58Two or more races 8.29 --^ 2.77^ 7.73 3.75^ 6.63
Hispanic originHispanic 1.76 0.24^ 0.68 1.53 0.66 1.32Non-Hispanic 0.86 0.11 0.23 0.78 0.31 0.67
Age 12-15 3.61 0.48^ 0.92 3.38 1.42 2.96 16-19 3.16 0.37^ 1.18 2.81 1.20 2.45 20-24 2.81 0.40^ 0.88 2.56 1.34 2.07 25-34 1.84 0.29^ 0.57 1.65 0.75 1.39 35-49 1.30 0.16^ 0.39 1.18 0.45 1.04 50-64 1.07 0.15^ 0.30 0.99 0.40 0.87 65 or older 0.64 0.14^ 0.21^ 0.56 0.18^ 0.52
Note: Violent crimes measured by the National Crime Victimization Survey include rape, sexual assault, robbery, aggravated assault, and simple as-sault. Because the NCVS interviews persons about their victimizations, murder and manslaughter cannot be included. Standard errors were calculated using NCVS general variance parameters developed by the U.S. Census Bureau. These standard errors are for estimates in table 5.^Based upon 10 or fewer sample cases.*Includes includes American Indians, Alaska Natives, Asians, Native Hawaiians, and other Pacific Islanders.--Rates round to less than 0.05 violent victimizations per 1,000 persons age 12 or older.
Appendix Table 5 Standard errors for property crime rates, by household income and household size, 2009
Standard error of the rates of victimizationsCharacteristics of household Total Burglary Motor vehicle theft TheftHousehold income
Less than $7,500 13.00 6.25 2.21 11.44$7,500-$14,999 9.38 5.08 2.06 7.63$15,000-$24,999 7.54 3.68 1.49 6.34$25,000-$34,999 7.30 3.48 1.48 6.16$35,000-$49,999 6.61 2.76 1.65 5.66$50,000-$74,999 5.97 2.25 1.03 5.33$75,000 or more 5.05 1.60 0.80 4.63
Number of persons in household1 3.69 1.86 0.62 2.962 or 3 3.46 1.36 0.62 2.984 or 5 6.26 2.25 1.21 5.656 or more 15.33 7.39 4.03 13.51
Note: Standard errors were calculated using NCVS general variance parameters developed by the U.S. Census Bureau. These standard errors are for estimates in table 6.

October 2010 13
Appendix Table 6 Standard errors for relationship between victim and offender, by gender of victim, 2009
Violent crime Rape/sexual assault Robbery Aggravated assault Simple assault
Relationship to victimStandard error of
the percentStandard error of
the percentStandard error of
the percentStandard error of
the percentStandard error of
the percentMale victims
Nonstranger 2.5 2.1^ 2.3 2.5 2.5Intimate* 1.0 --^ --^ 1.1^ 1.1Other relative 1.1 --^ 1.2^ --^ 1.3Friend/acquaintance 2.4 2.1^ 2.1 2.5 2.4
Stranger 2.5 2.3^ 2.5 2.5 2.5Relationship unknown 0.8 --^ 1.0^ 0.4^ 0.9
Female victimsNonstranger 2.5 2.2 2.6 2.6 2.5
Intimate* 2.2 2.6 2.0 1.9 2.3Other relative 1.4 --^ 1.5^ 1.2^ 1.5Friend/acquaintance 2.4 2.5 1.8^ 2.6 2.4
Stranger 2.4 2.1^ 2.6 2.5 2.3Relationship unknown 0.6^ --^ 1.1^ --^ 0.6^
Note: Standard errors were calculated using NCVS general variance parameters developed by the U.S. Census Bureau. These standard errors are for estimates in table 7.^Based on 10 or fewer sample cases.--Percents round to less than 0.5 percent*Defined as current or former spouses, boyfriends, or girlfriends.
Appendix Table 7 Standard errors for number and rate of intimate partner violence, by victims’ gender, 2008 and 2009
2008 2009Standard error of the number Standard error of the rate Standard error of the number Standard error of the rate
Males 20,706 0.17 23,831 0.19Females 54,537 0.42 57,216 0.44Note: Standard errors were calculated using NCVS general variance parameters developed by the U.S. Census Bureau. These standard errors are for estimates in table 8.
Appendix Table 8 Standard errors for presence of weapons in violent incidents, by type, 2009
Violent crime Rape/sexual assault RobberySimple and aggravated
assault
Presence of offender’s weaponStandard error of the
percentStandard error of
the percentStandard error of the
percentStandard error of
the percentNo weapon 1.8 6.6 4.8 1.9Weapon 1.6 5.3^ 4.8 1.6
Firearm 1.0 --^ 4.2 0.8Knife 0.8 4.8^ 2.6 0.8Other 0.9 2.4^ 2.5 1.0Type not ascertained 0.5 --^ 1.2^ 0.3
Don’t know 0.8 3.8^ 2.1^ 0.9Note: If the offender was armed with more than one weapon, the crime is classified based on the most serious weapon present.Standard errors were calculated using NCVS general variance parameters developed by the U.S. Census Bureau. These standard errors are for estimates in table 9.^Based upon 10 or fewer sample cases.--Percents round to less than 0.5 percent

14 Criminal Victimization, 2009
Appendix Table 9 Standard errors for percent of violent and property crimes reported to police, 2009
Type of crimeStandard error of
the percent reportedViolent crime 1.85
Rape/sexual assault 8.96Robbery 4.30Aggravated assault 3.74Simple assault 2.15
Property crime 0.92 Burglary 1.74
Motor vehicle theft 2.33Theft 0.96
Note: Standard errors were calculated using NCVS general variance parameters developed by the U.S. Census Bureau. These standard errors are for estimates in table 11.
Appendix Table 10 Standard errors for percent of crimes reported to the police, by gender, race, and Hispanic origin, 2009Characteristics of victim Violent Property
Total 1.96 0.96Male 2.51 1.27
White 2.81 1.38Black 5.19 3.04Other* 10.07 4.55Hispanic 5.75 2.71Non-Hispanic 2.68 1.36
Female 2.65 1.25White 2.99 1.38Black 5.31 2.63Other* 15.39 5.85Hispanic 6.10 2.77Non-Hispanic 2.83 1.34
Note: Total includes estimates for persons identifying with two or more races, not shown separately. Racial categories displayed are for persons who identified with one race.Standard errors were calculated using NCVS general variance parameters developed by the U.S. Census Bureau. These standard errors are for estimates in table 12.*Includes American Indians, Alaska Natives, Asians, Native Hawaiians, and other Pacific Islanders.

October 2010 15
Appendix Table 11 Standard errors for rates of crimes reported to the police, by type of crime, 2008 and 2009
Standard error of the ratesType of crime 2008 2009Violent crimesa 0.51 0.48Serious violent crimesb 0.30 0.29
Rape/sexual assault 0.07 0.07Robbery 0.16 0.17Assault 0.45 0.42
Aggravated 0.21 0.20Simple 0.37 0.34
Personal theftc 0.07 0.06Property crimes 1.85 1.62
Household burglary 0.82 0.76Motor vehicle theft 0.43 0.40Theft 1.39 1.19
Note: Standard errors were calculated using NCVS general variance parameters developed by the U.S. Census Bureau. These standard errors are for estimates in table 13.aExcludes murder because the NCVS is based on interviews with victims and therefore cannot measure murder.bIncludes rape/sexual assault, robbery, and aggravated assaultcIncludes pocket picking, completed purse snatching, and attempted purse snatching.

U.S. Department of JusticeOffice of Justice ProgramsBureau of Justice Statistics
Washington, DC 20531
Official BusinessPenalty for Private Use $300
PRESORTED STANDARDPOSTAGE & FEES PAID
DOJ/BJSPermit No. G-91
*NCJ~231327*
The Bureau of Justice Statistics is the statistical agency ofthe U.S. Department of Justice. James P. Lynch is director.
This Bulletin was written by Jennifer L.Truman, PhD andMichael R. Rand. Matthew Durose verified the report.
Georgette Walsh and Jill Duncan edited the report, BarbaraQuinn produced the report, and Jayne Robinson preparedthe report for final printing under the supervision of DorisJ. James.
October 2010, NCJ 231327
This report in portable document format and in ASCII and itsrelated statistical data and tables are available at the BJS WorldWi d e We b Inte r ne t s i t e : < ht tp : / / b j s .o jp. u s d oj .gov/index.cfm?ty=pbdetail&iid=2217>.
Office of Justice Programs
Innovation • Partnerships • Safer Neighborhoodshttp://www.ojp.usdoj.gov