2013-2014 budget disclosures - valley central school district
TRANSCRIPT

ELEMENTARY SCHOOLS
BUDGET HEARING
ELEMENTARY SCHOOLS
MAY 13, 2013 6:00 P.M.
ADMINISTRATION BUILDING
VOTE DATE
MAY 21, 2013 7:00 A.M. - 9:00 P.M.
Valley Central
School District
Proposed Budget
2013-2014
VOTER REGISTRATIONMAY 13, 2013 1:00 P.M. - 8:00 P.M.
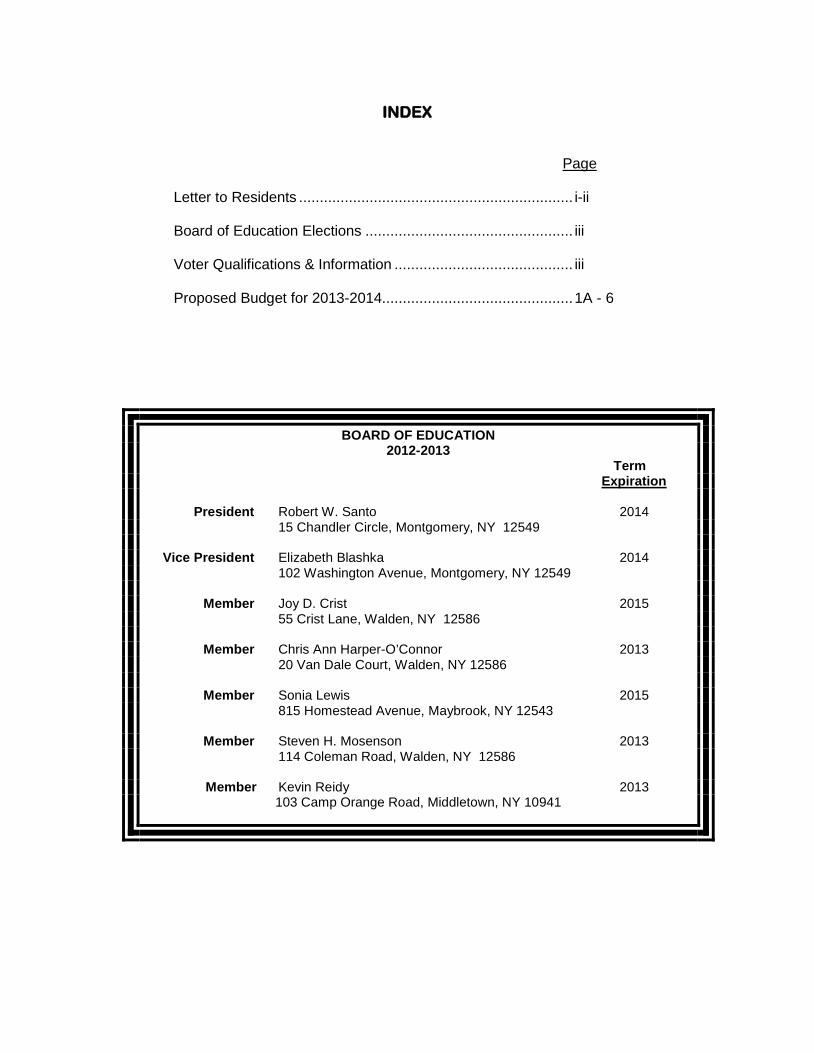
INDEX
Page Letter to Residents .................................................................. i-ii Board of Education Elections .................................................. iii Voter Qualifications & Information ........................................... iii Proposed Budget for 2013-2014.............................................. 1A - 6
BOARD OF EDUCATION 2012-2013
Term Expiration President Robert W. Santo 2014 15 Chandler Circle, Montgomery, NY 12549 Vice President Elizabeth Blashka 2014 102 Washington Avenue, Montgomery, NY 12549 Member Joy D. Crist 2015 55 Crist Lane, Walden, NY 12586 Member Chris Ann Harper-O’Connor 2013 20 Van Dale Court, Walden, NY 12586 Member Sonia Lewis 2015 815 Homestead Avenue, Maybrook, NY 12543 Member Steven H. Mosenson 2013 114 Coleman Road, Walden, NY 12586 Member Kevin Reidy 2013
103 Camp Orange Road, Middletown, NY 10941

May 2013 Dear Resident, In the late 90s, the New York State Legislature redefined how school budgets are presented to ensure a better understanding of how tax dollars are spent in local school districts. As a result, Valley Central, along with all other school districts, presents its expenses in three parts with comparative budget figures from the previous year. This format allows voters to view the areas of program, administration and capital against the costs from the prior year. As you review the attached budget, you can see areas that have increased and decreased from the previous year and see the comparative difference among the three areas. A Property Tax Report Card must be prepared and filed with the State and local newspapers. The Six-Day Budget Notice is also required by the State and will be mailed to all District residents following the Budget Hearing. For 2013-2014 the Board is recommending a budget which pierces the tax cap. These revenues with additional state aid, and other cuts and reductions address a significant shortfall which started as $8.1 Million in February as we began the budget process. If this budget fails, approximately $3 Million more in cuts to programs and student opportunities must be found. If the budget fails twice the increase to the levy must be zero causing another $3 Million in cuts or a total of $5 Million over what has already been cut from the instructional and extracurricular program. If the proposed budget is defeated by the voters, the Board of Education has three options: they may resubmit the budget in its original form, submit a revised budget, or adopt a contingency budget. If voters fail to approve the proposed budget on the second vote, the District must adopt a Contingency Budget since two votes are the maximum permitted under current legislation. In a Contingency Budget, the levy for the Contingency Budget year must be zero and may not exceed the levy in the preceding year. Specifically, for the proposed 2013-2014 budget, the Contingency Budget would be reduced by $2,925,544, due to reduction in the use of fund balance. This would mean additional reductions to staffing and programs. Please note that the proposed 2013-2014 tax levy is 5.5% over the state tax cap and therefore requires a 60% majority to pass. This year's budget vote and election will be held on Tuesday, May 21st from 7:00 a.m. to 9:00 p.m. in each of our five elementary schools.
-i-
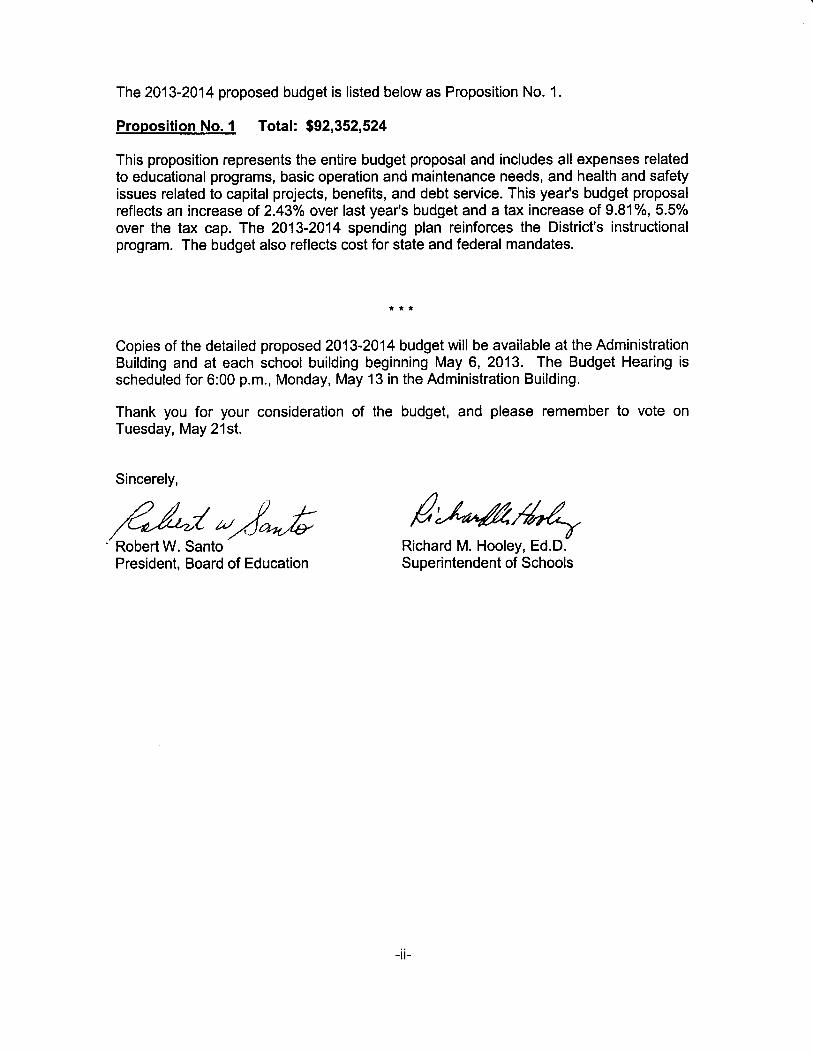
The 2013-2014 proposed budget is listed below as Proposition No. 1 .
Proposition No. 1 Total: $92,352,524
This proposition represents the entire budget proposal and includes all expenses relatedto educational programs, basic operation and maintenance needs, and health and safetyissues related to capital projects, benefits, and debt service. This yea/s budget proposalreflects an increase of 2.43o/o over last year's budget and a tax increase of 9.81 o/o, 5.5o/o
over the tax cap. The 2013-2014 spending plan reinforces the District's instructionalprogram. The budget also reflects cost for state and federal mandates.
Copies of the detailed proposed 2013-2014 budget will be available at the AdministrationBuilding and at each school building beginning May 6, 2013. The Budget Hearing isscheduled for 6:00 p.m., Monday, May 13 in the Administration Building.
Thank you for your consideration ofTuesday, May 21st.
Sincerely,
the budget, and please remember to vote on
,r4,/t"/ -/*6Richard M. Hooley, Ed.D.Superintendent of Schools
Robert W. SantoPresident, Board of Education
-ii-

BOARD OF EDUCATION ELECTIONS
To elect three (3) members to the Board of Education as follows: Three (3) members for three (3) year terms commencing July 1, 2013 and expiring June 30, 2016. Vacancies are due to the expiration of terms of Chris Ann Harper-O’Connor, Steven Mosenson and Kevin Reidy. According to Board Policy, vacancies are not considered separate, specific offices, and the nominating petition does not describe any specific vacancy upon the Board of Education for which the candidate is nominated; therefore, candidates are running "at large." Petitions were filed in the Office of the Clerk of the Board of Education at the Administration Building on or before Monday, April 22, 2013, 5:00 p.m. A drawing was held to determine the ballot order and the candidates are listed below:
Frances Fox-Pizzonia Steven H. Mosenson Matthew T. Flanagan Bradley Conklin Joseph Byrne
VOTER QUALIFICATIONS & INFORMATION
A person is entitled to vote at any school meeting (Annual District Election and Budget Vote) for the election of school district officers and upon all other matters which may be brought before such meeting, who is a qualified registered voter in the school district; in order to register, the applicant must meet the following criteria:
• Be a citizen of the United States • Be eighteen (18) years of age or older on May 21, 2013 • Be a resident within the district for a period of not less than thirty (30) days prior to
the Annual District Election and Budget Vote at which he or she offers to vote
No person shall have the right to register for or vote at any school meeting or election who would not be qualified to register for or vote at an election in accordance with the provisions of Section 5-106 of the Election Law. This includes convicted felons and those adjudged mentally incompetent by a court.
Qualified voters may vote on any question brought before any annual or special school meeting. It is not essential that a person be a taxpayer to vote on propositions for raising money by tax on the district. For your convenience, new voter registration is set for Monday, May 13 between 1:00 and 8:00 p.m. at our elementary schools. Any resident who registered and voted at an annual or special district meeting or general election within the last four (4) calendar years will be eligible to vote on Tuesday, May 21, 2013. Questions on voter qualifications can be directed to the Valley Central School District Administration Office at 457-2400, ext. 18122.
-iii-

CATEGORY
2012-2013 2013-2014 2012-2013 2013-2014 2012-2013 2013-2014
Board of Education 77,900 54,900
Central Administration 1,487,630 1,468,598
Central Services 383,875 314,170 4,870,087 4,766,256
Special Items 847,400 888,262 50,000 50,000
Supervision of Instruction 3,481,036 3,346,687
Regular Classroom 31,019,366 30,283,342
Special Education, Special
Schools & Tuition
12,139,322 14,122,281
Instructional Media 1,509,419 1,390,959
Pupil Personnel Services 3,632,181 2,733,150
Co-Curricular and
Interscholastic Sports
742,500 676,712
Transportation 6,055,300 6,290,420
Employee Benefits 1,714,566 1,995,587 17,157,450 18,758,823 1,727,106 1,899,377
Debt Service and Interfund
Transfers
3,270,000 3,313,000
7,992,407 8,068,204 72,255,538 74,255,687 9,917,193 10,028,633
8.86% 8.74% 80.14% 80.40% 11.00% 10.86%
ESTIMATED REVENUES
State Aid (including BOCES) 29,530,000 30,813,012
Property Tax 52,119,582 57,232,512
Fund Balance 6,488,138 2,000,000
Other Receipts:
Other Payments in lieu of taxes 1,610,000 1,590,000
Charges for services 150,000 166,000
Use of Money & Property 90,000 75,000
Sale of Property & Comp. for loss 3,418 0
Refund Prior Years Expenses 40,000 40,000
Unclassified 84,000 0
Interfund Transfer 0 436,000
Medicaid Assistance 50,000 2,027,418 0 2,307,000
92,352,524
VALLEY CENTRAL SCHOOL DISTRICT 2013-2014 THREE PART BUDGET, Adopted 4/15/13
ADMINISTRATIVE PROGRAM CAPITAL
2012-2013 2013-2014
90,165,138
2012-2013 2013-2014
$90,165,138 $92,352,524
Total Total

CODE BOARD OF EDUCATION 2012-2013
BUDGET
2013-2014
BUDGET
Board of Education
Expenditures incurred by the Board for supplies, travel, meetings, and
conferences.
District Clerk
Expenditures for supplies, postage, servicing of machines and portion
of clerical salary in support of the District Clerk’s office.
District Meeting
New voting machines required add substantial costs. Expenditures for
printing, advertising, payments to election officials, absentee ballots, and
supplies.
Total cost: BOARD OF EDUCATION
CODE CENTRAL ADMINISTRATION 2012-2013
BUDGET
2013-2014
BUDGET
Superintendent
Salaries of the Superintendent, Superintendent’s Assistant and negotiated
benefits, equipment, other expenses, and supplies.
Assistant Superintendent for Business
Salaries of the Assistant Superintendent for Business, clerical and
accounting staff, contractual expenses, and supplies.
Auditing Services
Annual Audit by External Auditor, Internal Auditor, and stipend for
Internal Claims Auditor.
District Treasurer
Stipend of Treasurer.
Receiver of Taxes
The T/o Montgomery employs the Receiver of Taxes, but the District
pays a portion of the salary for tax collections in the Towns of Crawford,
Wallkill, Hamptonburgh, and Shawangunk.
Total cost: SUPERINTENDENT AND BUSINESS OFFICE
2012-2013
BUDGET
Legal Services
School District Attorney and other legal fees.
Personnel Administration
Salaries of Assistant Superintendent for Pupil Services and Human
Resources and clerical staff, expenditures for supplies, recruiting costs,
and advertising.
Public Information and Services
Budget brochures and newsletters.
Total cost: STAFF
Total cost: CENTRAL ADMINISTRATION
A1310 535,130
A1040 1,000
A1060 63,000
77,900
A1240 319,090
A1010 13,900
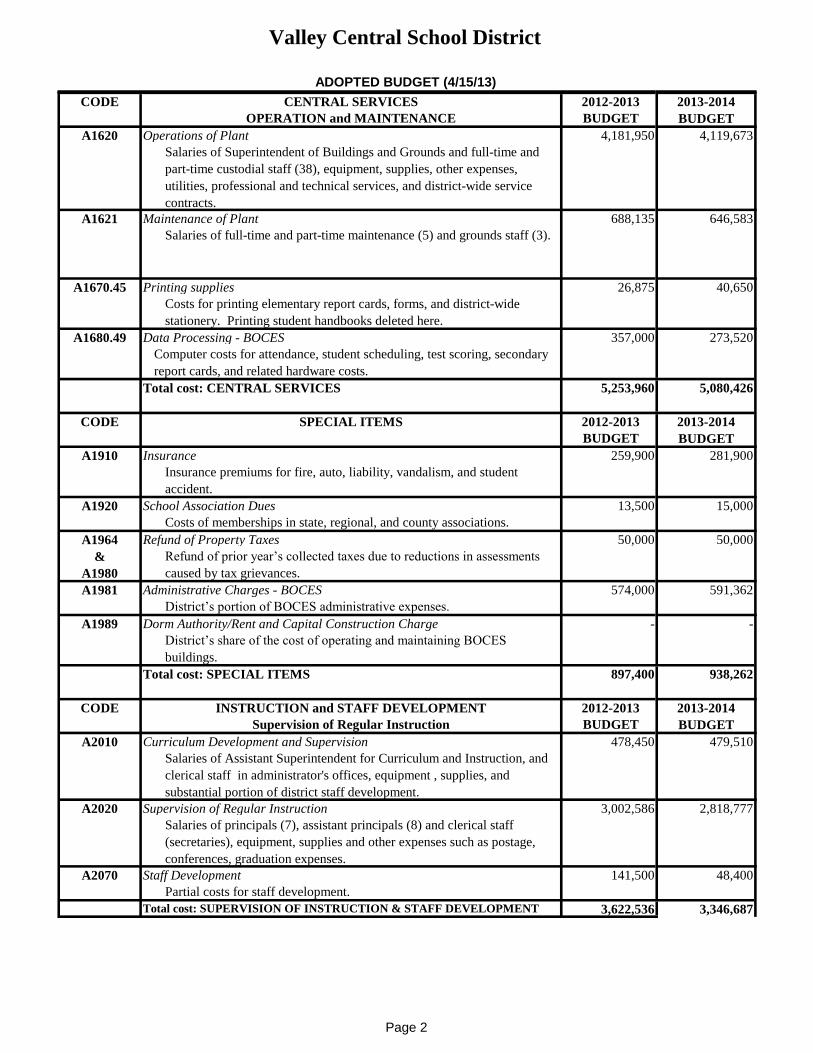
Valley Central School District
ADOPTED BUDGET (4/15/13)
13,900
A1330 7,300
939,070
A1320 61,500
A1325 16,050
189,000
A1430 343,560
CODE STAFF
A1420
CODE
A1480 16,000
548,560
1,487,630
511,103
61,500
16,530
7,500
-
41,000
54,900
319,357
552,608
1,468,598
915,990
189,000
355,608
8,000
2013-2014
BUDGET
2013-2014
BUDGET
Page 1
Valley Central School District
ADOPTED BUDGET (4/15/13) CENTRAL SERVICES 2012-2013
OPERATION and MAINTENANCE BUDGET
Operations of Plant
Salaries of Superintendent of Buildings and Grounds and full-time and
part-time custodial staff (38), equipment, supplies, other expenses,
utilities, professional and technical services, and district-wide service
contracts.
A1621 Maintenance of Plant 688,135
Salaries of full-time and part-time maintenance (5) and grounds staff (3).
Printing supplies
Costs for printing elementary report cards, forms, and district-wide
stationery. Printing student handbooks deleted here.
Data Processing - BOCES
Computer costs for attendance, student scheduling, test scoring, secondary
report cards, and related hardware costs.
Total cost: CENTRAL SERVICES
2012-2013
BUDGET
Insurance
Insurance premiums for fire, auto, liability, vandalism, and student
accident.
School Association Dues
Costs of memberships in state, regional, and county associations.
Refund of Property Taxes
Refund of prior year’s collected taxes due to reductions in assessments
caused by tax grievances.
Administrative Charges - BOCES
District’s portion of BOCES administrative expenses.
Dorm Authority/Rent and Capital Construction Charge
District’s share of the cost of operating and maintaining BOCES
buildings.
Total cost: SPECIAL ITEMS
INSTRUCTION and STAFF DEVELOPMENT 2012-2013
Supervision of Regular Instruction BUDGET
Curriculum Development and Supervision
Salaries of Assistant Superintendent for Curriculum and Instruction, and
clerical staff in administrator's offices, equipment , supplies, and
substantial portion of district staff development.
A2020 Supervision of Regular Instruction 3,002,586
Salaries of principals (7), assistant principals (8) and clerical staff
(secretaries), equipment, supplies and other expenses such as postage,
conferences, graduation expenses.
Staff Development
Partial costs for staff development.
Total cost: SUPERVISION OF INSTRUCTION & STAFF DEVELOPMENT 3,622,536 3,346,687
CODE
A1620 4,181,950
5,253,960
CODE SPECIAL ITEMS
A1670.45 26,875
A1680.49 357,000
A1964
&
A1980
50,000
A1981 574,000
A1910 259,900
A1920 13,500
CODE
A2010 478,450
A1989 -
897,400
A2070 141,500
4,119,673
646,583
15,000
50,000
591,362
-
40,650
273,520
2013-2014
BUDGET
281,900
938,262
479,510
2,818,777
48,400
2013-2014
BUDGET
2013-2014
BUDGET
5,080,426
Page 2

Valley Central School District
ADOPTED BUDGET (4/15/13) 2012-2013
REGULAR CLASSROOM BUDGET
Salaries of Grades K-6 Teachers
Budget reflects cost of teachers with contractual increases. Estimated
10.0 teacher reductions here.
Salaries of Grades 7-12 Teachers
Budget reflects costs of secondary teachers with contractual increases.
Estimated 12.5 teacher reductions here.
Substitute Teaching and Home Teaching
Reflects costs of substitutes.
Regular Classroom Paraprofessionals
Salaries for Paraprofessionals.
Sick-Day Incentives
Attendance incentive for instructional staff.
Classroom Supplies, Equipment and Other Expenses
Supplies, equipment, and contractual costs for instructional purposes.
Foster & Tuition
Tuition paid to other school districts for Valley Central students in foster
care outside of the district..
Textbooks
Includes costs of textbooks for all students.
BOCES
Includes testing, tuition, and some staff development.
Special Education
Salaries of special education teachers and paraprofessionals, equipment,
supplies, special education BOCES services, residential and contracted
tuition, and other expenses.
BOCES - Occupational Education
Educational services for students who attend the vocational programs at
BOCES.
Total cost: REGULAR CLASSROOM
A2110.12 12,063,747
A2110.13 13,113,456
CODE
A2110.18 37,000
A2110 648,135
A2110.14 636,580
A2110.16 1,649,900
A2110.49 183,000
A2250 12,139,322
A2110.471 150,000
A2110.48 300,630
A2280.49 870,000
41,791,770
150,000
300,630
198,640
14,122,281
870,000
42,370,392
11,588,363
12,865,838
368,915
1,353,152
37,000
515,573
2013-2014
BUDGET
Page 3

Valley Central School District
ADOPTED BUDGET (4/15/13) 2012-2013
BUDGET
Special Schools
Costs to operate Evening H.S., CAS.
Total cost: SPECIAL SCHOOLS
2012-2013
BUDGET
School Library and Audio Visual
Salaries of librarians and clerical staff, library and A/V equipment and
supplies and audio, video and computer repairs.
Computer Assisted Instruction
Computer hardware/software and State aided computer hardware/software
expenditures.
Total cost: INSTRUCTIONAL MEDIA
2012-2013
BUDGET
Attendance
Salaries of attendance teacher, clerical staff, supplies, equipment, and
other expenses.
Guidance
Salaries for guidance counselors, clerical staff, equipment, supplies and
other expenses.
Health Services/School Nurses
Salaries of clerical staff and nurses (10), plus additional time for school
nurses at the District’s non public schools, equipment, supplies, and other
expenses. District also pays for health services of district resident private
school students.
Psychological Services
Salaries of psychologists and clerical staff, equipment, supplies, and other
expenses.
Educational Related Support Services
Salaries of student assistance counselors, occupational and physical
therapists, supplies and other expenses.
Speech and Social Work Services
Salaries of speech teachers, supplies, and other expenses.
Pupil Personnel Services - Special Schools
Salaries of Assistant Superintendent for Pupil Services and Human
Resources, Director and Assistant Director of Special Education, office
staff, equipment, supplies, and other expenses.
Total cost: PUPIL PERSONNEL SERVICES
CODE SPECIAL SCHOOLS
A2330
CODE INSTRUCTIONAL MEDIA
A2610
107,000
107,000
1,509,419
CODE PUPIL PERSONNEL SERVICES
788,079
A2630 721,340
A2815 880,069
A2820 867,500
A2805 83,395
A2810 1,035,023
A2830 423,950
4,750,599
A2823 249,612
A2825 1,211,050
158,520
78,663
1,390,959
966,334
831,714
2013-2014
BUDGET
158,520
756,050
2013-2014
BUDGET
634,909
805,982
287,614
1,185,414
454,140
4,609,861
2013-2014
BUDGET
Page 4

Valley Central School District
ADOPTED BUDGET (4/15/13) 2012-2013
BUDGET
Co-Curricular Activities
Salaries of chaperones, class advisors and advisors to Yearbook, Student
Newspaper, Student Government, Plays, etc.
Interscholastic Sports, Grades 7-12
Salaries of coaches for interscholastic sports, supplies, uniforms,
equipment reconditioning, officials, dues, entry fees, and expenses for
pool.
Total cost:
CO-CURRICULAR AND INTERSCHOLASTIC SPORTS
2012-2013
BUDGET
District Transportation
Fuel costs.
Contract Transportation
Cost for transportation of pupils to and from the public, non-public and
special education schools.
Total cost: TRANSPORTATION
2012-2013
BUDGET
State Retirement
Civil service employees' retirement costs. A portion of expense paid from
district reserve.
Teachers’ Retirement
District’s share of retirement plan for professional staff.
Social Security
District’s share of Social Security and Medicare for employees.
Workers’ Compensation Insurance
Premiums paid by the District as required by law. District is a member
of a self-funded plan.
Unemployment Insurance
An expense required by State and Federal Law.
Health Insurance
District’s share for health and life insurance premiums. District is a
member of a self-funded plan as well as two other plans.
Dental and Vision Insurance
District’s share for dental and vision plan for employees.
A9070 Accumulated Sick And Vacation Days
Buyback of accumulated retiree sick and vacation days.
Total cost: EMPLOYEE BENEFITS
155,000
A2855 587,500
CODE CO-CURRICULAR and INTERSCHOLASTIC SPORTS
A2850
A5510 630,500
A5540.4 5,424,800
742,500
CODE PUPIL TRANSPORTATION
A9010.8 1,100,000
A9020.8 4,872,140
6,055,300
CODE EMPLOYEE BENEFITS
A9050.8 365,000
A9060.8 9,450,348
A9030.8 3,717,274
A9040.8 464,836
A9065.8 629,526
20,599,124
2013-2014
BUDGET
517,062
159,650
517,090
170,000
2,024,435
6,132,417
3,483,558
507,394
2013-2014
BUDGET
365,000
9,453,893
676,712
6,290,420
22,653,787
2013-2014
BUDGET
661,915
5,628,505
Page 5

Valley Central School District
ADOPTED BUDGET (4/15/13) CODE DEBT SERVICE, CAPITAL PROJECTS, BORROWING COSTS and
INTERFUND TRANSFERS
2012-2013
BUDGET
2013-2014
BUDGET
Principal and Interest
Long term debt service and short-term borrowing should State Aid
payments fail to be made by NYS.
Transfer to Special Aid Funds and Cafeteria Fund
Transfer to Federal Fund for the Summer Handicapped Program, and
continued support for student food service.
Transfer to Capital Funds
Not currently used.
Total cost: DEBT SERVICE, CAPITAL PROJECTS, and INTERFUND
TRANSFERS
Change: Total cost: GENERAL FUND APPROPRIATION
#REF!
A9710 2,980,000
90,165,138
A9950.9 -
3,270,000
290,000 A9901.95
3,003,000
310,000
-
3,313,000
92,352,524
Page 6

Valley Central School District
2013-2014 Fiscal Accountability Report

SDL: 4490 LEA: 441301060000
The New York State School Report CardFiscal Accountability Supplement
forValley Central School District (Montgomery)
New York State Education Law and the Commissioner's Regulations require the attachment of the NYS School Report Card to the public school district budget proposal. The regulations require that certain expenditure ratios for general education and special education students be reported and compared with ratios for similar districts and all public schools. The required ratios for this district are reported below.
2010-2011 School Year General Education Special Education
This School District
Similar District Group
Similar District Group Description: Average Need/Resource Capacity
Instructional ExpendituresPupilsExpenditures Per Pupil
$47,871,8784,729
$10,123
$18,377,050775
$23,712
$7,820,663,210798,424$9,795
$3,172,283,304110,978$28,585
Instructional ExpendituresPupilsExpenditures Per Pupil
Instructional ExpendituresPupils
Expenditures Per Pupil
$29,473,160,4062,688,528
$10,963
$12,260,104,540412,226
$29,741
Instructional Expenditures for General Education are K-12 expenditures for classroom instruction (excluding Special Education) plus a pro-ration of building level administrative and instructional support expenditures. These expenditures include amounts for instruction of stu-dents with disabilities in a general-education setting. District expenditures, such as transportation, debt service and district-wide adminis-tration are not included.
The pupil count for General Education is K-12 average daily membership plus K-12 pupils for whom the district pays tuition to another school district. This number represents all pupils, including those classified as having disabilities and those not classified, excluding only students with disabilities placed out of district. For districts in which a county jail is located, this number includes incarcerated youth to whom the district must provide an education program.
Instructional Expenditures for Special Education are K-12 expenditures for students with disabilities (including summer special education expenditures) plus a proration of building-level administrative and instructional support expenditures. District expenditures, such as trans-portation, debt service and district-wide administration are not included.
The pupil count for Special Education is a count of K-12 students with disabilities for the 2010-11 school year plus students for whom thedistrict receives tuition from another district plus students for whom the district pays tuition to another district. Students attending the Stateschools at Rome and Batavia, private placements and out-of-state placements are included.
Total of All School
Districts in NY State
Total of All School Districts in NY State2010-2011 School Year This School
District Similar District
Group
Total Expenditures Per Pupil $17,810 $20,410$18,876
The numbers used to compute the statistics on this page were collected on the State Aid Form A, the State Aid Form F, the School District Annual Financial Report (ST-3), and from the Student Information Repository System (SIRS).
Instructional Expenditures Per Pupil is the simple arithmetic ratio of Instructional Expenditures to Pupils. The total cost of instruction for stu-dents with disabilities may include both general- and special-education expenditures. Special-education services provided in the general- education classroom may benefit students not classified as having disabilities.
Total Expenditures Per Pupil is the simple arithmetic ratio of Total Expenditures to Pupils. Total Expenditures include district expenditures for classroom instruction, as well as expenditures for transportation, debt service, community service and district-wide administration that are not included in the Instructional Expenditure values for General Education and Special Education. As such, the sum of General Educa-tion and Special Education Instructional Expenditures does not equal the Total Expenditures.

SDL: 4490 LEA: 441301060000
The New York State School Report CardInformation about Students with Disabilities
forValley Central School District (Montgomery)
New York State Education Law and the Commissioner's Regulations require the attachment of the NYS School Report Card to the public school district budget proposal. The regulations require reporting students with disabi-lities by the percent of time they are in general education classrooms and the classification rate of students with disabilities. These data are to be compared with percentages for similar districts and all public schools. The re-quired percentages for this district are reported below.
Student Counts as of October 4, 2011 This School District Total of All School
Districts in NY State
Student Placement -- Percent of Time Inside Regular Classroom
Count of Students with
Disabilities
Percentage of Students with
Disabilities
Percentage of Students with
Disabilities
80% or more40% to 79%Less than 40%Separate Settings
31416422931
41.0%21.4%29.9%4.0%
57.3%11.7%22.1%6.1%
The source data for the statistics in this table were reported through the Student Information Repository System (SIRS) and verified in Verification Report 5. The counts are numbers of students reported in the least restrictive environment categories for school-age programs (ages 6-21) on October 4, 2011. The percentages represent the amount of time students with disabilities are in general-education classrooms, regardless of the amount and cost of special education services they receive. Rounding of percentage values may cause them to sum to a number slightly different from 100%.
School-age Students with Disabilities Classification Rate
2011-12 School Year This School District
Total of All School Districts in NY State
Special Ed Classification Rate 12.8%
This rate is a ratio of the count of school-age students with disabilities (ages 4-21) to the total enrollment of all school-age students in the school district, including students who are parentally placed in nonpublic schools located in the school district. The numerator includes all school-age students for whom a district has Committee on Special Education (CSE) responsibility to ensure the provision of special education services. The denominator includes all school-age students who reside in the district. In the case of parentally placed students in nonpublic schools, it includes the number of students who attend the nonpublic schools located in the school district. Source data are drawn from the SIRS and from the Basic Education Data System (BEDS).
15.2%
Other Settings 28 3.7% 2.8%
Similar District Group
Percentage of Students with
Disabilities
Similar District Group12.1%
58.1%18.8%16.7%
4.1%
2.3%
Similar District Group Description: Average Need/Resource CapacitySimilar District Groups are identified according to the Need-to-Resource-Capacity Index. More information about this categorization is on the Internet at: http://www.p12.nysed.gov/irs/accountability/2011-12/NeedResourceCapacityIndex.pdf
Valley Central School District
2011-2012 Report Card

March 25, 2013 Page 1
The New York State Report Card
2011–12
The New York State Report Card is an important part of the Board of Regents’ effort to raise learning standards for all students. It provides information to the public on school/district enrollment and staff, student performance, and other measures of school and district performance. Knowledge gained from the report card on a school’s or district’s strengths and weaknesses can be used to improve instruction and services to students. State assessments are designed to help ensure that all students reach high learning standards. They show whether students are getting the knowledge and skills they need to succeed at the elementary, middle, and commencement levels and beyond. The State requires that students who are not making appropriate progress toward the standards receive academic supports.
This report includes:
1 Profile This section shows comprehensive data relevant to this school’s or district’s learning environment, including information about enrollment, attendance and suspensions, and staff.
2 Student Performance This section shows student performance on standardized assessments at the elementary, middle, and commencement levels.
3 Student Outcomes This section shows outcomes for graduates and non-completers, including post-graduation plans of completers.
For more information: Office of Information and Reporting Services New York State Education Department Room 863 EBA Albany, NY 12234 Email: [email protected]
District VALLEY CENTRAL SCHOOL DISTRICT(MONTGOMERY)
District ID 44-13-01-06-0000Superintendent RICHARD HOOLEYTelephone (845) 457-2400Grades PK-12, UE, USNeed/ResourceCapacity Category Average Need Districts

March 25, 2013 Page 2
1 Profile
Enrollment
Pre-K
Kindergarten
Grade 1
Grade 2
Grade 3
Grade 4
Grade 5
Grade 6
Ungraded Elementary
Grade 7
Grade 8
Grade 9
Grade 10
Grade 11
Grade 12
Ungraded Secondary
Total K–12
Average Class Size
Common Branch
Grade 8
English
Mathematics
Science
Social Studies
Grade 10
English
Mathematics
Science
Social Studies
Enrollment Information Enrollment counts are as of Basic Educational Data System (BEDS) day, which is typically the first Wednesday of October of the school year. Students who attend BOCES programs on a part-time basis are included in a school’s and district's enrollment. Students who attend BOCES on a full-time basis or who are placed full time by the district in an out-of-district placement are not included in a school’s or district's enrollment. The state public enrollment includes public school districts, charter schools, and NYSED-operated programs. Students classified by districts as "pre-first" are included in first grade counts. Kindergarten and Pre-K counts include half- and full-day students.
Average Class Size Information Average Class Size is the total registration in specified classes divided by the number of those classes with registration. Common Branch refers to self-contained classes in Grades 1–6.
District VALLEY CENTRAL SCHOOL DISTRICT (MONTGOMERY) District ID 44-13-01-06-0000
2009–10 2010–11 2011–1286
327
357
351
340
370
374
372
4
395
378
443
378
387
364
13
4853
87
333
324
354
340
339
370
374
4
386
387
435
418
355
375
16
4810
86
314
322
319
350
323
341
371
25
370
388
421
390
389
334
26
4683
2009–10 2010–11 2011–1221
23
23
20
23
22
22
22
26
22
23
23
20
24
24
23
23
25
22
24
24
24
24
25
23
23
25

March 25, 2013 Page 3
1 Profile
Demographic Factors
# % # % # %
Eligible for Free Lunch
Reduced Price Lunch
Limited English Proficient
Racial/Ethnic Origin
American Indian or Alaska Native
Black or African American
Hispanic or Latino
Asian or Native Hawaiian/Other Pacific Islander
White
Multiracial
Attendance and Suspensions
# % # % # %
Annual Attendance Rate
Student Suspensions
Demographic Factors Information Eligible for Free Lunch and Reduced-Price Lunch percentages are determined by dividing the number of approved lunch applicants by the Basic Educational Data System (BEDS) enrollment in full-day Kindergarten through Grade 12.
Attendance and Suspensions Information Annual Attendance Rate is determined by dividing the school’s (or district's) total actual attendance by the total possible attendance for a school year. A school’s (or district's) actual attendance is the sum of the number of students in attendance on each day the school (or district's schools) was open during the school year. Possible attendance is the sum of the number of enrolled students who should have been in attendance on each day the school (or schools) was open during the school year. The state’s Annual Attendance Rate is a weighted average of all district-level attendance rates. Student Suspension rate is determined by dividing the number of students who were suspended from school (not including in-school suspensions) for one full day or longer anytime during the school year by the Basic Educational Data System (BEDS) day enrollments for that school year. A student is counted only once, regardless of whether the student was suspended one or more times during the school year.
District VALLEY CENTRAL SCHOOL DISTRICT (MONTGOMERY) District ID 44-13-01-06-0000
2009–10 2010–11 2011–12
826
366
45
16
505
720
98
3513
1
17%
8%
1%
0%
10%
15%
2%
72%
0%
847
358
46
16
508
792
90
3396
8
18%
7%
1%
0%
11%
16%
2%
71%
0%
821
381
38
15
488
788
86
3269
37
18%
8%
1%
0%
10%
17%
2%
70%
1%
2008–09 2009–10 2010–11
310
95%
6% 323
95%
7% 299
95%
6%

March 25, 2013 Page 4
1 Profile
Teacher Qualifications
Total Number of Teachers
Percent with No Valid Teaching Certificate
Percent Teaching Out of Certification
Percent with Fewer than Three Years of Experience
Percentage with Master’s Degree Plus 30 Hours or Doctorate
Total Number of Core Classes
Percent Not Taught by Highly Qualified Teachers in This School*
Percent Not Taught by Highly Qualified Teachers in This District**
Percent Not Taught by Highly Qualified Teachers in High-Poverty Schools Statewide
Percent Not Taught by Highly Qualified Teachers in Low-Poverty Schools Statewide
Total Number of Classes
Percent Taught by Teachers Without Appropriate Certification
*Not available at the district or statewide level. **Not available for charter schools or at the statewide level.
Teacher Turnover Rate
Staff Counts
*Not available at the school level.
Turnover Rate of Teachers with Fewer than Five Years of Experience
Turnover Rate of All Teachers
Total Other Professional Staff
Total Paraprofessionals*
Assistant Principals
Principals
Teacher Qualifications Information The Percent Teaching Out of Certification for public schools is the percent doing so on more than an incidental basis; that is, the percent teaching for more than five periods per week outside certification.
Core Classes are primarily K–6 common branch, English, mathematics, science, social studies, art, music, and foreign languages. To be Highly Qualified, a teacher must have at least a Bachelor’s degree, be certified to teach in the subject area or otherwise in accordance with state standards, and show subject matter competency. In public schools, a teacher who taught one class outside of the certification area(s) is counted as Highly Qualified provided that 1) the teacher had been determined by the school or district through the HOUSSE process or other state-accepted methods to have demonstrated acceptable subject knowledge and teaching skills and 2) the class in question was not the sole assignment reported. Credit for incidental teaching does not extend beyond a single assignment. Independent of Highly Qualified Teacher status, any assignment for which a teacher did not hold a valid certificate still registers as teaching out of certification.
In charter schools, a teacher is counted as Highly Qualified if the teacher has at least a Bachelor’s degree, is certified to teach, and shows subject matter competency. Enabling legislation considers charter school teachers to be certified if they hold any valid teaching certificate. Enabling legislation also permits up to 30 percent (with a maximum of five) of charter school teachers to be without certification and to be considered Highly Qualified if they meet all remaining criteria.
High-poverty and low-poverty schools are those schools in the upper and lower quartiles, respectively, for percentage of students eligible for a free or reduced-price lunch.
Teacher Turnover Rate Information Teacher Turnover Rate for a specified school year is the number of teachers in that school year who were not teaching in the following school year divided by the number of teachers in the specified school year, expressed as a percentage.
Staff Counts Information Other Professionals includes administrators, guidance counselors, school nurses, psychologists, and other professionals who devote more than half of their time to non-teaching duties.
District VALLEY CENTRAL SCHOOL DISTRICT (MONTGOMERY) District ID 44-13-01-06-0000
2009–10 2010–11 2011–12
403
0%
0%
3%
35%
981
N/A
0%
6%
1%
1467
1%
382
0%
0%
3%
41%
881
N/A
0%
5%
0%
1382
0%
371
0%
0%
2%
46%
873
N/A
0%
7%
1%
1340
0%
2008–09 2009–10 2010–11
18%
8%
36%
14%
23%
12%
2009–10 2010–11 2011–12
43
164
8
7
43
144
8
7
41
166
8
7

March 25, 2013 Page 5
2 Student Performance
This section contains annual assessment data for students at the elementary, middle, and commencement levels as well as the performance of secondary-level cohorts on standardized achievement assessments.
New York State Testing Program (NYSTP) Assessments The New York State Testing Program assessments are administered in English language arts (ELA) and mathematics in grades 3 through 8. The Performance Level Descriptors for these assessments are provided below:
English Language Arts Level 1: Below Standard Student performance does not demonstrate an understanding of the English language arts knowledge and skills expected at this grade level. Level 2: Meets Basic Standard Student performance demonstrates a partial understanding of the English language arts knowledge and skills expected at this grade level. Level 3: Meets Proficiency Standard Student performance demonstrates an understanding of the English language arts knowledge and skills expected at this grade level. Level 4: Exceeds Proficiency Standard Student performance demonstrates a thorough understanding of the English language arts knowledge and skills expected at this grade level.
Mathematics Level 1: Below Standard Student performance does not demonstrate an understanding of the mathematics content expected at this grade level. Level 2: Meets Basic Standard Student performance demonstrates a partial understanding of the mathematics content expected at this grade level. Level 3: Meets Proficiency Standard Student performance demonstrates an understanding of the mathematics content expected at this grade level. Level 4: Exceeds Proficiency Standard Student performance demonstrates a thorough understanding of the mathematics content expected at this grade level. New York State Alternate Assessment (NYSAA) The New York State Alternate Assessments are administered in English language arts (ELA) and mathematics to ungraded students with severe cognitive disabilities whose ages are equivalent to graded students in grades 3 through 8 and secondary level. They are administered in science to students with disabilities age equivalent to graded students in grades 4, 8, and secondary level. And they are administered in social studies at the secondary level only. New York State English as a Second Language Achievement Tests (NYSESLAT) The New York State English as a Second Language Achievement Tests are administered in grades K through 12 to limited English proficient students. Secondary-Level Cohorts A secondary-level cohort consists of all students who first entered grade 9 anywhere or, in the case of ungraded students with disabilities, reached their seventeenth birthday in a particular year. The 2008 cohort consists of all students who first entered grade 9 anywhere or, in the case of ungraded students with disabilities, reached their seventeenth birthday between July 1, 2008 and June 30, 2009. The 2007 cohort consists of all students who first entered grade 9 anywhere or, in the case of ungraded students with disabilities, reached their seventeenth birthday between July 1, 2007 and June 30, 2008. For more detailed information on cohort definitions, see Secondary-Level Cohort Definitions at http://www.p12.nysed.gov/irs/sirs/.
District VALLEY CENTRAL SCHOOL DISTRICT (MONTGOMERY) District ID 44-13-01-06-0000

March 25, 2013 Page 6
2 Student Performance 100%
Results by Student Group
Percentage scoring at level(s): Percentage scoring at level(s):
2–4 3–4 4 2–4 3–4 4
All Students
Female
Male
American Indian or Alaska Native
Black or African American
Hispanic or Latino
Asian or Native Hawaiian/Other Pacific Islander
White
Multiracial
Small Group Totals
General-Education Students
Students with Disabilities
English Proficient
Limited English Proficient Economically Disadvantaged Not Disadvantaged
Migrant
Not Migrant
Other Assessments
Number scoring at level(s): Number scoring at level(s):
2–4 3–4 4 2–4 3–4 4
District VALLEY CENTRAL SCHOOL DISTRICT (MONTGOMERY) District ID 44-13-01-06-0000
Results in Grade 3 English Language Arts
Percentage scoring at level(s):
2-4 3-4 4
NY State PublicPercentage scoring at level(s):
2-4 3-4 4
This District
2012 Mean Score: 6672011 Mean Score: 666
*Range: 644–780 663–780 694–780
88% 91%
64% 61%
7% 5%
86% 87%
56% 56%
7% 5%
Number of Tested Students: 310 226 24300 202 15
2011–12
2010–11
2011–12 School Year 2010–11 School Year
TotalTested
TotalTested
352 88% 64% 7% 330 91% 61% 5%
183
169
136
55
5253
28
290
62350
2121231
352
91%
85%
–83%
85%
–89%
–88%95%
55%––
77%94%
88%
67%
62%
–44%
58%
–68%
–75%74%
18%––
45%74%
64%
8%
5%
–0%
2%
–9%
–0%8%
0%––
2%9%
7%
158
172
236
54
4233
17
271
59326
4110220
1329
92%
90%
–78%
89%
–93%
–100%97%
63%––
85%94%
––
70%
53%
–50%
63%
–63%
–43%69%
24%––
46%69%
––
6%
3%
–6%
2%
–5%
–14%6%
0%––
2%6%
––
NOTESThe – symbol indicates that data for a group of students have been suppressed. If a group has fewer than five students,data for that group and the next smallest group(s) are suppressed to protect the privacy of individual students.* These ranges are for 2011–12 data only. Ranges for 2010–11 data are available in the 2010–11 Accountability and Overview Reports.
2011–12 School Year 2010–11 School Year
TotalTested
TotalTested
New York State Alternate Assessment
(NYSAA): Grade 3 Equivalent11 9 8 5 5 5 5 4
New York State English as a Second Language
Achievement Test (NYSESLAT)†: Grade 30 N/A N/A N/A 0 N/A N/A N/A
Total Total
Recently Arrived LEP Students NOT Tested on
the ELA NYSTP: Grade 30 N/A N/A N/A 0 N/A N/A N/A
† These counts represent recently arrived LEP students who used the NYSESLAT to fulfill the English language arts participation requirement.

March 25, 2013 Page 7
2 Student Performance 100%
Results by Student Group
Percentage scoring at level(s): Percentage scoring at level(s):
2–4 3–4 4 2–4 3–4 4
All Students
Female
Male
American Indian or Alaska Native
Black or African American
Hispanic or Latino
Asian or Native Hawaiian/Other Pacific Islander
White
Multiracial
Small Group Totals
General-Education Students
Students with Disabilities
English Proficient
Limited English Proficient Economically Disadvantaged Not Disadvantaged
Migrant
Not Migrant
Other Assessments
Number scoring at level(s): Number scoring at level(s):
2–4 3–4 4 2–4 3–4 4
District VALLEY CENTRAL SCHOOL DISTRICT (MONTGOMERY) District ID 44-13-01-06-0000
Results in Grade 3 Mathematics
Percentage scoring at level(s):
2-4 3-4 4
NY State PublicPercentage scoring at level(s):
2-4 3-4 4
This District
2012 Mean Score: 6922011 Mean Score: 691
*Range: 662–770 684–770 707–770
97% 94%
70% 68%
14% 21%
91% 91%
61% 60%
13% 13%
Number of Tested Students: 341 245 51311 225 68
2011–12
2010–11
2011–12 School Year 2010–11 School Year
TotalTested
TotalTested
352 97% 70% 14% 330 94% 68% 21%
183
169
136
55
5253
28
290
62350
2121231
352
96%
98%
–83%
100%
–98%
–100%99%
85%––
92%100%
97%
66%
73%
–53%
55%
–75%
–63%76%
42%––
50%80%
70%
15%
14%
–0%
16%
–16%
–25%18%
0%––
8%18%
14%
158
172
236
53
4234
17
271
59326
4110220
1329
94%
95%
–83%
91%
–97%
–100%98%
78%––
86%98%
––
70%
67%
–56%
58%
–72%
–71%77%
27%––
49%78%
––
18%
23%
–17%
11%
–24%
–14%24%
7%––
10%26%
––
NOTESThe – symbol indicates that data for a group of students have been suppressed. If a group has fewer than five students,data for that group and the next smallest group(s) are suppressed to protect the privacy of individual students.* These ranges are for 2011–12 data only. Ranges for 2010–11 data are available in the 2010–11 Accountability and Overview Reports.
2011–12 School Year 2010–11 School Year
TotalTested
TotalTested
New York State Alternate Assessment
(NYSAA): Grade 3 Equivalent11 11 10 7 5 5 5 3

March 25, 2013 Page 8
2 Student Performance 100%
Results by Student Group
Percentage scoring at level(s): Percentage scoring at level(s):
2–4 3–4 4 2–4 3–4 4
All Students
Female
Male
American Indian or Alaska Native
Black or African American
Hispanic or Latino
Asian or Native Hawaiian/Other Pacific Islander
White
Multiracial
Small Group Totals
General-Education Students
Students with Disabilities
English Proficient
Limited English Proficient Economically Disadvantaged Not Disadvantaged
Migrant
Not Migrant
Other Assessments
Number scoring at level(s): Number scoring at level(s):
2–4 3–4 4 2–4 3–4 4
District VALLEY CENTRAL SCHOOL DISTRICT (MONTGOMERY) District ID 44-13-01-06-0000
Results in Grade 4 English Language Arts
Percentage scoring at level(s):
2-4 3-4 4
NY State PublicPercentage scoring at level(s):
2-4 3-4 4
This District
2012 Mean Score: 6822011 Mean Score: 673
*Range: 637–775 671–775 722–775
96% 94%
72%58%
6% 1%
91% 92%
59% 57%
5% 2%
Number of Tested Students: 305 228 18317 196 4
2011–12
2010–11
2011–12 School Year 2010–11 School Year
TotalTested
TotalTested
317 96% 72% 6% 336 94% 58% 1%
153
164
230
55
5223
29
264
53314
3111206
1316
96%
96%
–87%
100%
–97%
–89%99%
81%––
91%99%
––
74%
70%
–70%
67%
–74%
–67%80%
32%––
57%80%
––
8%
4%
–3%
4%
–7%
–0%7%
0%––
2%8%
––
157
179
225
64
7238
9265
71334
2118218
1335
96%
93%
–92%
92%
–95%
100%100%
75%––
92%96%
––
62%
55%
–40%
50%
–61%
89%69%
20%––
47%64%
––
2%
1%
–0%
0%
–2%
0%2%
0%––
0%2%
––
NOTESThe – symbol indicates that data for a group of students have been suppressed. If a group has fewer than five students,data for that group and the next smallest group(s) are suppressed to protect the privacy of individual students.* These ranges are for 2011–12 data only. Ranges for 2010–11 data are available in the 2010–11 Accountability and Overview Reports.
2011–12 School Year 2010–11 School Year
TotalTested
TotalTested
New York State Alternate Assessment
(NYSAA): Grade 4 Equivalent10 10 10 6 4 – – –
New York State English as a Second Language
Achievement Test (NYSESLAT)†: Grade 41 N/A N/A N/A 0 N/A N/A N/A
Total Total
Recently Arrived LEP Students NOT Tested on
the ELA NYSTP: Grade 41 N/A N/A N/A 0 N/A N/A N/A
† These counts represent recently arrived LEP students who used the NYSESLAT to fulfill the English language arts participation requirement.

March 25, 2013 Page 9
2 Student Performance 100%
Results by Student Group
Percentage scoring at level(s): Percentage scoring at level(s):
2–4 3–4 4 2–4 3–4 4
All Students
Female
Male
American Indian or Alaska Native
Black or African American
Hispanic or Latino
Asian or Native Hawaiian/Other Pacific Islander
White
Multiracial
Small Group Totals
General-Education Students
Students with Disabilities
English Proficient
Limited English Proficient Economically Disadvantaged Not Disadvantaged
Migrant
Not Migrant
Other Assessments
Number scoring at level(s): Number scoring at level(s):
2–4 3–4 4 2–4 3–4 4
District VALLEY CENTRAL SCHOOL DISTRICT (MONTGOMERY) District ID 44-13-01-06-0000
Results in Grade 4 Mathematics
Percentage scoring at level(s):
2-4 3-4 4
NY State PublicPercentage scoring at level(s):
2-4 3-4 4
This District
2012 Mean Score: 6942011 Mean Score: 691
*Range: 636–800 676–800 707–800
99% 98%
78% 75%
30% 26%
95% 94%
69% 67%
30% 27%
Number of Tested Students: 314 248 95327 250 87
2011–12
2010–11
2011–12 School Year 2010–11 School Year
TotalTested
TotalTested
318 99% 78% 30% 335 98% 75% 26%
154
164
230
55
5224
29
265
53314
4111207
1317
98%
99%
–97%
100%
–99%
–100%99%
96%––
97%100%
––
75%
80%
–70%
76%
–79%
–78%84%
49%––
68%83%
––
28%
32%
–20%
18%
–33%
–56%34%
8%––
16%37%
––
157
178
225
63
7238
9264
71333
2118217
1334
97%
98%
–96%
95%
–98%
100%100%
90%––
94%100%
––
72%
77%
–68%
75%
–74%
100%82%
48%––
68%78%
––
29%
23%
–12%
24%
–27%
56%31%
7%––
18%30%
––
NOTESThe – symbol indicates that data for a group of students have been suppressed. If a group has fewer than five students,data for that group and the next smallest group(s) are suppressed to protect the privacy of individual students.* These ranges are for 2011–12 data only. Ranges for 2010–11 data are available in the 2010–11 Accountability and Overview Reports.
2011–12 School Year 2010–11 School Year
TotalTested
TotalTested
New York State Alternate Assessment
(NYSAA): Grade 4 Equivalent10 10 9 5 4 – – –
March 25, 2013 Page 10
2 Student Performance 100%
Results by Student Group
Percentage scoring at level(s): Percentage scoring at level(s):
2–4 3–4 4 2–4 3–4 4
All Students
Female
Male
American Indian or Alaska Native
Black or African American
Hispanic or Latino
Asian or Native Hawaiian/Other Pacific Islander
White
Multiracial
Small Group Totals
General-Education Students
Students with Disabilities
English Proficient
Limited English Proficient Economically Disadvantaged Not Disadvantaged
Migrant
Not Migrant
Other Assessments
Number scoring at level(s): Number scoring at level(s):
2–4 3–4 4 2–4 3–4 4
District VALLEY CENTRAL SCHOOL DISTRICT (MONTGOMERY) District ID 44-13-01-06-0000
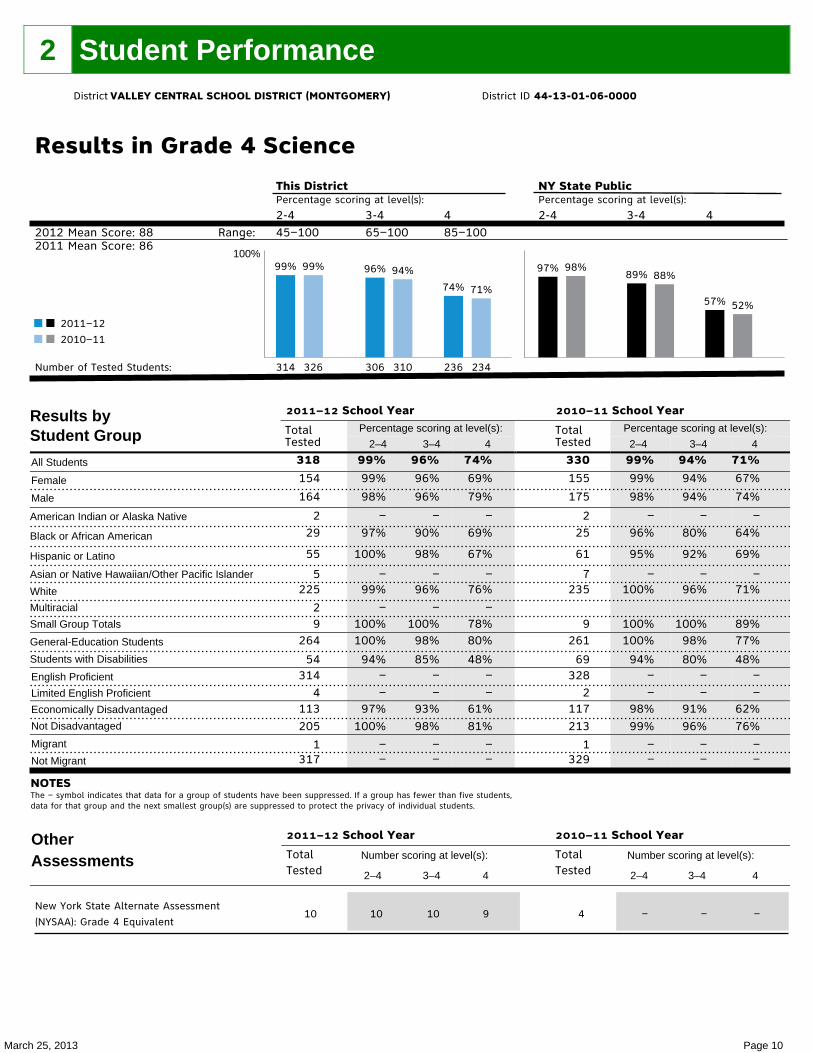
Results in Grade 4 Science
Percentage scoring at level(s):
2-4 3-4 4
NY State PublicPercentage scoring at level(s):
2-4 3-4 4
This District
2012 Mean Score: 882011 Mean Score: 86
Range: 45–100 65–100 85–100
99% 99% 96% 94%
74% 71%
97% 98%89% 88%
57% 52%
Number of Tested Students: 314 306 236326 310 234
2011–12
2010–11
2011–12 School Year 2010–11 School Year
TotalTested
TotalTested
318 99% 96% 74% 330 99% 94% 71%
154
164
229
55
5225
29
264
54314
4113205
1317
99%
98%
–97%
100%
–99%
–100%100%
94%––
97%100%
––
96%
96%
–90%
98%
–96%
–100%98%
85%––
93%98%
––
69%
79%
–69%
67%
–76%
–78%80%
48%––
61%81%
––
155
175
225
61
7235
9261
69328
2117213
1329
99%
98%
–96%
95%
–100%
100%100%
94%––
98%99%
––
94%
94%
–80%
92%
–96%
100%98%
80%––
91%96%
––
67%
74%
–64%
69%
–71%
89%77%
48%––
62%76%
––
NOTESThe – symbol indicates that data for a group of students have been suppressed. If a group has fewer than five students,data for that group and the next smallest group(s) are suppressed to protect the privacy of individual students.
2011–12 School Year 2010–11 School Year
TotalTested
TotalTested
New York State Alternate Assessment
(NYSAA): Grade 4 Equivalent10 10 10 9 4 – – –

March 25, 2013 Page 11
2 Student Performance 100%
Results by Student Group
Percentage scoring at level(s): Percentage scoring at level(s):
2–4 3–4 4 2–4 3–4 4
All Students
Female
Male
American Indian or Alaska Native
Black or African American
Hispanic or Latino
Asian or Native Hawaiian/Other Pacific Islander
White
Multiracial
Small Group Totals
General-Education Students
Students with Disabilities
English Proficient
Limited English Proficient Economically Disadvantaged Not Disadvantaged
Migrant
Not Migrant
Other Assessments
Number scoring at level(s): Number scoring at level(s):
2–4 3–4 4 2–4 3–4 4
District VALLEY CENTRAL SCHOOL DISTRICT (MONTGOMERY) District ID 44-13-01-06-0000
Results in Grade 5 English Language Arts
Percentage scoring at level(s):
2-4 3-4 4
NY State PublicPercentage scoring at level(s):
2-4 3-4 4
This District
2012 Mean Score: 6712011 Mean Score: 667
*Range: 648–795 668–795 700–795
92% 92%
60% 54%
2% 1%
89% 89%
58% 54%
5% 4%
Number of Tested Students: 318 206 7340 201 3
2011–12
2010–11
2011–12 School Year 2010–11 School Year
TotalTested
TotalTested
344 92% 60% 2% 369 92% 54% 1%
159
185
223
70
5242
29
268
76342
2133211
1343
94%
91%
–87%
90%
–93%
–100%100%
67%––
89%94%
––
69%
52%
–48%
60%
–61%
–56%73%
14%––
47%68%
––
3%
2%
–0%
1%
–2%
–11%3%
0%––
1%3%
––
185
184
244
67
1255
47306
63366
3133236
1368
96%
89%
––
87%
–94%
89%98%
62%––
86%95%
––
58%
51%
––
49%
–56%
53%63%
13%––
38%64%
––
1%
1%
––
0%
–1%
2%1%
0%––
1%1%
––
NOTESThe – symbol indicates that data for a group of students have been suppressed. If a group has fewer than five students,data for that group and the next smallest group(s) are suppressed to protect the privacy of individual students.* These ranges are for 2011–12 data only. Ranges for 2010–11 data are available in the 2010–11 Accountability and Overview Reports.
2011–12 School Year 2010–11 School Year
TotalTested
TotalTested
New York State Alternate Assessment
(NYSAA): Grade 5 Equivalent8 8 8 5 1 – – –
New York State English as a Second Language
Achievement Test (NYSESLAT)†: Grade 50 N/A N/A N/A 0 N/A N/A N/A
Total Total
Recently Arrived LEP Students NOT Tested on
the ELA NYSTP: Grade 50 N/A N/A N/A 0 N/A N/A N/A
† These counts represent recently arrived LEP students who used the NYSESLAT to fulfill the English language arts participation requirement.

March 25, 2013 Page 12
2 Student Performance 100%
Results by Student Group
Percentage scoring at level(s): Percentage scoring at level(s):
2–4 3–4 4 2–4 3–4 4
All Students
Female
Male
American Indian or Alaska Native
Black or African American
Hispanic or Latino
Asian or Native Hawaiian/Other Pacific Islander
White
Multiracial
Small Group Totals
General-Education Students
Students with Disabilities
English Proficient
Limited English Proficient Economically Disadvantaged Not Disadvantaged
Migrant
Not Migrant
Other Assessments
Number scoring at level(s): Number scoring at level(s):
2–4 3–4 4 2–4 3–4 4
District VALLEY CENTRAL SCHOOL DISTRICT (MONTGOMERY) District ID 44-13-01-06-0000
Results in Grade 5 Mathematics
Percentage scoring at level(s):
2-4 3-4 4
NY State PublicPercentage scoring at level(s):
2-4 3-4 4
This District
2012 Mean Score: 6902011 Mean Score: 688
*Range: 640–780 676–780 707–780
95% 97%
74% 71%
28%20%
93% 94%
67% 66%
28% 23%
Number of Tested Students: 325 255 96360 263 74
2011–12
2010–11
2011–12 School Year 2010–11 School Year
TotalTested
TotalTested
343 95% 74% 28% 370 97% 71% 20%
159
184
223
70
5241
29
268
75341
2132211
1342
95%
95%
–91%
94%
–95%
–100%98%
83%––
92%97%
––
74%
74%
–70%
69%
–76%
–78%84%
40%––
67%79%
––
33%
24%
–17%
20%
–30%
–56%34%
5%––
22%32%
––
186
184
244
68
1255
47307
63366
4134236
1369
99%
96%
––
96%
–98%
98%100%
86%––
96%98%
––
71%
71%
––
59%
–76%
64%80%
27%––
63%75%
––
24%
16%
––
9%
–22%
26%23%
5%––
13%24%
––
NOTESThe – symbol indicates that data for a group of students have been suppressed. If a group has fewer than five students,data for that group and the next smallest group(s) are suppressed to protect the privacy of individual students.* These ranges are for 2011–12 data only. Ranges for 2010–11 data are available in the 2010–11 Accountability and Overview Reports.
2011–12 School Year 2010–11 School Year
TotalTested
TotalTested
New York State Alternate Assessment
(NYSAA): Grade 5 Equivalent8 8 8 6 1 – – –

March 25, 2013 Page 13
2 Student Performance 100%
Results by Student Group
Percentage scoring at level(s): Percentage scoring at level(s):
2–4 3–4 4 2–4 3–4 4
All Students
Female
Male
American Indian or Alaska Native
Black or African American
Hispanic or Latino
Asian or Native Hawaiian/Other Pacific Islander
White
Multiracial
Small Group Totals
General-Education Students
Students with Disabilities
English Proficient
Limited English Proficient Economically Disadvantaged Not Disadvantaged
Migrant
Not Migrant
Other Assessments
Number scoring at level(s): Number scoring at level(s):
2–4 3–4 4 2–4 3–4 4
District VALLEY CENTRAL SCHOOL DISTRICT (MONTGOMERY) District ID 44-13-01-06-0000
Results in Grade 6 English Language Arts
Percentage scoring at level(s):
2-4 3-4 4
NY State PublicPercentage scoring at level(s):
2-4 3-4 4
This District
2012 Mean Score: 6642011 Mean Score: 666
*Range: 644–785 662–785 694–785
93% 94%
59% 66%
2% 5%
89% 88%
56% 56%
2% 4%
Number of Tested Students: 349 223 7348 246 17
2011–12
2010–11
2011–12 School Year 2010–11 School Year
TotalTested
TotalTested
377 93% 59% 2% 371 94% 66% 5%
190
187
249
72
1252
153
313
64373
4148229
1376
96%
89%
––
83%
–94%
–96%98%
66%––
86%97%
––
64%
54%
––
46%
–63%
–58%68%
14%––
41%71%
––
3%
1%
––
1%
–2%
–2%2%
0%––
1%3%
––
181
190
40
66
11253
112
316
55367
4120251
1370
96%
92%
90%
94%
–94%
–92%97%
73%––
92%95%
––
71%
62%
50%
61%
–72%
–42%72%
31%––
58%70%
––
7%
3%
3%
3%
–6%
–0%5%
0%––
1%6%
––
NOTESThe – symbol indicates that data for a group of students have been suppressed. If a group has fewer than five students,data for that group and the next smallest group(s) are suppressed to protect the privacy of individual students.* These ranges are for 2011–12 data only. Ranges for 2010–11 data are available in the 2010–11 Accountability and Overview Reports.
2011–12 School Year 2010–11 School Year
TotalTested
TotalTested
New York State Alternate Assessment
(NYSAA): Grade 6 Equivalent2 – – – 3 – – –
New York State English as a Second Language
Achievement Test (NYSESLAT)†: Grade 62 N/A N/A N/A 0 N/A N/A N/A
Total Total
Recently Arrived LEP Students NOT Tested on
the ELA NYSTP: Grade 62 N/A N/A N/A 0 N/A N/A N/A
† These counts represent recently arrived LEP students who used the NYSESLAT to fulfill the English language arts participation requirement.

March 25, 2013 Page 14
2 Student Performance 100%
Results by Student Group
Percentage scoring at level(s): Percentage scoring at level(s):
2–4 3–4 4 2–4 3–4 4
All Students
Female
Male
American Indian or Alaska Native
Black or African American
Hispanic or Latino
Asian or Native Hawaiian/Other Pacific Islander
White
Multiracial
Small Group Totals
General-Education Students
Students with Disabilities
English Proficient
Limited English Proficient Economically Disadvantaged Not Disadvantaged
Migrant
Not Migrant
Other Assessments
Number scoring at level(s): Number scoring at level(s):
2–4 3–4 4 2–4 3–4 4
District VALLEY CENTRAL SCHOOL DISTRICT (MONTGOMERY) District ID 44-13-01-06-0000
Results in Grade 6 Mathematics
Percentage scoring at level(s):
2-4 3-4 4
NY State PublicPercentage scoring at level(s):
2-4 3-4 4
This District
2012 Mean Score: 6732011 Mean Score: 680
*Range: 640–780 674–780 700–780
90% 96%
54% 61%
18% 18%
92% 92%
65% 63%
31% 26%
Number of Tested Students: 342 203 68356 226 67
2011–12
2010–11
2011–12 School Year 2010–11 School Year
TotalTested
TotalTested
378 90% 54% 18% 371 96% 61% 18%
192
186
249
74
1251
153
315
63372
6149229
2376
95%
86%
––
86%
–92%
–91%97%
59%91%50%85%94%
––
57%
51%
––
39%
–61%
–42%62%
11%55%0%
38%64%
––
17%
19%
––
8%
–21%
–19%21%
3%18%0%
11%22%
––
182
189
40
65
11254
112
316
55367
4121250
1370
97%
95%
98%
95%
–96%
–92%98%
84%––
95%96%
––
63%
59%
35%
63%
–64%
–67%68%
22%––
53%65%
––
20%
16%
8%
17%
–20%
–25%21%
2%––
7%23%
––
NOTESThe – symbol indicates that data for a group of students have been suppressed. If a group has fewer than five students,data for that group and the next smallest group(s) are suppressed to protect the privacy of individual students.* These ranges are for 2011–12 data only. Ranges for 2010–11 data are available in the 2010–11 Accountability and Overview Reports.
2011–12 School Year 2010–11 School Year
TotalTested
TotalTested
New York State Alternate Assessment
(NYSAA): Grade 6 Equivalent2 – – – 3 – – –

March 25, 2013 Page 15
2 Student Performance 100%
Results by Student Group
Percentage scoring at level(s): Percentage scoring at level(s):
2–4 3–4 4 2–4 3–4 4
All Students
Female
Male
American Indian or Alaska Native
Black or African American
Hispanic or Latino
Asian or Native Hawaiian/Other Pacific Islander
White
Multiracial
Small Group Totals
General-Education Students
Students with Disabilities
English Proficient
Limited English Proficient Economically Disadvantaged Not Disadvantaged
Migrant
Not Migrant
Other Assessments
Number scoring at level(s): Number scoring at level(s):
2–4 3–4 4 2–4 3–4 4
District VALLEY CENTRAL SCHOOL DISTRICT (MONTGOMERY) District ID 44-13-01-06-0000
Results in Grade 7 English Language Arts
Percentage scoring at level(s):
2-4 3-4 4
NY State PublicPercentage scoring at level(s):
2-4 3-4 4
This District
2012 Mean Score: 6672011 Mean Score: 665
*Range: 642–790 665–790 698–790
95% 94%
58%50%
2% 2%
92% 91%
52% 48%
4% 4%
Number of Tested Students: 346 213 8365 193 9
2011–12
2010–11
2011–12 School Year 2010–11 School Year
TotalTested
TotalTested
365 95% 58% 2% 387 94% 50% 2%
179
186
43
65
10247
308
57363
2136229
1364
96%
94%
93%
94%
90%96%
99%
72%––
92%97%
––
68%
49%
44%
58%
50%61%
67%
12%––
49%64%
––
3%
1%
0%
2%
0%3%
3%
0%––
0%3%
––
187
200
445
65
10263
14327
60385
2112275
1386
98%
91%
–96%
94%
–95%
86%99%
68%––
93%95%
––
58%
43%
–42%
43%
–53%
50%57%
10%––
33%57%
––
4%
1%
–2%
2%
–3%
0%2%
2%––
0%3%
––
NOTESThe – symbol indicates that data for a group of students have been suppressed. If a group has fewer than five students,data for that group and the next smallest group(s) are suppressed to protect the privacy of individual students.* These ranges are for 2011–12 data only. Ranges for 2010–11 data are available in the 2010–11 Accountability and Overview Reports.
2011–12 School Year 2010–11 School Year
TotalTested
TotalTested
New York State Alternate Assessment
(NYSAA): Grade 7 Equivalent4 – – – 9 9 9 6
New York State English as a Second Language
Achievement Test (NYSESLAT)†: Grade 70 N/A N/A N/A 1 N/A N/A N/A
Total Total
Recently Arrived LEP Students NOT Tested on
the ELA NYSTP: Grade 70 N/A N/A N/A 1 N/A N/A N/A
† These counts represent recently arrived LEP students who used the NYSESLAT to fulfill the English language arts participation requirement.

March 25, 2013 Page 16
2 Student Performance 100%
Results by Student Group
Percentage scoring at level(s): Percentage scoring at level(s):
2–4 3–4 4 2–4 3–4 4
All Students
Female
Male
American Indian or Alaska Native
Black or African American
Hispanic or Latino
Asian or Native Hawaiian/Other Pacific Islander
White
Multiracial
Small Group Totals
General-Education Students
Students with Disabilities
English Proficient
Limited English Proficient Economically Disadvantaged Not Disadvantaged
Migrant
Not Migrant
Other Assessments
Number scoring at level(s): Number scoring at level(s):
2–4 3–4 4 2–4 3–4 4
District VALLEY CENTRAL SCHOOL DISTRICT (MONTGOMERY) District ID 44-13-01-06-0000
Results in Grade 7 Mathematics
Percentage scoring at level(s):
2-4 3-4 4
NY State PublicPercentage scoring at level(s):
2-4 3-4 4
This District
2012 Mean Score: 6792011 Mean Score: 678
*Range: 639–800 670–800 694–800
96% 94%
64% 64%
23% 26%
91% 92%
65% 65%
31% 30%
Number of Tested Students: 349 235 83365 247 101
2011–12
2010–11
2011–12 School Year 2010–11 School Year
TotalTested
TotalTested
365 96% 64% 23% 388 94% 64% 26%
179
186
42
65
10248
307
58363
2135230
1364
96%
95%
98%
97%
90%95%
99%
79%––
94%97%
––
70%
59%
43%
63%
70%68%
72%
24%––
54%70%
––
25%
20%
10%
23%
10%25%
26%
5%––
12%29%
––
188
200
446
65
10263
14328
60385
3113275
1387
96%
92%
–93%
91%
–95%
93%99%
65%––
91%95%
––
68%
60%
–43%
55%
–69%
64%71%
23%––
48%70%
––
31%
22%
–17%
15%
–30%
29%30%
7%––
13%31%
––
NOTESThe – symbol indicates that data for a group of students have been suppressed. If a group has fewer than five students,data for that group and the next smallest group(s) are suppressed to protect the privacy of individual students.* These ranges are for 2011–12 data only. Ranges for 2010–11 data are available in the 2010–11 Accountability and Overview Reports.
2011–12 School Year 2010–11 School Year
TotalTested
TotalTested
New York State Alternate Assessment
(NYSAA): Grade 7 Equivalent4 – – – 9 8 8 3

March 25, 2013 Page 17
2 Student Performance 100%
Results by Student Group
Percentage scoring at level(s): Percentage scoring at level(s):
2–4 3–4 4 2–4 3–4 4
All Students
Female
Male
American Indian or Alaska Native
Black or African American
Hispanic or Latino
Asian or Native Hawaiian/Other Pacific Islander
White
Multiracial
Small Group Totals
General-Education Students
Students with Disabilities
English Proficient
Limited English Proficient Economically Disadvantaged Not Disadvantaged
Migrant
Not Migrant
Other Assessments
Number scoring at level(s): Number scoring at level(s):
2–4 3–4 4 2–4 3–4 4
District VALLEY CENTRAL SCHOOL DISTRICT (MONTGOMERY) District ID 44-13-01-06-0000
Results in Grade 8 English Language Arts
Percentage scoring at level(s):
2-4 3-4 4
NY State PublicPercentage scoring at level(s):
2-4 3-4 4
This District
2012 Mean Score: 6592011 Mean Score: 657
*Range: 628–790 658–790 699–790
95% 95%
54% 48%
1% 2%
93% 92%
50% 47%
2% 2%
Number of Tested Students: 369 208 3373 190 6
2011–12
2010–11
2011–12 School Year 2010–11 School Year
TotalTested
TotalTested
387 95% 54% 1% 393 95% 48% 2%
188
199
450
67
9257
13332
55384
3126261
1386
97%
93%
–96%
93%
–96%
85%100%
69%––
91%97%
––
61%
47%
–46%
43%
–58%
62%60%
15%––
35%63%
––
1%
1%
–0%
1%
–0%
8%1%
0%––
0%1%
––
198
195
46
66
11270
347
46389
499
294
393
96%
93%
93%
92%
91%96%
99%
65%––
91%96%
95%
57%
39%
35%
42%
45%52%
53%
13%––
31%54%
48%
3%
0%
2%
0%
0%2%
2%
0%––
0%2%
2%
NOTESThe – symbol indicates that data for a group of students have been suppressed. If a group has fewer than five students,data for that group and the next smallest group(s) are suppressed to protect the privacy of individual students.* These ranges are for 2011–12 data only. Ranges for 2010–11 data are available in the 2010–11 Accountability and Overview Reports.
2011–12 School Year 2010–11 School Year
TotalTested
TotalTested
New York State Alternate Assessment
(NYSAA): Grade 8 Equivalent15 15 15 12 3 – – –
New York State English as a Second Language
Achievement Test (NYSESLAT)†: Grade 81 N/A N/A N/A 0 N/A N/A N/A
Total Total
Recently Arrived LEP Students NOT Tested on
the ELA NYSTP: Grade 81 N/A N/A N/A 0 N/A N/A N/A
† These counts represent recently arrived LEP students who used the NYSESLAT to fulfill the English language arts participation requirement.

March 25, 2013 Page 18
2 Student Performance 100%
Results by Student Group
Percentage scoring at level(s): Percentage scoring at level(s):
2–4 3–4 4 2–4 3–4 4
All Students
Female
Male
American Indian or Alaska Native
Black or African American
Hispanic or Latino
Asian or Native Hawaiian/Other Pacific Islander
White
Multiracial
Small Group Totals
General-Education Students
Students with Disabilities
English Proficient
Limited English Proficient Economically Disadvantaged Not Disadvantaged
Migrant
Not Migrant
Other Assessments
Number scoring at level(s): Number scoring at level(s):
2–4 3–4 4 2–4 3–4 4
District VALLEY CENTRAL SCHOOL DISTRICT (MONTGOMERY) District ID 44-13-01-06-0000
Results in Grade 8 Mathematics
Percentage scoring at level(s):
2-4 3-4 4
NY State PublicPercentage scoring at level(s):
2-4 3-4 4
This District
2012 Mean Score: 6802011 Mean Score: 681
*Range: 639–775 674–775 704–775
96% 96%
64% 65%
17% 15%
93% 91%
61% 60%
20% 18%
Number of Tested Students: 370 246 64376 254 58
2011–12
2010–11
2011–12 School Year 2010–11 School Year
TotalTested
TotalTested
385 96% 64% 17% 393 96% 65% 15%
186
199
450
68
9254
13333
52381
4125260
1384
97%
95%
–96%
96%
–96%
92%99%
79%––
92%98%
––
64%
64%
–54%
53%
–69%
54%70%
23%––
50%71%
––
21%
13%
–10%
9%
–19%
31%19%
2%––
2%24%
––
198
195
46
66
11270
347
46389
499
294
393
97%
94%
93%
98%
100%95%
98%
76%––
97%95%
96%
71%
58%
57%
68%
64%65%
70%
22%––
55%68%
65%
17%
13%
7%
8%
45%17%
16%
9%––
7%17%
15%
NOTESThe – symbol indicates that data for a group of students have been suppressed. If a group has fewer than five students,data for that group and the next smallest group(s) are suppressed to protect the privacy of individual students.* These ranges are for 2011–12 data only. Ranges for 2010–11 data are available in the 2010–11 Accountability and Overview Reports.
2011–12 School Year 2010–11 School Year
TotalTested
TotalTested
New York State Alternate Assessment
(NYSAA): Grade 8 Equivalent15 14 14 10 3 – – –

March 25, 2013 Page 19
2 Student Performance 100%
Results by Student Group
Percentage scoring at level(s): Percentage scoring at level(s):
2–4 3–4 4 2–4 3–4 4
All Students
Female
Male
American Indian or Alaska Native
Black or African American
Hispanic or Latino
Asian or Native Hawaiian/Other Pacific Islander
White
Multiracial
Small Group Totals
General-Education Students
Students with Disabilities
English Proficient
Limited English Proficient Economically Disadvantaged Not Disadvantaged
Migrant
Not Migrant
Other Assessments
Number scoring at level(s): Number scoring at level(s):
2–4 3–4 4 2–4 3–4 4
District VALLEY CENTRAL SCHOOL DISTRICT (MONTGOMERY) District ID 44-13-01-06-0000
Results in Grade 8 Science
Percentage scoring at level(s):
2-4 3-4 4
NY State PublicPercentage scoring at level(s):
2-4 3-4 4
This District
98% 98%86% 85%
38% 38%
93% 94%
73% 72%
30% 28%
Number of Tested Students: 377 332 148380 330 146
2011–12
2010–11
2011–12 School Year 2010–11 School Year
TotalTested
TotalTested
350 98% 85% 32% 354 97% 83% 31%
167
183
450
62
7227
11296
54346
4123227
1349
98%
97%
–98%
95%
–98%
100%100%
85%––
96%99%
––
87%
83%
–76%
79%
–89%
64%92%
48%––
75%90%
––
33%
32%
–26%
26%
–35%
36%36%
9%––
20%39%
––
175
179
45
65
8236
309
45350
496
258
354
98%
97%
96%
97%
100%98%
99%
84%––
98%97%
97%
86%
81%
82%
77%
88%85%
89%
44%––
71%88%
83%
29%
34%
20%
26%
25%35%
35%
9%––
18%36%
31%
NOTESThe – symbol indicates that data for a group of students have been suppressed. If a group has fewer than five students,data for that group and the next smallest group(s) are suppressed to protect the privacy of individual students.
2011–12 School Year 2010–11 School Year
TotalTested
TotalTested
New York State Alternate Assessment
(NYSAA): Grade 8 Equivalent15 15 14 12 3 – – –
Regents Science 35 35 35 35 35 35 35 35
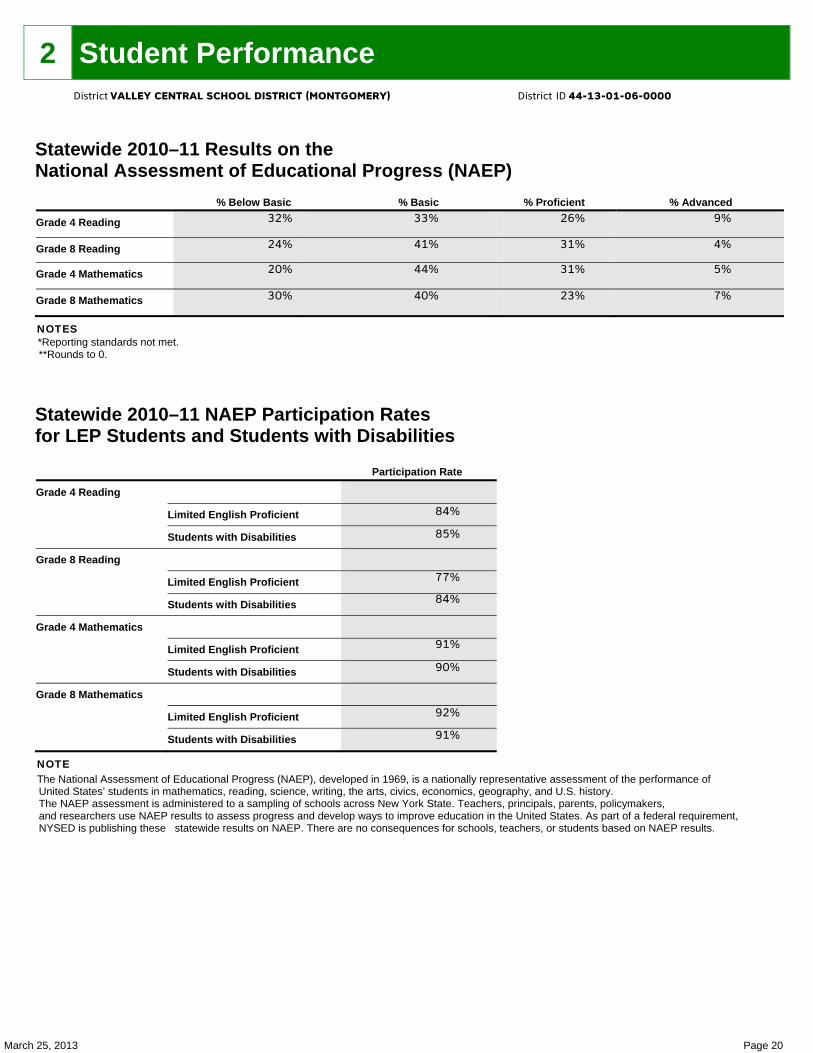
March 25, 2013 Page 20
2 Student Performance
Statewide 2010–11 Results on the National Assessment of Educational Progress (NAEP)
% Below Basic % Basic % Proficient % Advanced
Grade 4 Reading
Grade 8 Reading
Grade 4 Mathematics
Grade 8 Mathematics
NOTES *Reporting standards not met. **Rounds to 0.
Statewide 2010–11 NAEP Participation Rates for LEP Students and Students with Disabilities
Participation Rate
Grade 4 Reading
Limited English Proficient
Students with Disabilities
Grade 8 Reading
Limited English Proficient
Students with Disabilities
Grade 4 Mathematics
Limited English Proficient
Students with Disabilities
Grade 8 Mathematics
Limited English Proficient
Students with Disabilities
NOTE
The National Assessment of Educational Progress (NAEP), developed in 1969, is a nationally representative assessment of the performance of United States’ students in mathematics, reading, science, writing, the arts, civics, economics, geography, and U.S. history. The NAEP assessment is administered to a sampling of schools across New York State. Teachers, principals, parents, policymakers, and researchers use NAEP results to assess progress and develop ways to improve education in the United States. As part of a federal requirement, NYSED is publishing these statewide results on NAEP. There are no consequences for schools, teachers, or students based on NAEP results.
District VALLEY CENTRAL SCHOOL DISTRICT (MONTGOMERY) District ID 44-13-01-06-0000
32%
24%
20%
30%
33%
41%
44%
40%
26%
31%
31%
23%
9%
4%
5%
7%
84%
85%
77%
84%
91%
90%
92%
91%
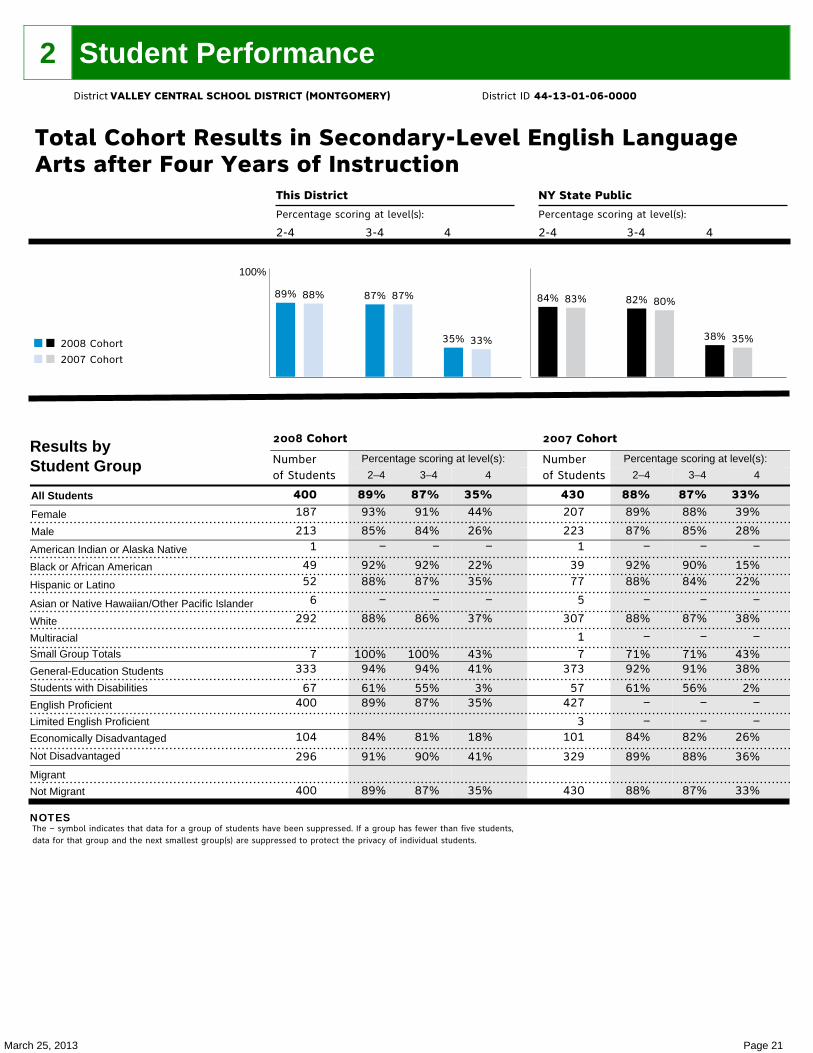
March 25, 2013 Page 21
2 Student Performance
100%
Results by Student Group
Percentage scoring at level(s): Percentage scoring at level(s):
2–4 3–4 4 2–4 3–4 4
All Students
Female
Male
American Indian or Alaska Native
Black or African American
Hispanic or Latino
Asian or Native Hawaiian/Other Pacific Islander
White
Multiracial
Small Group Totals
General-Education Students
Students with Disabilities
English Proficient
Limited English Proficient
Economically Disadvantaged
Not Disadvantaged
Migrant
Not Migrant
NOTES
District VALLEY CENTRAL SCHOOL DISTRICT (MONTGOMERY) District ID 44-13-01-06-0000
Total Cohort Results in Secondary-Level English LanguageArts after Four Years of Instruction
This District
Percentage scoring at level(s):
2-4 3-4 4
NY State Public
Percentage scoring at level(s):
2-4 3-4 4
89% 88% 87% 87%
35% 33%
84% 83% 82% 80%
38% 35%2008 Cohort
2007 Cohort
2008 Cohort 2007 Cohort
Numberof Students
Numberof Students
400 89% 87% 35% 430 88% 87% 33%187
2131
4952
6
292
7333
67400
104
296
400
93%
85%–
92%88%
–
88%
100%94%
61%89%
84%
91%
89%
91%
84%–
92%87%
–
86%
100%94%
55%87%
81%
90%
87%
44%
26%–
22%35%
–
37%
43%41%
3%35%
18%
41%
35%
207
2231
3977
5
307
17
373
57427
3101
329
430
89%
87%–
92%88%
–
88%
–71%92%
61%–
–84%
89%
88%
88%
85%–
90%84%
–
87%
–71%91%
56%–
–82%
88%
87%
39%
28%–
15%22%
–
38%
–43%38%
2%–
–26%
36%
33%
The – symbol indicates that data for a group of students have been suppressed. If a group has fewer than five students,data for that group and the next smallest group(s) are suppressed to protect the privacy of individual students.

March 25, 2013 Page 22
2 Student Performance
100%
Results by Student Group
Percentage scoring at level(s): Percentage scoring at level(s):
2–4 3–4 4 2–4 3–4 4
All Students
Female
Male
American Indian or Alaska Native
Black or African American
Hispanic or Latino
Asian or Native Hawaiian/Other Pacific Islander
White
Multiracial
Small Group Totals
General-Education Students
Students with Disabilities
English Proficient
Limited English Proficient
Economically Disadvantaged
Not Disadvantaged
Migrant
Not Migrant
NOTES
District VALLEY CENTRAL SCHOOL DISTRICT (MONTGOMERY) District ID 44-13-01-06-0000
Total Cohort Results in Secondary-Level Mathematics afterFour Years of Instruction
This District
Percentage scoring at level(s):
2-4 3-4 4
NY State Public
Percentage scoring at level(s):
2-4 3-4 4
91% 91% 88% 89%
22% 26%
87% 86% 82% 81%
22% 25%2008 Cohort
2007 Cohort
2008 Cohort 2007 Cohort
Numberof Students
Numberof Students
400 91% 88% 22% 430 91% 89% 26%187
2131
4952
6
292
7333
67400
104
296
400
94%
88%–
90%88%
–
91%
100%96%
63%91%
88%
92%
91%
91%
85%–
88%87%
–
87%
100%95%
49%88%
81%
90%
88%
25%
19%–
10%13%
–
25%
43%26%
1%22%
7%
27%
22%
207
2231
3977
5
307
17
373
57427
3101
329
430
93%
88%–
92%91%
–
91%
–71%95%
63%–
–91%
91%
91%
91%
87%–
90%90%
–
90%
–71%94%
56%–
–89%
89%
89%
30%
22%–
21%16%
–
30%
–29%30%
2%–
–15%
30%
26%
The – symbol indicates that data for a group of students have been suppressed. If a group has fewer than five students,data for that group and the next smallest group(s) are suppressed to protect the privacy of individual students.

March 25, 2013 Page 23
2 Student Performance
2008 Total Cohort Results in Secondary-Level Global History and Geography, U.S. History and Government, and Science after Four Years of Instruction
All Students General-Education Students Students with Disabilities
Coh
ort
Enr
ollm
ent
Percentage of students scoring: C
ohor
t E
nrol
lmen
t
Percentage of students scoring: C
ohor
t E
nrol
lmen
t
Percentage of students scoring:
55-64 65-84 85-100 55-64 65-84 85-100 55-64 65-84 85-100
Global History and Geography
U.S. History and Government
Science
New York State Alternate Assessments (NYSAA) 2011-12
All Students Total
Tested Number of students scoring at Level:
Secondary Level 1 2 3 4
English Language Arts
Mathematics
Social Studies
Science
NOTES The — symbol indicates that data for a group of students have been suppressed. If a group has fewer than five students, data for that group and the next smallest group(s) are
suppressed to protect the privacy of individual students.
District VALLEY CENTRAL SCHOOL DISTRICT (MONTGOMERY) District ID 44-13-01-06-0000
400
400
400
5%
4%
4%
46%
35%
47%
35%
47%
40%
333
333
333
1%
1%
1%
50%
37%
48%
42%
55%
47%
67
67
67
22%
19%
19%
25%
24%
37%
1%
6%
6%
11
11
11
11
0
0
0
0
0
0
0
0
0
3
1
3
11
8
10
8

March 25, 2013 Page 24
2 Student Performance
Regents Exams All Students General-Education Students Students with Disabilities
Total Tested
Percentage of students scoring at or above:
Total Tested
Percentage of students scoring at or above:
Total Tested
Percentage of students scoring at or above:
55 65 85 55 65 85 55 65 85
Comprehensive English
Integrated Algebra
Geometry
Algebra 2/Trigonometry
Global History and Geography
U.S. History and Government
Living Environment
Physical Setting/Earth Science
Physical Setting/Chemistry
Physical Setting/Physics
NOTE The — symbol indicates that data for a group of students have been suppressed. If a group has fewer than five students, data for that group and the next smallest group(s) are suppressed to protect the privacy of individual students.
District VALLEY CENTRAL SCHOOL DISTRICT (MONTGOMERY) District ID 44-13-01-06-0000
2011–12
2010–11
2009–102011–12
2010–11
2009–102011–12
2010–11
2009–102011–12
2010–11
2009–10
2011–12
2010–11
2009–10
2011–12
2010–11
2009–102011–12
2010–11
2009–10
2011–12
2010–11
2009–102011–12
2010–11
2009–102011–12
2010–11
2009–10
429
448
399374
416
420221
205
227169
188
160
468
457
424
409
357
384431
434
455
373
399
370212
229
247121
104
152
97%
99%
97%95%
95%
95%99%
99%
100%92%
91%
90%
88%
87%
87%
92%
95%
98%95%
96%
94%
90%
90%
89%94%
96%
95%98%
89%
94%
94%
95%
92%87%
89%
90%95%
97%
96%78%
79%
78%
77%
75%
77%
87%
88%
95%91%
89%
84%
79%
76%
79%75%
83%
74%88%
78%
88%
29%
47%
37%20%
24%
23%37%
41%
35%28%
26%
24%
29%
30%
34%
45%
52%
62%44%
43%
34%
43%
34%
34%19%
23%
10%47%
33%
43%
371
407
355312
359
363215
204
222168
187
159
386
397
349
362
314
342378
377
379
329
343
325211
227
245120
104
150
99%
100%
99%100%
99%
99%99%
–
100%–
–
–
94%
92%
95%
97%
98%
99%97%
99%
98%
94%
94%
93%–
–
––
89%
–
96%
98%
96%95%
95%
96%95%
–
96%–
–
–
85%
82%
87%
93%
94%
98%93%
93%
92%
84%
83%
84%–
–
––
78%
–
33%
51%
41%22%
27%
27%37%
–
35%–
–
–
34%
34%
41%
49%
58%
66%47%
48%
40%
48%
38%
38%–
–
––
33%
–
58
41
4462
57
576
1
51
1
1
82
60
75
47
43
4253
57
76
44
56
451
2
21
0
2
86%
88%
84%73%
68%
68%100%
–
100%–
–
–
60%
52%
49%
60%
77%
88%85%
81%
75%
61%
64%
56%–
–
––
–
76%
71%
59%47%
53%
49%100%
–
100%–
–
–
38%
28%
29%
38%
47%
74%74%
61%
46%
43%
36%
42%–
–
––
–
3%
2%
5%5%
4%
0%33%
–
40%–
–
–
5%
7%
4%
9%
9%
24%19%
14%
4%
9%
4%
7%–
–
––
–

March 25, 2013 Page 25
2 Student Performance
Regents Competency Tests All Students General-Education Students Students with Disabilities
Total Tested Percent Passing:
Total Tested Percent Passing:
Total Tested Percent Passing:
Mathematics
Science
Reading
Writing
Global Studies
U.S. History and Government
NOTE The — symbol indicates that data for a group of students have been suppressed. If a group has fewer than five students, data for that group and the next smallest group(s) are suppressed to protect the privacy of individual students.
District VALLEY CENTRAL SCHOOL DISTRICT (MONTGOMERY) District ID 44-13-01-06-0000
2011–12
2010–11
2009–102011–12
2010–11
2009–102011–12
2010–11
2009–102011–12
2010–11
2009–102011–12
2010–11
2009–102011–12
2010–11
2009–10
14
11
135
7
129
7
117
6
1237
37
4718
13
15
57%
55%
62%60%
57%
75%67%
29%
82%71%
67%
75%24%
16%
47%44%
54%
40%
0
1
10
0
00
0
00
0
00
3
00
1
0
–
–
–
–
14
10
125
7
129
7
117
6
1237
34
4718
12
15
57%
–
–60%
57%
75%67%
29%
82%71%
67%
75%24%
–
47%44%
–
40%
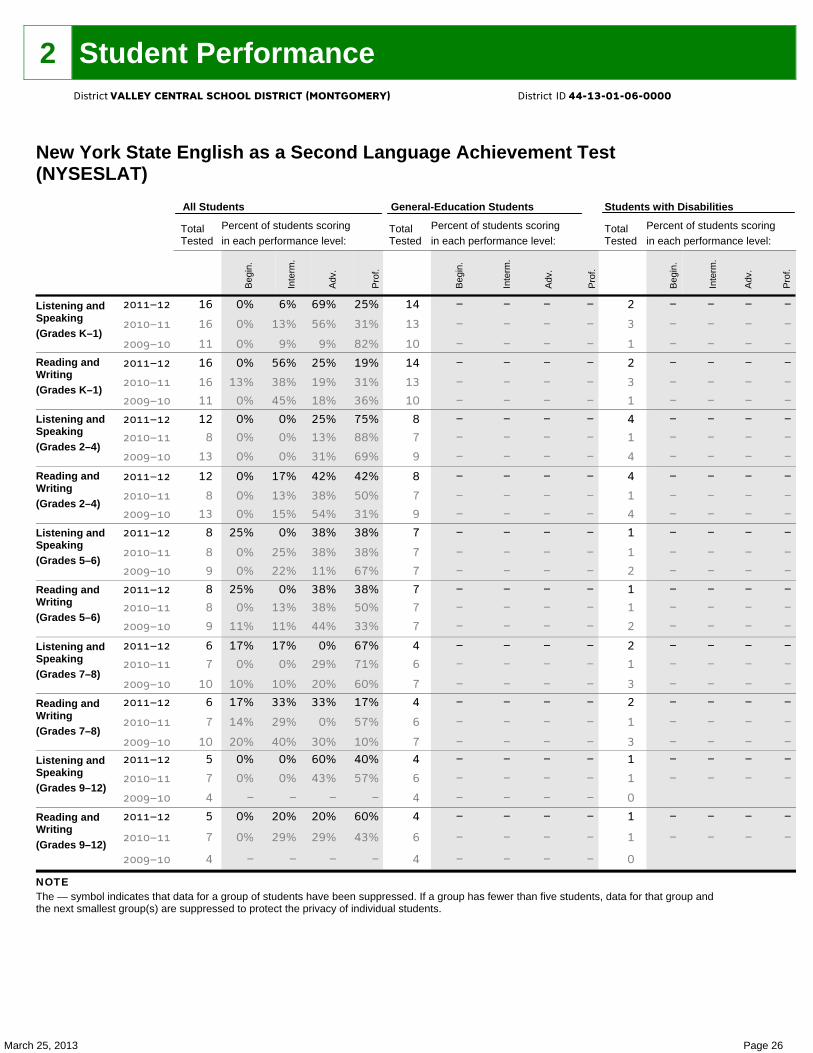
March 25, 2013 Page 26
2 Student Performance
New York State English as a Second Language Achievement Test (NYSESLAT)
All Students General-Education Students Students with Disabilities
Total Tested
Percent of students scoring in each performance level:
Total Tested
Percent of students scoring in each performance level:
Total Tested
Percent of students scoring in each performance level:
Beg
in.
Inte
rm.
Adv.
Prof
.
Beg
in.
Inte
rm.
Adv.
Pr
of.
Beg
in.
Inte
rm.
Adv.
Prof
.
Listening and Speaking (Grades K–1)
Reading and Writing (Grades K–1)
Listening and Speaking (Grades 2–4)
Reading and Writing (Grades 2–4)
Listening and Speaking (Grades 5–6)
Reading and Writing (Grades 5–6)
Listening and Speaking (Grades 7–8)
Reading and Writing (Grades 7–8)
Listening and Speaking (Grades 9–12)
Reading and Writing (Grades 9–12)
NOTE The — symbol indicates that data for a group of students have been suppressed. If a group has fewer than five students, data for that group and the next smallest group(s) are suppressed to protect the privacy of individual students.
District VALLEY CENTRAL SCHOOL DISTRICT (MONTGOMERY) District ID 44-13-01-06-0000
2011–12
2010–11
2009–10
2011–12
2010–11
2009–10
2011–12
2010–11
2009–10
2011–12
2010–11
2009–10
2011–12
2010–11
2009–10
2011–12
2010–11
2009–10
2011–12
2010–11
2009–10
2011–12
2010–11
2009–102011–12
2010–11
2009–10
2011–12
2010–11
2009–10
16
16
11
16
16
11
12
8
13
12
8
13
8
8
9
8
8
9
6
7
10
6
7
105
7
4
5
7
4
0%
0%
0%
0%
13%
0%
0%
0%
0%
0%
0%
0%
25%
0%
0%
25%
0%
11%
17%
0%
10%
17%
14%
20%0%
0%
–
0%
0%
–
6%
13%
9%
56%
38%
45%
0%
0%
0%
17%
13%
15%
0%
25%
22%
0%
13%
11%
17%
0%
10%
33%
29%
40%0%
0%
–
20%
29%
–
69%
56%
9%
25%
19%
18%
25%
13%
31%
42%
38%
54%
38%
38%
11%
38%
38%
44%
0%
29%
20%
33%
0%
30%60%
43%
–
20%
29%
–
25%
31%
82%
19%
31%
36%
75%
88%
69%
42%
50%
31%
38%
38%
67%
38%
50%
33%
67%
71%
60%
17%
57%
10%40%
57%
–
60%
43%
–
14
13
10
14
13
10
8
7
9
8
7
9
7
7
7
7
7
7
4
6
7
4
6
74
6
4
4
6
4
–
–
–
–
–
–
–
–
–
–
–
–
–
–
–
–
–
–
–
–
–
–
–
––
–
–
–
–
–
–
–
–
–
–
–
–
–
–
–
–
–
–
–
–
–
–
–
–
–
–
–
–
––
–
–
–
–
–
–
–
–
–
–
–
–
–
–
–
–
–
–
–
–
–
–
–
–
–
–
–
–
––
–
–
–
–
–
–
–
–
–
–
–
–
–
–
–
–
–
–
–
–
–
–
–
–
–
–
–
–
––
–
–
–
–
–
2
3
1
2
3
1
4
1
4
4
1
4
1
1
2
1
1
2
2
1
3
2
1
31
1
0
1
1
0
–
–
–
–
–
–
–
–
–
–
–
–
–
–
–
–
–
–
–
–
–
–
–
––
–
–
–
–
–
–
–
–
–
–
–
–
–
–
–
–
–
–
–
–
–
–
–
–
–
–
––
–
–
–
–
–
–
–
–
–
–
–
–
–
–
–
–
–
–
–
–
–
–
–
–
–
–
––
–
–
–
–
–
–
–
–
–
–
–
–
–
–
–
–
–
–
–
–
–
–
–
–
–
–
––
–
–
–

March 25, 2013 Page 27
3 Student Outcomes
High School Completers All Students General-Education Students Students with Disabilities Number of
Students Percentage of Graduates
Number of Students
Percentage of Graduates
Number of Students
Percentage of Graduates
Total Graduates
Receiving a Regents Diploma
Receiving a Regents Diploma with Advanced Designation
Receiving an Individualized Education Program (IEP) Diploma
NOTE Students receiving Regents diplomas and Regents diplomas with advanced designation are considered graduates; recipients of IEP diplomas are not.
High School Non-completers All Students General-Education Students Students with Disabilities Number of
Students Percentage of Students
Number of Students
Percentage of Students
Number of Students
Percentage of Students
Dropped Out
Entered Approved High School Equivalency Preparation Program
Total Non-completers
Post-secondary Plans of 2011–12 Completers All Students General-Education Students Students with Disabilities Number of
Students Percentage of Students
Number of Students
Percentage of Students
Number of Students
Percentage of Students
To 4-year College
To 2-year College
To Other Post-secondary
To the Military
To Employment
To Adult Services
To Other Known Plans
Plan Unknown
District VALLEY CENTRAL SCHOOL DISTRICT (MONTGOMERY) District ID 44-13-01-06-0000
2011–122010–112009–102011–122010–112009–102011–122010–112009–102011–122010–112009–10
356356372324328331110126127
745
91%92%89%31%35%34%N/AN/AN/A
317324335311309320109125127
000
98%95%96%34%39%38%
393237131911110745
33%59%30%3%3%0%
N/AN/AN/A
2011–122010–112009–102011–122010–112009–102011–122010–112009–10
32414402
13324357
2%2%2%0%0%1%2%2%3%
282932009
282941
2%2%2%0%0%1%2%2%2%
412120244
1416
2%4%4%0%1%1%2%5%5%
154
144
8
8
45
1
3
0
42%
40%
2%
2%
12%
0%
1%
0%
150
126
4
7
30
0
0
0
47%
40%
1%
2%
9%
0%
0%
0%
4
18
4
1
15
1
3
0
9%
39%
9%
2%
33%
2%
7%
0%
Valley Central School District
2011-2012 Accountability Report
April 25, 2013 1
The New York StateAccountability Report2011-12
DISTRICT: VALLEY CENTRAL SCHOOLDISTRICT (MONTGOMERY)
DISTRICT ID: 441301060000SUPERINTENDENT: RICHARD HOOLEYPHONE: 845-457-2400
Data in this report are those reported by districts in the Student Information Repository System as of August 24, 2012.
On May 29, 2012, the United States Department of Education (USDE)approved New York's Elementary and Secondary Education Act (ESEA) waiver.This waiver provides New York with increased flexibility to help close theachievement gap and assist students in becoming college and career ready.New York's waiver introduced a system of identifying districts and/or schoolsas Reward, Focus, or Priority, based on performance in English languagearts (ELA), mathematics, and science at the elementary/middle level and inELA, mathematics, and graduation rate at the secondary level. Moreinformation on the waiver is available athttp://www.p12.nysed.gov/esea-waiver/.
Data in The New York State Accountability Report are those used to determinePerformance Indices (PIs) and make Adequate Yearly Progress (AYP)determinations which, in turn, are used to assist in identifying districts andschools as Reward, Focus, and Priority. Explanations of how the data are usedto make the determinations are available athttp://www.p12.nysed.gov/accountability/ESEAMaterials.html.
More Information:Office of AccountabilityNew York State Education Department55 Hanson PlaceBrooklyn, NY 11217Email: [email protected]
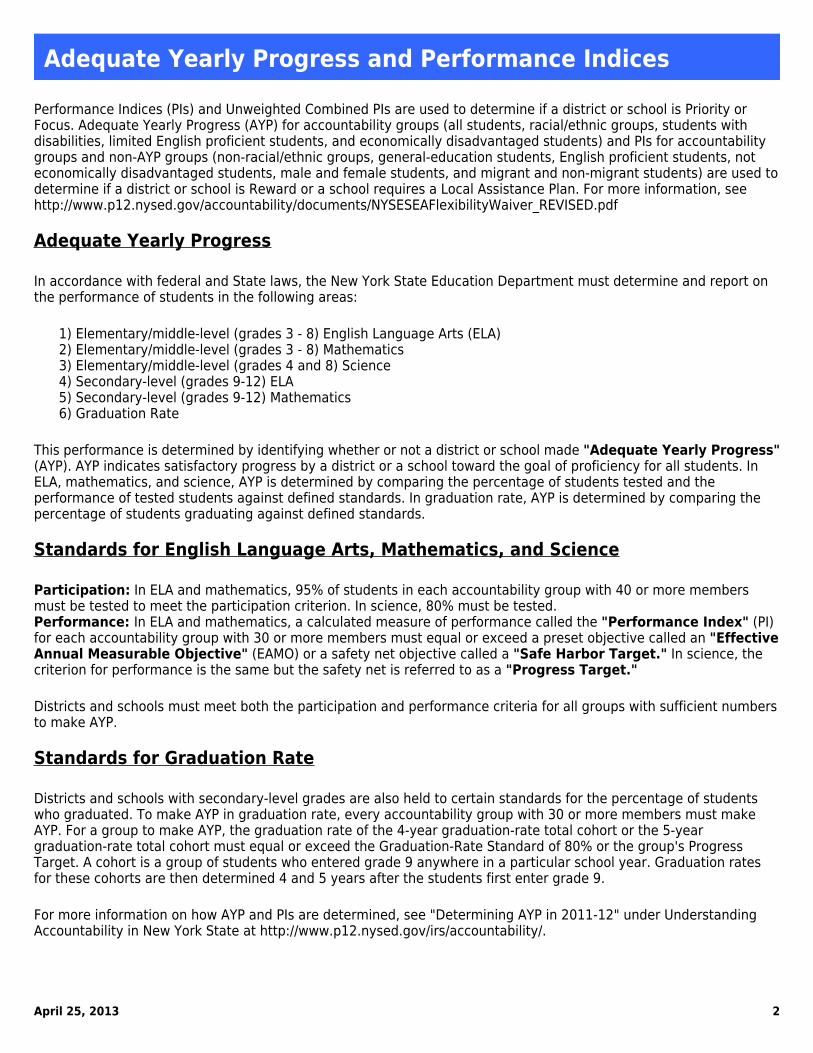
April 25, 2013 2
Adequate Yearly Progress and Performance IndicesPerformance Indices (PIs) and Unweighted Combined PIs are used to determine if a district or school is Priority orFocus. Adequate Yearly Progress (AYP) for accountability groups (all students, racial/ethnic groups, students withdisabilities, limited English proficient students, and economically disadvantaged students) and PIs for accountabilitygroups and non-AYP groups (non-racial/ethnic groups, general-education students, English proficient students, noteconomically disadvantaged students, male and female students, and migrant and non-migrant students) are used todetermine if a district or school is Reward or a school requires a Local Assistance Plan. For more information, seehttp://www.p12.nysed.gov/accountability/documents/NYSESEAFlexibilityWaiver_REVISED.pdf
Adequate Yearly Progress
In accordance with federal and State laws, the New York State Education Department must determine and report onthe performance of students in the following areas:
1) Elementary/middle-level (grades 3 - 8) English Language Arts (ELA)2) Elementary/middle-level (grades 3 - 8) Mathematics3) Elementary/middle-level (grades 4 and 8) Science4) Secondary-level (grades 9-12) ELA5) Secondary-level (grades 9-12) Mathematics6) Graduation Rate
This performance is determined by identifying whether or not a district or school made "Adequate Yearly Progress"(AYP). AYP indicates satisfactory progress by a district or a school toward the goal of proficiency for all students. InELA, mathematics, and science, AYP is determined by comparing the percentage of students tested and theperformance of tested students against defined standards. In graduation rate, AYP is determined by comparing thepercentage of students graduating against defined standards.
Standards for English Language Arts, Mathematics, and Science
Participation: In ELA and mathematics, 95% of students in each accountability group with 40 or more membersmust be tested to meet the participation criterion. In science, 80% must be tested.Performance: In ELA and mathematics, a calculated measure of performance called the "Performance Index" (PI)for each accountability group with 30 or more members must equal or exceed a preset objective called an "EffectiveAnnual Measurable Objective" (EAMO) or a safety net objective called a "Safe Harbor Target." In science, thecriterion for performance is the same but the safety net is referred to as a "Progress Target."
Districts and schools must meet both the participation and performance criteria for all groups with sufficient numbersto make AYP.
Standards for Graduation Rate
Districts and schools with secondary-level grades are also held to certain standards for the percentage of studentswho graduated. To make AYP in graduation rate, every accountability group with 30 or more members must makeAYP. For a group to make AYP, the graduation rate of the 4-year graduation-rate total cohort or the 5-yeargraduation-rate total cohort must equal or exceed the Graduation-Rate Standard of 80% or the group's ProgressTarget. A cohort is a group of students who entered grade 9 anywhere in a particular school year. Graduation ratesfor these cohorts are then determined 4 and 5 years after the students first enter grade 9.
For more information on how AYP and PIs are determined, see "Determining AYP in 2011-12" under UnderstandingAccountability in New York State at http://www.p12.nysed.gov/irs/accountability/.

April 25, 2013 3
Elementary/Middle-Level ELA: AYPDISTRICT: VALLEY CENTRAL SCHOOL DISTRICT (MONTGOMERY) DISTRICT ID: 441301060000
Adequate Yearly Progress: In elementary/middle-level (grades 3 - 8) English language arts (ELA), districts and schools must meetboth the participation and performance criteria to make Adequate Yearly Progress (AYP).
Participation: To meet the participation criterion, at least 95% of students in each accountability group with 40 or more members mustbe tested on an appropriate ELA assessment.
Performance: To meet the performance criterion, the Performance Index (PI) of students in each accountability group with 30 or moremembers must be equal to or greater than the Effective Annual Measurable Objective (EAMO) or the Safe Harbor Target.
All accountability groups met the participation and performance criteria (made AYP): YES
Student Group Made AYPAll Students ✔American Indian or Alaska Native ―Black or African American ✔Hispanic or Latino ✔Asian or Native Hawaiian/Other Pacific Islander ✔White ✔Multiracial ―Students With Disabilities ✔Limited English Proficient ―Economically Disadvantaged ✔
✔ Made AYP✘ Did not make AYP― There were not enough students to make an AYPdetermination

April 25, 2013 4
Elementary/Middle-Level ELA: ParticipationDISTRICT: VALLEY CENTRAL SCHOOL DISTRICT (MONTGOMERY) DISTRICT ID: 441301060000
All accountability groups with 40 or more members tested at least 95% of students enrolled during thetest administration period: YESElementary/Middle-Level (Grades 3 - 8) English Language Arts (ELA) Participation Results
Student Group Tested95%
Students Enrolled Duringthe Test Administration
Period
Enrolled Studentswith Valid Test
Scores
Percent of EnrolledStudents with Valid
Test ScoresAll Students ✔ 2198 2196 100%American Indian or Alaska Native ― 12 ― ―Black or African American ✔ 236 236 100%Hispanic or Latino ✔ 393 393 100%Asian or Native Hawaiian/Other PacificIslander ― 35 ― ―
White ✔ 1515 1513 100%Multiracial ― 7 ― ―Students With Disabilities ✔ 417 417 100%Limited English Proficient ― 20 ― ―Economically Disadvantaged ✔ 804 803 100%
✔ At least 95% of students enrolled during the test administration period were tested.✘ Less than 95% of students enrolled during the test administration period were tested.― There were fewer than 40 students enrolled during the test administration period.
Medically Excused:Students who were excused from testing for medical reasons in accordance with federal No Child Left Behind guidance are notincluded in these calculations.
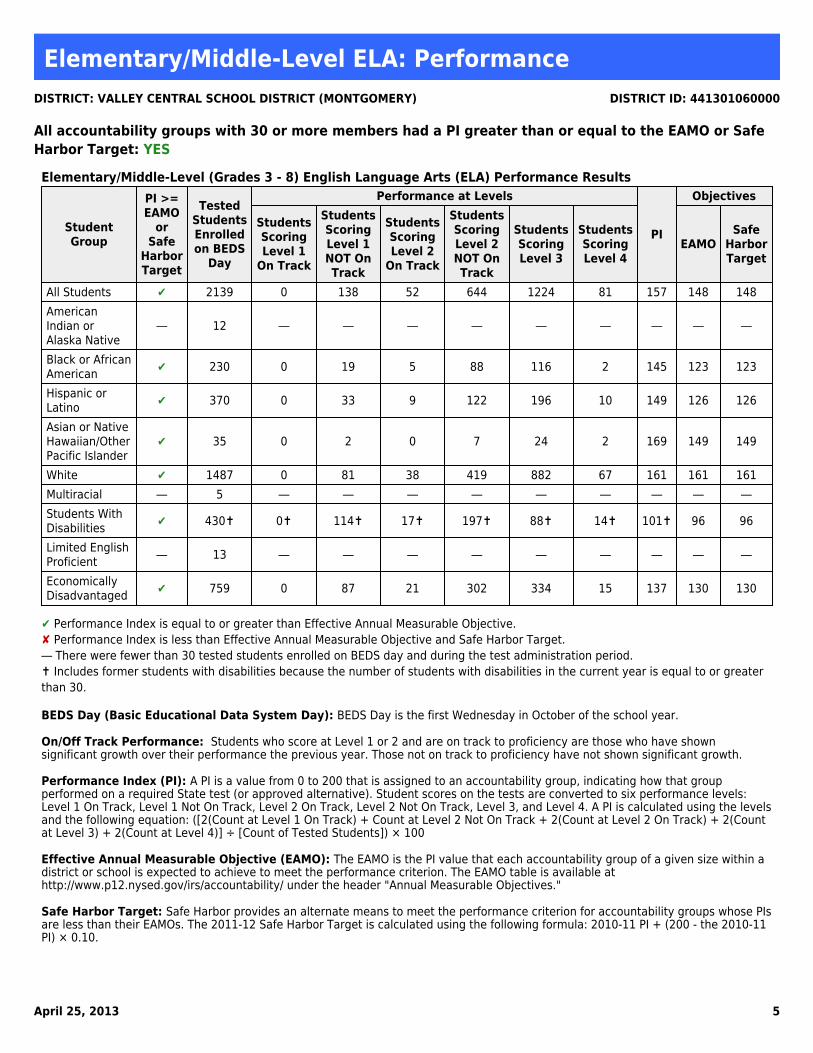
April 25, 2013 5
Elementary/Middle-Level ELA: PerformanceDISTRICT: VALLEY CENTRAL SCHOOL DISTRICT (MONTGOMERY) DISTRICT ID: 441301060000
All accountability groups with 30 or more members had a PI greater than or equal to the EAMO or SafeHarbor Target: YESElementary/Middle-Level (Grades 3 - 8) English Language Arts (ELA) Performance Results
StudentGroup
PI >=EAMO
orSafe
HarborTarget
TestedStudentsEnrolledon BEDS
Day
Performance at Levels
PI
Objectives
StudentsScoringLevel 1
On Track
StudentsScoringLevel 1NOT OnTrack
StudentsScoringLevel 2
On Track
StudentsScoringLevel 2NOT OnTrack
StudentsScoringLevel 3
StudentsScoringLevel 4
EAMOSafe
HarborTarget
All Students ✔ 2139 0 138 52 644 1224 81 157 148 148AmericanIndian orAlaska Native
― 12 ― ― ― ― ― ― ― ― ―
Black or AfricanAmerican ✔ 230 0 19 5 88 116 2 145 123 123
Hispanic orLatino ✔ 370 0 33 9 122 196 10 149 126 126
Asian or NativeHawaiian/OtherPacific Islander
✔ 35 0 2 0 7 24 2 169 149 149
White ✔ 1487 0 81 38 419 882 67 161 161 161Multiracial ― 5 ― ― ― ― ― ― ― ― ―Students WithDisabilities ✔ 430✝ 0✝ 114✝ 17✝ 197✝ 88✝ 14✝ 101✝ 96 96
Limited EnglishProficient ― 13 ― ― ― ― ― ― ― ― ―
EconomicallyDisadvantaged ✔ 759 0 87 21 302 334 15 137 130 130
✔ Performance Index is equal to or greater than Effective Annual Measurable Objective.✘ Performance Index is less than Effective Annual Measurable Objective and Safe Harbor Target.― There were fewer than 30 tested students enrolled on BEDS day and during the test administration period.✝ Includes former students with disabilities because the number of students with disabilities in the current year is equal to or greaterthan 30.
BEDS Day (Basic Educational Data System Day): BEDS Day is the first Wednesday in October of the school year.
On/Off Track Performance: Students who score at Level 1 or 2 and are on track to proficiency are those who have shownsignificant growth over their performance the previous year. Those not on track to proficiency have not shown significant growth.
Performance Index (PI): A PI is a value from 0 to 200 that is assigned to an accountability group, indicating how that groupperformed on a required State test (or approved alternative). Student scores on the tests are converted to six performance levels:Level 1 On Track, Level 1 Not On Track, Level 2 On Track, Level 2 Not On Track, Level 3, and Level 4. A PI is calculated using the levelsand the following equation: ([2(Count at Level 1 On Track) + Count at Level 2 Not On Track + 2(Count at Level 2 On Track) + 2(Countat Level 3) + 2(Count at Level 4)] ÷ [Count of Tested Students]) × 100
Effective Annual Measurable Objective (EAMO): The EAMO is the PI value that each accountability group of a given size within adistrict or school is expected to achieve to meet the performance criterion. The EAMO table is available athttp://www.p12.nysed.gov/irs/accountability/ under the header "Annual Measurable Objectives."
Safe Harbor Target: Safe Harbor provides an alternate means to meet the performance criterion for accountability groups whose PIsare less than their EAMOs. The 2011-12 Safe Harbor Target is calculated using the following formula: 2010-11 PI + (200 - the 2010-11PI) × 0.10.
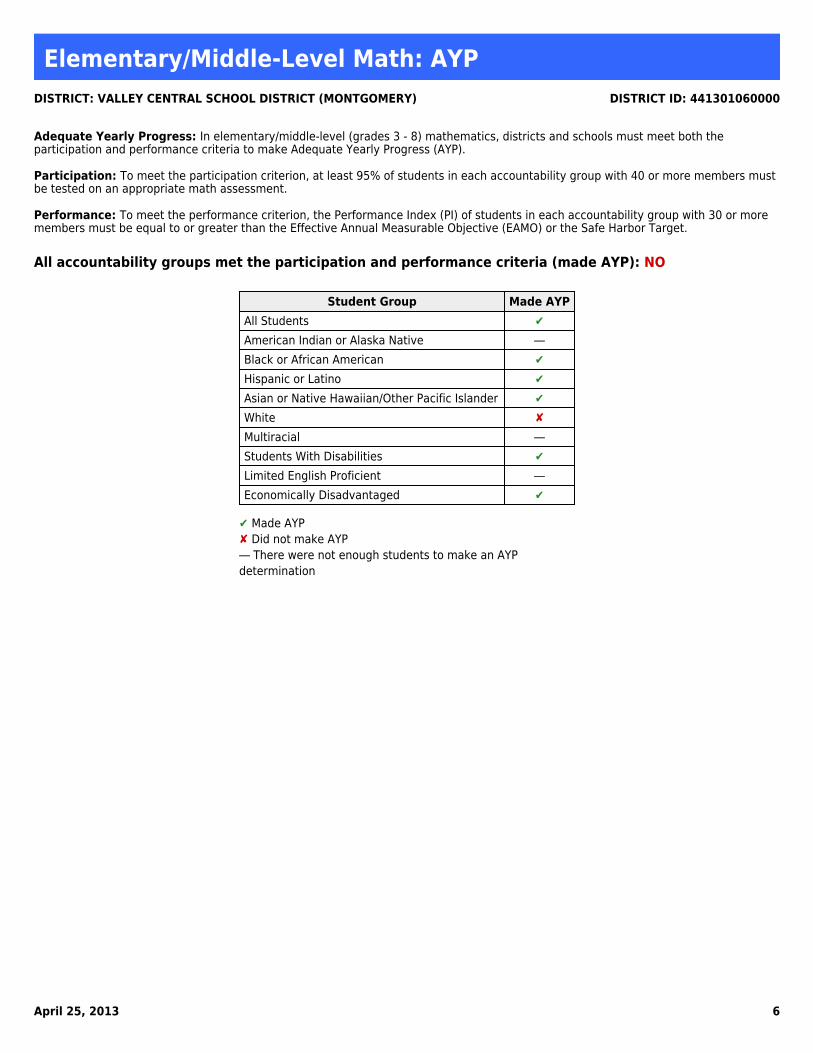
April 25, 2013 6
Elementary/Middle-Level Math: AYPDISTRICT: VALLEY CENTRAL SCHOOL DISTRICT (MONTGOMERY) DISTRICT ID: 441301060000
Adequate Yearly Progress: In elementary/middle-level (grades 3 - 8) mathematics, districts and schools must meet both theparticipation and performance criteria to make Adequate Yearly Progress (AYP).
Participation: To meet the participation criterion, at least 95% of students in each accountability group with 40 or more members mustbe tested on an appropriate math assessment.
Performance: To meet the performance criterion, the Performance Index (PI) of students in each accountability group with 30 or moremembers must be equal to or greater than the Effective Annual Measurable Objective (EAMO) or the Safe Harbor Target.
All accountability groups met the participation and performance criteria (made AYP): NO
Student Group Made AYPAll Students ✔American Indian or Alaska Native ―Black or African American ✔Hispanic or Latino ✔Asian or Native Hawaiian/Other Pacific Islander ✔White ✘Multiracial ―Students With Disabilities ✔Limited English Proficient ―Economically Disadvantaged ✔
✔ Made AYP✘ Did not make AYP― There were not enough students to make an AYPdetermination

April 25, 2013 7
Elementary/Middle-Level Math: ParticipationDISTRICT: VALLEY CENTRAL SCHOOL DISTRICT (MONTGOMERY) DISTRICT ID: 441301060000
All accountability groups with 40 or more members tested at least 95% of students enrolled during thetest administration period: YESElementary/Middle-Level (Grades 3 - 8) Math Participation Results
Student Group Tested95%
Students Enrolled Duringthe Test Administration
Period
Enrolled Studentswith Valid Test
Scores
Percent of EnrolledStudents with Valid
Test ScoresAll Students ✔ 2198 2191 100%American Indian or Alaska Native ― 12 ― ―Black or African American ✔ 235 235 100%Hispanic or Latino ✔ 393 393 100%Asian or Native Hawaiian/Other PacificIslander ― 35 ― ―
White ✔ 1516 1509 100%Multiracial ― 7 ― ―Students With Disabilities ✔ 418 413 99%Limited English Proficient ― 20 ― ―Economically Disadvantaged ✔ 804 798 99%
✔ At least 95% of students enrolled during the test administration period were tested.✘ Less than 95% of students enrolled during the test administration period were tested.― There were fewer than 40 students enrolled during the test administration period.
Medically Excused:Students who were excused from testing for medical reasons in accordance with federal No Child Left Behind guidance are notincluded in these calculations.

April 25, 2013 8
Elementary/Middle-Level Math: PerformanceDISTRICT: VALLEY CENTRAL SCHOOL DISTRICT (MONTGOMERY) DISTRICT ID: 441301060000
All accountability groups with 30 or more members had a PI greater than or equal to the EAMO or SafeHarbor Target: NOElementary/Middle-Level (Grades 3 - 8) Math Performance Results
StudentGroup
PI >=EAMO
orSafe
HarborTarget
TestedStudentsEnrolledon BEDS
Day
Performance at Levels
PI
Objectives
StudentsScoringLevel 1
On Track
StudentsScoringLevel 1NOT OnTrack
StudentsScoringLevel 2
On Track
StudentsScoringLevel 2NOT OnTrack
StudentsScoringLevel 3
StudentsScoringLevel 4
EAMOSafe
HarborTarget
All Students ✔ 2135 0 90 29 577 972 467 165 162 162AmericanIndian orAlaska Native
― 12 ― ― ― ― ― ― ― ― ―
Black or AfricanAmerican ✔ 230 0 14 6 87 93 30 150 135 135
Hispanic orLatino ✔ 370 0 13 8 126 163 60 159 144 144
Asian or NativeHawaiian/OtherPacific Islander
✔ 35 0 1 1 7 11 15 174 169 169
White ✘ 1483 0 60 14 350 700 359 168 171 171Multiracial ― 5 ― ― ― ― ― ― ― ― ―Students WithDisabilities ✔ 426✝ 0✝ 71✝ 17✝ 186✝ 118✝ 34✝ 123✝ 117 117
Limited EnglishProficient ― 13 ― ― ― ― ― ― ― ― ―
EconomicallyDisadvantaged ✔ 755 0 55 13 267 320 100 150 147 147
✔ Performance Index is equal to or greater than Effective Annual Measurable Objective.✘ Performance Index is less than Effective Annual Measurable Objective and Safe Harbor Target.― There were fewer than 30 tested students enrolled on BEDS day and during the test administration period.✝ Includes former students with disabilities because the number of students with disabilities in the current year is equal to or greaterthan 30.
BEDS Day (Basic Educational Data System Day): BEDS Day is the first Wednesday in October of the school year.
On/Off Track Performance: Students who score at Level 1 or 2 and are on track to proficiency are those who have shownsignificant growth over their performance the previous year. Those not on track to proficiency have not shown significant growth.
Performance Index (PI): A PI is a value from 0 to 200 that is assigned to an accountability group, indicating how that groupperformed on a required State test (or approved alternative). Student scores on the tests are converted to six performance levels:Level 1 On Track, Level 1 Not On Track, Level 2 On Track, Level 2 Not On Track, Level 3, and Level 4. A PI is calculated using the levelsand the following equation: ([2(Count at Level 1 On Track) + Count at Level 2 Not On Track + 2(Count at Level 2 On Track) + 2(Countat Level 3) + 2(Count at Level 4)] ÷ [Count of Tested Students]) × 100
Effective Annual Measurable Objective (EAMO): The EAMO is the PI value that each accountability group of a given size within adistrict or school is expected to achieve to meet the performance criterion. The EAMO table is available athttp://www.p12.nysed.gov/irs/accountability/ under the header "Annual Measurable Objectives."
Safe Harbor Target: Safe Harbor provides an alternate means to meet the performance criterion for accountability groups whose PIsare less than their EAMOs. The 2011-12 Safe Harbor Target is calculated using the following formula: 2010-11 PI + (200 - the 2010-11PI) × 0.10.

April 25, 2013 9
Elementary/Middle-Level Science: AYPDISTRICT: VALLEY CENTRAL SCHOOL DISTRICT (MONTGOMERY) DISTRICT ID: 441301060000
Adequate Yearly Progress: In elementary/middle-level (grades 4 & 8) science, districts and schools must meet both the participationand performance criteria to make Adequate Yearly Progress (AYP).
Participation: To meet the participation criterion, at least 80% of students in each accountability group with 40 or more members mustbe tested on an appropriate science assessment.
Performance: To meet the performance criterion, the Performance Index (PI) of students in each accountability group with 30 or moremembers must be equal to or greater than the Effective Annual Measurable Objective (EAMO) or the Progress Target.
All accountability groups met the participation and performance criteria (made AYP): YES
Student Group Made AYPAll Students ✔American Indian or Alaska Native ―Black or African American ✔Hispanic or Latino ✔Asian or Native Hawaiian/Other Pacific Islander ―White ✔Multiracial ―Students With Disabilities ✔Limited English Proficient ―Economically Disadvantaged ✔
✔ Made AYP✘ Did not make AYP― There were not enough students to make an AYPdetermination
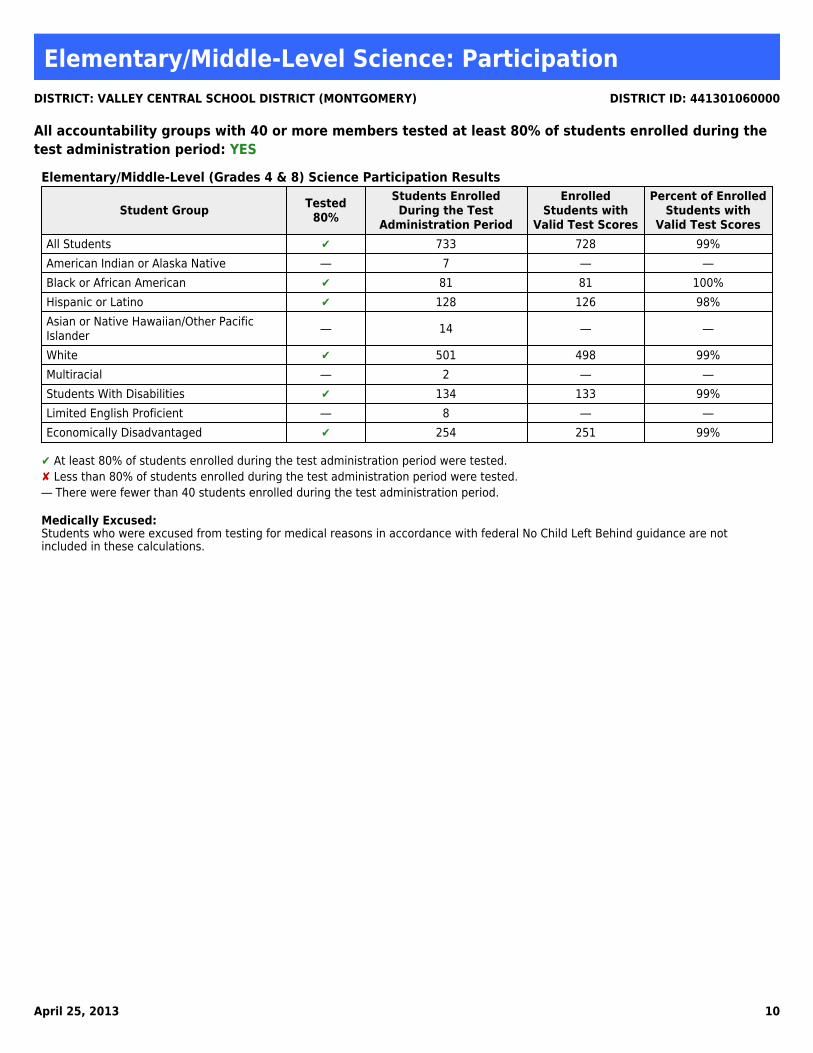
April 25, 2013 10
Elementary/Middle-Level Science: ParticipationDISTRICT: VALLEY CENTRAL SCHOOL DISTRICT (MONTGOMERY) DISTRICT ID: 441301060000
All accountability groups with 40 or more members tested at least 80% of students enrolled during thetest administration period: YESElementary/Middle-Level (Grades 4 & 8) Science Participation Results
Student Group Tested80%
Students EnrolledDuring the Test
Administration Period
EnrolledStudents with
Valid Test Scores
Percent of EnrolledStudents with
Valid Test ScoresAll Students ✔ 733 728 99%American Indian or Alaska Native ― 7 ― ―Black or African American ✔ 81 81 100%Hispanic or Latino ✔ 128 126 98%Asian or Native Hawaiian/Other PacificIslander ― 14 ― ―
White ✔ 501 498 99%Multiracial ― 2 ― ―Students With Disabilities ✔ 134 133 99%Limited English Proficient ― 8 ― ―Economically Disadvantaged ✔ 254 251 99%
✔ At least 80% of students enrolled during the test administration period were tested.✘ Less than 80% of students enrolled during the test administration period were tested.― There were fewer than 40 students enrolled during the test administration period.
Medically Excused:Students who were excused from testing for medical reasons in accordance with federal No Child Left Behind guidance are notincluded in these calculations.

April 25, 2013 11
Elementary/Middle-Level Science: PerformanceDISTRICT: VALLEY CENTRAL SCHOOL DISTRICT (MONTGOMERY) DISTRICT ID: 441301060000
All accountability groups with 30 or more members had a PI greater than or equal to the EAMO orProgress Target: YESElementary/Middle-Level (Grades 4 & 8) Science Performance Results
Student GroupPI >=
EAMO orProgressTarget
TestedStudentsEnrolledon BEDS
Day
Performance at Levels
PI
Objectives
StudentsScoringLevel 1
StudentsScoringLevel 2
StudentsScoringLevel 3
StudentsScoringLevel 4
EAMO ProgressTarget
All Students ✔ 709 9 53 246 401 190 175 175American Indian orAlaska Native ― 7 ― ― ― ― ― ― ―
Black or AfricanAmerican ✔ 79 1 13 30 35 181 150 150
Hispanic or Latino ✔ 120 3 11 48 58 186 156 156Asian or NativeHawaiian/OtherPacific Islander
― 14 ― ― ― ― ― ― ―
White ✔ 487 5 25 163 294 193 186 186Multiracial ― 2 ― ― ― ― ― ― ―Students WithDisabilities ✔ 138✝ 9✝ 27✝ 47✝ 55✝ 167✝ 145 145
Limited EnglishProficient ― 6 ― ― ― ― ― ― ―
EconomicallyDisadvantaged ✔ 238 5 30 98 105 183 161 161
✔ Performance Index is equal to or greater than Effective Annual Measurable Objective.✘ Performance Index is less than Effective Annual Measurable Objective and Progress Target.― There were fewer than 30 tested students enrolled on BEDS day and during the test administration period.✝ Includes former students with disabilities because the number of students with disabilities in the current year is equal to or greaterthan 30.
BEDS Day (Basic Educational Data System Day): BEDS Day is the first Wednesday in October of the school year.
On/Off Track Performance: Students who score at Level 1 or 2 and are on track to proficiency are those who have shownsignificant growth over their performance the previous year. Those not on track to proficiency have not shown significant growth.
Performance Index (PI): A PI is a value from 0 to 200 that is assigned to an accountability group, indicating how that groupperformed on a required State test (or approved alternative). Student scores on the tests are converted to four performance levels,from Level 1 to Level 4. A PI is calculated using the levels and the following equation: ([(Count at Level 2) + 2(Count at Level 3) +2(Count at Level 4)] ÷ [Count of Tested Students]) × 100
Effective Annual Measurable Objective (EAMO): The EAMO is the PI value that each accountability group of a given size within adistrict or school is expected to achieve to meet the performance criterion. The EAMO table is available athttp://www.p12.nysed.gov/irs/accountability/ under the header "Annual Measurable Objectives."
Progress Target: A Progress Target provides an alternate means to meet the performance criterion for accountability groups whosePIs are less than their EAMOs. The 2011-12 Progress Target is calculated by adding 1 point to the previous year's PI.

April 25, 2013 12
Secondary-Level ELA: AYPDISTRICT: VALLEY CENTRAL SCHOOL DISTRICT (MONTGOMERY) DISTRICT ID: 441301060000
Adequate Yearly Progress: In secondary-level English language arts (ELA), districts and schools must meet both the participation andperformance criteria to make Adequate Yearly Progress (AYP).
Participation: To meet the participation criterion, at least 95% of students in each accountability group with 40 or more members mustbe tested on an appropriate ELA assessment.
Performance: To meet the performance criterion, the Performance Index (PI) of students in each accountability group with 30 or moremembers must be equal to or greater than the Effective Annual Measurable Objective (EAMO) or the Safe Harbor Target.
All accountability groups met the participation and performance criteria (made AYP): NO
Student Group Made AYPAll Students ✔American Indian or Alaska Native ―Black or African American ✔Hispanic or Latino ✔Asian or Native Hawaiian/Other Pacific Islander ―White ✘Multiracial ―Students With Disabilities ✔Limited English Proficient ―Economically Disadvantaged ✔
✔ Made AYP✘ Did not make AYP― There were not enough students to make an AYPdetermination

April 25, 2013 13
Secondary-Level ELA: ParticipationDISTRICT: VALLEY CENTRAL SCHOOL DISTRICT (MONTGOMERY) DISTRICT ID: 441301060000
All accountability groups with 40 or more members tested at least 95% of 12th graders: YESSecondary-Level English Language Arts (ELA) Participation Results
Student Group Tested 95% 12th Graders 12th Graders withValid Test Scores
Percent of 12th Graderswith Valid Test Scores
All Students ✔ 347 347 100%American Indian or Alaska Native ― 1 ― ―Black or African American ✔ 43 43 100%Hispanic or Latino ✔ 44 44 100%Asian or Native Hawaiian/Other Pacific Islander ― 5 ― ―White ✔ 254 254 100%Multiracial ― 0 ― ―Students With Disabilities ― 38 ― ―Limited English Proficient ― 0 ― ―Economically Disadvantaged ✔ 84 84 100%
✔ At least 95% of 12th graders were tested.✘ Less than 95% of 12th graders were tested.― There were fewer than 40 12th graders in the group.

April 25, 2013 14
Secondary-Level ELA: PerformanceDISTRICT: VALLEY CENTRAL SCHOOL DISTRICT (MONTGOMERY) DISTRICT ID: 441301060000
All accountability groups with 30 or more members had a PI greater than or equal to the EAMO or SafeHarbor Target: NOSecondary-Level English Language Arts (ELA) Performance Results
StudentGroup
PI >=EAMO
orSafe
HarborTarget
2008Accountability
CohortMembers
Performance at Levels
PI
Objectives
StudentsScoring at
AccountabilityLevel 1
StudentsScoring at
AccountabilityLevel 2
StudentsScoring at
AccountabilityLevel 3
StudentsScoring at
AccountabilityLevel 4
EAMOSafe
HarborTarget
All Students ✔ 358 13 95 195 55 166 153 153AmericanIndian orAlaska Native
― 1 ― ― ― ― ― ― ―
Black orAfricanAmerican
✔ 42 0 15 23 4 164 119 119
Hispanic orLatino ✔ 44 2 11 26 5 166 122 122
Asian or NativeHawaiian/OtherPacific Islander
― 5 ― ― ― ― ― ― ―
White ✘ 266 11 68 142 45 166 167 167Multiracial ― 0 ― ― ― ― ― ― ―Students WithDisabilities ✔ 51✝ 8✝ 29✝ 13✝ 1✝ 112✝ 84 84
Limited EnglishProficient ― 0 ― ― ― ― ― ― ―
EconomicallyDisadvantaged ✔ 84 5 30 45 4 152 130 130
✔ Performance Index is equal to or greater than Effective Annual Measurable Objective.✘ Performance Index is less than Effective Annual Measurable Objective and Safe Harbor Target.― There were fewer than 30 tested students in the 2008 accountability cohort.✝ Includes former students with disabilities because the number of students with disabilities in the current year is equal to or greaterthan 30.
2008 Accountability Cohort: The 2008 Accountability Cohort consists of all students who first entered grade 9 anywhere betweenJuly 1, 2008 and June 30, 2009 or, in the case of ungraded students with disabilities, reached their seventeenth birthday during the2008-09 school year. Results for these students are captured as of June 30, 2012. A more detailed definition of this cohort is availablein "Secondary-Level Cohort Definitions" at http://www.p12.nysed.gov/irs/sirs/.
Performance Index (PI): A PI is a value from 0 to 200 that is assigned to an accountability group, indicating how that groupperformed on a required State test (or approved alternative). Student scores on the tests are converted to four performance levels,from Level 1 to Level 4. A PI is calculated using the levels and the following equation: ([(Count at Level 2) + 2(Count at Level 3) +2(Count at Level 4)] ÷ [Count of Cohort Members]) × 100
Effective Annual Measurable Objective (EAMO): The EAMO is the PI value that each accountability group of a given size within adistrict or school is expected to achieve to meet the performance criterion. The EAMO table is available athttp://www.p12.nysed.gov/irs/accountability/ under the header "Annual Measurable Objectives."
Safe Harbor Target: Safe Harbor provides an alternate means to meet the performance criterion for accountability groups whose PIsare less than their EAMOs. The 2011-12 Safe Harbor Target is calculated using the following formula: 2010-11 PI + (200 - the 2010-11PI) × 0.10

April 25, 2013 15
Secondary-Level Math: AYPDISTRICT: VALLEY CENTRAL SCHOOL DISTRICT (MONTGOMERY) DISTRICT ID: 441301060000
Adequate Yearly Progress: In secondary-level mathematics, districts and schools must meet both the participation and performancecriteria to make Adequate Yearly Progress (AYP).
Participation: To meet the participation criterion, at least 95% of students in each accountability group with 40 or more members mustbe tested on an appropriate math assessment.
Performance: To meet the performance criterion, the Performance Index (PI) of students in each accountability group with 30 or moremembers must be equal to or greater than the Effective Annual Measurable Objective (EAMO) or the Safe Harbor Target.
All accountability groups met the participation and performance criteria (made AYP): YES
Student Group Made AYPAll Students ✔American Indian or Alaska Native ―Black or African American ✔Hispanic or Latino ✔Asian or Native Hawaiian/Other Pacific Islander ―White ✔Multiracial ―Students With Disabilities ✔Limited English Proficient ―Economically Disadvantaged ✔
✔ Made AYP✘ Did not make AYP― There were not enough students to make an AYPdetermination

April 25, 2013 16
Secondary-Level Math: ParticipationDISTRICT: VALLEY CENTRAL SCHOOL DISTRICT (MONTGOMERY) DISTRICT ID: 441301060000
All accountability groups with 40 or more members tested at least 95% of 12th graders: YESSecondary-Level Math Participation Results
Student Group Tested 95% 12th Graders 12th Graders withValid Test Scores
Percent of 12th Graderswith Valid Test Scores
All Students ✔ 347 347 100%American Indian or Alaska Native ― 1 ― ―Black or African American ✔ 43 43 100%Hispanic or Latino ✔ 44 44 100%Asian or Native Hawaiian/Other Pacific Islander ― 5 ― ―White ✔ 254 254 100%Multiracial ― 0 ― ―Students With Disabilities ― 38 ― ―Limited English Proficient ― 0 ― ―Economically Disadvantaged ✔ 84 84 100%
✔ At least 95% of 12th graders were tested.✘ Less than 95% of 12th graders were tested.― There were fewer than 40 12th graders in the group.

April 25, 2013 17
Secondary-Level Math: PerformanceDISTRICT: VALLEY CENTRAL SCHOOL DISTRICT (MONTGOMERY) DISTRICT ID: 441301060000
All accountability groups with 30 or more members had a PI greater than or equal to the EAMO or SafeHarbor Target: YESSecondary-Level Math Performance Results
StudentGroup
PI >=EAMO
orSafe
HarborTarget
2008Accountability
CohortMembers
Performance at Levels
PI
Objectives
StudentsScoring at
AccountabilityLevel 1
StudentsScoring at
AccountabilityLevel 2
StudentsScoring at
AccountabilityLevel 3
StudentsScoring at
AccountabilityLevel 4
EAMOSafe
HarborTarget
All Students ✔ 358 15 168 126 49 145 130 130AmericanIndian orAlaska Native
― 1 ― ― ― ― ― ― ―
Black orAfricanAmerican
✔ 42 2 29 10 1 121 88 88
Hispanic orLatino ✔ 44 2 23 17 2 139 93 93
Asian or NativeHawaiian/OtherPacific Islander
― 5 ― ― ― ― ― ― ―
White ✔ 266 11 114 96 45 149 147 147Multiracial ― 0 ― ― ― ― ― ― ―Students WithDisabilities ✔ 51✝ 12✝ 33✝ 3✝ 3✝ 88✝ 69 69
Limited EnglishProficient ― 0 ― ― ― ― ― ― ―
EconomicallyDisadvantaged ✔ 84 5 52 24 3 126 104 104
✔ Performance Index is equal to or greater than Effective Annual Measurable Objective.✘ Performance Index is less than Effective Annual Measurable Objective and Safe Harbor Target.― There were fewer than 30 tested students in the 2008 accountability cohort.✝ Includes former students with disabilities because the number of students with disabilities in the current year is equal to or greaterthan 30.
2008 Accountability Cohort: The 2008 Accountability Cohort consists of all students who first entered grade 9 anywhere betweenJuly 1, 2008 and June 30, 2009 or, in the case of ungraded students with disabilities, reached their seventeenth birthday during the2008-09 school year. Results for these students are captured as of June 30, 2012. A more detailed definition of this cohort is availablein "Secondary-Level Cohort Definitions" at http://www.p12.nysed.gov/irs/sirs/.
Performance Index (PI): A PI is a value from 0 to 200 that is assigned to an accountability group, indicating how that groupperformed on a required State test (or approved alternative). Student scores on the tests are converted to four performance levels,from Level 1 to Level 4. A PI is calculated using the levels and the following equation: ([(Count at Level 2) + 2(Count at Level 3) +2(Count at Level 4)] ÷ [Count of Cohort Members]) × 100
Effective Annual Measurable Objective (EAMO): The EAMO is the PI value that each accountability group of a given size within adistrict or school is expected to achieve to meet the performance criterion. The EAMO table is available athttp://www.p12.nysed.gov/irs/accountability/ under the header "Annual Measurable Objectives."
Safe Harbor Target: Safe Harbor provides an alternate means to meet the performance criterion for accountability groups whose PIsare less than their EAMOs. The 2011-12 Safe Harbor Target is calculated using the following formula: 2010-11 PI + (200 - the 2010-11PI) × 0.10
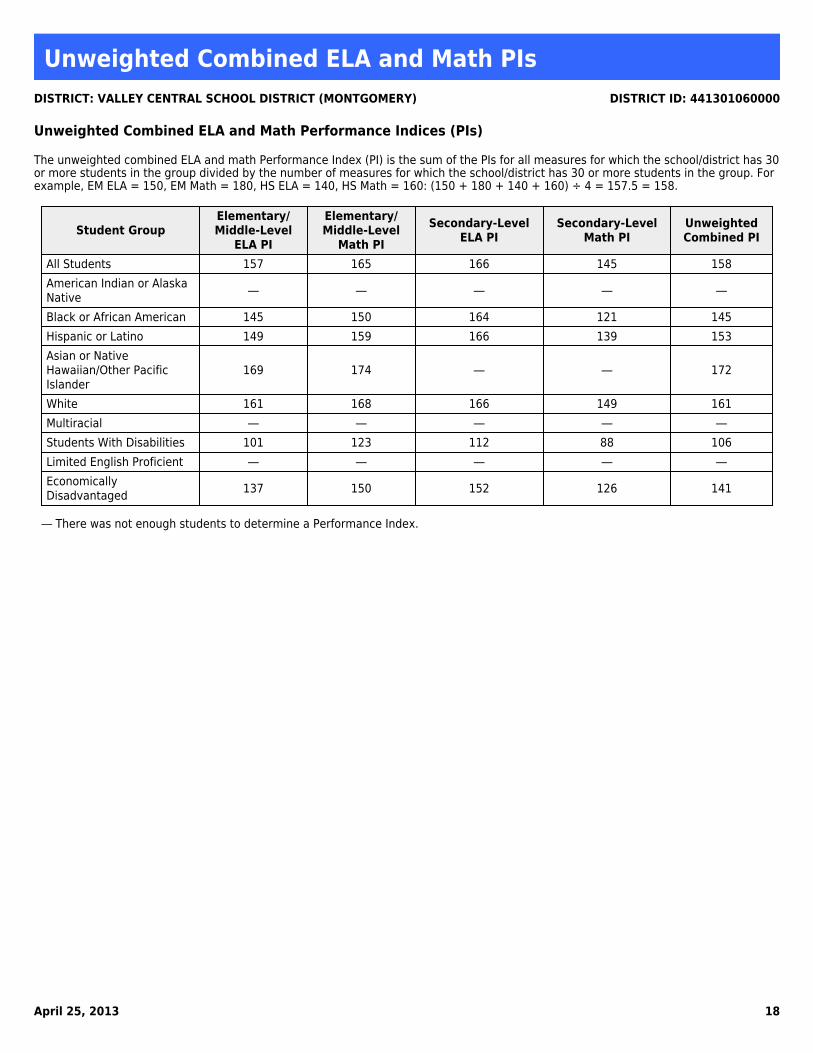
April 25, 2013 18
Unweighted Combined ELA and Math PIsDISTRICT: VALLEY CENTRAL SCHOOL DISTRICT (MONTGOMERY) DISTRICT ID: 441301060000
Unweighted Combined ELA and Math Performance Indices (PIs)
The unweighted combined ELA and math Performance Index (PI) is the sum of the PIs for all measures for which the school/district has 30or more students in the group divided by the number of measures for which the school/district has 30 or more students in the group. Forexample, EM ELA = 150, EM Math = 180, HS ELA = 140, HS Math = 160: (150 + 180 + 140 + 160) ÷ 4 = 157.5 = 158.
Student GroupElementary/Middle-Level
ELA PI
Elementary/Middle-Level
Math PISecondary-Level
ELA PISecondary-Level
Math PIUnweightedCombined PI
All Students 157 165 166 145 158American Indian or AlaskaNative ― ― ― ― ―
Black or African American 145 150 164 121 145Hispanic or Latino 149 159 166 139 153Asian or NativeHawaiian/Other PacificIslander
169 174 ― ― 172
White 161 168 166 149 161Multiracial ― ― ― ― ―Students With Disabilities 101 123 112 88 106Limited English Proficient ― ― ― ― ―EconomicallyDisadvantaged 137 150 152 126 141
― There was not enough students to determine a Performance Index.

April 25, 2013 19
Graduation Rate: AYPDISTRICT: VALLEY CENTRAL SCHOOL DISTRICT (MONTGOMERY) DISTRICT ID: 441301060000
Adequate Yearly Progress: To make AYP in graduation rate, every accountability group with 30 or more members must make AYP. Fora group to make AYP, the graduation rate of the 4-year graduation-rate total cohort OR the 5-year graduation-rate total cohort mustequal or exceed the Graduation-Rate Standard of 80% or the group's Progress Target.
All accountability groups made AYP: YES
Student Group Made AYPAll Students ✔American Indian or Alaska Native ―Black or African American ✔Hispanic or Latino ✔Asian or Native Hawaiian/Other Pacific Islander ―White ✔Multiracial ―Students With Disabilities ✔Limited English Proficient ―Economically Disadvantaged ✔
✔ Made AYP✘ Did not make AYP― There were not enough students to make an AYPdetermination

April 25, 2013 20
Graduation Rate: 4-Year Graduation-Rate Total CohortDISTRICT: VALLEY CENTRAL SCHOOL DISTRICT (MONTGOMERY) DISTRICT ID: 441301060000
All accountability groups with 30 or more members met the graduation-rate criterion for the four-yeargraduation-rate total cohort: NOFour-Year Graduation-Rate Total Cohort
Student GroupMet
Graduation-Rate
Criterion
2007 Four-Year
Graduation-Rate Total
Cohort
Number ofGraduates
GraduationRate
StateStandard
ProgressTarget
All Students ✔ 430 361 84% 80% 80%American Indian or Alaska Native ― 1 ― ― ― ―Black or African American ✔ 39 32 82% 80% 80%Hispanic or Latino ✔ 77 67 87% 80% 80%Asian or Native Hawaiian/Other Pacific Islander ― 5 ― ― ― ―White ✔ 307 257 84% 80% 80%Multiracial ― 1 ― ― ― ―Students With Disabilities ✘ 65✝ 39✝ 60%✝ 80% 67%Limited English Proficient ― 3 ― ― ― ―Economically Disadvantaged ✘ 102 77 75% 80% 80%
✔ Graduation rate is equal to or greater than the State Standard or the group's Progress Target.✘ Graduation rate is less than the State Standard and the group's Progress Target.― There were fewer than 30 students in the cohort.✝ Includes former students with disabilities because the number of students with disabilities in the current year is equal to or greaterthan 30.
2007 Four-Year Graduation-Rate Total CohortThe 2007 four-year graduation-rate total cohort consists of all students who first entered grade 9 anywhere between July 1, 2007 andJune 30, 2008. Four-year graduation-rate results for these students are captured as of August 31, 2011.
Graduation RateThe graduate rate for the 2007 four-year graduation-rate total cohort is the percentage of cohort members who earned a local orRegents diploma by August 31, 2011.
Progress TargetThe Progress Target for the 2007 four-year graduation-rate total cohort is a 10% gap reduction in the graduation rate of the 2006four-year graduation-rate total cohort as of August 31, 2010. The following equation is used to determine the 2007 four-yeargraduation-rate total cohort progress target:[(80 - the graduation rate of the 2006 four-year graduation-rate total cohort) x 0.1] + the graduation rate of the 2006 four-yeargraduation-rate total cohort

April 25, 2013 21
Graduation Rate: 5-Year Graduation-Rate Total CohortDISTRICT: VALLEY CENTRAL SCHOOL DISTRICT (MONTGOMERY) DISTRICT ID: 441301060000
All accountability groups with 30 or more members met the graduation-rate criterion for the five-yeargraduation-rate total cohort: YESFive-Year Graduation-Rate Total Cohort
Student GroupMet
Graduation-Rate
Criterion
2006 Five-Year
Graduation-Rate Total
Cohort
Number ofGraduates
GraduationRate
StateStandard
ProgressTarget
All Students ✔ 409 357 87% 80% 80%American Indian or Alaska Native ― 0 ― ― ― ―Black or African American ✔ 46 38 83% 80% 80%Hispanic or Latino ✔ 55 49 89% 80% 80%Asian or Native Hawaiian/Other Pacific Islander ― 6 ― ― ― ―White ✔ 302 264 87% 80% 80%Multiracial ― 0 ― ― ― ―Students With Disabilities ✔ 52✝ 36✝ 69%✝ 80% 69%Limited English Proficient ― 0 ― ― ― ―Economically Disadvantaged ✔ 95 80 84% 80% 80%
✔ Graduation rate is equal to or greater than the State Standard or the group's Progress Target.✘ Graduation rate is less than the State Standard and the group's Progress Target.― There were fewer than 30 students in the cohort.✝ Includes former students with disabilities because the number of students with disabilities in the current year is equal to or greaterthan 30.
2006 Five-Year Graduation-Rate Total CohortThe 2006 five-year graduation-rate total cohort consists of all students who first entered grade 9 anywhere between July 1, 2006 andJune 30, 2007. Five-year graduation-rate results for these students are captured as of August 31, 2011.
Graduation RateThe graduate rate for the 2006 five-year graduation-rate total cohort is the percentage of cohort members who earned a local orRegents diploma by August 31, 2011.
Progress TargetThe Progress Target for the 2006 five-year graduation-rate total cohort is a 20% gap reduction in the graduation rate of the 2005five-year graduation-rate total cohort as of June 30, 2010. The following equation is used to determine the 2006 five-yeargraduation-rate total cohort progress target:[(80 - the graduation rate of the 2005 five-year graduation-rate total cohort) x 0.2] + the graduation rate of the 2005 five-yeargraduation-rate total cohort

Valley Central School District
2012-2013 Property Tax Report Card

New York State Education Department State Aid Management System (SAMS) Page I ofl
Property Tax Report Card4/1301 - VALLEY CSD (MONTGOME
2012-2013 - Page 1
Revision - as of 041261201312:58 PM
lmportant Note: Chapter 97 of the Laws of 2011 requires school districts to report data elements necessary tocalculate a Property Tax Levy Limit. Data elements for the Property Tax Report Card have been renamed andredefined in accordance with these changes. Please see http:/lwww.p12.nvsed.qov/mqtserv/propertvtax/taxcap/for additional guidance.
School District Contact Person:
School District Telephone Number:
Form Due - April27,2013
Budgeted2012-13
(A)
ProposedBudget 2013-14
(B)
PercentChange
(c)
Total Proposed Spending
Total Proposed School Year TaxLevy, lncluding Tax Levy to SupportLibrary DebtlPermissible Exclusions to the SchoolTax Levy LimitProposed School Year Tax Levy, Notlncluding Levy for PermissibleExclusions or Levy to SupportLibrary DebtSchool Tax Levy Limit2Difference (positive value requires60.0% voter approval)Public School Enrollment
Consumer Price lndex
lroJ6t13s ----llsrJ1r,ss, --l
l+rr/r, ------llEr6rqoe3--_--l
51,620,083
0
,777
W{sssr,3srs,sr,sr4-----1
W,n ,sir----]
1,462,236
,770,276
2.43
9.81
%
%
W21868:004 :
Fs55----l :2:55. o
Er--1uI All proposed levies should exclude any prior year reserve for excess tax levy, including interest.
2 For 2013-11, includes any carryover from 2012-13 and excludes any tax levy for library debt or prior year reserve forexcess tax levy, including interest.
Actuaf 2012-'|.3(D)
Estimated 2013-14(E)
Adjusted Restricted Fund Balance
Assigned Appropriated FundBalanceAdjusted Unrestricted Fund Balance
Adjusted Unrestricted Fund BalanceasaPercent ofthe Total Budget
5J26,314
,546,758
1,638,492
|s52631t---llr^ooo,ooo-----l
fi**t9 _12.80 %%
httos://eservices.nvsed.sov/sams/nrintForm.do?method:nrinfForm&.fsld:Ri0&serrmenfKev:1166QQ54Q6 4n6Do11

Valley Central School District
2013-2014 Administrative Compensation Disclosure
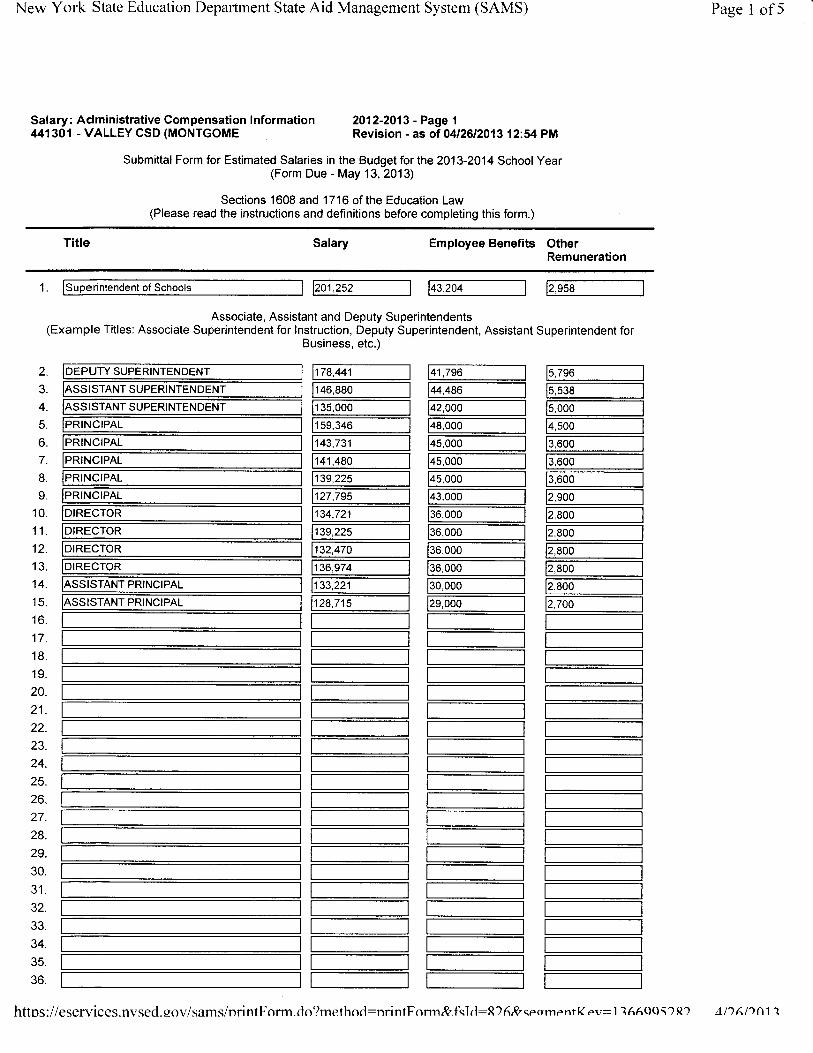
New York State Education Department State Aid Management System (SAMS)
Salary: Administrative Compensation lnformation 2012-2013 - Page 1
441301 - VALLEY CSD (MONTGOME Revision - as of 041261201312:54PM
Submittal Form for Estimated Salaries in the Budget for the 201 3-2014 School Year(Form Due - May 13,2013)
Sections 1608 and 1716 ofthe Education Law(Please read the instructions and definitions before completing this form.)
Page I of5
Title Salary Employee Benefits OtherRemuneration
1. rintendent of Schools
DEPUTY SUPERINTENDENT
ASSISTANT SUPERINTENDENT
ASSISTANT SUPERINTENDENT
PRINCIPAL
PRINCIPAL
PRINCIPALDRINCIPAL
)RINCIPAL
f IRECTOR
)IRECTOR
)IRECTOR
]IRECTOR
\SSISTANT PRINCIPAL
\SSISTANT PRINCIPAL
Wl4sr-----l F32o+-------l tt,r58---------l
Associate, Assistant and Deputy Superintendents(Example Titles: Associate Superintendent for lnstruction, Deputy Superintendent, Assistant Superintendent for
Business, etc.)
2.
3.
4.
5.
6.
7.
8.
9.'10.
11.
12.
13.
14.
15.
16.
17.
18.
19.
20.
21.
22.
23.
24.
25.
26.
27.
28.
29.
30.
31.
32.
33.
34.
35.
36.
178,441
146,880
135,000
1 59,346
143.731
141 ,480
Itr2r5 -_lFfigs ------1
FnA;-------1Fnno-------1ttu6,rt-----l133,221
128,715
l41,116 *-----l
F4186------l42,000
48,000
45,000
45,000
45,000
43,000
36,000
36,000
36,000
36,000
30,000
29,000
796
ttooo ------lFsoo
------__-.'
ilaoo-------lbsoo ---l1,600
2 900
2,800
2,800
2,800
2,800
2,800
2.700
httos:l/eservices.nvsed.sov/sams/nrintForm.do?mefhod:nrintForm&fsTd:R76&seomentKerz:l ?66QQ{?R? t.D6/)fi1't'

Valley Central School District
2011-2012 Exempt Property Report

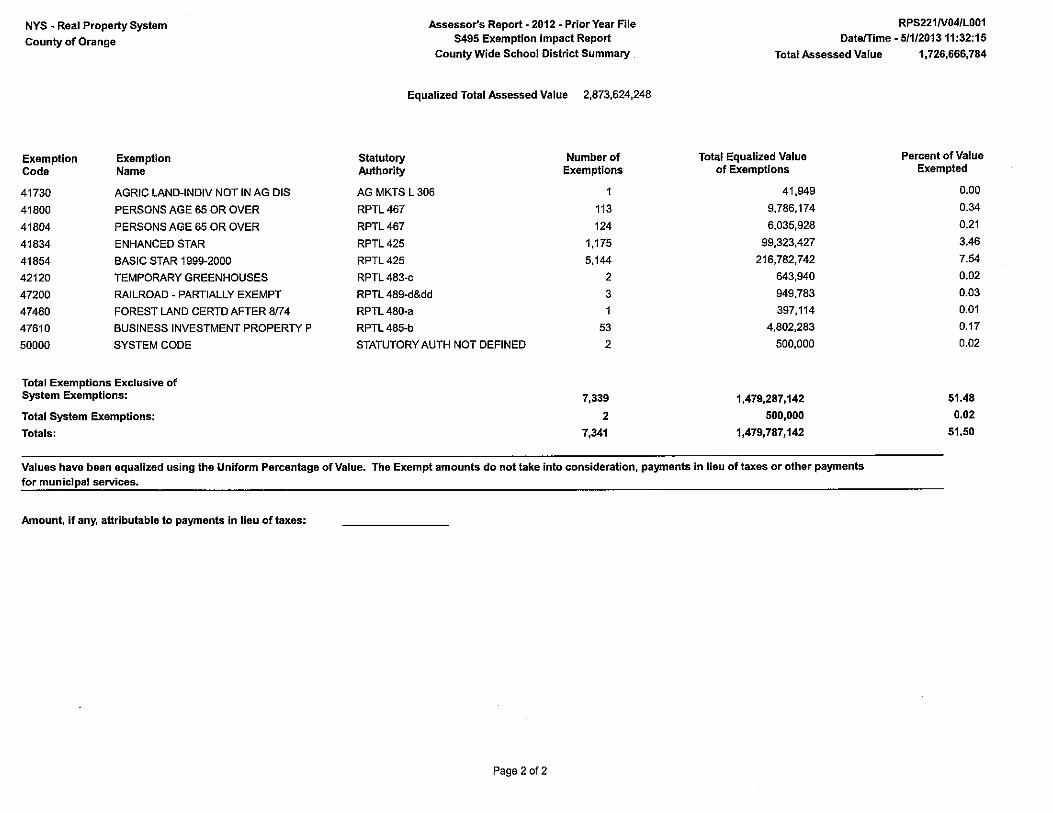

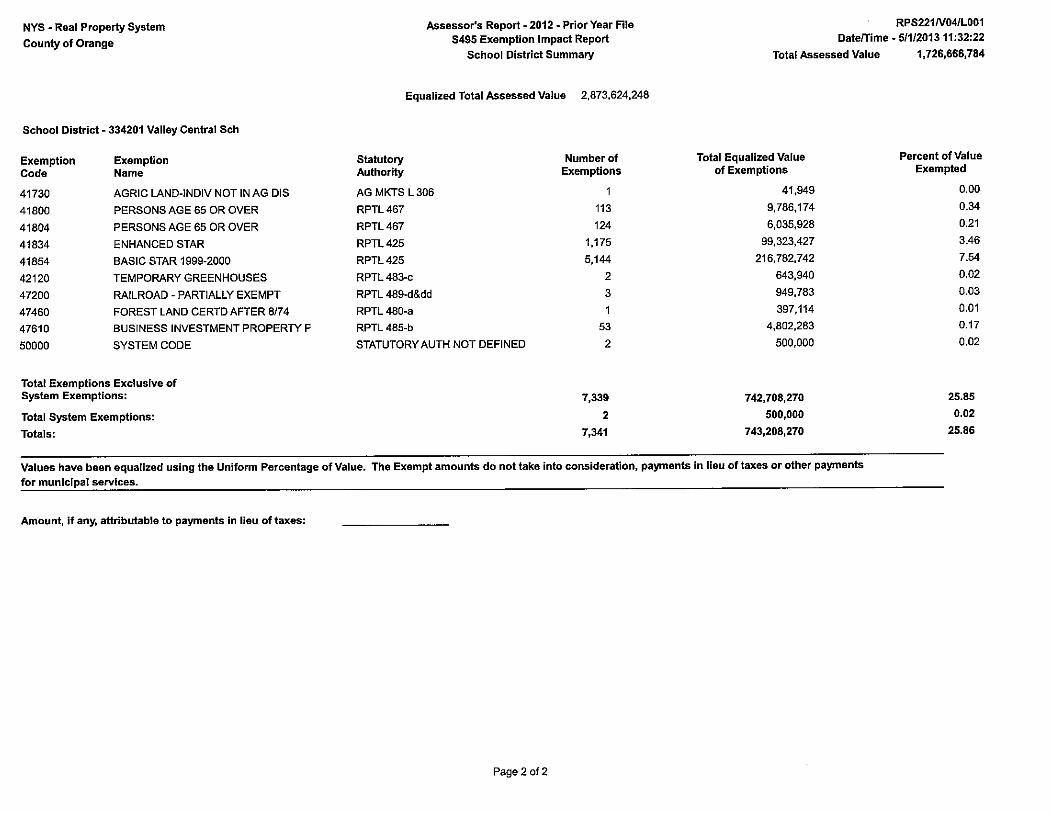


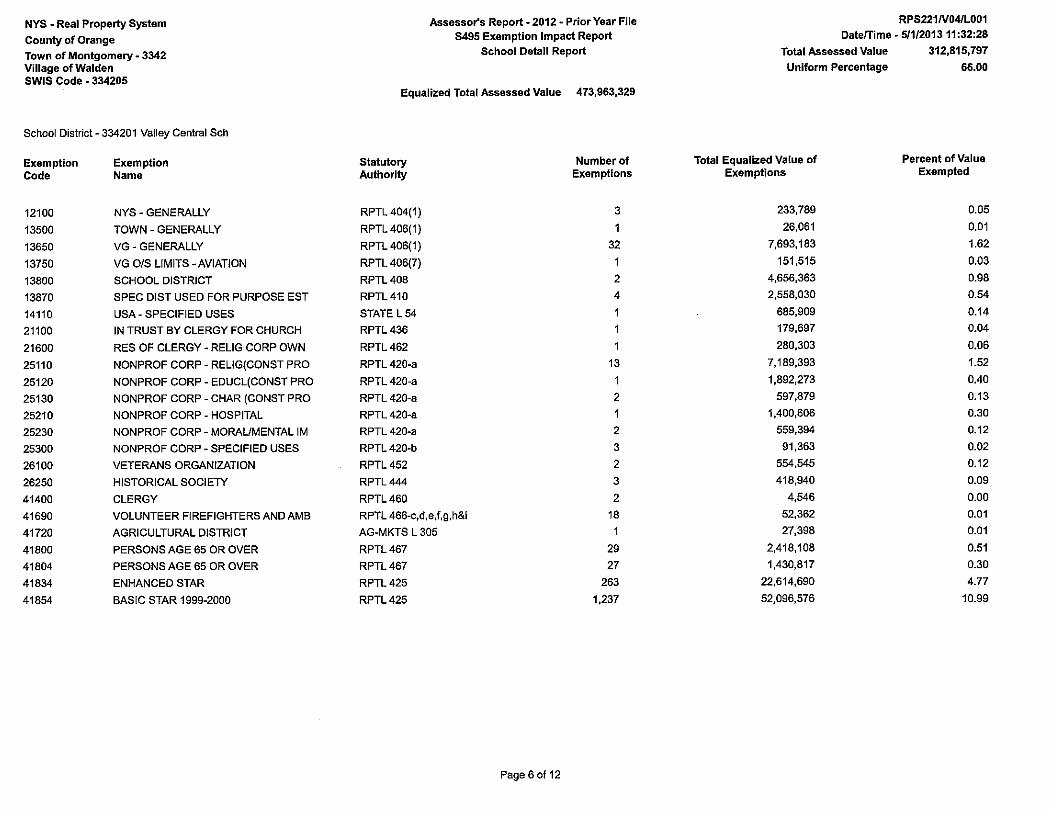
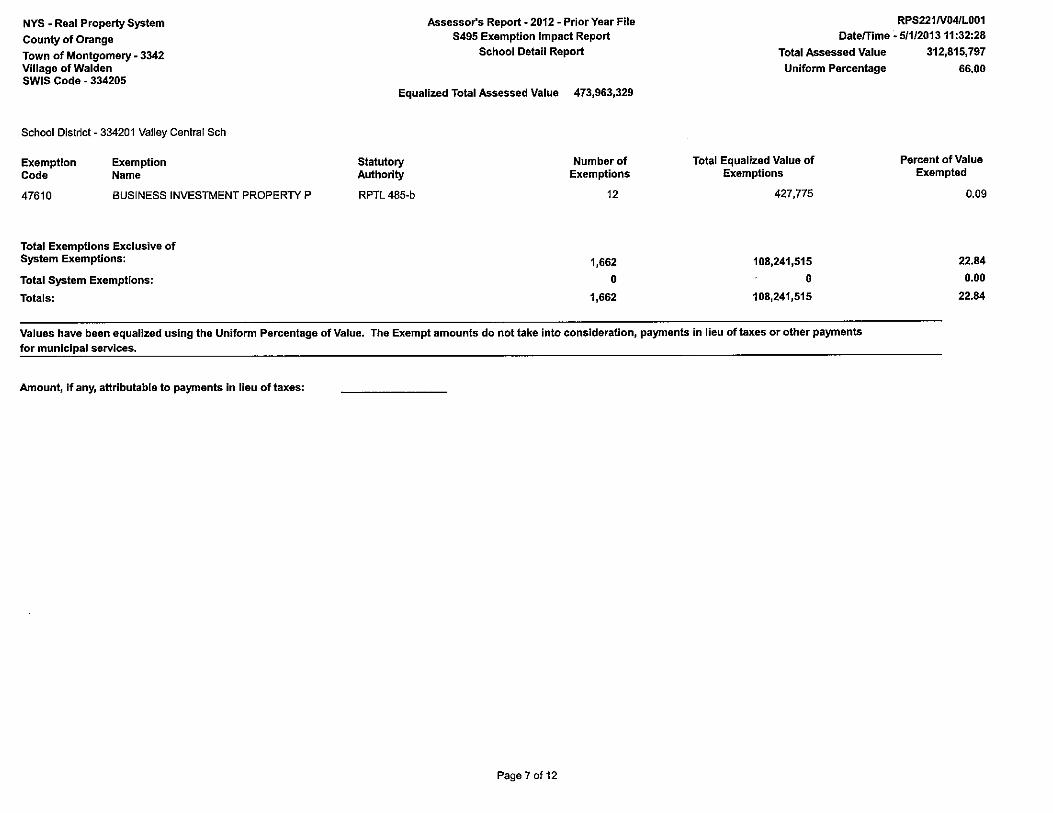


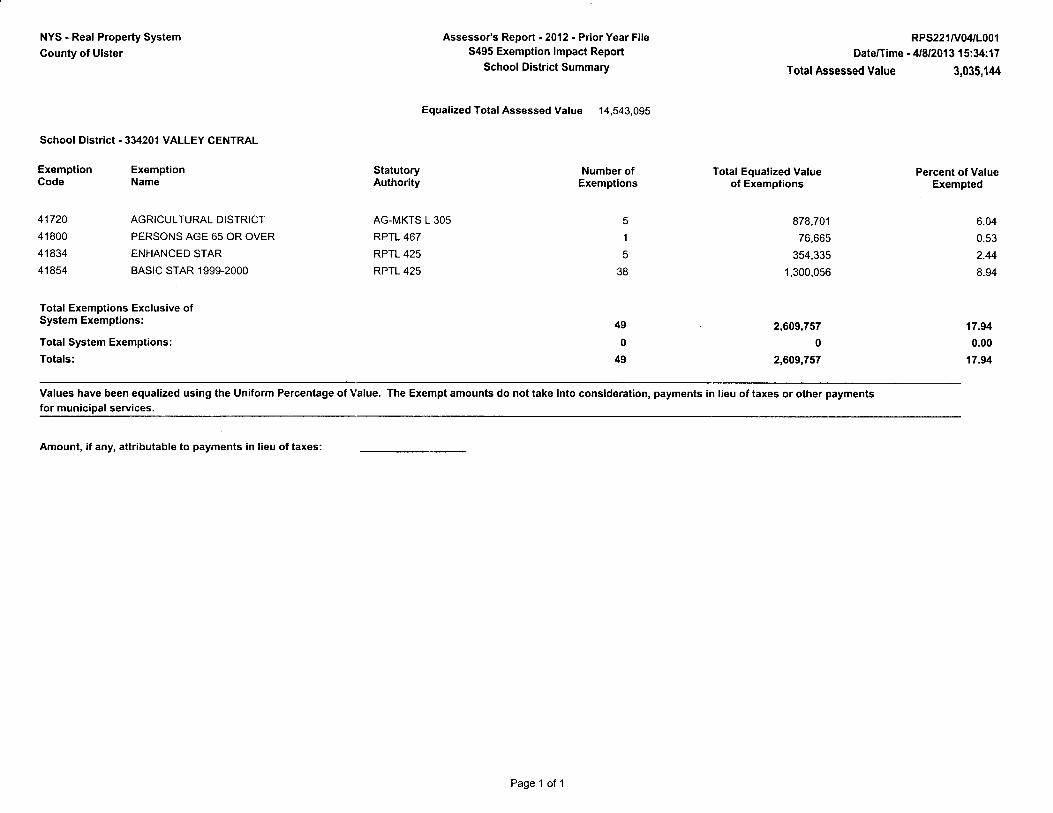
oz o< c,a :.; '<!
oo +4,
!r (,)i
6: 'of o o o 3
g$ tr
oJ
o€o 6'
oJo
=. o (')
zfn
eox
e
3E
3(D
5 J
s 6' :l-r m o ltl z -{ n -
55S
5@
@@
!('r
(roN
5500
{ {
alI
I X
9o
q,
=0,
I a
E;
o m
oq
i:m
tto
x =
fo
oU'
: ds
f,o o= ai. o o +
@m
!>>
zma
0,-n
no4
Ro
@,6
>=
iH;;
E;T
F9n
Uis
X
ou)
6 n1
o 64 <
(.1
m-l
n
n v
v >
>
v,T
I
I Q
9S
F F
F i
f E
s s
r a
iq(,
(,r{
(,r- (t O (J
r
m .o c g !'3 Xo ;
e.3
S
rnie
9q,
o
-' ,^
':r
m-'
oooo
o -:
rEfi
FE
3o
f o,
cLi.5
N!3
=o
t, (,
'J
NF
E
;."
J gT
{ de
'A
<t,/
'(t'
I d
5 JO
cDr
.Olt E#
m-
x= OL 33 SF g;
-{ 9 !L o o o o o 8g SE
b=' o ir FE
o\J'
-<o6
PE
6=--
f
bA
JO 5-lr
{ oog
l* m
Fx+ 9E
N
N
EB
o a
6'a
-E -
E
BE
=,q
;=
{{o.
rcl)c
o=$o
t a-
AE
; F
O)(
'(Jlr
.!o
mB
xo o= :+eo
N p
9'
8f(o
5(ro
=5A
(,56
5A (00(
o
-lO{
iobi
D50
$
(, @(t
r(t
q6 3tr
io LO Oo E; ;s oo ?5 :'o id€
OL .o
= N o CL tr 9. =(o o c =o 3 ! o o o ql (o o o g c !D { o m x o T' o o = o CL o 5 o A' - o o o o 3 o d o q) * o ; q, = o o 5' o o 0, x o o o t o o !t A' 3 o o
3 o c r o s 0, =. tt c q, E 6- o ! 0, 3 o o 5' o c o 0, x o o
! 0) (o o o

(,1C
) z
=:
e ;
O=
=
.
oo.<
!
oa6
iicL
U)
+
oor
c=|>
;-v
HF
4 €
NZ
:l
ta
€=
6 Xo
o =
s 5
s 5
c)m
ox66
O!A
O(r
(,
o
1\)
;-=
5 5
o o
"€f, o
U) o o o' :. OJ (,) s N o t- r m o m z { n r
i {
u, I
o o
<o
a,
t *0
)i
6 g;
o m
og
6Er1
- m
!ox
=,f,
o oo
: is
=o
o= de.
o o -
urm
rr>
zm
>zm
a gX
3ta4
" dE
@,6
>=
*
iHfr
i 5
S;T
Fgr
Uio
N
odE
?i
YO
m-
n
n a
n >
>
oT
T !
c)
c5
'J
) J
r --
r r
r S
. O
=s
s s
X
=.o
uEq;
€e
r- (, o (,l
m lt tr A, il 6v
,cL
8 d fiq
E
9x3
fi a:
Eon
4*cL
Y
o,:+
:'N
F
l€
N!r
oT
.i 3F
igr
El
-b
3sO
t@
'Y
tor
=o
$= =l
EF
,g; (,
,|+
55 (oo(
0(, @
(rJc
tr
eO 50r
o> =o
10 ;8 aDo-
;PV
e =
q69
Llro
c:(D
o6iz >! !r
= S
9N o\-o
-(,.,
fisE
o--ib
boF
-o{A
{J
{ o gm
El
x: Eb
!N ao ocL
-g s
* 3
;f-o
-5
-o)
-oo
-O
(rO
)-.lO
(r(r
o)o
O)(
,rO
rJ=
NN
o ct
)oo _(
t Jo
{\t
(t
('{o
{
! om
Fxo O
J2- =o:- 8.S
Pi$
9P
F8i
E8
6{o
{io
bio
505
g q o an t, o cr o o o .ct g N o cl = 9. GI o C ii o t o 5 o o f !, (ct o o ET c !e o m x o 3 It t, J o J o o o o 0, F o =' o o o 2. C
L o A' * o -= ! 0t 3 o f o 5' o tr o q, x o o o o o !t t 3 o o
o tr E: t g o o 3. o o I
3 o c f F o, = :< t, ;i. A' s o o E' t, 3 o f o = o c o q, x o o
! G)
(o o o