2013 iba mega conference capital planning amid evolving regulations may 15, 2013 3:15 – 4:15 p.m
TRANSCRIPT

2013 IBA Mega Conference
Capital Planning Amid Evolving Regulations
May 15, 20133:15 – 4:15 p.m.
2
Presenter
Craig Mancinotti Managing Director & Principal
Austin Associates, LLC
www.austinassociates.com
3
Capital Planning Amid Evolving Regulations
Industry Update
Regulatory Guidance
Basel III
Case Study
Developing a Capital Plan
Stress Testing
4
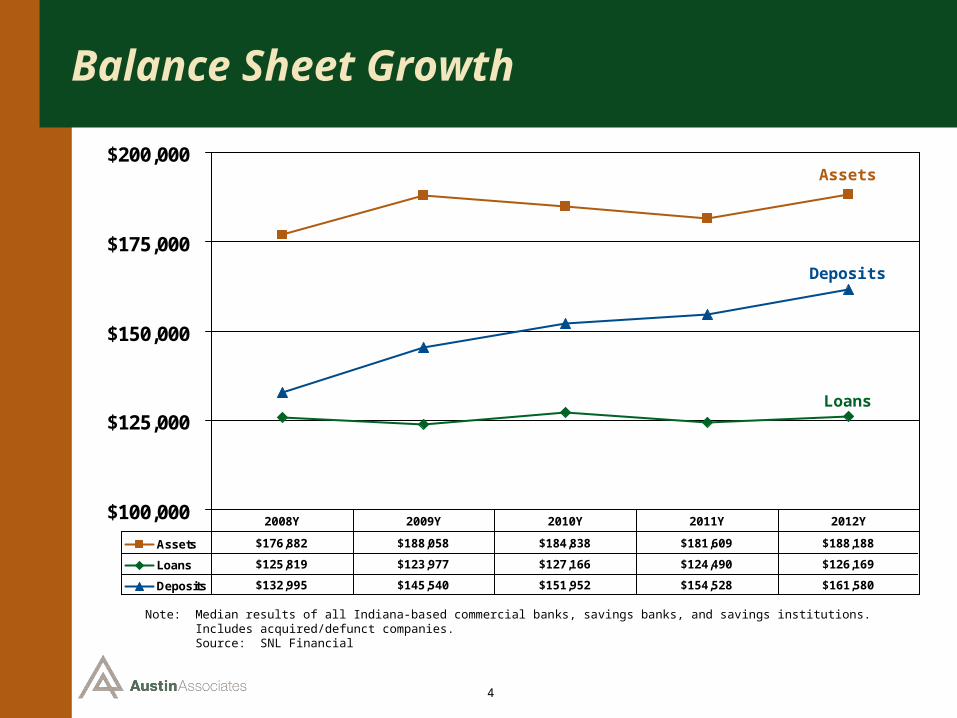
Balance Sheet Growth
$100,000
$125,000
$150,000
$175,000
$200,000
Assets $176,882 $188,058 $184,838 $181,609 $188,188
Loans $125,819 $123,977 $127,166 $124,490 $126,169
Deposits $132,995 $145,540 $151,952 $154,528 $161,580
2008Y 2009Y 2010Y 2011Y 2012Y
Note: Median results of all Indiana-based commercial banks, savings banks, and savings institutions.Note: Includes acquired/defunct companies. Note: Source: SNL Financial
Assets
Deposits
Loans
5
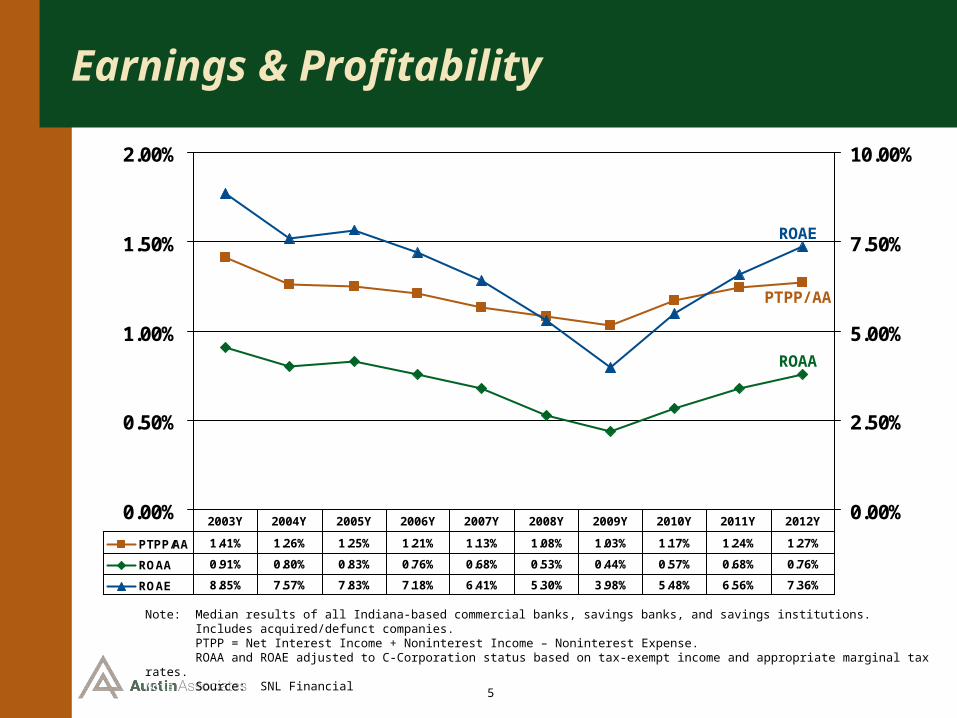
Earnings & Profitability
0.00%
0.50%
1.00%
1.50%
2.00%
0.00%
2.50%
5.00%
7.50%
10.00%
PTPP/AA 1.41% 1.26% 1.25% 1.21% 1.13% 1.08% 1.03% 1.17% 1.24% 1.27%
ROAA 0.91% 0.80% 0.83% 0.76% 0.68% 0.53% 0.44% 0.57% 0.68% 0.76%
ROAE 8.85% 7.57% 7.83% 7.18% 6.41% 5.30% 3.98% 5.48% 6.56% 7.36%
2003Y 2004Y 2005Y 2006Y 2007Y 2008Y 2009Y 2010Y 2011Y 2012Y
Note: Median results of all Indiana-based commercial banks, savings banks, and savings institutions.Note: Includes acquired/defunct companies. Note: PTPP = Net Interest Income + Noninterest Income – Noninterest Expense.Note: ROAA and ROAE adjusted to C-Corporation status based on tax-exempt income and appropriate marginal tax rates.Note: Source: SNL Financial
PTPP/AA
ROAE
ROAA

6
Asset Quality
0.00%
0.50%
1.00%
1.50%
2.00%
2.50%
NPAs/Assets 0.67% 0.65% 0.61% 0.68% 0.86% 1.26% 1.80% 2.13% 2.22% 2.05%
NCO/Avg Loans 0.15% 0.14% 0.13% 0.12% 0.14% 0.22% 0.41% 0.52% 0.44% 0.32%
ALLL/Loans 1.16% 1.10% 1.06% 1.05% 1.04% 1.20% 1.32% 1.48% 1.53% 1.63%
2003Y 2004Y 2005Y 2006Y 2007Y 2008Y 2009Y 2010Y 2011Y 2012Y
Note: Median results of all Indiana-based commercial banks, savings banks, and savings institutions. Includes acquired/defunct companies. Note: Nonperforming assets (“NPAs”) equal to the sum of loans 90+ days past due, nonaccrual loans, other real estate owned (OREO), and debtNote: securities & other assets. NPAs exclude the guaranteed portion of loans covered by the U.S. government and OREO covered by loss-sharingNote: agreements with the FDIC. Performing restructured loans are included. Note: Source: SNL Financial
NPAs/Assets
ALLL/Loans
NCO/Avg Loans

7
Capital Ratios
5.00%
10.00%
15.00%
20.00%
Tier 1 Leverage 9.57% 9.51% 9.70% 9.39% 9.54% 9.45% 9.22% 9.41% 9.75% 9.95%
Tier 1 Risk-Based 14.11% 13.93% 13.79% 13.75% 13.69% 12.98% 12.89% 13.82% 14.72% 15.29%
Total Risk-Based 15.31% 15.12% 14.94% 14.88% 14.87% 14.14% 14.03% 14.98% 15.92% 16.41%
2003Y 2004Y 2005Y 2006Y 2007Y 2008Y 2009Y 2010Y 2011Y 2012Y
Note: Median results of all Indiana-based commercial banks, savings banks, and savings institutions.Note: Includes acquired/defunct companies. Note: Source: SNL Financial
Tier 1 Leverage
Total Risk-Based
Tier 1 Risk-Based
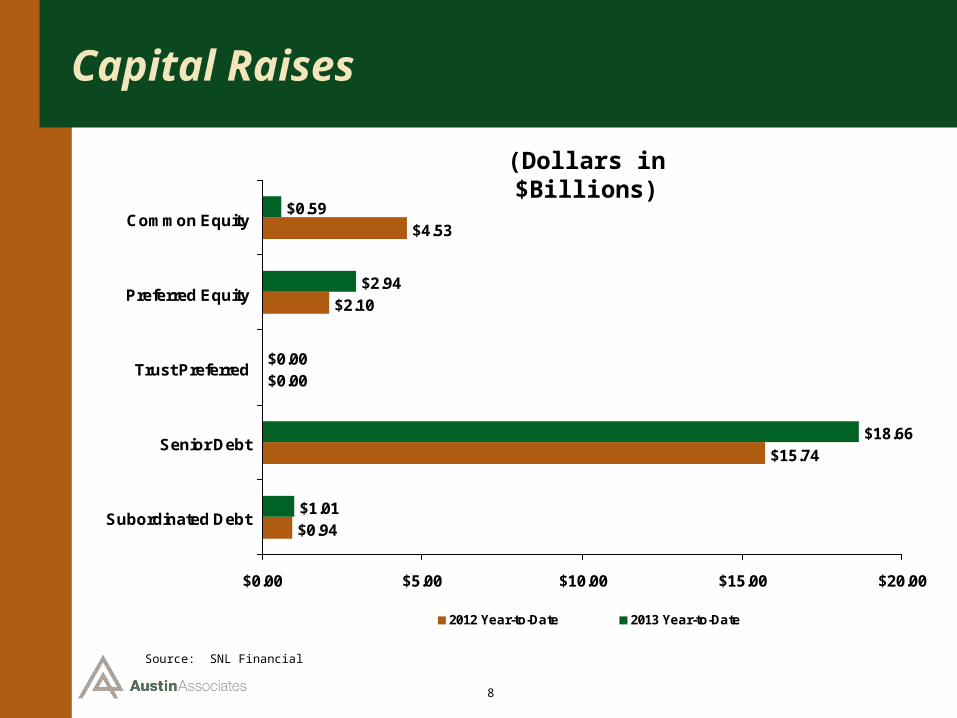
8
Capital Raises
$0.94
$15.74
$0.00
$2.10
$4.53
$1.01
$18.66
$0.00
$2.94
$0.59
$0.00 $5.00 $10.00 $15.00 $20.00
Subordinated Debt
Senior Debt
Trust Preferred
Preferred Equity
Common Equity
2012 Year-to-Date 2013 Year-to-Date
Source: SNL Financial
(Dollars in $Billions)
9
Industry Update
Uncertainty of Basel III
Margin Compression
Mixed Signals on Loan Demand
“Irrational” pricing
Improving asset quality
Low or negative provisions
Bank equity markets stabilizing
M&A activity picking up
10
Industry Update
Dodd-Frank signed into law 7/21/10
Implementation 2011
Increased capital requirements and creation of CFPB, among extensive provisions
“Tougher” regulatory exams
Enhanced enterprise risk management (“ERM”)
Increased compliance costs
11
Regulatory Guidance: Capital Planning
OCC 2012-16: Guidance for Evaluating Capital Planning and Adequacy (July 2012)
• Every bank must have effective process to: (i) assess capital adequacy in relation to overall risks; and (ii) plan for maintaining appropriate capital levels
OCC 2012-33: Community Bank Stress Testing
• To identify and quantify risk in the loan portfolio and help establish effective strategic and capital planning process

12
OCC 2012-16 - Elements
1. Identifying and Evaluating All Material Risks
2. Setting and Assessing Capital Adequacy Goals that Relate to Risk
3. Maintaining a Strategy to Ensure Capital Adequacy and Contingency Planning
4. Ensuring Integrity in the Internal Capital Planning Process and Capital Adequacy Assessments
Supervisory Review – included in assessment of Capital and Management component ratings

13
OCC 2012-16 – Element #1
Identify and Evaluate All Material Risks
Risk FactorInherent
RiskRisk
ManagementComposite Risk Level Trend
Credit
Operational
Liquidity
Market
Reputational
Strategic
Legal
Start with regulatory risk assessmentCustomize based on bank-specific issues

14
OCC 2012-16 – Element #2
Set and Assess Capital Adequacy Goals that Relate to Risk
Determine capital needs in relations to risks and strategic direction
Short-term and long-term
Higher risk + Growth plans + Acquisitions = Higher Capital Goals
Concentration levels and limits
Quality of risk management, internal controls and audit processes
Quality, sustainability and level of earnings
Pro forma modeling (at least 2 years)

15
OCC 2012-16 – Element #3
Determine a Strategy to Ensure Capital Adequacy and Contingency Planning
Internal and external sources of capital
- Earnings
- Infusion of capital
Contingency Planning
- Deleverage
- Asset Mix change
- Asset Sale
- Raise Capital
- Sell

16
OCC 2012-16 – Element #4
Ensure Integrity in the Internal Capital Planning Process and Capital Adequacy Assessments
Capital planning must be documented
Roles/Responsibilities of Board, Management and Audit
Process for monitoring risk tolerance levels, capital adequacy, including board reporting and contingency plans
Key planning assumptions and methods must be documented
Risk exposures and concentrations
Measures to take in response to changes in conditions
Stress testing

17
OCC 2012-33: Stress Testing
Use OCC 2012-33 in conjunction with:
(i) “Concentrations of Credit” booklet in the OCC’s Comptroller’s Handbook Series;
(ii) OCC Bulletin 2012-16; and
(iii) Interagency Final Guidance on “Concentrations in CRE Lending, Sound Risk Management Practices”
Dodd-Frank requires annual stress testing for Banks > $10 Billion
(i) Community Banks not required to use same testing, but
(ii) Some form of annual stress testing is a key part of sound risk management for community banks
18
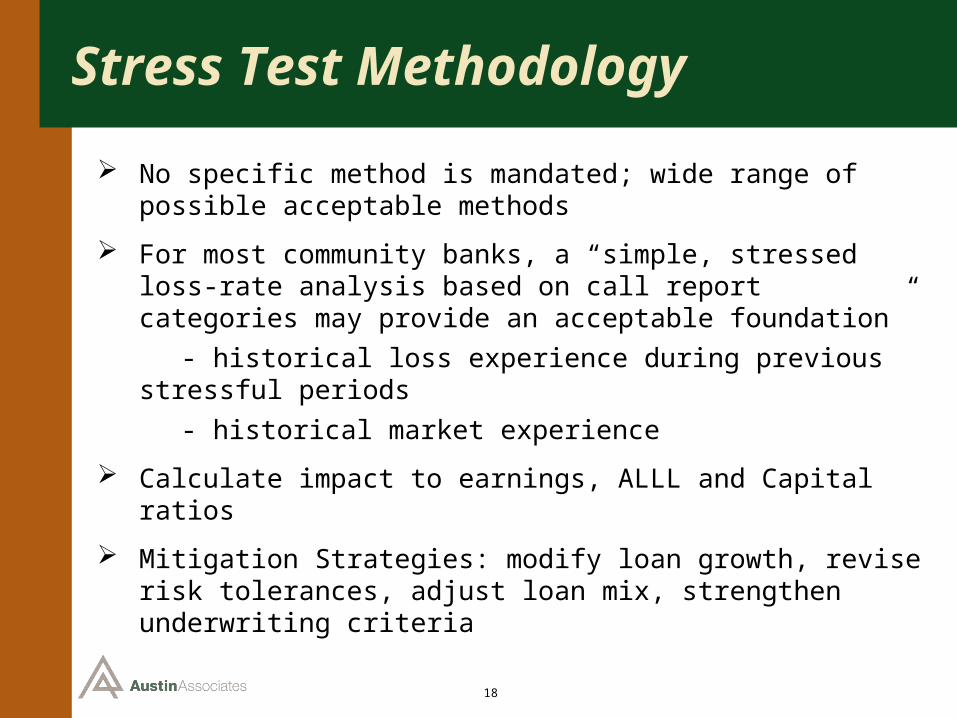
Stress Test Methodology
No specific method is mandated; wide range of possible acceptable methods
For most community banks, a “simple, stressed loss-rate analysis based on call report categories may provide an acceptable foundation”
- historical loss experience during previous stressful periods
- historical market experience
Calculate impact to earnings, ALLL and Capital ratios
Mitigation Strategies: modify loan growth, revise risk tolerances, adjust loan mix, strengthen underwriting criteria
19
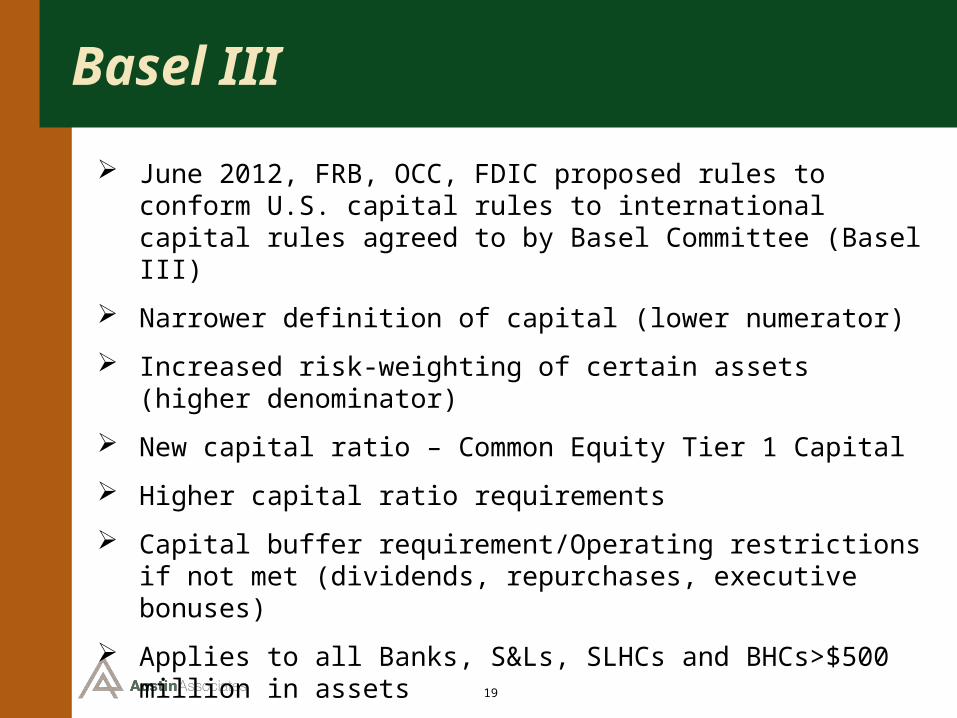
Basel III
June 2012, FRB, OCC, FDIC proposed rules to conform U.S. capital rules to international capital rules agreed to by Basel Committee (Basel III)
Narrower definition of capital (lower numerator)
Increased risk-weighting of certain assets (higher denominator)
New capital ratio – Common Equity Tier 1 Capital
Higher capital ratio requirements
Capital buffer requirement/Operating restrictions if not met (dividends, repurchases, executive bonuses)
Applies to all Banks, S&Ls, SLHCs and BHCs>$500 million in assets

20
Basel III
Capital RatioFully-Phased in
Minimum Comments
Tier 1 Leverage 5.0% Tier 1 excludes TruPS
Tier 1 Risk-Based 6.0% + 2.5% = 8.5% Tier 1 includes NCPPS
Total Risk-Based 8.0% + 2.5% = 10.5% TruPS are included in Tier 2
Common Equity Tier 1 Capital (Risk-Based)
4.5% + 2.5% = 7.0 Common equity only, and includes AOCI adjustment
Full implementation phase-in by 2019 Extremely complex – risk weightings and exclusions Strong opposition from community bankers Final implementation remains on HOLD

21
Case Study
Midwestern-based Bank
$700 million in assets
Written Agreement with OCC Credit risk management focus No explicit “Capital Plan” requirement IMCR of 8% Tier 1 Leverage/12% TRBC
Bank presently exceeds IMCR requirements
Board determined to develop a formal, written Capital Plan

22
Case Study: Capital Plan
Table of ContentsI. Executive Summary
II. History and Profile of Bank
III. Financial Performance Review
IV. Peer Group Analysis
V. Key Risk Assessment
VI. Core Strategic Objectives and Operating Strategies
VII. Quarterly Financial Projections
VIII. Capital Stress Test
IX. Contingency Plan

23
Case Study: Capital Plan
Executive SummaryManage capital consistent with regulatory guidance
Summarized Formal Agreement
Referenced IMCRs and current capital ratios
Listed core strategic objectives
Summarized oversight responsibilities and process
24
Case Study: Capital Plan
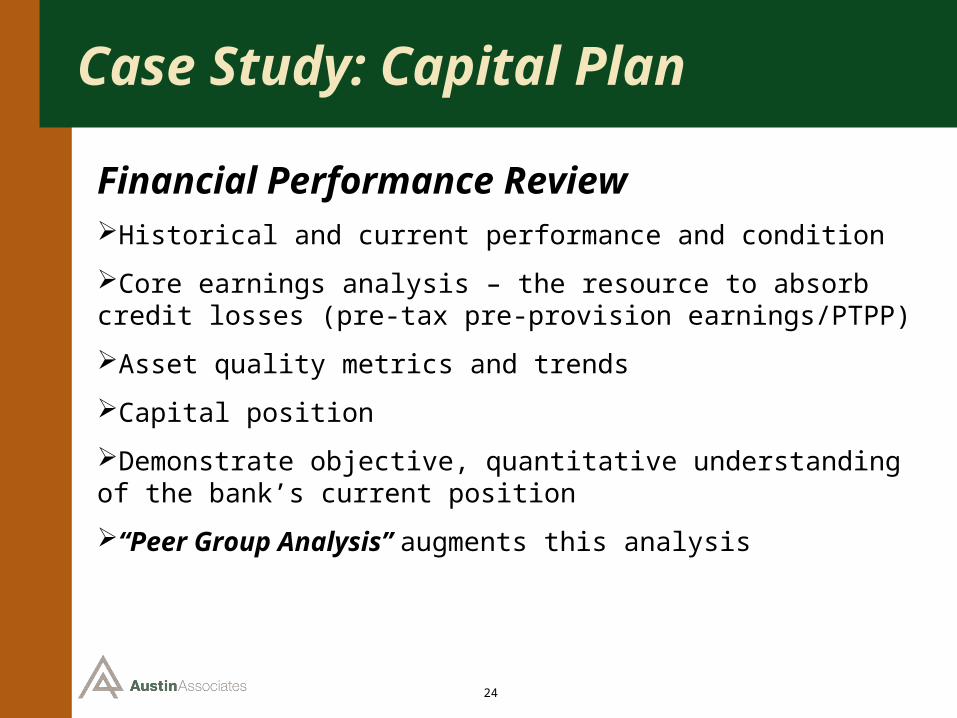
Financial Performance ReviewHistorical and current performance and condition
Core earnings analysis – the resource to absorb credit losses (pre-tax pre-provision earnings/PTPP)
Asset quality metrics and trends
Capital position
Demonstrate objective, quantitative understanding of the bank’s current position
“Peer Group Analysis” augments this analysis

25
Case Study: Capital Plan
Key Risk AssessmentUsed Regulatory Exam Risk Matrix as starting point
No formal ERM process; Risk assessments prepared by managers; reviewed by Internal Audit or Compliance
Credit Risk (classified asset totals, NCO’s, specific exam criticisms related to credit risk management)
Interest Rate Risk (increasing rates = NIM pressure)
Liquidity Risk (high NPAs, erratic earnings)
Price Risk (high % of capital in TruPS, non-agency CMOs, CMBS and high REO level)
Strategic Risk and Reputation Risk also cited due to problems
“Mitigating Factors” discussion followed each key risk assessment

26
Case Study: Capital Plan
Core Strategic ObjectivesInternally-focused operating strategy
Compliance with Written Agreement
NPA reduction, including specific remediation efforts
Capital management
Revenue enhancement initiatives
Cost reduction initiatives
Focus on C&I and CRE-owner occupied loans, and de-emphasize commercial participations, construction and development lending
Focus on Business Relationships
High performance, “Best Practices” culture

27
Case Study: Capital Plan
Quarterly Financial ProjectionsBaseline forecast for 2013-2014, quarterly and annual
Description of all key assumptions
Narrative summary of results
Key Drivers: Growth; NCOs, PTPP earnings
Projected capital ratios
28
Capital Stress Test
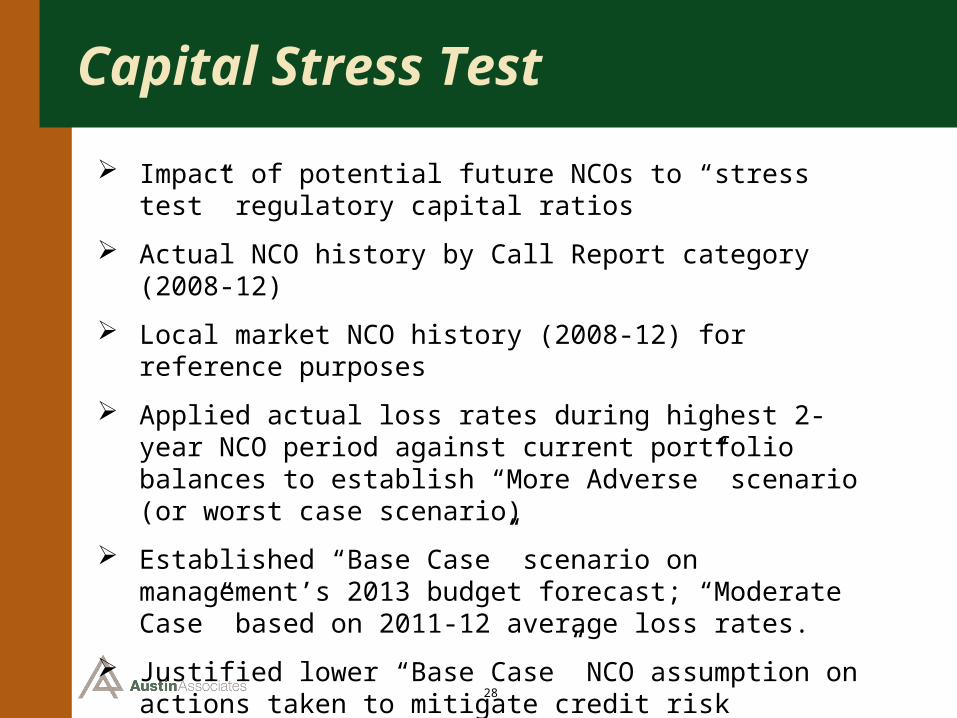
Impact of potential future NCOs to “stress test” regulatory capital ratios
Actual NCO history by Call Report category (2008-12)
Local market NCO history (2008-12) for reference purposes
Applied actual loss rates during highest 2-year NCO period against current portfolio balances to establish “More Adverse” scenario (or worst case scenario)
Established “Base Case” scenario on management’s 2013 budget forecast; “Moderate Case” based on 2011-12 average loss rates.
Justified lower “Base Case” NCO assumption on actions taken to mitigate credit risk
29
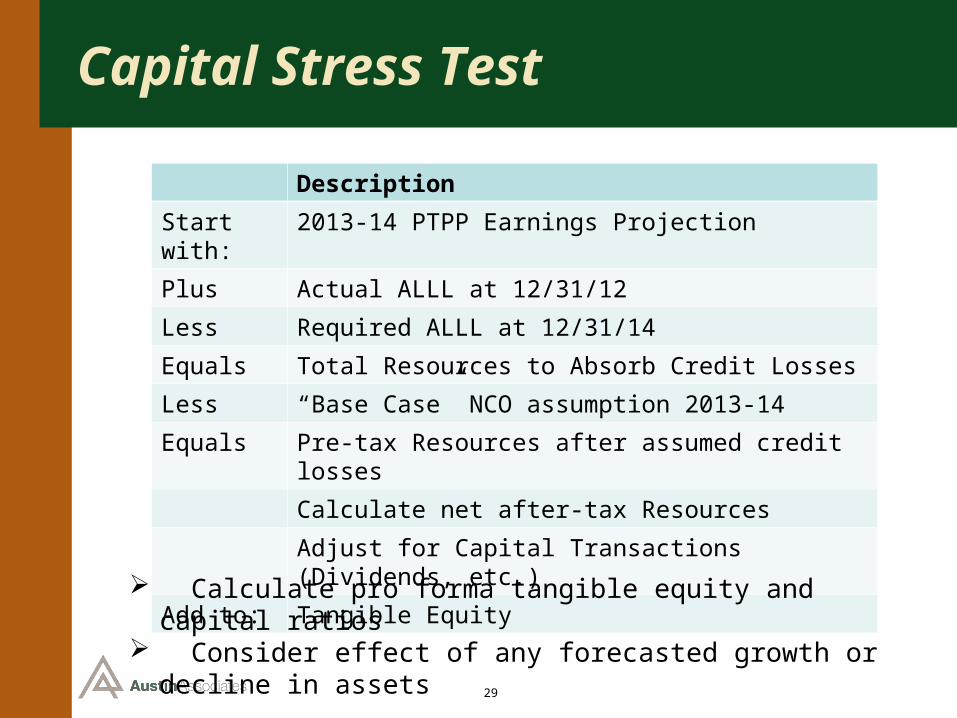
Capital Stress Test
Description
Start with: 2013-14 PTPP Earnings Projection
Plus Actual ALLL at 12/31/12
Less Required ALLL at 12/31/14
Equals Total Resources to Absorb Credit Losses
Less “Base Case” NCO assumption 2013-14
Equals Pre-tax Resources after assumed credit losses
Calculate net after-tax Resources
Adjust for Capital Transactions (Dividends, etc.)
Add to: Tangible Equity
Calculate pro forma tangible equity and capital ratios Consider effect of any forecasted growth or decline in assets
30
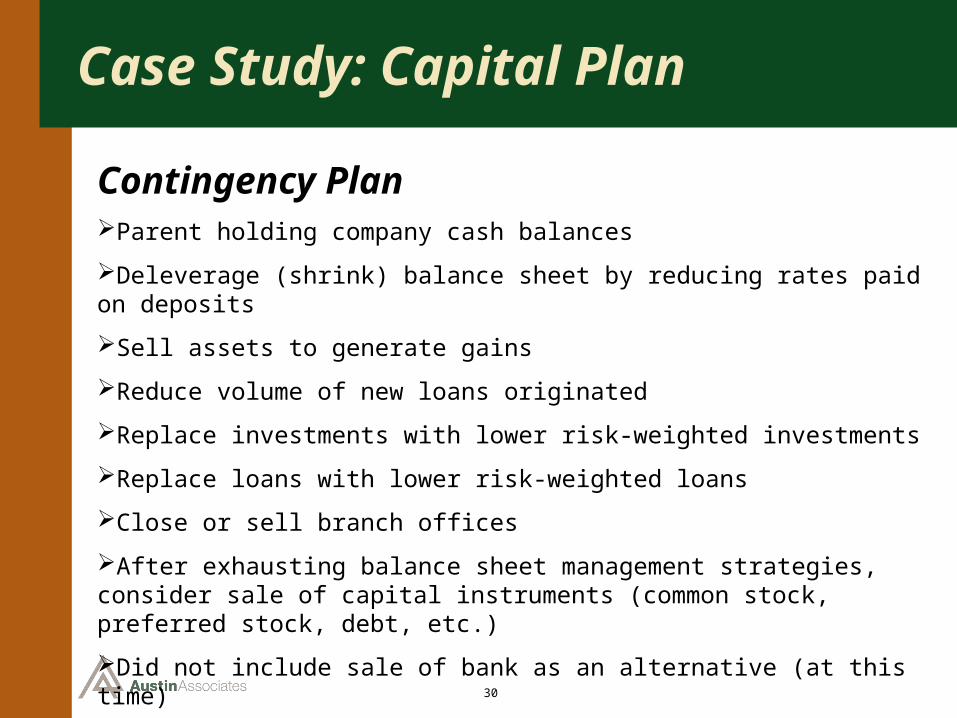
Case Study: Capital Plan
Contingency PlanParent holding company cash balances
Deleverage (shrink) balance sheet by reducing rates paid on deposits
Sell assets to generate gains
Reduce volume of new loans originated
Replace investments with lower risk-weighted investments
Replace loans with lower risk-weighted loans
Close or sell branch offices
After exhausting balance sheet management strategies, consider sale of capital instruments (common stock, preferred stock, debt, etc.)
Did not include sale of bank as an alternative (at this time)

31
Case Study: Capital Plan
Regulatory Comments on Draft Capital PlanVary factors other than NCOs, including appropriate ending ALLL
Validate PTPP assumptions; 5% reduction in “Moderate” and 10% reduction in “More Adverse” scenarios need to be supported – use IRR and Liquidity stress tests to estimate potential decline in revenue
Capital Triggers – “The Board should set capital triggers above the 8% and 12% minimums to prompt Board and management action before capital deteriorates below the minimum levels
Management should establish a Capital Policy in addition to the Capital Plan. The Policy should document the:
• Capital planning process and the Board’s expectations and goals• Type and frequency of reporting to monitor the capital plan• Roles and responsibilities of key parties to the process• Key planning assumptions, methodologies and limitations
32
Q & A
Craig J. MancinottiManaging Director & Principal
Austin Associates, LLCToledo, Ohio