2014 gresb report
DESCRIPTION
ÂTRANSCRIPT

© 2014 GRESB BV
2014GRESBReport

Key Figures
2013 2014
543
637
Survey Participants
$5.5 trillion
Institutional Capital
$5.0 trillion
ȭǍइ
35
46
Investor Members
56
10 12Partners
$1.6 trillion
49,000
1,771
18
14
56,000*
3,329
21
$2.1 trillionProperty value
Associate members
Assets in new construction and major renovations
Fund manager andcompany members
Assets covered* Excluding single-family residential assets

Investor Members
GRESB’s mission is to enhance and protect shareholder value by evaluating and improving sustainability best practices in the global real estate sector.

© 2014 GRESB B.V.Unless explicitly stated otherwise, all rights including those in copyright in publication are owned by or controlled for these purposes by GRESB B.V. Except as otherwise expressly permitted under copyright law or GRESB B.V.’s terms and conditions, no part of this publication may be reproduced, copied, republished, downloaded, posted, broadcast or transmitted in any way without first obtaining GRESB B.V.’s written permission.
Contents
Introduction 2
Data Collection and Validation 4
Scoring and Methodology 5
Online Report, Products & Services 6
Global Results 7
Regional Results 10
Aspect Overview 13
Management 14
Policy & Disclosure 15
Risks & Opportunities 16
Monitoring & EMS 17
Performance Indicators 18
Building Certifications 20
Stakeholder Engagement 21
New Construction & Major Renovations 23
Timeline 25
Governance and Contact 26
GRESB Members 27
Participants 29
How to read this reportThe 2014 GRESB Report is in digital format, downloadable as a PDF. For the first time, in 2014, the Report also links with additional online materials. These online resources, accessible via the GRESB website, contain additional analysis and data, together with topic-specific innovation case studies col-lected from 2014 benchmark participants and 2014 sector leaders. You can access these additional materials by clicking on the links in the Report.
Click to access Innovation Case Studies
Click graphs to see more analysis in the Portal
Click to get more insights in the Portal...more

2
With increased societal focus on resource scarcity, the need for de-carbonization, and the effects of climate change, in-vestors have become increasingly aware of the implications from these, generally longer term, megatrends. More than any other investment class, real assets are exposed to the direct, local consequences posed by these global risks: more stringent regulatory requirements, changing societal prefer-ences for places to work, live, and play, and exposure to cli-mate-related events, such as flooding and extreme weather conditions.
With these investment beliefs in mind, in 2009 three large pension funds joined forces to better understand their ex-posure to risks related to environmental, social and govern-ance (ESG) issues in their global portfolios of investments in property companies and private equity real estate funds. The first assessment of the sustainability performance of the real estate industry, based on a selection of 43 material metrics, led to the inaugural GRESB benchmark, including 198 property companies and funds. The outcomes clearly showed that the real estate sector was just waking up to the reality of integrating sustainability in its investment and asset management strategies: for example, only 19 percent of benchmark participants had some information on energy consumption, and only 20 participants (10 percent) achieved a ranking in the highest category (Green Stars).
Five years later, GRESB reporting has become standard practice for most of the world’s property companies and fund managers. In consultation with the real estate indus-try, GRESB has further developed the set of metrics that constitute the most important sustainability issues for its more than 130 members, of which 42 are pension funds and their fiduciaries, jointly representing some USD 8.9 trillion in assets under management. This year, 637 listed property companies and private equity real estate funds submitted data, covering 56,0001 buildings with an aggregate value of USD 2.1 trillion. Not only has the coverage of sustainabili-ty reporting improved, but the sustainability performance of benchmark participants also shows significant progress. For example, 79 percent of property companies and funds now measure the energy consumption in their buildings. Collectively, between 2012 and 2013, the commercial real es-tate sector reduced its energy consumption by 0.8 percent, carbon emissions fell by 0.3, and water consumption by 2.3 percent.2 Over a third of the benchmark participants are now ranked in the highest “Green Star” category.
Looking forward, there is no doubt that buildings will con-tinue to be a focus of environmental legislation. In six years from now, all new construction in European Union countries will need to reach a “nearly zero-energy” standard. Follow-ing disclosure laws in Australia and the EU, ten US cities, two states and one county now require the benchmarking and disclosure of building energy performance for large commercial, institutional, and multifamily buildings. Green 1 Excluding single-family residential assets
2 Based on like-for-like data from 508, 434, and 462 participants, respectively
building certification programs have become institutional-ized in the real estate market, with over 34,000 commercial buildings certified across the globe3.
For investors, these trends of increasing transparency and enhanced sustainability performance at the asset level will likely affect the volatility and profitability of real estate in-vestments in property companies and funds. The financial industry continues to seek ways to incorporate ESG metrics in financial decision-making, with new investment oppor-tunities, such as green property bonds, recently added to the universe of investment vehicles. The need for reliable, investment grade data on ESG metrics continues to increase with the advent of capital market interest in the topic, and GRESB will be at the forefront of providing increasingly granular, high-quality data to the industry. This data will provide transparency, allowing pension funds, insurance companies, banks, and other institutional investors and lenders to incorporate non-financial information into their investment decision-making. For the global real estate in-dustry, accurate benchmarking at the portfolio level will in-crease competition and the speed with which sustainability best practices diffuse into the market. This will enhance and protect the value of real estate investments, and ultimately contribute to a more efficient, more sustainable built envi-ronment.
3 Source Green Building Information Gateway (GBIG) www.gbig.org
Five years of GRESB: the past, the present, and the future of sustainability in the global real estate sector
Introduction
“PREA believes that sustainability should be at the forefront of business planning and analysis across all industries, but particularly within the institutional real estate community. The built environment accounts for a large proportion of carbon emissions and other environmental impacts, and our industry is poised to contribute significantly to global sustainability improvements.”
—Gail Haynes,
President Pension Real Estate Association

3
The GRESB Process
Valid
ation & AnalysisData
Response Check
Scorecard Portfolioanalysis
Benchmark &Customized Report
Global Real Estate IndustryParticipants, Company and Fund Manager Members
Capital MarketInvestor Members
Service ProvidersAssociate Members
Portal
Industry AssociationsPartners and Supporters
Public Results
GRESB collects information regarding the sustainability performance of property companies and funds via its annual online Survey. The Survey opens on April 1 and participants have a three-month period to complete the Survey. After the Survey closes, GRESB validates and analyzes all participants’ Survey submissions. The benchmark results are then published in September of each year and distributed to all participants, Company and Fund Manager Members and Investor Members via a secure online Portal. In addition to this secure Portal, GRESB has developed additional online resources. These resources, accessible via the GRESB website, contain additional analysis and data, together with topic-specific innovation case studies collected from the benchmark participants.
Participants:Measure the sustainability im-pact and risk of their portfolios and communicate their perfor-mance to the capital market.
Investor Members: Use the benchmark results to evaluate the sustainability per-formance of their investment portfolios and to engage with their investments.
Associate Members:Provide essential added value by offering services and solu-tions to develop participants' sustainability performance.
Partners: Industry associations that sup-port GRESB's mission to en-hance and protect shareholder value in the real estate industry.

4
Data Collection and Validation
Data validation is an important part of GRESB’s annual benchmarking process. Its purpose is to develop data qual-ity. It is therefore the most critical component of GRESB’s roadmap to investment grade data.
All data submitted by GRESB participants is included in an extensive validation procedure. However, in 2014, GRESB added two additional layers to its validation process. The new framework has been developed by GRESB,4 and is man-aged and implemented by the GRESB team using an online system, developed specifically for GRESB, and tailored to its three-layer validation process. The validation process con-
tinued from the start of the Survey period until August 2014.
All Participant Checks Ű Checks on all Survey participants;
Ű 176 data point checks across all Survey Aspects;
Ű Validation is per question with a secondary review system;
Ű Focus on open text boxes and open fields, including green building certificates;
Ű Supplemental check to confirm the existence of sup-porting evidence for questions requiring documen-tary evidence (uploaded document or details of the name and date of the document);
Ű In total, the GRESB team validated over 16,000 open text boxes and open fields;
Ű In addition, GRESB completed automated outlier checks on Performance Indicator data. These checks were incorporated into the GRESB Portal.
Validation Plus Ű Validation of data for 50 participants;
Ű Automatic, random selection via the GRESB Portal, using a pre-defined algorithm;
Ű 99 data point checks per selected participant;
4 GRESB worked with PwC to develop the data validation approach described above. PwC has not provided an audit, accounting or attest opinion, and PwC has not verified or audited any of the information in this Report. PwC shall not be responsi ble or liable for any advice given to third parties, any investment decisions or trading, or any other actions taken based on information contained in the Report.
Ű Validation is per participant with a secondary review system;
Ű Document review of all uploaded documents provid-ed to support a question response. Where no docu-ment was provided, the GRESB team contacted the participant to request the document;
Ű Combined with the All Participant Checks on docu-mentary evidence, the GRESB team validated over 11,000 uploaded documents.
Site Visits Ű In-depth assessment of data for eight participants;
Ű Automatic, random selection within the regions with the most participants: Asia Pacific (three checks in-cluding Australia), Europe (three checks including the United Kingdom) and North America (two checks, both United States);
Ű 95 data point checks per selected participant;
Ű Focus on the mapping of the portfolio (Reporting and Entity Characteristics), and the Policy & Disclosure, Monitoring & EMS, and Performance Indicator As-pects;
Ű Validation is per participant.
Outcomes of the validation processThis is the first year that GRESB operated its extended val-idation process. The process will be further developed in phases over the coming two-year period (2015-2016).
With the phased approach in mind, in 2014:
Ű Where possible, in the case of Reporting Character-istics and Performance Indicator data (energy, water consumption, GHG emissions and waste), GRESB gave participants the opportunity to correct errors in their submissions.
Ű For other data and where it was not possible to cor-rect Performance data, an invalid answer or one for which insufficient supporting evidence was provided (where required) received no points. GRESB did not impose penalty points for invalid data.
Ű The validation level for the submission is disclosed in a participant’s Scorecard and Benchmark Re-port. GRESB also discloses whether or not a ques-tion response received points. However, the detailed outcomes from the validation process are kept confi-dential and are only disclosed to the participant.
Ű Finally, those participants with significant errors in their data may automatically be included in the 2015 Validation Plus process, the purpose of which is to ensure that GRESB gives participants the tools they need to submit an accurate benchmark response. Par-ticipants will be kept informed of the 2015 validation process.
Validation Plus
SiteVisit
All Participant Check
Reporting boundaries
Data quality
Evidence for answers
Open textboxes (quality)
Open-endedquestions
Hyperlinks
Evidence (uploads)
Data accuracy
100%
8%
1%

5
Scoring and Methodology
Scoring modelThe GRESB Survey is structured into seven unique sustain-able Aspects, plus a separate Aspect for New Construction & Major Renovations. The weighted scores for each of the seven Aspects combined generate the overall GRESB score.
The scoring model is based on an automated system, which uses a technology platform designed for GRESB by a third party that specializes in data analysis software develop-ment. The scoring is completed without manual intervention after data validation has been completed.
The sum of the scores for each question adds up to a max-imum of 137.5 points, and the overall GRESB score is then expressed as a percentage – from 0 to 100. The maximum score for each Aspect is a weighted element of the overall GRESB score. GRESB takes into account the unique charac-teristics of different property types, not only in benchmark-ing, but also in the scoring of a selection of questions. Where a portfolio contains multiple property types, a selection of questions is scored based on each of that portfolio’s main property type – this holds specifically for the Performance Indicators and Building Certifications Aspects.
Survey Aspect Absolute Points Weight
Management 12 8.7%
Policy & Disclosure 14 10.2%
Risks & Opportunities 16 11.6%
Monitoring & EMS 13 9.5%
Performance Indicators 32.5 23.6%
Building Certifications 15 10.9%
Stakeholder Engagement 35 25.5%
Participants reporting on new construction and major reno-vation projects, can complete the additional New Construc-tion & Major Renovations (NC&MR) Aspect, for which they receive a separate Aspect score that is not included in the overall GRESB score. Participants reporting on new con-struction and major renovation projects will also receive a “Development” score. This score is based on a subset of questions from Aspects 1 to 7, and includes the score for the NC&MR Aspect. Participants reporting on new construction and major renovation projects only (“developments only” participants) are excluded from the analysis for Aspects 1 to
7 in this Report.
GRESB Quadrant ModelThe overall GRESB score is divided into two dimensions: Management & Policy and Implementation & Measurement.
Management & Policy is defined as “the means by which a company or fund deals with or controls its portfolio and its stakeholders and/or a course or principle of action adopted by the company or fund.” The maximum score for Manage-ment & Policy is 41.5 points – this is 30 percent of the overall GRESB Score – and is expressed as a percentage.
Implementation & Measurement is defined as “the process of executing a decision or plan or of putting a decision or plan into effect and/or the action of measuring something related to the portfolio.” The maximum score for Implemen-tation & Measurement is 96 points – this is 70 percent of the overall GRESB Score – and is expressed as a percentage.
The scores for Management & Policy (MP) and Implemen-tation & Measurement (IM) are visualized using the GRESB Quadrant Model. In 2014, for the first time, MP appears on the vertical axis while IM appears on the horizontal axis. Each participant is allocated to one of the following quad-rants:
Ű Green Starters: participants with a score of less than 50 on MP, and a score of less than 50 on IM;
Ű Green Talk: participants with a score that is equal or larger than 50 on MP, but a score of less than 50 on IM;
Ű Green Walk: participants with a score of less than 50 on MP, but a score that is equal or larger than 50 on IM;
Ű Green Stars: participants with a score that is equal or larger than 50 on MP, and a score that is equal or larg-er than 50 on IM.
Geographic location and property typeThe geographic location and property type characterization of participants is determined by a pre-set allocation thresh-old. The threshold for determining allocation to a property type is set at 75 percent of the Gross Asset Value (GAV), while the threshold for determining the geographic location is set at 60 percent of the GAV. If a participant does not reach the threshold for allocation to a specific geography, it is allocat-ed to “globally diversified.” Likewise, if a participant does not reach the threshold for allocation to a specific property type, it is allocated to “diversified.” Within the latter, three additional classifications are made: retail/office, residen-tial/office, and industrial/office.

6
Online Report, Products & Services
In addition to its digital 2014 Report, GRESB has also developed additional online materials containing further data and analysis from the 2014 benchmark, together with topic-specific innovation case studies collected from 2014 GRESB partici-pants and 2014 sector leaders.
ScorecardsParticipants’ benchmark results are disclosed in a Scorecard that contains an overview of their GRESB perfor-mance. Using the GRESB Quadrant model, it highlights both absolute per-formance and performance relative to peers. The Scorecard also highlights areas for improvement and contains valuable information both for property companies and funds that are starting to implement sustainability practices into their portfolios, as well as industry leaders.
Benchmark Reports and Customized ReportsGRESB’s Benchmark Reports provide an in-depth analysis of a participant’s sustainability performance. In addition to the information in the Scorecard, the Benchmark Report contains a detailed question-by-question comparison with peers, which helps participants to de-velop detailed improvement plans and to improve scores.
Participants can also request Custom-ized Benchmark Reports, which pro-vide an alternative comparison and ranking based on a customized peer group composition, selected by partic-ipants.
Member PortalCompany and Fund Manager Members can view and download individual Benchmark Reports for each of their portfolios via GRESB’s Member Portal. Additionally, using the online Portfo-lio Analysis tool, Company and Fund Manager Members are able to compare results per region or country, or per property type. They are also able to undertake portfolio analysis for self-se-lected groups of their portfolios.
Products & ServicesThe GRESB benchmark results allow participants to identify the areas in which they can improve their sustainability per-formance, both in absolute terms as well as relative to peers. The results can be used globally by both investors and man-agers of real estate investments to improve sustainability performance, by lowering operating costs and meeting regulatory requirements, and by satisfying the developing preferences of corporate tenants. Benchmark participants can also use the results as a toolkit for internal and external engagement.
REPORT
2014 Overall Scores
REPORT
Global Leaders
REPORT
Aspects
REPORT
Innovation Case Studies
REPORT
2014 Coverage
REPORT
Scoring & Validation

7
Global Results
Overall scores GRESB’s global benchmark uses a consistent methodology across different regions, investment vehicles and property types, evaluating the sustainability performance of both pri-vate and listed real estate portfolios. Over the past five years, participation in GRESB has continued to increase, a sign of the global real estate’s industry’s uptake and acceptance of sustainability as part of general real estate investment management practices. In 2014, a total of 637 property com-panies and funds participated in the GRESB Survey, an in-crease of 17 percent compared to 2013 (543 participants), an increase of 44 percent compared to 2012 (443 participants), and almost double the response rate of 340 in 2011. GRESB now covers about 56,000 assets, with an aggregate value of USD 2.1 trillion, a 31 percent and 62 percent increase as com-pared to 2013 and 2012, respectively.
For listed property companies (the majority of which are Real Estate Investment Trusts), the response rate increased by 31 percent to 156 participants, compared to an increase of 25 percent in 2013. GRESB now covers 52 percent of the FTSE EPRA/NAREIT Developed Index, with regional coverage of 38 percent in Asia Pacific, 76 percent in Europe, and 51 per-cent in North America. The response rate for private entities (including private equity real estate funds, non-listed prop-erty companies, developers, JVs, etc.) increased by 13 per-cent to a total of 481. Of these non-listed entities, 61 percent are characterized as Core, 26 percent as Value Added, and 13 percent as Opportunistic.
GRESB assesses both portfolios with standing investments and portfolios with new construction and major renovation projects. In 2014, 97 percent of participating entities had
operating buildings in their portfolio during the reporting period. 348 entities manage standing investments only, while 269 entities manage standing investments as well as new construction and major renovation projects. 3 per-cent (20 participants) are “development only” participants – these do not have any standing investments and merely focus on new construction and major renovation projects.
Property type allocations for each participating entity are based on gross asset value (GAV). Using a 60 percent thresh-old, GRESB classifies each property company and fund as a single property type, or as diversified. The main proper-ty types included in the benchmark are office (19 percent), retail (18 percent), a combination of office and retail (13 percent), residential (8 percent), and industrial (7 percent). Other increasingly frequent property types are, for example, hotels and healthcare.
0
200,000
400,000
600,000
800,000
1,000,000
1,200,000
1,400,000
0
100
200
300
400
500
600
2010 2011 2012 2013 2014
GRESB Response rate developmentListed participants
Listed GAV Private GAV
Private participants
Participants GAV (USD million)
Property types
18% Retail
19% Office
7% Industrial
1% Hotels
8% Residential
13% Retail/Office
4% Other
3% Office/Residential
1% Healthcare
2% Office/Industrial
25% Diversified

8
100
Man
agem
ent &
Pol
icy
Implementation & Measurement
50
0
0 50 100
2011
20122013
2014Listed
Private
GRESB Quadrant ModelThe GRESB Quadrant Model shows the sustainability perfor-mance for all Survey participants, based on their score for each of GRESB’s two dimensions: Management & Policy (MP, in 2014 on the vertical axis) and Implementation & Measure-ment (IM, in 2014 on the horizontal axis). A participant’s po-sition in the GRESB Quadrant Model explains how far it has progressed in integrating sustainability into its portfolio. A participant will move between each quadrant based on its performance on Implementation & Measurement (70 percent weight) and Management & Policy (30 percent weight).
The 2014 benchmark results show the progress both of the relative performance of individual participants (compared to peers) as well as absolute performance (reflected in the total GRESB score). The overall GRESB score for all participants combined has increased by 9 points and is now 47 (out of 100). This is mainly driven by an increase in the Implementa-tion & Measurement score (+23 percent), which counteracts a decrease in the Management & Policy score (-11 percent).
Of course, these changes reflect the combined effect of mul-tiple developments in the benchmark. First, in 2014, GRESB had 156 first-time participants. As these participants have a score that is, on average, 11 points lower than the average for all participants combined, this has an effect on the over-all development of the score. Second, GRESB has changed some of the Survey questions, introduced scoring of qual-itative questions (i.e. narratives), and evaluated the pres-ence of documentary evidence for a selection of questions. Third, and most important, many existing participants have started to implement sustainability programs and improvements, leading to a stronger GRESB performance.
Generally, the results show significant improvement of par-ticipants’ individual scores; organizations seem to be more adept at dealing with sustainability issues and more aware of the importance both of implementing policies and of proper monitoring and reporting on ESG metrics. Overall this has resulted in a strong increase in the sustainability performance of the global real estate industry.
As GRESB participants have started to implement sustain-ability policies, and are improving their management of governance issues as well as their environmental and so-cial impact, the proportion of participants in each quadrant changes. This year, 36 percent of participants are Green Stars, up from 22 percent in 2013, while the number of Green Walk participants increased from 1 percent to 3 percent. The proportion of Green Talk participants has decreased to 23 percent (compared to 50 percent last year). 38 percent of benchmark participants are Green Starters, up from 28 per-cent in 2013, something that is linked to the large number of new participants in 2014.
In 2014, listed companies obtained a 7 points higher score, on average, compared to private participants, and the over-all listed participant’s score in 2014 now stands at 52.
GRESB Global average scores (2011-2014)
Green Talk
Green Starters
Green Stars
Green Walk

North America151 participants 24,287 assets920 USD billion GAV48 Green Stars
Asia92 participants1,785 assets274 USD billion GAV25 Green Stars
Australia/New Zealand44 participants1,129 assets131 USD billion GAV30 Green Stars
Europe328 participants28,498 assets698 USD billion GAV115 Green Stars
South America10 participants144 assets4 USD billion GAV1 Green Star
Globally Diversified7 participants212 assets39 USD billion GAV2 Green Stars
Africa5 participants458 assets12 USD billion GAV
2013
115
15,398
587
21
2013
8
132
3
2013
10
3356
62
2013
292
26,989
652
53
2013
74
1,528
157
16
2013
42
1,109
111
29
2013
2
204
6
9
Response Rate per Region
... more about Global Leaders

10
Regional Results
GRESB analyzes the Survey results separately per region, for North America, Europe, Asia, and Australia/New Zealand (NZ). This regional analysis excludes data for companies and funds that GRESB allocates to South America (8) and Africa (5), and globally diversified portfolios (7). See GRESB geographic location and property type allocation thresholds (Scoring & Methodology section).
Regional response rateThe number of 2014 GRESB participants with the majority (at least 60 percent) of their portfolio allocated to North Ameri-ca now stands at 151, an increase of 31 percent as compared to 2013. This is mainly the result of a strong increase in par-ticipation by private entities (35 percent, to 131). Most portfo-lios are allocated to the United States (141 participants), the remainder to Canada (9 participants). The response rate in Europe increased by 12 percent to 328 participants, mainly driven by a strong increase in participation by listed com-panies (40 percent). Most European portfolios are allocated to the UK (111 participants), followed by the Netherlands (39 participants), France (22 participants) and Germany (20 participants). The response rate in Asia has increased by 24 percent to a total of 92 participants. This increase is even-ly spread across listed companies and private entities. Most portfolios are allocated to Japan (31), followed by China (21), and Singapore (13). The response rate for Australia/NZ re-mains relatively stable, with an increase of 5 percent to 44 participants. 43 of these portfolios are allocated to Australia and 1 to New Zealand.
Regional performanceIn terms of overall performance, as in previous years, Aus-tralia/NZ is the leading region, with a score of 61, although
there has been a slight decrease of 4 percent compared to last year’s score (57). Europe scores second highest, with a score of 47, an increase of 8 percent compared to last year (44). Overall performance in Asia has increased most signif-icantly, by 23 percent from 37 to a score of 46 this year. Asia now slightly outperforms North America, even though the overall score for North America increased from 39 to 44, an improvement of 13 percent.
In 2014, the number of Green Stars increased in all regions. Australia/NZ performs strongest in terms of regional Green Stars. 70 percent of the total participants for Australia/NZ are Green Stars, compared to 32 percent of participants in North America and Asia. In Europe, 35 percent of property companies and funds are Green Stars. Europe also has a rel-atively large number of Green Talk participants: 29 percent of European participants have a Management & Policy score that is above 50 and an Implementation & Measurement score that is below 50. In Australia/NZ this percentage is 25 percent, while for North America and Asia it is about 12 per-cent.
Strengths and opportunitiesOverall, strengths and opportunities in each of GRESB’s Sur-vey Aspects are broadly similar across regions. North Amer-ica performs strongly in the Risks & Opportunities Aspect (ranked second out of four regions), where GRESB examines steps being taken to address sustainability risks and to im-plement activities to improve performance. The region also performs well on Building Certifications (ranked second), where GRESB examines participants’ use and monitoring of building certification and energy rating schemes within their portfolios. While overall Europe scores less well on Risks & Opportunities, the region performs solidly overall, and is
TotalNorth
America Europe AsiaAustralia/
NZSouth
America AfricaGlobally
diversified
Listed no of participantsDevelopment only participants
1543
370
651
352
100
10
20
40
Gross asset valueUSD million
1,159,754 481,553 354,922 218,627 59,792 952 8,013 35,894
Average sizebased on GAV in USD million
7,531 13,015 5,460 6,246 5,979 952 4,007 8,974
Market coverage* 52% 53% 76% 38% 82%
Private no of participantsDevelopment only participants
48317
1140
2631
5713
341
92
30
30
Gross asset valueUSD million
920,065 436,569 343,441 55,400 71,532 4,209 3,704 3,210
Average sizebased on GAV in USD million
1,905 3,847 1,306 972 2,104 468 1,235 1,070
Total no of participantsDevelopment only participants
63720
1510
3282
9215
441
102
50
70
Gross asset valueUSD million
2,079,819 920,123 698,364 274,027 131,324 5,161 11,717 39,104
Average sizebased on GAV in USD million
3,265 6,094 2,129 2,979 2,985 516 2,343 5,586
* Based on the FTSE EPRA/NAREIT market index

11
100
Man
agem
ent &
Pol
icy
Implementation & Measurement
50
0
0 50 100
Other
North AmericaAsiaEurope
Australia/NZ
Average global GRESB scores per region
Asia
North America
100
75
50
25
63%
63%
29%
41%
52%
48%33%
39%
100
75
50
25
67%
61%
35%
44%
53%
58%22%
42%
Europe
100
75
50
25
72%
58%
32%
46%
61%
55%32%
42%
Australia/NZ
100
75
50
25
85%
79%
47%
64%
70%
69%34%
56%
Risks & Opportunities
Monitoring & EMS
Performance Indicators
Building Certifications
Stakeholder Engagement
New Construction &Major Renovations
Management
Policy & Disclosure
ranked second or third for all other Aspects. Asia scores rel-atively well on the Monitoring & EMS Aspect, where GRESB examines steps taken to monitor compliance with sustaina-bility policies, objectives and targets, but less well on Build-ing Certifications compared to the other three regions.
Australia/NZ outperforms the other three regions for all As-pects. The region scores relatively well on Performance In-dicators, in which GRESB examines collection of resource consumption data and annual changes in energy, water,
waste and GHG emissions. GRESB’s weighting of this Aspect in its scoring methodology underlines its belief that man-agement of performance data is the basis for improvement. Australia/NZ’s performance for this Aspect is reflected in its continued strong overall performance. However, in 2014 environmental performance data availability has increased across all four regions, indicating a commitment by partici-pants globally to gather material information on their port-folios.
Green Talk
Green Starters
Green Stars
Green Walk

12
100
75
50
25
Management
Policy & Disclosure
Risks & Opportunities
Monitoring & EMS
Performance Indicators
Building Certifications
Stakeholder Engagement
New Construction & Major Renovations
54%
69%42%
32%
58%
61%45%
30%
Global Aspect Scores

13
Aspect Overview
The GRESB Survey is structured into seven unique sustain-ability Aspects, together with a separate Aspect for New Construction & Major Renovations. Over the past two Survey years, GRESB has developed the Survey so that it provides property companies and funds, as well as their investors, with a comprehensive overview of the material elements of sustainability within real estate portfolios. The 2014 GRESB data shows that sustainability reporting in the sector is evolving rapidly – this holds for both the quantity as well as the quality of reporting.
The 2014 GRESB Survey results provide detailed insight into the way sustainability is embedded in participants’ organi-zations and their core activities.
ManagementThis section is focused on how an organization addresses sustainability implementation in the context of its overall business strategy. In 2014, 88 percent of participants report-ed that they had available sustainability objectives. Of these, 72 percent have made their objectives publicly available, compared to 44 percent in 2013. 80 percent of participants report that they integrate their sustainability objectives into their overall business strategy.
Policy & DisclosureDisclosure of sustainability performance allows partici-pants to show how sustainability policies and management practices are being implemented and their impact on the business. 84 percent of participants now disclose their sus-tainability performance. 61 percent of this group discloses its performance in a stand-alone sustainability report (2013: 38 percent).
Risks & OpportunitiesSustainability risk assessments help to reduce exposure to long-term risks. In the acquisition process, these assess-ments demonstrate a focus on mitigating risks that might impact returns, and a forward-looking approach to the de-velopment of the portfolio. 81 percent of participants now perform sustainability risk assessments as a standard part of their due diligence process for new acquisitions. Climate risks (55 percent of those undertaking assessments) and cli-mate change-related risks (45 percent) are increasingly as-sessed.
Monitoring & EMSA data management system enables organizations to moni-tor environmental performance in an efficient and effective way. 76 percent of participants now have a data manage-ment system in place, on average covering 87 percent of their portfolio. 52 percent of participants use an external data management system. The most commonly monitored metrics included are energy consumption (95 percent), wa-ter consumption (84 percent), GHG emissions (75 percent), and waste (63 percent).
Performance IndicatorsCollecting and measuring key environmental performance data enables property companies and funds to assess their aggregate consumption and footprint, and to set clear tar-gets for reducing the portfolio’s operational cost and en-vironmental impact. In 2014, the results show an overall reduction in energy consumption of 0.82 percent over the 2012-2013 reporting period (4.8 percent in 2013 for 319 par-ticipants), based on like-for-like data from 508 participants. GHG emissions decreased by 0.31 percent (2013: 2.5 percent) and water consumption decreased by 2.3 percent (2013: 1.2 percent).
Building CertificationsGreen building certificates are a measure of the intrinsic quality of the asset and its design to meet the requirements of environmental standards. In 2014, 22 percent of GRESB participants obtained green building certificates for build-ing design, development and structure, at the time of con-struction. 14 percent of participants obtained green building certifications for operational buildings, based on actual operational data for a specific period. Globally, LEED and BREEAM are the most commonly used schemes.
Stakeholder EngagementImproving the sustainability performance of a real estate portfolio requires not only dedicated resources, a commit-ment from senior management and tools for measurement/management of resource consumption, but also requires the cooperation of other stakeholders, including tenants, sup-pliers, a participant’s workforce and the local community.
Tenant satisfaction surveys identify occupiers’ key issues and concerns, which can then be addressed in improvement measures and/or programs adopted by the landlord. Proper follow-up demonstrates commitment to the tenant engage-ment process, and to developing and maintaining tenant satisfaction. 52 percent of participants now undertake ten-ant satisfaction surveys (2013: 50 percent), on average cover-ing 68 percent of tenants.
Effective implementation of sustainability strategies also includes integration of organizations’ sustainability-specific requirements into their supply chain. 65 percent of partic-ipants include sustainability-specific requirements in their procurement processes.
New Construction & Major RenovationsOn-site renewable energy generation reduces environmental and economic impacts associated with fossil fuel energy use. 35 percent of participants have new construction and major renovation projects that are designed to generate energy from on-site renewable sources (2013: 27 percent). On average, 47 percent of participants’ projects are covered, and 19 percent of the total projected energy use for these projects is expected to be produced on-site.

14
Management
The Management Aspect is focused on how organizations address sustainability implementation in the context of their overall business strategies. The purpose of this Aspect is (1) to identify who in the par-ticipant organization is responsible for managing sustainability issues and has the authority for decision-making on sustainability matters, (2) to communicate to a participant’s investors how it structures manage-ment of sustainability issues and (3) to determine how sustainability is embedded in the organization.
Key outcomesHaving clear sustainability objectives helps to identify material issues and to integrate them into overall day-to-day management. This fosters alignment between management of sustainability issues and the or-ganization’s overall strategy. It also demonstrates commitment to mon-itoring sustainability objectives and to meeting targets. 88 percent of 2014 GRESB participants have specific sustainability objectives, similar to 2013 (87 percent). Of these participants, 72 percent have objectives that are publicly available. 91 percent of participants with sustaina-bility objectives have incorporated those objectives into their overall business strategy.
Staff resourcesAllocating staff resources to the management of sustainability strate-gies contributes to the proper implementation and monitoring of sus-tainability objectives. 94 percent of participants have employees who are responsible for implementation of sustainability objectives. Of these, 91 percent of participants have employees who have sustainabil-ity as one of their responsibilities (2013: 84 percent), while 62 percent have dedicated employees for whom sustainability is a core responsi-bility (2013: 63 percent). Responsibility for the implementation of sus-tainability objectives can also be outsourced: about half (49 percent) of 2014’s participants work with external consultants (2013: 50 percent). There are some interesting regional differences here: in Australia/NZ, 88 percent of participants have a dedicated sustainability employee, as compared to 43 percent in Asia, 51 percent in North America, and 68 percent in Europe.
The existence of a taskforce focused on sustainability issues demon-strates a structured approach towards integration of sustainability across the organization. 88 percent of participants now have a sus-tainability taskforce in place (2013: 84 percent) and 86 percent have the Senior Management Team represented in that taskforce (2013: 74 percent). Other common taskforce members are asset managers (77 per-cent) and fund/portfolio managers (76 percent). ...more
Performance targetsThe inclusion of sustainability factors in performance targets demon-strates that an organization assesses employee performance based on sustainability issues. 75 percent of the 2014 GRESB participants include sustainability factors in the annual performance targets of employees responsible for the property company or fund. Where sustainability factors are included in performance targets, they apply to asset and property managers in respectively 68 and 60 percent of cases, while 63 percent of participants apply sustainability factors to the performance targets of members of the Senior Management Team. For one third (34 percent) they even apply to the Board of Directors.
Sustainability taskforce
Senior Management Team
Asset managers
Fund/portfolio managers
Property managers
Board of Directors
External consultants
Other
86%
77%
76%
55%
49%
33%
44%
86%
77%
76%
55%
49%
32%
45%
Sustainability factors included in annual performance review
Asset managers
Senior Management Team
Property managers
Fund/portfolio managers
Board of Directors
Other
68%
63%
60%
58%
34%
47%
Implementation of sustainability objectives
91%
62%
49%
20%
External consultants/managers
Other
Employee(s) for whom sustainability is one of the responsibilities
Dedicated employee(s)
“There is a growing market of environmentally conscious investors, and we found a Green Bond issuance was a good way to connect our commitment to sustainability with the socially responsible investing community while maintaining our overall goals and strategy.”
— Lisa Palmer, Chief Executive OfficerRegency Centers Corporation

15
Policy & Disclosure
Institutional investors and other shareholders are important drivers for increasing disclosure of environmental, social, and governance perfor-mance data of property companies and funds, while formal policies on sustainability issues help real estate investors understand what sus-tainability criteria organizations are incorporating into their business practices. This Aspect investigates how 2014 GRESB participants dis-close their sustainability performance and the types of sustainability policies they have in place.
Key outcomesDisclosureSustainability disclosure shows how policies and management prac-tices are being implemented by organizations, while alignment of disclosure with recognized standards facilitates a greater and easier understanding of environmental impact on the business. Third-par-ty reviews of sustainability disclosure give investors comfort regard-ing the integrity and reliability of reported information. 84 percent of participants disclose their sustainability performance to their stake-holders. 61 percent of this group now discloses performance in a stand-alone sustainability report (2013: 38 percent). In 74 percent of cases these stand-alone sustainability reports are aligned with leading best practice recommendations, guidelines, and frameworks for sustaina-bility reporting.5
58 percent of participants include disclosure of their sustainability per-formance in their annual reports. Of this group, 61 percent align their reporting with recognized standards. 54 percent of participants that include sustainability performance in annual reports have the infor-mation externally reviewed. Of these participants, 46 percent have the data externally assured or verified. ...more
PoliciesPolicies on sustainability issues assist organizations with the formal and structural integration of sustainability criteria into their business. 87 percent of 2014 GRESB participants have an environmental policy in place. For 97 percent of these participants, this policy includes energy consumption and management (2013: 94 percent). ...more
The existence and content of employee policies assist organizations with management of employee relationships and with ensuring the stability of the group of individuals responsible for managing the or-ganization and the portfolio. 90 percent of all participants have an employee policy in place. These policies mainly include performance and career development (93 percent), health and safety (93 percent), diversity (91 percent) and remuneration (90 percent). Cyber security is now included by 73 percent of the participants that have an employee policy.
5 ANREV, APREA, EPRA and INREV’s Best Practice Recommendations were included as options in the 2014 GRESB Survey, together with the GRI and PRI framework. Participants were also given the opportunity to specify alignment with other standards.
Disclosure of sustainability performance
Dedicated section on the corporate website
Section in annual report
Stand-alone sustainability report
Integrated report
Other
Listed companies
Non-listed entities
Section in entity reportingto investors
Sustainability policies in place for
Climate change
Other
2014 2013
Energy consumption/management
GHG emissions/management
Waste management
Water consumption/management
75%
75%
63%
56%
55%
62%
25%
41%
4%
2%
14%
18%
97%
94%
90%
87%
83%
84%
83%
72%
55%
45%
26%
24%
Not aligned with standard
“Sustainability management is part of our daily business as a real estate investment manager and we continue to see and meet a significant number of ESG related enquiries from our clients.”
— Pieter Hendrikse, Chief Executive Officer EMEACBRE Global Investors

16
Risks & Opportunities
The risks from environmental, social and governance issues can ad-versely impact property companies and funds, and the investment performance of their portfolios. The Risks & Opportunities Aspect in-vestigates the steps taken by 2014 GRESB participants to stay abreast of sustainability-related risks at the organization and portfolio level. Besides looking at ways of identifying and managing risks such as bribery and corruption, climate change, environmental legislation and other material sustainability risks, this Aspect also looks at measures taken to identify and implement opportunities for sustainability im-provements.
Key outcomesRisk assessmentsSustainability risk assessments help to reduce exposure to long-term risks. In the acquisition process, these assessments demonstrate a for-ward-looking approach to the development of the portfolio and a fo-cus on mitigating risks that might impact returns. Risk assessments of standing investments demonstrate an active approach to operational sustainability risk management. 81 percent of participants now per-form sustainability risk assessments as a standard part of their due dil-igence process for new acquisitions, while 77 percent do so for standing investments. For the latter, environmental risks such as landslides and irremediable pollution are most commonly assessed (82 percent). Reg-ulatory risks, including mandatory disclosure schemes, are assessed by 74 percent. Participants also increasingly assess climate risks (55 per-cent) and climate change-related risks (45 percent). Regional compar-isons show that in Australia/NZ, 74 percent of the participants assess climate change-related risks for standing investments, as compared to 42 percent in North America, 43 percent in Europe, and 45 percent in Asia. ...more
OpportunitiesTechnical building assessments are important, both to understand the sustainability performance of the portfolio, and to assess opportuni-ties for improving, among other issues, energy and water efficiency. 61 percent of 2014 GRESB participants perform technical building assess-ments to identify energy efficiency opportunities within the portfolio. In-house and external assessments are almost equally popular. On average, 61 percent of the portfolio is covered. 78 percent of partici-pants have implemented measures to improve the energy efficiency of their portfolio, while 63 percent have done so to improve the portfolio’s water efficiency. For energy efficiency, the most common measures are upgrades and replacements of lighting and HVAC systems (84 and 67 percent respectively). For water efficiency, the placement of high-effi-ciency fixtures is most common (66 percent). ...more
Sustainability risk assessment of standing investments
Environmental
Regulatory
Climate
Climate change
Socio-economic
Other
Window replacements
Wall/roof insulation
HVAC upgrades/replacements
Building energy management systems
Systems commissioning
Installation of efficient electrical appliances
Other
Smart grid/smart building technologies
Lighting upgrades/replacements
31%
38%
28%
21%
46%
46%
40%
28%
74%
45%
43%
42%
77%
55%
53%
52%
85%
82%
75%
61%
82%
77%
83%
81%
84%
67%
32%
29%
10%
8%
7%
5%
11%
Measures to improve energy efficiency
North America Europe
Asia Australia/NZ
“Participating in Demand Response is challenging for commercial real estate owners because of tenant comfort concerns. Kilroy has solved this problem and is very proud that its million square foot Long Beach campus is contributing to the reliability of the grid and reducing operating expenses via participating.”
— Sara Neff, VP of SustainabilityKilroy Realty Corporation

17
Monitoring & EMS
Environmental Management System
15% Yes, aligned
8% Yes, externally verified
13% Yes, externally certified
9% Yes, not aligned
54% No
Data Management System includes
Energy consumption/management
Water consumption/management
GHG emissions/management
Waste management
Refrigerants
Other
95%
84%
75%
63%
30%
25%
79%
79%
71%
85%
86%
66%
59%
54%
35%
55%
41%
42%
46%
37%
51%
7%
13%
40%
3%
24%
6%
3%
3% 2%
3%
84%
79%
77%
13%
17%
80%
7%
7%
38%
20%
3%
4%
8%
82%
32%
27%
23%
22%
22%
51%
41%
38%
32%
45%
Monitoring consumption
Retail IndustrialOffice
Residential Diversified
Energy Water
Based oninvoices
Automatic meter readings
Manual-visual readings
Provided by the tenant
Other
Measuring and monitoring of resource consumption is an important basis for performance improvement. The purpose of the Monitoring & EMS Aspect is to investigate the steps taken by 2014 GRESB participants to monitor implementation of and compliance with their sustainability policies, objectives and targets. Distinction is made between Environ-mental Management Systems (EMS) and data management systems.
Key outcomesMonitoring key environmental performance data (energy and water consumption, GHG emissions and waste) is an important part of iden-tifying and managing environmental issues and improving the portfo-lio’s performance. 87 percent of participants now monitor the energy consumption of their portfolio, while 81 percent monitor water con-sumption (2013: 90 percent and 84 percent, respectively). 81 percent of participants that monitor energy consumption base monitoring on invoices. A similar percentage uses invoices to monitor water consump-tion. On average, portfolio coverage for consumption monitoring via invoices is 76 percent for energy and 79 percent for water. ...more
A data management system enables organizations to monitor perfor-mance efficiently and effectively, for example by integrating building management systems for individual locations across a portfolio. 76 percent of 2014 GRESB participants have a data management system in place, on average covering 87 percent of the portfolio. About half (52 percent) of those participants use an external data management sys-tem. Aspects covered by the system include energy (95 percent), water (84 percent), GHG emissions (75 percent), and waste (63 percent). Oth-er elements frequently covered by data management systems include health & safety indicators and corporate travel.
Environmental Management SystemAn EMS has a broader scope than a data management system. It assists an organization with managing and improving its environmental per-formance and helps the business to comply with environmental laws and regulations. It can generate financial savings through more effi-cient operating practices, and can improve the standing of the business with staff, client companies, partner organizations and other stake-holders. The existence of an EMS demonstrates a structured approach towards measuring and managing sustainability performance. 46 per-cent of participants have an EMS in place (2013: 43 percent). EMSs are most common in Europe and Australia/NZ (for both regions, 53 percent of participants use an EMS), while 43 percent of participants in Asia and 32 percent of participants in North America have an EMS in place. ...more
“Incorporating new technologies into property operations demonstrates how our Responsible Property Investment focus is integrated into all operational aspects of our fund strategies.”
— Matthew H. Lynch, Head of Global Real Estate USUBS Trumbull Property Fund

18
Performance Indicators
Buildings and their occupants use a significant amount of natural re-sources, such as electricity, gas and water, and produce major quanti-ties of waste. The Performance Indicator Aspect assesses consumption and efficiency, providing insight into opportunities for increasing data coverage and the resource efficiency of real estate portfolios.
Key outcomesEnergy consumptionThe collection of energy consumption data has been challenging for the real estate sector, and the mere availability of data within prop-erty portfolios is a crucial metric. Continuing the positive trend docu-mented in previous years, in 2014 data availability has increased for all property types. Data availability in residential portfolios has increased the most as compared to 2013. Data is now available for 65 percent of GRESB participants with residential assets in their portfolio (2013: 51 percent). Participants with offices and retail shopping centers have the most data available (on average 80 and 79 percent of GRESB partici-pants with respectively office and retail shopping center assets in their portfolio). For hotels (43 percent) and retail high street (53 percent) data availability is relatively low, as well as for property types desig-nated as “other” (this includes leisure, parking garages, data centers, etc.), for which data availability is 31 percent.
GRESB also measures the portfolio coverage of consumption data per property type – whether the data includes consumption in common ar-eas, tenant areas, or both. In 2014, whole portfolio coverage is highest in office portfolios (average of 67 percent coverage) followed by retail shopping centers (average of 66 percent). Data coverage for hotels and retail high street is lower (35 and 34 percent, respectively). However, the coverage increased substantially as compared to 2013 (by 8 percent in both cases).
The implementation of energy efficiency improvements should ulti-mately result in reduction of energy consumption. Therefore, GRESB assesses the change in consumption of a “like-for-like” (or same store) portfolio. In 2014, the like-for-like change in energy consumption is -0.82 percent between 2012 and 2013, a total of 397,074 MWh, equivalent to 24,982 homes, based on data provided by 508 participants. A sub-stantial difference compared to the -4.8 percent change between 2011 and 2012, based on data provided by 319 participants. ...more
Energy use intensitiesEnergy use intensities (where energy consumption is standardized by a variety of metrics) are a key metric for measuring the energy perfor-mance of a building. These metrics vary across regions, property types, and even within countries, but typically include building size, occu-pancy, and weather. When calculated correctly, energy use intensity metrics are building-agnostic and can be used for tracking and compar-ing portfolio performance over time. In 2014, GRESB started to collect
Data availability (%)
Retail, High Street
Industrial, Distribution Warehouse
Office
Hotels
Retails, Shopping Center
Industrial, Manufacturing
Retail, Warehouse
Residential Other
0%
15%
30%
45%
60%
75%
90%
2009 2010 2011 2012 2013
Whole portfolio coverage (%)
Like-for-like change energy consumption (2012-2013)
Retail, High Street
Retail, High Street
Industrial, Distribution Warehouse
Industrial, Distribution Warehouse
Office
Office
Hotels
Hotels
Retails, Shopping Center
Retails, Shopping Center
Industrial, Manufacturing
Industrial, Manufacturing
Retail, Warehouse
Retail, Warehouse
Residential
Residential
Other
Other
0%
15%
30%
45%
60%
75%
90%
2009 2010 2011 2012 2013
RHS RSC RWH OFF IDW IM RES HOT OTH -5%
-4%
-3%
-2%
-1%
0%
1%
2%
3%
“We are thrilled to partner with a local utility and solar provider for our solar array at Weston Corpo-rate Center. The installation has been a tremendous success utilizing renewable energy sources to both reduce our carbon emissions and energy cost and contributing to our achievement of a LEED Platinum certification.”
— Mike LaBelle, Chief Financial OfficerBoston Properties

19
basic data on participants’ use of energy use intensities with a view to further developing its assessment in the future, once the consistency and accuracy of intensity calculations have further developed. Of par-ticipants that provided energy consumption data, an encouraging 72 percent also provided data on energy use intensities. ...more
The use of renewable energy reduces the economic and environmen-tal impact associated with fossil fuel energy use. Of the 2014 GRESB participants that have energy consumption data, 25 percent now have data on renewable energy consumption and/or generation. Renewable energy is mostly present in industrial manufacturing and retail ware-house portfolios (39 and 32 percent respectively of participants with these property types included in their portfolios), followed by offices (29 percent) and Retail Shopping Centers (28 percent).
GHG emissionsAn increasing number of countries have introduced mandatory GHG emissions reporting, in addition to organizations often setting their own voluntary GHG emission targets. Among 2014 GRESB participants, 50 percent collect and calculate GHG emission data. In 2014, the like-for-like change in GHG emissions is -0.31 percent between 2012 and 2013, a total of 69,283 metric tonnes, equivalent to 14,586 cars off the road, based on data provided by 434 participants. Compared to 2.5 percent between 2011 and 2012, based on data provided by 264 partic-ipants. ...more
Water consumption and waste managementConsistent collection of water consumption data gives property com-panies and fund managers the information they need to monitor their environmental impact with the aim of reducing the burden on potable water consumption and wastewater systems, and to assess their risk of exposure to disruptions in water supplies, and increases in the cost of water. Water consumption data is reported by 44 percent of 2014 GRESB participants. In 2014, the like-for-like change in water consumption is -2.3 percent between 2012 and 2013, a total of 8,275,660 m3, equivalent to 3310 Olympic swimming pools, based on data provided by 462 par-ticipants. ...more
Consistent collection of waste data allows organizations to monitor their waste generation and process efficiency, with the aim both of de-veloping more efficient waste management processes and reducing the amount of waste produced. 27 percent of 2014 participants report abso-lute waste data. ...more
Environmental performance targets guide employees and help busi-nesses to benchmark improvements in performance. In 2014, 49 per-cent of all GRESB participants and 63 percent of all listed participants have defined long-term targets. ...more
Third-party checks on dataThird-party checks on sustainability disclosure give investors com-fort regarding the integrity and reliability of reported data. Across all property types, 37 percent of GRESB participants that collect energy consumption data have their data reviewed by an independent third party. 61 percent of participants that collect energy consumption data have undertaken external checks, 12 percent have undertaken external verification and for 27 percent the data was externally assured. ...more
Long-term reduction targets
42%
30%
34%
22%
30%
22%
25%
18%
8%
5%
Long-term target 2013 target
Energy consumption
GHG Emissions
Water consumption
Waste diverted from landfill
Other
“The GPT Group’s commitment to the sustainability of its assets is exemplified by the advancements it has made in the handling of waste management, material recovery and reuse in its portfolio.”
— Michael Cameron, CEO & Managing DirectorThe GPT Group
Like-for-like change
Energy Consumption
GHG Emissions
Water Consumption
-397.074 MWh
-69,283 metric tonnes
-8,275,660 m3
Absolute change equivalent to
24,982 Homes
Absolute change equivalent to
14,586 Cars off the road
Absolute change equivalent to
3,310 Olympic swimming pools
508 participants
434 participants
462 participants
20
Building Certifications
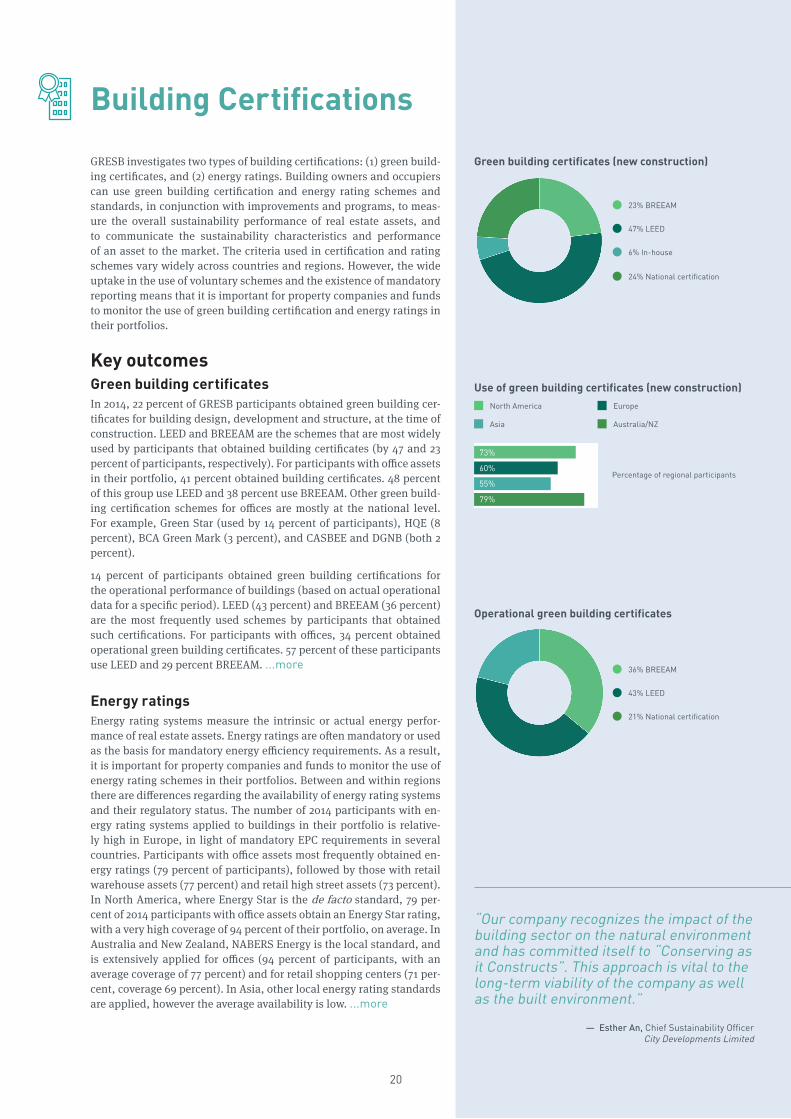
GRESB investigates two types of building certifications: (1) green build-ing certificates, and (2) energy ratings. Building owners and occupiers can use green building certification and energy rating schemes and standards, in conjunction with improvements and programs, to meas-ure the overall sustainability performance of real estate assets, and to communicate the sustainability characteristics and performance of an asset to the market. The criteria used in certification and rating schemes vary widely across countries and regions. However, the wide uptake in the use of voluntary schemes and the existence of mandatory reporting means that it is important for property companies and funds to monitor the use of green building certification and energy ratings in their portfolios.
Key outcomesGreen building certificatesIn 2014, 22 percent of GRESB participants obtained green building cer-tificates for building design, development and structure, at the time of construction. LEED and BREEAM are the schemes that are most widely used by participants that obtained building certificates (by 47 and 23 percent of participants, respectively). For participants with office assets in their portfolio, 41 percent obtained building certificates. 48 percent of this group use LEED and 38 percent use BREEAM. Other green build-ing certification schemes for offices are mostly at the national level. For example, Green Star (used by 14 percent of participants), HQE (8 percent), BCA Green Mark (3 percent), and CASBEE and DGNB (both 2 percent).
14 percent of participants obtained green building certifications for the operational performance of buildings (based on actual operational data for a specific period). LEED (43 percent) and BREEAM (36 percent) are the most frequently used schemes by participants that obtained such certifications. For participants with offices, 34 percent obtained operational green building certificates. 57 percent of these participants use LEED and 29 percent BREEAM. ...more
Energy ratingsEnergy rating systems measure the intrinsic or actual energy perfor-mance of real estate assets. Energy ratings are often mandatory or used as the basis for mandatory energy efficiency requirements. As a result, it is important for property companies and funds to monitor the use of energy rating schemes in their portfolios. Between and within regions there are differences regarding the availability of energy rating systems and their regulatory status. The number of 2014 participants with en-ergy rating systems applied to buildings in their portfolio is relative-ly high in Europe, in light of mandatory EPC requirements in several countries. Participants with office assets most frequently obtained en-ergy ratings (79 percent of participants), followed by those with retail warehouse assets (77 percent) and retail high street assets (73 percent). In North America, where Energy Star is the de facto standard, 79 per-cent of 2014 participants with office assets obtain an Energy Star rating, with a very high coverage of 94 percent of their portfolio, on average. In Australia and New Zealand, NABERS Energy is the local standard, and is extensively applied for offices (94 percent of participants, with an average coverage of 77 percent) and for retail shopping centers (71 per-cent, coverage 69 percent). In Asia, other local energy rating standards are applied, however the average availability is low. ...more
Green building certificates (new construction)
23% BREEAM
6% In-house
24% National certification
47% LEED
Operational green building certificates
36% BREEAM
21% National certification
43% LEED
“Our company recognizes the impact of the building sector on the natural environment and has committed itself to “Conserving as it Constructs”. This approach is vital to the long-term viability of the company as well as the built environment.”
— Esther An, Chief Sustainability OfficerCity Developments Limited
73%
60%
55%
79%
Use of green building certificates (new construction)North America Europe
Asia Australia/NZ
Percentage of regional participants

21
“For our company, focus on sustainability is important in order to maintain a strong relationship with our stakeholders, to ensure sustainable revenues for our investors, and to provide attractive lease areas for our tenants.”
— Michael Keller, Global Sustainability Co-ordinatorAXA Real Estate Investment Managers
StakeholderEngagementImproving the sustainability performance of a real estate portfolio not only requires dedicated resources, commitment from senior management and tools for measurement/management of resource consumption, but also involves the cooperation of other stakeholders, including tenants, suppliers, the organization’s workforce and the local community. The Stakeholder Engagement Aspect identifies the steps taken by participants to engage with those stakeholders and the nature of the engagement.
Key outcomesEmployeesEmployees are critical for any company: a more skilled and aware workforce enhances organizations’ human capital, and may help to improve employee satisfaction, which, in turn, can contribute towards improved business performance. Regular training for employees is now common, provided by 96 percent of the 2014 GRESB participants (2013: 91 percent). On average, 92 percent of employees received training, while 49 percent received sustainability-specific training. ...more
Employee satisfaction surveys help organizations to understand criti-cal issues in the business, engage with their staff and increase employ-ee satisfaction, which contributes towards improving retention rates and overall productivity. The 2014 GRESB data shows that 67 percent of property companies and funds undertook an employee satisfaction survey, equal to 2013. The average response rate was 79 percent, with independent third parties undertaking 72 percent of surveys. All partic-ipants that undertook an employee satisfaction survey have a program in place to improve their employee satisfaction, based on the survey outcomes. This mostly includes feedback sessions with the Senior Man-agement Team (95 percent) or with separate teams or departments (83 percent), and the development of action plans (82 percent). ... more
Tenants/occupiersAn effective tenant engagement program facilitates communication between tenant and landlord and provides the means by which ten-ants’ suggestions and concerns can be integrated into operational and sustainability decision-making. 72 percent of 2014 GRESB participants have a tenant engagement program in place that includes sustainabil-ity-specific elements (2013: 73 percent). The most common elements included are tenant engagement meetings (74 percent), tenant sus-tainability guides (67 percent) and providing tenants with feedback on energy/water consumption and waste (64 percent). 35 percent also provide tenant sustainability training.
Tenant satisfaction surveys identify key issues and concerns, which can then be addressed in improvement measures and/or programs adopted by the landlord. Proper follow-up demonstrates commitment to the tenant engagement process, and to developing and maintaining tenant satisfaction. 52 percent of participants now undertake tenant satisfaction surveys (2013: 50 percent), on average covering 68 percent of tenants. The average response rate is 53 percent. Almost all partic-ipants that undertake a survey have a program in place to improve tenant satisfaction based on the survey outcomes (99 percent). Most common actions are feedback sessions with asset/property managers (92 percent) and with individual tenants (76 percent), followed by de-velopment of asset-specific action plans (72 percent).
Having a tenant fit-out and refurbishment program in place helps to align the views and actions of landlords and tenants at an early stage.
Employee satisfaction improvement programs
95%
83%
82%
23%
Feedback sessions with Senior Management Team
Development of action plan
Other
Feedback sessions with separate teams/departments
Sustainability-specific requirements in standard lease contracts
Sharing of utility dataEnergy-efficient and/or environmentally responsible specifications for tenant worksInformation sharing relevant to green building certificatesLandlord/tenant information for mandatory energy rating schemes
Mutual environmental performance targets
Other
77%
64%
53%
41%
38%
24%
Tenant engagement programs
Tenant engagement meetings
Tenant sustainability guide
Sustainability awareness events
Building/asset communication
Tenant sustainability training
Other
74%
67%
64%
56%
52%
35%
6%
Tenant feedback on resource consumption and waste

22
Guidance and support from the start of the lease reinforces the impor-tance placed on sustainability issues and creates a basis for operating and using the building in a sustainable way. Half of all participants (49 percent) have a fit-out and refurbishment program in place for tenants including sustainability-specific issues (2013: 44%). ...more
The content of lease contracts is the starting point for the landlord/ten-ant relationship, and defines both parties’ respective rights and duties. Including sustainability-specific lease clauses creates tenant aware-ness, encourages mutual commitment, and empowers landlords to positively influence tenant behavior. In 2013, when GRESB asked about implementation of Green Leases and Memoranda of Understanding (MoUs), 29 percent made use of Green Lease formats and 6 percent used MoUs. This year, 43 percent of GRESB participants include sustaina-bility-specific requirements in their standard lease contracts. The most popular provision is a clause regarding the sharing of sustainability-re-lated data: 77 percent of participants include clauses requiring sharing of utility data, while 53 percent include clauses requiring the sharing of information that is relevant to green building certificates. Only 38 per-cent of participants have mutual environmental performance targets in place. ...more
Supply chainEffective implementation of sustainability strategies includes integra-tion of organizations’ sustainability-specific requirements into their supply chain. 65 percent of property companies and funds include such sustainability-specific requirements in their procurement processes. Requirements are mostly imposed on external contractors (81 percent) and external service providers (80 percent), followed by external prop-erty/asset managers (73 percent) and external suppliers (71 percent).
Independent monitoring of suppliers is important to back up organiza-tions’ sustainability claims. It also sends a strong message to suppliers, increases transparency and highlights potential supply chain problems that need to be rectified. 60 percent of participants monitor external property/asset managers’ compliance with the sustainability-specif-ic requirements in place (2013: 58 percent), while 62 percent monitor the compliance of other direct external suppliers and service providers (2013: 55 percent). Participants monitoring their supply chain mostly hold regular meetings (80 percent) or receive update reports (73 per-cent). 41 percent of participants check the alignment of their supply chain with applicable professional standards.
CommunityCommunity engagement is important for assessing the local impact of the operation of the asset. A structured and comprehensive approach to community engagement contributes towards development of more prosperous and sustainable communities. 64 percent of all participants have a community engagement program in place that includes sustain-ability-specific issues (2013: 69 percent). Of those that have a program, a large share of participants supports charities and community groups (93 percent). 51 percent of participants have a sustainability education program, while 40 percent have a health and well-being program. 48 percent focus on effective communication and processes that address community concerns. ...more
Supply chain’s compliance with sustainability-specific requirements
80%
73%
54%
41%
12%
Supply chain meetings
Supply chain update reports
Checks performed by external consultantsSupply chain alignment with applicable professional standards
Other
Community engagement program
93%
51%
48%
46%
45%
43%
40%
13%
Supporting charities and community groups
Sustainability education programEffective communication and process to adress community concernsSustainability enhancement programs for public spaces
Research and network activities
Employment creation in local communities
Health and well-being program
Other
“CCT strives to not only be a provider of good quality office space with conducive work environment, but also be an environmentally responsible landlord. We started CCT Eco Race with a view to engaging our tenants in promoting practical ways in protecting the environment with fun and healthy activities.”
— Lynette Leong, Chief Executive Officer
Capita Commercial Trust
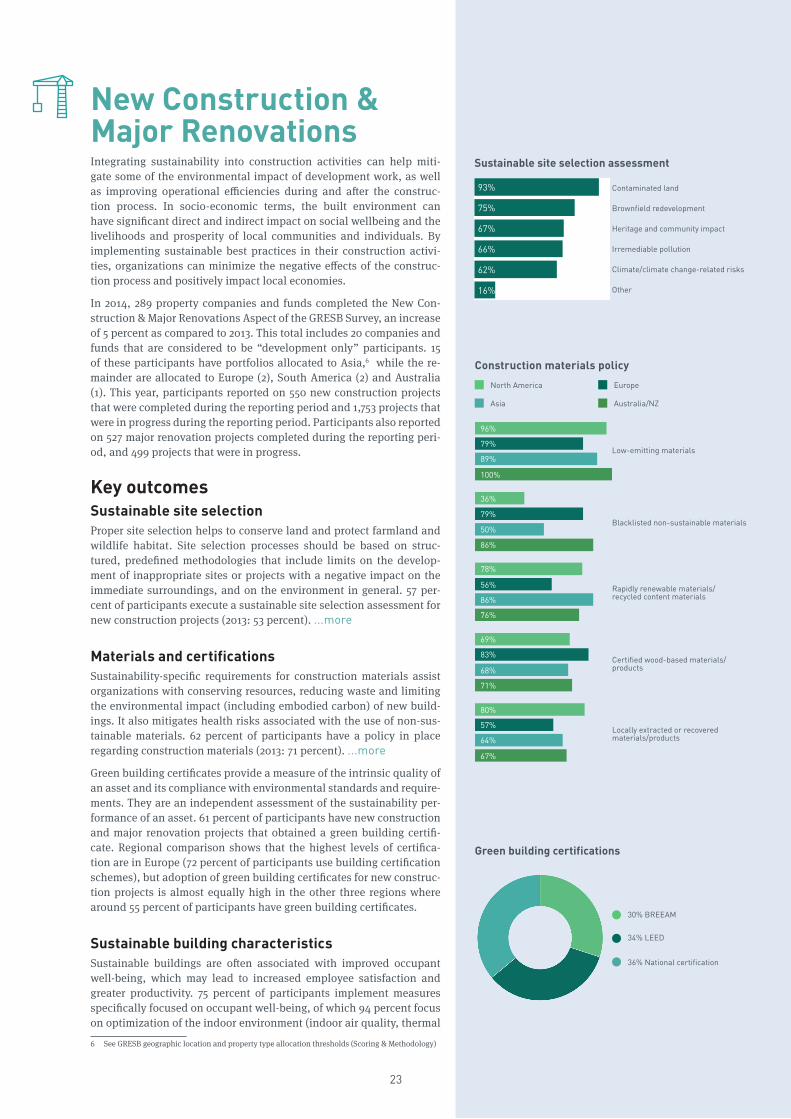
23
Integrating sustainability into construction activities can help miti-gate some of the environmental impact of development work, as well as improving operational efficiencies during and after the construc-tion process. In socio-economic terms, the built environment can have significant direct and indirect impact on social wellbeing and the livelihoods and prosperity of local communities and individuals. By implementing sustainable best practices in their construction activi-ties, organizations can minimize the negative effects of the construc-tion process and positively impact local economies.
In 2014, 289 property companies and funds completed the New Con-struction & Major Renovations Aspect of the GRESB Survey, an increase of 5 percent as compared to 2013. This total includes 20 companies and funds that are considered to be “development only” participants. 15 of these participants have portfolios allocated to Asia,6 while the re-mainder are allocated to Europe (2), South America (2) and Australia (1). This year, participants reported on 550 new construction projects that were completed during the reporting period and 1,753 projects that were in progress during the reporting period. Participants also reported on 527 major renovation projects completed during the reporting peri-od, and 499 projects that were in progress.
Key outcomesSustainable site selectionProper site selection helps to conserve land and protect farmland and wildlife habitat. Site selection processes should be based on struc-tured, predefined methodologies that include limits on the develop-ment of inappropriate sites or projects with a negative impact on the immediate surroundings, and on the environment in general. 57 per-cent of participants execute a sustainable site selection assessment for new construction projects (2013: 53 percent). ...more
Materials and certificationsSustainability-specific requirements for construction materials assist organizations with conserving resources, reducing waste and limiting the environmental impact (including embodied carbon) of new build-ings. It also mitigates health risks associated with the use of non-sus-tainable materials. 62 percent of participants have a policy in place regarding construction materials (2013: 71 percent). ...more
Green building certificates provide a measure of the intrinsic quality of an asset and its compliance with environmental standards and require-ments. They are an independent assessment of the sustainability per-formance of an asset. 61 percent of participants have new construction and major renovation projects that obtained a green building certifi-cate. Regional comparison shows that the highest levels of certifica-tion are in Europe (72 percent of participants use building certification schemes), but adoption of green building certificates for new construc-tion projects is almost equally high in the other three regions where around 55 percent of participants have green building certificates.
Sustainable building characteristicsSustainable buildings are often associated with improved occupant well-being, which may lead to increased employee satisfaction and greater productivity. 75 percent of participants implement measures specifically focused on occupant well-being, of which 94 percent focus on optimization of the indoor environment (indoor air quality, thermal
6 See GRESB geographic location and property type allocation thresholds (Scoring & Methodology)
Sustainable site selection assessment
Contaminated land
Brownfield redevelopment
Heritage and community impact
Irremediable pollution
Climate/climate change-related risks
Other
93%
75%
67%
66%
62%
16%
Construction materials policy
North America Europe
Asia Australia/NZ
Blacklisted non-sustainable materials
Low-emitting materials
Rapidly renewable materials/recycled content materials
Certified wood-based materials/products
Locally extracted or recovered materials/products
96%
79%
89%
100%
36%
79%
50%
86%
78%
56%
86%
76%
69%
83%
68%
71%
80%
57%
64%
67%
New Construction & Major Renovations
Green building certifications
30% BREEAM
36% National certification
34% LEED

24
comfort, lighting and acoustic performance). 88 percent provide us-er-focused building facilities (fitness or gym, cafeteria, green areas and amenities), and specific furnishings and fit-outs, such as ergonomic work stations.
Implementing energy and water efficiency requirements during con-struction contributes to reducing the energy consumption of a building once it is operational. 69 percent of participants have minimum ener-gy efficiency requirements for new construction and major renovation projects (2013: 58 percent). ...more
On-site renewable energy generation reduces environmental and eco-nomic impacts associated with fossil fuel energy use. 35 percent of par-ticipants have new construction and major renovation projects that are designed to generate energy from on-site renewable sources (2013: 27 percent). ...more
Supply chain requirementsSustainability-specific requirements for contractors aid the proper im-plementation of organizations’ sustainability policies for new construc-tion and major renovation projects. Relationships with contractors and the written agreements that define those relationships make sustaina-bility requirements enforceable against a wider range of stakeholders. 67 percent of participants now monitor their contractors’ compliance with the organization’s sustainability-specific requirements (2013: 64 percent). ...more
The dangerous nature of construction work can lead to incidents, inju-ries, and fatalities. These have the potential to undermine the organi-zation’s reputation and long-term financial performance. Occupational health and safety performance is a key indicator of an organization’s approach to its duty of care. Monitoring of and reporting on on-site oc-cupational health and safety thus assists prudent risk management. Keeping records of the number of injuries, fatalities and near misses helps to identify patterns that can guide the implementation of meas-ures needed to minimize health and safety risks. In 2014, half of par-ticipants implemented an on-site occupational health and safety (OHS) management system. ...more
Community engagementNew construction and major renovation projects are likely to impact the local community. A communication policy demonstrates commitment to engaging with the community by obtaining their input and feedback on issues relevant to the development process. This helps to manage compliance with regulatory requirements and provides a structured ap-proach to planning and controlling construction activities. 59 percent of 2014 GRESB participants with new construction and major renova-tion activities have a policy in place for communication with the local community regarding the impact of development projects, while 51 per-cent monitor the impact of the project on the local community during the different stages of the project.
34 percent of participants also assess the socio-economic impact of their projects on the community, which helps to minimize any nega-tive impact and to create more sustainable communities. Most of these participants (87 percent) include community welfare in their impact assessments.
Socio-economic impact assessment includes
87%
72%
63%
7%
Local residents’ well-being
Local community welfare
Local business revenues
Other
Energy efficiency requirements
85%
76%
66%
64%
17%
Commissioning plan
Verification of building energy systems
Exceeding mandatory performance requirements
Fundamental refrigerant management
Other
71%
67%
62%
58%
47%
42%
3%
Monitoring contractors’ compliance
Update reports
Audits
Ad hoc site visits
On site sustainability resource/staff
Compliance with international standard
Other
Enforcement of requirementsfor sub-contracters
“The Old Dixie Eco-Walk represents the transformation of a dusty back road to a multifaceted amenity. It offers an exhibition space for local artists, a showcase for Florida flora, a haven for native species butterflies, and a tranquil nature walk for neighboring apartment residents.”
— Heitman America Real Estate Trust, L.P.

25
Timeline
January
June
February
July
March
August
April
September
November
May
October
December
Ű Engagement with the GRESB team on the most important topics in the Survey
Ű Receive engagement package
Ű Calls and webinars for a better understand-ing of the 2014 GRESB Survey and processes
Ű Outreach to investments to request participa-tion in the 2014 Survey. This is part of the en-gagement process and continues until early April
Ű Second outreach to investments to request participation in the 2014 Survey
Ű Monitoring of progress
Ű Participants provide feedback on Survey content, products and
Ű Investors provide feedback on Survey content, products and processes
Ű Collective or individual meetings to discuss Survey results with the GRESB team
Ű Aggregate and analyze feedback
Ű Start the preparation for the new Survey
Ű Third outreach to investments to request participation in the 2014 Survey
Ű Monitoring of progress
Ű Data in Member Portal
Ű Analysis tool available
Ű Engagement with investments regarding the re-sults. This is an ongoing process that is respon-sive to investor requirements and requests
Ű Companies and funds are invited to participate in the 2014 GRESB Survey at www.gresb.com. After registration, participants receive login de-tails by email
Ű Upon completion of all the sections in the Sur-vey, GRESB gives participants the option to re-quest a Response Check
Ű Participants are asked to confirm the accuracy of the data before submitting their response
Ű All submissions must be received by July 1, 2014 latest. Unfortunately GRESB cannot accept any submissions received after this date
Ű Engagement with User Groups and Mem-bers regarding the most important topics in the Survey, and supporting documentation preparation. This continues throughout Jan-uary and February
Ű GRESB Portal testing
Ű Final amendments to the Survey and sup-porting documentation
Ű Early release of the Survey questions, in preparation for the official release
Investor Members GRESB
April 1: Survey opens
July 1: Survey closes
May 1
October: Consultation Period starts
December 1 onwards
October 1: Consultation Period starts
June 15
Ű Following submission GRESB analyzes all par-ticipants’ Survey submissions. This process continues until early August. We contact partici-pants during this time to clarify any outstanding issues with their submissions
July 1: Validation process starts
Ű Participants receive a Scorecard containing the headline results including their overall GRESB score, their score for each of GRESB’s seven sustainability aspects (plus their score for New Construction & Major Renovations if applica-ble).
September: Survey results

26
Governance and Contact
GovernanceGRESB is an industry-driven organization committed to rigorous and independent evaluation of the sustainability perfor-mance of real estate portfolios around the globe.
Since its inception, GRESB has grown from an initiative pioneered by three institutional investors (APG Asset Management, PGGM Investments and The Universities Superannuation Scheme (USS)) with the assistance of Maastricht University, into a benchmarking tool used by more than one hundred institutional investors, listed property companies and fund managers and backed by all leading international real estate associations and industry bodies.
GRESB B.V. undertakes the day-to-day management of GRESB’s activities. It is a private limited company incorporated in the Netherlands with registration number 55416071 and whose registered office is at George Gershwinlaan 115, 1082 MT, Am-sterdam, Netherlands. GRESB B.V. is a wholly owned subsidiary of Stichting GRESB, a foundation incorporated in the Neth-erlands with registration number 52383113. The Board of Stichting GRESB (referred to by GRESB as its Supervisory Board) controls the activities of GRESB B.V.. The GRESB B.V. Executive Board is responsible for GRESB’s strategic management.
In addition to the GRESB Supervisory and Executive Boards, GRESB also benefits from the guidance of its Advisory Board, regional Benchmark Committees and user groups. The individuals that sit on the Advisory Board, Benchmark Committee, and user groups are all drawn from GRESB’s membership community and they all perform a crucial role in giving GRESB strategic, commercial and technical input regarding both the Survey and services offered to the real estate industry.
The GRESB Executive Board approves the appointment of Advisory Board and Benchmark Committee members. Individuals are appointed for a two-year term, extendable by a further two years with Executive Board approval.
A detailed explanation of GRESB’s governance structure is available on the GRESB website.
GRESB B.V. PO Box 75801 1070 AV Amsterdam The Netherlands Tel. +31 (0)207740220 [email protected] www.gresb.com
Contact
© 2014 GRESB B.V.This Report is an aggregation and analysis of data that has been undertaken by GRESB using data provided by participants in the 2014 GRESB Survey. It reflects the opinions of GRESB and not of our members. The information in the Report has been provided in good faith and is provided on an “as is” basis. We take reasonable care to check the accuracy and completeness of the Report prior to its publication. However, the Report has not been independently verified. In addition, the statements in the Report may provide current expectations of future events based on certain assumptions. The variety of sources from which we obtain the information in the Report means that we make no representations and give no warranties, express or implied as to its accuracy, availability, completeness, timeliness, merchantability or fitness for any particular purpose.
The Report is not provided as the basis for any professional advice or for transactional use. GRESB and its advisors, consultants and sub-contractors shall not be responsible or liable for any advice given to third parties, any investment decisions or trading or any other actions taken by you or by third parties based on information contained in the Report. Except where stated otherwise, GRESB is the exclusive owner of all intellectual property rights in all the information contained in the Report.
27
GRESB Members
Fund Manager and Property Company Members

28
Associate Members
Global Associate Members
Partners
Strategic Alliances
Support Provided ByACSI (The Australian Council of Superannuation Investors)AFIRE (The Association of Foreign Investors in Real Estate)ARES (The Association for Real Estate Securitization)Danish Property FederationPCA (Property Council of Australia)
PHILGBC (Philippine Green Building Council)RIAA (Responsible Investment Association of Australasia)SGBC (Singapore Green Building Council)Swedish Property Federation

29
GRESB Participants
Private entitiesAberdeen Asset Management gAEW Capital ManagementAEW EuropeAlpha Investment Partners LtdAltaFundAltera Vastgoed NVAltis Property PartnersAmerican Realty AdvisorsAMP CapitalAmundi Asset ManagementAmvestAndersson Real Estate Investment Management gArch Capital Management Co. Ltd.Ardstone Capital LtdArt-Invest Real EstateASR Real Estate Investment ManagementATP Ejendomme A/SAvalonBay Communities, Inc.Aviva Investors gAXA Investment ManagementAXA Real EstateBank J. Safra SarasinBehringer Harvard gBentall Kennedy GroupBlackRock gBlackstone Real Estate PartnersBluehouse CapitalBouwfonds Fondsverwaltungs GmbHBouwfonds Investment Management gBouwinvest REIMBritish Land Company Plc gBrockton Capital LLPBrookfield Office Properties Australia Pty LtdCapitaMalls China Fund Management Pte LtdCapitaMalls India Fund Management Pte LtdCBRE Global Investors gCIM GroupCITIC CapitalCitizenM Asset ManagementClarion PartnersClimate Change CapitalCOLI ICBCI China Investment ManagementCommercial Estates GroupCommonwealth Bank of Australia gCommonWealth PartnersConservatorio SACordea Savills Fund Managers (Jersey) Limited gCordea Savills Investment ManagementCornerstone Real Estate AdvisersCorValDDRDeutsche Asset & Wealth ManagementDEXUS Funds ManagementDivcoWestDNB Real Estate Investment Managemente-Shang Cayman LimitedEquity Estate BVEurindustrial N.V. gEuropa Capital LLPExeter Property GroupFairfield Residential Company LLCFastighetsaktiebolaget NorrportenFederal Capital PartnersFortius Funds Management
Forum Partners gFrogmoreGablesGaw Capital PartnersGenCap PartnersGenerali Real EstateGenesta Property NordicGerding Edlen Investment ManagementGI PartnersGoodman GroupGrainger Asset Management LtdGreystar Investment ManagementGrosvenor Fund ManagementGTIS PartnersGuggenheim PartnersHansteen Harrison Street Real Estate Management, LLCHealthcare of Ontario Pension PlanHeitmanHemsö Fastighets ABHermes Real Estate Investment ManagementIEF Capital Management B.V.Inland Real Estate Investment CorporationInternational Housing Solutions Internos Global InvestorsInvesco Advisors, Inc.Invesco Real EstateInvesta gISPTIVG Immobilien AGJ.P. Morgan Asset ManagementJ.P. Morgan Asset Management (UK) LimitedJamestown Properties Jonathan Rose CompaniesJPMorgan ChaseKenedix, Inc.KingSett CapitalLaSalle Investment ManagementLegal and General PropertyLend LeaseLimeTree Capital Car Park Investment Management LimitedLocal Government SuperLothbury Investment Management LimitedM&G Real Estate gMacFarlane Partners Investment Management gMadison MarquetteMajid Al Futtaim PropertiesMayfair Capital Investment ManagementMedicXMetLife Investment ManagementMeyer BergmanMoorfield Investment Management LimitedMorgan Stanley gNational Real Estate Advisors LLCNeinver SANiamNordic Real Estate PartnersOFI REIMOrion PartnersOthrys Asset ManagementOVG Real EstateOxford Properties GroupPalmer Capital
PamfleetParamount Group, Inc.Pareto LimitedParmenter Realty PartnersPerella Weinberg Real Estate UK LLPPhoenix Property InvestorsPradera gPramerica Real Estate Investors (Asia) Pte LtdPrelios SGRPrincipal Real Estate Investors gPrologis gProsperitas InvestimentosPrudential Real Estate Investors gPT Farpoint Realty IndonesiaPublic Investment CorporationQ-Park NVQIC Global Real EstateRedwood Group AsiaRikshem ABRockefeller Group Development CorporationRockspringRoyal London Savanna gSchroder Property Investment Management LimitedScottish Widows Investment PartnershipSDASentinelShorenstein Properties, LLCSOCAM Development & TAN-EU CapitalSonae Sierra gStam EuropeStandard Life InvestmentsSteen & Strom ASStockbridge Capital GroupSyntrus Achmea Real Estate & FinanceTA Realty LLCThe Carlyle GroupThe Crown EstateThe GPT Group gThe Hampshire CompaniesThe Laramar Group, LLC gThe UNITE Group PlcThor EquitiesThreadneedle Property Investments LimitedTIAA Henderson Real Estate gTIAA-CREFTimbercreek Asset ManagementTishman Speyer gTRIF Investment Management LtdTristan Capital PartnersUBS Global Asset Management (UK) Ltd.UBS Real Estate KAG mbHUBS Realty Investors LLCUrban Car Park Management Limited USAA Real Estate Company gVALAD EuropeValue Retail PLCVasakronanVesteda Investment Management B.V. gWarburg-HendersonWillhemWP GroupXYMAX REAL ESTATE INVESTMENT ADVISORS Corporation
g Participant has reported for 5 consecutive Survey years

30
AD Investment Management Co., Ltd.AIMS AMP Capital Industrial REIT Management LimitedAltarea Cogedim gAmerican Assets Trust, Inc.Associated Estates Realty CorporationAustralandAvalonBay Communities, Inc.Ayala Land Inc.BEFIMMO SABeni Stabili SpA SiiqBig Yellow Plc gBoston PropertiesBrandywine Realty TrustBritish Land Company Plc gBrookfield Office Properties Inc.Camden Property TrustCampus Crest Communities, Inc.CapitaCommercial TrustCapitaLand Limited gCapitamall TrustCastellum AB gCegerealCharities Property FundCharter HallChina Overseas Land & Investment Ltd.China Resources LandCity Developments LimitedCitycon Oyj gCLS HoldingsCOFINIMMO gCommonwealth Bank of Australia gCorio N.V. gCorporación Inmobiliaria Vesta S.A.B. de C.V.Credit SuisseCromwell Property GroupDaiwa Real Estate Asset Management Co., Ltd.Derwent London Plc gDeutsche EuroShop AG gDeutsche Wohnen AGDEXUS Property Group (DXS)DiamondRock Hospitality CompanyEquity OneEquity ResidentialFabege First Capital Realty Inc.
First Industrial Realty Trust, Inc.Foncière des RégionsFranklin Street Properties GAGFAH S.A.GECINAGeneral Growth PropertiesGlobal Logistic Properties LimitedGodrej PropertiesGoodman GroupGovernment Properties Income TrustGrainger plcGreat Portland Estates plcGrowthpoint PropertiesHammerson plc gHCP, Inc.Health Care REIT, Inc.HEIWA REAL ESTATE Asset Management Co., Ltd.Hersha Hospitality TrustHost Hotels & Resorts, Inc.Hulic Co., Ltd.Hyprop Investments LimitedIgd SiiqInland Real Estate CorporationIntu Properties plcInvesco Real EstateInvesta gJapan Excellent Asset Management Co., Ltd.Japan REIT Advisors Co., Ltd.KENEDIX Real Estate Fund Management, Inc.Keppel Land LimitedKeppel REIT Management LimitedKilroy Realty Corporation gKimco Realty Corporation gKlépierre gLand Securities Group PLC gLaSalle Hotel PropertiesLiberty Property Trust gLondonMetric Property PlcMahindra Lifespaces Developers LimitedMcKay Securities PLCMirvac gMitsubishi Corp. - UBS Realty Inc.Mitsui & Co., Logistics Partners Ltd.Mobimo Holding AGMori Building Investment Management Co., Ltd.
New Europe Property Investments plcNSIORIX Asset Management Corporation Parkway Properties, Inc.Post Properties, Inc.Prologis gPrologis REIT ManagementPSP Swiss Property gPublic StorageRegency Centers Corporation gSEGRO plc gSFLShaftesbury Plc gSimon Property Group, Inc. gSimplex Investment AdvisorsSociété de la Tour EiffelSponda PlcStandard Life InvestmentsStocklandSwiss Prime Site Group AGTechnopolis Plc 2014The Conygar Investment Company PlcThe GPT Group gThe Link Management LimitedThe Macerich CompanyThe UNITE Group PlcTIER REITTLC Activia Investment Management Inc.Tokyo Realty Investment Management, Inc.Tokyo Tatemono Co. Ltd.Tokyu Real Estate Investment Management Inc.Top Spring InternationalTriodosUnibail-Rodamco gUnion Investment Institutional Property GmbHUnion Investment Real Estate GmbHVastned Retail N.V.Ventas, Inc.Vornado Realty Trust gWashington Real Estate Investment TrustWeingarten RealtyWereldhave NV gWestfield Group gWihlborgs Fastigheter AB gWorkspaceYatra Capital Limited
Listed companies
g Participant has reported for 5 consecutive Survey years