2015-2016 revenue forecast - cob.org
TRANSCRIPT

2015-2016REVENUE FORECAST
1
Presented by Brian HenshawOctober 27, 2014

General Fund Revenue - $70.3 Million
$30
$40
$50
$60
$70
$80
2
$0
$10
$20
$30
2010
2.6%
2011
3.1%
2012
2.4%
2013
1.8%
2014P
2.4%
2015
2.6%
2016
1.5%
Taxes Goods & Services Intergovernmental
Fines Transfers Licenses
Miscellaneous
Year
% Change

Sales Tax Citywide - $20.1 Million
$10
$15
$20
$25
18.6 19.8 14.8
5.0
20.1 20.5
3
$0
$5
$10
2010
3.1%
*2011
6.6%
2012
4.5%
2013
6.5%
2014
0.0%
2015
1.5%
2016
2.0%
16.7 17.818.6 19.8
Received Projected Budgeted
Year
Percent Change
* State Tax Amnesty

YTD Sales Tax – Top Sectors (millions)
Building Mat.
Clothing
Wholesale
Specialty Trade
Misc. Retailers
4
0.0 0.5 1.0 1.5 2.0 2.5 3.0
Gen. Merch
Autos & Parts
Food & Drink
Construction
Millions2014 2013
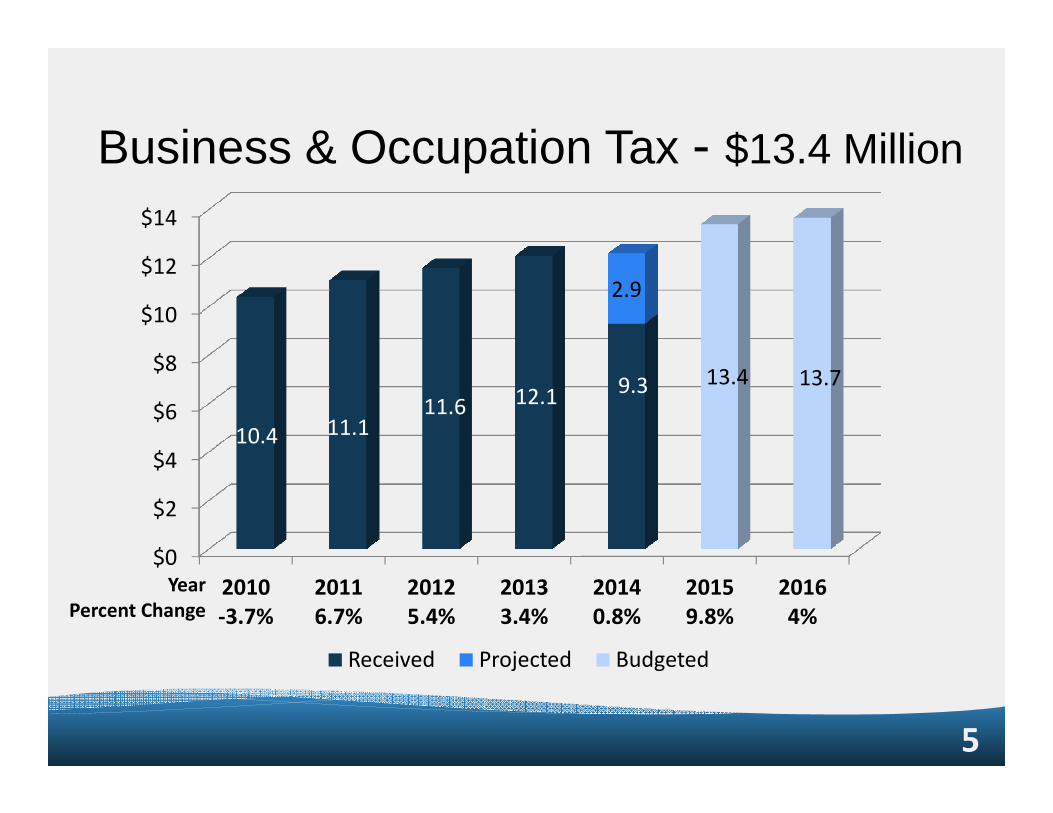
Business & Occupation Tax - $13.4 Million
$6
$8
$10
$12
$14
11.6 12.19.3
2.9
13.4 13.7
5
$0
$2
$4
$6
2010
-3.7%
2011
6.7%
2012
5.4%
2013
3.4%
2014
0.8%
2015
9.8%
2016
4%
10.4 11.111.6 12.1
Received Projected Budgeted
Year
Percent Change

Utility Taxes - Combined $15.9 Million
$6
$8
$10
$12
$14
$16
$18
12.7 13.8 14.1 14.7 11.7
3.6
15.9 16.2
6
$0
$2
$4
$6
2010
-.8%
*2011
8.7%
**2012
2.2%
2013
4.3%
2014
4.1%
2015
3.9%
2016
2.0%
Received Projected Budgeted
Year
% Change
**2012 Watershed Fee Increase*2011 Change to pay for hydrants

Utility Taxes - $15.9 Million
Water $3.8
24%
Gas $1.8
Tele $2.2
14%
Cable $1.3
8%
7
Sewer $2.3
14%
Storm $0.8
5%
Elect $3.8
24%
Gas $1.8
11%

Property Tax - $23.7 Million
$10
$15
$20
$25
18.9 19.2 19.5 22.9 12.6
10.7
23.7 24
8
$0
$5
$10
2010
3.3%
2011
1.6%
2012
1.6%
**2013
17.4%
2014
1.7%
2015
1.5%
2016
1.3%
18.9 19.2 19.5 12.6
Received Projected Budgeted
Year
% Change
**2013 Housing Levy

2014 Property Tax Distribution
B'ham School
39.1%
Port of B'ham
2.5%
General Fund
14.1%
City of
Bellingham
9
Conservation
Futures
0.4%Flood Control
1.2%
County Levy
10.2%
State GF
22.8%
Greenways
4.7%
Fire / Police
Pension 2.0%
Housing, 3.0%
Bellingham
23.8%

Property Tax - 20148.23%
59.09%
0.14%
12.82%
Levy Rate per $1,000 of
Assessed Valuation
General Fund $1.6163
Greenways III .53949
10
19.72%
Fire / Police Pension General Fund
Greenways Rev. Dev. Area
Housing
Affordable Housing .35071
Fire / Police Pension .22499
RDA .00384
CITY TOTAL $2.73538

Estimated Impact of 1% Increase
Item Amount
2014 Total Levy $21,400,000
1% Levy Increase $210,000
Estimated New Construction ($40 Million) $100,000
11
Estimated New Construction ($40 Million) $100,000
Housing Levy $2 M per year $2,000,000
2015 Levy $23,710,000
*Does not include adjustments: annexations, refunds,
utility valuations, etc.
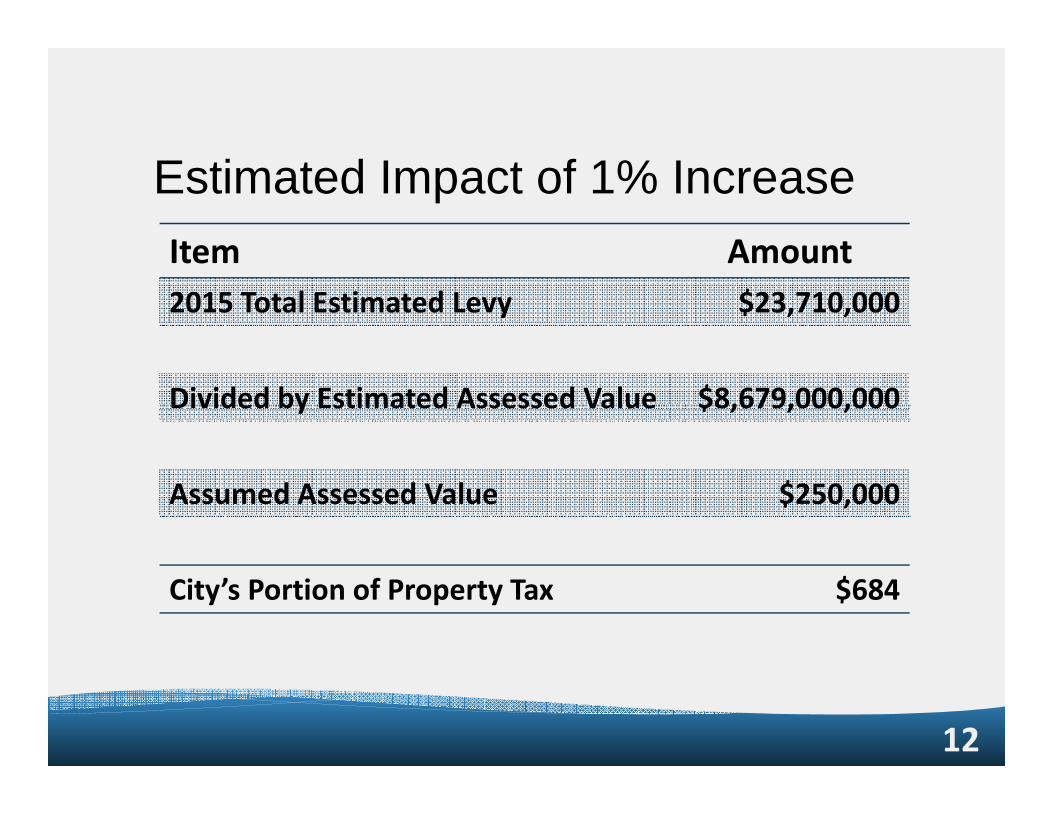
Estimated Impact of 1% Increase
Item Amount
2015 Total Estimated Levy $23,710,000
Divided by Estimated Assessed Value $8,679,000,000
12
Divided by Estimated Assessed Value $8,679,000,000
Assumed Assessed Value $250,000
City’s Portion of Property Tax $684

Citywide Budgeted Revenue - $229.5 Million
General
Fund,
$70.3All
13
All
Others,
$159.2

Real Estate Excise Tax - $2.1 Million
$1.5
$2.0
$2.5
2.3 2.3 1.9
0.4
2.1 2.2
14
$-
$0.5
$1.0
2010
-10.5%
2011
1.8%
2012
32.9%
2013
0.0%
2014
0.0%
2015
-8%
2016
4.8%
1.7
1.7
Received Projected Budgeted
Year
Percent Change

Street Fund Revenues - $12.8 Million* PW Admin & Eng. Fund
$15
$20
$25
15
$0
$5
$10
2010 2011 2012 2013 2014P 2015* 2016*
Taxes Goods & Services Intergovernmental
Impact Fees Fuel Tax All Other

Water Fund Revenues - $24.2 Million
$20
$25
$30
$35
$40
*Watershed Rate Increase
16
$0
$5
$10
$15
2010 2011 *2012 2013 2014P 2015 2016
Metered Water Unmetered Water Bond & Misc
Watershed Goods & Services Demand Charges

Wastewater Fund Revenues - $20.3 Million
$30
$40
$50
$60
$70
17
$0
$10
$20
$30
2010 2011 2012 2013 2014P 2015 2016
Unmetered Wastewater Metered Wastewater All Other
Demand Charges Financing

Stormwater Fund Revenues - $12 Million
$8.0
$10.0
$12.0
$14.0
18
$0.0
$2.0
$4.0
$6.0
2010 2011 2012 2013 2014P 2015 2016
Goods & Services Loan Interest & Misc. Grants

Solid Waste Fund Revenues - $1.6 Million
$2.0
$2.5
$3.0
$3.5
$4.0
19
$0.0
$0.5
$1.0
$1.5
$2.0
2010 2011 2012 2013 2014P 2015 2016Taxes Miscellaneous Goods & Services Grants

Budget Calendar Key DatesNovember 10th Afternoon Budget Work Sessions
Close Public Comment
Introduce Property Tax Ordinance
November 24th Evening Public Hearing on Budget
Budget Work Sessions
Adopt Property Tax Ordinance
20
Adopt Property Tax Ordinance
December 8th Afternoon Introduce Budget Ordinance
Budget Work Sessions
December 15th Evening Adopt Budget Ordinance

REVENUE FORECAST2014
21
Presented by Brian HenshawFinance Department
(360) 778 – 8036 [email protected]