2015 annual crr market results report - california iso is based on the theory of spot pricing and is...
TRANSCRIPT

2015 Annual CRR Market Results
Report
March 9, 2015
ISO Market Services
Market Services –California ISO 2015 Annual CRR Market Results Report
Market Services/CRR Team Page 2 of 22
Executive Summary
This report on the Congestion Revenue Rights (CRR) market concerns those annual
markets that were associated with the 2015 annual CRR processes, which include the
2015 tier 1 (Priority Nomination Process), tier 2, tier 3 and long-term allocation markets
as well as the 2015 annual auction market.
Empirical Results of 2015 annual processes
The annual allocation awarded to LSEs an average of 9,611 MW and 8,315 MW of CRRs
in on-peak and off-peak periods, respectively, which was approximately 42 percent of
what they nominated across all tiers. The volume of CRR awards in the 2015 annual
auction increased to 335,981 MW from 286,923 MW in the 2014 annual auction.
Further, the revenues from the 2015 annual auction were $66.62 million, an increase of
59 percent with respect to the revenues of $41.82 million from the 2014 annual auction.
Market Services –California ISO 2015 Annual CRR Market Results Report
Market Services/CRR Team Page 3 of 22
Acronyms
BPM Business Practice Manual
CRR Congestion Revenue Right
DA Day Ahead
IFM Integrated Forward Market
LAP Load Aggregation Point
LMP Locational Marginal Price
LT Long Term
LSE Load Serving Entity
MCC Marginal Congestion Component
MSS
NERC
OBAALSE
Meter Sub-System
North American Electric Reliability Corporation
Out of Balancing Authority Area Load Serving Entity
RT Real Time
SRS Secondary Registration System
ST Short Term
TOU
WECC
Time of Use
Western Electricity Coordinating Council
Market Services –California ISO 2015 Annual CRR Market Results Report
Market Services/CRR Team Page 4 of 22
List of Figures
Figure 1: Number of Different Paths Cleared in Annual ST CRR Allocations ..................... 10 Figure 2: Volume of Awards in Annual CRR Allocations –On Peak .................................... 11 Figure 3: Volume of Awards in Annual CRR Allocations –Off Peak ................................... 11 Figure 4: Volumes of LT CRR in Annual Allocations -On Peak .......................................... 12 Figure 5: Volumes of LT CRR in Annual Allocations -Off Peak.......................................... 13 Figure 6: Total Volumes of CRRs Released in Annual Allocations –On Peak ..................... 14 Figure 7: Total Volumes of CRRs Released in Annual Allocations –Off Peak .................... 14 Figure 8: Number of Participants in Annual CRR Auctions ................................................... 15 Figure 9: Number of Bids in Annual CRR Auctions .............................................................. 16 Figure 10: Number of Different Paths Cleared in Annual Auctions ....................................... 17 Figure 11: Bid-in Volume in Annual CRR Auctions .............................................................. 18 Figure 12: Volume of Awards in Annual CRR Auctions ....................................................... 19 Figure 13: Volume of Bids and Awards in Annual CRR Auctions ........................................ 19 Figure 14: Annual Auction Prices Organized by Price Range –On Peak ............................... 20 Figure 15: Annual Auction Prices Organized by Price Range –Off Peak .............................. 20 Figure 16: Revenues Collected in Annual CRR Auctions ..................................................... 21 Figure 17: Net Revenues Collected in Annual CRR Auctions ............................................... 22
Market Services –California ISO 2015 Annual CRR Market Results Report
Market Services/CRR Team Page 5 of 22
Table of Contents
Executive Summary ................................................................................................................... 2 Empirical Results of 2015 annual processes .................................................................... 2
Acronyms .................................................................................................................................. 3 List of Figures ............................................................................................................................ 4 Table of Contents ...................................................................................................................... 5 Introduction .............................................................................................................................. 6 Allocation Processes ................................................................................................................. 9
CRR Paths .............................................................................................................................. 9 Annual Allocation of Short-Term (ST) CRRs ........................................................................ 10 Annual Allocation of LT CRRs .............................................................................................. 12
Auctions .................................................................................................................................. 15 Participation ....................................................................................................................... 15 Market Bids ......................................................................................................................... 16 CRR Paths ............................................................................................................................ 16 Annual Volumes .................................................................................................................. 17 Auction Prices ..................................................................................................................... 20 Auction Revenues ............................................................................................................... 21
Market Services –California ISO 2015 Annual CRR Market Results Report
Market Services/CRR Team Page 6 of 22
Introduction
This report covers the ISO’s CRR annual market for 2015. The nodal market’s LMP
approach is based on the theory of spot pricing and is the natural extension of the
classical market equilibrium theory. LMPs reflect the locational value of power which
depends not only on the generation costs but also on the transmission system
characteristics and the willingness of demand to pay. The essence of an LMP-based
market is that all operational decisions are made by an independent system operator and
that energy is traded at LMPs. As a by-product of this pricing process, the marginal cost
of transmission is just the price difference between locations, which amounts to the price
differential of congestion and losses. Since congestion is inherently volatile, so are
congestion costs. In order to hedge volatile congestion costs, a natural complement to the
LMP-based markets is a transmission rights market. At the ISO, the energy market is
supplemented with a Congestion Revenue Rights (CRR) market. CRRs are financial
instruments that the ISO has put in place to provide participants a means to manage the
variability of congestion charges that arise under the congestion management protocol of
the Integrated Forward Market (IFM). CRRs hedge only congestion costs, not losses.
Also, only congestion costs from the DA market are hedged with CRRs. There is no
hedging mechanism for congestion costs in RT.
A CRR is defined by a MW quantity, term (i.e. season or month), time of use (TOU),
source and sink. For each term, a CRR can have one of two TOU periods: on- or off-
peak. The TOU definition is consistent with the Western Electricity Coordinating
Council (WECC) and the North American Electric Reliability Corporation (NERC)
guidelines. CRRs have a term consistent with the markets for which they have been
awarded. Each CRR is awarded through either the monthly, annual or long-term market
processes. The monthly and annual markets have both an allocation and auction
component, while the long term market is only available for the allocation. Monthly
CRRs are valid for a specific TOU for the month, while annual CRRs are valid for a
specific TOU for one of four seasons/quarters. Through the long term allocation any
awarded CRRs are valid for one of the seasons/quarters for an additional 9 years beyond
the annual market term. This effectively provides LSEs with the ability to hedge a
particular position for ten years, the annual term plus nine years associated with the long
term allocation. There may also be CRRs associated with merchant transmission projects
that may have a life term of up to 30 years.

Market Services –California ISO 2015 Annual CRR Market Results Report
Market Services/CRR Team Page 7 of 22
As noted above, the CRR market is organized in annual and monthly processes, and each
process is composed of allocations and auctions. CRRs are released on a seasonal basis
during the annual processes. There are two distinct phases in the annual allocation,
Short-Term (ST) phase for the upcoming calendar year, which consists of three separate
tiers and Long-Term (LT) phase, which is a nine year extension of awards received in tier
1 of the ST annual allocation process. In the ST annual process, up to 75 percent of the
transmission capacity is released. The remaining 25 percent of the capacity is released in
the monthly processes. For the LT allocation process 60 percent of the transmission
capacity is released. Although two types of products can be found in the ISO’s CRR
market: obligations and options; only obligation CRRs are released in the standard
allocation and auction markets. Option CRRs are only made available through the
Merchant Transmission allocation process or through the conversion of TOR rights to
CRRs, referred to as MT_TOR CRRs. The allocation and auction processes release as
much transmission capacity as is determined by the simultaneous feasibility of all CRR
portfolios. Even though market participants can nominate up to a certain volume of
CRRs in the allocation process, there is no guarantee that all of their nominations can be
allocated, due to the simultaneous feasibility constraint.
Obligation CRRs can be obtained through both annual and monthly allocations and
auctions. Entities with load-serving obligations are generally entitled to receive CRRs at
no cost in the allocation process with an upper bound set in proportion to the LSE’s load
serving obligation. A special class of LSE, the Out of Balancing Authority Area LSE
(OBAALSE), is required to prepay the respective Wheeling Access Charge (WAC) in
order to participate in the allocation process. The maximum volume of CRRs for
nomination is determined by the load serving entities (LSEs) historical load, and in tier 1
(Priority Nomination Process - PNP) of the annual allocation the CRR paths they can
nominate are restricted by a predefined set of sources and sinks. For all subsequent
allocation tiers the LSEs can nominate to any valid source, but the LSEs are always
limited to the sink location where the load is actually scheduled. Sources can be
generators, trading hubs and scheduling points. Sinks are restricted to Default Load
Aggregation Points (DLAPs), Sub-LAPs, Custom LAPs and scheduling points external to
the LSEs areas, for OBAALSEs.
The very first CRR market run was the 2008 annual market and the 2009-2017 LT CRR
market. These markets were run in the summer of 2007 when the new nodal market
(Market Redesign and Technology Upgrade – MRTU) was initially planned to go live in
2008. Since MRTU did not go live until April 1, 2009 only the CRRs awarded in the
2009-2017 LT CRR market for seasons 2-4 were kept. For the 2009 annual process, run
in 2008, the ISO released 2009 seasonal ST CRRs for seasons 2 to 4 after the launch of
Market Services –California ISO 2015 Annual CRR Market Results Report
Market Services/CRR Team Page 8 of 22
the new market on April 1, 2009, and 2010-2018 LT CRRs for all four seasons. The
2010 annual process, run in 2009, released 2010 ST CRRs and 2011-2019 LT CRRs for
all four seasons. The 2011 annual process, run in 2010, released 2011 ST CRRs and
2012-2020 LT CRRs for all four seasons. The 2012 annual process, run in 2011, released
2012 ST CRRs and 2013-2021 LT CRRs for all four seasons. The 2013 annual process,
run in 2012, released 2013 ST CRRs and 2014-2022 LT CRRs for all four season. The
2014 annual process, run in 2013, released 2014 ST CRRs and 2015-2023 LT CRRs for
all four season. In the summer of 2014, the ISO started the 2015 annual process with the
allocation and auction processes completing in November of 2014 with the release of
2015 ST CRRs (allocation and auction) and 2016-2024 LT CRRs (allocation only) for all
four seasons. Furthermore, each monthly process is started approximately one month
ahead with two allocation tiers and one auction round to release monthly CRRs for each
TOU, although this report focuses only on the 2015 annual CRR allocation and auction
market results.
This report provides metrics and analysis only related to the annual CRR markets,
including 2015 and 2014 annual processes.

Market Services –California ISO 2015 Annual CRR Market Results Report
Market Services/CRR Team Page 9 of 22
Allocation Processes
Only (candidate) CRR holders that are LSEs or qualified Out of Balancing Authority
Area Load Serving Entities (OBAALSEs) can participate and obtain CRRs through the
CRR allocations. The CRR eligible quantity is the starting point for calculating an LSE’s
nomination limits. CRR eligible quantities for the annual CRR allocations are based on
the LSE’s historical load. The reference period for historical load includes the most
recent and full calendar year. The historical load data is then grouped by season and
TOU to derive a load duration curve. The LSE’s seasonal CRR load metric for each
season and TOU period is the MW level of load that is exceeded only in 0.5 percent of
the hours based on the LSE’s historical load data. With the participants’ nominations
available, the ISO runs a simultaneous feasibility test to release CRRs to fulfill CRR
nominations as fully as possible while enforcing all transmission constraints defined in
the full network model of the transmission system. To the extent that nominations are not
simultaneously feasible, the nominations are reduced in accordance with the CRR
allocation optimization formulation until simultaneous feasibility is achieved. The CRR
Allocation optimization formulation, which utilizes a weighted least squares objective
function that applies reductions in flows on a binding constraint based on the squares of
the power transfer distribution factor of each CRR nomination for the binding constraint
while applying a weighting factor based on bid in volumes. In the annual process, up to
75 percent of transmission capacity is available. Annual allocations are organized in four
different tiers, with one tier releasing LT CRRs, as explained in the BPM for CRRs.
CRR Paths
The definition of a CRR includes the path from source to sink points. For the allocation
process, CRR nominations are restricted to a predefined set of sources and sinks. Sources
can be generation PNodes, trading hubs or scheduling points. Sinks are restricted to
default LAPs, sub-LAPs, custom LAPs and scheduling points external to the LSE’s areas
(for OBAALSEs). CRR paths for the allocation can only be from a source to a sink
(where the LSE schedules load) and cannot be in the counter-flow direction. The
expectation is that the CRR paths for the allocation will be positively valued because they
resemble supply-to-load patterns.
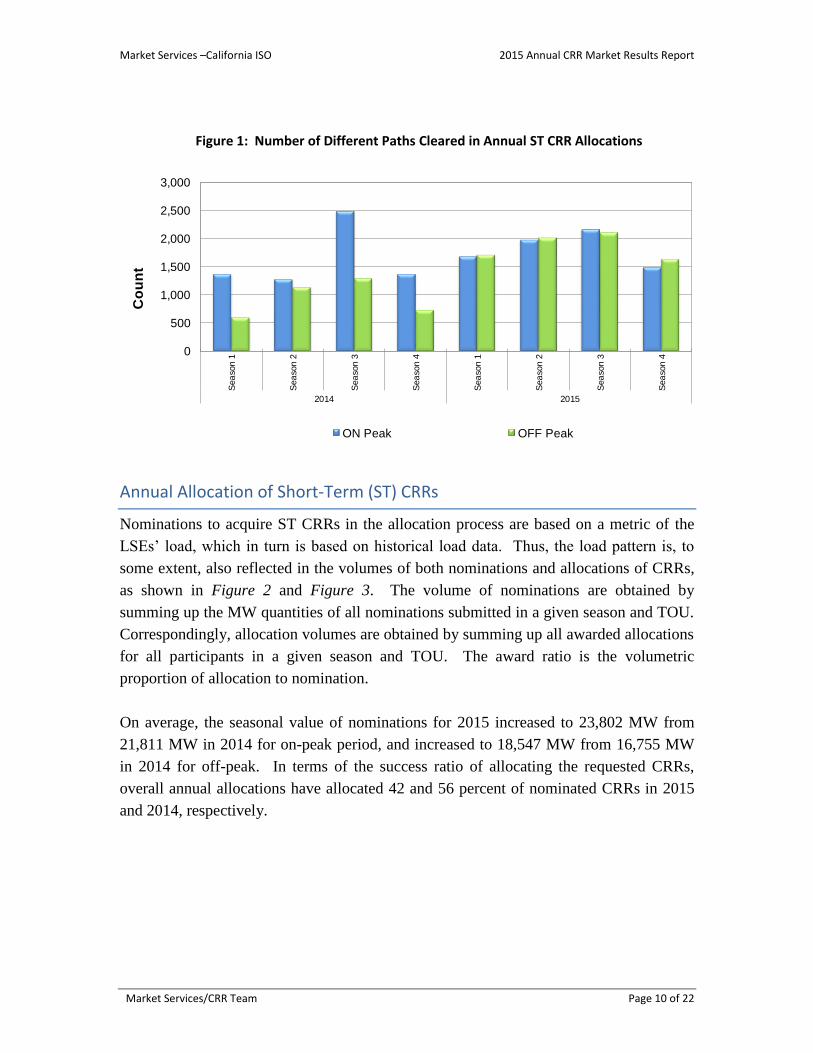
Figure 1 represents the count of different ST CRR paths awarded in the annual
allocations, organized by year, season and TOU. The number of different paths in the
2015 allocation averaged 1855, while it averaged 1293 in the 2014 annual process.
Market Services –California ISO 2015 Annual CRR Market Results Report
Market Services/CRR Team Page 10 of 22
Figure 1: Number of Different Paths Cleared in Annual ST CRR Allocations
0
500
1,000
1,500
2,000
2,500
3,000
Sea
son
1
Sea
son
2
Sea
son
3
Sea
son
4
Sea
son
1
Sea
son
2
Sea
son
3
Sea
son
4
2014 2015
Co
un
t
ON Peak OFF Peak
Annual Allocation of Short-Term (ST) CRRs
Nominations to acquire ST CRRs in the allocation process are based on a metric of the
LSEs’ load, which in turn is based on historical load data. Thus, the load pattern is, to
some extent, also reflected in the volumes of both nominations and allocations of CRRs,
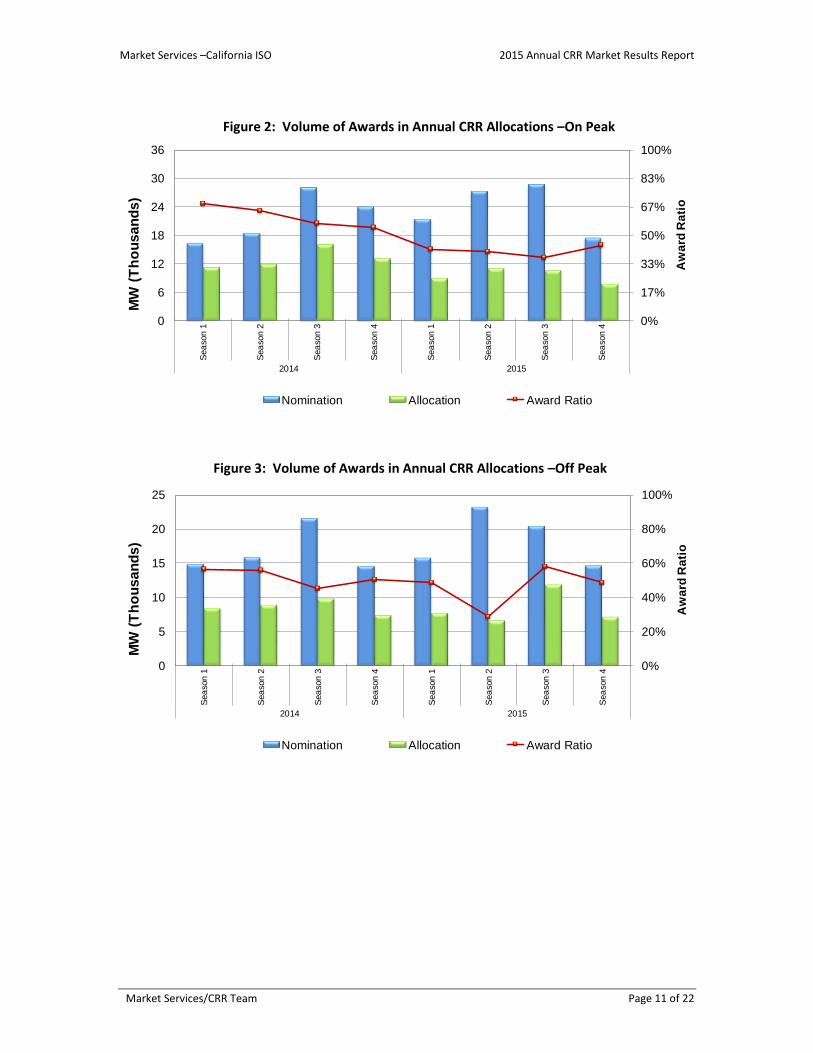
as shown in Figure 2 and Figure 3. The volume of nominations are obtained by
summing up the MW quantities of all nominations submitted in a given season and TOU.
Correspondingly, allocation volumes are obtained by summing up all awarded allocations
for all participants in a given season and TOU. The award ratio is the volumetric
proportion of allocation to nomination.
On average, the seasonal value of nominations for 2015 increased to 23,802 MW from
21,811 MW in 2014 for on-peak period, and increased to 18,547 MW from 16,755 MW
in 2014 for off-peak. In terms of the success ratio of allocating the requested CRRs,
overall annual allocations have allocated 42 and 56 percent of nominated CRRs in 2015
and 2014, respectively.
Market Services –California ISO 2015 Annual CRR Market Results Report
Market Services/CRR Team Page 11 of 22
Figure 2: Volume of Awards in Annual CRR Allocations –On Peak
0%
17%
33%
50%
67%
83%
100%
0
6
12
18
24
30
36
Sea
son
1
Sea
son
2
Sea
son
3
Sea
son
4
Sea
son
1
Sea
son
2
Sea
son
3
Sea
son
4
2014 2015
Aw
ard
Ra
tio
MW
(T
ho
usan
ds)
Nomination Allocation Award Ratio
Figure 3: Volume of Awards in Annual CRR Allocations –Off Peak
0%
20%
40%
60%
80%
100%
0
5
10
15
20
25
Sea
son
1
Sea
son
2
Sea
son
3
Sea
son
4
Sea
son
1
Sea
son
2
Sea
son
3
Sea
son
4
2014 2015
Aw
ard
Ra
tio
MW
(T
ho
us
an
ds
)
Nomination Allocation Award Ratio
Market Services –California ISO 2015 Annual CRR Market Results Report
Market Services/CRR Team Page 12 of 22
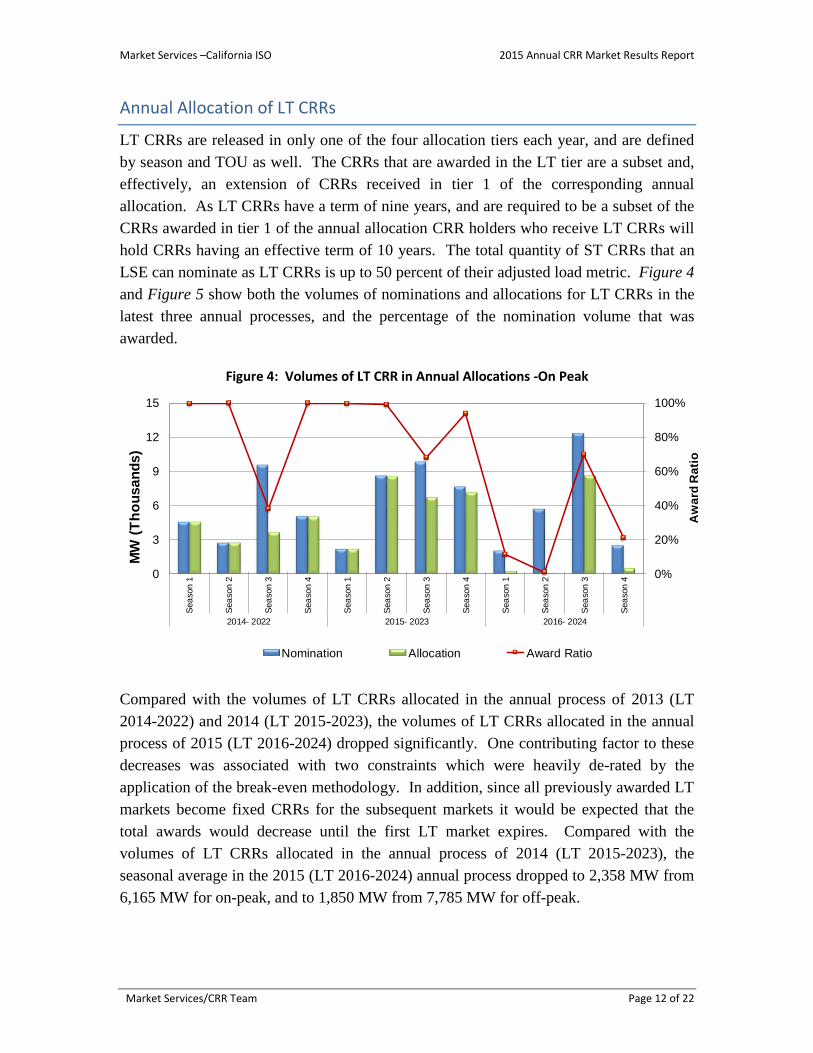
Annual Allocation of LT CRRs
LT CRRs are released in only one of the four allocation tiers each year, and are defined
by season and TOU as well. The CRRs that are awarded in the LT tier are a subset and,
effectively, an extension of CRRs received in tier 1 of the corresponding annual
allocation. As LT CRRs have a term of nine years, and are required to be a subset of the
CRRs awarded in tier 1 of the annual allocation CRR holders who receive LT CRRs will
hold CRRs having an effective term of 10 years. The total quantity of ST CRRs that an
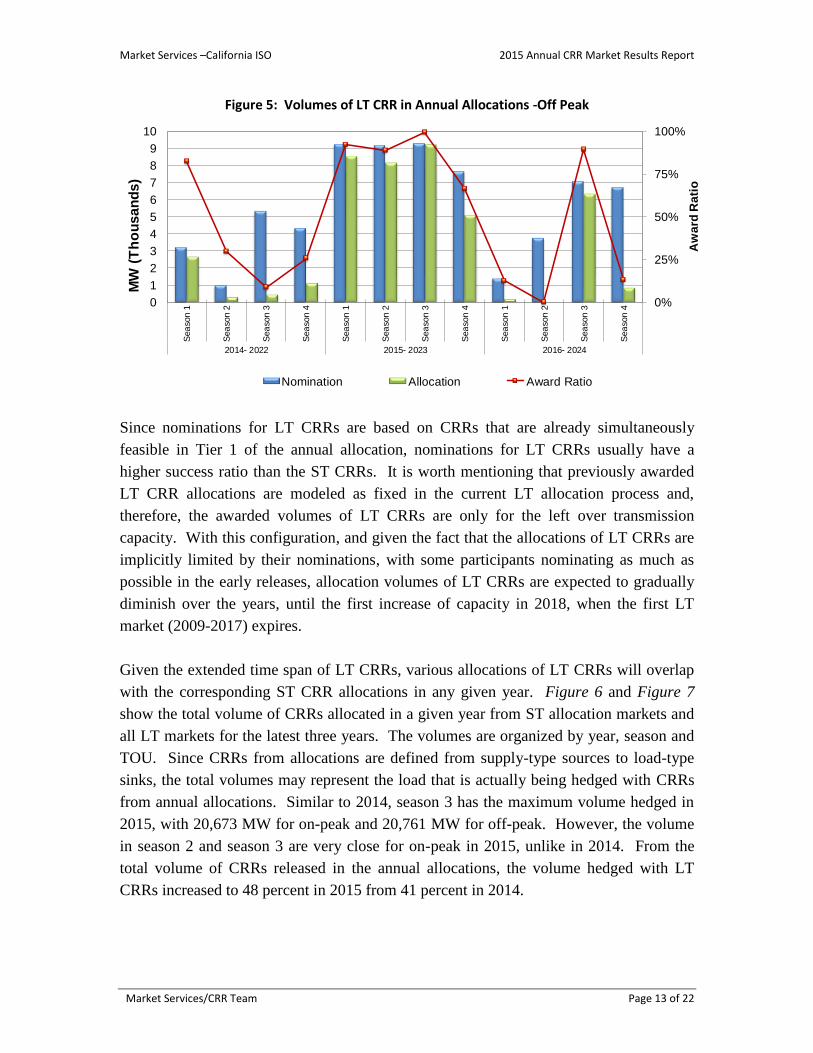
LSE can nominate as LT CRRs is up to 50 percent of their adjusted load metric. Figure 4
and Figure 5 show both the volumes of nominations and allocations for LT CRRs in the
latest three annual processes, and the percentage of the nomination volume that was
awarded.
Figure 4: Volumes of LT CRR in Annual Allocations -On Peak
0%
20%
40%
60%
80%
100%
0
3
6
9
12
15
Sea
son
1
Sea
son
2
Sea
son
3
Sea
son
4
Sea
son
1
Sea
son
2
Sea
son
3
Sea
son
4
Sea
son
1
Sea
son
2
Sea
son
3
Sea
son
42014- 2022 2015- 2023 2016- 2024
Aw
ard
Ra
tio
MW
(T
ho
usan
ds)
Nomination Allocation Award Ratio
Compared with the volumes of LT CRRs allocated in the annual process of 2013 (LT
2014-2022) and 2014 (LT 2015-2023), the volumes of LT CRRs allocated in the annual
process of 2015 (LT 2016-2024) dropped significantly. One contributing factor to these
decreases was associated with two constraints which were heavily de-rated by the
application of the break-even methodology. In addition, since all previously awarded LT
markets become fixed CRRs for the subsequent markets it would be expected that the
total awards would decrease until the first LT market expires. Compared with the
volumes of LT CRRs allocated in the annual process of 2014 (LT 2015-2023), the
seasonal average in the 2015 (LT 2016-2024) annual process dropped to 2,358 MW from
6,165 MW for on-peak, and to 1,850 MW from 7,785 MW for off-peak.
Market Services –California ISO 2015 Annual CRR Market Results Report
Market Services/CRR Team Page 13 of 22
Figure 5: Volumes of LT CRR in Annual Allocations -Off Peak
0%
25%
50%
75%
100%
0
1
2
3
4
5
6
7
8
9
10
Sea
son
1
Sea
son
2
Sea
son
3
Sea
son
4
Sea
son
1
Sea
son
2
Sea
son
3
Sea
son
4
Sea
son
1
Sea
son
2
Sea
son
3
Sea
son
4
2014- 2022 2015- 2023 2016- 2024
Aw
ard
Ra
tio
MW
(T
ho
us
an
ds
)
Nomination Allocation Award Ratio
Since nominations for LT CRRs are based on CRRs that are already simultaneously
feasible in Tier 1 of the annual allocation, nominations for LT CRRs usually have a
higher success ratio than the ST CRRs. It is worth mentioning that previously awarded
LT CRR allocations are modeled as fixed in the current LT allocation process and,
therefore, the awarded volumes of LT CRRs are only for the left over transmission
capacity. With this configuration, and given the fact that the allocations of LT CRRs are
implicitly limited by their nominations, with some participants nominating as much as
possible in the early releases, allocation volumes of LT CRRs are expected to gradually
diminish over the years, until the first increase of capacity in 2018, when the first LT
market (2009-2017) expires.
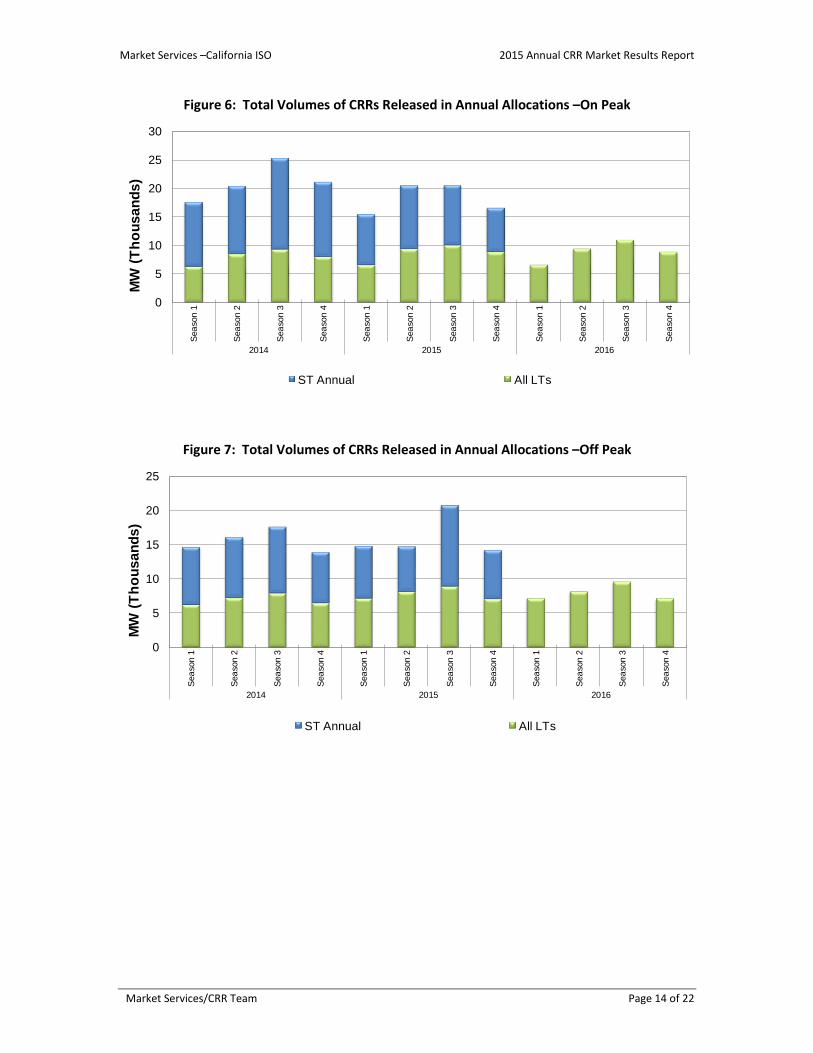
Given the extended time span of LT CRRs, various allocations of LT CRRs will overlap
with the corresponding ST CRR allocations in any given year. Figure 6 and Figure 7
show the total volume of CRRs allocated in a given year from ST allocation markets and
all LT markets for the latest three years. The volumes are organized by year, season and
TOU. Since CRRs from allocations are defined from supply-type sources to load-type
sinks, the total volumes may represent the load that is actually being hedged with CRRs
from annual allocations. Similar to 2014, season 3 has the maximum volume hedged in
2015, with 20,673 MW for on-peak and 20,761 MW for off-peak. However, the volume
in season 2 and season 3 are very close for on-peak in 2015, unlike in 2014. From the
total volume of CRRs released in the annual allocations, the volume hedged with LT
CRRs increased to 48 percent in 2015 from 41 percent in 2014.
Market Services –California ISO 2015 Annual CRR Market Results Report
Market Services/CRR Team Page 14 of 22
Figure 6: Total Volumes of CRRs Released in Annual Allocations –On Peak
0
5
10
15
20
25
30
Sea
son
1
Sea
son
2
Sea
son
3
Sea
son
4
Sea
son
1
Sea
son
2
Sea
son
3
Sea
son
4
Sea
son
1
Sea
son
2
Sea
son
3
Sea
son
4
2014 2015 2016
MW
(T
ho
us
an
ds
)
ST Annual All LTs
Figure 7: Total Volumes of CRRs Released in Annual Allocations –Off Peak
0
5
10
15
20
25
Sea
son
1
Sea
son
2
Sea
son
3
Sea
son
4
Sea
son
1
Sea
son
2
Sea
son
3
Sea
son
4
Sea
son
1
Sea
son
2
Sea
son
3
Sea
son
4
2014 2015 2016
MW
(T
ho
us
an
ds
)
ST Annual All LTs
Market Services –California ISO 2015 Annual CRR Market Results Report
Market Services/CRR Team Page 15 of 22
Auctions
CRR auctions are available in both annual and monthly processes. In these one-tier
auctions, each TOU is treated independently as a market.
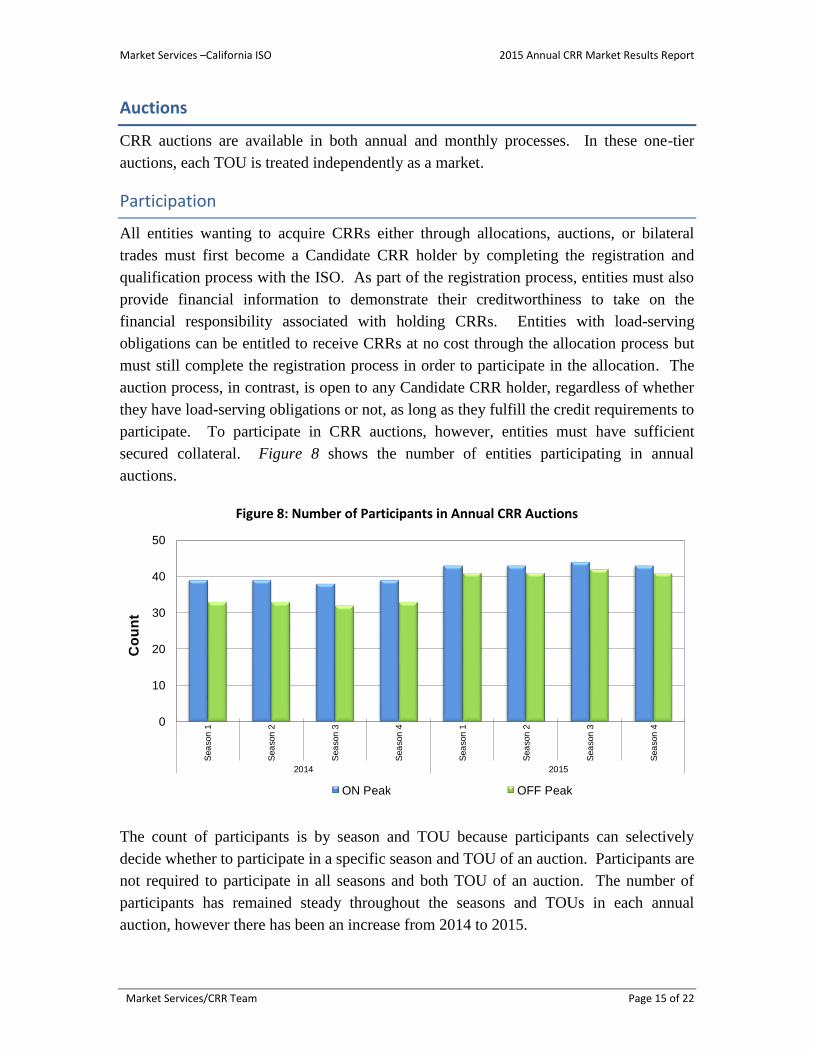
Participation
All entities wanting to acquire CRRs either through allocations, auctions, or bilateral
trades must first become a Candidate CRR holder by completing the registration and
qualification process with the ISO. As part of the registration process, entities must also
provide financial information to demonstrate their creditworthiness to take on the
financial responsibility associated with holding CRRs. Entities with load-serving
obligations can be entitled to receive CRRs at no cost through the allocation process but
must still complete the registration process in order to participate in the allocation. The
auction process, in contrast, is open to any Candidate CRR holder, regardless of whether
they have load-serving obligations or not, as long as they fulfill the credit requirements to
participate. To participate in CRR auctions, however, entities must have sufficient
secured collateral. Figure 8 shows the number of entities participating in annual
auctions.
Figure 8: Number of Participants in Annual CRR Auctions
0
10
20
30
40
50
Sea
son
1
Sea
son
2
Sea
son
3
Sea
son
4
Sea
son
1
Sea
son
2
Sea
son
3
Sea
son
4
2014 2015
Co
un
t
ON Peak OFF Peak
The count of participants is by season and TOU because participants can selectively
decide whether to participate in a specific season and TOU of an auction. Participants are
not required to participate in all seasons and both TOU of an auction. The number of
participants has remained steady throughout the seasons and TOUs in each annual
auction, however there has been an increase from 2014 to 2015.
Market Services –California ISO 2015 Annual CRR Market Results Report
Market Services/CRR Team Page 16 of 22
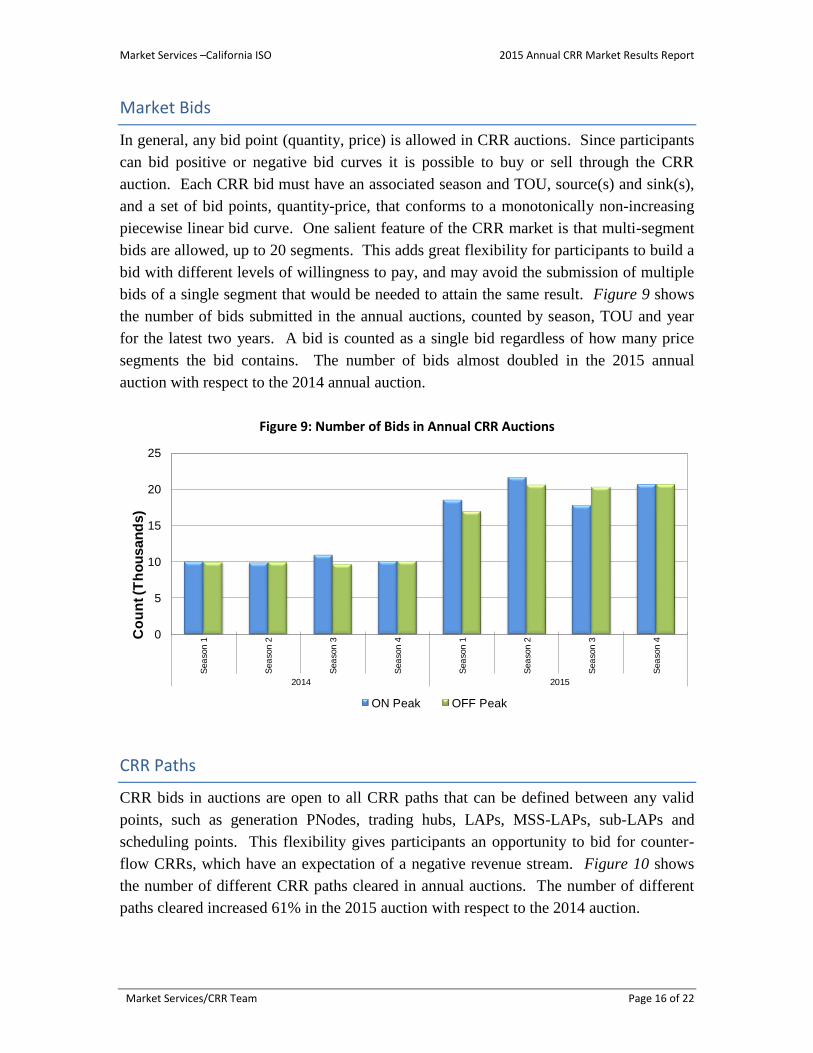
Market Bids
In general, any bid point (quantity, price) is allowed in CRR auctions. Since participants
can bid positive or negative bid curves it is possible to buy or sell through the CRR
auction. Each CRR bid must have an associated season and TOU, source(s) and sink(s),
and a set of bid points, quantity-price, that conforms to a monotonically non-increasing
piecewise linear bid curve. One salient feature of the CRR market is that multi-segment
bids are allowed, up to 20 segments. This adds great flexibility for participants to build a
bid with different levels of willingness to pay, and may avoid the submission of multiple
bids of a single segment that would be needed to attain the same result. Figure 9 shows
the number of bids submitted in the annual auctions, counted by season, TOU and year
for the latest two years. A bid is counted as a single bid regardless of how many price
segments the bid contains. The number of bids almost doubled in the 2015 annual
auction with respect to the 2014 annual auction.
Figure 9: Number of Bids in Annual CRR Auctions
0
5
10
15
20
25
Sea
son
1
Sea
son
2
Sea
son
3
Sea
son
4
Sea
son
1
Sea
son
2
Sea
son
3
Sea
son
4
2014 2015
Co
un
t (T
ho
us
an
ds
)
ON Peak OFF Peak
CRR Paths
CRR bids in auctions are open to all CRR paths that can be defined between any valid
points, such as generation PNodes, trading hubs, LAPs, MSS-LAPs, sub-LAPs and
scheduling points. This flexibility gives participants an opportunity to bid for counter-
flow CRRs, which have an expectation of a negative revenue stream. Figure 10 shows
the number of different CRR paths cleared in annual auctions. The number of different
paths cleared increased 61% in the 2015 auction with respect to the 2014 auction.

Market Services –California ISO 2015 Annual CRR Market Results Report
Market Services/CRR Team Page 17 of 22
Figure 10: Number of Different Paths Cleared in Annual Auctions
0
1,000
2,000
3,000
4,000
5,000
6,000
7,000
8,000
9,000
Sea
son
1
Sea
son
2
Sea
son
3
Sea
son
4
Sea
son
1
Sea
son
2
Sea
son
3
Sea
son
4
2014 2015
Co
un
t
ON Peak OFF Peak
Annual Volumes
Figure 11 shows the trend of bid-in volumes in annual auctions, organized by year,
season and TOU. The bid-in MW volume went up from a seasonal average of 158,685
MW in 2014 to 208,883 MW in 2015, which represents an increase of 32 percent in the
bid-in MW volume. In the 2014 annual auction, participants bid more for on-peak CRRs
than off-peak CRRs across all four seasons, however, in the 2015 annual auction,
participants bid slightly more for off-peak than on-peak CRRs in season three and season
four. Unlike allocations, participants are not limited in auctions to choose from a specific
list of sources and sinks. In the allocation, nominations have to be from valid source
locations and sink locations have to be where the LSE serves its load. However, with the
auction process, this limitation is not present. For auction participants the concept of
‘source’ and ‘sink’ is not relevant since counter-flow bids are allowed. In fact, as seen
through the auction results counter-flow bids are often used to clear the more typical
source to sink CRR paths. When the counter-flow bids are used in the auction they end
up creating capacity for those entities willing to pay for the counter-flow. For this
reason, the level of bid volume has no direct limitations or correlations with actual load
levels, as seen in the allocations.

Market Services –California ISO 2015 Annual CRR Market Results Report
Market Services/CRR Team Page 18 of 22
Figure 11: Bid-in Volume in Annual CRR Auctions
0
50
100
150
200
250
Sea
son
1
Sea
son
2
Sea
son
3
Sea
son
4
Sea
son
1
Sea
son
2
Sea
son
3
Sea
son
4
2014 2015
MW
(T
ho
us
an
ds
)
ON Peak OFF Peak
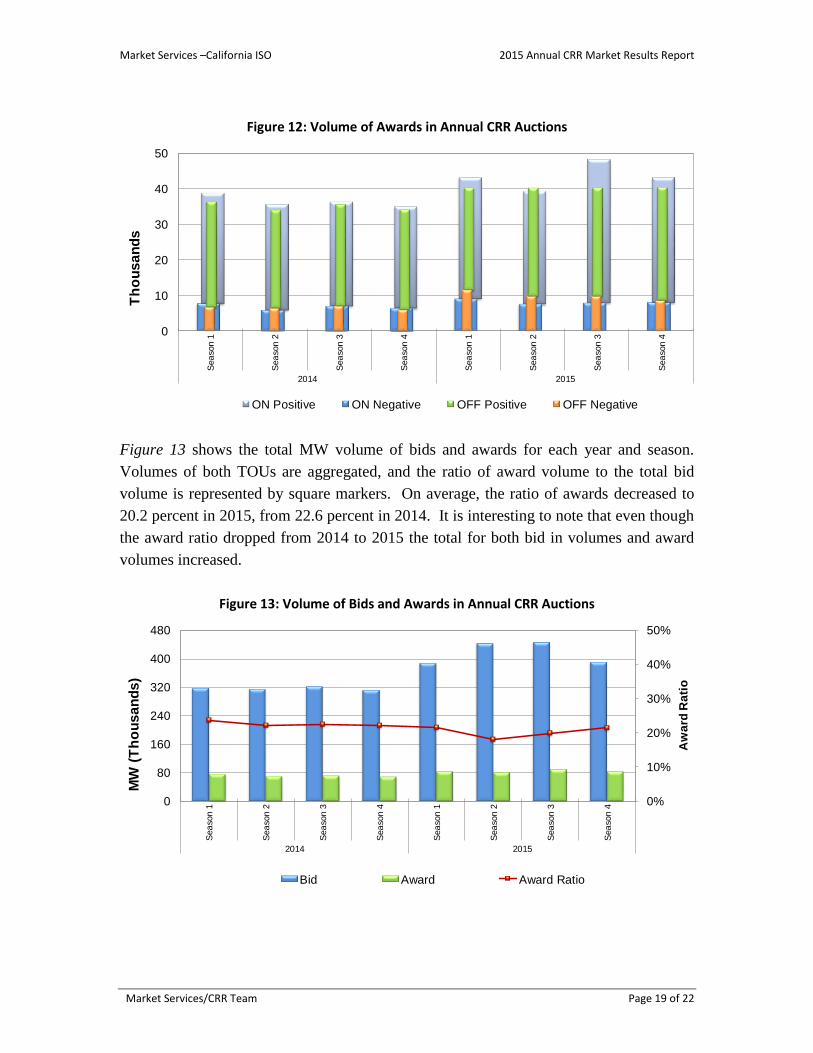
Figure 12 shows the volume of awards in the annual auctions, organized by year, season
and TOU. The average volume of auction awards increased from 35,192 MW and
36,538 MW in off-peak and on-peak periods respectively in 2014 to 40,439 MW and
43,556 MW in off-peak and on-peak respectively in 2015.
A key point in CRR auctions is that participants can bid negatively for CRRs. This will
usually be associated with counter-flow CRRs. The expectation is that an awarded CRR
will have an associated negative price, and this implies that the bidder will be paid to take
on the CRRs. Once the DAM is run for the trade day for which the negatively valued
CRRs were awarded the CRR holder of these negatively valued CRRs would expect to be
charged, i.e., the CRR becomes a liability. There may be some awards that also see
negative prices through the settlement of the DAM LMP/MCCs, even though their
corresponding CRR bid prices were positive, as a by-product of the clearing process that
is based on an overall simultaneous feasibility test. Figure 12 also classifies CRR awards
by the type of payment they are associated with. A volume labeled as positive quantifies
the volume of CRRs sold to participants through the auction (buy bids); i.e., participants
paid to acquire CRRs. On the other hand, volumes labeled as negative quantify the CRR
volume for which participants were paid (sell bids) to acquire CRRs. On average, the
percentage of CRR volume auctioned at negative prices increased to 21.6 percent in 2015
from 18.5 percent in 2014.
Market Services –California ISO 2015 Annual CRR Market Results Report
Market Services/CRR Team Page 19 of 22
Figure 12: Volume of Awards in Annual CRR Auctions
0
10
20
30
40
50
Sea
son
1
Sea
son
2
Sea
son
3
Sea
son
4
Sea
son
1
Sea
son
2
Sea
son
3
Sea
son
4
2014 2015
Th
ou
sa
nd
s
ON Positive ON Negative OFF Positive OFF Negative
Figure 13 shows the total MW volume of bids and awards for each year and season.
Volumes of both TOUs are aggregated, and the ratio of award volume to the total bid
volume is represented by square markers. On average, the ratio of awards decreased to
20.2 percent in 2015, from 22.6 percent in 2014. It is interesting to note that even though
the award ratio dropped from 2014 to 2015 the total for both bid in volumes and award
volumes increased.
Figure 13: Volume of Bids and Awards in Annual CRR Auctions
0%
10%
20%
30%
40%
50%
0
80
160
240
320
400
480
Sea
son
1
Sea
son
2
Sea
son
3
Sea
son
4
Sea
son
1
Sea
son
2
Sea
son
3
Sea
son
4
2014 2015
Aw
ard
Ra
tio
MW
(T
ho
us
an
ds
)
Bid Award Award Ratio
Market Services –California ISO 2015 Annual CRR Market Results Report
Market Services/CRR Team Page 20 of 22
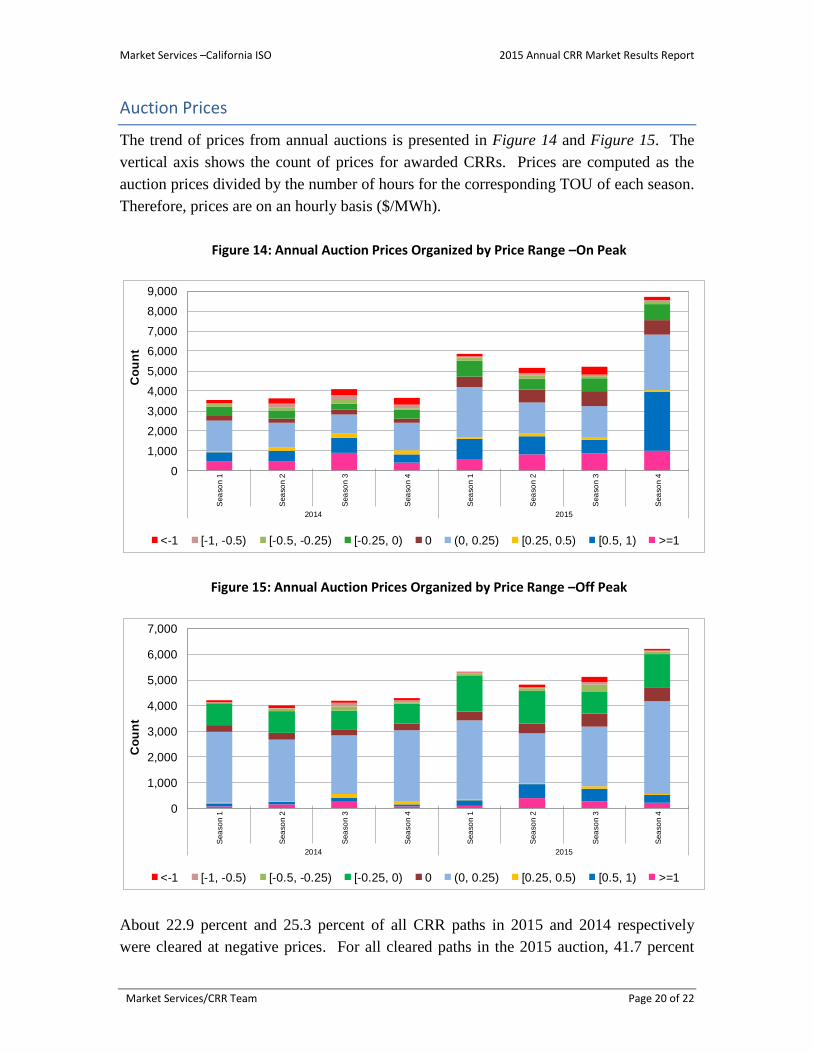
Auction Prices
The trend of prices from annual auctions is presented in Figure 14 and Figure 15. The
vertical axis shows the count of prices for awarded CRRs. Prices are computed as the
auction prices divided by the number of hours for the corresponding TOU of each season.
Therefore, prices are on an hourly basis ($/MWh).
Figure 14: Annual Auction Prices Organized by Price Range –On Peak
0
1,000
2,000
3,000
4,000
5,000
6,000
7,000
8,000
9,000
Sea
so
n 1
Sea
son 2
Sea
son 3
Sea
so
n 4
Sea
son 1
Sea
son 2
Sea
so
n 3
Sea
son 4
2014 2015
Co
un
t
<-1 [-1, -0.5) [-0.5, -0.25) [-0.25, 0) 0 (0, 0.25) [0.25, 0.5) [0.5, 1) >=1
Figure 15: Annual Auction Prices Organized by Price Range –Off Peak
0
1,000
2,000
3,000
4,000
5,000
6,000
7,000
Sea
son 1
Sea
son 2
Sea
son 3
Sea
son 4
Sea
son 1
Sea
son 2
Sea
son 3
Sea
son 4
2014 2015
Co
un
t
<-1 [-1, -0.5) [-0.5, -0.25) [-0.25, 0) 0 (0, 0.25) [0.25, 0.5) [0.5, 1) >=1
About 22.9 percent and 25.3 percent of all CRR paths in 2015 and 2014 respectively
were cleared at negative prices. For all cleared paths in the 2015 auction, 41.7 percent
Market Services –California ISO 2015 Annual CRR Market Results Report
Market Services/CRR Team Page 21 of 22
were at prices between 0 and 0.25 $/MWh and 9.6 percent were at prices 0 $/MWh, while
they were 48.5 percent and 6.1 percent in the 2014 auction.
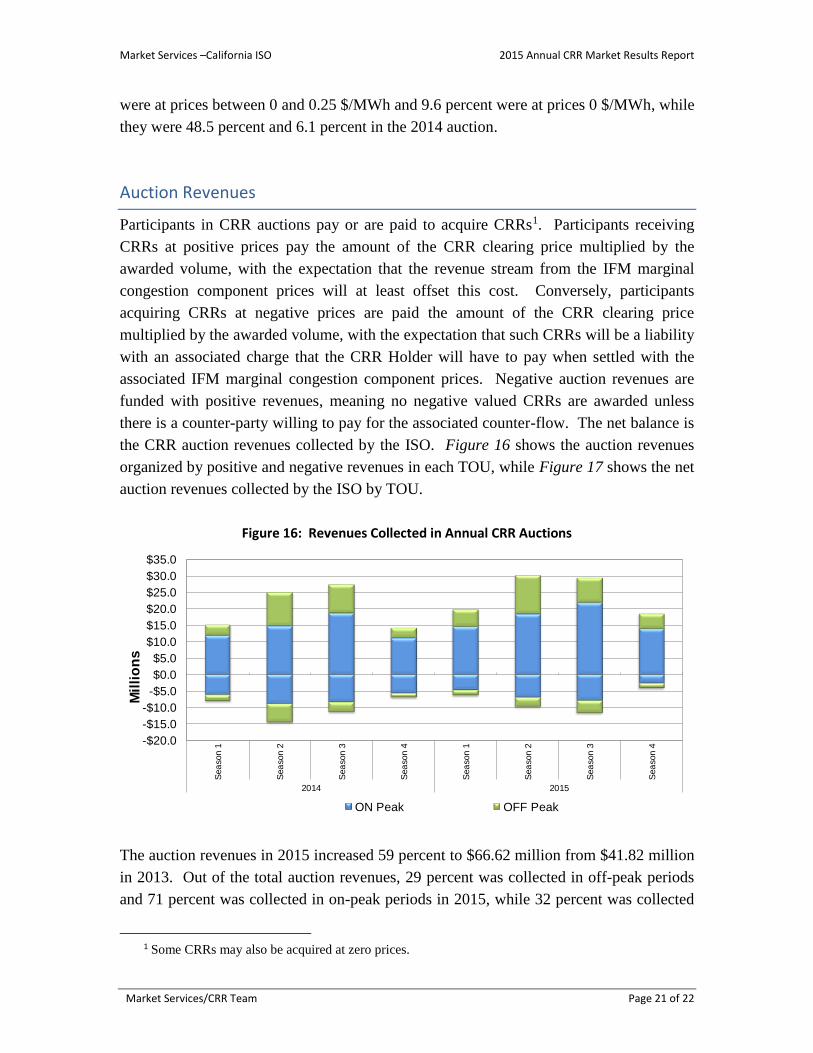
Auction Revenues
Participants in CRR auctions pay or are paid to acquire CRRs1. Participants receiving
CRRs at positive prices pay the amount of the CRR clearing price multiplied by the
awarded volume, with the expectation that the revenue stream from the IFM marginal
congestion component prices will at least offset this cost. Conversely, participants
acquiring CRRs at negative prices are paid the amount of the CRR clearing price
multiplied by the awarded volume, with the expectation that such CRRs will be a liability
with an associated charge that the CRR Holder will have to pay when settled with the
associated IFM marginal congestion component prices. Negative auction revenues are
funded with positive revenues, meaning no negative valued CRRs are awarded unless
there is a counter-party willing to pay for the associated counter-flow. The net balance is
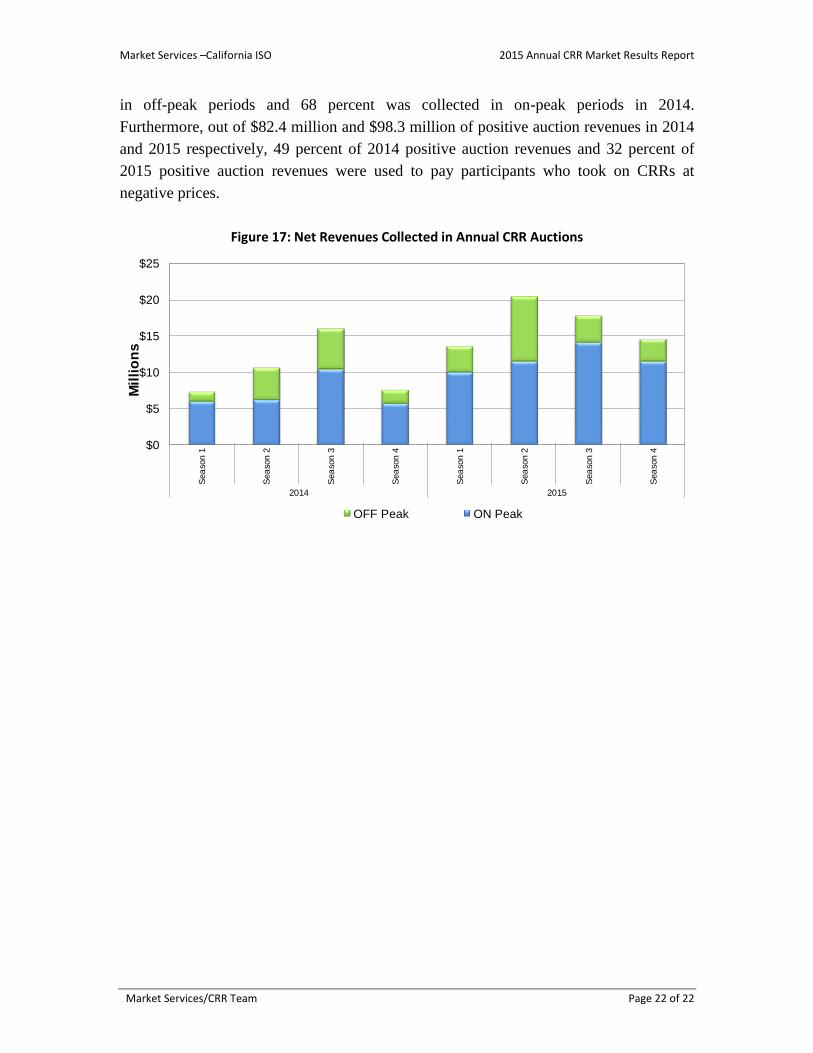
the CRR auction revenues collected by the ISO. Figure 16 shows the auction revenues
organized by positive and negative revenues in each TOU, while Figure 17 shows the net
auction revenues collected by the ISO by TOU.
Figure 16: Revenues Collected in Annual CRR Auctions
-$20.0
-$15.0
-$10.0
-$5.0
$0.0
$5.0
$10.0
$15.0
$20.0
$25.0
$30.0
$35.0
Sea
son
1
Sea
son
2
Sea
son
3
Sea
son
4
Sea
son
1
Sea
son
2
Sea
son
3
Sea
son
4
2014 2015
Mil
lio
ns
ON Peak OFF Peak
The auction revenues in 2015 increased 59 percent to $66.62 million from $41.82 million
in 2013. Out of the total auction revenues, 29 percent was collected in off-peak periods
and 71 percent was collected in on-peak periods in 2015, while 32 percent was collected
1 Some CRRs may also be acquired at zero prices.
Market Services –California ISO 2015 Annual CRR Market Results Report
Market Services/CRR Team Page 22 of 22
in off-peak periods and 68 percent was collected in on-peak periods in 2014.
Furthermore, out of $82.4 million and $98.3 million of positive auction revenues in 2014
and 2015 respectively, 49 percent of 2014 positive auction revenues and 32 percent of
2015 positive auction revenues were used to pay participants who took on CRRs at
negative prices.
Figure 17: Net Revenues Collected in Annual CRR Auctions
$0
$5
$10
$15
$20
$25
Sea
son
1
Sea
son
2
Sea
son
3
Sea
son
4
Sea
son
1
Sea
son
2
Sea
son
3
Sea
son
4
2014 2015
Mil
lio
ns
OFF Peak ON Peak