2015 annual report - arizona@work annual... · 3 2 introduction arizona revised statute §41-5401...
TRANSCRIPT
Workforce Arizona Council
2015 Annual Report

2
1 CONTENTS
2 Introduction .................................................................................................................................................................... 3
3 Services ........................................................................................................................................................................... 4
3.1 Title I: Adult, Youth and Dislocated Workers .......................................................................................................... 4
3.2 Title II: Adult Education ........................................................................................................................................... 5
3.3 Title III: Wagner-Peyser Employment Services ....................................................................................................... 6
3.4 Title IV: Vocational Rehabilitation .......................................................................................................................... 7
4 Participation .................................................................................................................................................................... 8
4.1 Title I: Adult, Youth and Dislocated Workers .......................................................................................................... 8
4.2 Title II: Adult Education ........................................................................................................................................... 9
4.3 Title III: Wagner-Peyser Employment Services ..................................................................................................... 10
4.4 Title IV: Vocational Rehabilitation ........................................................................................................................ 10
5 Outcomes ...................................................................................................................................................................... 10
5.1 Title I: Adult, Dislocated Worker and Youth ......................................................................................................... 10
5.2 Title II: Adult Education ......................................................................................................................................... 11
6 Cost ............................................................................................................................................................................... 11
6.1 Title I: Adult, Dislocated Worker and Youth ......................................................................................................... 11
6.2 Title II: Adult Education ......................................................................................................................................... 11
6.3 Title IV: Vocational Rehabilitation ........................................................................................................................ 12
7 Appendix I: Community Colleges .................................................................................................................................. 14

3
2 INTRODUCTION
Arizona Revised Statute §41-5401 establishes the Workforce Arizona Council (State Council) and outlines requirements
for its Annual Report. The State Council has been busy over the last year building capacity within the system to not only
comply with federal regulations but to go beyond and champion a system that reflects the needs and desires of
Arizona’s people. Its efforts have been consolidated into four categories and four standing committees:
Performance Excellence;
Measuring Effectiveness;
Strategic Communications and Partnerships; and
Quality Workforce.
The Workforce Innovation and Opportunity Act (WIOA) Program Year 2015 (PY 2015) was one of great transition for
Arizona’s workforce development system. Transitioning from the previous federal law to the new provisions of WIOA is
creating great opportunities for innovative approaches to serving the needs of individuals looking for work and
companies looking for assistance in filling workforce needs. The new law requires increased focus on emboldening the
system to be one that produces a high quality workforce capable of meeting the changing needs of Arizona employers.
WIOA authorizes the one–stop career center service delivery system and six core programs. The four core programs are:
Title I: Adult, Dislocated Worker and Youth formula programs;
Title II: Adult Education and Literacy Act;
Title III: Wagner–Peyser Act employment services; and
Title IV: Rehabilitation Act programs.
The state’s core partners responsible for these programs include the Arizona Department of Economic Security (DES) and the Arizona Department of Education (ADE) with the Office of Economic Opportunity (OEO) providing staffing support to the State Council. These state entities, along with the state’s 12 local workforce development areas (LWDAs), have been working collaboratively to implement the new federal regulations.
Arizona currently uses three distinct data management systems across the six core programs for federal reporting. In
the future, Arizona will work toward developing a web-based system that leverages the existing state systems for
maximum secure data sharing with minimal new cost investment. In the meantime, state partners are initially
developing a solution to facilitate data sharing between current systems in order to meet the immediate requirements
of WIOA performance management and program reporting.
The information shared in the following report presents data from each Title divided into the topics of services,
participation, outcomes and cost. Due to the fact that the state currently uses three different data management
systems, participants in the system may be counted more than once across the four titles and information may not be
defined the same. In addition, not all of the reporting elements required by the Annual Report are currently applicable
to each title, so the data may appear incomplete. The data for Title II: Adult Education is not yet available for PY 2015,
so the data in this report is from PY 2014. In the future, the State Council intends to work with the state partners to
create a stronger template for this Annual Report and continue to work on improving the system’s data connections.
4
3 SERVICES
Arizona has a strong foundation for providing workforce development activities due to its long history of locally established
workforce partners, adult education, and vocational rehabilitation programs. State policy provides workforce system
partners with instruction and guidance on the ARIZONA@WORK seamless delivery system. Through this system, clients
can access a broad range of employment and training–related services at a single point of entry. The following programs
deliver services through the ARIZONA@WORK system.
Adult, Youth, and Dislocated Worker (Title I)
Adult Education and Literacy (Title II)
Programs authorized under the Wagner–Peyser Act (Title III (Employment Service))
Vocational Rehabilitation (Title IV)
Career and technical education programs at the postsecondary level authorized under the Carl D. Perkins Career and Technical Education Act of 2006
Employment and training activities carried out under the community Services Block Grant Act
Employment and training activities carried out by the Department of Housing and Urban Development
Jobs for Veterans State Grants programs authorized under chapter 41 of title 38, United States Code
Programs authorized under State unemployment compensation laws
Programs authorized under section 212 of the Second Chance Act of 2007
Programs authorized Part A of title IV of the Social Security Act
The Senior Community Services Employment Program authorized under Title V of the Older Americans Act of 1965
Trade Adjustment Assistance activities authorized under chapter 2 of title II of the Trade Act of 1974
3.1 TITLE I: ADULT, YOUTH AND DISLOCATED WORKERS
The Adult, Dislocated Worker, and Youth Programs comprise the WIOA Title I–B workforce development programs. These
programs offer an assortment of employment and training activities designed to prepare participants for employment
that will lead to financial stability and economic security for themselves and their families. The programs are co–located
in the ARIZONA@WORK Job Centers in Arizona.
Youth Program
The Youth program serves eligible in–school youth ages 14–21 and out–of–school youth ages 16–24. The youth program
is designed to prepare Arizona’s youth to enter postsecondary education, training, or employment upon completion of
designated program activities. The design framework of the youth program includes outreach and recruitment, objective
assessment, development of an Individual Service Strategy (ISS), case management, supportive services and follow–up
services. The youth participants are enrolled in one or more of the 14 required youth program elements based on the
youth’s needs as identified in the ISS. Program elements can include tutoring, alternative services, paid and unpaid work
experiences, occupational skills training, adult mentoring, financial literacy education, and leadership development
activities.
Youth programs in Arizona have been serving in–school youth and out–of–school youth at an approximate ratio of fifty
percent each, based on approved expenditures. In Program Year (PY) 2014, Arizona exceeded the U.S. Department of
Labor’s (U.S. DOL’s) negotiated performance targets for statewide youth services. Six local areas exceeded all negotiated
measures for youth, and only two areas did not meet all negotiated levels.

5
LWDAs work with numerous community partners on initiatives designed to assist youth with the transition to
employment, such as:
Youth programs that provide work experience and help with the transition from high school to employment including TeenWorks in Coconino County and the Arizona Integrated Basic Education Skills Training (AZ–IBEST) Construction Degree Program in Navajo/Apache Counties.
Services to help offenders re–entering the community or youth on probation, including the Smart Justice initiative in Maricopa County, YouthBuild in Phoenix, or the EAGLES program in Mohave County.
Arizona Call–a–Teen Youth Resources, which has managed a regional collaboration for Phoenix and Maricopa County in partnership with the Bureau of Land Management and the Student Conservation Association since 2011, providing opportunity for hands–on work experience.
The Pima Vocational High School works with out–of–school and other at–risk youth, with a focus on high school completion and preparation for employment.
Adult and Dislocated Worker Programs
The Adult and Dislocated Worker programs have two types of services: Career Services and Training Services. The Adult
Program provides workforce investment activities designed to assist individuals, particularly those with barriers to
employment, increasing access to employment, retention, earnings, and the attainment of recognized postsecondary
credentials. Services for adults age 18 and older are provided by all 12 LWDAs. The Adult Program provides priority of
service to veterans, public assistance recipients, other low–income individuals, and individuals who are basic–skills
deficient. Self–service is available to all Arizonans at the ARIZONA@WORK Job Centers or via the AJC website, including
job search, orientation, and group workshops.
The Dislocated Worker Program provides services to individuals who have been terminated, laid off, or received a notice
of termination or layoff from employment, generally due to closures or downsizing. Self–employed individuals who are
unemployed due to general economic conditions and individuals who meet the WIOA definition of a displaced homemaker
may also be eligible for services.
Arizona exceeded its negotiated performance levels for the Adult Program and met or exceeded the negotiated
performance levels for the Dislocated Worker Program in PY 2014. All 12 local areas met or exceeded their U.S. DOL
performance levels for the Adult and Dislocated Worker Programs in PY 2014.
LWDAs engage in numerous partnerships and initiatives in their communities, working directly with partner agencies or
participating in grant–funded activities, to support youth, veterans, and individuals with disabilities and other barriers.
3.2 TITLE II: ADULT EDUCATION Arizona Adult Education, in adherence to WIA and WIOA implemented services to assist adults (aged 16 and older and
not enrolled in school) in becoming literate, obtaining knowledge and skills necessary for employment and self-
sufficiency, obtaining the skills necessary to become full partners in their children’s education, competing secondary
school education, transitioning to postsecondary education or training, improving reading, writing, and comprehension
skills for English language learners, and acquiring an understanding of the American system of government.
There are 24 adult education programs funded throughout Arizona to provide the following educational services:
Adult Basic Education (ABE) – Instruction in reading, writing and math up to the 8th grade level

6
Adult Secondary Education (ASE) – Instruction in reading, writing, math, science and social studies at the 9th-12th
grade level and higher, generally provided to prepare students to take the High School Equivalency (HSE) test to
earn a HSE secondary diploma
English Language Acquisition for Adults (ELAA) – Instruction in communication and comprehension skills for
English language learners
Civics engagement for English language learners
Arizona Integrated Based Education Skills Training (AZ IBEST)
Distance Education and Hybrid Learning instructional delivery
3.3 TITLE III: WAGNER-PEYSER EMPLOYMENT SERVICES
Employment Service is a network of public employment offices providing placement services for jobseekers and labor
force recruitment services for employers. Employment Service is co–located with workforce development services in all
ARIZONA@WORK Job Centers throughout the state. Services are delivered in one of three modes: self–service, facilitated
self–help services and staff–assisted service. Employment Service focuses on providing a variety of employment–related
labor exchange services including, but not limited to:
• Employability Assessment; • One–on–one initial registration in the Arizona Job Connection (AJC); • Review on–line employability assessments for possible referral to other programs; • Referrals to partner services within the ARIZONA@WORK Job Center; • Discussion job search techniques; • Assessing and referring jobseeker to job search workshops; • Job search assistance; • Job referral and placement assistance for jobseekers; • Providing labor market information; • Resume preparation; • Job development; • Re–employment services to Unemployment Insurance claimants; • Priority of service to veterans and their spouses which may include referral to the Disabled Veterans Outreach
Program (DVOP) Coordinator; • Assisting migrant and seasonal farmworkers with the “MSFW Outreach Packet,” developed to provide critical
information concerning access to services in their area; • Assessment of eligibility for the Work Opportunity Tax Credit (WOTC) and issue certification for jobseekers found
eligible; and • Recruitment services for employers with job openings.
Employment Service assists jobseekers from all walks of life and is committed to working with the partners within the
ARIZONA@WORK system to ensure jobseekers have access to the full menu of services available. Certain populations
require more assistance than the standard jobseeker, at times requiring staff to spend more time with them. Some
examples are:
• Veterans; • Homeless veterans; • Low–income clients and recipients of public assistance; • Ex–Offenders; • Individuals with limited English proficiency; • Unemployment compensation claimants;

7
• Unemployed, underemployed individuals; • Migrant and seasonal farm workers; • Older workers; and • Individuals with a disability.
Employment Service staff serves on Local Workforce Development Boards (LWDBs). The partnerships developed through
LWDBs provide staff the opportunity to share information gained from both employers and jobless workers, allowing
community leaders to better identify the types of training that will prepare unemployed workers for needed local jobs.
Employment Service staff also participate on the Business Service Team in each area allowing the partnership built in the
ARIZONA@WORK Job Center to be more responsive to the needs of the business community. Local offices routinely
receive employers’ requests for workers to fill a wide range of jobs from entry level to highly qualified positions. Among
them are professional, technical, and managerial positions, clerical and sales jobs, service occupations, manufacturing
work, agricultural employment, machine trades, and skilled crafts.
With the implementation of WIOA, Employment Service staff has taken on a new role in the ARIZONA@WORK Job Center
by participating in the design, implementation and provision of services through the Welcome Team. In some instances
the roles are shared with the partners for a seamless delivery of services, including but not limited to:
• Front desk screening for services; • Conducting ARIZONA@WORK orientations; • Completing partial registration of the customer in AJC during the triage process; • Determining the appropriate provision of services and completing a referral; and • Scheduling appointments for services within the ARIZONA@WORK system.
Cross–training and information sharing sessions will be held to ensure that Employment Service staff have the knowledge
to provide quality services to the jobseeker, therefore enhancing their customer experience within the ARIZONA@WORK
system.
3.4 TITLE IV: VOCATIONAL REHABILITATION
The purpose of the Vocational Rehabilitation (VR) program is to provide persons with disabilities with the services and
supports they need to overcome disability–related barriers to employment and become an integral part of the workforce.
VR services are provided statewide through a comprehensive network of staff and contracted service providers who are
trained to meet the unique needs of persons with disabilities, including those who are visually impaired or blind, hard of
hearing or deaf, who have experienced a traumatic brain or spinal cord injury, have a mental health diagnosis or are a
youth with a disability. The VR program utilizes Employer Coordinators to collaborate with local businesses and increase
awareness of the large, often over–looked, talent pool of people with disabilities. Employer needs are addressed and
employment opportunities for persons with disabilities are enhanced through activities such as coordinated job fairs, job
preparation seminars, and employer panels.
Persons eligible for VR services must have a physical or mental disability that creates a barrier to employment and must
be able to benefit from VR services in terms of achieving an integrated and competitive employment outcome. Services
are individualized and adapted to meet each client’s specific vocational goals and disability–related needs. Services may
include, but are not limited to, assessments for determining eligibility and rehabilitation needs, vocational counseling and
guidance, job development and retention services, vocational and educational training and support services, mobility
training, adjustment to disability services, and rehabilitation technology. The VR program also provides post–employment

8
services and coordination of Extended Supported Employment services to enhance job retention and/or help an individual
regain employment in an efficient manner.
The Arizona VR program believes that education and training are vital to preparing persons with disabilities for
employment and enhancing opportunities for the attainment of high quality employment outcomes. All clients receive
career counseling and may participate in various assessments to determine interests and aptitudes, as well as the need
for accommodations and support services. Clients may begin preparing for employment through participation in work
adjustment training, on–the–job training, apprenticeships, vocational/occupational training, or undergraduate and
graduate degree programs. Support services such as coaching, assistive technology, tutoring, and assistance with
obtaining necessary accommodations may be provided to support the successful completion of the training endeavors.
Provision of Education and Training Services and Supports
Clients receive career counseling and assessments to assist in determining aptitude, skills, abilities, weaknesses, and the
need for accommodations and support services. Tuition assistance for occupational/vocational training, undergraduate
and graduate degree programs are provided based on an individual’s ability to complete the educational requirements.
Additionally, on–the–job training and apprenticeship opportunities are sought out and provided whenever available.
The VR program prepares persons with disabilities to be competitive in the labor market by offering services such as
occupational/vocational training as well as undergraduate and advanced degrees. The VR program has the unique ability
to support individuals in attending specialized or out–of–state schools for disability–related reasons, and Arizona VR
clients have graduated from schools such as the Rochester Institute of Technology for the Deaf and Gallaudet University
in New York. Education and training support services vary based on student need but many individuals receive tutoring,
assistive technology, supplies/tools, and assistance arranging accommodations with the school’s Disability Resource
Center. In Federal Fiscal Year (FFY) 2015, 1,470 individuals participated in a plan of services and received educational
training supported by the VR program, and a total of $5,826,857 was spent to fund these educational endeavors.
4 PARTICIPATION
4.1 TITLE I: ADULT, YOUTH AND DISLOCATED WORKERS
WIA/Title IB PY15
Qualifying Wage Rate by County N/A
Number of Businesses Recruited N/A
Number of Approved Applicants ==
Adults 9,230
Dislocated Worker 2,071
Older Youth 1,186
Younger Youth 1,966
Total number of Approved Applicants
Number of Persons Hired ==
Adults 1,728
Dislocated Worker 845

9
Older Youth 684
Younger Youth N/A
Total number of Persons Hired
Number of Incumbent Workers Trained ==
Racial/Ethnic Background ==
White 6,941
Black/African American 1,524
Ethnicity Hispanic/Latino 6,898
American Indian/Alaskan Native 1,101
Asian 218
Asian Pacific Islander 68
Other/Not Provided/Unknown 2,149
Average Salary Paid N/A
Breakdown of Full-Time and Part-Time Jobs ==
Full – Time N/A
Part – Time N/A
Leveraged Training Resources [co-enroll Dislocated Worker (DW) & Trade Adjustment Act (TAA)]
97
Section 41 – 1543 Summary N/A
The number of grant applications denied due to either of the following:
Insufficient available grant money or
Inability to meet the qualifying wage rate
N/A
N/A
4.2 TITLE II: ADULT EDUCATION
Participation PY 14
Educational Functioning Level at Program Entry
Number of Participants Total Service Hours
ABE Beginning Literacy 277 23,831
ABE Beginning Basic Education 1,907 192,339
ABE Intermediate Low 2,925 271,483
ABE Intermediate High 2,213 197,431
ASE Low 542 40,059
ASE High 375 25,507
Beginning ESL Literacy 1,597 165,548
Low Beginning ESL 1,082 124,636
High Beginning ESL 1,056 129,265
Low Intermediate ESL 946 117,367
High Intermediate ESL 470 62,384
Advanced ESL 110 14,473
Total 13,500 1,364,323
*The dates for PY 14 are July 1, 2014 through June 30, 2015. Adult Education data for PY 2015 is not yet available.

10
4.3 TITLE III: WAGNER-PEYSER EMPLOYMENT SERVICES
The total number of participants in the services provided by Wagner-Peyser Employment Services in PY 2015 is 103,754. The exiters that received Career Guidance was 8,555. Title III JS Program does not provide training services, however 16,366 exiters were referred to WIOA title I.
4.4 TITLE IV: VOCATIONAL REHABILITATION
Client Closures: SFY 2015 SFY 2016
Status 26 1739 1871
Status 28 1310 1914
Total Closures (Statuses 26 and 28) 3049 3785
5 OUTCOMES
5.1 TITLE I: ADULT, DISLOCATED WORKER AND YOUTH
PY 2015***
Measure Goal Actual Met/Exceed
Youth (14 – 21) Placement in Employment or Education 64.5% 72.3% Exceed
Youth (14 – 21) Attainment of Degree or Certificate 61.9% 65.9% Exceed
Youth (14 – 21) Literacy and Numeracy Gains 51.5% 59.5% Exceed
Adult Entered Employment 75.3% 77.0% Exceed
Adult Six Month Retention 84.5% 86.5% Exceed
Adult Average Earnings $13,200 $14,354 Exceed
Dislocated Workers Entered Employment 83.8% 79.9% Met
Dislocated Workers Six Month Retention 89.5% 90.9% Exceed
Dislocated Workers Average Earnings $16,700 $19,612 Exceed
Employer Customer Satisfaction 71.0% 72.3% Exceed
Participant Customer Satisfaction 71.0% 56.8% Met
Source: WIA Title 1B Annual Report submitted to U.S. Department of Labor
Met – Actual performance within 80% of the negotiated goal; Exceed – Actual performance more than 100% of negotiated goal
***PY2015 – Timeframe is July 1, 2015 – June 30, 2016

11
5.2 TITLE II: ADULT EDUCATION
Outcomes PY 14
Educational Functioning Level at Program Entry
Number of Participants Participants Who Earned an Educational Gain
ABE Beginning Literacy 277 163
ABE Beginning Basic Education 1,907 1,026
ABE Intermediate Low 2,925 1,577
ABE Intermediate High 2,213 995
ASE Low 542 209
ASE High 375 112
Beginning ESL Literacy 1,597 995
Low Beginning ESL 1,082 743
High Beginning ESL 1,056 668
Low Intermediate ESL 946 575
High Intermediate ESL 470 224
Advanced ESL 110 23
Total 13,500 7,310
Participants who earned a High School Equivalency Diploma 392 *Employment outcomes not available due to lack of UI wage data matching availability. **Postsecondary outcomes not available due to lack of National Student Clearinghouse data matching availability.
***The dates for PY 14 are July 1, 2014 through June 30, 2015. Adult Education data for PY 2015 is not yet available.
6 COST
6.1 TITLE I: ADULT, DISLOCATED WORKER AND YOUTH
Program Cost
Program PY 2015 Participants Cost per Participant
Overall for all programs* 14,453 $2,873
Adult Program 9,230 $1,405
Dislocated Worker Program 2,071 $5,496
Youth Program 3,152 $3,862 *Overall includes Administrative Expenses
6.2 TITLE II: ADULT EDUCATION
Program Cost PY 14
Program Participants Cost per Participant
Overall for all programs 13,500 $ 1,172
Adult Basic Education and Adult Secondary Education 8,239 $1,040
English Language Acquisition for Adults 5,261 $ 819 *Overall includes Administrative Expenses
**The dates for PY 14 are July 1, 2014 through June 30, 2015. Adult Education data for PY 2015 is not yet available.

12
6.3 TITLE IV: VOCATIONAL REHABILITATION
Client Cost Summary SFY 2015 SFY 2016
Total Cost for Paid Services, All Clients $59,339,800 $67,300,100 Unduplicated Ct. of Clients Receiving Service(s)
8,700 9,100
Average Cost per Client $6,800 $7,400
SFY 2015 Cost per Service
Service Description Cost of Paid
Services Client Count per Service
Avg Cost per Client, per Service
Assessment $7,978,500 3,600 $2,216
College or University Training $5,747,200 1,200 $4,789
Diagnoses and Treatment of Impairments $5,825,500 800 $7,282
Disability Related Skills Training $13,042,700 700 $18,632
Job Placement/Readiness $8,823,900 3,000 $2,941
Maintenance $327,000 200 $1,635
Occupational or Vocational Training $3,050,400 1,000 $3,050
On the Job Support or Training $960,200 800 $1,200
Other Services $2,268,000 1,900 $1,194
Rehabilitation Technology $3,015,800 800 $3,770
Transition School to Work $6,881,000 3,700 $1,860
Transportation $1,419,500 2,100 $676
Grand Total $59,339,700
SFY 2016 Cost per Service
Service Description Cost of Paid
Services Client Count per Service
Avg Cost per Client, per Service
Assessment $9,487,800 3,600 $2,636
College or University Training $6,134,900 1,300 $4,719
Diagnoses and Treatment of Impairments $4,944,100 900 $5,493
Disability Related Skills Training $14,705,200 900 $16,339
Job Placement/Readiness $13,238,800 3,800 $3,484
Maintenance $448,200 200 $2,241
Occupational or Vocational Training $3,118,900 1,000 $3,119
On the Job Support or Training $481,400 500 $963
Other Services $2,319,100 2,100 $1,104

13
Rehabilitation Technology $3,876,700 1,000 $3,877
Transition School to Work $6,712,600 4,200 $1,598
Transportation $1,832,400 2,400 $764
Grand Total $67,300,100
14
7 APPENDIX I: COMMUNITY COLLEGES

ARIZONA COMMUNITY COLLEGE COORDINATING COUNCIL
DATA FOR THE WORKFORCE ARIZONA COUNCIL ANNUAL REPORT
A.R.S. §41.1542 (C, D)
FY 2015-16
Data Provided by: Arizona Community College Coordinating Council Districts
Report Prepared by: Arizona Community College Coordinating Council
November 1, 2016
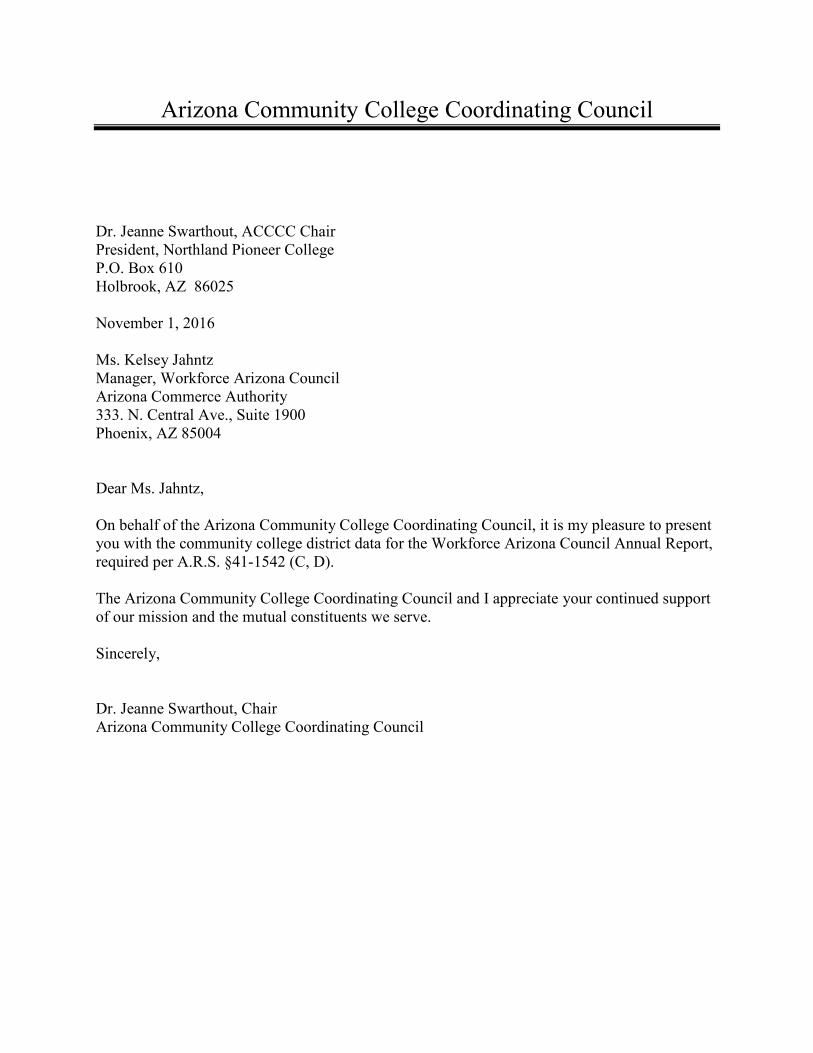
Arizona Community College Coordinating Council Dr. Jeanne Swarthout, ACCCC Chair President, Northland Pioneer College P.O. Box 610 Holbrook, AZ 86025 November 1, 2016 Ms. Kelsey Jahntz Manager, Workforce Arizona Council Arizona Commerce Authority 333. N. Central Ave., Suite 1900 Phoenix, AZ 85004 Dear Ms. Jahntz, On behalf of the Arizona Community College Coordinating Council, it is my pleasure to present you with the community college district data for the Workforce Arizona Council Annual Report, required per A.R.S. §41-1542 (C, D). The Arizona Community College Coordinating Council and I appreciate your continued support of our mission and the mutual constituents we serve. Sincerely, Dr. Jeanne Swarthout, Chair Arizona Community College Coordinating Council

ACKNOWLEDGEMENTS
The Arizona Community College Coordinating Council (ACCCC) prepared this report on behalf of the community college districts. Each community college district provided the data contained in this report through their institutional effectiveness/research offices. ACCCC thanks the following individuals and the members of their staff. Without their efforts the preparation of this document would not have been possible. Cochise Community College District Jordan Fischer, Analyst, Office of Institutional Research Sandy Bryan, Dean of Institutional Effectiveness Coconino Community College District Jane Jarboe, IR Functional Analyst Michael Merica, Director of Institutional Research Eastern Arizona Community College District Teresa Bailey, Analyst, Institutional Research Glen Snider, Director of Institutional Research Maricopa County Community College District John Catapano, Manager, Research & Communications, Workforce Development Kerry Mitchell, Director of Research, Office of Institutional Effectiveness Mohave Community College District Shelly Castañeda, Office of Institutional Research Bob Faubert, Director of Institutional Research Navajo Community College District Debra Myers, Office of Institutional Effectiveness Jeremy Raisor, Director of Enrollment Pima County Community College District David Purkiss, Research Project Manager, Institutional Research, Planning & Effectiveness Del Dawley, IT Principal Analyst, Planning & Institutional Research Dr. Nicola Richmond, Asst. Vice Chancellor of Planning & Institutional Research Pinal County Community College District Gina Carlock, Research Assistant, Institutional Research Yavapai Community College District Leo Derks, Office of Institutional Effectiveness Tom Hughes, Director, Office of Institutional Effectiveness

Yuma/La Paz Community College District Marisela Dickman, Institutional Research Analyst Dr. Mary Schaal, Dean of Institutional Effectiveness, Research & Grants Laurie Black (Administrative Assistant, Office of Institutional Effectiveness, Maricopa County Community College District) compiled this report on behalf of ACCCC.
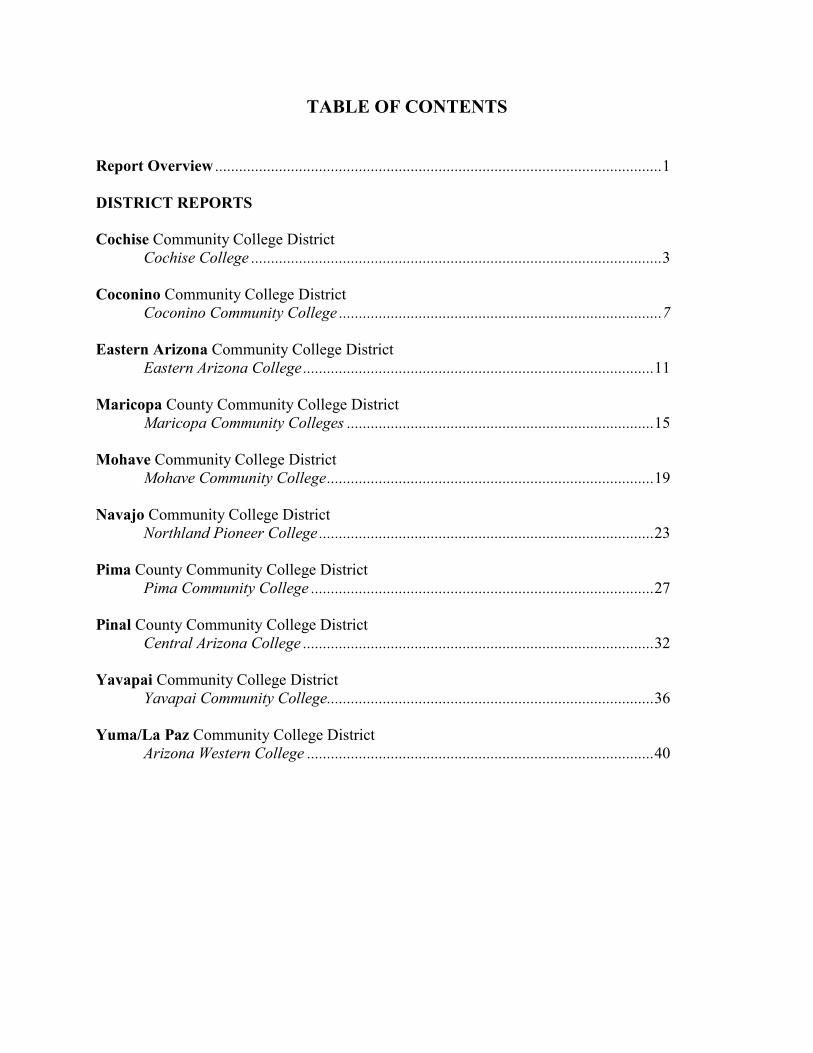
TABLE OF CONTENTS
Report Overview ................................................................................................................1 DISTRICT REPORTS Cochise Community College District
Cochise College .......................................................................................................3
Coconino Community College District Coconino Community College .................................................................................7
Eastern Arizona Community College District
Eastern Arizona College ........................................................................................11 Maricopa County Community College District
Maricopa Community Colleges .............................................................................15 Mohave Community College District
Mohave Community College ..................................................................................19
Navajo Community College District Northland Pioneer College ....................................................................................23
Pima County Community College District
Pima Community College ......................................................................................27 Pinal County Community College District
Central Arizona College ........................................................................................32 Yavapai Community College District
Yavapai Community College..................................................................................36 Yuma/La Paz Community College District
Arizona Western College .......................................................................................40

REPORT OVERVIEW This document provides workforce data for the most recently ended fiscal year, as required by A.R.S. §41-1542 (C, D). The information is provided using definitions consistent with previous years. This file provides the merged data; separate files submitted electronically provide the data in Word and Excel format. In the absence of the common definition of the Workforce/Occupational Enrollment and FTSE for this report, the district own methodologies for retrieving these data. Cochise Community College District The enrollment is the count of occupational/workforce courses taken by students.
FTSE is calculated following the state formula, but including only the occupational/workforce courses. 1 FTSE = 30 credit hours. Coconino Community College District The enrollment is the headcount of students, enrolled in workforce/occupational programs, unduplicated.
FTSE formula is to sum the number of full-time equivalent students enrolled as of forty-five days after classes begin. Eastern Arizona Community College District The enrollment is the headcount of students, enrolled in workforce/occupational programs, unduplicated.
FTSE formula is to sum total completed credits and then divide by 30, according the state formula. Maricopa County Community College District The enrollment is the count of occupational/workforce courses taken by students. A student is counted once for each occupational course they are enrolled in during the year.
Annual vocational FTSE is reported following the State Auditor's office requirements. Mohave Community College District The enrollment is the count of occupational/workforce courses taken by students.
FTSE is calculated following the state formula, but including only the occupational/workforce courses.

Navajo Community College District The enrollment is the count of occupational/workforce courses taken by students.
FTSE is calculated following the state formula, but including only the occupational/workforce courses. Pima County Community College District The enrollment is the count of occupational/workforce courses taken by students.
FTSE is calculated following the state formula, but including only the occupational/workforce courses. Pinal County Community College District The enrollment is the headcount of students, enrolled in workforce/occupational programs, duplicated by program.
FTSE formula is to add the number of full-time equivalent students enrolled as of forty-five days after classes begin in the fall semester to the number of full-time equivalent students enrolled as of forty-five days after classes begin in the spring semester, not including additional short-term classes. Yavapai Community College District The enrollment is the headcount of students, enrolled in workforce/occupational programs, unduplicated.
FTSE formula is to sum total completed credits and then divide by 30. Yuma/La Paz Community College District The enrollment is the count of all courses taken by students college-wide.
FTSE formula is to add total credits enrolled and total credits completed, divide that number by two, and then divide that number by 30. Note: 1 FTSE = 30 credit hours.

3
ARIZONA COMMUNITY COLLEGE COORDINATING COUNCIL
DATA FOR THE WORKFORCE ARIZONA COUNCIL ANNUAL REPORT
A.R.S. §41.1542 (C, D)
FY 2015-16
COCHISE COUNTY COMMUNITY COLLEGE DISTRICT
4
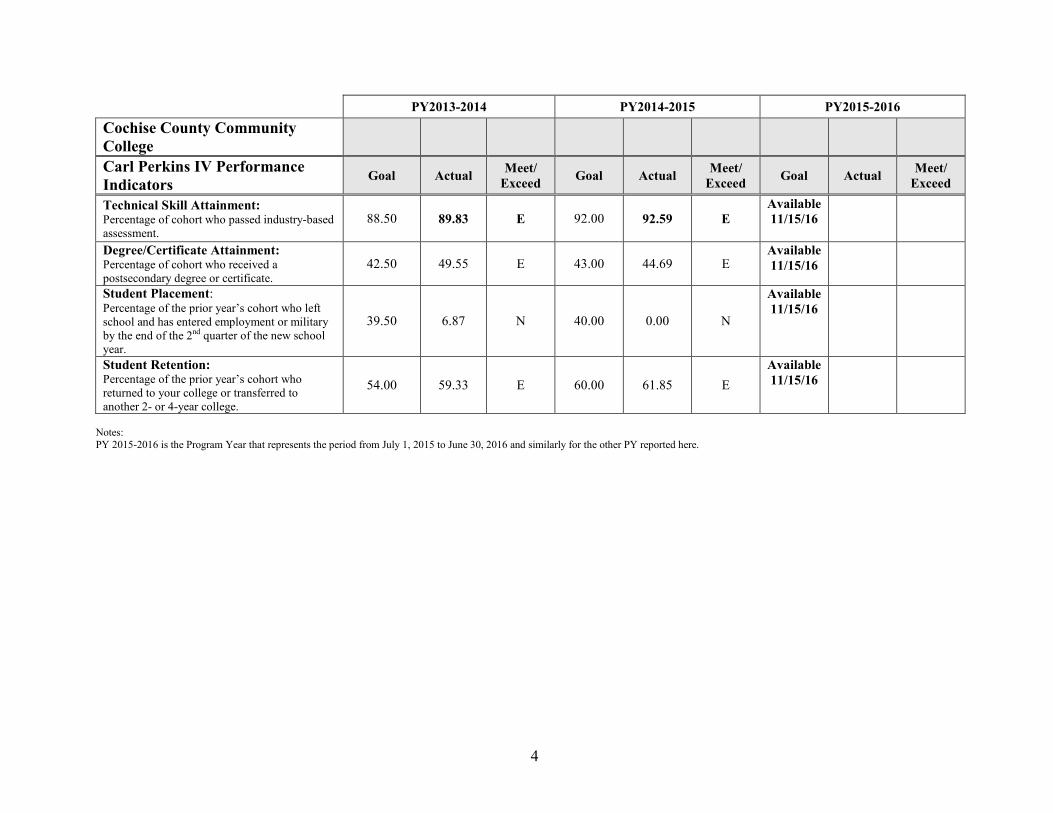
PY2013-2014 PY2014-2015 PY2015-2016 Cochise County Community College
Carl Perkins IV Performance Indicators
Goal Actual Meet/ Exceed Goal Actual Meet/
Exceed Goal Actual Meet/ Exceed
Technical Skill Attainment: Percentage of cohort who passed industry-based assessment.
88.50 89.83 E 92.00 92.59 E Available 11/15/16
Degree/Certificate Attainment: Percentage of cohort who received a postsecondary degree or certificate.
42.50 49.55 E 43.00 44.69 E Available 11/15/16
Student Placement: Percentage of the prior year’s cohort who left school and has entered employment or military by the end of the 2nd quarter of the new school year.
39.50 6.87 N 40.00 0.00 N
Available 11/15/16
Student Retention: Percentage of the prior year’s cohort who returned to your college or transferred to another 2- or 4-year college.
54.00 59.33 E 60.00 61.85 E Available 11/15/16
Notes: PY 2015-2016 is the Program Year that represents the period from July 1, 2015 to June 30, 2016 and similarly for the other PY reported here.
5
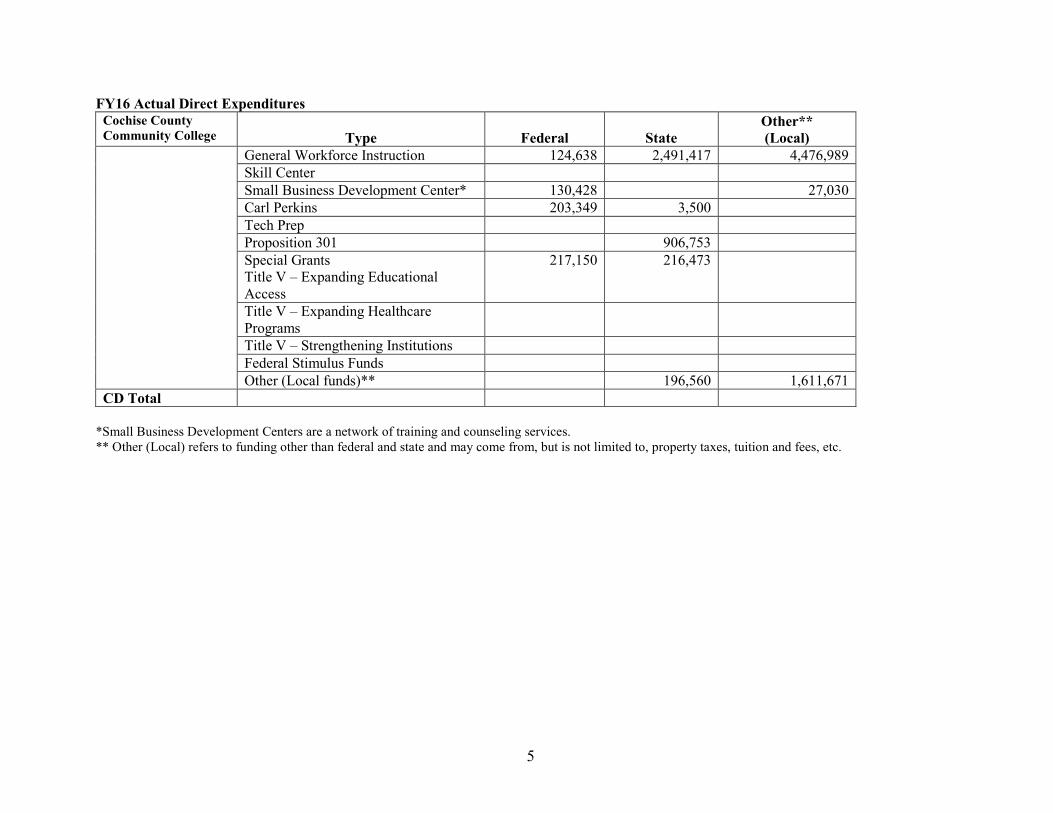
FY16 Actual Direct Expenditures Cochise County Community College
Type
Federal
State
Other** (Local)
General Workforce Instruction 124,638 2,491,417 4,476,989 Skill Center Small Business Development Center* 130,428 27,030 Carl Perkins 203,349 3,500 Tech Prep Proposition 301 906,753 Special Grants Title V – Expanding Educational Access
217,150 216,473
Title V – Expanding Healthcare Programs
Title V – Strengthening Institutions Federal Stimulus Funds Other (Local funds)** 196,560 1,611,671
CD Total *Small Business Development Centers are a network of training and counseling services. ** Other (Local) refers to funding other than federal and state and may come from, but is not limited to, property taxes, tuition and fees, etc.

6
FY17 Estimated Direct Expenditures Cochise County Community College
Type
Federal
State
Other** (Local)
General Workforce Instruction 125,847 2,515,584 4,520,416 Skill Center Small Business Development Center* 131,693 27,292 Carl Perkins 205,321 3,534 Tech Prep Proposition 301 915,549 Special Grants Title V – Expanding Educational Access Special Grants
219,256 218,573
Title V – Expanding Healthcare Programs
Title V – Strengthening Institutions Federal Stimulus Funds Other (Local funds)** 198,467 1,613,681
CD Total
* Small Business Development Centers are a network of training and counseling services. ** Other (Local) refers to funding other than federal and state and may come from, but is not limited to, property taxes, tuition and fees, etc. Workforce/Occupational Enrollment:
.
Cochise County
Community College
FY 2014
Enrollment
FY 2014
FTSE
FY 2015
Enrollment
FY 2015
FTSE
FY 2016
Enrollment
FY 2016
FTSE
9,037 1,003.3 7,882 884.0 7,860 885.8

7
ARIZONA COMMUNITY COLLEGE COORDINATING COUNCIL
DATA FOR THE WORKFORCE ARIZONA COUNCIL ANNUAL REPORT
A.R.S. §41.1542 (C, D)
FY 2015-16
COCONINO COMMUNITY COLLEGE DISTRICT

8
PY2013-2014 PY2014-2015 PY2015-2016
Coconino Community College
Carl Perkins IV Performance Indicators
Goal Actual Meet/ Exceed Goal Actual Meet/
Exceed Goal Actual Meet/ Exceed
Technical Skill Attainment: Percentage of cohort who passed industry-based assessment.
88.50% 98.73% Yes 92.00% 96.81% Yes 92.25%
Degree/Certificate Attainment: Percentage of cohort who received a postsecondary degree or certificate.
42.50% 40.24 No 43.00% 35.67% No 45.00%
Student Placement: Percentage of the prior year’s cohort who left school and has entered employment or military by the end of the 2nd quarter of the new school year.
39.50% Unable to calculate –
DES wage data unavailable
40.00% 42.00% Yes 40.50%
Student Retention: Percentage of the prior year’s cohort who returned to your college or transferred to another 2- or 4-year college.
54.00% 67.66 Yes 60.00% 45.74% No 65.00%
Notes: PY 2015-2016 is the Program Year that represents the period from July 1, 2015 to June 30, 2016 and similarly for the other PY reported here.

9
FY16 Actual Direct Expenditures Coconino Community College
Type
Federal
State
Other** (Local)
General Workforce Instruction 2,798,917 Skill Center Small Business Development Center* 39,993 38,192 Carl Perkins 222,517 Tech Prep Proposition 301 444,299 Special Grants Title V – Expanding Educational Access
Title V – Expanding Healthcare Programs
Title V – Strengthening Institutions Federal Stimulus Funds Other (Local funds)**
CD Total $262,510 $444,299 $2,837,109 *Small Business Development Centers are a network of training and counseling services. ** Other (Local) refers to funding other than federal and state and may come from, but is not limited to, property taxes, tuition and fees, etc.

10
FY17 Estimated Direct Expenditures Coconino Community College
Type
Federal
State
Other** (Local)
General Workforce Instruction 2,243,535 Skill Center Small Business Development Center* Carl Perkins 252,277 Tech Prep Proposition 301 458,068 Special Grants Title V – Expanding Educational Access Special Grants
Title V – Expanding Healthcare Programs
Title V – Strengthening Institutions Federal Stimulus Funds Other (Local funds)**
CD Total $252,277 $458,068 $2,243,535
* Small Business Development Centers are a network of training and counseling services. ** Other (Local) refers to funding other than federal and state and may come from, but is not limited to, property taxes, tuition and fees, etc. Workforce/Occupational Enrollment:
.
Coconino Community
College
FY 2014
Enrollment
FY 2014
FTSE
FY 2015
Enrollment
FY 2015
FTSE
FY 2016
Enrollment
FY 2016
FTSE 1,857 842.44 1752 849.39 1748 835.399

11
ARIZONA COMMUNITY COLLEGE COORDINATING COUNCIL
DATA FOR THE WORKFORCE ARIZONA COUNCIL ANNUAL REPORT
A.R.S. §41.1542 (C, D)
FY 2015-16
EASTERN ARIZONA COMMUNITY COLLEGE DISTRICT

12
PY2013-2014 PY2014-2015 PY2015-2016 Eastern Arizona Community College
Carl Perkins IV Performance Indicators
Goal Actual Meet/ Exceed Goal Actual Meet/
Exceed Goal Actual Meet/ Exceed
Technical Skill Attainment: Percentage of cohort who passed industry-based assessment.
88.5% 96.49% E
89.50% 98.13% E
92.25% Available 11/16
Degree/Certificate Attainment: Percentage of cohort who received a postsecondary degree or certificate.
42.5% 42.75% E
43% 46.20% E
45.0% Available 11/16
Student Placement: Percentage of the prior year’s cohort who left school and has entered employment or military by the end of the 2nd quarter of the new school year.
39.5% 38.08% M 90%
40% 39.73% M 90%
40.50%
Available 11/16
Student Retention: Percentage of the prior year’s cohort who returned to your college or transferred to another 2- or 4-year college.
54% 50.18% M 90%
56% 56.53% E
65.0%
Available 11/16
Notes: PY 2015-2016 is the Program Year that represents the period from July 1, 2015 to June 30, 2016 and similarly for the other PY reported here.

13
FY16 Actual Direct Expenditures Eastern Arizona Community College
Type
Federal
State
Other** (Local)
General Workforce Instruction Skill Center Small Business Development Center* 98,118.99 Carl Perkins 188,957.40 Tech Prep Proposition 301 1,154,830.10 Special Grants Title V – Expanding Educational Access
1,188,004.58
Title V – Expanding Healthcare Programs
Title V – Strengthening Institutions Federal Stimulus Funds Other (Local funds)**
CD Total 1,475,080.97 1,154,830.10 *Small Business Development Centers are a network of training and counseling services. ** Other (Local) refers to funding other than federal and state and may come from, but is not limited to, property taxes, tuition and fees, etc.

14
FY17 Estimated Direct Expenditures Eastern Arizona Community College
Type
Federal
State
Other** (Local)
General Workforce Instruction Skill Center Small Business Development Center* 104,987.32 Carl Perkins 202,184.42 Tech Prep Proposition 301 1,235,668.21 Special Grants Title V – Expanding Educational Access Special Grants
1,271,164.90
Title V – Expanding Healthcare Programs
1,271,164.90
Title V – Strengthening Institutions Federal Stimulus Funds Other (Local funds)**
CD Total 1,578,336.64 1,235,668.21
* Small Business Development Centers are a network of training and counseling services. ** Other (Local) refers to funding other than federal and state and may come from, but is not limited to, property taxes, tuition and fees, etc. Workforce/Occupational Enrollment:
.
Eastern Arizona
Community College
FY 2014
Enrollment
FY 2014
FTSE
FY 2015
Enrollment
FY 2015
FTSE
FY 2016
Enrollment
FY 2016
FTSE
9005 1909 8996 1390 8139 1372

15
ARIZONA COMMUNITY COLLEGE COORDINATING COUNCIL
DATA FOR THE WORKFORCE ARIZONA COUNCIL ANNUAL REPORT
A.R.S. §41.1542 (C, D)
FY 2015-16
MARICOPA COUNTY COMMUNITY COLLEGE DISTRICT

16
PY2013-2014 PY2014-2015 PY2015-2016
Maricopa Community Colleges
Carl Perkins IV Performance Indicators
Goal Actual Meet/ Exceed Goal Actual Meet/
Exceed Goal Actual Meet/ Exceed
Technical Skill Attainment: Percentage of cohort who passed industry-based assessment.
88.5% 87.0% Meet* 92.0% 88.5% Meet* 92.25% Available 11/16 N/A
Degree/Certificate Attainment: Percentage of cohort who received a postsecondary degree or certificate.
42.5% 48.0% Exceed 43.0% 50.1% Exceed 45.0% Available 11/16 N/A
Student Placement: Percentage of the prior year’s cohort who left school and has entered employment or military by the end of the 2nd quarter of the new school year.
39.5% 50.3% Exceed 40.0% Data Not
Available Data Not Available 40.5% Available
11/16 N/A
Student Retention: Percentage of the prior year’s cohort who returned to your college or transferred to another 2- or 4-year college.
54.0% 69.4% Exceed 60.0% 68.1% Exceed 65.0% Available 11/16 N/A
Notes: *A performance indicator is considered met if it reaches 90% of the performance goal. PY 2015-2016 is the Program Year that represents the period from July 1, 2015 to June 30, 2016 and similarly for the other PY reported here.

17
FY16 Actual Direct Expenditures Maricopa Community Colleges
Type
Federal
State
Other** (Local)
General Workforce Instruction 70,175,111 Skill Center 11,302,402 Small Business Development Center* 2,379,132 Carl Perkins 991,502 Tech Prep Proposition 301 6,370,850 Special Grants Title V – Expanding Educational Access
5,043,308
Title V – Expanding Healthcare Programs
Title V – Strengthening Institutions 249,627 Federal Stimulus Funds Other (Local funds)**
CD Total $8,663,569 $6,370,850 $81,477,513 *Small Business Development Centers are a network of training and counseling services. ** Other (Local) refers to funding other than federal and state and may come from, but is not limited to, property taxes, tuition and fees, etc.

18
FY17 Estimated Direct Expenditures Maricopa Community Colleges
Type
Federal
State
Other** (Local)
General Workforce Instruction 71,559,452 Skill Center 11,753,757 Small Business Development Center* 2,670,641 Carl Perkins 975,259 Tech Prep Proposition 301 6,327,250 Special Grants Title V – Expanding Educational Access Special Grants
4,004,045
Title V – Expanding Healthcare Programs
Title V – Strengthening Institutions 2,708,740 Federal Stimulus Funds Other (Local funds)**
CD Total $10,358,685 $6,327,250 $83,313,209
* Small Business Development Centers are a network of training and counseling services. ** Other (Local) refers to funding other than federal and state and may come from, but is not limited to, property taxes, tuition and fees, etc. Workforce/Occupational Enrollment:
Maricopa Community Colleges
FY 2014
Enrollment
FY 2014
FTSE
FY 2015
Enrollment
FY 2015
FTSE
Projected FY 2016
Enrollment
Projected FY 2016
FTSE 284,037 27,107 261,783 24,597 254,687 22,115

19
ARIZONA COMMUNITY COLLEGE COORDINATING COUNCIL
DATA FOR THE WORKFORCE ARIZONA COUNCIL ANNUAL REPORT
A.R.S. §41.1542 (C, D)
FY 2015-16
MOHAVE COMMUNITY COLLEGE DISTRICT

20
PY2013-2014 PY2014-2015 PY2015-2016
Mohave Community College
Carl Perkins IV Performance Indicators
Goal Actual Meet/ Exceed Goal Actual Meet/
Exceed Goal Actual Meet/ Exceed
Technical Skill Attainment: Percentage of cohort who passed industry-based assessment.
89 92 Ex 92 86 N/A 92.25 Avail. 11/2016 N/A
Degree/Certificate Attainment: Percentage of cohort who received a postsecondary degree or certificate.
43 43 Mt 43 40 N/A 45 Avail. 11/2016 N/A
Student Placement: Percentage of the prior year’s cohort who left school and has entered employment or military by the end of the 2nd quarter of the new school year.
40 N/A N/A 40 N/A N/A 40.50 Avail. 11/2016 N/A
Student Retention: Percentage of the prior year’s cohort who returned to your college or transferred to another 2- or 4-year college.
54 51 Mt 60 50 N/A 65 Avail. 11/2016 N/A
Notes: PY 2015-2016 is the Program Year that represents the period from July 1, 2015 to June 30, 2016 and similarly for the other PY reported here.
21
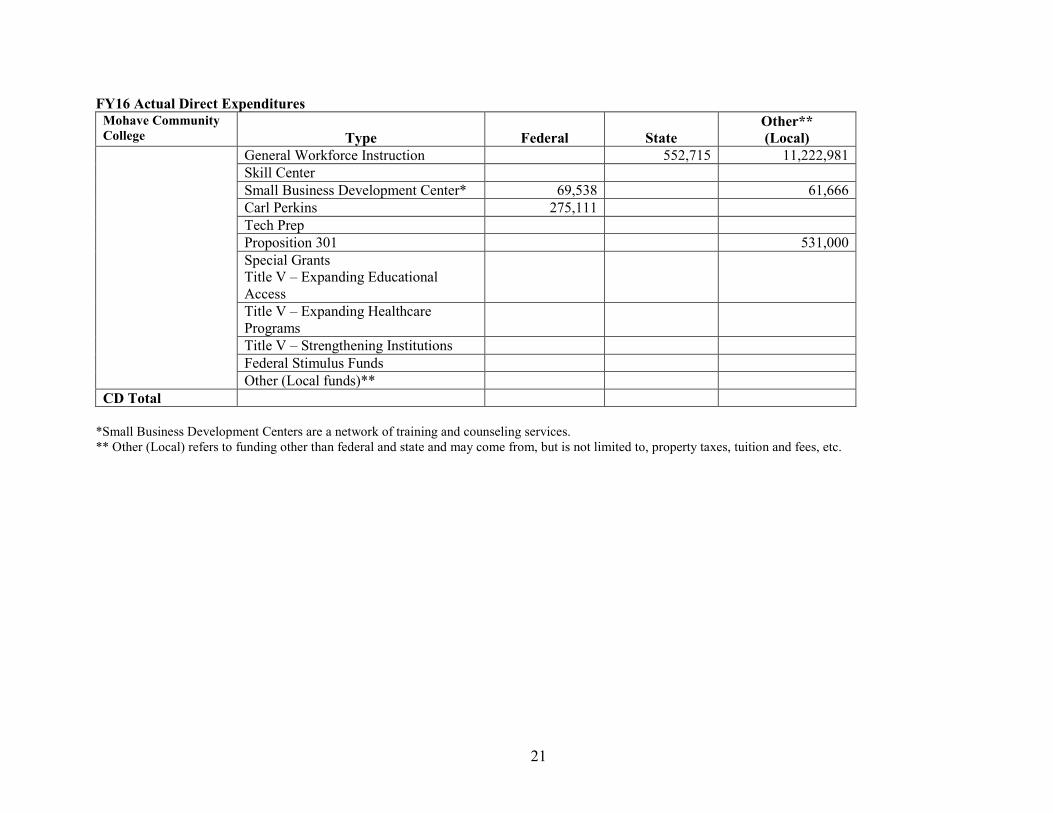
FY16 Actual Direct Expenditures Mohave Community College
Type
Federal
State
Other** (Local)
General Workforce Instruction 552,715 11,222,981 Skill Center Small Business Development Center* 69,538 61,666 Carl Perkins 275,111 Tech Prep Proposition 301 531,000 Special Grants Title V – Expanding Educational Access
Title V – Expanding Healthcare Programs
Title V – Strengthening Institutions Federal Stimulus Funds Other (Local funds)**
CD Total *Small Business Development Centers are a network of training and counseling services. ** Other (Local) refers to funding other than federal and state and may come from, but is not limited to, property taxes, tuition and fees, etc.

22
FY17 Estimated Direct Expenditures Mohave Community College
Type
Federal
State
Other** (Local)
General Workforce Instruction 565,980 11,492,333 Skill Center Small Business Development Center* 68,817 61,027 Carl Perkins 262,996 Tech Prep Proposition 301 506,200 Special Grants Title V – Expanding Educational Access Special Grants
Title V – Expanding Healthcare Programs
Title V – Strengthening Institutions Federal Stimulus Funds Other (Local funds)**
CD Total
* Small Business Development Centers are a network of training and counseling services. ** Other (Local) refers to funding other than federal and state and may come from, but is not limited to, property taxes, tuition and fees, etc. Workforce/Occupational Enrollment:
Mohave Community
College
FY 2014
Enrollment
FY 2014
FTSE
FY 2015
Enrollment
FY 2015
FTSE
FY 2016
Enrollment
FY 2016
FTSE 3,600 1,172 3,147 989 1,788 433

23
ARIZONA COMMUNITY COLLEGE COORDINATING COUNCIL
DATA FOR THE WORKFORCE ARIZONA COUNCIL ANNUAL REPORT
A.R.S. §41.1542 (C, D)
FY 2015-16
NAVAJO COMMUNITY COLLEGE DISTRICT
24
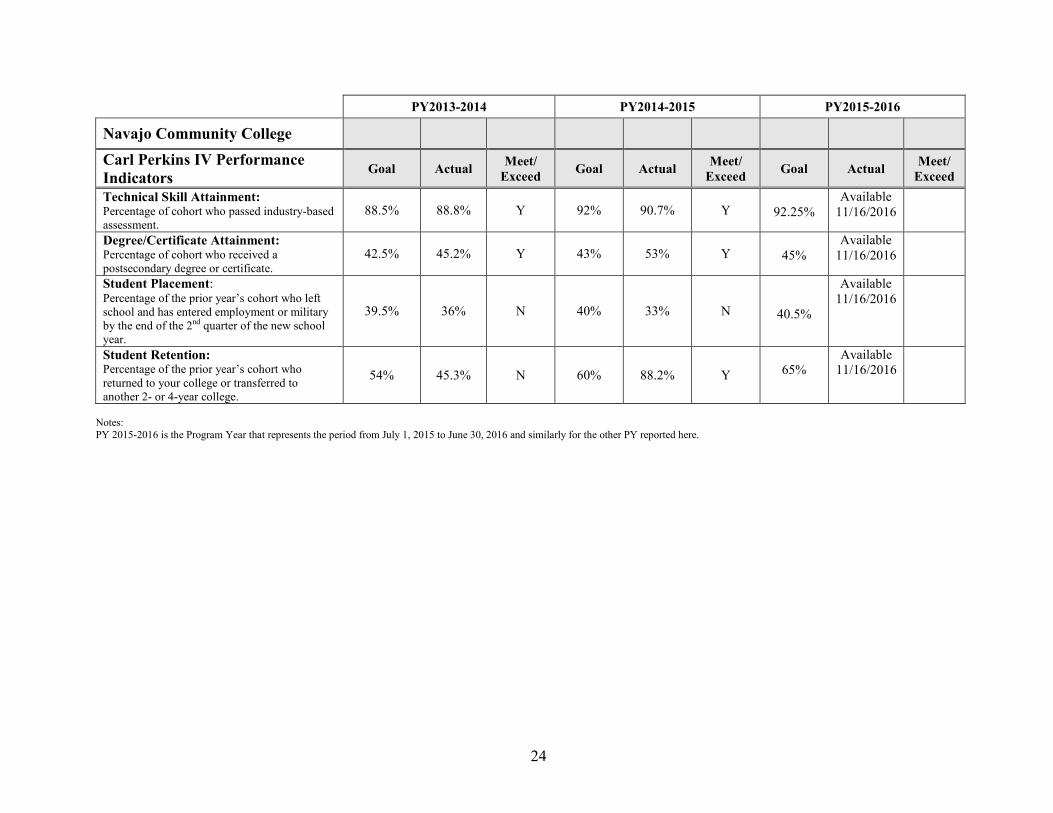
PY2013-2014 PY2014-2015 PY2015-2016
Navajo Community College
Carl Perkins IV Performance Indicators
Goal Actual Meet/ Exceed Goal Actual Meet/
Exceed Goal Actual Meet/ Exceed
Technical Skill Attainment: Percentage of cohort who passed industry-based assessment.
88.5% 88.8% Y 92% 90.7% Y
92.25% Available
11/16/2016
Degree/Certificate Attainment: Percentage of cohort who received a postsecondary degree or certificate.
42.5% 45.2% Y 43% 53% Y
45% Available
11/16/2016
Student Placement: Percentage of the prior year’s cohort who left school and has entered employment or military by the end of the 2nd quarter of the new school year.
39.5% 36% N 40% 33% N
40.5%
Available 11/16/2016
Student Retention: Percentage of the prior year’s cohort who returned to your college or transferred to another 2- or 4-year college.
54% 45.3% N 60% 88.2% Y
65% Available
11/16/2016
Notes: PY 2015-2016 is the Program Year that represents the period from July 1, 2015 to June 30, 2016 and similarly for the other PY reported here.

25
FY16 Actual Direct Expenditures Navajo Community College
Type
Federal
State
Other** (Local)
General Workforce Instruction 5,749,673 Skill Center 154,698 Small Business Development Center* 83,221 109,237 Carl Perkins 186,306 60,180 Tech Prep Proposition 301 Special Grants Title V – Expanding Educational Access
Title V – Expanding Healthcare Programs
Title V – Strengthening Institutions Federal Stimulus Funds Other (Local funds)**
CD Total 424,225 5,919,090 *Small Business Development Centers are a network of training and counseling services. ** Other (Local) refers to funding other than federal and state and may come from, but is not limited to, property taxes, tuition and fees, etc.

26
FY17 Estimated Direct Expenditures Navajo Community College
Type
Federal
State
Other** (Local)
General Workforce Instruction 6,278,740 Skill Center Small Business Development Center* 86221 96,272 Carl Perkins 165,091 35,304 Tech Prep Proposition 301 Special Grants Title V – Expanding Educational Access Special Grants
Title V – Expanding Healthcare Programs
Title V – Strengthening Institutions Federal Stimulus Funds Other (Local funds)**
CD Total
* Small Business Development Centers are a network of training and counseling services. ** Other (Local) refers to funding other than federal and state and may come from, but is not limited to, property taxes, tuition and fees, etc. Workforce/Occupational Enrollment:
Navajo Community
College
FY 2014
Enrollment
FY 2014
FTSE
FY 2015
Enrollment
FY 2015
FTSE
FY 2016
Enrollment
FY 2016
FTSE 9160 1843.73 7582 1369.25 7583 1313.37
27
ARIZONA COMMUNITY COLLEGE COORDINATING COUNCIL
COUNCIL ON WORKFORCE POLICY ANNUAL REPORT
A.R.S. §41.1542 (C, D)
FY 2015-16
PIMA COUNTY COMMUNITY COLLEGE DISTRICT

28
PY2013-2014 PY2014-2015 PY2015-2016 Pima County Community College District
Carl Perkins IV Performance Indicators
Goal Actual Meet/ Exceed Goal Actual Meet/
Exceed Goal Actual Meet/ Exceed
Technical Skill Attainment: Percentage of cohort who passed industry-based assessment.
88.5% 97.7% YES 92.0% 92.96% YES 92.3%
Avail. 11/2016
Avail.
11/2016 Degree/Certificate Attainment: Percentage of cohort who received a postsecondary degree or certificate.
42.5% 30.9% NO 43.0% 38.93% NO 45.0%
Avail. 11/2016
Avail.
11/2016 Student Placement: Percentage of the prior year’s cohort who left school and has entered employment or military by the end of the 2nd quarter of the new school year.
39.5% Unavail.
(See Note)
N/A 40.0% Unavail. (See Note) N/A 40.5%
Avail.
11/2016
Avail.
11/2016
Student Retention: Percentage of the prior year’s cohort who returned to your college or transferred to another 2- or 4-year college.
54.0% 74.4% YES 60.0% 78.4% YES 65.0%
Avail. 11/2016
Avail.
11/2016
Notes: PY 2015-2016 is the Program Year that represents the period from July 1, 2015 to June 30, 2016 and similarly for the other PY reported here. The DES UI data necessary to report on this performance measure as of today’s date is not available.
29
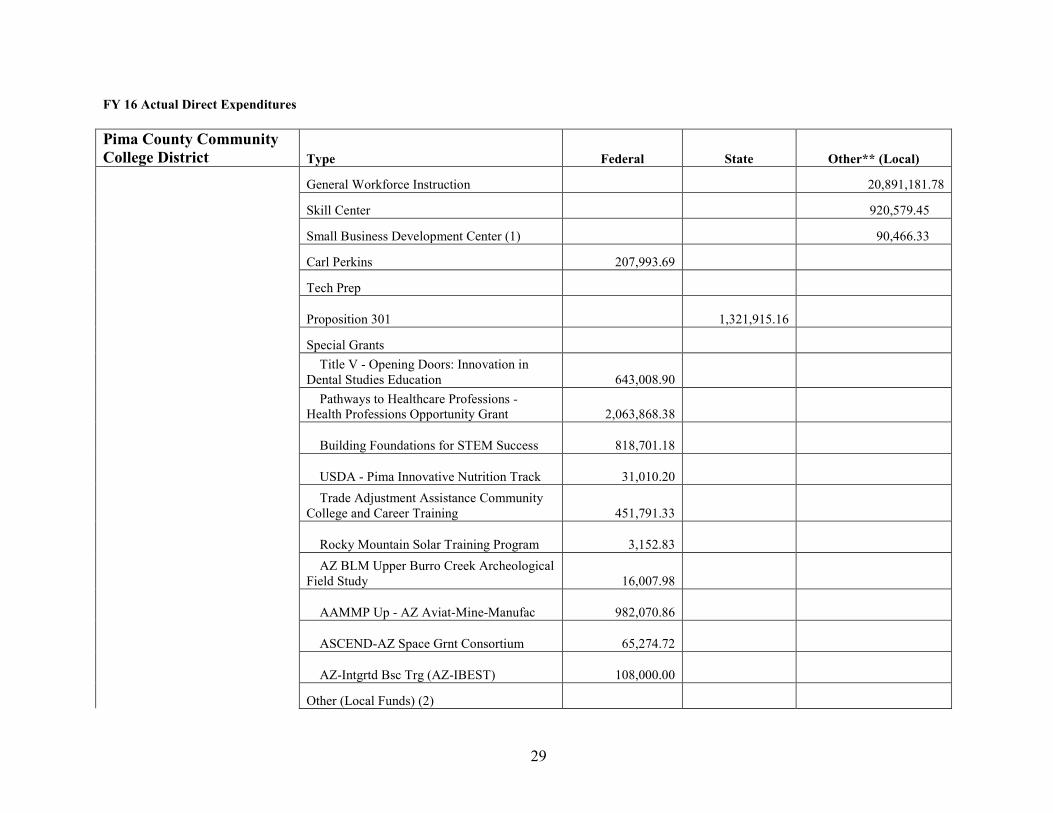
FY 16 Actual Direct Expenditures
Pima County Community College District Type Federal State Other** (Local)
General Workforce Instruction 20,891,181.78
Skill Center 920,579.45
Small Business Development Center (1) 90,466.33
Carl Perkins 207,993.69
Tech Prep
Proposition 301
1,321,915.16
Special Grants
Title V - Opening Doors: Innovation in
Dental Studies Education
643,008.90
Pathways to Healthcare Professions -
Health Professions Opportunity Grant
2,063,868.38
Building Foundations for STEM Success
818,701.18
USDA - Pima Innovative Nutrition Track
31,010.20
Trade Adjustment Assistance Community
College and Career Training
451,791.33
Rocky Mountain Solar Training Program
3,152.83
AZ BLM Upper Burro Creek Archeological
Field Study
16,007.98
AAMMP Up - AZ Aviat-Mine-Manufac
982,070.86
ASCEND-AZ Space Grnt Consortium
65,274.72
AZ-Intgrtd Bsc Trg (AZ-IBEST)
108,000.00
Other (Local Funds) (2)
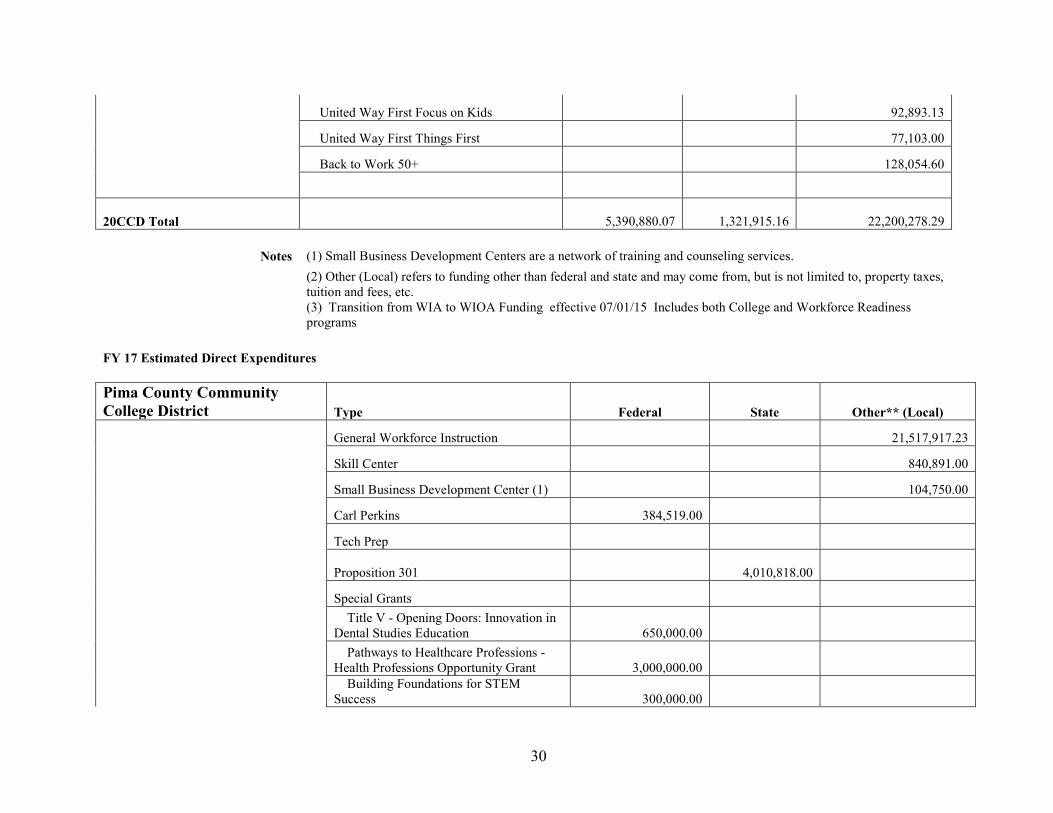
30
United Way First Focus on Kids 92,893.13
United Way First Things First 77,103.00
Back to Work 50+ 128,054.60
20CCD Total 5,390,880.07
1,321,915.16 22,200,278.29
Notes (1) Small Business Development Centers are a network of training and counseling services.
(2) Other (Local) refers to funding other than federal and state and may come from, but is not limited to, property taxes, tuition and fees, etc.
(3) Transition from WIA to WIOA Funding effective 07/01/15 Includes both College and Workforce Readiness programs
FY 17 Estimated Direct Expenditures
Pima County Community College District Type Federal State Other** (Local)
General Workforce Instruction 21,517,917.23
Skill Center 840,891.00
Small Business Development Center (1) 104,750.00
Carl Perkins 384,519.00
Tech Prep
Proposition 301
4,010,818.00
Special Grants
Title V - Opening Doors: Innovation in
Dental Studies Education 650,000.00
Pathways to Healthcare Professions -
Health Professions Opportunity Grant 3,000,000.00
Building Foundations for STEM
Success 300,000.00

31
USDA - Pima Innovative Nutrition
Track
Trade Adjustment Assistance
Community College and Career Training
Rocky Mountain Solar Training
Program
AZ BLM Upper Burro Creek
Archeological Field Study 20,000.00
AAMMP Up - AZ Aviat-Mine-Manufac 528,999.00
ASCEND-AZ Space Grnt Consortium
AZ-Intgrtd Bsc Trg (AZ-IBEST) 108,000.00
Other (Local Funds) (2)
United Way First Focus on Kids 35,000.00
United Way First Things First 79,440.00
Back to Work 50+ 65,000.00
CCD Total 4,991,518.00
4,010,818.00 22,642,998.23
Total 10,382,398.07
5,332,733.16 4,4843,276.52
Notes (1) Small Business Development Centers are a network of training and counseling services.
(2) Other (Local) refers to funding other than federal and state and may come from, but is not limited to, property taxes, tuition and fees, etc.
(3) Transition from WIA to WIOA Funding effective 07/01/15 Includes both College and Workforce Readiness programs
Workforce/Occupational Enrollment:
Pima County Community
College District
FY 2014
Enrollment
FY 2014
FTSE
FY 2015
Enrollment
FY 2015
FTSE
FY 2016
Enrollment
FY 2016
FTSE 71,388 6,258.7 65,901 5,779.3 58,048 5,124.1
32
ARIZONA COMMUNITY COLLEGE COORDINATING COUNCIL
DATA FOR THE WORKFORCE ARIZONA COUNCIL ANNUAL REPORT
A.R.S. §41.1542 (C, D)
FY 2015-16
PINAL COUNTY COMMUNITY COLLEGE DISTRICT

33
PY2013-2014 PY2014-2015 PY2015-2016
Pinal County Community College
Carl Perkins IV Performance Indicators
Goal Actual Meet/ Exceed Goal Actual Meet/
Exceed Goal Actual Meet/ Exceed
Technical Skill Attainment: Percentage of cohort who passed industry-based assessment.
88.5% 91.86% Yes 92% 93.7% Yes 92.25
N/A N/A
Degree/Certificate Attainment: Percentage of cohort who received a postsecondary degree or certificate.
42.5% 40.84% Yes 43% 41.72% Yes 43.50%
N/A N/A
Student Placement: Percentage of the prior year’s cohort who left school and has entered employment or military by the end of the 2nd quarter of the new school year.
39.5% N/A N/A 40% N/A N/A
40.5%
N/A N/A
Student Retention: Percentage of the prior year’s cohort who returned to your college or transferred to another 2- or 4-year college.
54% 89.56 Yes 60% 88% Yes 61%
N/A N/A
Notes: PY 2015-2016 is the Program Year that represents the period from July 1, 2015 to June 30, 2016 and similarly for the other PY reported here.

34
FY16 Actual Direct Expenditures Pinal County Community College
Type
Federal
State
Other** (Local)
General Workforce Instruction 6,775,246 Skill Center Small Business Development Center* 51,977 Carl Perkins 187,839 Tech Prep Proposition 301 783,850 Special Grants
2,559,521 661,288
Title V – Expanding Healthcare Programs
Title V – Strengthening Institutions Federal Stimulus Funds Other (Local funds)**
CD Total 2,799,337 1,395,138 6,775,246 *Small Business Development Centers are a network of training and counseling services. ** Other (Local) refers to funding other than federal and state and may come from, but is not limited to, property taxes, tuition and fees, etc.
35
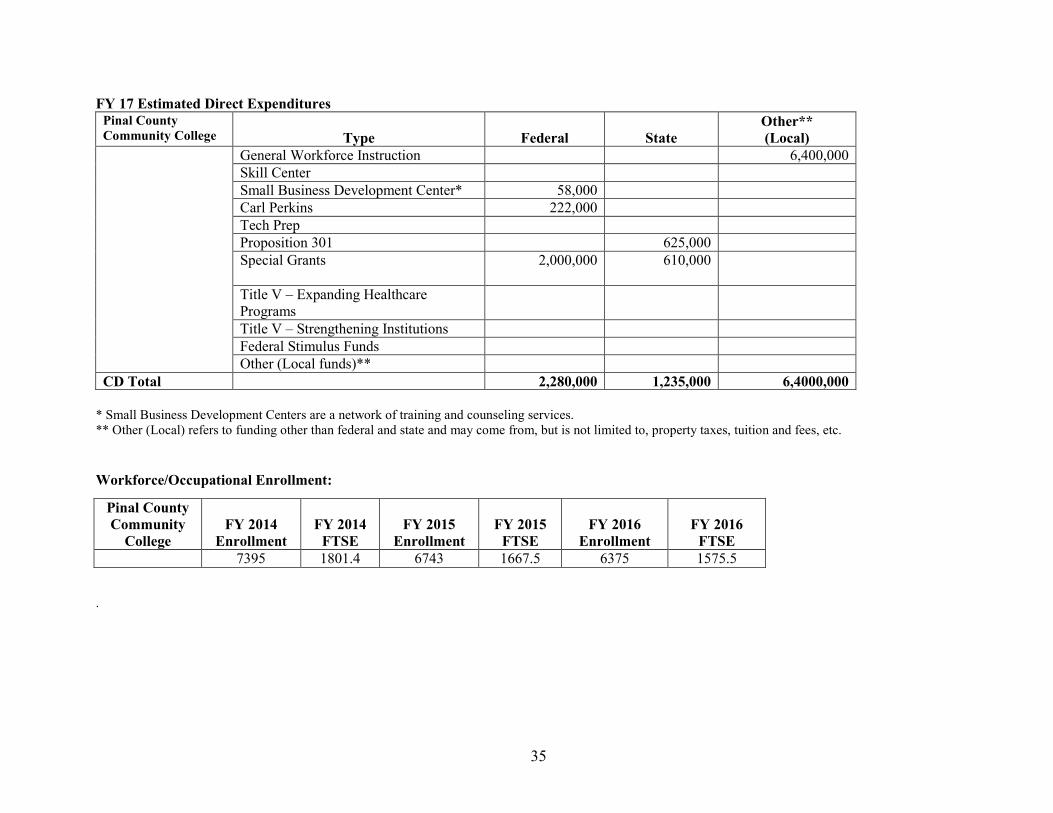
FY 17 Estimated Direct Expenditures Pinal County Community College
Type
Federal
State
Other** (Local)
General Workforce Instruction 6,400,000 Skill Center Small Business Development Center* 58,000 Carl Perkins 222,000 Tech Prep Proposition 301 625,000 Special Grants
2,000,000 610,000
Title V – Expanding Healthcare Programs
Title V – Strengthening Institutions Federal Stimulus Funds Other (Local funds)**
CD Total 2,280,000 1,235,000 6,4000,000
* Small Business Development Centers are a network of training and counseling services. ** Other (Local) refers to funding other than federal and state and may come from, but is not limited to, property taxes, tuition and fees, etc. Workforce/Occupational Enrollment:
.
Pinal County Community
College
FY 2014
Enrollment
FY 2014
FTSE
FY 2015
Enrollment
FY 2015
FTSE
FY 2016
Enrollment
FY 2016
FTSE 7395 1801.4 6743 1667.5 6375 1575.5

36
ARIZONA COMMUNITY COLLEGE COORDINATING COUNCIL
DATA FOR THE WORKFORCE ARIZONA COUNCIL ANNUAL REPORT
A.R.S. §41.1542 (C, D)
FY 2015-16
YAVAPAI COMMUNITY COLLEGE DISTRICT
37
PY2013-2014 PY2014-2015 PY2015-2016
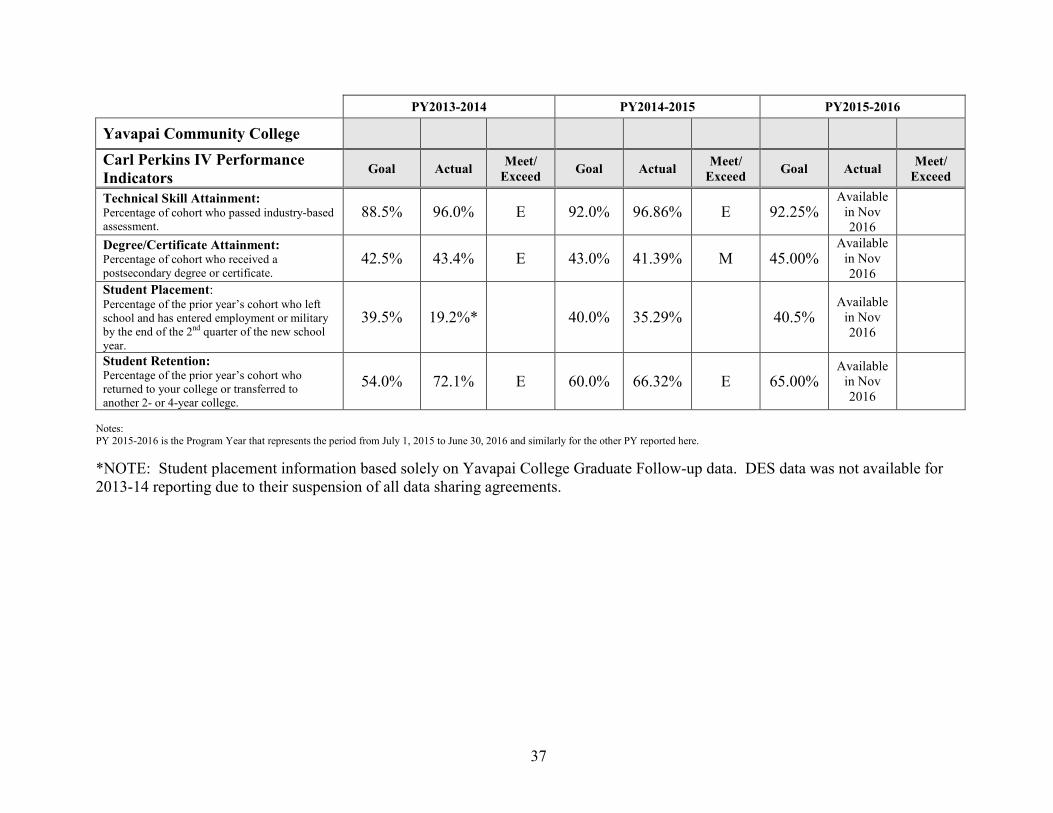
Yavapai Community College
Carl Perkins IV Performance Indicators
Goal Actual Meet/ Exceed Goal Actual Meet/
Exceed Goal Actual Meet/ Exceed
Technical Skill Attainment: Percentage of cohort who passed industry-based assessment.
88.5% 96.0% E 92.0% 96.86% E 92.25% Available
in Nov 2016
Degree/Certificate Attainment: Percentage of cohort who received a postsecondary degree or certificate.
42.5% 43.4% E 43.0% 41.39% M 45.00% Available
in Nov 2016
Student Placement: Percentage of the prior year’s cohort who left school and has entered employment or military by the end of the 2nd quarter of the new school year.
39.5% 19.2%* 40.0% 35.29% 40.5% Available
in Nov 2016
Student Retention: Percentage of the prior year’s cohort who returned to your college or transferred to another 2- or 4-year college.
54.0% 72.1% E 60.0% 66.32% E 65.00% Available
in Nov 2016
Notes: PY 2015-2016 is the Program Year that represents the period from July 1, 2015 to June 30, 2016 and similarly for the other PY reported here. *NOTE: Student placement information based solely on Yavapai College Graduate Follow-up data. DES data was not available for 2013-14 reporting due to their suspension of all data sharing agreements.

38
FY16 Actual Direct Expenditures Yavapai Community College
Type
Federal
State
Other** (Local)
General Workforce Instruction $128,430 $751,091 Skill Center Small Business Development Center* 113,259 83,179 Carl Perkins 173,352 Tech Prep 465,545 $814,345 5,285,329 Proposition 301 492,124 Special Grants Title V – Expanding Educational Access
Title V – Expanding Healthcare Programs
Title V – Strengthening Institutions Federal Stimulus Funds Other (Local funds)**
CD Total $880,586 $1,306,469 $6,119,599 *Small Business Development Centers are a network of training and counseling services. ** Other (Local) refers to funding other than federal and state and may come from, but is not limited to, property taxes, tuition and fees, etc.

39
FY17 Estimated Direct Expenditures Yavapai Community College
Type
Federal
State
Other** (Local)
General Workforce Instruction $120,000 $775,000 Skill Center Small Business Development Center* 134,000 121,000 Carl Perkins 184,000 Tech Prep 489,000 $821,700 5,461,000 Proposition 301 670,000 Special Grants Title V – Expanding Educational Access Special Grants
Title V – Expanding Healthcare Programs
Title V – Strengthening Institutions Federal Stimulus Funds Other (Local funds)**
CD Total $927,000 $1,491,700 $6,357,000
* Small Business Development Centers are a network of training and counseling services. ** Other (Local) refers to funding other than federal and state and may come from, but is not limited to, property taxes, tuition and fees, etc. Workforce/Occupational Enrollment:
Yavapai Community
College
FY 2014
Enrollment
FY 2014
FTSE
FY 2015
Enrollment
FY 2015
FTSE
FY 2016
Enrollment
FY 2016
FTSE 5,983 1,438 5,817 1,436 5296 1,335
40
ARIZONA COMMUNITY COLLEGE COORDINATING COUNCIL
DATA FOR THE WORKFORCE ARIZONA COUNCIL ANNUAL REPORT
A.R.S. §41.1542 (C, D)
FY 2015-16
Yuma La Paz COMMUNITY COLLEGE DISTRICT

41
PY2013-2014 PY2014-2015 PY2015-2016 Yuma La Paz Community College
Carl Perkins IV Performance Indicators
Goal Actual Meet/ Exceed Goal Actual Meet/
Exceed Goal Actual Meet/ Exceed
Technical Skill Attainment: Percentage of cohort who passed industry-based assessment.
88.5 90.05 Yes 92.0 91.34 No 92.25
Not available Until Nov
15
Degree/Certificate Attainment: Percentage of cohort who received a postsecondary degree or certificate.
42.5 48.9 Yes 43.0 63.30 Yes 45.0
Not available Until Nov
15
Student Placement: Percentage of the prior year’s cohort who left school and has entered employment or military by the end of the 2nd quarter of the new school year.
39.5 44.21 Yes 40.0 63.30 Yes 40.50
Not available Until Nov
15
Student Retention: Percentage of the prior year’s cohort who returned to your college or transferred to another 2- or 4-year college.
54.0 85.69 Yes 60.0 72.22 Yes 65.00
Not available Until Nov
15
Notes: PY 2015-2016 is the Program Year that represents the period from July 1, 2015 to June 30, 2016 and similarly for the other PY reported here.
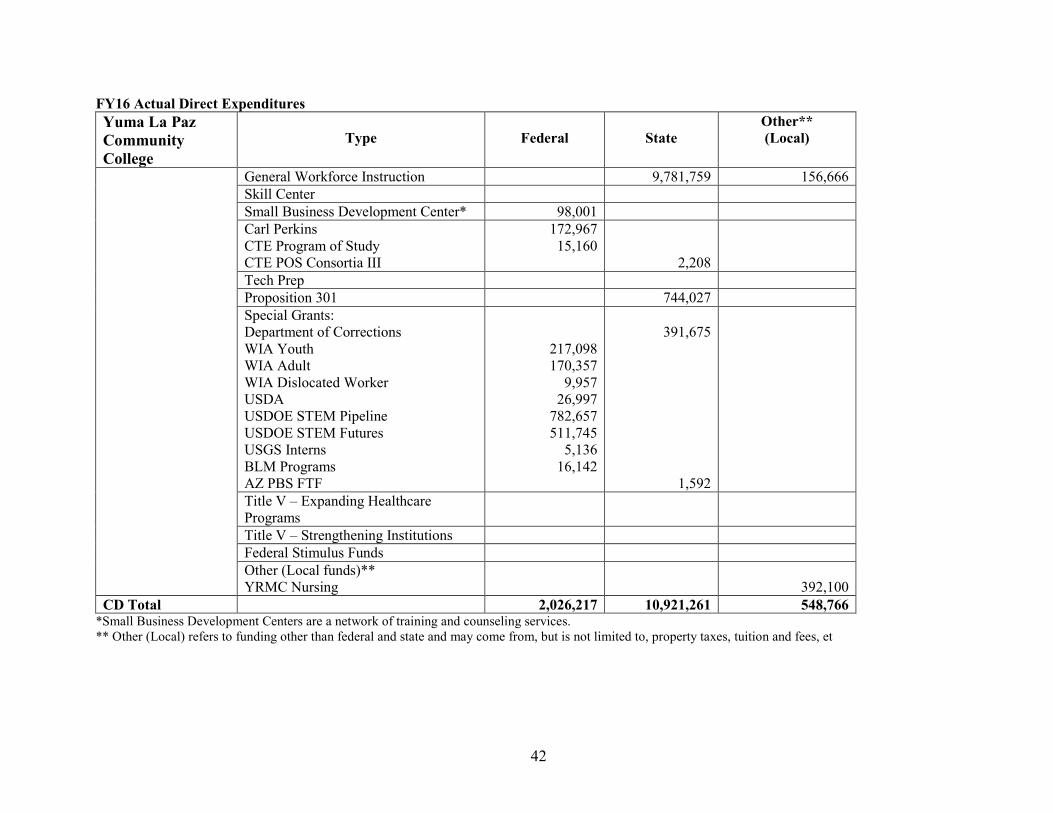
42
FY16 Actual Direct Expenditures Yuma La Paz Community College
Type
Federal
State
Other** (Local)
General Workforce Instruction 9,781,759 156,666 Skill Center Small Business Development Center* 98,001 Carl Perkins CTE Program of Study CTE POS Consortia III
172,967 15,160
2,208
Tech Prep Proposition 301 744,027 Special Grants: Department of Corrections WIA Youth WIA Adult WIA Dislocated Worker USDA USDOE STEM Pipeline USDOE STEM Futures USGS Interns BLM Programs AZ PBS FTF
217,098 170,357
9,957 26,997
782,657 511,745
5,136 16,142
391,675
1,592
Title V – Expanding Healthcare Programs
Title V – Strengthening Institutions Federal Stimulus Funds Other (Local funds)** YRMC Nursing
392,100
CD Total 2,026,217 10,921,261 548,766 *Small Business Development Centers are a network of training and counseling services. ** Other (Local) refers to funding other than federal and state and may come from, but is not limited to, property taxes, tuition and fees, et

FY17 Estimated Direct Expenditures Yuma La Paz Community College
Type
Federal
State
Other** (Local)
General Workforce Instruction 9,781,759 Skill Center Small Business Development Center* 103,406 Carl Perkins CTE Program of Study CTE POS Consortia III
297,083 11,286
Proposition 301 667,104 Special Grants: Department of Corrections WIA Youth WIA Adult WIA Dislocated Worker USDA USGS Interns BLM Programs AZ PBS FTF
190,476 195,238 71,429 93,455 12,000 25,000
496,205
400
Title V – Expanding Healthcare Programs
Title V – Strengthening Institutions Federal Stimulus Funds Other (Local funds)** YRMC Nursing
337,206
CD Total 999,373 10,945,468 337,206 * Small Business Development Centers are a network of training and counseling services. ** Other (Local) refers to funding other than federal and state and may come from, but is not limited to, property taxes, tuition and fees, etc. Workforce/Occupational Enrollment:
Yuma La Paz Community
College
FY 2014
Enrollment
FY 2014
FTSE
FY 2015
Enrollment
FY 2015
FTSE
FY 2016
Enrollment
FY 2016
FTSE 6295 1159 6561 1654 6223 1670