20150130 information dissemination - yale university
TRANSCRIPT

1
How Quickly Do Markets Learn? Private Information Dissemination in a Natural Experiment
Robert J. Jackson, Jr. Columbia Law School
Wei Jiang Columbia Business School
Joshua Mitts Columbia Law School
First Draft: December 2014
This Draft: January 2015
The authors thank Lucian Bebchuk, John Coffee, Slava Fos, Merritt Fox, Larry Glosten, Jeffrey Gordon, Jonathan Macey, Richard Squire and Paul Tetlock for helpful discussions and suggestions. We are grateful to the Ira M. Millstein Center for Global Markets and Corporate Ownership for financial support that made our PDS subscription, and this research, possible. We thank Brian Benvenisty and Like Chen for excellent research assistance. Professor of Law and Co-Director, Ira M. Millstein Center for Global Markets and Corporate Ownership. Jerome L. Greene Hall, Room 819, 435 West 116th Street, New York, New York 10027. (212) 854-0409; [email protected]. Arthur F. Burns Professor of Free and Competitive Enterprise, Finance and Economics Division. Uris Hall 803, 3022 Broadway, New York, New York 10027. (212) 854 9002; [email protected]. Postdoctoral Fellow in Empirical Law and Economics, Ira M. Millstein Center for Global Markets and Corporate Ownership. Jerome L. Greene Hall Room 821, 435 West 116th Street, New York, New York 10027. (202) 460-0003; [email protected].

2
HOW QUICKLY DO MARKETS LEARN? PRIVATE INFORMATION DISSEMINATION IN A NATURAL EXPERIMENT
Robert J. Jackson, Jr., Wei Jiang, and Joshua R. Mitts
ABSTRACT
Using data from a unique episode in which the SEC disseminated securities
filings to a small group of private investors before releasing them to the public, we provide a direct test of the process through which private information is impounded into stock prices. Because the delay between the time when the filings were privately distributed and when the filings were made public was randomly distributed, our setting provides a rare natural experiment for examining how markets process new private information. We find that it takes minutes—not seconds—for informed traders to incorporate fundamental information into stock prices. We also show that the private investors who had early access to fundamental information profited more, and convey more information into stock prices, when the delay before the filings are released to the public is longer. More importantly, the rate at which information is impounded into stock prices is more correlated with the length of the predicted delay before public release than the actual delay, suggesting that informed investors trade strategically. Our study serves as the modern counterpart to Koudijs’s (2014a) study on insider trading on eighteenth-century stock exchanges—except, in our case, week-long sailing voyages have been replaced by modern electronic transmission as the conduit for information flows.
3
INTRODUCTION
For more than two decades, the Securities and Exchange Commission (SEC) has provided
investors with access to securities filings containing market-moving information through its Electronic
Data Gathering, Analysis, and Retrieval, or EDGAR, system, which is available through the SEC’s
website. For years, however—unbeknownst to investors, lawmakers, and the public—a small group of
private investors have consistently been given early access to these filings before they are released via
EDGAR. A government contractor operating a service known as the public dissemination service, or PDS,
distributed SEC filings to a small number of paying subscribers moments before they reached the public.1
In October 2014, the Wall Street Journal exposed the issue,2 drawing immediate demands from several
Members of Congress that the SEC examine the problem.3 Two months later, SEC Chairman Mary Jo
White pledged to Congress that the Commission would soon eliminate PDS subscribers’ advantage.4
While lawmakers’ outrage in response to these revelations was understandable, we were more
intrigued by a rare opportunity presented by the episode. Before the problem was revealed to the public,
Jackson and Mitts (2014) designed and implemented software that allowed us to track the moment when
filings reached PDS subscribers and the public EDGAR website. The data effectively give us a lab-like
setting for studying how speculators trade on, and how the stock market processes, private information.
Specifically, the setting gives us the following two features that are typically not available to researchers
in this area.
First, we are able to detect both the arrival as well as the nature of private information. While the
theoretical literature (pioneered by Glosten and Milgrom (1985) and Kyle (1985)) has developed a
1 As described in greater detail below, before this issue was revealed to the public, we subscribed to the
PDS service ourselves in order to study the effects of the early dissemination of market-moving information. 2 Patterson and Tracy (2014) first revealed the PDS advantage to the public. Two of us provided detailed
analysis of the timing of the delivery of filings through the SEC’s systems that was featured in that article as a critical piece of evidence (Jackson and Mitts, 2014)).
3 For example, U.S. Senators Tim Johnson and Mike Crapo, the Chairman and Ranking Member of the Senate Committee on Banking, Housing, and Urban Affairs, wrote to SEC Chairman Mary Jo White lamenting the “unequal access” to information provided on SEC-managed systems and demanding that the SEC take steps to “understand and eliminate this disparity.”
4 Chairman White’s letter, sent in December 2014, specified that the SEC would, by early 2015, “implement[] an enhancement to our system . . . to ensure that EDGAR filings are available to the public on the SEC website before such filings are made available to PDS subscribers.”
4
thorough framework for how securities prices incorporate private information through the work of
informed traders, there are few direct empirical tests of these important theories. That is because private
information is, by definition, not public knowledge; thus, neither the timing of its arrival, nor its content,
is observable by econometricians. In our setting, we observe the exact time of the arrival of information to
a small group of investors (the time at which the filing first reaches PDS subscribers) as well as the nature
of the information the investors receive (the content of the filings).
Second, we are able to measure how long informed traders have the information before the filings
reach the public—that is, we can detect the beginning and the end of the window during which informed
traders can take advantage of their information. Critically, as explained below, the duration of the “private
window” in our setting varies randomly, allowing us to identify the incorporation of private information
in a quasi-experimental setting. Although the SEC claimed that PDS subscribers received filings “at the
same time” as filings were posted to the SEC’s website, in fact the technical limitations of the EDGAR
system led to delays of random length between the time when PDS subscribers received filings and when
those filings were posted to EDGAR.5 The variation in the length of the “private window” in our setting is
thus exogenous in the sense that it was beyond the control of all of the parties involved, and thus could
not be correlated with any of our variables of interest. This unique source of exogenous variation allows
us to draw rare causal inferences about the process through which markets incorporate information into
public-company stock prices.
Our study includes three principal findings. First, as one might predict, we find that the profits
that accrue to informed traders increase with the length of the delay until the information becomes public.
Throughout our entire sample of SEC filings, informed traders earn between six and nine basis points per
100-second delay. The gains are significantly larger, however, for the subset of filings that are especially
5 As explained below, the length of the delay did depend, in part, upon the volume of filings being
submitted to the systems at each point in time. In particular, the delay was longest at approximately 4:00 PM Eastern Standard Time, when markets closed and these systems tended to be overwhelmed by the volume of submissions. The time of day was only a noisy predictor of the length of the “private window,” however, which was otherwise randomly distributed.

5
“newsworthy.” These filings, on average, generated a one-day abnormal return of 2% or higher for the
small group of private investors who received the filings early.
Second, we find that informed traders take several minutes—not seconds—to impound new
fundamental information into stock prices. Contrary to popular intuition driven by the high-frequency
trading that has captured headlines, we show that, unlike trading information such as order flow,
fundamental information is not incorporated into stock prices in seconds. Indeed, we observe little price
impact during the first 100 or so seconds into the “private window,” and it takes five to six minutes of
trading by informed investors for the price to impound just half of the total effect of the information. In
addition, we find that the speed at which stock prices incorporate private information—which serves as a
proxy for the aggressiveness with which informed investors trade on their private information—is two to
three times higher during the period when informed investors would ex ante expect there to be a “private
window,” as opposed to unexpected portions of that window. That contrast is consistent with the notion
that informed investors engage in strategic trading, attempting to maximize profits by smoothing out the
price impact of their trading over the expected time during which they will have an informational
advantage (Caldentey and Stacchetti (2010)).
Finally, we analyze whether informed trading leads investors to “overreact” to the public release
of information on the EDGAR website because the public is unaware that the information is stale. We
find that a significant proportion of the abnormal return we observe after filings are posted to the EDGAR
website is reversed during the subsequent four days—but only in cases where the delay between the
private and public release of the information was more than 100 seconds. To the extent that the duration
of the private window is positively correlated with the staleness of the information when it was released
to the public, it is not surprising that the reversal is generally increasing in the length of delay. The lack
of a return reversal (reflecting an overreaction) when the delay was brief—that is, when the time between
private and public release of the information was 100 seconds or less—suggests that the only reason for
the overreaction in other cases was investors’ ignorance of the early leakage.

6
Our study makes a distinct contribution to the vast literature on information and asset pricing by
making usually unobservable private information the subject of empirical tests, complementing the
common approaches that rely on transaction and order flow information (for a comprehensive survey, see
Easley and O’Hara (2003)). Given the fundamental role of financial markets in the aggregation of
information and allocation of investment capital (for a detailed survey, see Bond, Edmans, and Goldstein
(2012)), our study sheds light on exactly how the stock market performs that role. Importantly, our study
complements, but is distinct from, several recent papers that assess the relationship between the
distribution of information to investors through the internet and price discovery (Bauguess, Cooney, and
Hanley (2013), Drake, Toulstone, and Thornock (2014), Loughran and McDonald (2014)), because the
subject of our study is private—rather than public—information.6
The recent work most relevant to our study is likely Collin-Dufresne and Fos (2013a) and
Koudijis (2014a, b), both of which adopted ingenious research designs to identify the path of private
information and the consequent effect on stock prices. Our design differs from that of Collin-Dufresne
and Fos (2013a), however, in that the private information in our study relates to the financial and
operational—that is, the fundamental—condition of the firm itself. By contrast, the private information
studied in Collin-Dufresne and Fos (2013a) is about the trader’s intention to intervene rather than about
the current state of the firm. As a result, both the creation and duration of the private information are
endogenous to the informed trader, which imply critically different strategic behaviors in trading on
private information (Collin-Dufresne and Fos (2013b)).
Much more related, however, is Koudijis (2014a, b), which uses boats carrying mail between
London and Amsterdam during the 18th century as the conduit for information flow to the stock
exchanges in both cities to uncover the strategic behavior of informed trading as well as the relation
between information and volatility in securities prices. Like Koudijis, we study how information reaches
6 Two other recent working papers analyze market responses to private information before its public release
(see Hu et al. (2013) and Rogers et al. (2014)). As explained above, however, our setting features random variation in the window during which investors have private information, unlike in Hu et al (2013). Rogers et al. (2014) analyzes the same episode as we do, but that study covers only one of the many types of SEC filings in our sample and does not take advantage of, or mention, the random variation in the private-information window.
7
and is processed by markets, although we use electronic dissemination as the 21st-century equivalent of
boats as transmitters of information. Also like Koudijis, we take advantage of an exogenous source of
random variation—in our case, random delays in electronic transmission, and in his, inclement weather
that delayed boats at random—to identify how markets process private information. Over the course of
the last three centuries, boat journeys that took weeks have been replaced by electronic signals that reach
their destinations in seconds as the means for disseminating value-relevant information to investors. We
believe that studying similar episodes from these two different eras will offer new insights as to how
markets have processed private information in the past—and how they might do so in the future.
I. DATA AND SUMMARY STATISTICS
A. Data
U.S. securities laws impose rigid rules on publicly traded companies that require these firms to
disclose material information about themselves to investors in a timely manner. These disclosures are
typically provided in the form of securities filings submitted to the SEC. As a result, the SEC has become
the central repository for the information that moves markets. Specifically, the SEC’s EDGAR system,
first launched in the 1990s, is the central portal through which firms can disclose, and investors can
retrieve, new information about the firm’s fundamental value.
When a company submits a securities filing to the SEC, the filing is distributed to three locations.
First, the filing becomes available on the SEC’s public file transfer protocol (FTP) server. Second, a
private contractor detects new filings located on the FTP server and, through a service known as the
public dissemination service, or PDS, distributes the filing to a small group of about forty subscribers at a
cost of approximately $15,000 per year. Finally, the filing is uploaded to the SEC’s EDGAR system,
which is available to the investing public through the SEC’s website. While in theory these systems
should operate simultaneously, in fact technical limitations of these systems led to random delays
between the time when filings were distributed to PDS subscribers and when they were made available to
the public on EDGAR. Thus, investors with access to the SEC’s FTP server, or with a PDS subscription,
8
received filings before other investors could access those filings on the SEC’s EDGAR website. The
length of the delay ranged from a few seconds to as long as several minutes.7
Our study builds on previous work by two of us that collected a detailed dataset including the
exact timestamps when filings were posted to the FTP server, distributed to PDS subscribers, and made
available on the EDGAR website a sample of recorded exact timestamps when filings were released on
the FTP system and the EDGAR website from June 25 to October 15, 2014; our data for delivery of
filings to PDS subscribers begins on August 1, 2014.8 Using the overlapping part of the sample, we
found that the FTP and PDS timestamps are almost identical with differences of no more than a few
seconds. As such, we use the FTP timestamp as a proxy for the time advantage of the “early informed” in
order to preserve a larger sample. Thus, for purposes of our study, sophisticated investors could become a
member of the early informed either by directly accessing the FTP site or subscribing to the PDS service
by paying approximately $15,000 per year.
This group of informed investors is expected to be small relative to the number of all market
participants. While early access via FTP was technically challenging, and PDS subscriptions were
granted only to about forty paying subscribers. There is anecdotal evidence suggesting that some of these
PDS subscribers were wire services,9 but end-users likely did not have real-time access to the original
filings. The wire services disseminate news in real time in the form of quick summaries of the original
filing, but the time it takes to write and post new articles would easily offset the PDS time lead over
EDGAR. With respect to early access via FTP, the SEC has not provided data on the number of users of
7 As noted above, the Wall Street Journal revealed the existence of the delay on October 28. Based on
additional research by two of us (Jackson and Mitts, 2014), the Journal reported several days later that the delay had substantially narrowed after initial reports of the delay were made public (Ackerman et al., 2014).
8 Our data for delivery to PDS subscribers begins on August 1, 2014, and continues through the end of the sample period. We obtained the EDGAR website timestamp by monitoring the RSS version of the “Latest Filings” feed that the SEC provides to the public. The FTP timestamp was obtained by querying the FTP server for the “last modified” date of the filing. The PDS timestamp was obtained by recording the exact time a filing was delivered to the PDS subscription maintained by Jackson and Mitts (2014). We also recorded the timestamp indicating when each filing was “accepted” by the SEC, which likely reflects the time when the filing was uploaded to the SEC before it is disseminated through FTP and the SEC’s website.
9 The SEC declined to provide a list of subscribers. According to news reports (Patterson 2014; Ackerman et al. 2014), the group of PDS subscribers include several major financial news and data providers, including Dow Jones Newswire and Morningstar, Inc.
9
the FTP server at any single point in time. In general, utilizing the FTP server to detect unexpected
filings is technically difficult, as an interested investor would be required to navigate to the server
directory associated with a particular firm. Because it is difficult to know ex ante which firms will file
unexpected or unscheduled filings—which constitute about 95% of our sample—we think that the
number of investors with early access to filings via FTP is relatively small.10
B. Sample
Our entire dataset starts with 101,555 filings public companies made with the SEC from June 25,
2014 to October 15, 2014, with the exception of July 15, 2014, as technical difficulties with connecting to
the SEC’s systems prevented us from collecting data on that day. As most of these filings were made by
firms whose shares are not traded on a public exchange, our sample consists of only those filings made by
publicly traded firms. Moreover, we remove filings that arrived to the EDGAR website prior to the FTP
server, which occurs infrequently but happened occasionally because of the random nature of the FTP-
EDGAR delay. We also remove filings that occur within one day of a previous filing by the same issuer.
These additional filters reduce our sample to 42,619 filings.11
For each filing, we obtain individual trades in the issuer’s primary shares from the NYSE TAQ
database, beginning at the FTP timestamp and concluding at 10 minutes following the EDGAR website
timestamp. Restricting the sample further to filings having at least one trade in the TAQ data during the
time lag between the FTP and EDGAR timestamps further reduces the sample size to 3,394 filings, or
about 8% of the total filings by public companies during our sample period. This small percentage was
due to two causes: First, most of the filings involve issuers with low trading volume throughout the day;
10 It is possible, however, to observe the “file created” date ex post and thereby identify the time that a
filing is deposited on the FTP server—and this is how the authors obtained the FTP timestamps. After the delay in SEC filing release was publicly revealed, the authors’ requests to FTP servers were almost always denied during the day with the error message that the maximum number of allowed clients (50) were already connected. The fact that earlier requests were never denied indicates that few people were attempting at the FTP during our sample period, and that more investors started to pursue the FTP when its advantage was discovered and when the PDS advantage diminished at the same time.
11 To determine whether a firm is publicly traded, we search for an entry for the firm in the CRSP and Compustat table that links an entity’s CIK to its exchange ticker.

10
second, in most of the remaining cases the random delay was too short for the early informed to react
before the information becomes public on the EDGAR website. For example, the median delay for filings
without a trade between the FTP and EDGAR timestamps was 22 seconds, compared to 151 seconds
among filings with at least one trade during the FTP-EDGAR gap.
Filings with trades between the FTP timestamp, but before the public release of the information
on EDGAR, constitute our key sample for most of the analyses described below. This sample include
140 different filing types, where the most common are Form 8-K (timely disclosure of material corporate
events), Form 4 (disclosure of insider trading; current U.S. securities law requires insiders to provide such
disclosure within 48 hours of each trade), and Schedule 13D (disclosure of beneficial ownership with an
intention to influence corporate control or policies, within 10 days from crossing the 5% threshold). The
three form types combined make up 56.1% of the sample. Moreover, a great majority (94.7%) of the
filings in our sample are non-scheduled, that is, they are contingent on circumstances rather than coming
out at pre-set frequency (such as 10-Q and 10-K). This is important for our analyses because it implies
that it is difficult for the market to discern leakage without knowing that a certain filing is forthcoming.
To set the stage, we define the following key points in the timeline of events:
[Insert Figure 1 here.]
1t : The PDS/FTP timestamp, or the time when the “early informed” receive the information.
2t : The EDGAR timestamp, or the time when the filing information becomes public. The difference
2 1( )t t is thus the “private window,” or the time lag during which the information remains
private.
3t : A time proxy for the end of the period 2 3( , )t t during which public investors trade on the
information revealed by the SEC filing.
4t : A time proxy for the time by which the stock price fully incorporates the new information,
including adjusting properly from potential initial over-/under-reaction.
C. Summary statistics

11
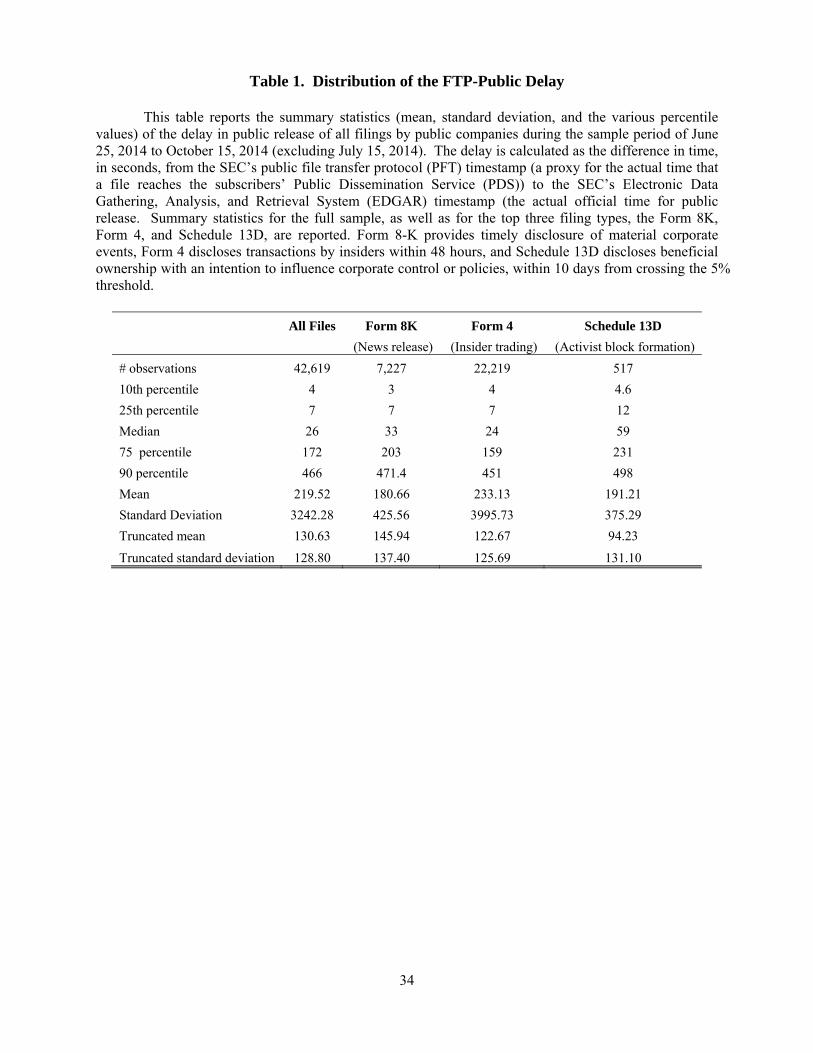
Table 1 reports the distribution of the Delay, 2 1( )t t , in seconds, of the full sample as well as
separately for the three major file types. The median delay for the full sample is 26 seconds, with an
interquartile range of 7 to 172 seconds. The distributions are highly right-skewed, leading to both mean
and variance values that are not representative of the sample. Unless otherwise specified, we impose an
additional filter for sample inclusion that Delay must not exceed 466 seconds, or the 90th percentile value
of the full sample. Trimming the extreme outliers not only limits the influence of extreme observations
but also takes into account the possibility that the monitoring script may have periodically “hung” due to
server overload, introducing erroneous delays into the data. We believe that the top decile reflects a
conservative estimate of delays that are likely to be erroneous, but our results are robust using a lower
cutoff such as 300 seconds. The last two rows report the truncated mean (131 seconds) and standard
deviation (129 seconds), which reflect the central and dispersion tendencies of the trimmed sample.
[Insert Table 1 here.]
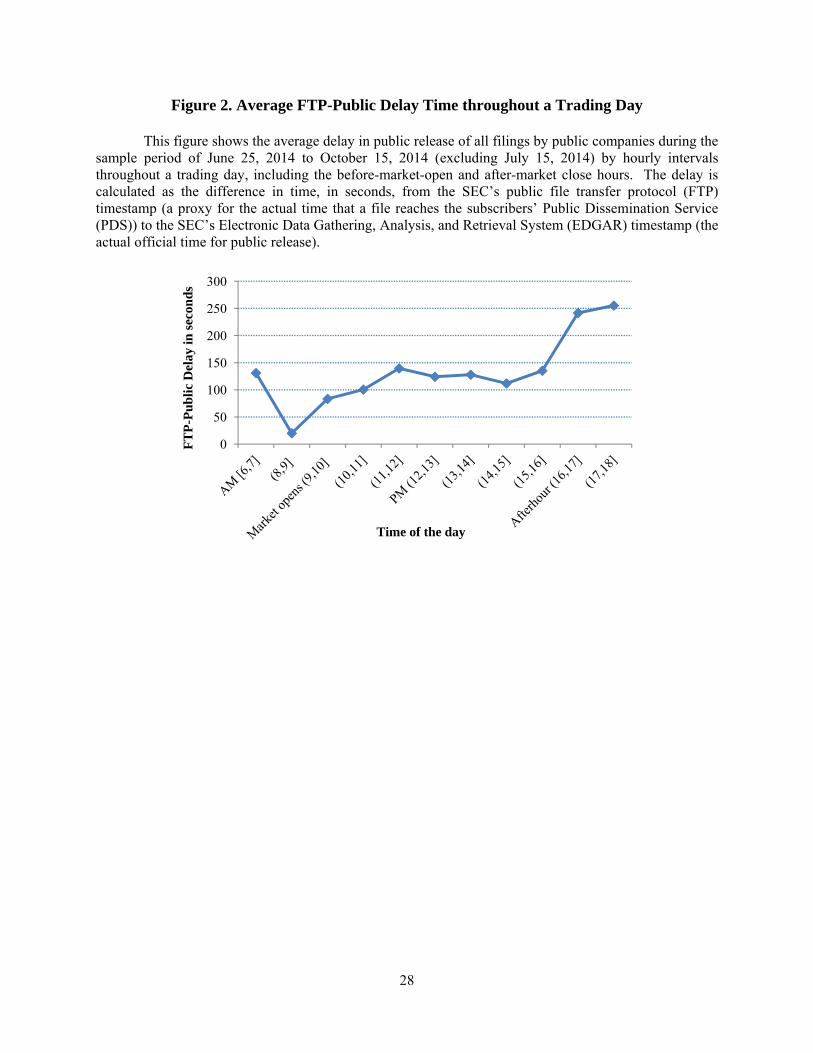
While the time lag between early and public release of filings is largely random, it does seem to
be affected by the volume of submissions and traffic at the SEC’s EDGAR servers. In fact, there is quite
a distinct pattern of delay in relation to time of the day. Figure 2 demonstrates the daily pattern with an
average plot of 2 1( )t t by hourly bins from 6:00am to 9:00pm. The average delay reaches its peak (about
242 seconds) right after 4:00pm EST, the closing of the formal market of the trading day, presumably a
time with high traffic causing delays in transmission of filings to the public EDGAR servers.
[Insert Figure 2 here.]
It is worth noting that trades take place before the market opening at 9:30am and continue after
the close of the market at 4:00pm. The after-hour trades, including preopen (8:00 – 9:30am) and post
close (4:00 – 6:30pm), are not a recent phenomenon as trades have been regularly executed on electronic
communications networks (ECNs) for decades. For example, Barclay and Hendershott (2003) document
that among the 250 highest volume stocks on Nasdaq in 2000, about 2.5% of the trading volume occurs
pre-open and another 5.5% post-close. Pre-open and post-close trades account for 4.0% and 9.9% of our
12
final sample. Our sample’s over-representation of after-hours trades is consistent with Barclay and
Hendershott’s (2004) finding that adverse selection in trading starts higher in the early day, decreases
over the course of the regular trading day, and increases immediately following the close of the market.
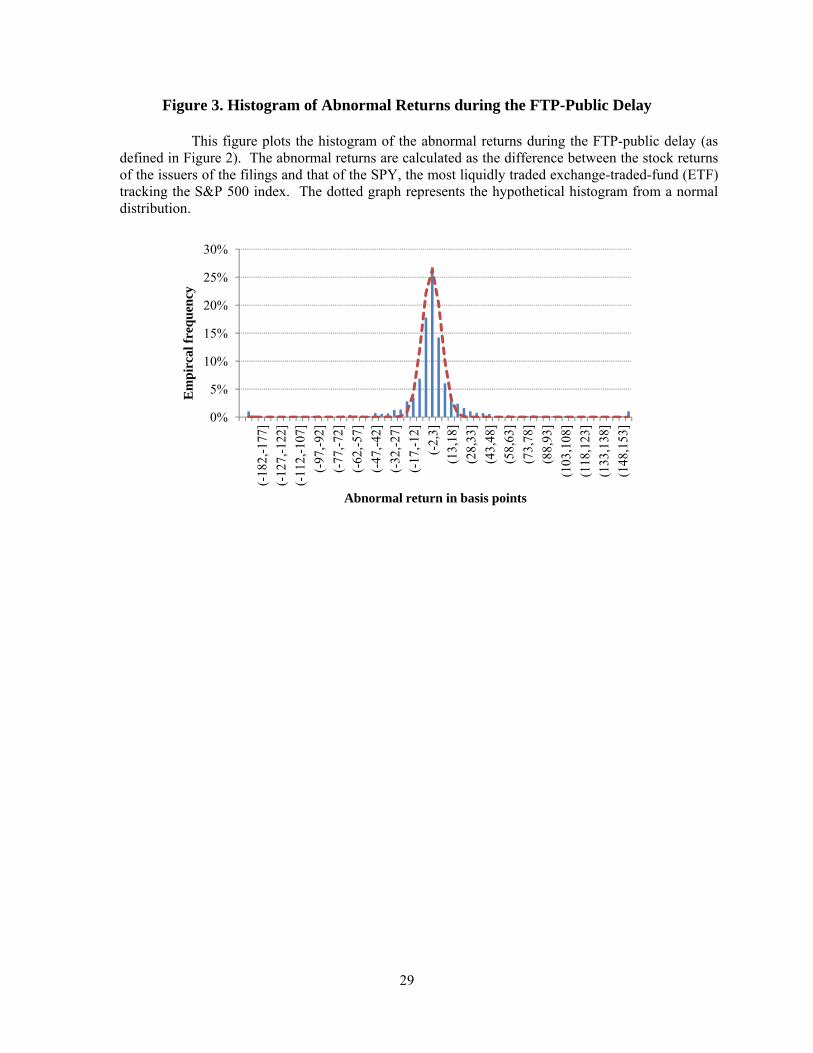
The variables of central interest to this study are the abnormal returns earned during various time
windows. For an overview, we plot in Figure 3 the histogram of the average abnormal return during the
private window, 1 2( , )t t , where the benchmark return is that of the SPY, the most liquid exchange-traded
fund (ETF) tracing the S&P 500 index. That is, 1 2 1 2 1 2( , ) [ ( , ) ( , )]i i mAR t t E R t t R t t . The sample is
restricted to all filings for which there is at least one trade during the 2 1( )t t , i.e., trades containing some
information content. The mean is essentially zero (–0.005 basis points), and the standard deviation is 35
basis points (after winsorizing at the 1% extremes). Figure 3 shows that the abnormal returns are roughly
symmetric and have fatter tails than a comparable normal distribution.
[Insert Figure 3 here.]
II. RESULTS
A. Trading Profitability by the Early Informed
A1. Regression analysis
Given the “private window” that some trading participants enjoy via early access to SEC filings,
the first natural question to explore is the profitability that such an opportunity offers for the informed
traders. To this end, we compute the abnormal returns during the random intervals between the time of
early access by the subscribers (the FTP time, or t1) and the time of public release of the same filing (the
public server time, or t2), and relate them to length of delay, conditional on the sign of the ex post returns
that incorporate the public digestion of the news.
In this analysis, the dependent variable is 1 2( , )iAR t t , the abnormal returns (in basis points) of
stock i during the time window 1 2( , )t t when information remains private, where i is the index for a stock
whose issuer posts a SEC filing. The benchmark return is that of SPY, the exchange-traded fund (ETF)
13
for the S&P 500 index portfolio. The choice of SPY over a broader based market portfolio reflects the
need to have an instrument with sufficient trading liquidity at high frequencies. Given our interest in
assessing how information is disseminated through trading, we include in this analysis only observations
where stock i posts at least one transaction during the interval 1 2( , )t t in the TAQ trading data.
The key independent variable is Delay, which is 2 1t t in seconds. We adopt both a short and a
long window, 2 3( , )t t , to allow the market to digest new information from the public release of the filings
after 2t , resulting in two abnormal return measures capturing the information content of the filings for the
short term. Henceforth we denote 3 2 1{ 10 min, }t t d as the point of time when we record the new value
of the security after the market digests the publicly released information. The two resulting measures,
1 2( , 10min)iAR t t and 1 1( , )iAR t d , represent abnormal returns from the early access time to 10 minutes
after the public release, or to the market close of the following day.
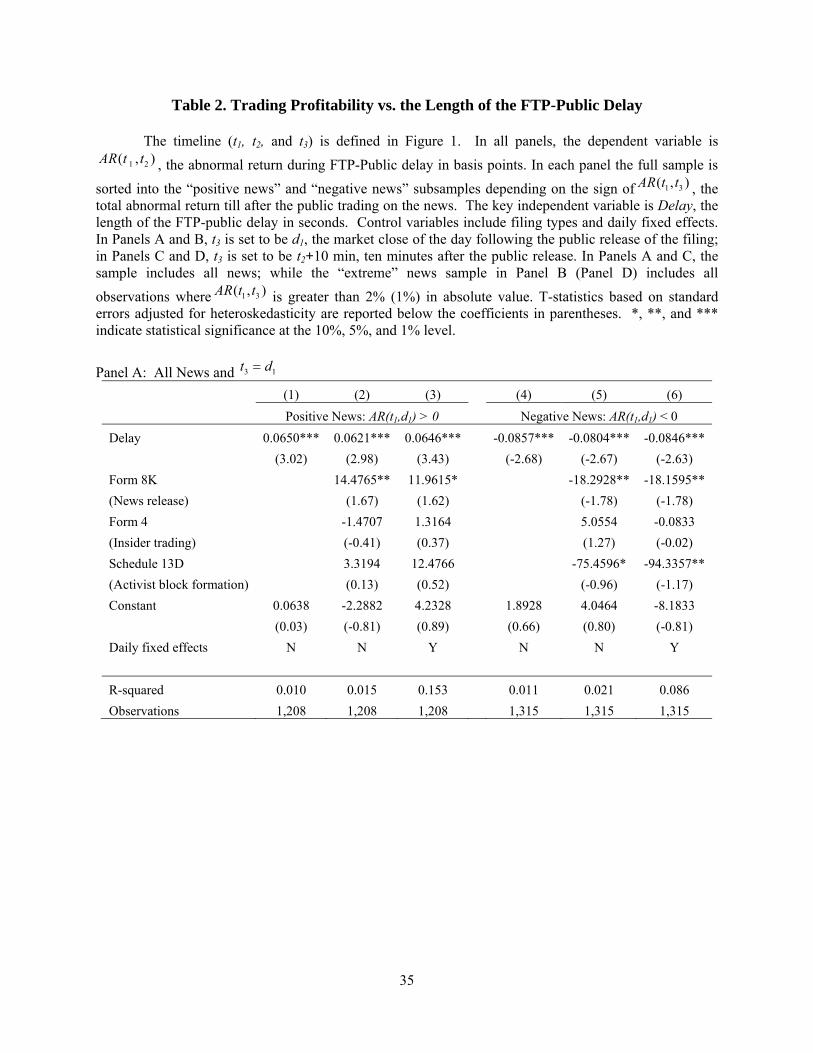
Table 2 reports results from various permutations. To start with, Panel A shows the relation
between 1 1( , )iAR t d and Delay, conditional on positive and negative news, where the latter is simply
classified by the sign of 1 1( , )iAR t d . In both directions, for every 100 seconds of incremental delay, the
private informed traders gain additional 6.2 –8.6 basis points in profits. The magnitude of the gain is
stable across all specifications, whether or not we include controls for file types and daily fixed effects,
and are all statistically significant at the 1% level.
[Insert Table 2 here.]
Needless to say, all filings are not equal in their newsworthiness. As we increase the hurdle for
positive/negative news classification by requiring 1 1( , )iAR t d to be more than 0.5%, 1%, and 2% in
absolute value, the coefficients on Delay (with full controls) increases smoothly and monotonically, from
7 to 26 basis points per 100 second delay for positive news, and from 9 to 25 basis points for negative
news. The results reported in Panel B of Table 2 are conditional on a positive/negative news hurdle of +2%
or −2%. All specifications indicate that trading profitability significant increases with the length of delay;
moreover, early access to negative information is more profitable than positive information. With full

14
controls, every 100 second delay is associated with 16-21 basis points of additional abnormal returns for
positive news; and the corresponding figure for negative news, 26-28 basis points, is about 50% higher.
To a large extent, the profitability opportunities for the early informed does not depend on the
eventual equilibrium stock price that the market settles at one day after the public release of the
information. Instead, the early informed can always front run the trades by the late informed—who were
likely not aware of their information disadvantage. We thus consider an alternative positive/negative
news classification using 1 2( , 10min)iAR t t , the abnormal returns during the shorter window until 10
minutes after the public release. This interval is meant to provide just enough time for the early informed
to unwind their positions by trading against the late informed shortly after the information becomes public.
Results using this short window are reported in Panels C and D of Table 2. Using the sign of
1 2( , 10min)iAR t t as classification of positive/negative news, the coefficients on Delay are stable,
ranging from 7-9 basis points per 100 seconds’ delay, and are all significant at the 1% level. If we use a
more stringent cutoff 1 2( , 10min) 1%iAR t t 12, the coefficients rise to 36-94 basis points (significant at
the 5% level or less), suggesting substantially higher profit opportunities from early access to more
informative filings.
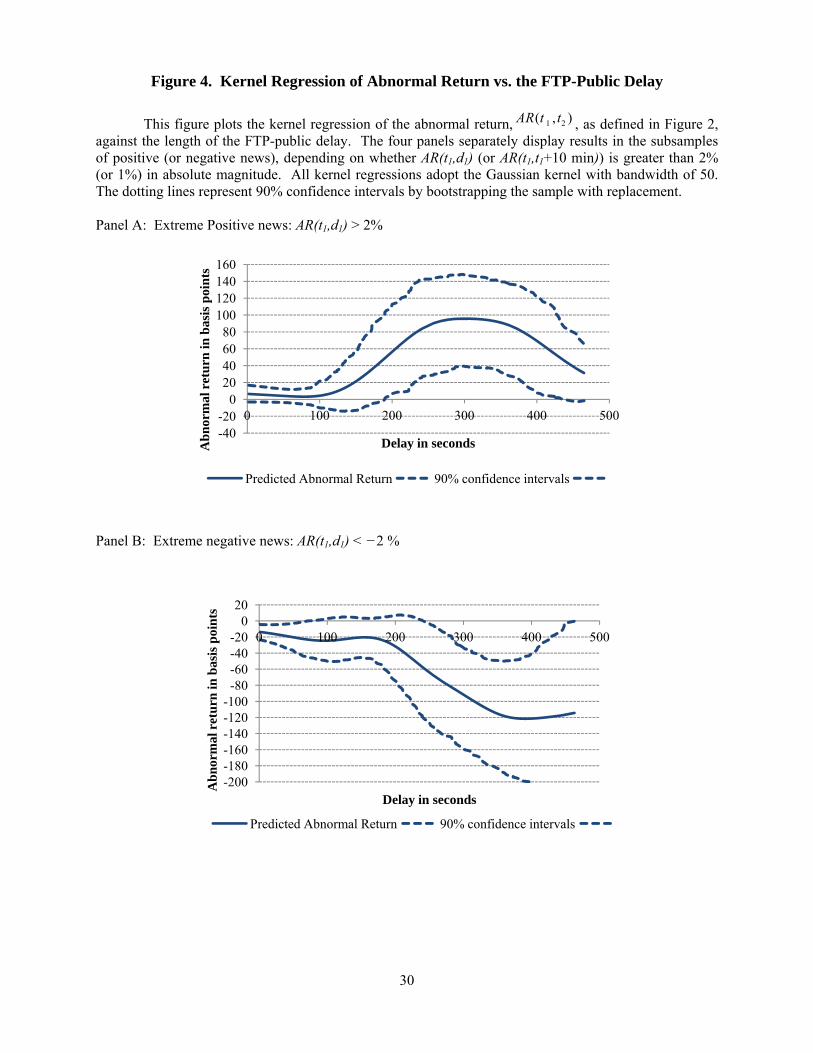
A2. Nonparametric analysis
Results in Table 2 offer a full picture, under a variety of specifications, of the average rate of
profitability which is assumed to progress linearly with the time of delay. To entertain a non-linear
relation, taking into account that it might take some (short) time before the market price incorporates
private information, we resort to nonparametric analyses by running standard kernel regressions of the
abnormal return, 1 2( , )AR t t , on the delay, 2 1t t , conditional on the nature of the news as proxied by the
sign and magnitude of the ex post abnormal return, 1 3( , )AR t t . Panels A and B of Figure 4 provide a
12 We opt for 1% rather than 2% as the threshold for “extreme” news because the subsample of
observations with absolute abnormal returns greater than 2% is too small for reliable statistical analysis.

15
visualization of the cumulative trading profitability as the time advantage enjoyed by the early informed
prolongs, separately for “extreme” positive and negative news using the 1 1( , ) 2%iAR t d cutoff. The
shapes of the graphs using only the sign of 1 1( , )iAR t d are similar with flatter slope.
[Insert Figure 4 here.]
The solid lines in the figures are the nonparametric regressions of 1 2( , )iAR t t versus Delay using
the standard Gaussian kernel function, and the dotted lines represent the 90% confidence intervals
obtained using bootstrapping with replacement. Several patterns emerge that are incremental to what one
can learn from the regressions in Table 2. First, there is little price movement during the first 100 second
of delay even for this sample of newsworthy events (such that the news will generate 2% or more in
absolute abnormal returns after the public fully absorbs the news). This “inaction” region is somewhat
surprising given all the attention given to high-frequency trading where informed trades and their price
impact could occur on a millisecond scale.
Thus, the informed trading analyzed in our context is distinct from high-frequency trading, and
there are two possibilities for the inaction at the short end of the delay. The first explanation is that it
takes time (up to minutes and not seconds) for even the most sophisticated speculators to process new
information about the fundamental value of a firm, which is distinct from information advantage from the
knowledge of order flows. This possibility explains the finding of Rogers, et al. (2014) that the early
informed traders react faster to information in Form 4 because Form 4 essentially reveals the order flow
from the insiders. The direction of the trades in a Form 4 could be retrieved instantly, while assessing the
nature of information disclosed in a Form 8-K takes more time. Alternatively, it may take up to 1 – 2
minutes before the informed trades are detected by market makers. This is also plausible given that a
great majority (95%) of the filings analyzed in our sample are unscheduled. Hence, it might take time for
market makers to form a certain level of belief regarding order flows from the early informed.
Second, impounding of private information seems to be saturated around the 5th – 6th minute for
both positive and negative news. In fact, there seems to be a reversal after six minutes for the positive

16
news subsample (though the scanty data density around that range does not allow use to conclude with
statistical confidence). Delays beyond five minutes are uncommon and likely unexpected. As such,
strategic training may occur, such that the full price impact is obtained during the first few minutes, and
additional trades are not as profitable. Section II.B will analyze such strategic trading in more detail.
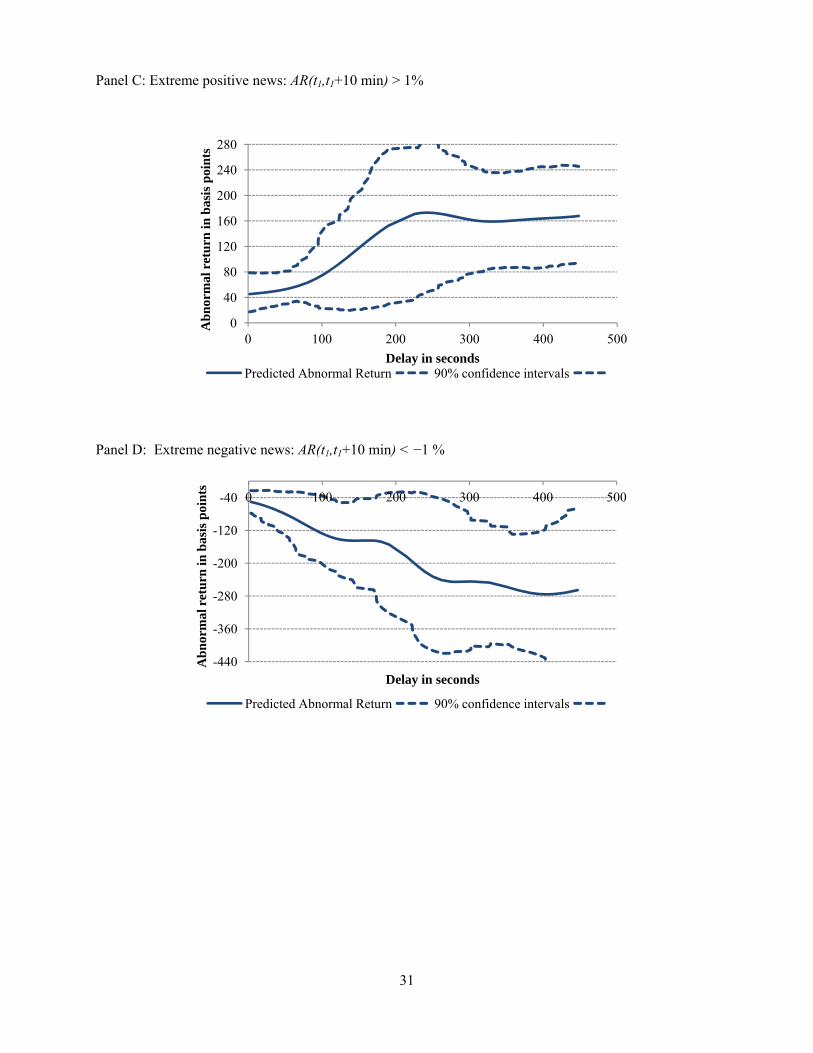
Analogous to Panels A and B of Figure 2, Panels C and D plot the nonparametric relation
between abnormal returns during the private window against the length of delay using the
1 2( , 10min) 1%iAR t t to classify positive or negative news. The patterns are similar except that the
total trading profits are almost twice as larger. The higher profitability conditional on ex post returns in a
shorter time window is expected because the filings are more likely to be the sole driver of price
movement during the ten-minute window than the one-day window.
The combined results in Table 2 and Figure 4 affirm a robust opportunity for profitable trading by
market participants who gained early access to firms’ SEC filings. If we assume that they can trade in the
right direction when the ex post abnormal return 1 2( , 10min)iAR t t is greater than 1% in absolute terms
(empirically, 81.4% of the time 1 2( , )iAR t t and 1 2( , 10min)iAR t t have the same sign), and that they
initiate a trade right after 1t and unwind right after 2t , the early informed would potentially be earning an
abnormal return of 75 and 160 basis points for a 100 and 200 second delay for positive news, and around
120-170 basis points for a 100-200 second delay for negative news. Both are significantly different from
zero even under the low-power nonparametric tests. The total trading profits potentially come from two
sources: foreknowledge of the change in the fundamental value of the firm conditional on the news, and
overreaction of the late informed who are not aware of the stale nature of the news at public release (to be
analyzed in detail in Section II.C). The magnitude of the returns is sizable considering the duration for
the arbitrage. Such opportunities also abounded during our sample period: Out of 77 trading days during
our sample period alone, there are 113 filings that incurred absolute abnormal returns of more than 1%
during the 1 2( , 10min)t t window and a delay in public release of more than 100 seconds.
17
B. Information Dissemination and Strategic Trading
B.1. Information dissemination and length of delay
After establishing the trading profitability of the early informed, we now shift our focus from the
speculators to the market to assess the speed at which stock prices reflect private information from
speculators. We use the abnormal returns during the 1 3( , )t t window ( 1 1( , )iAR t d or 1 2( , 10min)iAR t t ) to
capture the information content of a filing. A longer time window allows adequate time for the market to
digest the new information but also allows other information events to confound the effect of the
particular filing under study. Therefore, consistency across the results using both measures will give us
more confidence.
In this analysis, the dependent variable becomes the ratio 1 2 1 3( , ) / ( , )i iAR t t AR t t , which measures
the proportion of the “total information content” of a particular filing that is impounded into the stock
price during the window when the information remains private. To ensure that the “total information
content” is meaningful, we restrict the sample to filings for which 1 3( , )iAR t t is at least 0.5% in either
direction. Setting 3t to be 2 10mint or 1d , 72.4% or 53.6% of the observations have positive values of
1 2 1 3( , ) / ( , )i iAR t t AR t t . Assuming that the market correctly assesses at least the directional change in the
firm value based on the new SEC filing by 3t , then a negative value of 1 2 1 3( , ) / ( , )i iAR t t AR t t indicates that
informed trading, if exists, does not overcome noise trades to have a price impact; in other words, noise,
rather than information, drives the stock prices during the private window. Our default specification thus
retains the negative values of 1 2 1 3( , ) / ( , )i iAR t t AR t t , effectively interpreting noise as “negative
information.” An alternative method is to censor the negative values of the ratio as zero by treating noise
as simply “non-information.” Both specifications produce qualitatively similar results but the method we
utilized has greater statistical power. The independent variables are the same as in Table 2, where the
independent variable of key interest is Delay, or the duration of time when information remains private.
Results are reported in Table 3.
[Insert Table 3 here.]
18
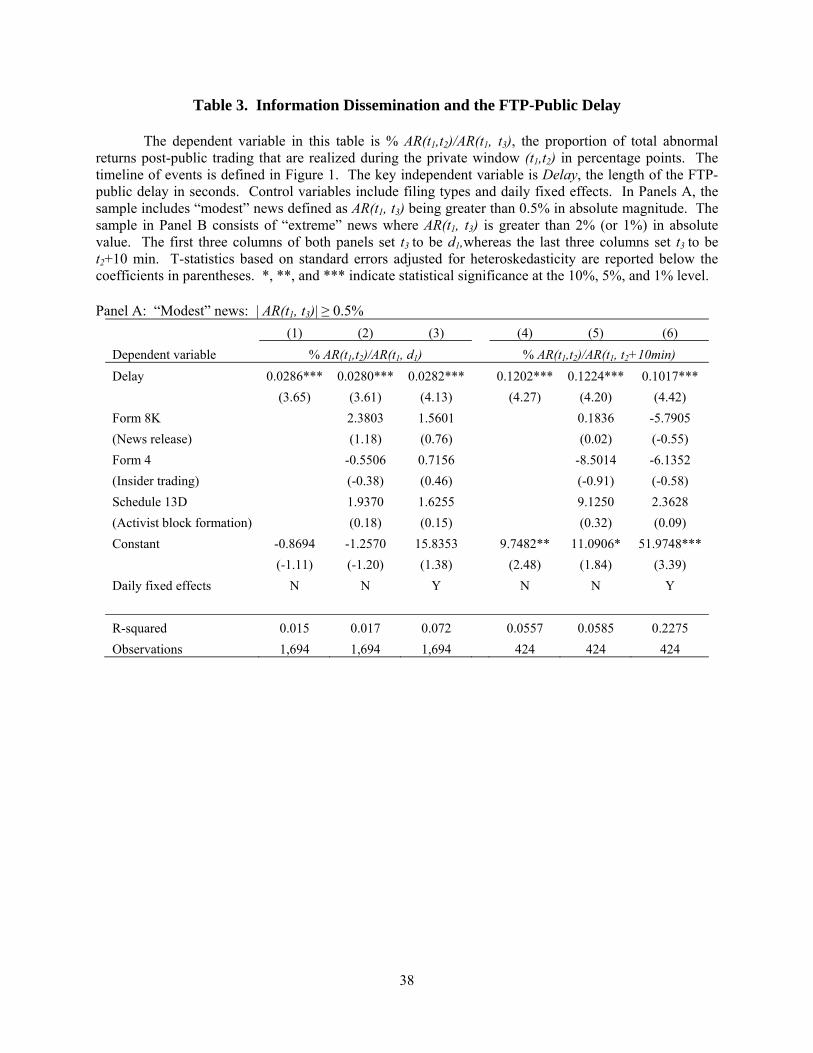
Panel A of Table 3 analyze the sample of “modest” news, i.e., | ARi(t
1,t
3) | 0.5% . As a
percentage of the total return from 1t to 1d , every 100 second delay is associated with 2.8 – 2.9
percentage points increase in private information dissemination; and the speed increases to 10.2 – 12.2
percentage points if we shrink the end point to 2 10mint during which we are reasonably sure that the
SEC filing in consideration is the only information event. All these coefficients are highly statistically
significant at the 1% level.
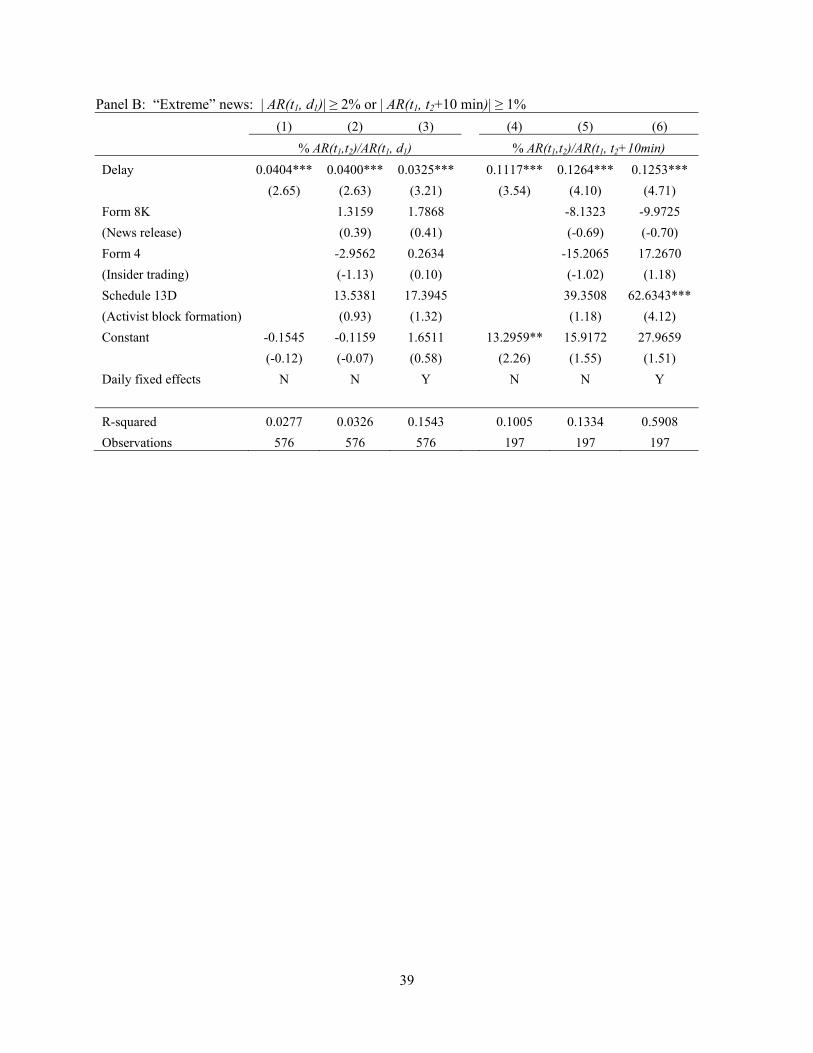
Panel B raises the stakes, limiting the definition of “extreme” news to 1 1| ( , ) | 2%iAR t d or
1 2| ( , 10min) | 1%iAR t t . The magnitude of the coefficients on Delay is similar to those in the “modest”
news sample: 3.2 – 4.0 basis points for every 100 second delay for the long window and 13.0 – 14.4.6
basis points for the short window. Again, all coefficients are significant at the 1% level. Results in Table
3 thus suggest that it takes time to disseminate private information. On average it takes 4 – 5 minutes for
the market to incorporate about half of the total information in the private signal acquired by the early
informed.
The stable pace of private information dissemination with varying intensity of the signal (i.e., a
filing that will move the stock price by at least 0.5% or 2%) is consistent with the standard microstructure
models (e.g., Kyle (1985)) where one-half of the inside information is incorporated into the price in a one-
period model regardless of the ex ante volatility of the asset value. We thus offer a first study that
quantifies the time the market takes to incorporate private information via informed trading. Such
estimations have not been available to researchers precisely because the accurate arrival time of private
information is, by definition, not observable to researchers (except in the rare case we are analyzing). A
similar analysis using public announcement cannot isolate the channel of information impounding
through trading because prices usually adjust (by market makers) even in the absence of a trade.
B.2. Strategic trading and predicted vs. residual delay
As in the setting of Koudijs (2014a), the speed at which the early informed speculators trade their
private information depends on the expected duration of the private window. In Koudijs (2014a), the
19
duration has exogenous variation—that is, there, weather affects the journey by boats carrying newsletters
across the Atlantic. In our setting, the private window has a random stopping time depending on traffic at
the EDGAR server. While speculators in our sample could form some expectation about the delay time,
for which the single most powerful predictor is the time of the day for 1t (see Figure 2), the expectation is
quite coarse, leaving a large residual variation in the unexpected delay to allow for identifying the
strategic behavior.
As an illustration, consider the following hypothetical example. Suppose a PDS subscriber
receives a newsworthy SEC filing at 9:00am. At that time of the day, the expected delay is short (around
40 seconds). The speculator should trade as aggressively as possible and will probably reveal her private
signal quite promptly. If, however, the actual delay were much longer at 200 seconds, the “unexpected”
part of the delay (in this case, 160 seconds) is likely to be a wasted opportunity because the private signal
would have been revealed prematurely compared to an optimized scheme with known delay duration of
200 seconds. As an example, consider a scenario where private information arrives around 4:00pm when
the expected delay is expected to be more than 200 seconds. In that case, a strategic speculator should
trade smoothly in small quantities. If, however, the public release occurs much faster than usual and ends
the private window after a mere 60 seconds, then the “residual” delay (120 seconds) would not contribute
additional private information dissemination because the process was cut short. In both cases, the
prediction is such that 1 2 1 3( , ) / ( , )i iAR t t AR t t should bear a much stronger relation to expected or predicted
delay than to unexpected or residual delay.
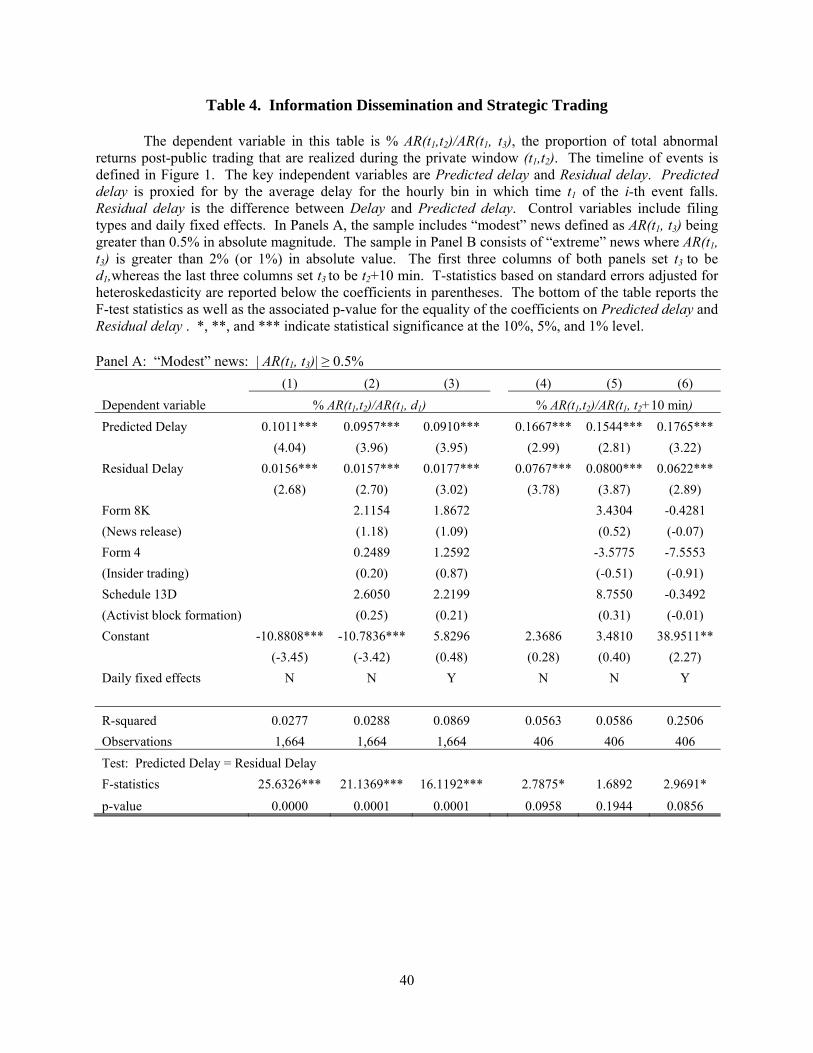
Table 4 performs this test. Here the regressions are the same as in Table 3, except that the key
independent variable Delay is replaced by two variables, Predicted delay and Residual delay. Predicted
delay is the average delay for the hourly bin in which time t1 of the i-th event falls. Residual delay is the
difference between Delay and Predicted delay. Under all of our specifications, the statistical significance
is higher for the coefficients on Predicted delay than Residual delay, as the former has more cross-
20
sectional variation. Under variance decomposition, 39.7% of the total variation in Delay is retained by
Predicted delay.
[Insert Table 4 here.]
Panel A reports the “modest” news sample where | ARi(t
1,t
3) | 0.5%. Indeed, the coefficients on
Expected delay are about 4-6 times as large as those on Residual delay across all three specifications for
3 1t d . An F-test on the difference between these coefficients indicates that the pairwise difference is
significant at the 1% level in these specifications as well. If we use a shorter window, 2 10mint to
record the stock price that incorporates the public information, the ratio of the two coefficients is lower,
around 2.0 – 2.5, in which case the difference between the two coefficients is only marginally significant
(at the 10% level) in two out of the three specifications.
The “extreme” news sample ( 1 1| ( , ) | 2%iAR t d or 1 2| ( , 10min) | 1%iAR t t ) provides similar
results. The sample shrinks but both time windows 1 3( , )t t produce coefficients on Predicted delay that
are notably larger than those on Residual delay, with ratios similar to those in Panel A except the last
column where estimation with daily fixed effects on a small sample becomes unreliable. The F-tests for
the difference in the two coefficients remain significant at the 1% level for t3 = d1, but are insignificant
for t3 = t2+10 min.
Overall, the results in Table 4 show the early informed trade aggressively based on the time
advantage they expect to have—rather than the advantage they actually enjoy. This echoes Koudijs’
(2014a) finding that the co-movement between the London and Amsterdam exchanges was significantly
higher when the next boat was expected to arrive sooner (depending on the wind and weather conditions),
which implies that the speed of information dissemination in Amsterdam depended on how long insiders
expected it would take for their private signal to become public.
C. Overreaction to Stale News at Public Release
21
During our sample period, public investors were likely not aware of the fact that some investors
were gaining access to the SEC filings moments before the public release of that information. In fact, the
magnitude of the public’s surprise was apparent in light of the outrage expressed in the media and by
lawmakers upon the revelation of the dissemination delay. As such, investors would most likely not be
aware that information made available on EDGAR was already stale by the time the filings reached the
SEC’s public website. The combination of the investors’ late-informed status together with an ignorance
of that status predicts that public investors may overreact to the news contained in public releases even if
those investors are fully rational. To the extent that the length of the information advantage obtained by
the early informed is positively associated with the staleness of news at public release (as shown in Tables
2 to 4), it should also be positively associated with the extent of overreaction.
It is worth noting that overreaction to stale news in our setting is of a different nature from that in
Huberman and Regev (2001) and Tetlock (2011). In those two studies, investors treat all information as
news without differentiating “printed” from “reprinted” news, i.e., news with either full or partial content
that was already described in earlier releases. Thus, the investors in those studies are interpreted to be
naïve or unsophisticated in assessing the incremental content of public news. In our setting, investors—
even sophisticated ones—were likely unaware of the possibility that some traders could front-run on
filings submitted to the SEC—an agency whose stated mission is to create a level playing field all market
participants.
Following Tetlock (2011), overreaction to stale news can be tested by showing whether there is
return reversal in the “steady state” after the first trading period post public news release, i.e., 2 3( , )t t as
previously defined. We now introduce another time point, 4t , to proxy for the “steady state.” We set
4 5t d , the market close five days after the public release ( 2t ), based on Tetlock’s (2011) finding that it
takes up to five days for market overreactions to reverse. Figure 1 displays and explains the relation
among all the time points, t1 to t4. Then the analysis boils down to a regression of 3 4( , )iAR t t on

22
2 3( , )iAR t t and an interaction term 2 3( , )i iAR t t Delay where a significantly positive coefficient on the
latter is consistent with overreaction due to stale news. Results are reported in Table 5.
[Insert Table 5 here.]
Panel A starts with the full sample. Using the first day close (i.e, 3 1t d ) as the end of the period
of the presumed overreaction, the first three columns show that the key coefficients on 2 3( , )i iDelay AR t t
are significant (at the 5% level) in a regression that includes iDelay and 2 3( , )iAR t t on their own as well
as other standard control variables. The coefficients on 2 3( , )iAR t t are positive but insignificant,
indicating no overreaction when the time enjoyed by the early informed is close to zero. Moreover, the
coefficients are about 100 times as large as those on the interaction term 2 3( , )i iDelay AR t t , indicating
that return reversal starts to manifest when the delay exceeds 100 seconds.
It is worth noting that the length of 100 seconds required for overreaction to take place maps
nicely to the first 100 seconds of “no action” zone by the early informed identified in Section II.A, and in
particular Figure 3. If stock prices on average fail to reflect the new signal possessed by the early
informed for the first 100 seconds, there should be no overreaction by the late informed if the time lag
between the two groups is no longer than 100 seconds because the news remains “fresh” at the time of
public release ( 2t ). The last three columns of Panel A adopt the ten-minute window for overreaction.
The coefficients of DelayiAR
i(t
2,t
3)are almost twice as high as those in the first three columns, but are
not statistically significant.
Results in Panel B, which focuses on the “extreme” news subsamples, are qualitatively similar to
those in Panel A where every 100 seconds is associated with 14% more of the abnormal returns during the
(t2,d1) window to be reversed during (d1,d5). On the other hands, using t2+10 min as the separator
between the overreaction period and reversal period overall does not produce significant results.
The contrast in the statistical significance between setting the end of overreaction period to be d1
and t2+10 min suggests that the public investors may continue to overreact to news during the

23
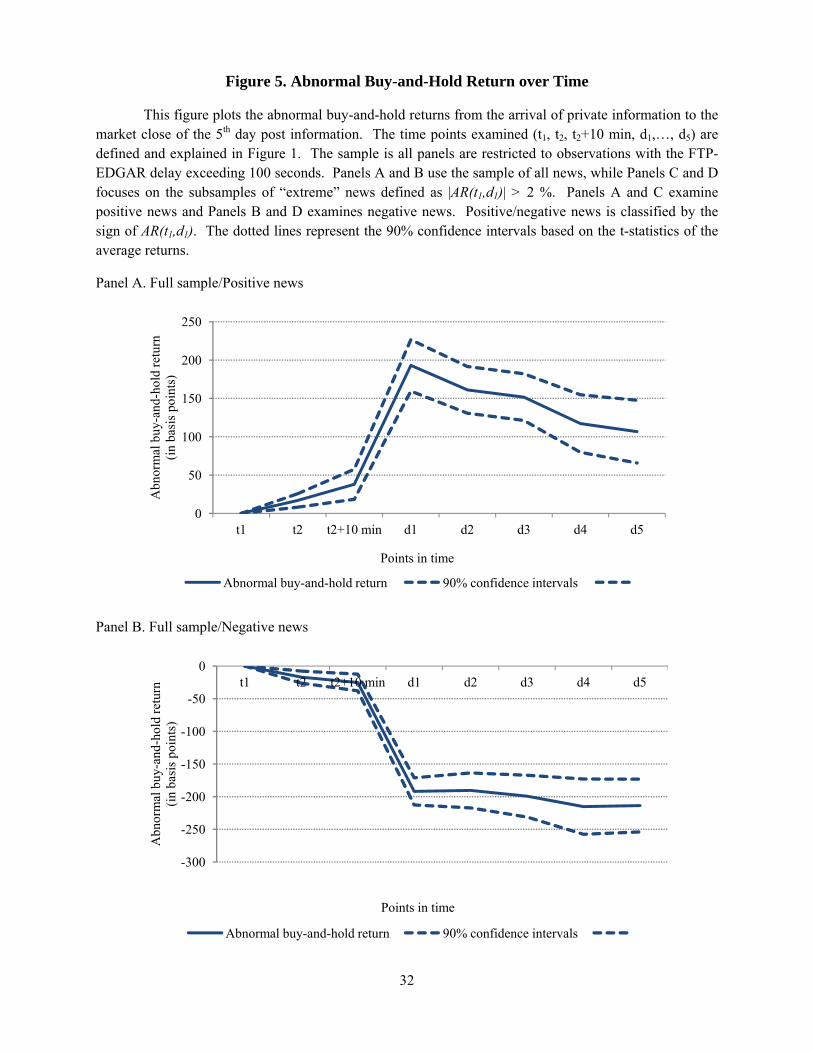
2 1( 10min, )t d time window. This conjecture is confirmed by Figure 5, where we plot the cumulative
abnormal buy-and-hold returns from the arrival of the private information (t1) to the market close of the
fifth trading day afterwards (d5), with intermediate time points of interest, t2, t2+10min, d1,…,d4
highlighted. The sample is restricted to observations with a delay of 100 seconds or more (since there is
no overreaction when the delay is shorter), and positive/negative news is classified by the sign of
AR(t1,d1). Interestingly, overreaction is present only for positive news but not for negative news.13
Importantly, it is indeed the case that the bulk of the overreaction takes place during the 2 1( 10 min, )t d
time window.
[Insert Figure 5 here.]
The analysis in this section indicates that public investors overreacted to SEC filings containing
positive news on the day of the public release, not knowing that the news was already stale when there
was a significant delay (above 100 seconds) in its release. The absence of overreaction when the delay
was minimal indicates that the investors were not irrational but only ignorant (and rightly so) about the
pre-release leakage. Such evidence shows that the early release of SEC filings to a small group of
investors hurt the investing public, inflicting more damage than would have been incurred if PDS
subscribers’ time advantage had been public knowledge.
III. CONCLUSION
Using rare data from an unusual episode in which SEC filings containing market-moving
information were disseminated to a small group of investors before the public release of that information,
we consider a quasi-natural experiment that provides a direct test of the process through which private
information is impounded into stock prices. Contrary to the common public intuition about how quickly
“fast” traders can act on new information, we find that it takes time—minutes, not seconds—for informed
investors to impound fundamental information into public-company stock prices.
13 One explanation for this asymmetry in reaction to news is the “bad news travels slowly” phenomenon
described in Hong, Lim, and Stein (2000), especially when the source of the negative information is the firm.
24
As one might expect, informed investors profit more—and convey more information into stock
prices through their trading—when the delay between private and public revelation of the information is
longer. More importantly, information dissemination is much more strongly correlated with the predicted
length of the delay rather than the actual delay, consistent with the notion that informed investors trade
strategically, evening out the price impact of their trading. Finally, we show that public investors
overreacted to positive news contained in SEC filings, because they were unaware that the information
was stale by the time it arrived on the SEC’s EDGAR website.
Our study contributes to the relatively scant empirical literature on the process through which
private information is incorporated into security prices. We quantify the consequences that investors
suffered when certain traders were given early access to market-moving information. The study also
serves as a modern counterparty to Koudijis’ (2014a) analysis of insider trading during the eighteenth
century. Our setting, however, allows us to consider the questions analyzed by Koudijis while replacing
week-long sailing voyages with electronic transmission as the conduit through which information travels
to markets .

25
REFERENCES
Ackerman, Andrew, Scott Patterson, and Ryan Tracy (2014, Nov. 3). Gap narrows in access to SEC filings. Wall Street Journal.
Barclay, Michael J. and Terrance Hendershott, 2003. Price discovery and trading after hours, Review of
Financial Studies 16, 1041-1073. Barclay, Michael J. and Terrance Hendershott, 2004. Liquidity externalities and adverse selection:
Evidence from trading after hours, Journal of Finance 59, 685-710. Bauguess, Scott, Jack Cooney, and Kathleen Weiss Hanley, 2013. Investor demand for information in
newly issued securities, working paper, Securities and Exchange Commission, Texas Tech University, and University of Maryland.
Bond, Philip, Alex Edmans, and Itay Goldstein, 2012. The real effects of financial markets, Annual
Reviews of Financial Economics 4, 339-360. Caldentey, René, and Ennio Stacchetti, 2010. Insider trading with a random deadline, Econometrica,
245-283. Collin-Dufresne, Pierre and Vyacheslav Fos, 2014a. Do prices reveal the presence of informed trading?
Journal of Finance, forthcoming. Collin-Dufresne, Pierre and Vyacheslav Fos, 2014b. Insider trading, stochastic liquidity, and equilibrium
prices, working paper, Swiss Finance Institute and University of Illinois. Drake, Michael S., Darren T. Roulstone, and Jacob T. Thornock, 2014. The determinants and
consequences of information acquisition via EDGAR, working paper, Brigham Young University, Ohio State University, and University of Washington.
Easley, David Alan and Maureen O'Hara, 2003. Microstructure and asset pricing, in Handbook of the
Economics of Finance, eds G. Constantinides, M. Harris, R. Stulz, Elsevier. Glosten, Laurence, and Paul Milgrom, 1985. Bid, ask and transaction prices in a specialist market with
heterogeneously informed traders, Journal of Financial Economics 14, 71-100. Hong, Harrison, Terence Lim, and Jeremy Stein, 2000. Bad news travels slowly: Size, analyst coverage,
and the profitability of momentum strategies, Journal of Finance 55, 265-295. Hu, Grace Xing, Jun Pan, and Jiang Wang, 2013. Early peek advantage, working paper, Hong Kong
University and MIT. Huberman, Gur, and Tomer Regev, 2001. Contagious speculation and a cure for cancer: A non-event that
made stock prices soar, Journal of Finance 56, 387-396. Jackson Jr., Robert J., and Joshua Mitts, 2014. How the SEC Helps Speedy Traders, working paper,
Columbia Law School. Loughran, Tim, and Bill McDonald, 2014. Information Decay and Financial Disclosures, working paper,
University of Notre Dame.
26
Koudijs, Peter, 2014a. Those who know most: Insider trading in the 18th century Amsterdam, Journal of
Political Economy, forthcoming. Koudijs, Peter, 2014b. The boats that did not sail: Asset price volatility in a natural experiment. Journal
of Finance, forthcoming. Kyle, Albert S. 1985. Auctions and insider trading, Econometrica 53, 1315-1336. Patterson, Scott and Ryan Tracy (2014, Oct. 28). Fast traders are getting data from SEC seconds early:
studies show lag in posting to website. Wall Street Journal. Rogers, Jonathan L., Douglas J. Skinner, and Sarah L. C. Zechman, 2014. Run EDGAR Run: SEC
dissemination in a high-frequency world. Working paper, University of Colorado and University of Chicago Booth School of Business.
Silverman, B.W., 1998. Density Estimation for Statistics and Data Analysis. London: Chapman &
Hall/CRC. Tetlock, Paul C., 2011. All the news that’s fit to reprint: Do investors react to stale information? Review
of Financial Studies 24, 1481-1512. Tetlock, Paul C., 2014. Information Transmission in Finance, Annual Review of Financial Economics 6,
365-84.
27
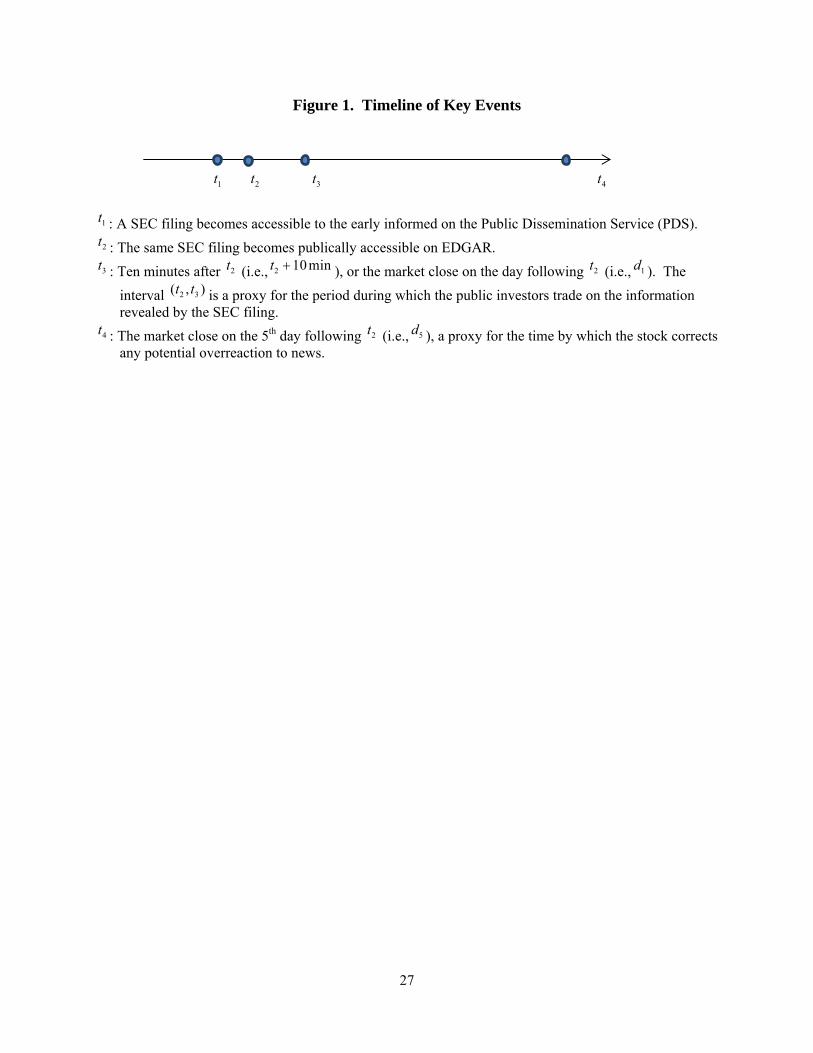
Figure 1. Timeline of Key Events
1t 2t 3t 4t
1t : A SEC filing becomes accessible to the early informed on the Public Dissemination Service (PDS).
2t : The same SEC filing becomes publically accessible on EDGAR.
3t : Ten minutes after 2t (i.e., 2 10mint ), or the market close on the day following 2t (i.e., 1d ). The
interval 2 3( , )t t is a proxy for the period during which the public investors trade on the information revealed by the SEC filing.
4t : The market close on the 5th day following 2t (i.e., 5d ), a proxy for the time by which the stock corrects any potential overreaction to news.
28
Figure 2. Average FTP-Public Delay Time throughout a Trading Day
This figure shows the average delay in public release of all filings by public companies during the sample period of June 25, 2014 to October 15, 2014 (excluding July 15, 2014) by hourly intervals throughout a trading day, including the before-market-open and after-market close hours. The delay is calculated as the difference in time, in seconds, from the SEC’s public file transfer protocol (FTP) timestamp (a proxy for the actual time that a file reaches the subscribers’ Public Dissemination Service (PDS)) to the SEC’s Electronic Data Gathering, Analysis, and Retrieval System (EDGAR) timestamp (the actual official time for public release).
0
50
100
150
200
250
300
FT
P-P
ub
lic
Del
ay in
sec
ond
s
Time of the day
29
Figure 3. Histogram of Abnormal Returns during the FTP-Public Delay
This figure plots the histogram of the abnormal returns during the FTP-public delay (as defined in Figure 2). The abnormal returns are calculated as the difference between the stock returns of the issuers of the filings and that of the SPY, the most liquidly traded exchange-traded-fund (ETF) tracking the S&P 500 index. The dotted graph represents the hypothetical histogram from a normal distribution.
0%
5%
10%
15%
20%
25%
30%(-
182,
-177
]
(-12
7,-1
22]
(-11
2,-1
07]
(-97
,-92
]
(-77
,-72
]
(-62
,-57
]
(-47
,-42
]
(-32
,-27
]
(-17
,-12
]
(-2,
3]
(13,
18]
(28,
33]
(43,
48]
(58,
63]
(73,
78]
(88,
93]
(103
,108
]
(118
,123
]
(133
,138
]
(148
,153
]
Em
pir
cal f
req
uen
cy
Abnormal return in basis points
30
Figure 4. Kernel Regression of Abnormal Return vs. the FTP-Public Delay
This figure plots the kernel regression of the abnormal return, 1 2( , )AR t t , as defined in Figure 2, against the length of the FTP-public delay. The four panels separately display results in the subsamples of positive (or negative news), depending on whether AR(t1,d1) (or AR(t1,t1+10 min)) is greater than 2% (or 1%) in absolute magnitude. All kernel regressions adopt the Gaussian kernel with bandwidth of 50. The dotting lines represent 90% confidence intervals by bootstrapping the sample with replacement. Panel A: Extreme Positive news: AR(t1,d1) > 2%
Panel B: Extreme negative news: AR(t1,d1) < −2 %
-40-20
020406080
100120140160
0 100 200 300 400 500
Ab
nor
mal
ret
urn
in b
asis
poi
nts
Delay in seconds
Predicted Abnormal Return 90% confidence intervals
-200-180-160-140-120-100
-80-60-40-20
020
0 100 200 300 400 500
Ab
nor
mal
ret
urn
in b
asis
poi
nts
Delay in seconds
Predicted Abnormal Return 90% confidence intervals
31
Panel C: Extreme positive news: AR(t1,t1+10 min) > 1%
Panel D: Extreme negative news: AR(t1,t1+10 min) < −1 %
0
40
80
120
160
200
240
280
0 100 200 300 400 500
Ab
nor
mal
ret
urn
in b
asis
poi
nts
Delay in secondsPredicted Abnormal Return 90% confidence intervals
-440
-360
-280
-200
-120
-40 0 100 200 300 400 500
Ab
nor
mal
ret
urn
in b
asis
poi
nts
Delay in seconds
Predicted Abnormal Return 90% confidence intervals
32
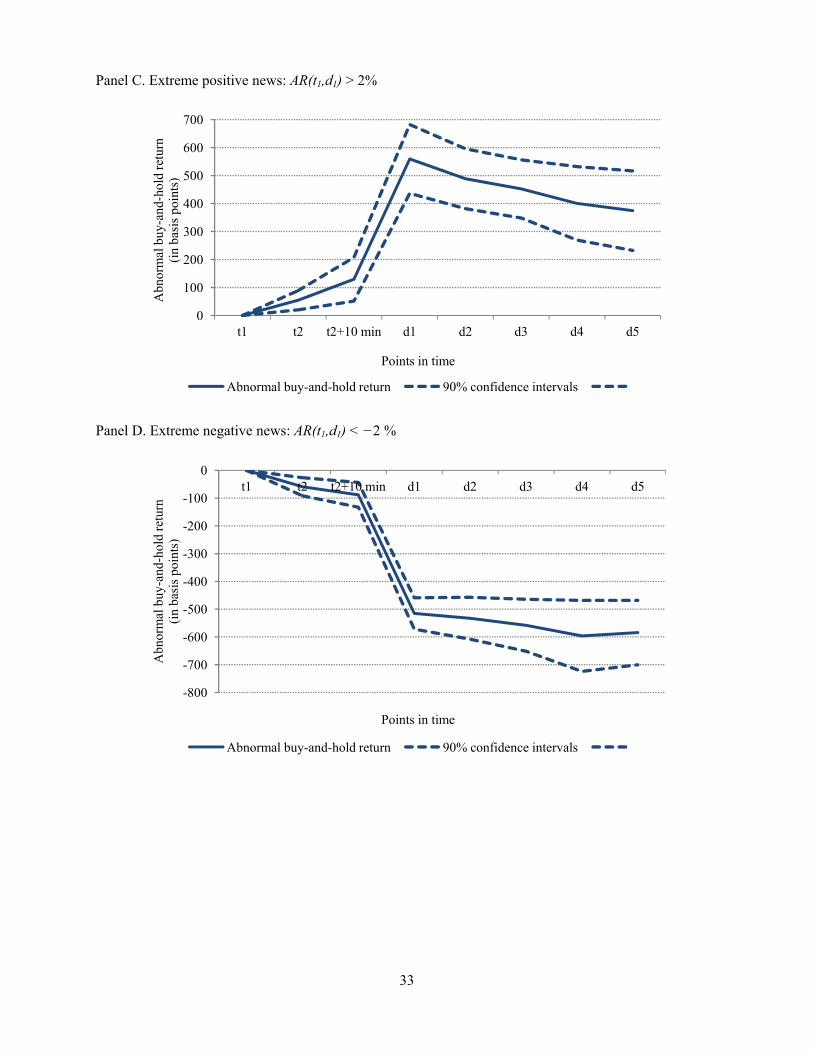
Figure 5. Abnormal Buy-and-Hold Return over Time
This figure plots the abnormal buy-and-hold returns from the arrival of private information to the market close of the 5th day post information. The time points examined (t1, t2, t2+10 min, d1,…, d5) are defined and explained in Figure 1. The sample is all panels are restricted to observations with the FTP-EDGAR delay exceeding 100 seconds. Panels A and B use the sample of all news, while Panels C and D focuses on the subsamples of “extreme” news defined as |AR(t1,d1)| > 2 %. Panels A and C examine positive news and Panels B and D examines negative news. Positive/negative news is classified by the sign of AR(t1,d1). The dotted lines represent the 90% confidence intervals based on the t-statistics of the average returns.
Panel A. Full sample/Positive news
Panel B. Full sample/Negative news
0
50
100
150
200
250
t1 t2 t2+10 min d1 d2 d3 d4 d5
Abn
orm
al b
uy-a
nd-h
old
retu
rn
(in
basi
s po
ints
)
Points in time
Abnormal buy-and-hold return 90% confidence intervals
-300
-250
-200
-150
-100
-50
0t1 t2 t2+10 min d1 d2 d3 d4 d5
Abn
orm
al b
uy-a
nd-h
old
retu
rn
(in
basi
s po
ints
)
Points in time
Abnormal buy-and-hold return 90% confidence intervals
33
Panel C. Extreme positive news: AR(t1,d1) > 2%
Panel D. Extreme negative news: AR(t1,d1) < −2 %
0
100
200
300
400
500
600
700
t1 t2 t2+10 min d1 d2 d3 d4 d5
Abn
orm
al b
uy-a
nd-h
old
retu
rn
(in
basi
s po
ints
)
Points in time
Abnormal buy-and-hold return 90% confidence intervals
-800
-700
-600
-500
-400
-300
-200
-100
0t1 t2 t2+10 min d1 d2 d3 d4 d5
Abn
orm
al b
uy-a
nd-h
old
retu
rn
(in
basi
s po
ints
)
Points in time
Abnormal buy-and-hold return 90% confidence intervals
34
Table 1. Distribution of the FTP-Public Delay This table reports the summary statistics (mean, standard deviation, and the various percentile values) of the delay in public release of all filings by public companies during the sample period of June 25, 2014 to October 15, 2014 (excluding July 15, 2014). The delay is calculated as the difference in time, in seconds, from the SEC’s public file transfer protocol (PFT) timestamp (a proxy for the actual time that a file reaches the subscribers’ Public Dissemination Service (PDS)) to the SEC’s Electronic Data Gathering, Analysis, and Retrieval System (EDGAR) timestamp (the actual official time for public release. Summary statistics for the full sample, as well as for the top three filing types, the Form 8K, Form 4, and Schedule 13D, are reported. Form 8-K provides timely disclosure of material corporate events, Form 4 discloses transactions by insiders within 48 hours, and Schedule 13D discloses beneficial ownership with an intention to influence corporate control or policies, within 10 days from crossing the 5% threshold.
All Files Form 8K Form 4 Schedule 13D
(News release) (Insider trading) (Activist block formation)
# observations 42,619 7,227 22,219 517
10th percentile 4 3 4 4.6
25th percentile 7 7 7 12
Median 26 33 24 59
75 percentile 172 203 159 231
90 percentile 466 471.4 451 498
Mean 219.52 180.66 233.13 191.21
Standard Deviation 3242.28 425.56 3995.73 375.29
Truncated mean 130.63 145.94 122.67 94.23
Truncated standard deviation 128.80 137.40 125.69 131.10
35
Table 2. Trading Profitability vs. the Length of the FTP-Public Delay The timeline (t1, t2, and t3) is defined in Figure 1. In all panels, the dependent variable is
1 2( , )AR t t , the abnormal return during FTP-Public delay in basis points. In each panel the full sample is
sorted into the “positive news” and “negative news” subsamples depending on the sign of 1 3( , )AR t t , the total abnormal return till after the public trading on the news. The key independent variable is Delay, the length of the FTP-public delay in seconds. Control variables include filing types and daily fixed effects. In Panels A and B, t3 is set to be d1, the market close of the day following the public release of the filing; in Panels C and D, t3 is set to be t2+10 min, ten minutes after the public release. In Panels A and C, the sample includes all news; while the “extreme” news sample in Panel B (Panel D) includes all
observations where 1 3( , )AR t t is greater than 2% (1%) in absolute value. T-statistics based on standard errors adjusted for heteroskedasticity are reported below the coefficients in parentheses. *, **, and *** indicate statistical significance at the 10%, 5%, and 1% level.
Panel A: All News and 3 1t d
(1) (2) (3) (4) (5) (6)
Positive News: AR(t1,d1) > 0 Negative News: AR(t1,d1) < 0
Delay 0.0650*** 0.0621*** 0.0646*** -0.0857*** -0.0804*** -0.0846***
(3.02) (2.98) (3.43) (-2.68) (-2.67) (-2.63)
Form 8K 14.4765** 11.9615* -18.2928** -18.1595**
(News release) (1.67) (1.62) (-1.78) (-1.78)
Form 4 -1.4707 1.3164 5.0554 -0.0833
(Insider trading) (-0.41) (0.37) (1.27) (-0.02)
Schedule 13D 3.3194 12.4766 -75.4596* -94.3357**
(Activist block formation) (0.13) (0.52) (-0.96) (-1.17)
Constant 0.0638 -2.2882 4.2328 1.8928 4.0464 -8.1833
(0.03) (-0.81) (0.89) (0.66) (0.80) (-0.81)
Daily fixed effects N N Y N N Y
R-squared 0.010 0.015 0.153 0.011 0.021 0.086
Observations 1,208 1,208 1,208 1,315 1,315 1,315

36
Panel B: Extreme News ( 1 3| ( , ) | 2%AR t t ) and 3 1t d
(1) (2) (3) (4) (5) (6)
Positive News: AR(t1,d1) > 2% Negative News: AR(t1,d1) < -2%
Delay 0.2057*** 0.1988*** 0.1603** -0.2796*** -0.2726*** -0.2581**
(2.60) (2.63) (2.13) (-2.38) (-2.45) (-2.66)
Form 8K 26.1740 36.7084 -27.3287 -42.1265
(News release) (0.93) (1.93) (1.22) (-0.31)
Form 4 -18.3061 -6.0805 22.5557 -9.4810
(Insider trading) (-1.12) (-0.32) (1.22) (-0.31)
Schedule 13D -0.3794 39.8695 -294.3428* -346.4304**
(Activist block formation) (-0.01) (0.82) (-2.42) (-2.62)
Constant 0.8983 -1.0633 -13.2046 -0.2433 8.6945 14.7468
(0.12) (-0.08) (-0.44) (-0.02) -0.41 -0.49
Daily fixed effects N N Y N N Y
R-squared 0.027 0.038 0.493 0.030 0.049 0.231
Observations 280 280 280 296 296 296
Panel C: All News and 3 2 10mint t
(1) (2) (3) (4) (5) (6)
Positive News: AR(t1, t2+10 min) > 0 Negative News: AR(t1, t2 +10 min) < 0
Delay 0.0723*** 0.0708*** 0.0780*** -
0.0926*** -0.0861*** -0.0903***
(3.16) (3.19) (3.52) (-3.12) (-3.13) (-3.01)
Form 8K -4.6449 -5.1760 -
18.9438*** -
20.2260***
(News release) (1.78) (1.87) (-1.92) (-1.99)
Form 4 15.8717** 14.2107** 8.0612 2.5239
(Insider trading) (-1.27) (-1.02) (2.15) (0.63)
Schedule 13D 20.7098 23.6425 -45.0684 -50.4168* (Activist block formation) (0.61) (0.74) (-1.09) (-1.14)
Constant 4.2127** 2.2743 5.3683 -2.4910 -1.4153 -5.8221
(2.05) (0.67) (0.94) (-0.94) (-0.32) (-0.74)
Daily fixed effects N N Y N N Y
R-squared 0.0113 0.0195 0.0964 0.0144 0.0259 0.0992
Observations 1,232 1,232 1,232 1,328 1,328 1,328

37
Panel D: Extreme News ( 1 3| ( , ) | 1%AR t t ) and 3 2 10mint t
(1) (2) (3) (4) (5) (6)
Positive News: AR(t1, t2+10 min) > 1% Negative News: AR(t1, t2+10 min) < -1%
Delay 0.3623** 0.4029** 0.6929** -0.5811** -0.6083** -0.9430***
(2.71) (2.69) (2.78) (-2.32) (-2.52) (-2.91)
Form 8K 9.7966 -7.2389 128.4813 151.8677
(News release) (0.15) (-0.11) (0.70) (-0.96)
Form 4 -96.8759 -159.2786 54.3543 -132.4667
(Insider trading) (-1.72) (-1.63) (1.91) (1.25)
Schedule 13D 70.4536 68.8940 -71.4244 -462.5305 (Activist block formation) (0.48) (0.72) (-0.58) (-2.30)
Constant 47.5460 54.3259 -8.1347 -53.9028 -91.2645 16.4957
(1.99) (1.43) (-0.11) (-1.63) (-1.34) (1.34)
Daily fixed effects N N Y N N Y
R-squared 0.041 0.069 0.515 0.064 0.078 0.535
Observations 103 103 103 94 94 94
38
Table 3. Information Dissemination and the FTP-Public Delay
The dependent variable in this table is % AR(t1,t2)/AR(t1, t3), the proportion of total abnormal returns post-public trading that are realized during the private window (t1,t2) in percentage points. The timeline of events is defined in Figure 1. The key independent variable is Delay, the length of the FTP-public delay in seconds. Control variables include filing types and daily fixed effects. In Panels A, the sample includes “modest” news defined as AR(t1, t3) being greater than 0.5% in absolute magnitude. The sample in Panel B consists of “extreme” news where AR(t1, t3) is greater than 2% (or 1%) in absolute value. The first three columns of both panels set t3 to be d1,whereas the last three columns set t3 to be t2+10 min. T-statistics based on standard errors adjusted for heteroskedasticity are reported below the coefficients in parentheses. *, **, and *** indicate statistical significance at the 10%, 5%, and 1% level. Panel A: “Modest” news: | AR(t1, t3)| ≥ 0.5%
(1) (2) (3) (4) (5) (6)
Dependent variable % AR(t1,t2)/AR(t1, d1) % AR(t1,t2)/AR(t1, t2+10min)
Delay 0.0286*** 0.0280*** 0.0282*** 0.1202*** 0.1224*** 0.1017***
(3.65) (3.61) (4.13) (4.27) (4.20) (4.42)
Form 8K 2.3803 1.5601 0.1836 -5.7905
(News release) (1.18) (0.76) (0.02) (-0.55)
Form 4 -0.5506 0.7156 -8.5014 -6.1352
(Insider trading) (-0.38) (0.46) (-0.91) (-0.58)
Schedule 13D 1.9370 1.6255 9.1250 2.3628
(Activist block formation) (0.18) (0.15) (0.32) (0.09)
Constant -0.8694 -1.2570 15.8353 9.7482** 11.0906* 51.9748***
(-1.11) (-1.20) (1.38) (2.48) (1.84) (3.39)
Daily fixed effects N N Y N N Y
R-squared 0.015 0.017 0.072 0.0557 0.0585 0.2275
Observations 1,694 1,694 1,694 424 424 424
39
Panel B: “Extreme” news: | AR(t1, d1)| ≥ 2% or | AR(t1, t2+10 min)| ≥ 1%
(1) (2) (3) (4) (5) (6)
% AR(t1,t2)/AR(t1, d1) % AR(t1,t2)/AR(t1, t2+10min)
Delay 0.0404*** 0.0400*** 0.0325*** 0.1117*** 0.1264*** 0.1253***
(2.65) (2.63) (3.21) (3.54) (4.10) (4.71)
Form 8K 1.3159 1.7868 -8.1323 -9.9725
(News release) (0.39) (0.41) (-0.69) (-0.70)
Form 4 -2.9562 0.2634 -15.2065 17.2670
(Insider trading) (-1.13) (0.10) (-1.02) (1.18)
Schedule 13D 13.5381 17.3945 39.3508 62.6343***
(Activist block formation) (0.93) (1.32) (1.18) (4.12)
Constant -0.1545 -0.1159 1.6511 13.2959** 15.9172 27.9659
(-0.12) (-0.07) (0.58) (2.26) (1.55) (1.51)
Daily fixed effects N N Y N N Y
R-squared 0.0277 0.0326 0.1543 0.1005 0.1334 0.5908
Observations 576 576 576 197 197 197
40
Table 4. Information Dissemination and Strategic Trading
The dependent variable in this table is % AR(t1,t2)/AR(t1, t3), the proportion of total abnormal returns post-public trading that are realized during the private window (t1,t2). The timeline of events is defined in Figure 1. The key independent variables are Predicted delay and Residual delay. Predicted delay is proxied for by the average delay for the hourly bin in which time t1 of the i-th event falls. Residual delay is the difference between Delay and Predicted delay. Control variables include filing types and daily fixed effects. In Panels A, the sample includes “modest” news defined as AR(t1, t3) being greater than 0.5% in absolute magnitude. The sample in Panel B consists of “extreme” news where AR(t1, t3) is greater than 2% (or 1%) in absolute value. The first three columns of both panels set t3 to be d1,whereas the last three columns set t3 to be t2+10 min. T-statistics based on standard errors adjusted for heteroskedasticity are reported below the coefficients in parentheses. The bottom of the table reports the F-test statistics as well as the associated p-value for the equality of the coefficients on Predicted delay and Residual delay . *, **, and *** indicate statistical significance at the 10%, 5%, and 1% level.
Panel A: “Modest” news: | AR(t1, t3)| ≥ 0.5%
(1) (2) (3) (4) (5) (6)
Dependent variable % AR(t1,t2)/AR(t1, d1) % AR(t1,t2)/AR(t1, t2+10 min)
Predicted Delay 0.1011*** 0.0957*** 0.0910*** 0.1667*** 0.1544*** 0.1765***
(4.04) (3.96) (3.95) (2.99) (2.81) (3.22)
Residual Delay 0.0156*** 0.0157*** 0.0177*** 0.0767*** 0.0800*** 0.0622***
(2.68) (2.70) (3.02) (3.78) (3.87) (2.89)
Form 8K 2.1154 1.8672 3.4304 -0.4281
(News release) (1.18) (1.09) (0.52) (-0.07)
Form 4 0.2489 1.2592 -3.5775 -7.5553
(Insider trading) (0.20) (0.87) (-0.51) (-0.91)
Schedule 13D 2.6050 2.2199 8.7550 -0.3492
(Activist block formation) (0.25) (0.21) (0.31) (-0.01)
Constant -10.8808*** -10.7836*** 5.8296 2.3686 3.4810 38.9511**
(-3.45) (-3.42) (0.48) (0.28) (0.40) (2.27)
Daily fixed effects N N Y N N Y
R-squared 0.0277 0.0288 0.0869 0.0563 0.0586 0.2506
Observations 1,664 1,664 1,664 406 406 406
Test: Predicted Delay = Residual Delay
F-statistics 25.6326*** 21.1369*** 16.1192*** 2.7875* 1.6892 2.9691*
p-value 0.0000 0.0001 0.0001 0.0958 0.1944 0.0856
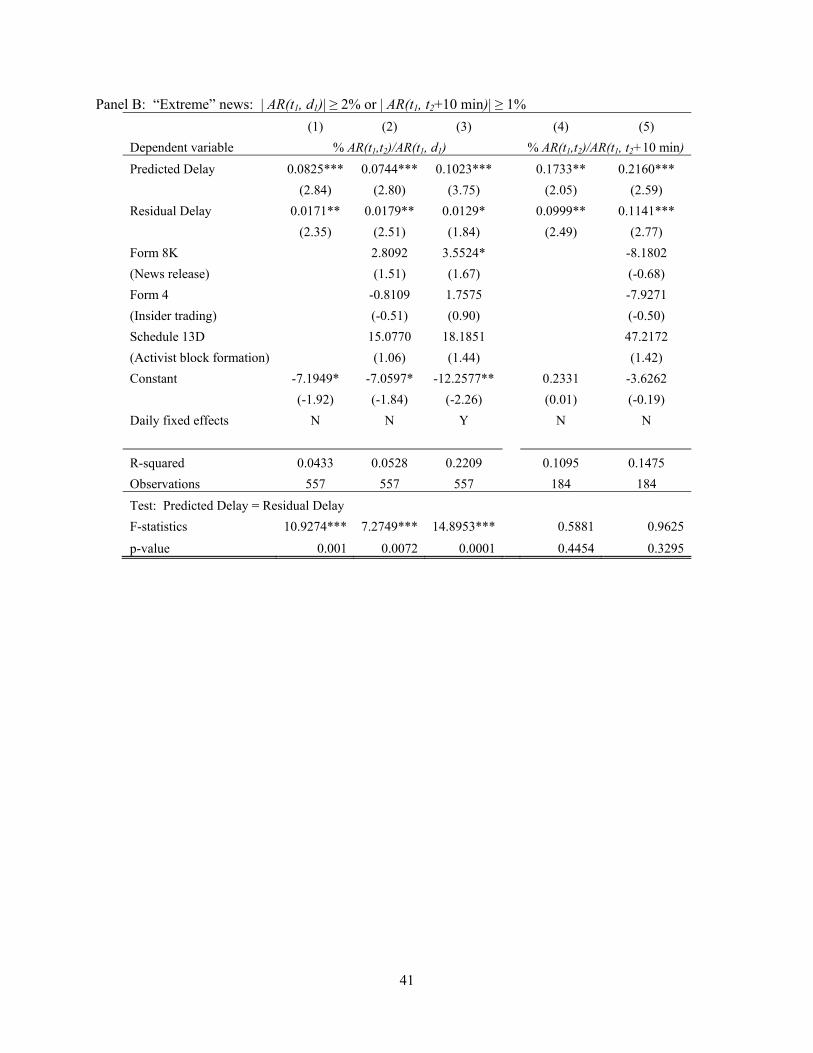
41
Panel B: “Extreme” news: | AR(t1, d1)| ≥ 2% or | AR(t1, t2+10 min)| ≥ 1%
(1) (2) (3) (4) (5)
Dependent variable % AR(t1,t2)/AR(t1, d1) % AR(t1,t2)/AR(t1, t2+10 min)
Predicted Delay 0.0825*** 0.0744*** 0.1023*** 0.1733** 0.2160***
(2.84) (2.80) (3.75) (2.05) (2.59)
Residual Delay 0.0171** 0.0179** 0.0129* 0.0999** 0.1141***
(2.35) (2.51) (1.84) (2.49) (2.77)
Form 8K 2.8092 3.5524* -8.1802
(News release) (1.51) (1.67) (-0.68)
Form 4 -0.8109 1.7575 -7.9271
(Insider trading) (-0.51) (0.90) (-0.50)
Schedule 13D 15.0770 18.1851 47.2172
(Activist block formation) (1.06) (1.44) (1.42)
Constant -7.1949* -7.0597* -12.2577** 0.2331 -3.6262
(-1.92) (-1.84) (-2.26) (0.01) (-0.19)
Daily fixed effects N N Y N N
R-squared 0.0433 0.0528 0.2209 0.1095 0.1475
Observations 557 557 557 184 184
Test: Predicted Delay = Residual Delay
F-statistics 10.9274*** 7.2749*** 14.8953*** 0.5881 0.9625
p-value 0.001 0.0072 0.0001 0.4454 0.3295
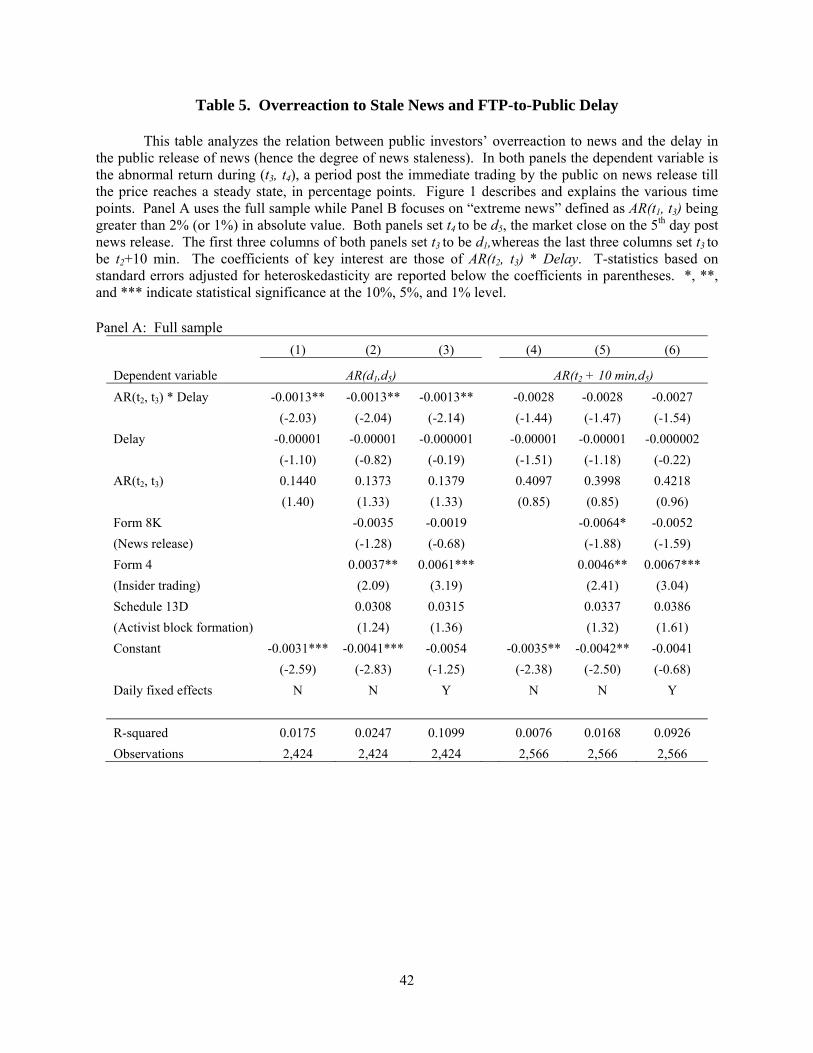
42
Table 5. Overreaction to Stale News and FTP-to-Public Delay
This table analyzes the relation between public investors’ overreaction to news and the delay in the public release of news (hence the degree of news staleness). In both panels the dependent variable is the abnormal return during (t3, t4), a period post the immediate trading by the public on news release till the price reaches a steady state, in percentage points. Figure 1 describes and explains the various time points. Panel A uses the full sample while Panel B focuses on “extreme news” defined as AR(t1, t3) being greater than 2% (or 1%) in absolute value. Both panels set t4 to be d5, the market close on the 5th day post news release. The first three columns of both panels set t3 to be d1,whereas the last three columns set t3 to be t2+10 min. The coefficients of key interest are those of AR(t2, t3) * Delay. T-statistics based on standard errors adjusted for heteroskedasticity are reported below the coefficients in parentheses. *, **, and *** indicate statistical significance at the 10%, 5%, and 1% level. Panel A: Full sample
(1) (2) (3) (4) (5) (6)
Dependent variable AR(d1,d5) AR(t2 + 10 min,d5)
AR(t2, t3) * Delay -0.0013** -0.0013** -0.0013** -0.0028 -0.0028 -0.0027
(-2.03) (-2.04) (-2.14) (-1.44) (-1.47) (-1.54)
Delay -0.00001 -0.00001 -0.000001 -0.00001 -0.00001 -0.000002
(-1.10) (-0.82) (-0.19) (-1.51) (-1.18) (-0.22)
AR(t2, t3) 0.1440 0.1373 0.1379 0.4097 0.3998 0.4218
(1.40) (1.33) (1.33) (0.85) (0.85) (0.96)
Form 8K -0.0035 -0.0019 -0.0064* -0.0052
(News release) (-1.28) (-0.68) (-1.88) (-1.59)
Form 4 0.0037** 0.0061*** 0.0046** 0.0067***
(Insider trading) (2.09) (3.19) (2.41) (3.04)
Schedule 13D 0.0308 0.0315 0.0337 0.0386
(Activist block formation) (1.24) (1.36) (1.32) (1.61)
Constant -0.0031*** -0.0041*** -0.0054 -0.0035** -0.0042** -0.0041
(-2.59) (-2.83) (-1.25) (-2.38) (-2.50) (-0.68)
Daily fixed effects N N Y N N Y
R-squared 0.0175 0.0247 0.1099 0.0076 0.0168 0.0926
Observations 2,424 2,424 2,424 2,566 2,566 2,566
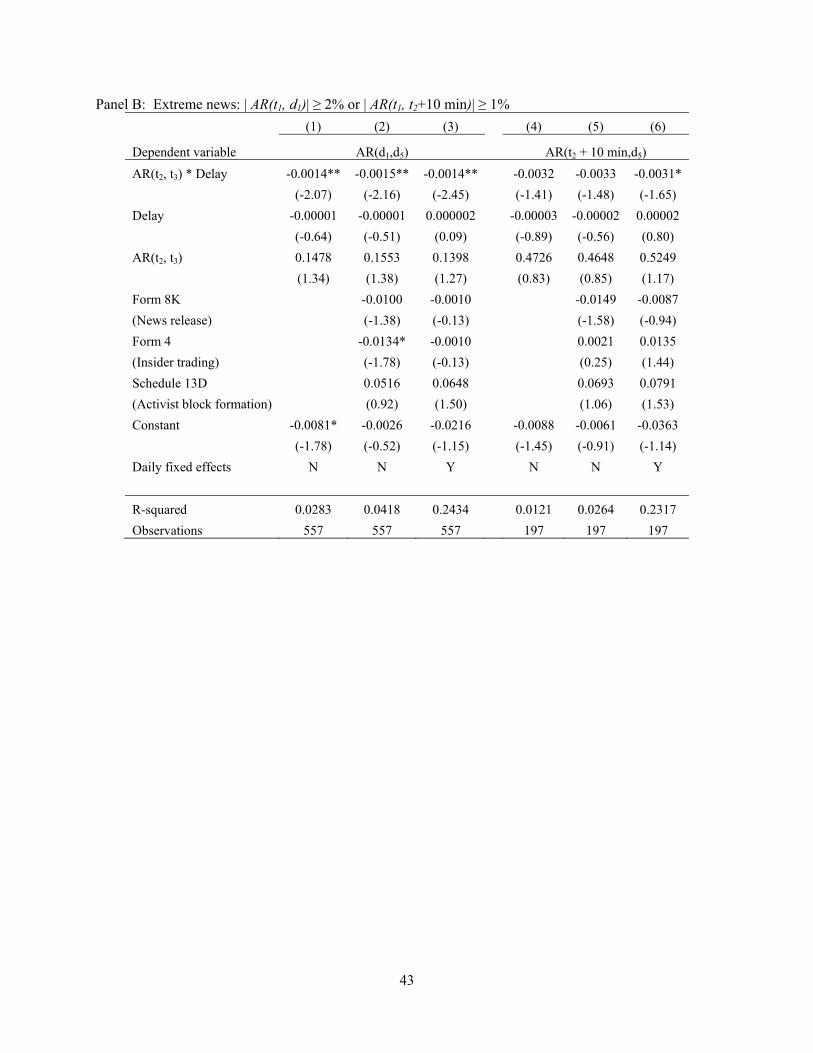
43
Panel B: Extreme news: | AR(t1, d1)| ≥ 2% or | AR(t1, t2+10 min)| ≥ 1%
(1) (2) (3) (4) (5) (6)
Dependent variable AR(d1,d5) AR(t2 + 10 min,d5)
AR(t2, t3) * Delay -0.0014** -0.0015** -0.0014** -0.0032 -0.0033 -0.0031*
(-2.07) (-2.16) (-2.45) (-1.41) (-1.48) (-1.65)
Delay -0.00001 -0.00001 0.000002 -0.00003 -0.00002 0.00002
(-0.64) (-0.51) (0.09) (-0.89) (-0.56) (0.80)
AR(t2, t3) 0.1478 0.1553 0.1398 0.4726 0.4648 0.5249
(1.34) (1.38) (1.27) (0.83) (0.85) (1.17)
Form 8K -0.0100 -0.0010 -0.0149 -0.0087
(News release) (-1.38) (-0.13) (-1.58) (-0.94)
Form 4 -0.0134* -0.0010 0.0021 0.0135
(Insider trading) (-1.78) (-0.13) (0.25) (1.44)
Schedule 13D 0.0516 0.0648 0.0693 0.0791
(Activist block formation) (0.92) (1.50) (1.06) (1.53)
Constant -0.0081* -0.0026 -0.0216 -0.0088 -0.0061 -0.0363
(-1.78) (-0.52) (-1.15) (-1.45) (-0.91) (-1.14)
Daily fixed effects N N Y N N Y
R-squared 0.0283 0.0418 0.2434 0.0121 0.0264 0.2317
Observations 557 557 557 197 197 197