2016-2017 annual energy report buildings & grounds
TRANSCRIPT
2016-2017ANNUAL ENERGY REPORT
Buildings & Grounds
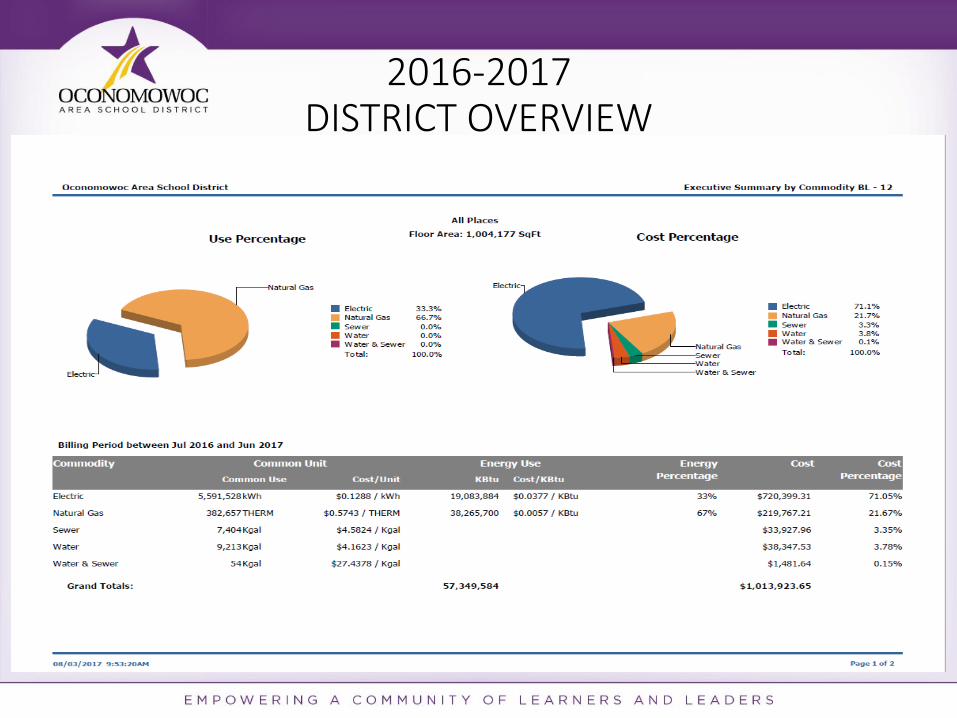
2016-2017DISTRICT OVERVIEW
Factors Affecting Energy Usage
• Weather
• Facility Use
• Building Envelope
• Age of Equipment
• Changes in Square Footage
• Changes in Building Occupancy
• Consumer Energy Habits
• Appliances and Electronics
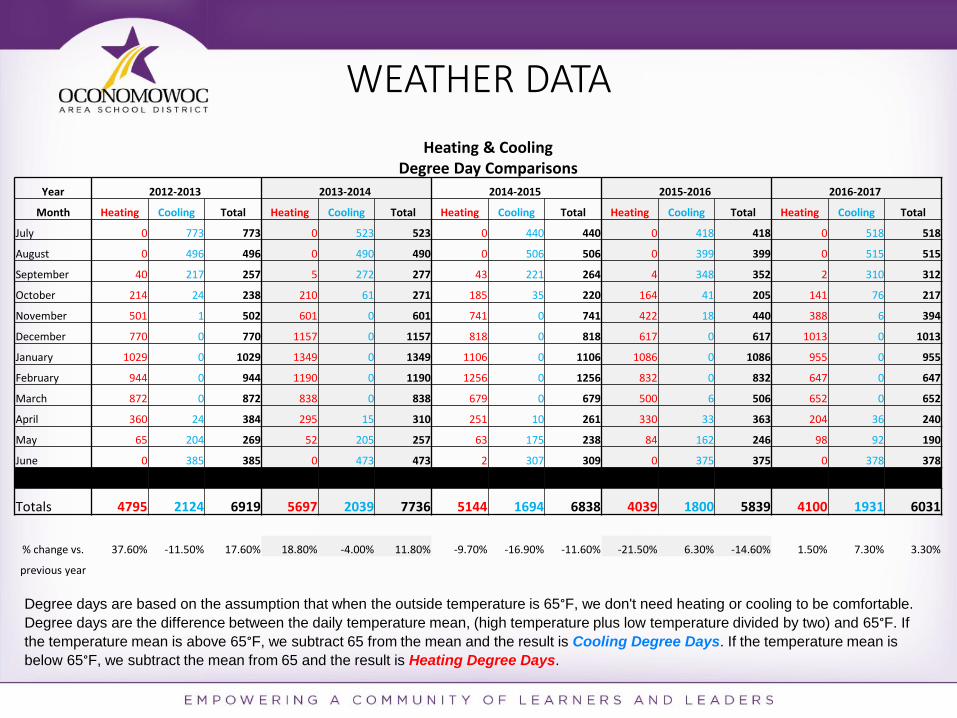
WEATHER DATA
Degree days are based on the assumption that when the outside temperature is 65°F, we don't need heating or cooling to be comfortable.
Degree days are the difference between the daily temperature mean, (high temperature plus low temperature divided by two) and 65°F. If
the temperature mean is above 65°F, we subtract 65 from the mean and the result is Cooling Degree Days. If the temperature mean is
below 65°F, we subtract the mean from 65 and the result is Heating Degree Days.
Heating & Cooling Degree Day Comparisons
Year 2012-2013 2013-2014 2014-2015 2015-2016 2016-2017
Month Heating Cooling Total Heating Cooling Total Heating Cooling Total Heating Cooling Total Heating Cooling Total
July 0 773 773 0 523 523 0 440 440 0 418 418 0 518 518
August 0 496 496 0 490 490 0 506 506 0 399 399 0 515 515
September 40 217 257 5 272 277 43 221 264 4 348 352 2 310 312
October 214 24 238 210 61 271 185 35 220 164 41 205 141 76 217
November 501 1 502 601 0 601 741 0 741 422 18 440 388 6 394
December 770 0 770 1157 0 1157 818 0 818 617 0 617 1013 0 1013
January 1029 0 1029 1349 0 1349 1106 0 1106 1086 0 1086 955 0 955
February 944 0 944 1190 0 1190 1256 0 1256 832 0 832 647 0 647
March 872 0 872 838 0 838 679 0 679 500 6 506 652 0 652
April 360 24 384 295 15 310 251 10 261 330 33 363 204 36 240
May 65 204 269 52 205 257 63 175 238 84 162 246 98 92 190
June 0 385 385 0 473 473 2 307 309 0 375 375 0 378 378
Totals 4795 2124 6919 5697 2039 7736 5144 1694 6838 4039 1800 5839 4100 1931 6031
% change vs. 37.60% -11.50% 17.60% 18.80% -4.00% 11.80% -9.70% -16.90% -11.60% -21.50% 6.30% -14.60% 1.50% 7.30% 3.30%
previous year
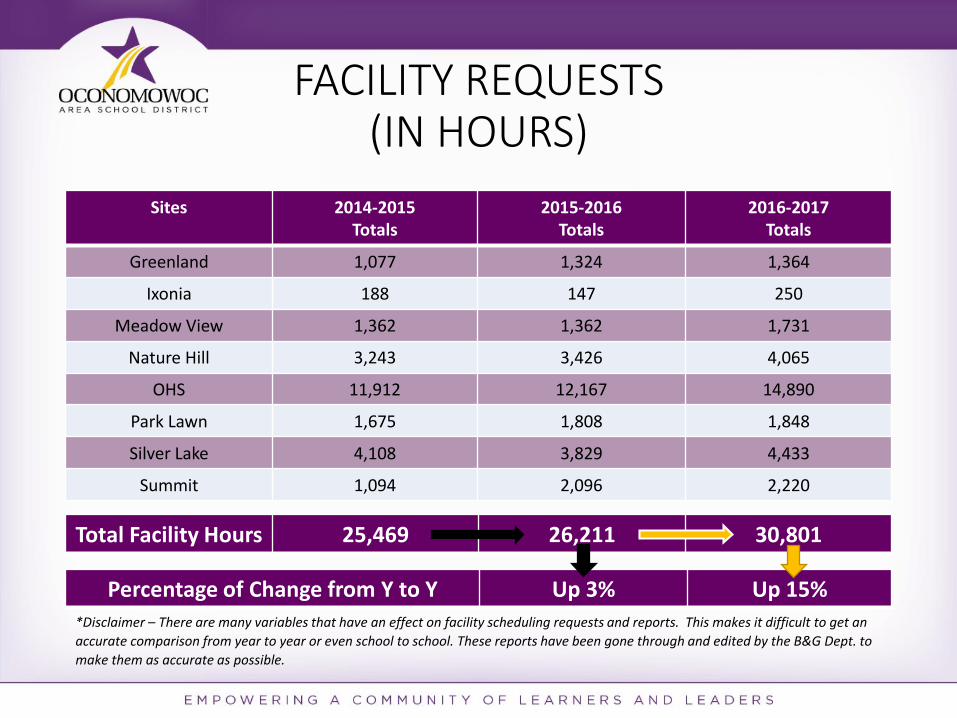
FACILITY REQUESTS(IN HOURS)
Sites 2014-2015Totals
2015-2016Totals
2016-2017Totals
Greenland 1,077 1,324 1,364
Ixonia 188 147 250
Meadow View 1,362 1,362 1,731
Nature Hill 3,243 3,426 4,065
OHS 11,912 12,167 14,890
Park Lawn 1,675 1,808 1,848
Silver Lake 4,108 3,829 4,433
Summit 1,094 2,096 2,220
Total Facility Hours 25,469 26,211 30,801
Percentage of Change from Y to Y Up 3% Up 15%
*Disclaimer – There are many variables that have an effect on facility scheduling requests and reports. This makes it difficult to get an
accurate comparison from year to year or even school to school. These reports have been gone through and edited by the B&G Dept. to
make them as accurate as possible.
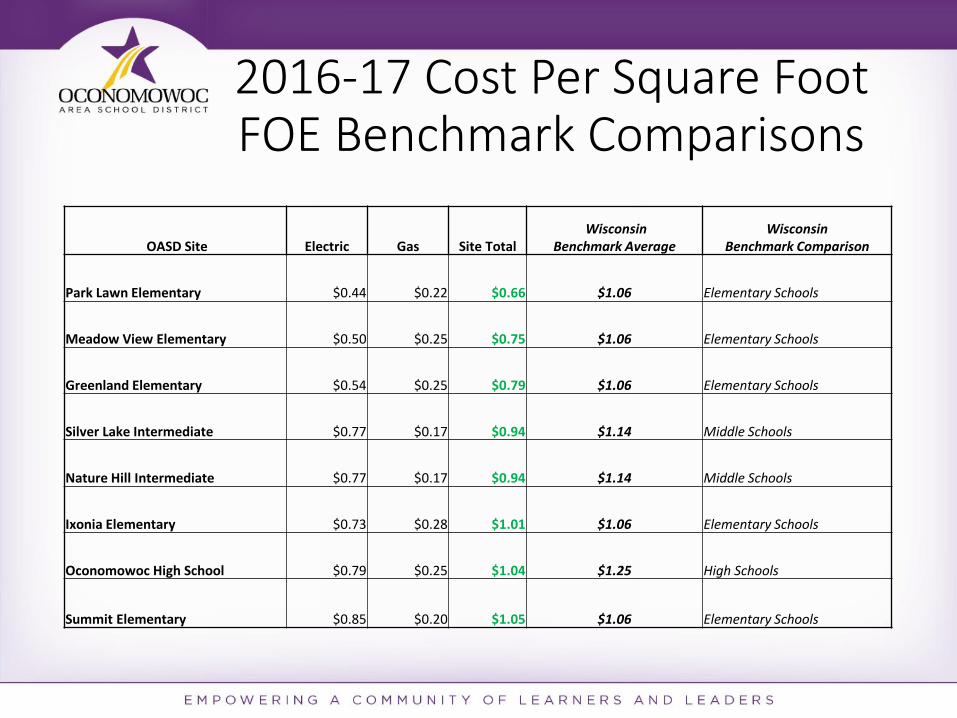
2016-17 Cost Per Square FootFOE Benchmark Comparisons
OASD Site Electric Gas Site TotalWisconsin
Benchmark AverageWisconsin
Benchmark Comparison
Park Lawn Elementary $0.44 $0.22 $0.66 $1.06 Elementary Schools
Meadow View Elementary $0.50 $0.25 $0.75 $1.06 Elementary Schools
Greenland Elementary $0.54 $0.25 $0.79 $1.06 Elementary Schools
Silver Lake Intermediate $0.77 $0.17 $0.94 $1.14 Middle Schools
Nature Hill Intermediate $0.77 $0.17 $0.94 $1.14 Middle Schools
Ixonia Elementary $0.73 $0.28 $1.01 $1.06 Elementary Schools
Oconomowoc High School $0.79 $0.25 $1.04 $1.25 High Schools
Summit Elementary $0.85 $0.20 $1.05 $1.06 Elementary Schools

2016-2017GREENLAND ELEMENTARY
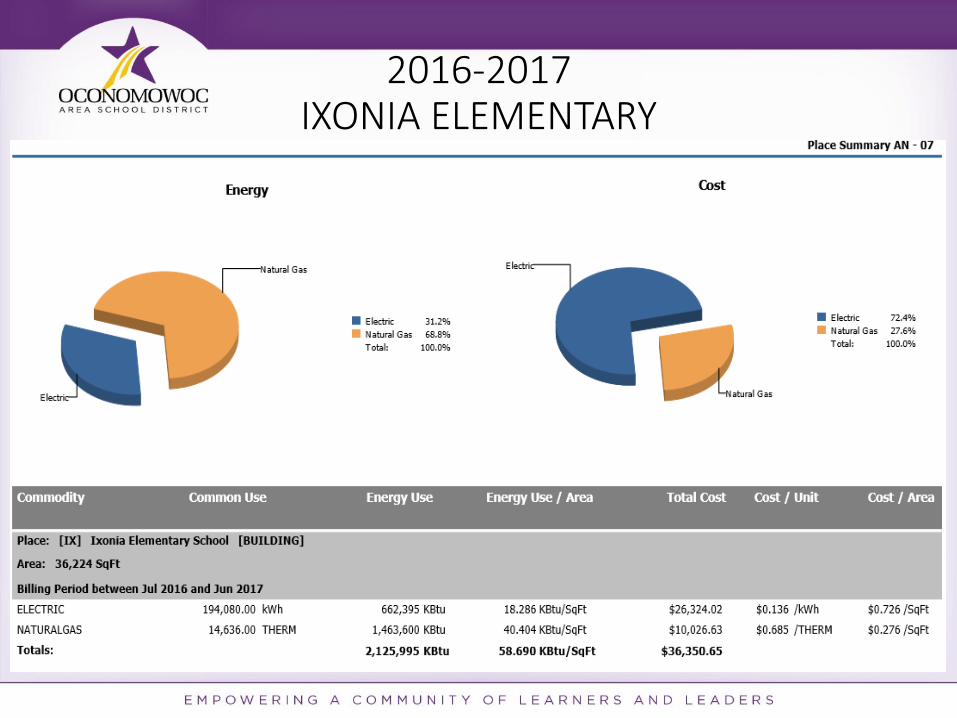
2016-2017IXONIA ELEMENTARY
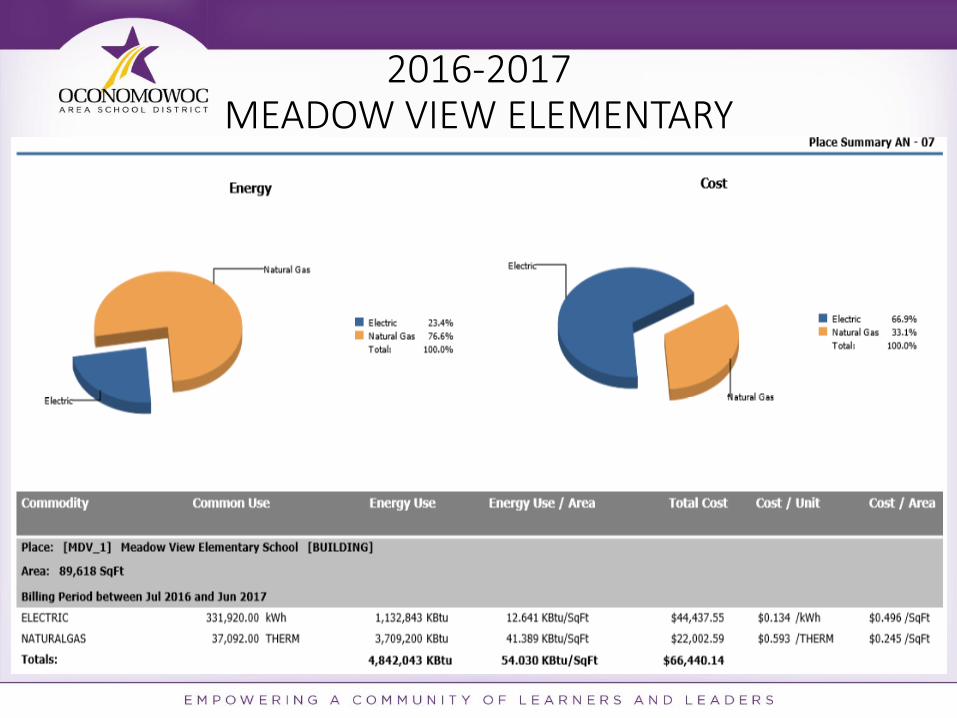
2016-2017MEADOW VIEW ELEMENTARY

2016-2017PARK LAWN ELEMENTARY
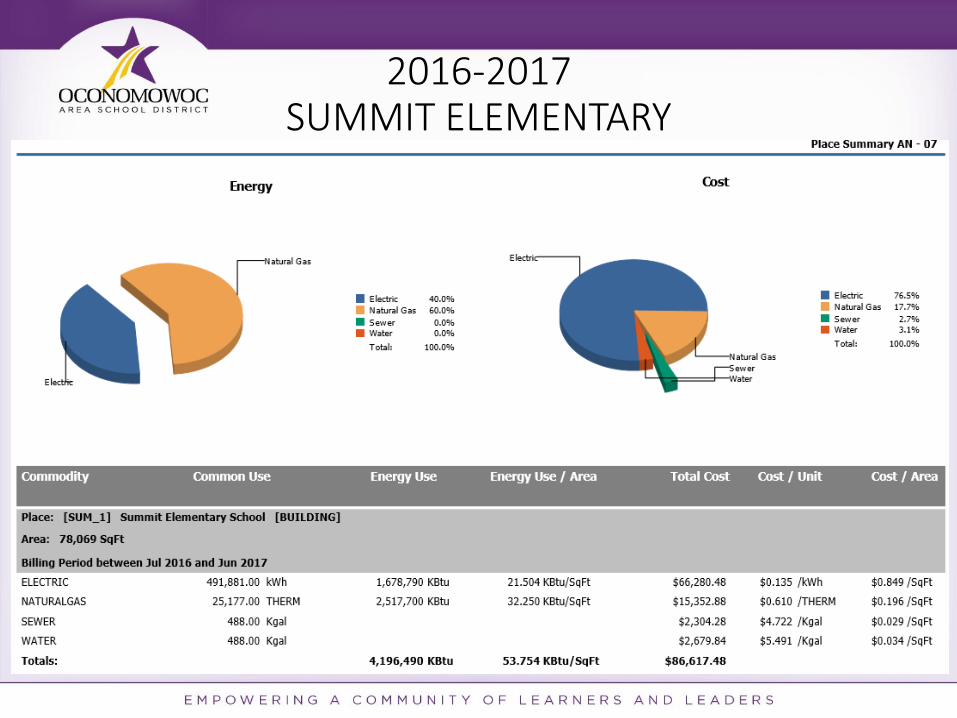
2016-2017SUMMIT ELEMENTARY
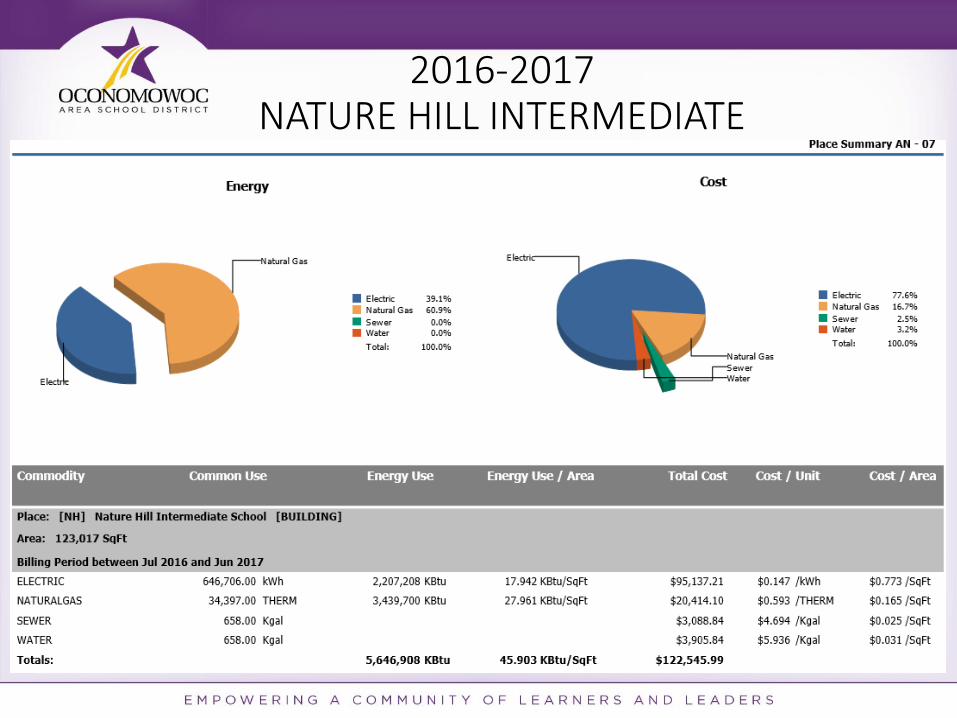
2016-2017NATURE HILL INTERMEDIATE
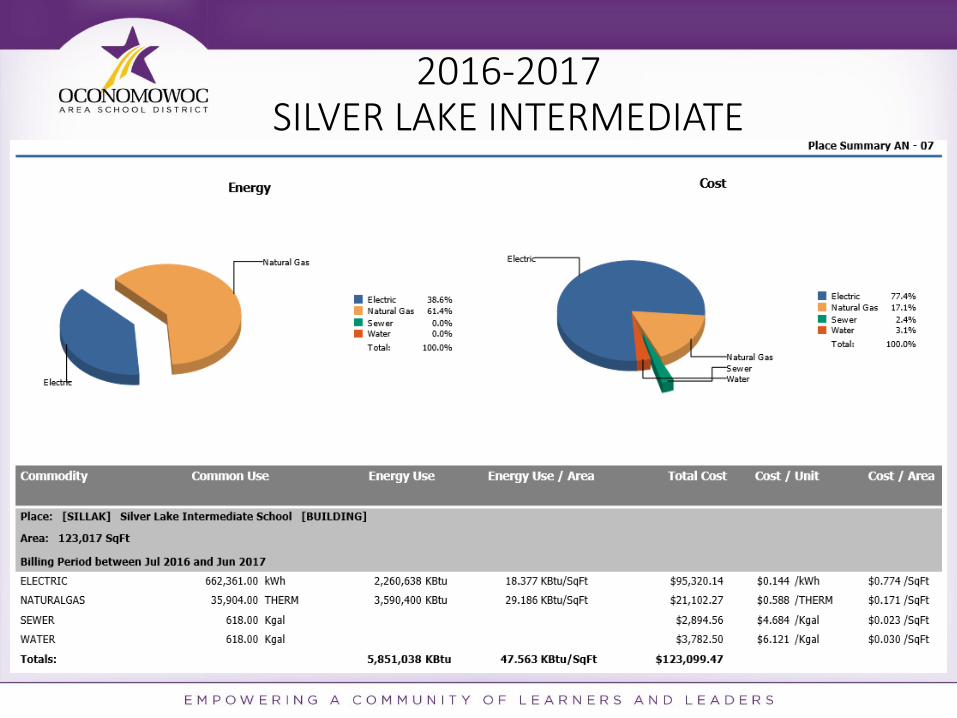
2016-2017SILVER LAKE INTERMEDIATE
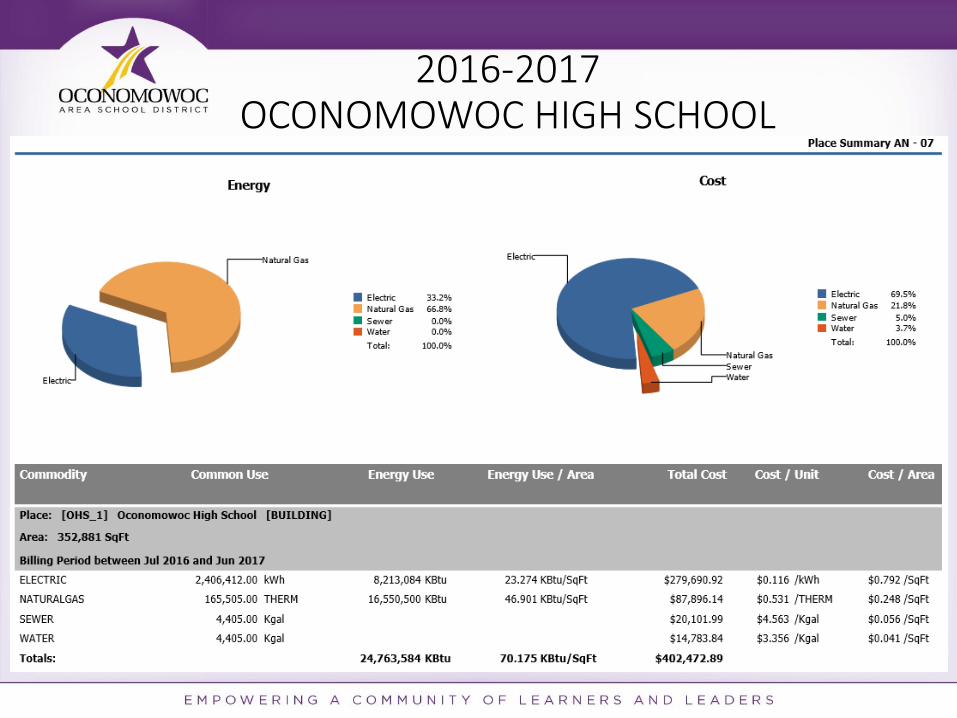
2016-2017OCONOMOWOC HIGH SCHOOL

2016-2017PHYSICAL DEVELOPMENT CENTER
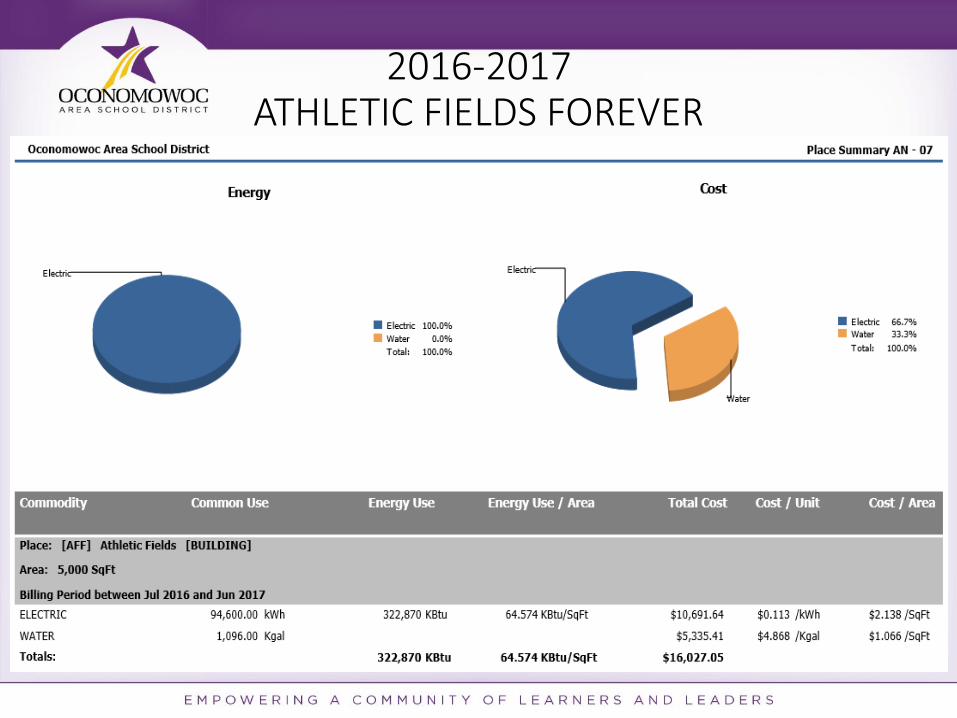
2016-2017ATHLETIC FIELDS FOREVER

FIVE YEAR COMPARISON ELECTRIC USE
2011-2012 2012-2013 2013-2014 2014-2015 2015-2016
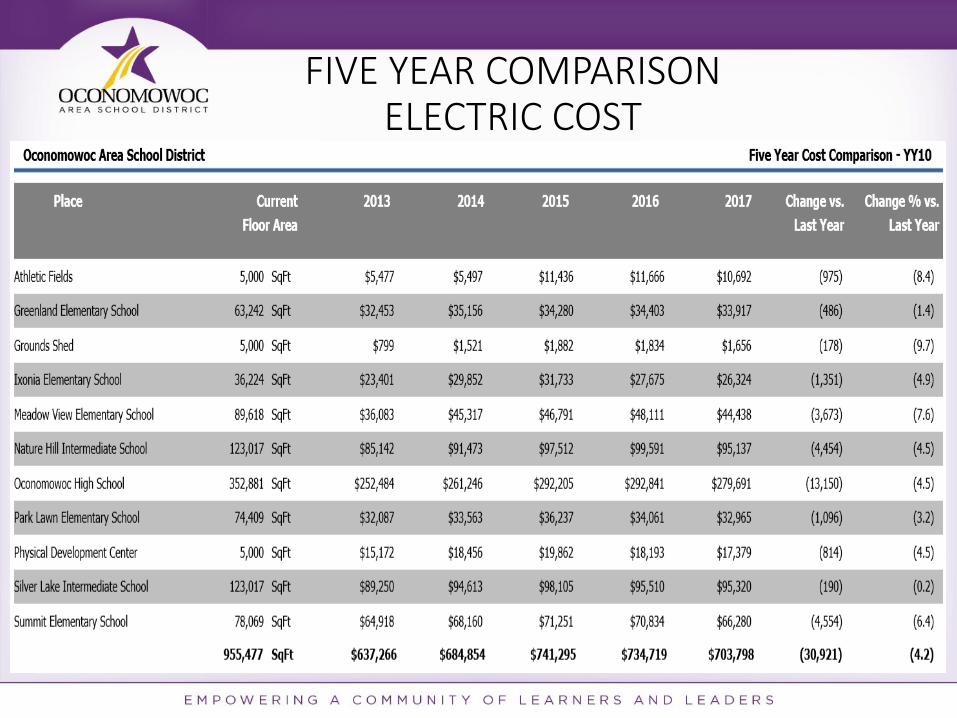
FIVE YEAR COMPARISON ELECTRIC COST
2011-2012 2012-2013 2013-2014 2014-2015 2015-2016
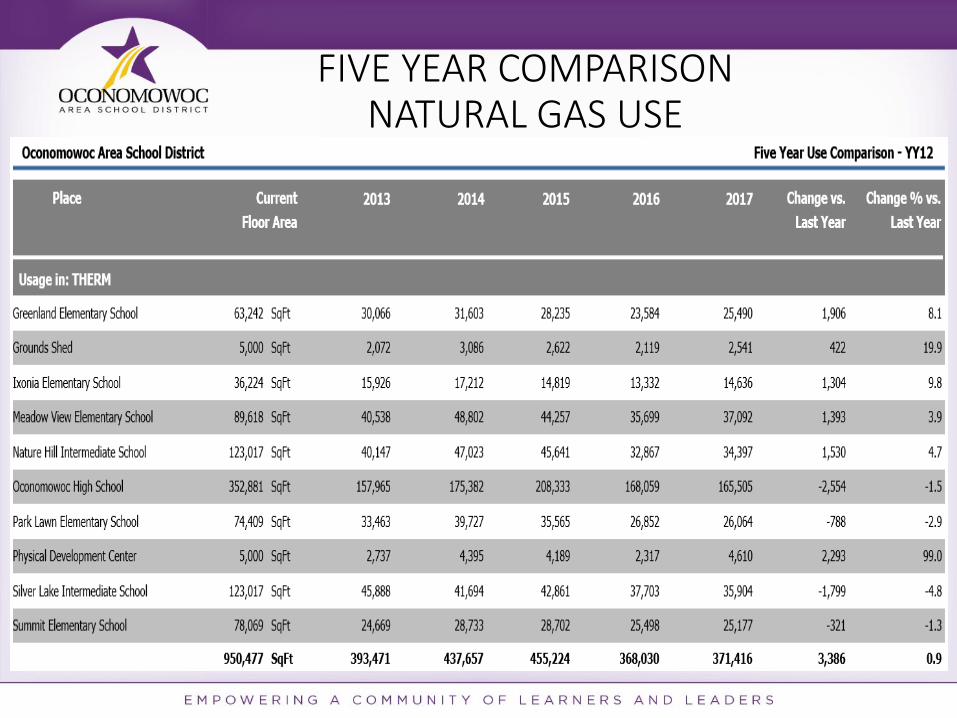
FIVE YEAR COMPARISON NATURAL GAS USE
2011-2012 2012-2013 2013-2014 2014-2015 2015-2016
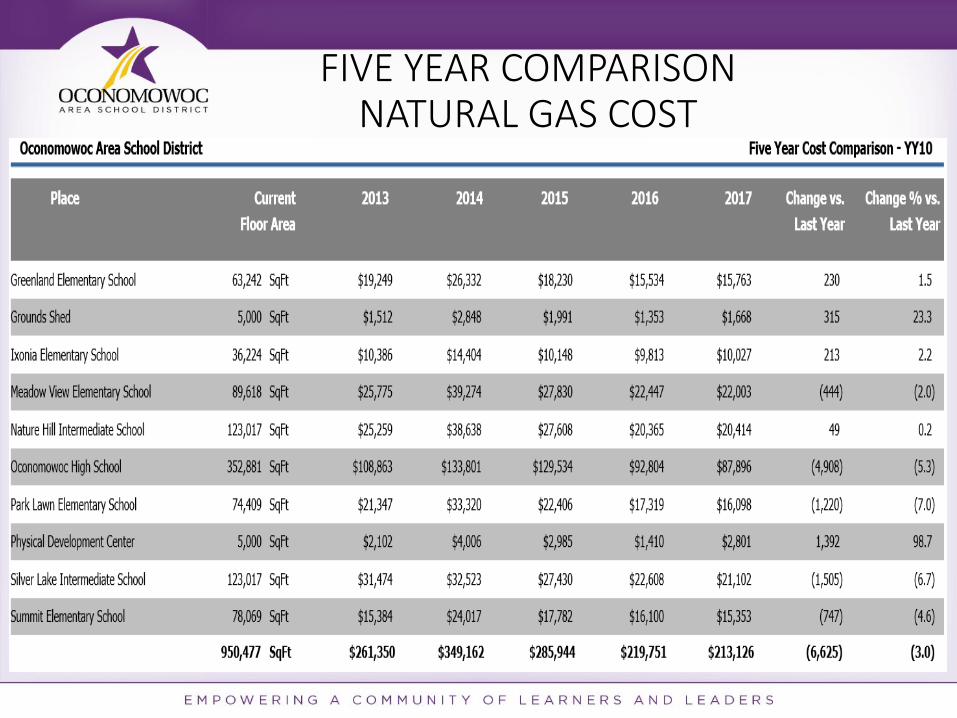
FIVE YEAR COMPARISON NATURAL GAS COST
2011-2012 2012-2013 2013-2014 2014-2015 2015-2016

FIVE YEAR COMPARISONWATER USE
2011-2012 2012-2013 2013-2014 2014-2015 2015-2016

FIVE YEAR COMPARISONWATER COST
2011-2012 2012-2013 2013-2014 2014-2015 2015-2016
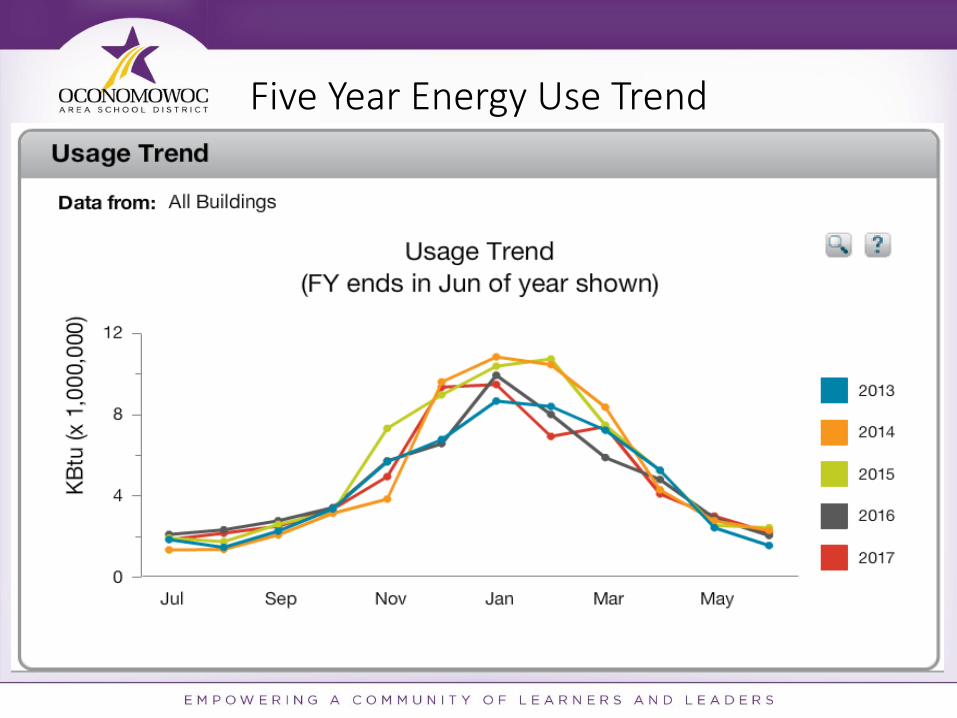
Five Year Energy Use Trend
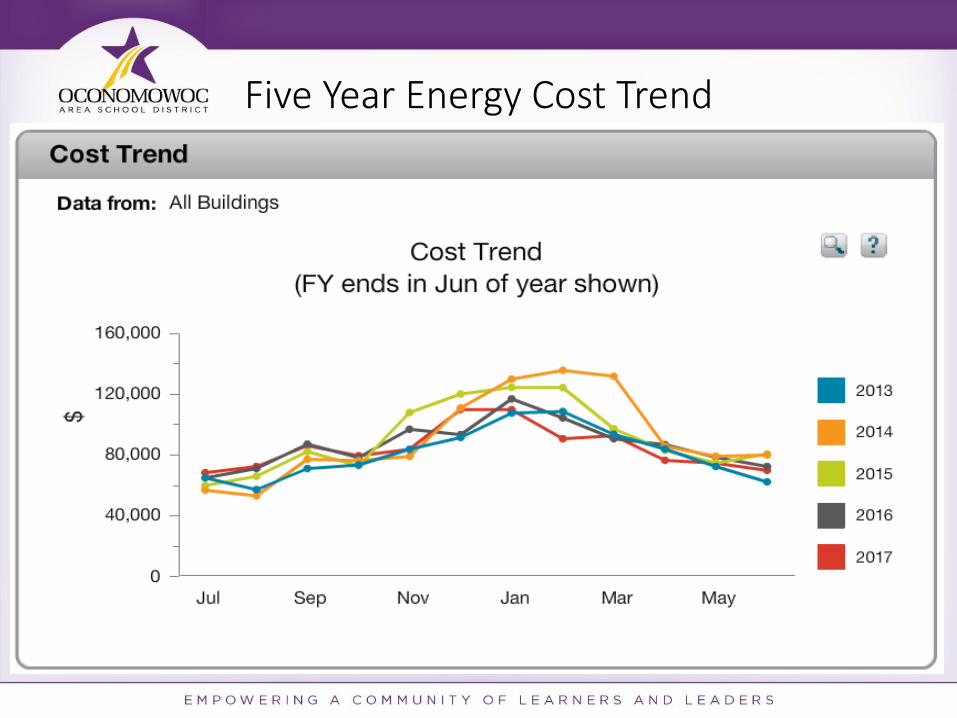
Five Year Energy Cost Trend

TEN YEAR SKYWARD UTILITIES COMPARISON (ACTUAL)
*TOTALS INCLUDE DISTRICT-WIDE NATURAL GAS, ELECTRICITY, WATER, SEWER AND GARBAGE DISPOSAL COSTS FOR THE FISCAL YEAR
2007-2008 2008-2009 2009-2010 2010-2011 2011-2012
$905,784.96 $1,083,117.26 $1,052,803.53 $1,060,263.37 $1,016,781.31
2012-2013 2013-2014 2014-2015 2015-2016 2016-2017
$1,032,832.24 $1,164,208.90 $1,129,217.87 $1,041,727.94 $1,069,990.55
TEAM WORKThe success of the program depends on everyone!
Special thanks go to:
• School Board for proactively implementing and supporting our program
• Community for supporting our energy program
• Buildings and Grounds Staff for executing changes in the heating and cooling systems and monitoring our energy use
• Teachers for continuing to assist in our efforts for energy conservation
• Principals and Staff for coordinating efforts in their schools

2016-2017 Energy Efficiency Projects
• Continuing upgrading perimeter lighting at all sites as needed
• Tune-ups and preventative maintenance on district boilers
• Tune-ups and preventative maintenance on district chillers
• Cleaning of air handling unit coils• Continuing to replace T10 bulbs and ballasts with T8
and LED retro-fit lamps• High School Field House lighting to LED• Nature Hill & Silver Lake Gyms to LED lighting• Continue replacing 24/7 security light fixtures to LED
THE FUTURE OF OUR ENERGY PROGRAM
• Increase visibility of our program
• Continue to identify efficiencies in operations
• Focus on shutdowns to achieve greater savings
• Continue developing an “energy conservation culture”
• Energy efficiencies in future facility planning

Questions?