2016 annual report - bluestar-adisseo.com · 2016 annual report 1 ... bluestar new chemical...
TRANSCRIPT
2016 Annual Report
1 / 169
Company Code: 600299 Company Abbreviation: Adisseo
Bluestar Adisseo Company 2016 Annual Report
Important Notice
I. The Company’s Board of Directors, Board of Supervisors, directors, supervisors, and senior management guarantee that, the content of the annual report is authentic, accurate and complete, and contains no false statement, misleading presentation or material omissions, and they assume individual and several & joint legal liabilities for the annual report.
II. All of the Company’s directors have attended the meeting of the Board of Directors.
III. KPMG Huazhen LLP issued an unqualified audit opinion.
IV. Jean-Marc Dublanc, the Company’s principal, Jean-Marc Dublanc, the person in charge of the accounting function, and Yun Cai, the person in charge of the accounting department (the personnel in charge of accounting) state that, they ensure the authenticity, accuracy and completeness of the financial statements in the annual report.
V. The Board of Directors has reviewed the profit distribution plan and the plan to use the statutory reserve to perform a capital increase in the reporting period.
As audited by KPMG Huazhen LLP, the net profit attributable to the shareholders of the Company for the year ended 31st December 2016 amounted to RMB 1,865,346,347 and the accumulated profits available for distribution at parent company level as at 31st December 2016 amounted to RMB 624,360,836. Therefore, in order to share the Company’s operation achievements with all shareholders, as well as enabling the Company for further development in consideration of the Company’s actual operation situations, the Company proposes that: based on the Company’s total share capital of 2,681,901,273 shares dated 31 December 2016, the Company will distribute to all shareholders, cash dividend of RMB 2.28 yuan per 10 shares (inclusive of tax). The total amount of the cash dividends to be distributed is RMB 611,473,490.24 yuan. The above proposal is still subject to the approval of 2016 Annual General Shareholders’ Meeting.
VI. Statement on the risks of forward-looking information
√Applicable Not applicable The forward-looking information such as future plans and development strategy, etc. described in the report do not constitute, in any manner whatsoever the Company’s substantial commitment to investors. Investors should pay special attention to assessing investment risks.
2016 Annual Report
2 / 169
VII. Has the capital held by the controlling shareholder and its related parties been used for purposes other than for transaction purposes?
No.
VIII. Has the guarantee been granted externally in violation of regulated decision-making procedures?
No.
IX. Risk factors
√ Applicable Not applicable During the reporting period, no material risks have been identified that will have a substantial impact on the operations of the Company. The Company has disclosed the relevant kinds of business and production risks as well as their corresponding solutions. For more information, please refer to Section 4, Discussion and Analysis of the Operation, part III.4 “Possible risks in the future”.
X. Other information
√Applicable Not applicable Business combination under common control and disposal of subsidiaries According to the Settlement Agreement dated July 27, 2015, the Company acquired 85% of the ordinary shares of Bluestar Adisseo Nutrition Group Limited (“BANG”) and simultaneously transferred all the rights and obligations of assets exchanged out to Bluestar Group. As such, the Company deconsolidated all the assets exchanged out at July 27, 2015. As of December 31, 2016, the procedures initiated in 2015 to finalize the disposal of equity interest in certain remaining entities have significantly progressed. Only the transfer of the Company’s equity interest in Cabot is still pending for the approval from Jiangxi Local Commerce Committee. At the year-end, Adisseo believed there shall not be any substantial legal barriers for such approval with the submission of application documents by the relevant company in accordance with the law.
Chinese version of this report This is an English translation of the Annual Report of Bluestar Adisseo Company. If there is any conflict between the Chinese version and its English translation, the Chinese version will prevail.
2016 Annual Report
3 / 169
CONTENTS Section 1 Interpretations and Major Risk Highlights ..................................................... 4 Section 2 Company Profile and Financial highlights ...................................................... 7 Section 3 Basic overview of the Company ...................................................................... 12 Section 4 Discussion and Analysis of the Operation ..................................................... 17 Section 5 Significant Matters ........................................................................................... 44 Section 6 Share Change and Shareholders .................................................................... 54 Section 7 Information on Preferred Shares ................................................................... 61 Section 8 Directors, Supervisors, Senior Management, and Employees ..................... 62 Section 9 Corporate Governance .................................................................................... 70 Section 10 Corporate bonds .............................................................................................. 74 Section 11 Financial Report ............................................................................................... 75
2016 Annual Report
4 / 169
Section 1 Interpretations and Major Risk Highlights
I. Interpretations
Unless otherwise specified, the following terms in the report shall have the meanings shown below:
Interpretations of the terms in common use a. General terms
Company, the Company Indicate Bluestar Adisseo Company BNCM Indicates Bluestar New Chemical Material Co., Ltd
Group, the Group, or Adisseo Indicates Bluestar Adisseo Company and its subsidiaries
ChemChina Indicates China National Chemical Corporation China Bluestar Indicates China Bluestar (Group) Co., Ltd. BANG Indicates Bluestar Adisseo Nutrition Group Ltd Evonik Indicates Evonik Industries AG
Board of Directors Indicates The Board of Directors of Bluestar Adisseo Company
Board of Supervisors Indicates The Board of Supervisors of Bluestar Adisseo Company
Shareholders’ General Meeting Indicates The Shareholders’ General Meeting of Bluestar Adisseo Company
Articles of association (“AOA”) Indicate The Articles of Association of Bluestar Adisseo Company
CSRC Indicates China Securities Regulatory Commission SSE Indicates Shanghai Stock Exchange
SASAC Indicates State Assets Supervision and Administration Commission of China
Yuan, ten thousand Yuan, one hundred million Yuan
Indicate RMB Yuan, RMB ten thousand Yuan, RMB one hundred million Yuan
Reporting period Indicates Jan 1, 2016 ~ Dec. 31, 2016
The transaction, the restructuring, the Major Asset Restructuring
Indicate
The Company acquired 85% of the ordinary shares of BANG as well as disposed of all previous businesses of the Company through major asset exchange, cash and share issuance in consideration of the asset acquisition, private placement in connection with the asset acquisition and affiliated transaction.
Asset Exchanged in Indicates
85% common stock equity (deducting the cash dividends RMB 425 million corresponding to 85% common stock equity of Adisseo after benchmark date of appraisal) owned by Bluestar Group in Bluestar Adisseo Nutrition Group Co., Ltd.
Asset Exchanged Out Indicates
Bluestar New chemical Material Co., Ltd.’s total assets and liabilities after deduction of sold assets and other payables RMB 1,671,000,400 as of June 30, 2014.
Company Law Indicates Company Law of the People’s Republic of China
Securities Law Indicates Securities Law of the People’s Republic of China
Listing Rules Indicates Listing Rules of the Shanghai Stock Exchange
2016 Annual Report
5 / 169
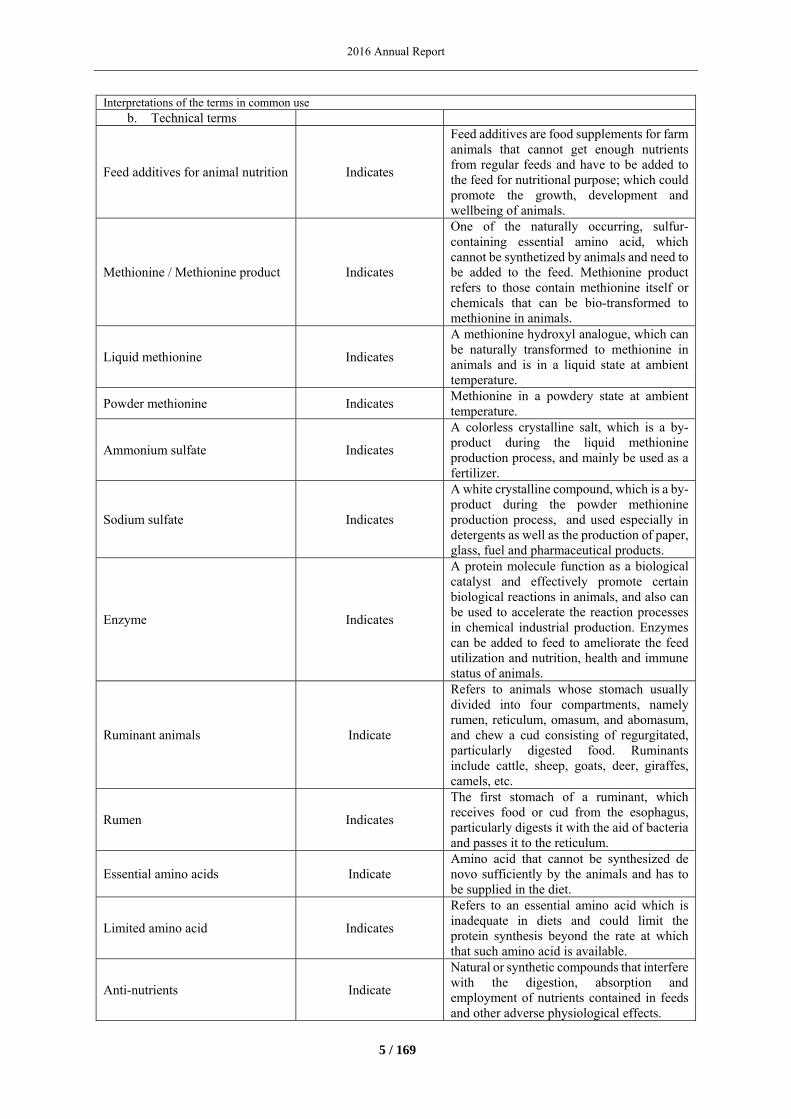
Interpretations of the terms in common use b. Technical terms
Feed additives for animal nutrition Indicates
Feed additives are food supplements for farm animals that cannot get enough nutrients from regular feeds and have to be added to the feed for nutritional purpose; which could promote the growth, development and wellbeing of animals.
Methionine / Methionine product Indicates
One of the naturally occurring, sulfur-containing essential amino acid, which cannot be synthetized by animals and need to be added to the feed. Methionine product refers to those contain methionine itself or chemicals that can be bio-transformed to methionine in animals.
Liquid methionine Indicates
A methionine hydroxyl analogue, which can be naturally transformed to methionine in animals and is in a liquid state at ambient temperature.
Powder methionine Indicates Methionine in a powdery state at ambient temperature.
Ammonium sulfate Indicates
A colorless crystalline salt, which is a by-product during the liquid methionine production process, and mainly be used as a fertilizer.
Sodium sulfate Indicates
A white crystalline compound, which is a by-product during the powder methionine production process, and used especially in detergents as well as the production of paper, glass, fuel and pharmaceutical products.
Enzyme Indicates
A protein molecule function as a biological catalyst and effectively promote certain biological reactions in animals, and also can be used to accelerate the reaction processes in chemical industrial production. Enzymes can be added to feed to ameliorate the feed utilization and nutrition, health and immune status of animals.
Ruminant animals Indicate
Refers to animals whose stomach usually divided into four compartments, namely rumen, reticulum, omasum, and abomasum, and chew a cud consisting of regurgitated, particularly digested food. Ruminants include cattle, sheep, goats, deer, giraffes, camels, etc.
Rumen Indicates
The first stomach of a ruminant, which receives food or cud from the esophagus, particularly digests it with the aid of bacteria and passes it to the reticulum.
Essential amino acids Indicate Amino acid that cannot be synthesized de novo sufficiently by the animals and has to be supplied in the diet.
Limited amino acid Indicates
Refers to an essential amino acid which is inadequate in diets and could limit the protein synthesis beyond the rate at which that such amino acid is available.
Anti-nutrients Indicate
Natural or synthetic compounds that interfere with the digestion, absorption and employment of nutrients contained in feeds and other adverse physiological effects.
2016 Annual Report
6 / 169
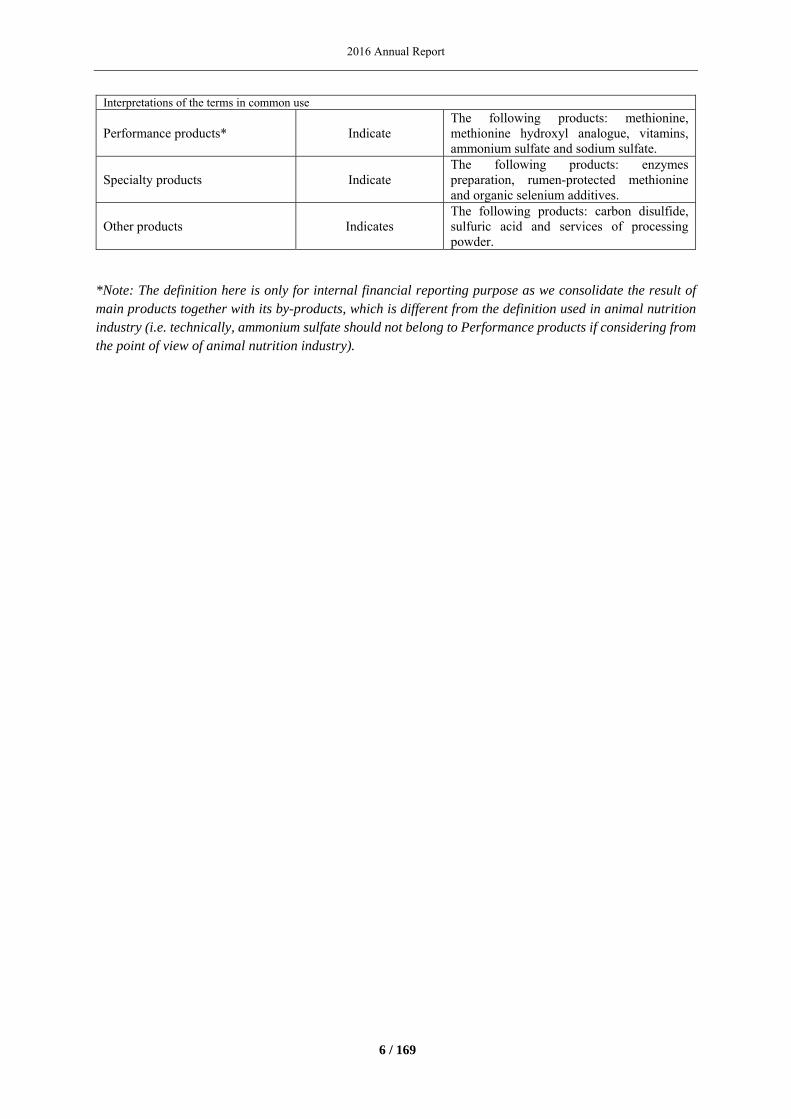
Interpretations of the terms in common use
Performance products* Indicate The following products: methionine, methionine hydroxyl analogue, vitamins, ammonium sulfate and sodium sulfate.
Specialty products Indicate The following products: enzymes preparation, rumen-protected methionine and organic selenium additives.
Other products Indicates The following products: carbon disulfide, sulfuric acid and services of processing powder.
*Note: The definition here is only for internal financial reporting purpose as we consolidate the result of main products together with its by-products, which is different from the definition used in animal nutrition industry (i.e. technically, ammonium sulfate should not belong to Performance products if considering from the point of view of animal nutrition industry).
2016 Annual Report
7 / 169
Section 2 Company Profile and Financial highlights
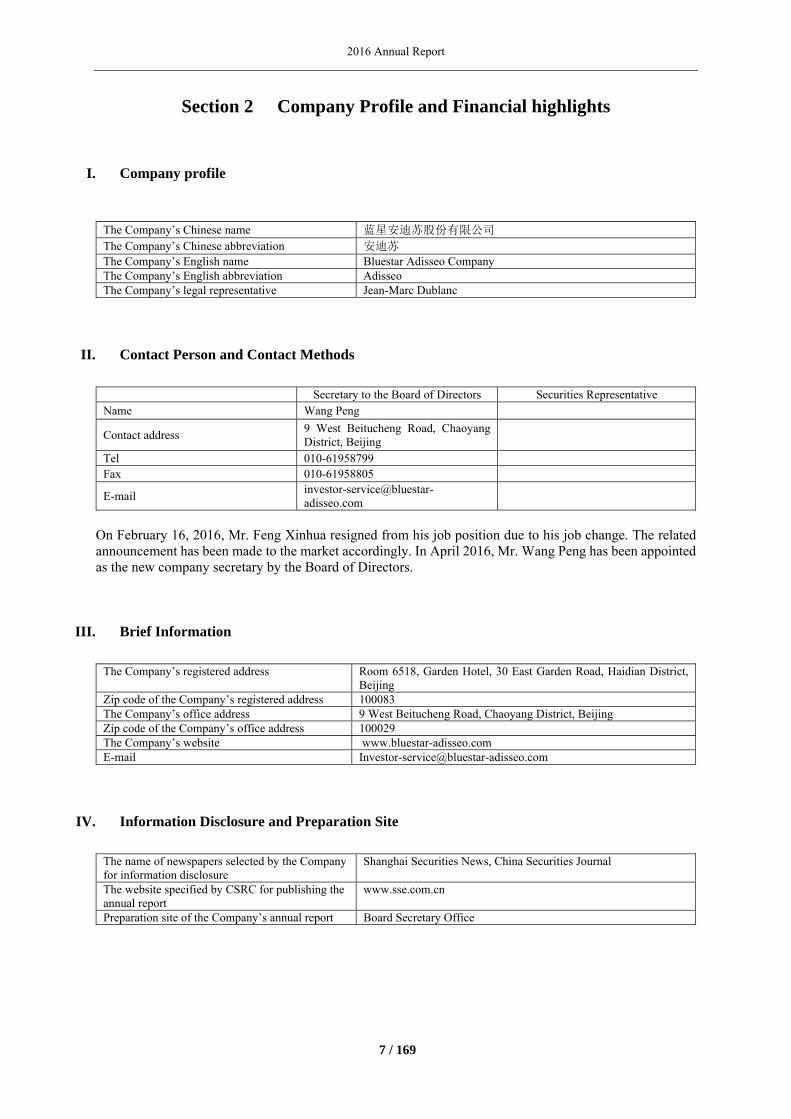
I. Company profile
The Company’s Chinese name 蓝星安迪苏股份有限公司 The Company’s Chinese abbreviation 安迪苏 The Company’s English name Bluestar Adisseo CompanyThe Company’s English abbreviation AdisseoThe Company’s legal representative Jean-Marc Dublanc
II. Contact Person and Contact Methods
Secretary to the Board of Directors Securities Representative Name Wang Peng
Contact address 9 West Beitucheng Road, Chaoyang District, Beijing
Tel 010-61958799 Fax 010-61958805
E-mail [email protected]
On February 16, 2016, Mr. Feng Xinhua resigned from his job position due to his job change. The related announcement has been made to the market accordingly. In April 2016, Mr. Wang Peng has been appointed as the new company secretary by the Board of Directors.
III. Brief Information
The Company’s registered address Room 6518, Garden Hotel, 30 East Garden Road, Haidian District,
Beijing Zip code of the Company’s registered address 100083The Company’s office address 9 West Beitucheng Road, Chaoyang District, Beijing Zip code of the Company’s office address 100029The Company’s website www.bluestar-adisseo.com E-mail [email protected]
IV. Information Disclosure and Preparation Site
The name of newspapers selected by the Company for information disclosure
Shanghai Securities News, China Securities Journal
The website specified by CSRC for publishing the annual report
www.sse.com.cn
Preparation site of the Company’s annual report Board Secretary Office
2016 Annual Report
8 / 169
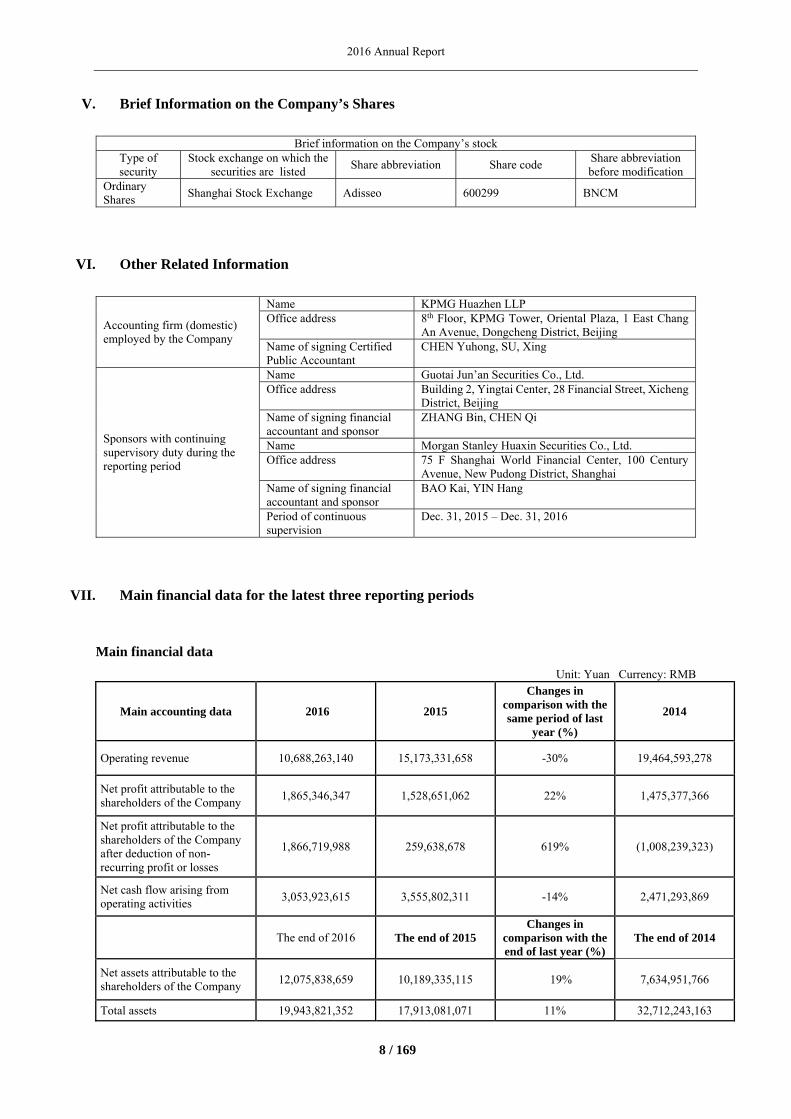
V. Brief Information on the Company’s Shares
Brief information on the Company’s stock
Type of security
Stock exchange on which the securities are listed
Share abbreviation Share code Share abbreviation before modification
Ordinary Shares
Shanghai Stock Exchange Adisseo 600299 BNCM
VI. Other Related Information
Accounting firm (domestic) employed by the Company
Name KPMG Huazhen LLP Office address 8th Floor, KPMG Tower, Oriental Plaza, 1 East Chang
An Avenue, Dongcheng District, Beijing Name of signing Certified Public Accountant
CHEN Yuhong, SU, Xing
Sponsors with continuing supervisory duty during the reporting period
Name Guotai Jun’an Securities Co., Ltd. Office address Building 2, Yingtai Center, 28 Financial Street, Xicheng
District, BeijingName of signing financial accountant and sponsor
ZHANG Bin, CHEN Qi
Name Morgan Stanley Huaxin Securities Co., Ltd. Office address 75 F Shanghai World Financial Center, 100 Century
Avenue, New Pudong District, Shanghai Name of signing financial accountant and sponsor
BAO Kai, YIN Hang
Period of continuous supervision
Dec. 31, 2015 – Dec. 31, 2016
VII. Main financial data for the latest three reporting periods
Main financial data
Unit: Yuan Currency: RMB
Main accounting data 2016 2015
Changes in comparison with the same period of last
year (%)
2014
Operating revenue 10,688,263,140 15,173,331,658 -30% 19,464,593,278
Net profit attributable to the shareholders of the Company
1,865,346,347 1,528,651,062 22% 1,475,377,366
Net profit attributable to the shareholders of the Company after deduction of non-recurring profit or losses
1,866,719,988 259,638,678 619% (1,008,239,323)
Net cash flow arising from operating activities
3,053,923,615 3,555,802,311 -14% 2,471,293,869
The end of 2016 The end of 2015 Changes in
comparison with the end of last year (%)
The end of 2014
Net assets attributable to the shareholders of the Company
12,075,838,659 10,189,335,115 19% 7,634,951,766
Total assets 19,943,821,352 17,913,081,071 11% 32,712,243,163
2016 Annual Report
9 / 169
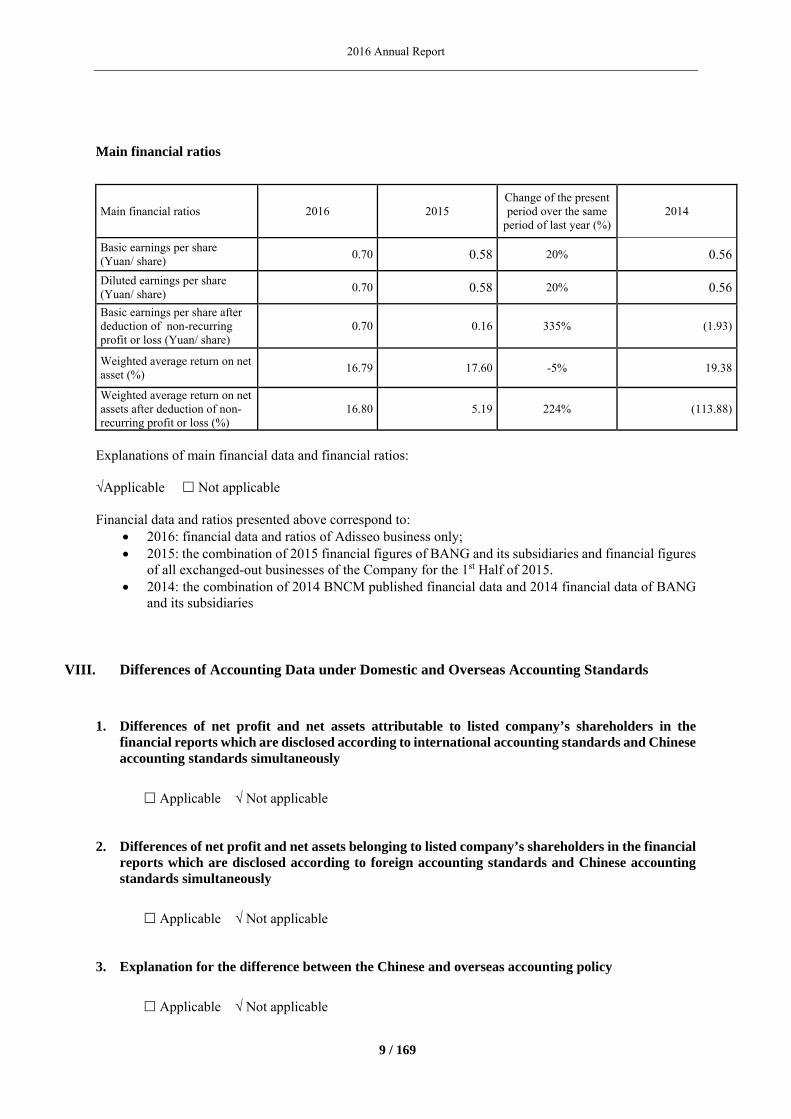
Main financial ratios
Main financial ratios 2016 2015 Change of the present period over the same
period of last year (%) 2014
Basic earnings per share (Yuan/ share)
0.70 0.58 20% 0.56
Diluted earnings per share (Yuan/ share)
0.70 0.58 20% 0.56
Basic earnings per share after deduction of non-recurring profit or loss (Yuan/ share)
0.70 0.16 335% (1.93)
Weighted average return on net asset (%)
16.79 17.60 -5% 19.38
Weighted average return on net assets after deduction of non-recurring profit or loss (%)
16.80 5.19 224% (113.88)
Explanations of main financial data and financial ratios: √Applicable Not applicable Financial data and ratios presented above correspond to:
2016: financial data and ratios of Adisseo business only; 2015: the combination of 2015 financial figures of BANG and its subsidiaries and financial figures
of all exchanged-out businesses of the Company for the 1st Half of 2015. 2014: the combination of 2014 BNCM published financial data and 2014 financial data of BANG
and its subsidiaries
VIII. Differences of Accounting Data under Domestic and Overseas Accounting Standards
1. Differences of net profit and net assets attributable to listed company’s shareholders in the financial reports which are disclosed according to international accounting standards and Chinese accounting standards simultaneously
Applicable √ Not applicable
2. Differences of net profit and net assets belonging to listed company’s shareholders in the financial reports which are disclosed according to foreign accounting standards and Chinese accounting standards simultaneously
Applicable √ Not applicable
3. Explanation for the difference between the Chinese and overseas accounting policy
Applicable √ Not applicable
2016 Annual Report
10 / 169
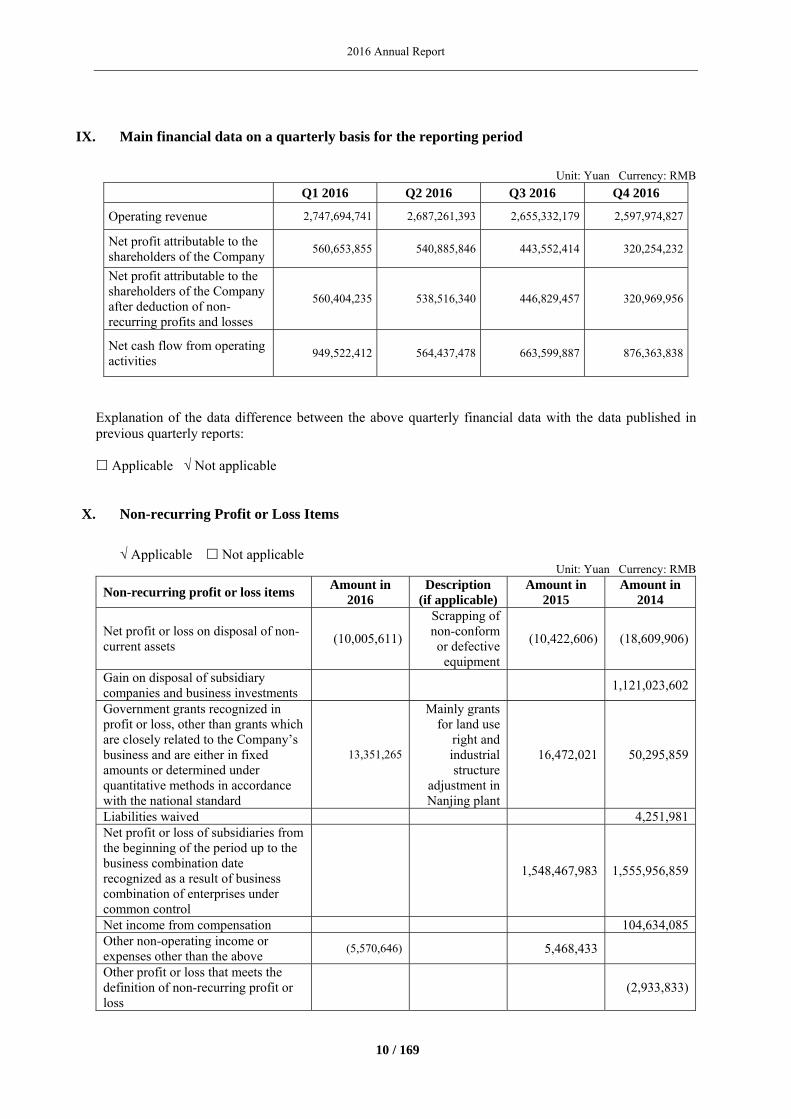
IX. Main financial data on a quarterly basis for the reporting period
Unit: Yuan Currency: RMB
Q1 2016 Q2 2016 Q3 2016 Q4 2016
Operating revenue 2,747,694,741 2,687,261,393 2,655,332,179 2,597,974,827
Net profit attributable to the shareholders of the Company
560,653,855 540,885,846 443,552,414 320,254,232
Net profit attributable to the shareholders of the Company after deduction of non-recurring profits and losses
560,404,235 538,516,340 446,829,457 320,969,956
Net cash flow from operating activities
949,522,412 564,437,478 663,599,887 876,363,838
Explanation of the data difference between the above quarterly financial data with the data published in previous quarterly reports: Applicable √ Not applicable
X. Non-recurring Profit or Loss Items
√ Applicable Not applicable
Unit: Yuan Currency: RMB
Non-recurring profit or loss items Amount in
2016 Description
(if applicable)Amount in
2015 Amount in
2014
Net profit or loss on disposal of non-current assets
(10,005,611)
Scrapping of non-conform or defective
equipment
(10,422,606) (18,609,906)
Gain on disposal of subsidiary companies and business investments
1,121,023,602
Government grants recognized in profit or loss, other than grants which are closely related to the Company’s business and are either in fixed amounts or determined under quantitative methods in accordance with the national standard
13,351,265
Mainly grants for land use
right and industrial structure
adjustment in Nanjing plant
16,472,021 50,295,859
Liabilities waived 4,251,981Net profit or loss of subsidiaries from the beginning of the period up to the business combination date recognized as a result of business combination of enterprises under common control
1,548,467,983 1,555,956,859
Net income from compensation 104,634,085Other non-operating income or expenses other than the above
(5,570,646) 5,468,433
Other profit or loss that meets the definition of non-recurring profit or loss
(2,933,833)
2016 Annual Report
11 / 169
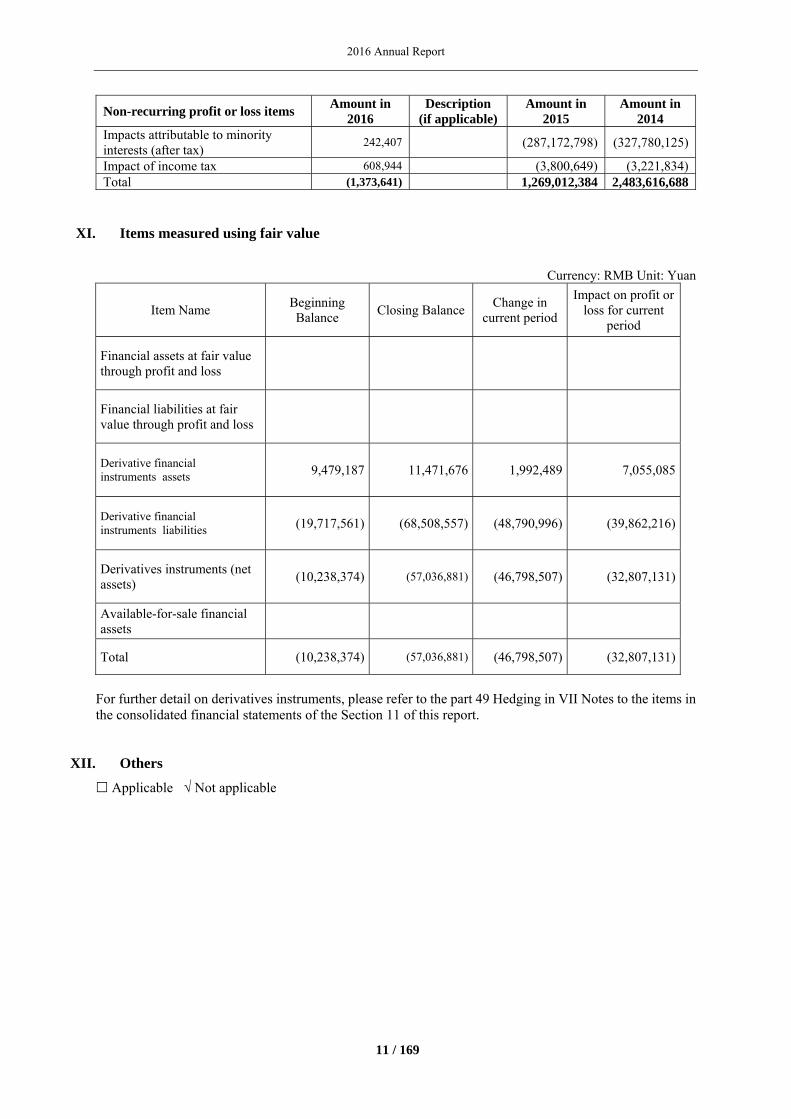
Non-recurring profit or loss items Amount in
2016 Description
(if applicable)Amount in
2015 Amount in
2014 Impacts attributable to minority interests (after tax)
242,407 (287,172,798) (327,780,125)
Impact of income tax 608,944 (3,800,649) (3,221,834)Total (1,373,641) 1,269,012,384 2,483,616,688
XI. Items measured using fair value
Currency: RMB Unit: Yuan
Item Name Beginning Balance
Closing BalanceChange in
current period
Impact on profit or loss for current
period
Financial assets at fair value through profit and loss
Financial liabilities at fair value through profit and loss
Derivative financial instruments assets 9,479,187 11,471,676 1,992,489 7,055,085
Derivative financial instruments liabilities (19,717,561) (68,508,557) (48,790,996) (39,862,216)
Derivatives instruments (net assets)
(10,238,374) (57,036,881) (46,798,507) (32,807,131)
Available-for-sale financial assets
Total (10,238,374) (57,036,881) (46,798,507) (32,807,131)
For further detail on derivatives instruments, please refer to the part 49 Hedging in VII Notes to the items in the consolidated financial statements of the Section 11 of this report.
XII. Others
Applicable √ Not applicable
2016 Annual Report
12 / 169
Section 3 Basic overview of the Company
I. Main businesses, Operating Methods and Industry explanation of the company during the reporting period
The primary businesses of the Group are as follows: research, development, production and sale of feed additives for animal nutrition. Adisseo is a global leader in nutrition and health feed solutions including research and development, production and sales with over 75 years’ experience. Its principal products include methionine, vitamins, enzymes and other animal feed additives. By relying on its rich product mix, expansive sales, distribution platforms and strong technical support team, the Company provides innovative feed additives solutions to around 2,600 customers located in 140 countries globally. Adisseo supplies three types of products: Performance products (including methionine, vitamins, ammonium sulfate and sodium sulfate), Specialty products (including enzymes, rumen-protected methionine and organic selenium and probiotics additives) and Other products (including carbon disulfide, sulfuric acid and services of processing powder). Adisseo has become a global leader in its main product lines:
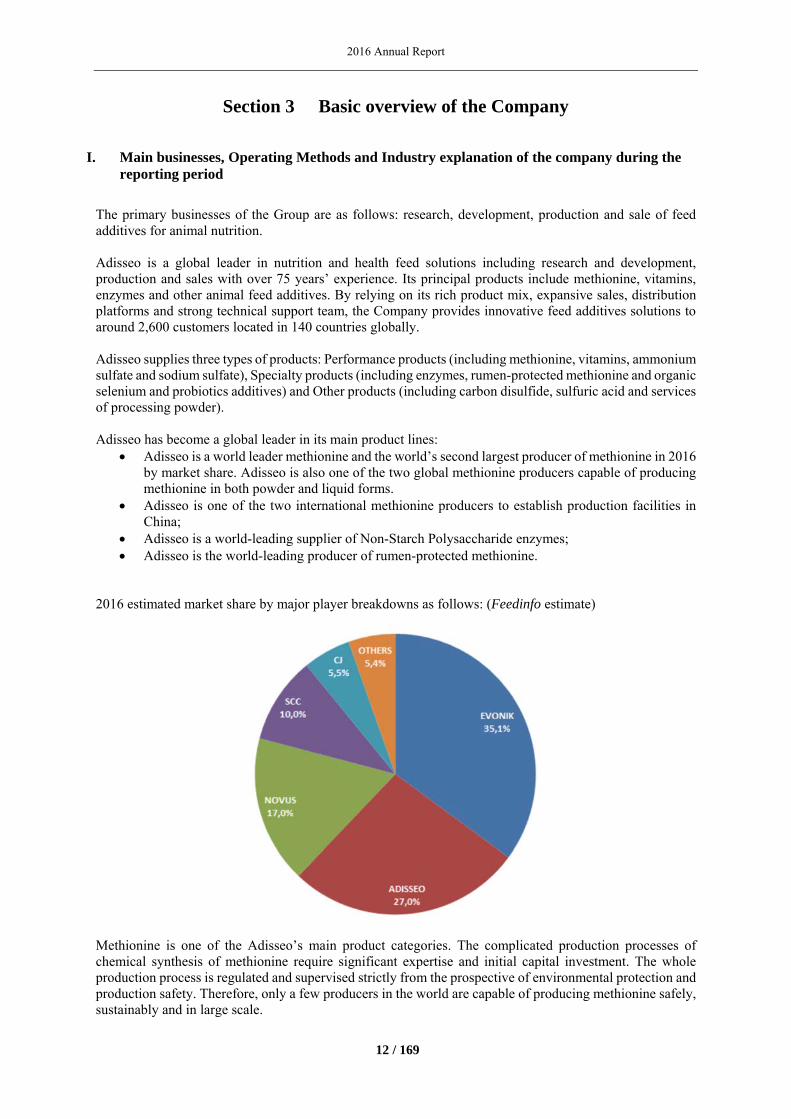
Adisseo is a world leader methionine and the world’s second largest producer of methionine in 2016 by market share. Adisseo is also one of the two global methionine producers capable of producing methionine in both powder and liquid forms.
Adisseo is one of the two international methionine producers to establish production facilities in China;
Adisseo is a world-leading supplier of Non-Starch Polysaccharide enzymes; Adisseo is the world-leading producer of rumen-protected methionine.
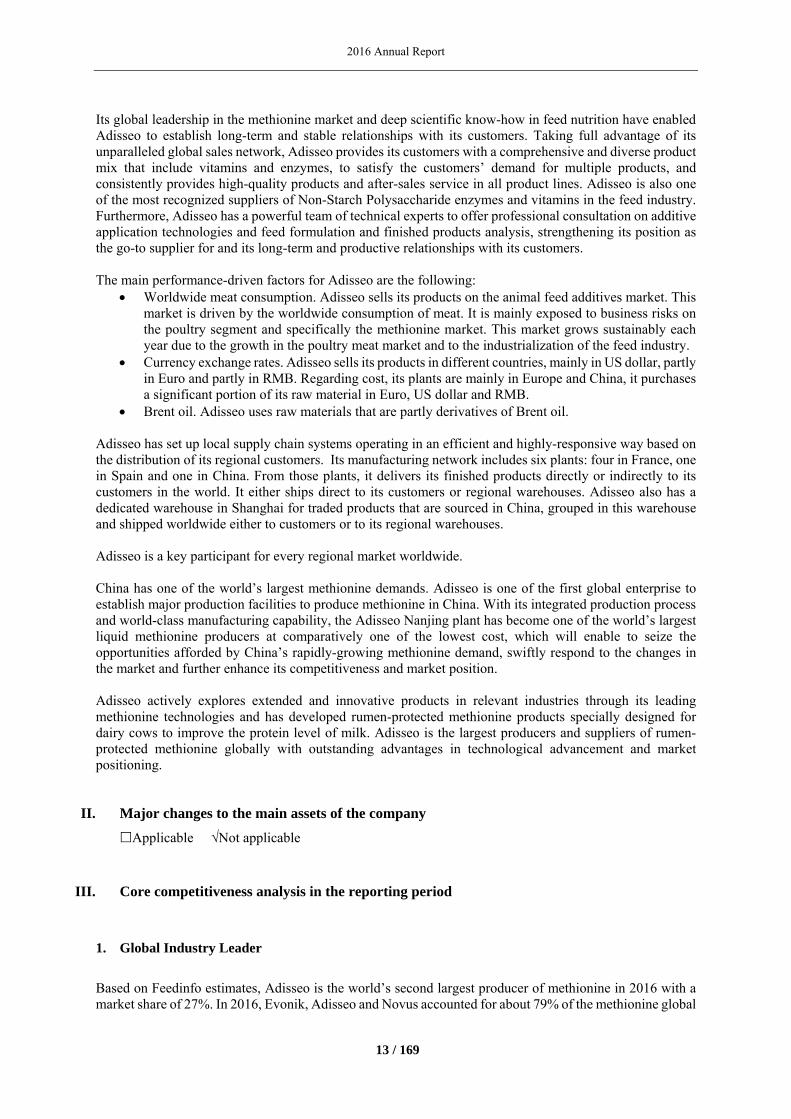
2016 estimated market share by major player breakdowns as follows: (Feedinfo estimate)
Methionine is one of the Adisseo’s main product categories. The complicated production processes of chemical synthesis of methionine require significant expertise and initial capital investment. The whole production process is regulated and supervised strictly from the prospective of environmental protection and production safety. Therefore, only a few producers in the world are capable of producing methionine safely, sustainably and in large scale.
2016 Annual Report
13 / 169
Its global leadership in the methionine market and deep scientific know-how in feed nutrition have enabled Adisseo to establish long-term and stable relationships with its customers. Taking full advantage of its unparalleled global sales network, Adisseo provides its customers with a comprehensive and diverse product mix that include vitamins and enzymes, to satisfy the customers’ demand for multiple products, and consistently provides high-quality products and after-sales service in all product lines. Adisseo is also one of the most recognized suppliers of Non-Starch Polysaccharide enzymes and vitamins in the feed industry. Furthermore, Adisseo has a powerful team of technical experts to offer professional consultation on additive application technologies and feed formulation and finished products analysis, strengthening its position as the go-to supplier for and its long-term and productive relationships with its customers. The main performance-driven factors for Adisseo are the following:
Worldwide meat consumption. Adisseo sells its products on the animal feed additives market. This market is driven by the worldwide consumption of meat. It is mainly exposed to business risks on the poultry segment and specifically the methionine market. This market grows sustainably each year due to the growth in the poultry meat market and to the industrialization of the feed industry.
Currency exchange rates. Adisseo sells its products in different countries, mainly in US dollar, partly in Euro and partly in RMB. Regarding cost, its plants are mainly in Europe and China, it purchases a significant portion of its raw material in Euro, US dollar and RMB.
Brent oil. Adisseo uses raw materials that are partly derivatives of Brent oil.
Adisseo has set up local supply chain systems operating in an efficient and highly-responsive way based on the distribution of its regional customers. Its manufacturing network includes six plants: four in France, one in Spain and one in China. From those plants, it delivers its finished products directly or indirectly to its customers in the world. It either ships direct to its customers or regional warehouses. Adisseo also has a dedicated warehouse in Shanghai for traded products that are sourced in China, grouped in this warehouse and shipped worldwide either to customers or to its regional warehouses. Adisseo is a key participant for every regional market worldwide. China has one of the world’s largest methionine demands. Adisseo is one of the first global enterprise to establish major production facilities to produce methionine in China. With its integrated production process and world-class manufacturing capability, the Adisseo Nanjing plant has become one of the world’s largest liquid methionine producers at comparatively one of the lowest cost, which will enable to seize the opportunities afforded by China’s rapidly-growing methionine demand, swiftly respond to the changes in the market and further enhance its competitiveness and market position. Adisseo actively explores extended and innovative products in relevant industries through its leading methionine technologies and has developed rumen-protected methionine products specially designed for dairy cows to improve the protein level of milk. Adisseo is the largest producers and suppliers of rumen-protected methionine globally with outstanding advantages in technological advancement and market positioning.
II. Major changes to the main assets of the company
Applicable √Not applicable
III. Core competitiveness analysis in the reporting period
1. Global Industry Leader
Based on Feedinfo estimates, Adisseo is the world’s second largest producer of methionine in 2016 with a market share of 27%. In 2016, Evonik, Adisseo and Novus accounted for about 79% of the methionine global
2016 Annual Report
14 / 169
market share and the other producers accounted for the remaining 21%. Adisseo is a key participant for every regional market worldwide. In North America, Novus has the highest market share; Evonik and Adisseo are also participants in that market. In China and Asia-Pacific, the key market participants are Evonik, Adisseo and Sumitomo, while Novus’ market share is relatively low. In other regions, Evonik, Adisseo and Novus are all major players. Adisseo is also a key player in vitamin with full range of products, including A, B, D3, E and H. Adisseo holds 21% of Vitamin A market shares. Adisseo is operating a Vitamin A plant. It faced with increase in prices in 2016 which can be explained as follows:
Producers’ shutting-down of production caused a sharp shortage of the core material lemon aldehyde;
The main competitor DSM shut down the production, and NHU, ZMC both discontinued their production because of the G20 summit.
The company's operating income of Vitamin A is generating higher margin thanks to price increase and cost optimization in 2016. In addition, Adisseo developed a leading position in the feed enzymes market. Enzymes improve
digestibility and efficiency of feed, which in turn reduces feed costs, waste, and water consumption. Animal
feed enzymes fall into two categories:
non-starch polysaccharide enzymes are digestive enzymes used in poultry feed cereal diets;
phytase enzymes are used to break down phytate in corn and soybean diets to release bound
phosphorus.
There is a significant growth potential for enzymes in regions such as North and South America as well as
in China.
Based on the world's leading methionine technology, Adisseo has actively developed ruminant protected methionine, a specialty products and confirmed its unique market positioning by:
Increasing production capacities; Reinforcing its industrial partnership for specialties development, with a strong global network and
a solid brand image.
Adisseo has 7 labs in both France and China which represent true engines of its development. In order to ensure sustainable growth, Specialty products will become a second pillar and thus Adisseo allocates financial resources on R&D for new products. Adisseo is commercializing other Specialty products, such as an organic selenium product Selisseo® and a probiotics product Alterion®, with a great probability of success. Adisseo is one of the major player in feed business thanks to its well-known range of product:
‐ Rhodimet® is one of the most recognized methionine brand all over the world (GKA survey, 2014, Ignit). Adisseo is considered as the best at the "global picture and global supply" for methionine in liquid form by key customers.
‐ Microvit® is recognized as a reliable and qualitative range of vitamins by our customers as Adisseo select and guarantee through the Microvit Certification System.
‐ Rovabio® is a leading brand in the NSPases segment for more than 20 years, supported with the Precise Nutrition Evaluation (PNEby Adisseo), a prediction services to evaluate feedstuff quality and help our customers to formulate the feed in line with the animal needs.
‐ Smartamine & Metasmart are recognized as the best protected methionine for ruminant to improve milk quality.
Adisseo awareness is improving all over the word. Adisseo is seen as expert company in Animal nutrition thanks to its teams and R&D research center.
2016 Annual Report
15 / 169
2. Global Production and Sales Network
Adisseo’s supply chain systems are based on the distribution of its regional customers. On the Chinese market, for example, in order to ensure the products safely delivered to customers all over the country on time, Adisseo has established a transit center for the Asia Pacific supply chain in the China (Shanghai) Free Trade Pilot Zone and 10 distribution warehousing centers national-wide according to where and how much the customers are concentrated. The Adisseo sales team has regularly opened distribution subsidiaries or offices globally. Adisseo will gradually establish and perfect the local sales organizations according to the development of the emerging economies. For example, Adisseo has set up a sales subsidiary in India and opened offices in Dubai. In addition to Adisseo’s own sales force, Adisseo has set up close long-term relationships with sales agents and distributors around the world in order to better serve the local market and customers.
Specialized and Comprehensive Feed Solutions
Because of Adisseo’s brand awareness, consistent product quality, competitive prices and rich product portfolio, most of its main customers purchase more than one kind of product. Adisseo has a long and distinguished history in animal feed nutrition, an outstanding market position, technological innovation and powerful R&D capabilities, nurturing a stable and ever-expanding client base. Furthermore, Adisseo has a powerful team of technical experts to offer professional consultation on additive application technologies and feed formulation and finished products analysis, strengthening its position as the go-to supplier for and its long-term and productive relationships with its customers. Adisseo has been recognized for its products and the quality of its service.
Unparalleled Market Explorer and Pioneer
Adisseo has continuously expanded its business to successfully seize the opportunities presented by the growth in demand for protein and animal feed additives in emerging economies. With population growth, growth in income per capita and changes in diet in emerging economies, a greater demand for animal proteins exists. Adisseo’s products help increase the metabolism and health of the animals and increase the efficiency in animal husbandry. The growth in population and per capita income and the need for higher efficiency in using land and water resources have created bright prospects for Adisseo’s core products. When it established the Adisseo Nanjing plant in 2013 and with the gradual increase of investment and production including debottlenecking, Adisseo has significantly increased its methionine global market share in the recent two years. Based on Feedinfo’s estimates, the market share of Adisseo increased from 23% in 2012 to 27% in 2015 and maintained its market share in 2016 despite strong competitiveness. Adisseo has developed strategic partnerships in order to reinforce its core businesses and diversify its portfolio in high growth segments in:
Feed specialties representing for Adisseo an attractive field to extend its business, and Animal health capturing accelerated growth, especially in dynamic and emerging businesses, that
will enable Adisseo to expand its product portfolio.
Strong Research and Development Capabilities
Adisseo’s R&D teams work closely with the marketing, production and engineering departments to align the objectives of product development with its general business objectives. Adisseo currently has a chemistry process lab, a biochemistry process lab, a formulation & process lab, a nutrition lab, a nutrition experimental farm, engineering experts and other R&D departments, with more than 100 employees globally. Adisseo cooperates with a number of international laboratories, universities and research institutions, strengthens its
2016 Annual Report
16 / 169
bonds with the scientific community, encourages the passion for innovation, and attracts technical talents by sponsoring R&D projects of methionine and related technologies. Adisseo remains an industry pioneer through its own prominent research and development capability since the release of methionine NP99 in 1945. Adisseo is one of the first companies in the world to synthesize methionine and vertically integrate its upstream and downstream production processes, one of the first companies to develop rumen-protected methionine for the ruminant market and is one of the first companies to develop the coated Vitamin A product. Adisseo was the first company to launch a high concentrated vitamin A (1 million unit/g), which became the new market standard. There are currently several major research projects under development, concerning all of Adisseo’s major products: methionine, vitamins, enzymes, and also rumen-protected products. From 2014 onwards, Adisseo launched one new product every year: Selisseo®, a specialty product based on selenium in 2014, and a new thermostable enzyme, Rovabio Advance®, a new Non-Starch Polysaccharide enzyme, in 2015 and Alterion®, a new probiotics, in 2016.
Scientific and Reasonable Cost Control Measures
Adisseo has vertically integrated its upstream and downstream production processes. Its methionine production extends to the production of propylene, sulfur and other such basic materials, ensuring a stable and reliable supply for the hazardous intermediates in methionine production. The dangerous intermediates mainly include methanol, MMP, hydrogen sulfide, hydrogen cyanide, among others. These materials have limited suppliers in the public market and the production is not integrated. Through the production of these intermediates, Adisseo is able to monitor the product quality at each production step, and appropriately lower the production costs and become even more competitive at the same time.
Experienced Management Team with Rich Industry Knowledge
The Adisseo management team in average has over 10 years of industry and management experience in animal feed additives. Adisseo’s management team has focused on effectively integrating and allocating Adisseo’s global business and resources. Additionally, Adisseo has built an excellent corporate culture and employee development and incentive programs, which provides internal drive for sustainable growth.
2016 Annual Report
17 / 169
Section 4 Discussion and Analysis of the Operation
I. Discussion and Analysis of the Operation
Adisseo’s businesses focus on research, development, production and sale of feed additives for animal nutrition. Its main products are classified within 3 categories of products: Performance products, Specialty products, and Other Products for other animal feed additives. Its performance, financial position and future are affected by the global macro economy. Although the global macro economy has demonstrated signs of slow recovery, significant disparity exists among the recovery process for each competitor. Debt crisis, trade imbalances and exchange rate fluctuations also increase the uncertainty of such recovery. Thanks to that fact that Adisseo is a key important player in the food value chain, Adisseo has high resilience in facing with those uncertainties, which can be proved by the stable profit generation in the past 10 years. Adisseo faces competition from large and well-known companies with strong financial positions as well as competition from smaller companies in the regional or local markets. Indeed, longer term capacity additions on methionine through to the end of 2020 have been announced by SCC Novus, CUC, NHU and Evonik. CJ is advancing with their objective to diversify towards more competitive raw material sources, as its production process is partially independent from petroleum based raw materials. Adisseo has taken steps to improve its competitiveness, including tightening cost control, improving production technologies, providing value-added services and increasing its production capacity:
Second phase engineering of the Nanjing plant has been launched in 2016. The aim is to increase production capacity to 140kT. The Nanjing plant has become one of the world's largest and lowest cost of liquid methionine production base by the fully vertical integration of the production process and world-class manufacturing capability.
Adisseo is actively preparing future development by combining extensions and debottlenecking of existing production facilities, as well as by studying new potential sites.
Adisseo also continually heavily invests in methionine related studies so as to make sure that it will take the leading position in technology and as such is always intending to provide break-through innovation in the industry.
Specialty products are under active development as a second pillar to enhance animal performance and health. Adisseo actively explores innovative products and launches one new product per year, as it is confident about the great potential of these products in the near future.
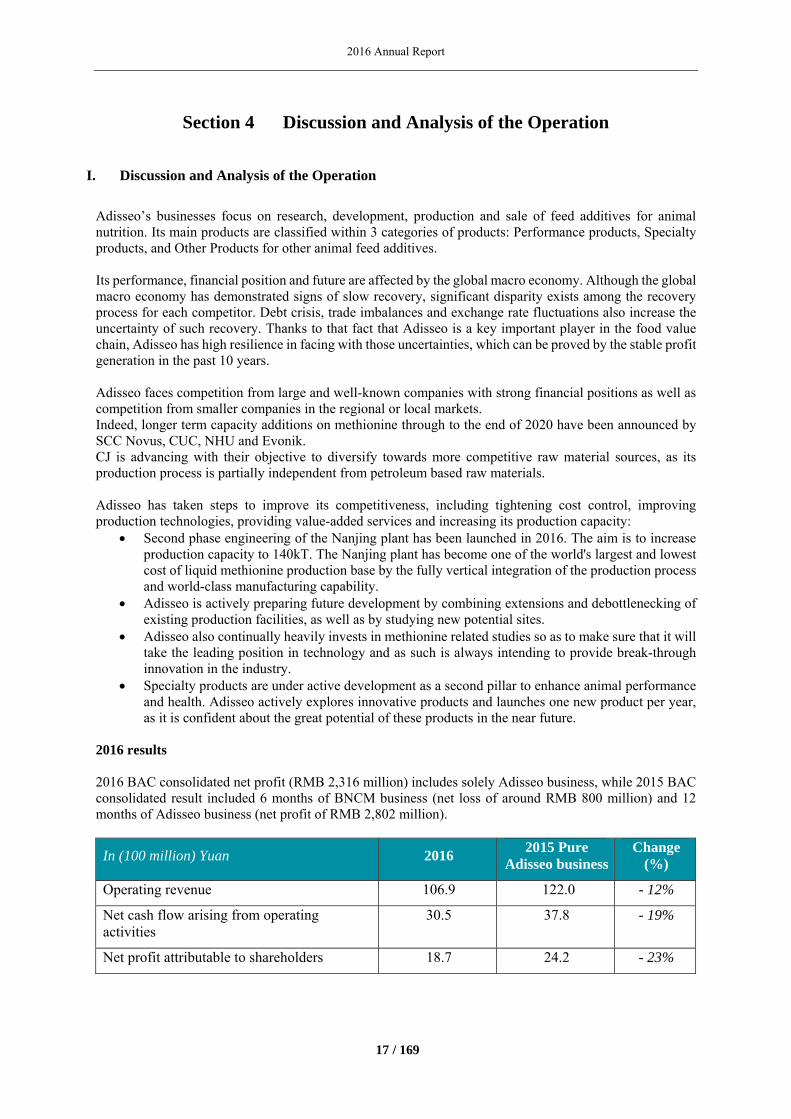
2016 results 2016 BAC consolidated net profit (RMB 2,316 million) includes solely Adisseo business, while 2015 BAC consolidated result included 6 months of BNCM business (net loss of around RMB 800 million) and 12 months of Adisseo business (net profit of RMB 2,802 million).
In (100 million) Yuan 2016 2015 Pure
Adisseo business Change
(%)
Operating revenue 106.9 122.0 - 12%
Net cash flow arising from operating activities
30.5 37.8 - 19%
Net profit attributable to shareholders 18.7 24.2 - 23%
2016 Annual Report
18 / 169
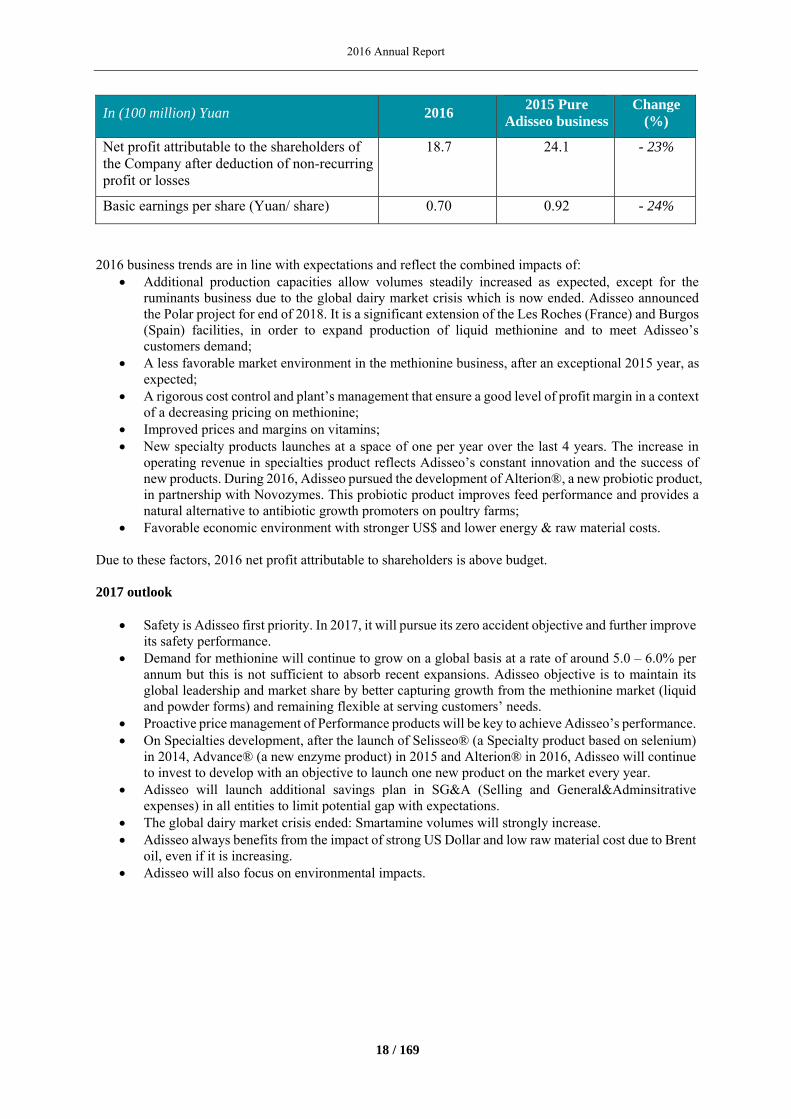
In (100 million) Yuan 2016 2015 Pure
Adisseo business Change
(%)
Net profit attributable to the shareholders of the Company after deduction of non-recurring profit or losses
18.7 24.1 - 23%
Basic earnings per share (Yuan/ share) 0.70 0.92 - 24%
2016 business trends are in line with expectations and reflect the combined impacts of:
Additional production capacities allow volumes steadily increased as expected, except for the ruminants business due to the global dairy market crisis which is now ended. Adisseo announced the Polar project for end of 2018. It is a significant extension of the Les Roches (France) and Burgos (Spain) facilities, in order to expand production of liquid methionine and to meet Adisseo’s customers demand;
A less favorable market environment in the methionine business, after an exceptional 2015 year, as expected;
A rigorous cost control and plant’s management that ensure a good level of profit margin in a context of a decreasing pricing on methionine;
Improved prices and margins on vitamins; New specialty products launches at a space of one per year over the last 4 years. The increase in
operating revenue in specialties product reflects Adisseo’s constant innovation and the success of new products. During 2016, Adisseo pursued the development of Alterion®, a new probiotic product, in partnership with Novozymes. This probiotic product improves feed performance and provides a natural alternative to antibiotic growth promoters on poultry farms;
Favorable economic environment with stronger US$ and lower energy & raw material costs. Due to these factors, 2016 net profit attributable to shareholders is above budget. 2017 outlook
Safety is Adisseo first priority. In 2017, it will pursue its zero accident objective and further improve its safety performance.
Demand for methionine will continue to grow on a global basis at a rate of around 5.0 – 6.0% per annum but this is not sufficient to absorb recent expansions. Adisseo objective is to maintain its global leadership and market share by better capturing growth from the methionine market (liquid and powder forms) and remaining flexible at serving customers’ needs.
Proactive price management of Performance products will be key to achieve Adisseo’s performance. On Specialties development, after the launch of Selisseo® (a Specialty product based on selenium)
in 2014, Advance® (a new enzyme product) in 2015 and Alterion® in 2016, Adisseo will continue to invest to develop with an objective to launch one new product on the market every year.
Adisseo will launch additional savings plan in SG&A (Selling and General&Adminsitrative expenses) in all entities to limit potential gap with expectations.
The global dairy market crisis ended: Smartamine volumes will strongly increase. Adisseo always benefits from the impact of strong US Dollar and low raw material cost due to Brent
oil, even if it is increasing. Adisseo will also focus on environmental impacts.
2016 Annual Report
19 / 169
II. Analysis of results of operations of main businesses in the reporting period
1. Analysis of main business
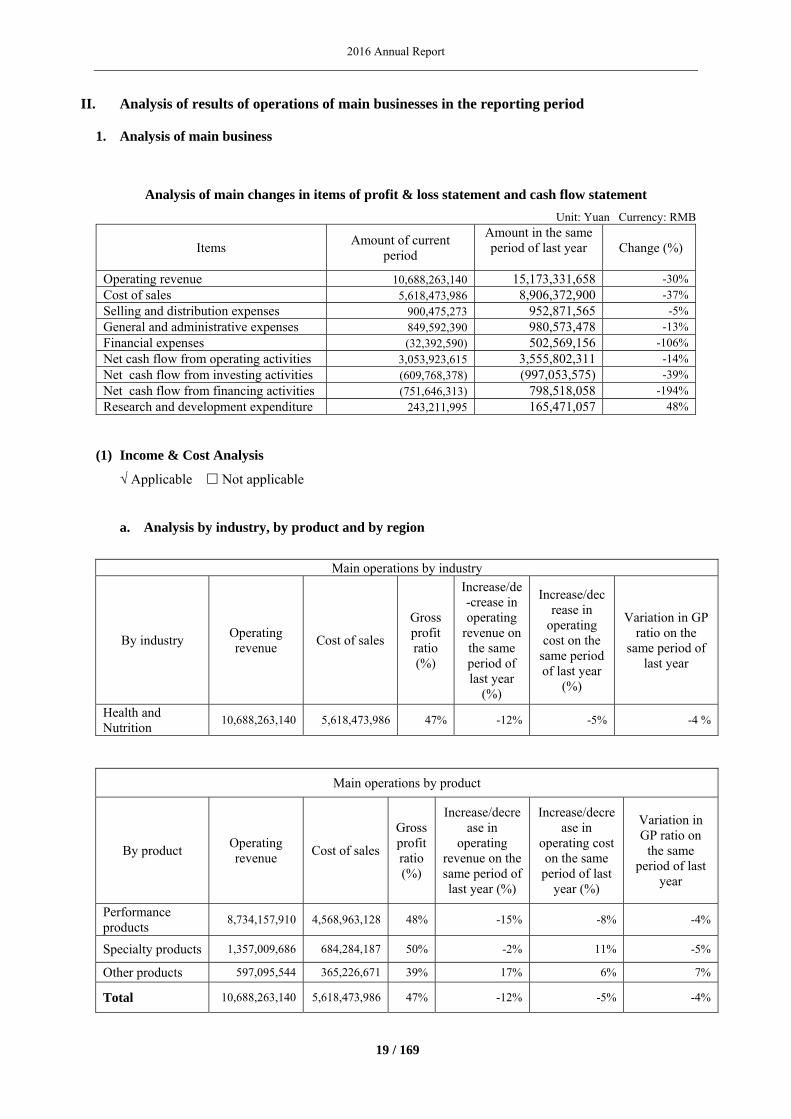
Analysis of main changes in items of profit & loss statement and cash flow statement
Unit: Yuan Currency: RMB
Items Amount of current
period
Amount in the same period of last year
Change (%)
Operating revenue 10,688,263,140 15,173,331,658 -30%Cost of sales 5,618,473,986 8,906,372,900 -37%Selling and distribution expenses 900,475,273 952,871,565 -5%General and administrative expenses 849,592,390 980,573,478 -13%Financial expenses (32,392,590) 502,569,156 -106%Net cash flow from operating activities 3,053,923,615 3,555,802,311 -14%Net cash flow from investing activities (609,768,378) (997,053,575) -39%Net cash flow from financing activities (751,646,313) 798,518,058 -194%Research and development expenditure 243,211,995 165,471,057 48%
(1) Income & Cost Analysis
√ Applicable Not applicable
a. Analysis by industry, by product and by region
Main operations by industry
By industry Operating revenue
Cost of sales
Gross profit ratio (%)
Increase/de-crease in operating
revenue on the same period of last year
(%)
Increase/decrease in
operating cost on the
same period of last year
(%)
Variation in GP ratio on the
same period of last year
Health and Nutrition
10,688,263,140 5,618,473,986 47% -12% -5% -4 %
Main operations by product
By product Operating revenue
Cost of sales
Gross profit ratio (%)
Increase/decrease in
operating revenue on the same period of last year (%)
Increase/decrease in
operating cost on the same
period of last year (%)
Variation in GP ratio on
the same period of last
year
Performance products
8,734,157,910 4,568,963,128 48% -15% -8% -4%
Specialty products 1,357,009,686 684,284,187 50% -2% 11% -5%
Other products 597,095,544 365,226,671 39% 17% 6% 7%
Total 10,688,263,140 5,618,473,986 47% -12% -5% -4%
2016 Annual Report
20 / 169
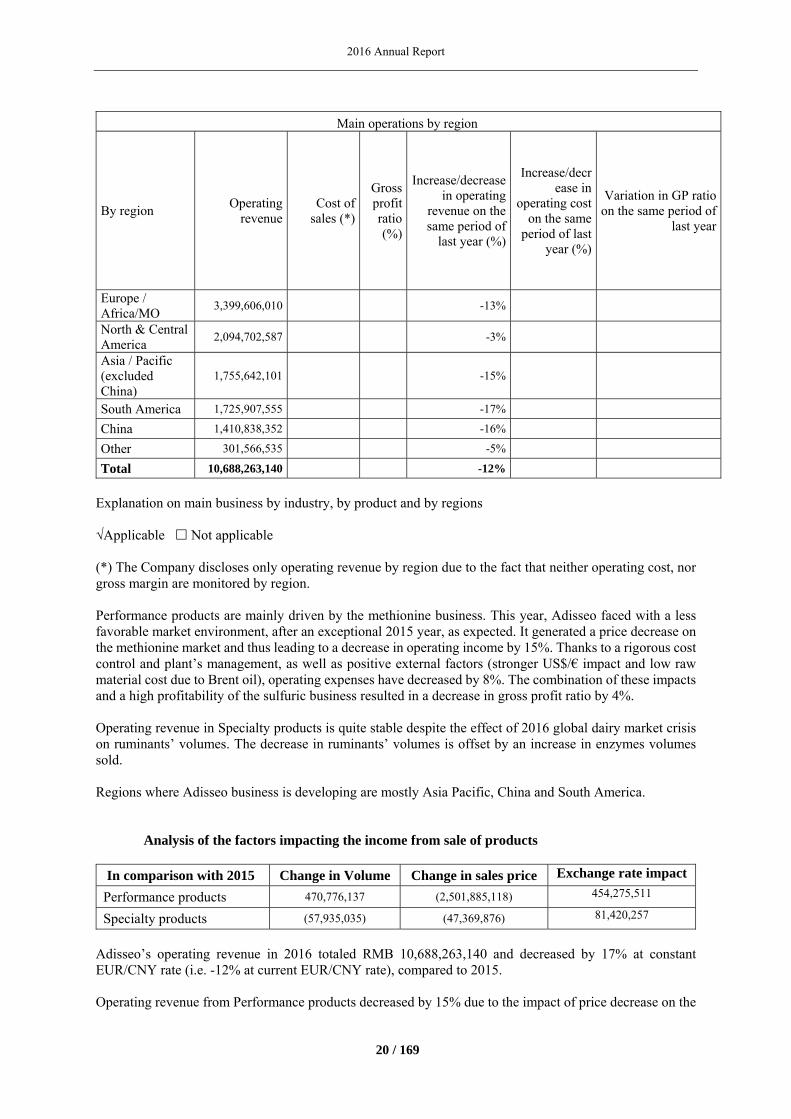
Main operations by region
By region Operating
revenue Cost of
sales (*)
Gross profit ratio (%)
Increase/decrease in operating
revenue on the same period of
last year (%)
Increase/decrease in
operating cost on the same
period of last year (%)
Variation in GP ratio on the same period of
last year
Europe / Africa/MO
3,399,606,010
-13%
North & Central America
2,094,702,587
-3%
Asia / Pacific (excluded China)
1,755,642,101
-15%
South America 1,725,907,555 -17%
China 1,410,838,352 -16%
Other 301,566,535 -5%
Total 10,688,263,140 -12% Explanation on main business by industry, by product and by regions √Applicable Not applicable (*) The Company discloses only operating revenue by region due to the fact that neither operating cost, nor gross margin are monitored by region. Performance products are mainly driven by the methionine business. This year, Adisseo faced with a less favorable market environment, after an exceptional 2015 year, as expected. It generated a price decrease on the methionine market and thus leading to a decrease in operating income by 15%. Thanks to a rigorous cost control and plant’s management, as well as positive external factors (stronger US$/€ impact and low raw material cost due to Brent oil), operating expenses have decreased by 8%. The combination of these impacts and a high profitability of the sulfuric business resulted in a decrease in gross profit ratio by 4%. Operating revenue in Specialty products is quite stable despite the effect of 2016 global dairy market crisis on ruminants’ volumes. The decrease in ruminants’ volumes is offset by an increase in enzymes volumes sold. Regions where Adisseo business is developing are mostly Asia Pacific, China and South America.
Analysis of the factors impacting the income from sale of products
In comparison with 2015 Change in Volume Change in sales price Exchange rate impact
Performance products 470,776,137 (2,501,885,118) 454,275,511
Specialty products (57,935,035) (47,369,876) 81,420,257
Adisseo’s operating revenue in 2016 totaled RMB 10,688,263,140 and decreased by 17% at constant EUR/CNY rate (i.e. -12% at current EUR/CNY rate), compared to 2015. Operating revenue from Performance products decreased by 15% due to the impact of price decrease on the
2016 Annual Report
21 / 169
methionine market, which has been partially compensated by higher volumes of methionine products sold and increase in vitamins selling prices in comparison with 2015.
b. Production, Sales and Inventory Quantity analysis
Applicable √Not applicable Units of volume by category of products comprising are not homogeneous. Therefore, no disclosure have been provided.
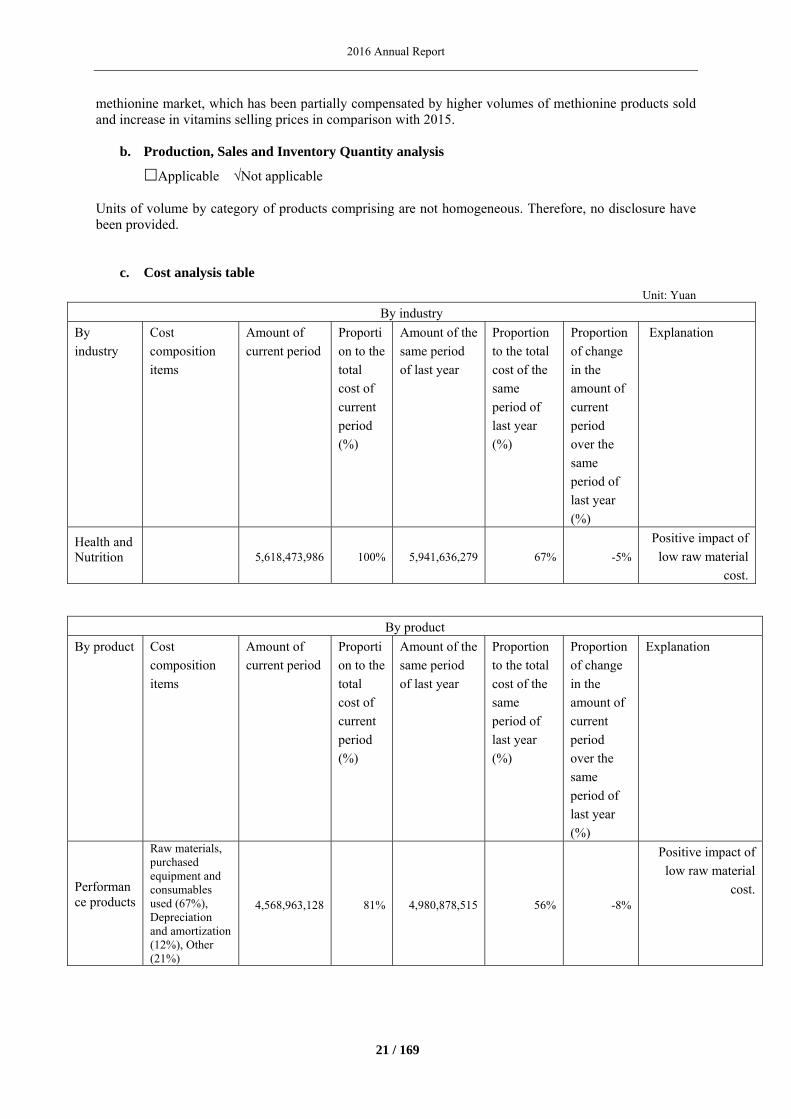
c. Cost analysis table
Unit: Yuan
By industry
By
industry
Cost
composition
items
Amount of
current period
Proporti
on to the
total
cost of
current
period
(%)
Amount of the
same period
of last year
Proportion
to the total
cost of the
same
period of
last year
(%)
Proportion
of change
in the
amount of
current
period
over the
same
period of
last year
(%)
Explanation
Health and Nutrition
5,618,473,986 100% 5,941,636,279 67% -5%
Positive impact of
low raw material
cost.
By product
By product Cost
composition
items
Amount of
current period
Proporti
on to the
total
cost of
current
period
(%)
Amount of the
same period
of last year
Proportion
to the total
cost of the
same
period of
last year
(%)
Proportion
of change
in the
amount of
current
period
over the
same
period of
last year
(%)
Explanation
Performance products
Raw materials, purchased equipment and consumables used (67%), Depreciation and amortization (12%), Other (21%)
4,568,963,128 81% 4,980,878,515 56% -8%
Positive impact of
low raw material
cost.
2016 Annual Report
22 / 169
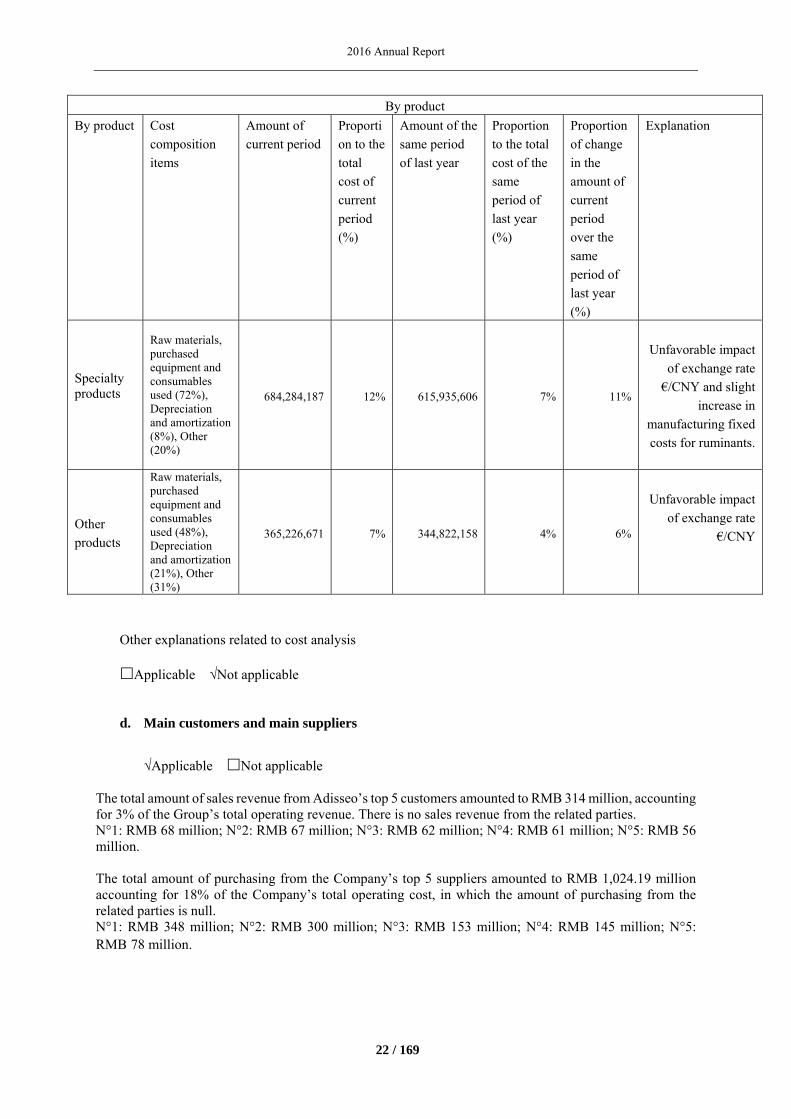
By product
By product Cost
composition
items
Amount of
current period
Proporti
on to the
total
cost of
current
period
(%)
Amount of the
same period
of last year
Proportion
to the total
cost of the
same
period of
last year
(%)
Proportion
of change
in the
amount of
current
period
over the
same
period of
last year
(%)
Explanation
Specialty products
Raw materials, purchased equipment and consumables used (72%), Depreciation and amortization (8%), Other (20%)
684,284,187 12% 615,935,606 7% 11%
Unfavorable impact
of exchange rate
€/CNY and slight
increase in
manufacturing fixed
costs for ruminants.
Other
products
Raw materials, purchased equipment and consumables used (48%), Depreciation and amortization (21%), Other (31%)
365,226,671 7% 344,822,158 4% 6%
Unfavorable impact
of exchange rate
€/CNY
Other explanations related to cost analysis Applicable √Not applicable
d. Main customers and main suppliers
√Applicable Not applicable
The total amount of sales revenue from Adisseo’s top 5 customers amounted to RMB 314 million, accounting for 3% of the Group’s total operating revenue. There is no sales revenue from the related parties. N°1: RMB 68 million; N°2: RMB 67 million; N°3: RMB 62 million; N°4: RMB 61 million; N°5: RMB 56 million. The total amount of purchasing from the Company’s top 5 suppliers amounted to RMB 1,024.19 million accounting for 18% of the Company’s total operating cost, in which the amount of purchasing from the related parties is null. N°1: RMB 348 million; N°2: RMB 300 million; N°3: RMB 153 million; N°4: RMB 145 million; N°5: RMB 78 million.
2016 Annual Report
23 / 169
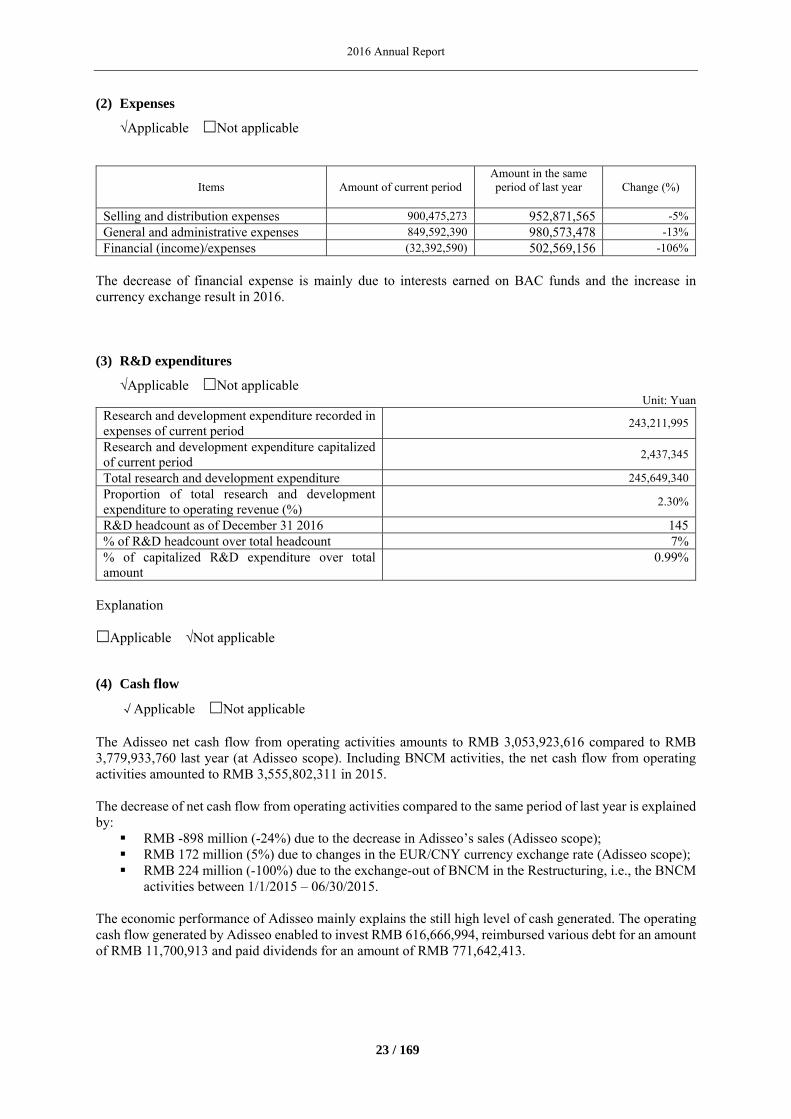
(2) Expenses
√Applicable Not applicable
Items Amount of current period Amount in the same period of last year
Change (%)
Selling and distribution expenses 900,475,273 952,871,565 -5%
General and administrative expenses 849,592,390 980,573,478 -13%
Financial (income)/expenses (32,392,590) 502,569,156 -106%
The decrease of financial expense is mainly due to interests earned on BAC funds and the increase in currency exchange result in 2016.
(3) R&D expenditures
√Applicable Not applicable Unit: Yuan
Research and development expenditure recorded in expenses of current period
243,211,995
Research and development expenditure capitalized of current period
2,437,345
Total research and development expenditure 245,649,340Proportion of total research and development expenditure to operating revenue (%)
2.30%
R&D headcount as of December 31 2016 145% of R&D headcount over total headcount 7%% of capitalized R&D expenditure over total amount
0.99%
Explanation Applicable √Not applicable
(4) Cash flow
√Applicable Not applicable The Adisseo net cash flow from operating activities amounts to RMB 3,053,923,616 compared to RMB 3,779,933,760 last year (at Adisseo scope). Including BNCM activities, the net cash flow from operating activities amounted to RMB 3,555,802,311 in 2015. The decrease of net cash flow from operating activities compared to the same period of last year is explained by: RMB -898 million (-24%) due to the decrease in Adisseo’s sales (Adisseo scope); RMB 172 million (5%) due to changes in the EUR/CNY currency exchange rate (Adisseo scope); RMB 224 million (-100%) due to the exchange-out of BNCM in the Restructuring, i.e., the BNCM
activities between 1/1/2015 – 06/30/2015. The economic performance of Adisseo mainly explains the still high level of cash generated. The operating cash flow generated by Adisseo enabled to invest RMB 616,666,994, reimbursed various debt for an amount of RMB 11,700,913 and paid dividends for an amount of RMB 771,642,413.
2016 Annual Report
24 / 169
2. Significant change in the Company’s profit composition or profit sources in the reporting period arises from the ancillary businesses
Applicable √ Not applicable
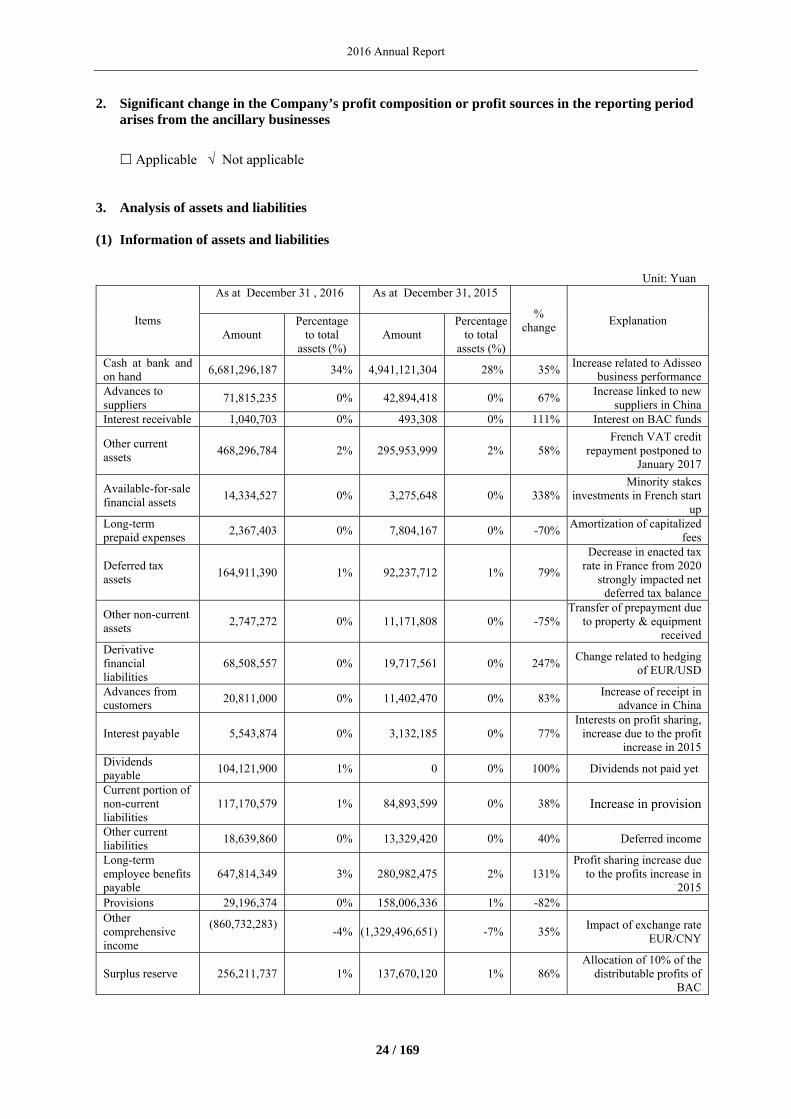
3. Analysis of assets and liabilities
(1) Information of assets and liabilities
Unit: Yuan
Items
As at December 31 , 2016
As at December 31, 2015
% change
Explanation Amount
Percentage to total
assets (%) Amount
Percentage to total
assets (%)Cash at bank and on hand 6,681,296,187 34% 4,941,121,304 28% 35% Increase related to Adisseo
business performance Advances to suppliers
71,815,235 0% 42,894,418 0% 67% Increase linked to new suppliers in China
Interest receivable 1,040,703 0% 493,308 0% 111% Interest on BAC funds
Other current assets
468,296,784 2% 295,953,999 2% 58% French VAT credit
repayment postponed to January 2017
Available-for-sale financial assets
14,334,527 0% 3,275,648 0% 338% Minority stakes
investments in French start up
Long-term prepaid expenses
2,367,403 0% 7,804,167 0% -70% Amortization of capitalized fees
Deferred tax assets
164,911,390 1% 92,237,712 1% 79%
Decrease in enacted tax rate in France from 2020
strongly impacted net deferred tax balance
Other non-current assets
2,747,272 0% 11,171,808 0% -75% Transfer of prepayment due
to property & equipment received
Derivative financial liabilities
68,508,557 0% 19,717,561 0% 247% Change related to hedging of EUR/USD
Advances from customers
20,811,000 0% 11,402,470 0% 83% Increase of receipt in advance in China
Interest payable 5,543,874 0% 3,132,185 0% 77% Interests on profit sharing,
increase due to the profit increase in 2015
Dividends payable
104,121,900 1% 0 0% 100% Dividends not paid yet
Current portion of non-current liabilities
117,170,579 1% 84,893,599 0% 38% Increase in provision
Other current liabilities
18,639,860 0% 13,329,420 0% 40% Deferred income
Long-term employee benefits payable
647,814,349 3% 280,982,475 2% 131% Profit sharing increase due
to the profits increase in 2015
Provisions 29,196,374 0% 158,006,336 1% -82% Other comprehensive income
(860,732,283)
-4% (1,329,496,651) -7% 35% Impact of exchange rate EUR/CNY
Surplus reserve 256,211,737 1% 137,670,120 1% 86% Allocation of 10% of the
distributable profits of BAC
2016 Annual Report
25 / 169
(2) Restricted assets at the end of reporting period
Applicable √ Not applicable
(3) Other information
Applicable √ Not applicable
4. Analysis of chemical industry business information
i. Basic information of the industry
a. Modifications in regulation
Applicable √ Not applicable
b. Basic information of the subdivided sectors industry and the companies’ position in the
industry √ Applicable Not applicable
Industry trend
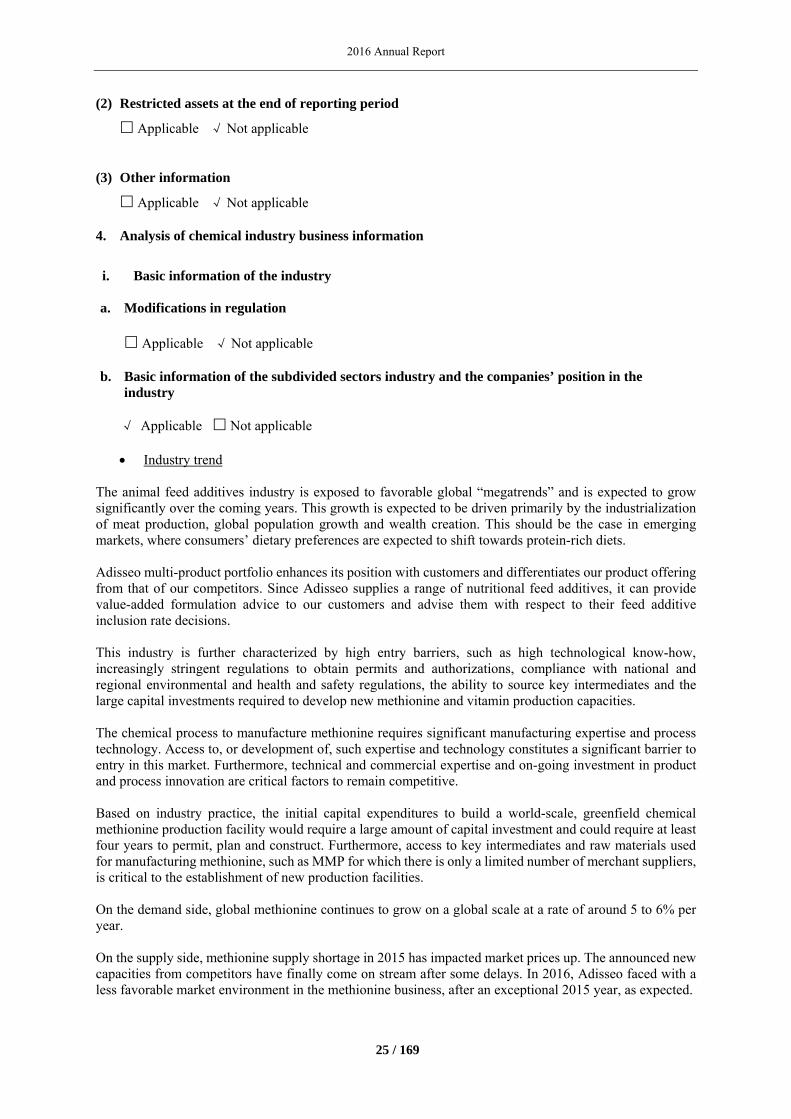
The animal feed additives industry is exposed to favorable global “megatrends” and is expected to grow significantly over the coming years. This growth is expected to be driven primarily by the industrialization of meat production, global population growth and wealth creation. This should be the case in emerging markets, where consumers’ dietary preferences are expected to shift towards protein-rich diets. Adisseo multi-product portfolio enhances its position with customers and differentiates our product offering from that of our competitors. Since Adisseo supplies a range of nutritional feed additives, it can provide value-added formulation advice to our customers and advise them with respect to their feed additive inclusion rate decisions. This industry is further characterized by high entry barriers, such as high technological know-how, increasingly stringent regulations to obtain permits and authorizations, compliance with national and regional environmental and health and safety regulations, the ability to source key intermediates and the large capital investments required to develop new methionine and vitamin production capacities. The chemical process to manufacture methionine requires significant manufacturing expertise and process technology. Access to, or development of, such expertise and technology constitutes a significant barrier to entry in this market. Furthermore, technical and commercial expertise and on-going investment in product and process innovation are critical factors to remain competitive. Based on industry practice, the initial capital expenditures to build a world-scale, greenfield chemical methionine production facility would require a large amount of capital investment and could require at least four years to permit, plan and construct. Furthermore, access to key intermediates and raw materials used for manufacturing methionine, such as MMP for which there is only a limited number of merchant suppliers, is critical to the establishment of new production facilities. On the demand side, global methionine continues to grow on a global scale at a rate of around 5 to 6% per year. On the supply side, methionine supply shortage in 2015 has impacted market prices up. The announced new capacities from competitors have finally come on stream after some delays. In 2016, Adisseo faced with a less favorable market environment in the methionine business, after an exceptional 2015 year, as expected.
2016 Annual Report
26 / 169
Negative impacts from price have been partly compensated by Adisseo volumes growth, and favorable raw material prices based on a low Brent level.
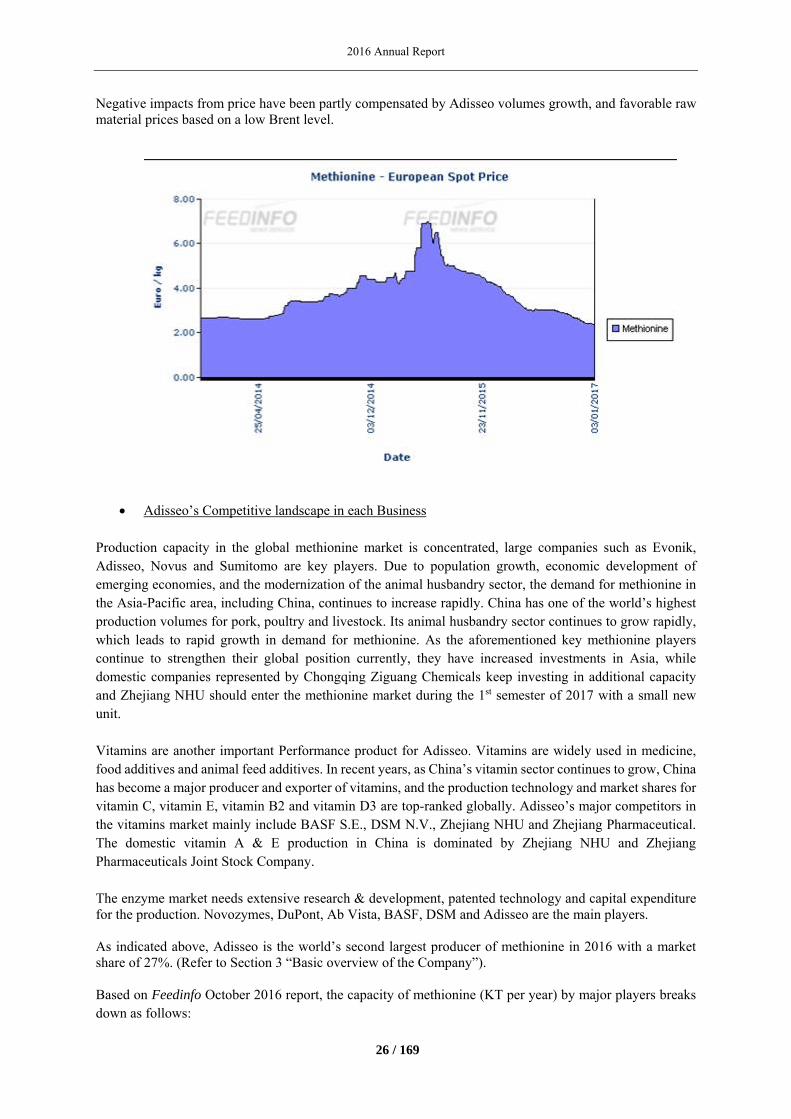
Adisseo’s Competitive landscape in each Business Production capacity in the global methionine market is concentrated, large companies such as Evonik, Adisseo, Novus and Sumitomo are key players. Due to population growth, economic development of emerging economies, and the modernization of the animal husbandry sector, the demand for methionine in the Asia-Pacific area, including China, continues to increase rapidly. China has one of the world’s highest production volumes for pork, poultry and livestock. Its animal husbandry sector continues to grow rapidly, which leads to rapid growth in demand for methionine. As the aforementioned key methionine players continue to strengthen their global position currently, they have increased investments in Asia, while domestic companies represented by Chongqing Ziguang Chemicals keep investing in additional capacity and Zhejiang NHU should enter the methionine market during the 1st semester of 2017 with a small new unit. Vitamins are another important Performance product for Adisseo. Vitamins are widely used in medicine, food additives and animal feed additives. In recent years, as China’s vitamin sector continues to grow, China has become a major producer and exporter of vitamins, and the production technology and market shares for vitamin C, vitamin E, vitamin B2 and vitamin D3 are top-ranked globally. Adisseo’s major competitors in the vitamins market mainly include BASF S.E., DSM N.V., Zhejiang NHU and Zhejiang Pharmaceutical. The domestic vitamin A & E production in China is dominated by Zhejiang NHU and Zhejiang Pharmaceuticals Joint Stock Company. The enzyme market needs extensive research & development, patented technology and capital expenditure for the production. Novozymes, DuPont, Ab Vista, BASF, DSM and Adisseo are the main players. As indicated above, Adisseo is the world’s second largest producer of methionine in 2016 with a market share of 27%. (Refer to Section 3 “Basic overview of the Company”). Based on Feedinfo October 2016 report, the capacity of methionine (KT per year) by major players breaks down as follows:
2016 Annual Report
27 / 169
Based on public information, the main competitors of Adisseo on its different markets are as follows:
Evonik, previously Degussa, was established in 1873, focused on specialty chemicals. Its methionine products are mainly powder methionine. Based on Evonik’s 2016 annual report, its 2016 sales totaled EUR 12,732 million, net profit reached EUR 844 million, of which sales from the nutritional health sector of EUR 4,316 million.
Novus is an American animal additives company, providing feed solutions for poultry, pork, rumen-protected, and aquaculture. Its products include methionine, chelated trace elements, feed enzymes, and mainly produces liquid methionine.
CJ CheilJedang is a core subsidiary in charge of the food and bioengineering business unit of the CJ Group. It has led the development of the Korean food industry for the past 60 years, and contributed to the development of the bioengineering industry as the nation’s top food originated company. CJ is advancing with their objective to lower input costs and diversify towards more competitive raw material sources. CJ’s production process is partially independent from petroleum based raw materials.
Chongqing Unisplendour Chemical Co (UNIS) is one of the natural gas fine chemical production bases with the largest scale, the most advanced technology and competitive cost in China. It is becoming one of the major methionine producers as it has recently increased its capacity by successfully implementing the second phase at their Ningxia dl Methionine plant. By the end of December 2016, the UNIS facility has been capable of manufacturing around 90kt -100 kt per annum.
Sumitomo Chemical is a major company within the Sumitomo Group. Its business sectors include basic chemicals, petrochemical and plastic chemicals, IT-related chemicals, health & crop science and pharmaceuticals. Methionine is a primary business in the health & crop sciences sector. As one of the major methionine producers globally, Sumitomo is the only company other than Adisseo that can produce both powder and liquid methionine.
NHU is a Chinese company specialized in the production of bulk pharmaceutical chemicals, medications, health products, food additives, feed additives and flavors and aromas. NHU are making exceptional progress in bringing their brand new dl Methionine factory on-stream. The facility is expected to gradually scale up during the first quarter of 2017 and reach close to nameplate capacity of 50kt per annum during the first semester of 2017.
Sichuan Hebang Group’s primary business includes manufacture and sale of pesticides and pesticide intermediaries, pharmaceutical intermediaries, soda products, smart glass, salt, phosphate, new
2016 Annual Report
28 / 169
materials, and production and sales of environmental protection products.
DuPont was established in 1802, its business spans over 90 countries and regions globally. Its main products and services include agriculture and foods, buildings and construction, telecommunications and transport, and energy and biotechnology sectors. In May 2011, DuPont purchased Danisco, a global leader in bio enzyme production to fill DuPont’s gap in the biotechnology sector.
DSM N.V. is an international nutritional supplements, chemicals materials and pharmaceutical group. The company was established in 1902, headquartered in the Netherlands, with over 200 institutions in Europe, Asia, and South Americas and 22,000 employees in total globally. Animal nutrition and health is a key business group under DSM. DSM provides high quality raw materials and animal feed additives for poultry, aquaculture, swine, rumen-protected animals and pets which are used to produce higher quality and better quality meat, eggs and milk. DSM’s main products include amino acids, enzyme, vitamin, beta-carotene and pre-mix feeds, etc.
Established in 1935, Associated British Foods is an international food manufacturing and retail company headquartered in London, and is one of the major food manufacturers in the world. Based on Associated British Foods’ 2016 financial statements, its sales reached GBP 13.4 billion and its net profit was GBP 821 million.
BASF S.E. is a globally leading chemicals company, providing products and services in chemical products, plastics, agricultural product, refined chemicals, petroleum and natural gas. Based on the 2016 Annual Report published by BASF, its sales amounted to EUR 57.6 billion, with a net profit of EUR 4.1 billion.
ii. Product and production a. Main operating mode
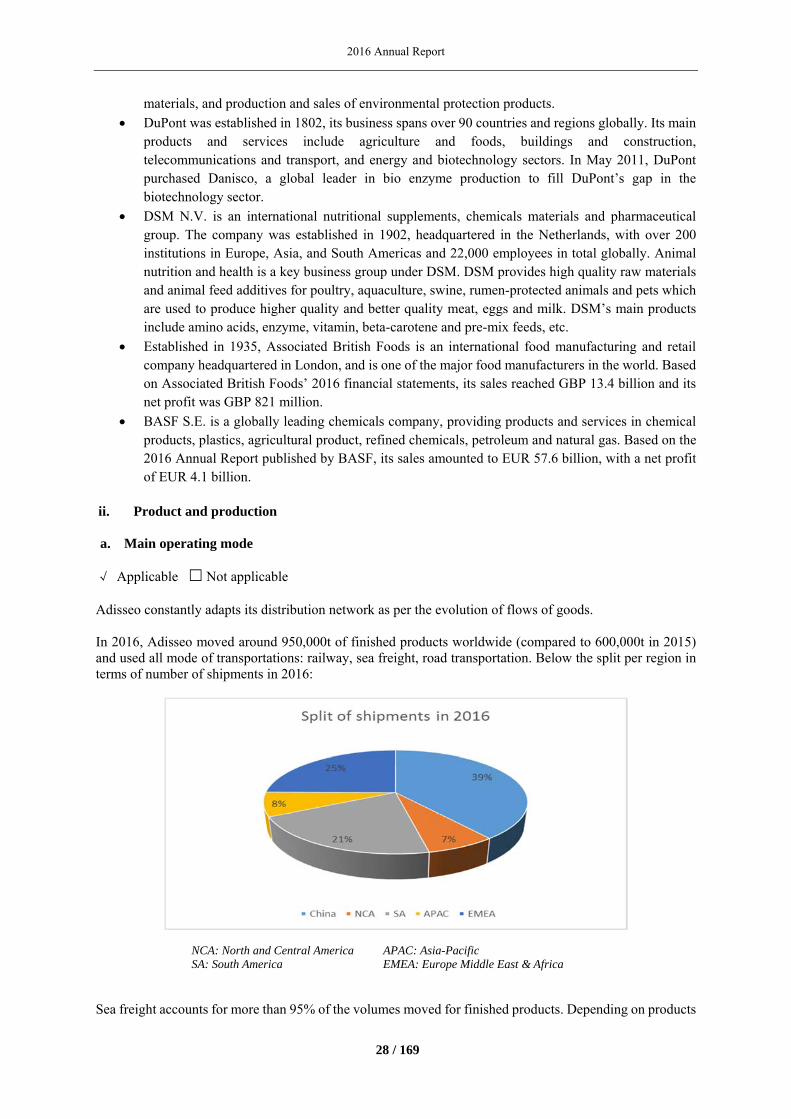
√ Applicable Not applicable Adisseo constantly adapts its distribution network as per the evolution of flows of goods. In 2016, Adisseo moved around 950,000t of finished products worldwide (compared to 600,000t in 2015) and used all mode of transportations: railway, sea freight, road transportation. Below the split per region in terms of number of shipments in 2016:
NCA: North and Central America APAC: Asia-Pacific SA: South America EMEA: Europe Middle East & Africa
Sea freight accounts for more than 95% of the volumes moved for finished products. Depending on products
2016 Annual Report
29 / 169
it uses container (for solid products) and ISO tanks and parcel tankers (for liquid products). Raw materials transportation is entirely in the hands of its suppliers. For intermediary products Adisseo is managing dedicated fleets of rail cars. Adisseo’s production materials and finished products inventories are stored in tanks for liquid products and traditional warehouses for the other products. Warehouses located in its factories are managed by its own people and warehouses outside its factories are all outsourced to logistics providers. For both outsourced and insourced warehouses, Adisseo has established policies with regard to warehouse management. These policies are regularly audited and improved. Change of main operating mode during the reporting period
Applicable √ Not applicable b. Information of principal product
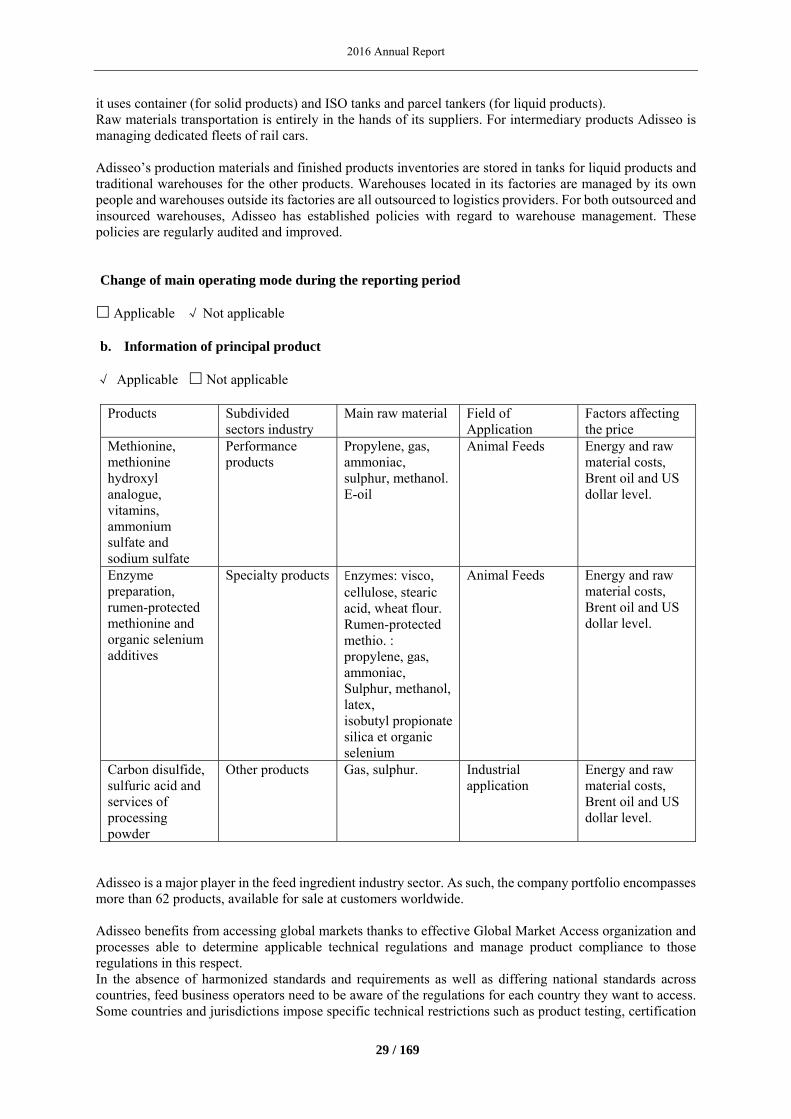
√ Applicable Not applicable
Products Subdivided
sectors industry Main raw material Field of
Application Factors affecting the price
Methionine, methionine hydroxyl analogue, vitamins, ammonium sulfate and sodium sulfate
Performance products
Propylene, gas, ammoniac, sulphur, methanol.E-oil
Animal Feeds Energy and raw material costs, Brent oil and US dollar level.
Enzyme preparation, rumen-protected methionine and organic selenium additives
Specialty products Enzymes: visco, cellulose, stearic acid, wheat flour. Rumen-protected methio. : propylene, gas, ammoniac, Sulphur, methanol, latex, isobutyl propionatesilica et organic selenium
Animal Feeds Energy and raw material costs, Brent oil and US dollar level.
Carbon disulfide, sulfuric acid and services of processing powder
Other products Gas, sulphur. Industrial application
Energy and raw material costs, Brent oil and US dollar level.
Adisseo is a major player in the feed ingredient industry sector. As such, the company portfolio encompasses more than 62 products, available for sale at customers worldwide. Adisseo benefits from accessing global markets thanks to effective Global Market Access organization and processes able to determine applicable technical regulations and manage product compliance to those regulations in this respect. In the absence of harmonized standards and requirements as well as differing national standards across countries, feed business operators need to be aware of the regulations for each country they want to access. Some countries and jurisdictions impose specific technical restrictions such as product testing, certification
2016 Annual Report
30 / 169
and shipment inspection requirements. In addition, the complex regulatory framework in some countries is constantly being updated and expanded. In this complex technical trade environment, Adisseo ensures products market access in more than 130 countries, resulting in more than 950 official registrations approvals worldwide. Adisseo acknowledges its responsibility for food and feed safety and consecutively control associated risks. During the manufacture of feed products, our company places the highest priority on the safety and health of our products and as such, places the highest emphasis on ensuring that each product is safe and fit for animal consumption and is in compliance with the current industry standards. For this purpose, company management has decided to implement and maintain an integrated management system through its worldwide activities (manufacturing and trade), complying in general to the ISO 9001 standard, and in addition, where applicable, complying to the ISO 22000:2005 and to the FAMI-QS Code of Practice. Adisseo is recognized by stakes as a visible and credible global leader, as such the company holds membership at major worldwide feed industry associations and committees in North America, Latin America, Europe and China. c. R&D and innovation
√ Applicable Not applicable
Adisseo R&D program is structured into 3 activities: Discovery – fundamental research, developing in partnership with academics or start-up companies Innovation – testing and commercialization through world-wide R&D centers Enhancement – ongoing enhancement for validated projects
Adisseo continues to make significant efforts to reinforce its R&D programs. Adisseo promotes a policy of reinforced and continuous research and innovation for its products, production processes as well as its businesses, work and organization methods. There are 7 research and development centers focused on several different areas such as analysis, nutrition, formulation, biotechnology, chemical processes, chemistry, formulation and processes. In 2016, the Company’s total research and development expenditures amounted to RMB 245,649,340 (including expenditure capitalized for the period) and its proportion to net assets and operating revenue was 1.5% and 2.3%, respectively.
Please refer to Section 4, Part II-1-(3) R&D expenditures for detailed figures. d. Manufacturing techniques
√ Applicable Not applicable Adisseo’s vertically integrated production process ensures a reliable supply for the key intermediates in methionine production and capturing the full value versus competition. Main raw materials sourced externally are propylene, methanol, natural gas and sulphuric products. Some intermediates produced in excess are sold (sulphuric acid and carbon disulphide). The end products are powder and liquid methionine; sodium sulphate and ammonium sulphate constitute by products. Adisseo manufacturing network includes six plants: four in France, one in Spain and one in China. From those plants Adisseo delivers its finished products directly or indirectly to around 2,600 clients in the world. According to commercial agreements, it ships directly to customers or regional warehouses and from those regional warehouses to customers. Adisseo also has a dedicated warehouse in Shanghai for traded products that are sourced in China, grouped in this warehouse and shipped worldwide either to customers or its regional warehouses. Adisseo constantly adapts its distribution network according to the evolution of the demand to guarantee the best service possible to customers.
2016 Annual Report
31 / 169
e. Production capacity and operation situation
Applicable √ Not applicable Change in capacity production during the reporting period
√ Applicable Not applicable After completion of the second phase of its development in 2016, the Nanjing plant in China can produce liquid methionine at full capacity i.e. 140,000 tons p.a. This plant is totally integrated from sulphur and petrochemical raw materials to methionine allowing Adisseo to fully master the complete production process and reach full competitiveness of the site.
Adjustment and improvement on product line or product capacity structure
Applicable √ Not applicable
Description of unusual production halts
Applicable √ Not applicable
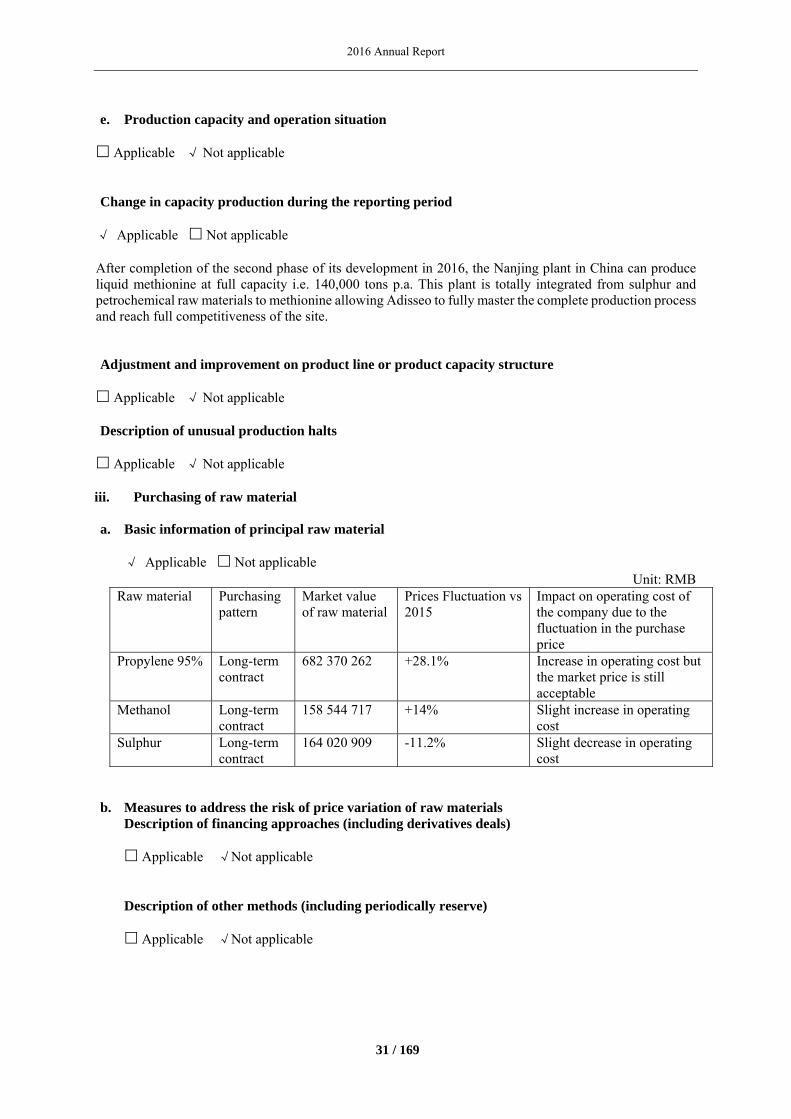
iii. Purchasing of raw material
a. Basic information of principal raw material √ Applicable Not applicable
Unit: RMB Raw material Purchasing
pattern Market value of raw material
Prices Fluctuation vs 2015
Impact on operating cost of the company due to the fluctuation in the purchase price
Propylene 95% Long-term contract
682 370 262 +28.1% Increase in operating cost but the market price is still acceptable
Methanol Long-term contract
158 544 717 +14% Slight increase in operating cost
Sulphur Long-term contract
164 020 909 -11.2% Slight decrease in operating cost
b. Measures to address the risk of price variation of raw materials Description of financing approaches (including derivatives deals)
Applicable √Not applicable Description of other methods (including periodically reserve) Applicable √Not applicable
2016 Annual Report
32 / 169
iv. Description of sales of product
a. Sales pattern
√ Applicable Not applicable Adisseo manages different kinds of contracts depending on the clients’ needs and the product. For methionine sales, Adisseo could propose spot sales, simple contract between 1 and 12 months with prices fixed at the order, or long-term contract over many years with fixed volumes and prices defined by quarter/month. b. Basic information of main business by subdivided sectors industry
√ Applicable Not applicable
Information on Adisseo’s main operations by business are specified above in Adisseo’s “Income and Cost analysis”. Refer to Section IV. II. Analysis of results of operations of main businesses in the reporting period. Adisseo’ industry is “Health and Nutrition”. Pricing strategy and price variation of principal product
√ Applicable Not applicable Historical pricing volatility in the methionine market has been attributable to exogenous factors like natural disasters or animal disease outbreaks and competitive behaviours from industry participants. Competitive behaviours within the industry and related new capacity announcements or start-ups could also affect the supply and demand balance. The pricing environment for vitamins is primarily driven by supply and demand dynamics. The primary end for vitamin A and E markets are animal feed. However, vitamin E is also driven by the human food, pharmaceutical and cosmetics markets. The pricing of our products is in most cases in-line with market pricing which can vary from region to region. Where possible, our prices also reflect a premium for the value-added support services that we provide to our customers. Our global pricing policy is implemented at three levels: global, regional and national. Our global pricing strategy is established by our Global business directors. The responsibility of the Regional business managers is to adapt this global pricing strategy according to the specific market and competitive environment of the countries under their responsibility. Regular reviews facilitate Adisseo ability to secure contracts with key customers at the right price and to seize profit-maximizing opportunities. A substantial number of our contracts across all our business lines are concluded on a quarterly basis with fixed pricing for such period. c. Basic information of main operating by sales channel
√ Applicable Not applicable Adisseo sales by distributors represent 7% of the total sales in 2016 (compared to 9% in 2015). The main part (93%) is performed directly by Adisseo own commercial network.
2016 Annual Report
33 / 169
Accounting policy of revenue recognition of every marketing channel
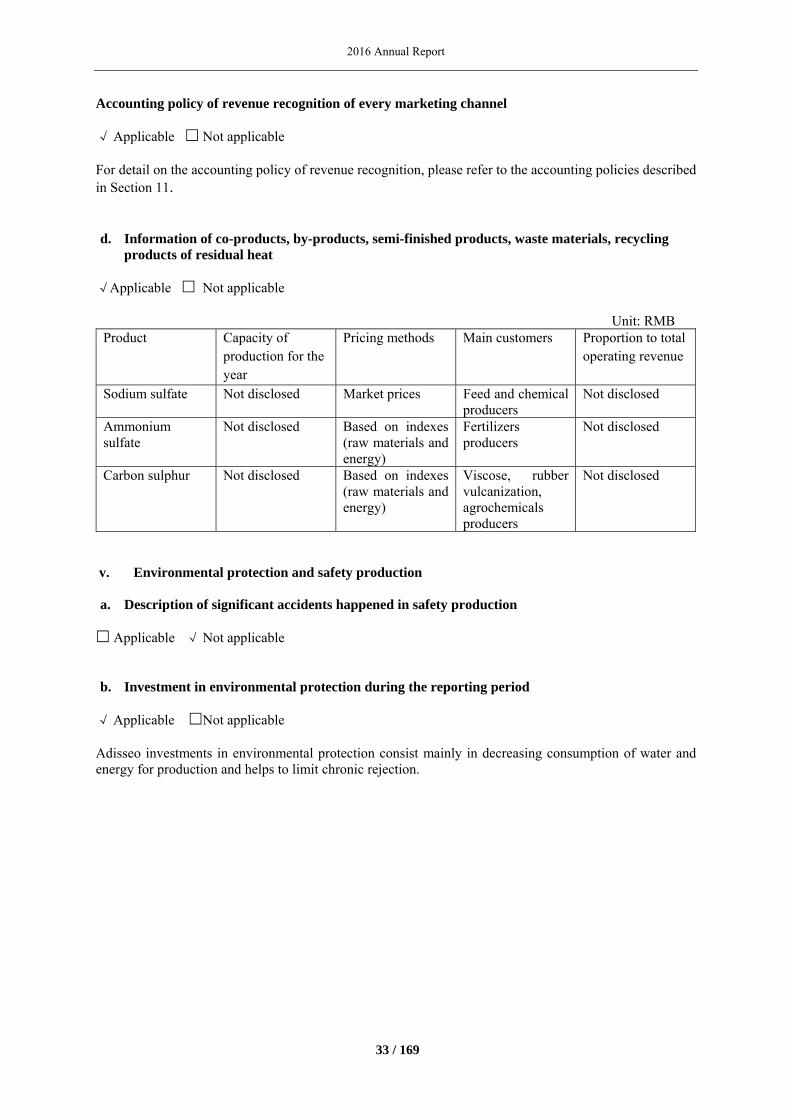
√ Applicable Not applicable For detail on the accounting policy of revenue recognition, please refer to the accounting policies described in Section 11. d. Information of co-products, by-products, semi-finished products, waste materials, recycling
products of residual heat
√Applicable Not applicable
Unit: RMB Product Capacity of
production for the year
Pricing methods Main customers Proportion to total operating revenue
Sodium sulfate Not disclosed Market prices Feed and chemical producers
Not disclosed
Ammonium sulfate
Not disclosed Based on indexes (raw materials and energy)
Fertilizers producers
Not disclosed
Carbon sulphur Not disclosed Based on indexes (raw materials and energy)
Viscose, rubber vulcanization, agrochemicals producers
Not disclosed
v. Environmental protection and safety production
a. Description of significant accidents happened in safety production
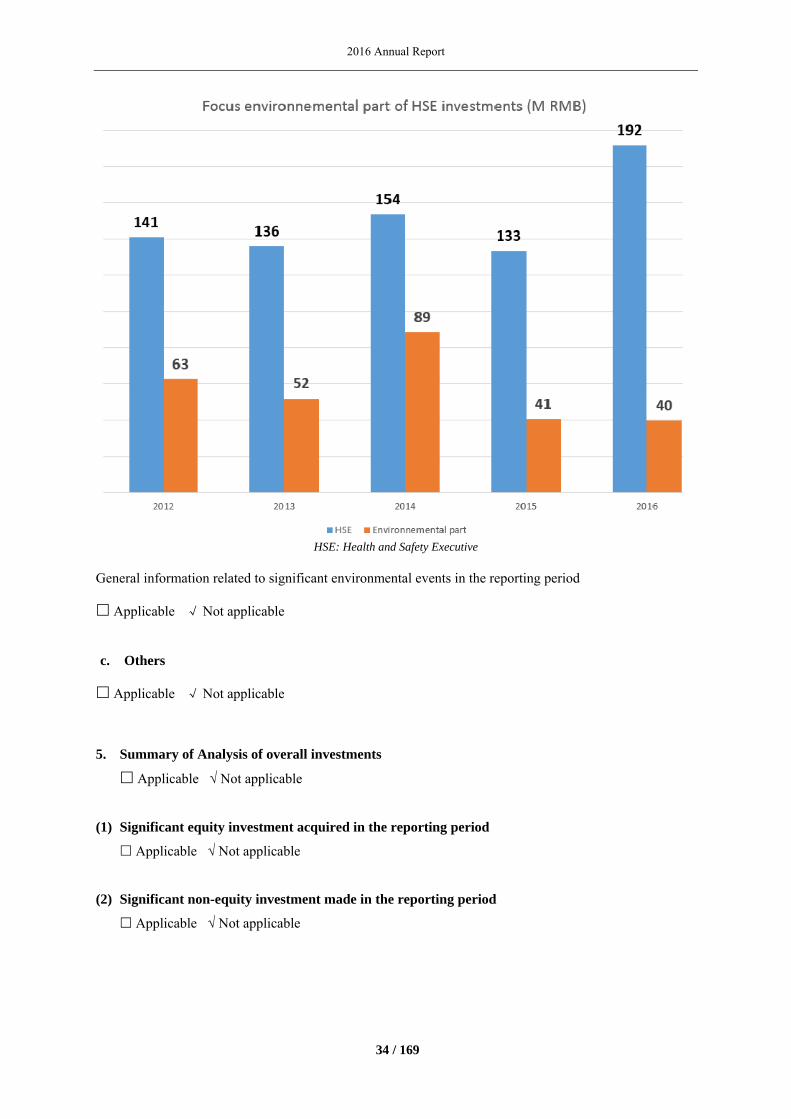
Applicable √ Not applicable b. Investment in environmental protection during the reporting period
√ Applicable Not applicable Adisseo investments in environmental protection consist mainly in decreasing consumption of water and energy for production and helps to limit chronic rejection.
2016 Annual Report
34 / 169
HSE: Health and Safety Executive
General information related to significant environmental events in the reporting period Applicable √ Not applicable
c. Others
Applicable √ Not applicable
5. Summary of Analysis of overall investments
Applicable √ Not applicable
(1) Significant equity investment acquired in the reporting period
Applicable √ Not applicable
(2) Significant non-equity investment made in the reporting period
Applicable √ Not applicable
2016 Annual Report
35 / 169
(3) Financial Assets measured at fair value
√ Applicable Not applicable Adisseo holds derivative financial instruments to manage the effect of changes in currency exchange rates. Derivatives are not used for speculative purposes. For most of those transactions, the Group applies cash flow hedge accounting and documents, at the inception of the hedge, the type of hedging relationship, the hedging instruments, the nature and the term of the hedged item. For further detail, please refer to paragraph 49 “Hedging” in Section 11.
6. Sales of Major Assets and Equity
Applicable √ Not applicable
7. Analysis of companies controlled by or invested in the Company
The following figures are based on financial information before elimination of the entities.
Subsidiaries representing more than 10% of the Group’s consolidated net profit:
Company Name Adisseo France SAS BANC Nanjing Business R&D, production and
distributionR&D, production and
distributionRevenue 9,027,046,741 1,622,257,715
Adisseo France SAS is an important subsidiary of Adisseo: the main businesses of this company are the R&D, the manufacturing as well as the distribution of protected methionine for ruminants and vitamin A produced at the Commentry plant, powder methionine produced at the Commentry and the Roussillon plants, upstream products of methionine at the Les Roches plant and also of AT88 produced at Burgos plant (Spain). BANC Nanjing is the second entity within Adisseo and deals with a plant producing liquid methionine.
8. Structured entities controlled by the Company
Applicable √ Not applicable
Company Name
Registered/Subscribed Capital
Business Total assets Net assets Net profit Change
Adisseo France SAS
EUR 83,417,000 R&D, production and distribution
9,652,743,128 5,619,248,566 1,669,351,461 NA
BANC Nanjing
RMB 1,833,000,000
R&D, production and distribution of other products
4,072,013,000 2,646,976,715 331,006,715 NA
Adisseo Life Science
USD 700,000 Distribution & Sourcing
767,216,893 487,038,758 66,988,758 NA
Adisseo USA Inc.
USD 3,139,000 Distribution
385,065,872
272,814,879 67,090,587 NA
Adisseo Brazil BRL 1,987,106 Distribution 276,523,200 -19,428,916 -29,530,561 NA
2016 Annual Report
36 / 169
III. Board of Directors’ Discussion and Analysis of the Company’s Future Development
1. Economic trends in the industry
√ Applicable Not applicable
Global Economic
The main global economies have implemented positive economic policies to stimulate economic growth. Employment rate and inflation are maintained within a reasonable range. The European and U.S. economies have slowly recovered. Emerging markets, including China, India, are expected to grow.
Emerging Economies Present Growth Opportunities in Protein Demand
The continuous global growth, particularly that of the emerging economies such as China and India, has driven urbanization and continuous improvement of people’s living standards and has promoted per person consumption of high protein foods (poultry, beef, pork, fish etc.).
2. Development strategy of the Company
√ Applicable Not applicable The primary Adisseo businesses are as follows: research, development, production and sale of feed additives for animal nutrition. The Company bases its growth’s strategy on four levers:
- Emerging markets footprint: 2 effective methionine production platforms, one in Europe and one in China, and a sales network with a focus on high-growth emerging markets (5 global sales and services divisions : Europe, China, Asia, North America, South America)
- Innovation: Seven R&D centers focused on several different areas such as analysis, nutrition, formulation, biotechnology, chemical processes, chemistry, formulation and processes to serve 3 axis:
o Service improvement: an ecosystem of continuous improvement, with direct feedback from customers and third-party experts such as universities and external nutritionists, intimate collaboration with customers to discover their needs, thereby exploring new opportunities
o Product development: Sustainable operation philosophy and track record of bringing products to market attract co-development from top academic and research institutions. Three major research directions: antibiotics replacement, reduction of harmful outputs, and yield improvement/enhanced cost efficiency
o Process improvement: Sustainable investment in projects aiming to improve production process and technologies to maintain competitiveness Breakthrough process and continuous improvements of daily methionine
production capacity, on top of all the debottlenecking projects, thanks to the involvement of both R&D teams and manufacturing teams
Improvement of vitamin A production yield Optimisation in Rovabio production costs
o To strengthen its position, Adisseo plans to launch a new product every year. Selisseo®, a specialty product based on selenium and a new thermostable enzyme, Advance®, in 2014, a new Non-Starch Polysaccharide enzyme, in 2015 and Alterion®, a new probiotic, in 2016.
- Industrial investments: Adisseo’s investment strategy enabled significant gains in methionine market shares in the last 3 years and strong value creation. Adisseo is actively preparing to grow in
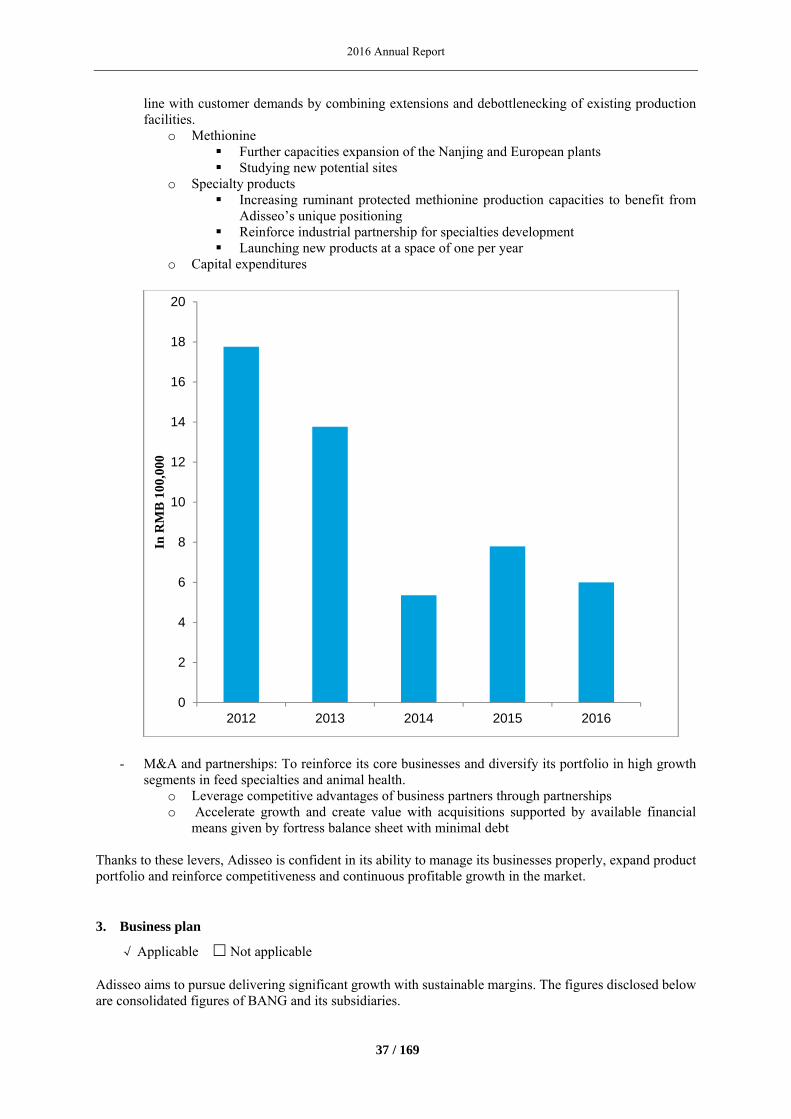
2016 Annual Report
37 / 169
line with customer demands by combining extensions and debottlenecking of existing production facilities.
o Methionine Further capacities expansion of the Nanjing and European plants Studying new potential sites
o Specialty products Increasing ruminant protected methionine production capacities to benefit from
Adisseo’s unique positioning Reinforce industrial partnership for specialties development Launching new products at a space of one per year
o Capital expenditures
- M&A and partnerships: To reinforce its core businesses and diversify its portfolio in high growth segments in feed specialties and animal health.
o Leverage competitive advantages of business partners through partnerships o Accelerate growth and create value with acquisitions supported by available financial
means given by fortress balance sheet with minimal debt Thanks to these levers, Adisseo is confident in its ability to manage its businesses properly, expand product portfolio and reinforce competitiveness and continuous profitable growth in the market.
3. Business plan
√ Applicable Not applicable Adisseo aims to pursue delivering significant growth with sustainable margins. The figures disclosed below are consolidated figures of BANG and its subsidiaries.
0
2
4
6
8
10
12
14
16
18
20
2012 2013 2014 2015 2016
In R
MB
100
,000
2016 Annual Report
38 / 169
Based on the Profit Forecasting Compensation Agreement signed for the Major Asset Restructuring, Adisseo disclosed a “committed net profit with deduction of non-recurring gains and losses” of EUR 106,978,590 in 2016 and EUR 106,506,110 in 2017 (i.e. RMB 785,372,621 and RMB 781,903,956 respectively using the EUR/CNY average exchange rate of 7.3414 for 2016). The net profit with deduction of non-recurring gains and losses amounts to RMB 2,296.95 million which was in excess by RMB 1,511.58 million in comparison with the committed profit forecast amount for 2016, i.e. RMB 785.37 million as set forth in the Profit Forecasting Compensation Agreement. Total sales volume is expected to increase across almost all product lines driven by the expected growth in global demand and additional methionine capacities linked to the debottlenecking of existing production plants. Developments in Research & Development and Capital expenditures should lead Adisseo to develop its specialty products and to launch new products. Adisseo plans for capital expenditure in the upcoming years mainly consist of:
Additional enhancement of the Health, Safety and Environment policies;
Further methionine capacities expansion of the Nanjing and European plants;
Studying new potential sites;
Increasing ruminant protected methionine production capacities to benefit from Adisseo’s unique positioning.
The Business Plan may not be considered as a guarantee of profitability as committed to the investors.
4. Possible risks in the future
(1) Risks related to the cyclical fluctuation of the global macro economy
As an international company, Adisseo provides products and services to around 2,600 customers in over 140 countries and regions. Its performance, financial position and future will be affected by the global macro economy. Although the global economy has demonstrated signs of slow recovery, there exists significant disparity among the recovery process for each economic actor. The debt crisis, trade imbalances, exchange rate fluctuation and other issues also increase the uncertainty of such recovery. The fluctuation of the global economy will increase fluctuation in Adisseo business.
(2) Risks related to imbalance of supply and demand
The methionine market is affected by global methionine production capacities, the imbalance between supply and demand, the availability and pricing of raw materials and various factors such as the global macro economy.
(3) Risks related to market competition
Adisseo faces competition from large and well-known companies with strong financial positions as well as
2016 Annual Report
39 / 169
competition from smaller companies in the regional or local markets. Adisseo has taken steps to improve its competitiveness, including tightening cost control, improving production technologies, providing value-added services and increasing capacities in the Nanjing and European plants.
(4) Risks related to cross-border operations
As a global producer of nutritional feed additives, Adisseo is implementing and is operating businesses all over the world. Cross-border operations are exposed to the risks related to changes in the market, economy, geopolitics, demographics, public consensus, exchange rates, trade barriers, exchange control, regulatory, tax regimes, restrictions on foreign investment and wars in each region. Although Adisseo has extensive experience in operating a global business, changes in policies and legal systems of the countries in which its assets and business are located may affect the operation of its business in such countries. Investors should be aware of the risks associated with Adisseo’s cross-border operations.
(5) Risks related to environmental protection policies
As a feed additives producer, Adisseo is subject to strict regulation and monitoring by governmental authorities with respect to discharge of sewage water, exhaust gas and solid wastes. As the public becomes more environmentally aware, if countries in which Adisseo operates amend the current environmental laws and regulations or alter the current pollutant discharge standards, the Company may need to incur additional costs and expenses to establish new environmental protection facilities.
(6) Risks related to hazardous chemicals
Adisseo’s complex production process involves many hazardous chemicals that require special production, transportation and storage facilities. In addition, production process and research and development processes generate waste gas, liquid and solid waste. Even though Adisseo is committed to Health, Safety and Environment system, and has adopted prudent safety measures and exercises grave precautions in accordance with relevant laws, regulations and administrative measures, there is risk that leaked hazardous chemicals, emission of waste gas, liquid and solid waste may exceed the relevant standards. Adisseo will assume serious civil or criminal liabilities and may be liable to pay financial compensation, which may materially and adversely affect its business, financial position and results from operations.
(7) Risks related to raw materials and energy
Raw materials used by Adisseo mainly include propylene, sulphur, methanol, ammonia and natural gas. Adisseo has a limited number of suppliers for such materials due to the fact that such raw materials are not easily transportable. If the suppliers of fail to supply such raw materials, if the prices of such raw materials fluctuate significantly, or if Adisseo fails to acquire sufficient raw materials at a reasonable price, the Company’s business, financial position, and results from operations may be materially and adversely affected.
2016 Annual Report
40 / 169
(8) Risks related to significant decline of performance
Competition in the nutritional feed additives industry has intensified in recent years. Adisseo results from operations could be adversely affected in the future years.
(9) Risks related to product research and development, technology upgrade and alternative methionine production technologies
In order to maintain their respective competitiveness, Adisseo, as well as its competitors, continue to invest in innovation, launch innovative products to meet the customers’ needs and develop new production technologies that are more efficient and competitive. Product R&D projects and projects aiming to improve production process and technologies may be terminated as a result of factors such as changes in market conditions, changes in technology, changes in government policies. If Adisseo fails to continuously launch new products or improve its production process, or if Adisseo’s competitors successfully launch competitive products or improve their production process faster than Adisseo, its’ market position will be eroded, which may materially and adversely affect the business, financial positions and results from operations of Adisseo. In addition, application of alternative methionine production technologies (such as the fermentation approach) may adversely affect the production and operations of Adisseo.
(10) Risks related to Human Resources
Talents with industry expertise are a key competitive advantage of Adisseo and essential to Adisseo’s market position and business operations. If Adisseo fails to retain or attract excellent talents with industry expertise in the future, it may face talent drain and may experience a bottleneck in its future business development. Therefore, Adisseo constantly develops and improves its employee incentive schemes, training programs and recruitment programs to effectively control such risks.
(11) Risks related to the diseases outbreak in poultry or livestock
There have been outbreaks of bird flu, foot-and-mouth disease, mad cow disease and swine flu in recent years. Such outbreaks of diseases that adversely affect poultry or livestock may adversely affect the poultry and livestock populations, consumers’ perceptions about certain protein products and demand for the products used as nutritional ingredients for animal feed. Frequent outbreaks of poultry or livestock diseases around the world may materially and adversely affect the business, financial position and results of operations of the Company.
(12) Risks related to improper lay-out of production plan
Adisseo’s performance may be restrained by its production capacity. Adisseo has made progressive investments to increase its production capacities and proactively manage its inventory. However, customers’ orders may not be fulfilled in a timely manner as a result of inappropriate production planning, malfunction of the production facilities, repairs of the production facilities or failure to convert the new production capacity into actual production. Failure to meet customers’ needs may damage Adisseo’s reputation and its relationship with its customers, which may result in customers choosing its competitors’ products. This will adversely affect future sales of the Company.
2016 Annual Report
41 / 169
Furthermore, if Adisseo over-estimates the future demand of its products and increases its production capacity based on such estimates but if such future demand fails to materialize, Adisseo’s business, financial condition and results of operations could be materially and adversely affected.
(13) Risks related to exchange rate
The reporting currency of the Company’s consolidated financial statements is the Chinese Renminbi, or RMB. The majority of Adisseo’s production, operation and sales are performed outside of China, and day-to-day transactions are mainly carried out in EUR and USD. Exchange rate risks mainly include risks associated with translating foreign currencies for the purpose of conducting day-to-day transactions and risks associated with translating foreign currencies into RMB when preparing Adisseo’s financial statements. Fluctuation of exchange rates may expose the Transaction to exchange rate risk and may adversely affect the financial position and results from operations of the Company. BANG (subsidiary held at 85% by the Company, functional currency in EUR) issued, on 27 March 2014, 400,000,000 preferred shares with nominal value of 1 US Dollar per share. Their value at this date, translated with the EUR/USD rate of 1.37 is EUR 292,248,118, categorized as an equity instrument of BANG. The preferred shares are measured at this historical rate of the 27th of March 2014. It has been agreed with these shareholders that BANG can decide to repurchase these preferred shares at nominal value (i.e. USD 400 million), which exposes BANG to a foreign currency exchange risk EUR/USD. As of December 31, 2016 with a EUR/USD rate of 1.05, this exposure represents a potential net equity loss of EUR 90,417,146 (RMB 660,659,999 with a EUR/CNY rate of 7.3068). In BAC consolidated financial statements in RMB, the historical value of these preferred shares amounts to RMB 2,416,862,000. As of December 31 2016 with a EUR/CNY rate of 7.31, the potential net equity loss of RMB 660,659,999 in EUR/USD will be partly offset by a potential gain of RMB 281,463,451 due to appreciation of CNY. As of December 31 2016, the net exposure on shareholders’ equity amounts to a potential loss of RMB 379,196,548.
(14) Risks related to customer credit
Adisseo is exposed to the credit risk of its customers. While Adisseo seeks to manage such exposure through a number of measures such as establishing customer accounts, setting credit limits for customers, obtaining deposits and security, and profiling the customers’ credit risk, there is no assurance that such risk will be entirely eliminated.
(15) Risks related to the potential changes in tax and custom duties
As an international company, Adisseo may be investigated by the tax authorities in the relevant countries with respect to its tax matters from time to time. Tax audits or investigations may result in Adisseo losing its tax benefits, exemptions, other tax incentives or favorable tax arrangements with the tax authorities, which may subject Adisseo to a higher effective tax rate. Although Adisseo has not had any material tax-related issues so far, there is no assurance that the provisions made by Adisseo will be sufficient; or that Adisseo will not be subject to a higher tax rate.
2016 Annual Report
42 / 169
(16) Risks related to break-down of information system
Adisseo’s operations, including research & development, production, finance, inventory, delivery and product tracking are highly dependent on its information technology systems. Any failure of the information systems to perform as anticipated, including break-down, any malicious attacks on its information technology systems, virus attacks or malfunction of the information technology system may seriously damage Adisseo’s logistics, sales and customer service systems. Given that Adisseo has adopted a centralized logistics system which integrates the functions of handling purchase orders, storage, logistics management, invoicing, deliveries and payment collection, any disruption to this centralized logistics system would cause Adisseo difficulties in performing these functions. From 2008, Adisseo has installed programs and technologies and made disaster recovery plans to mitigate the risk arising from potential unauthorized access and dissemination or loss of data. However, any such failure or disruption of its information technology systems may have a material adverse effect on Adisseo’s business, financial position and results of operations.
(17) Product liability claims and litigation
During the normal course of its business, Adisseo may be subject to actual or threatened legal proceedings, arbitration or administrative penalties arising from disputes with respect to product liability or patent and other intellectual property rights. Such disputes, legal proceedings or arbitration may adversely affect Adisseo’s operations and reputation. If any of the judgments or arbitral awards or decisions of the regulatory authorities is made against Adisseo, Adisseo may need to recall its products or even change the formula of its products.
(18) Risks related to insurance policy coverage
Per industry standard, Adisseo currently has insurance coverage for operations, product quality, inventory, transportation, environment, finance, senior management, employees, industrial accidents, IT system, etc., but Adisseo may be subject to liabilities for which it does not have adequate or any insurance, or that cannot be insured at all, thereby resulting in claims not being honored to the full extent of the losses or damages suffered.
(19) Risks related to intellectual property
Adisseo benefits from protection of its intellectual property rights afforded by the laws and regulations of the countries in which it operates. However, there is no assurance that the steps Adisseo has taken will be sufficient to protect its intellectual property rights when such rights are challenged, infringed or abused by a third party. Furthermore, Adisseo operates in many countries some of which may provide less protection for intellectual property rights against infringement than others. As a result, Adisseo may be disadvantaged in certain markets. In addition, Adisseo may be subject to claims brought by a third party in connection with its infringement of such third party’s intellectual property rights.
(20) Risks related to labor disputes
Adisseo operates in many countries around the world. Its centers of operations and production bases are
2016 Annual Report
43 / 169
mainly located in France, Spain and China where labor laws are relatively stringent. When making decisions in relation to production, operation or financing, Adisseo must notify, and consult with, the union representative or relevant committee or seek consent of the union representative or relevant committee. Strict labor laws and complex consultation process may limit the flexibility of Adisseo’s decision-making process and its ability to react to the changes in market conditions. Employees of Adisseo may disagree with Adisseo on certain matters which may result in disputes and litigation between the employees and the employer, strikes and boycott by employees. This may materially and adversely affect the businesses, financial position and results from operations of Adisseo. In addition, Adisseo’s suppliers may also be subject to strikes or claims brought about by their own employees, which may in turn affect the ordinary operations of Adisseo.
(21) Risk related to cross-border oversight
Of Adisseo’s 24 subsidiaries, 21 are located outside China, over 80% of its sales and a significant part of its production are outside China. Adisseo fails to properly sustain those oversight and internal control policies to ensure the Group’s normal operations, the Company’s business, financial position, and results from operations may be materially and adversely affected.
(22) Risks related to material lawsuits, arbitration and administrative penalties
In its day-to-day operations, Adisseo might be involved in material lawsuits, arbitration, administrative penalties or other disputes due to products, labor, taxes and other such matters, which may damage Adisseo’s operations and reputation. Adisseo is improving its processes in accordance with the requirement of a listed company’s corporate governance and process, and, with the professional assistance of advisors such as lawyers.
IV. Explanation of those non-disclosure parts due to national security or commercial confidentiality reasons
√ Applicable Not applicable For confidentiality purpose, Adisseo does not disclose information related to produced volumes by products during the reporting period, neither costs paid for raw materials. The amount of production volumes disclosed relates to production capacity and the cost of raw materials disclosed relates to market prices. Financial information by product is based on segment information (Performance products, Specialty products and Other products).
2016 Annual Report
44 / 169
Section 5 Significant Matters
I. Profit distribution or capitalization of reserves
1. Formulation, performance or adjustment of cash profit distribution policy
Policy for profit distribution
Adisseo has set up a profit distribution policy. The articles of association of the Company have clearly regulated the basic principal, the specified policy as well as the deliberation procedure related with the profit distribution plan. The Company gives priority to cash dividends as a profit distribution method and the Company will distribute the profit in cash no less than 30% of the distributable profit in the consolidated statements annually except under specific conditions as specified in the AoA. The Company continues to implement sustainable, stable and proactive profit distribution policies and will, with respect to the Company’s business, policy guidance and market consensus, continue to enhance the efficiency of its operations, enhance the transparency of implementing such distribution policies and safeguard the interests of all shareholders of the Company. The formulation and revision of the Company's profit distribution policies is strictly in compliance with the rules and procedures of the company. The standard and proportion of dividends distribution is clear and definitive and its deliberation process as well as its mechanism has also well established.
Policy for profit distribution in the reporting period
The Board of the Company as of April 15th, 2016 has proposed an interim dividend distribution for mid-term year 2016 amounting to RMB 442,513,710.05. It has been approved by the General Shareholders’ Meeting on May 20th, 2016. On June 2nd, 2016, the Company made announcement of the dividend implementation. The Company has completed the interim dividend distribution on 8th June 2016.
2. The Company’s plan or preliminary plan for dividend distribution, plan or preliminary plan for capitalization of reserve in the latest three years (including the reporting period)
Unit: Yuan Currency: RMB Year for dividend distribution
Bonus issue every 10 shares
Cash dividend every 10 shares(tax included)
Shares convert every 10 shares
Amount of cash dividends (tax included)
Net profit for the year attribute to common shareholders
% compared to net profit attributed to shareholders (%)
2016 0 3.93 0 1,053,987,200.29 1,865,346,347 56.5%2015 0 0 0 0 1,528,651,062 02014 0 0 0 0 1,475,377,366 0
The net profit listed above for the year 2014 has been restated, as presented in Section VII. The main financial data for the latest three reporting periods is presented in Section 2- “Company Profile and Financial Highlights”. Preliminary Plan for 2016 dividend: As audited by KPMG Huazhen LLP, the profit attributable to the shareholders of the Company for the year ended company 31st December 2016 amounted to RMB 1,865,346,347 and the accumulated profits available for distribution at parent company level as at 31st December 2016 amounted to RMB 624,360,836. Therefore, in order to share the Company’s operation
2016 Annual Report
45 / 169
achievements with all shareholders, as well as enabling the Company for further development in consideration of the Company’s actual operation situations, the Company proposes that: based on the Company’s total share capital of 2,681,901,273 shares dated 31, December, 2016, the Company will distribute to all shareholders, cash dividend of RMB 2.28 yuan per 10 shares (inclusive of tax). The total amount of the cash dividends to be distributed is RMB 611,473,490.24 yuan. The above proposal is still subject to the approval of 2016 Annual General Shareholders’ Meeting.
3. Cases including the repurchase of shares for the cash distribution
Applicable √ Not applicable
4. When the Company generates profits in the reporting period and has positive undistributed profits, although no profit distribution is planned,the Company shall disclose the reasons and the purpose and plans for use of the undistributed profits in detail.
Applicable √ Not applicable
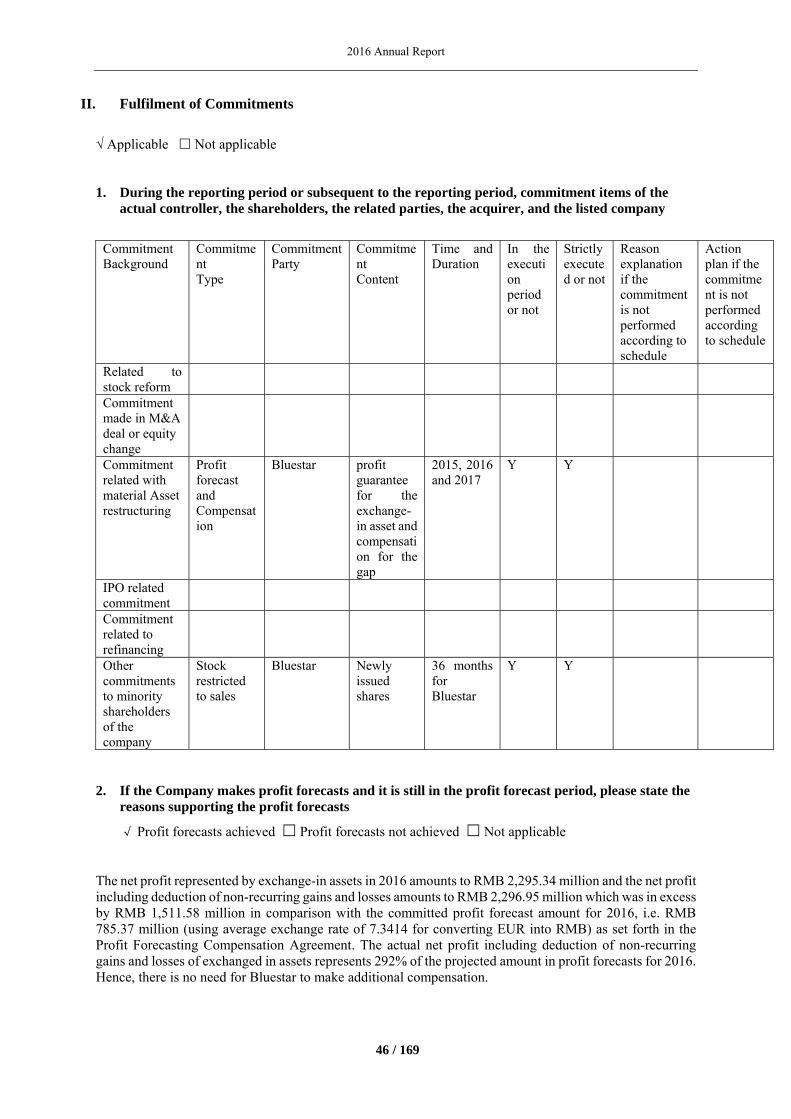
2016 Annual Report
46 / 169
II. Fulfilment of Commitments
√ Applicable Not applicable
1. During the reporting period or subsequent to the reporting period, commitment items of the actual controller, the shareholders, the related parties, the acquirer, and the listed company
Commitment Background
Commitment Type
CommitmentParty
Commitment Content
Time and Duration
In the execution period or not
Strictly executed or not
Reason explanation if the commitment is not performed according to schedule
Action plan if the commitment is not performed according to schedule
Related to stock reform
Commitment made in M&A deal or equity change
Commitment related with material Asset restructuring
Profit forecast and Compensation
Bluestar profit guarantee for the exchange-in asset and compensation for the gap
2015, 2016 and 2017
Y Y
IPO related commitment
Commitment related to refinancing
Other commitments to minority shareholders of the company
Stock restricted to sales
Bluestar Newly issued shares
36 months for Bluestar
Y Y
2. If the Company makes profit forecasts and it is still in the profit forecast period, please state the reasons supporting the profit forecasts
√ Profit forecasts achieved Profit forecasts not achieved Not applicable
The net profit represented by exchange-in assets in 2016 amounts to RMB 2,295.34 million and the net profit including deduction of non-recurring gains and losses amounts to RMB 2,296.95 million which was in excess by RMB 1,511.58 million in comparison with the committed profit forecast amount for 2016, i.e. RMB 785.37 million (using average exchange rate of 7.3414 for converting EUR into RMB) as set forth in the Profit Forecasting Compensation Agreement. The actual net profit including deduction of non-recurring gains and losses of exchanged in assets represents 292% of the projected amount in profit forecasts for 2016. Hence, there is no need for Bluestar to make additional compensation.
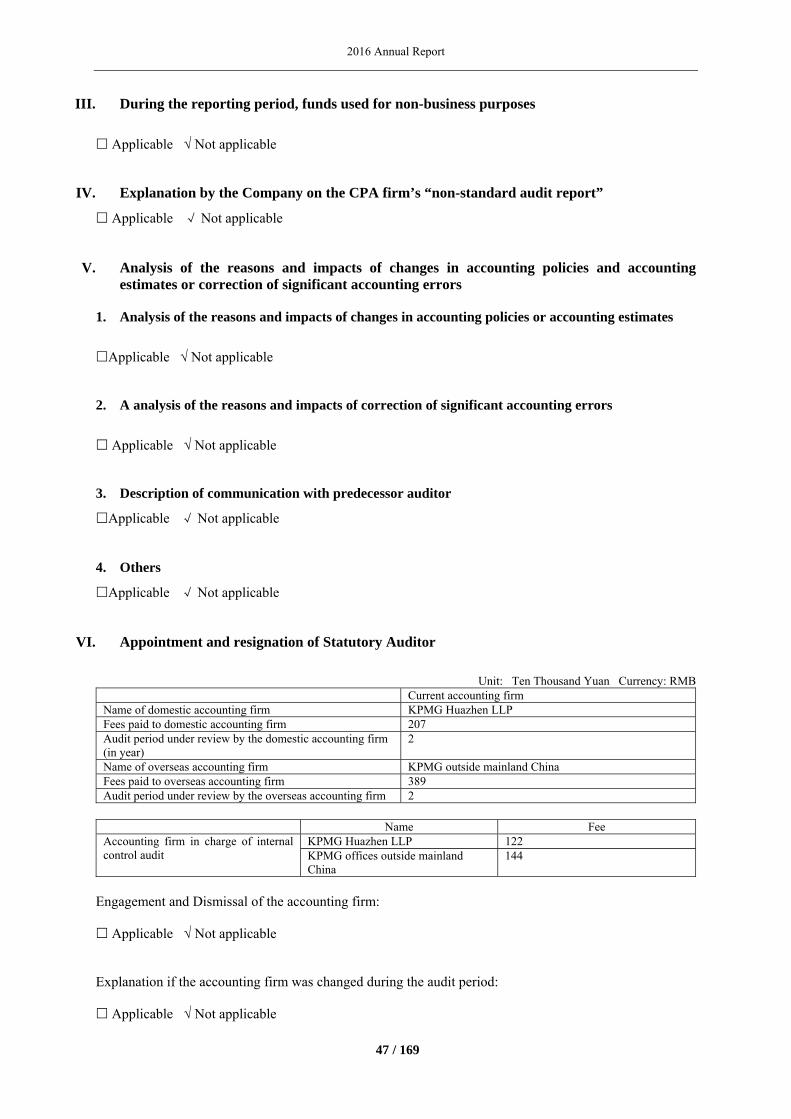
2016 Annual Report
47 / 169
III. During the reporting period, funds used for non-business purposes
Applicable √ Not applicable
IV. Explanation by the Company on the CPA firm’s “non-standard audit report”
Applicable √ Not applicable
V. Analysis of the reasons and impacts of changes in accounting policies and accounting estimates or correction of significant accounting errors
1. Analysis of the reasons and impacts of changes in accounting policies or accounting estimates
Applicable √ Not applicable
2. A analysis of the reasons and impacts of correction of significant accounting errors
Applicable √ Not applicable
3. Description of communication with predecessor auditor
Applicable √ Not applicable
4. Others
Applicable √ Not applicable
VI. Appointment and resignation of Statutory Auditor
Unit: Ten Thousand Yuan Currency: RMB
Current accounting firm Name of domestic accounting firm KPMG Huazhen LLP Fees paid to domestic accounting firm 207 Audit period under review by the domestic accounting firm (in year)
2
Name of overseas accounting firm KPMG outside mainland China Fees paid to overseas accounting firm 389 Audit period under review by the overseas accounting firm 2
Name Fee Accounting firm in charge of internal control audit
KPMG Huazhen LLP 122 KPMG offices outside mainland China
144
Engagement and Dismissal of the accounting firm: Applicable √ Not applicable Explanation if the accounting firm was changed during the audit period: Applicable √ Not applicable
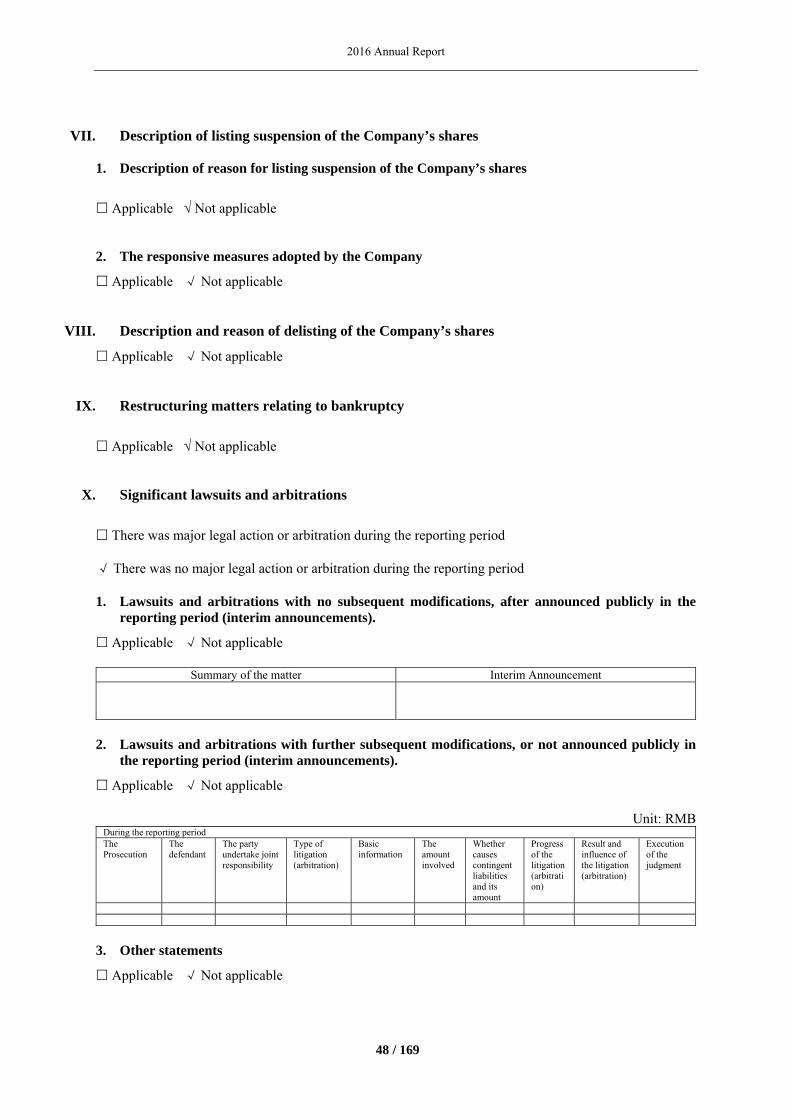
2016 Annual Report
48 / 169
VII. Description of listing suspension of the Company’s shares
1. Description of reason for listing suspension of the Company’s shares
Applicable √ Not applicable
2. The responsive measures adopted by the Company
Applicable √ Not applicable
VIII. Description and reason of delisting of the Company’s shares
Applicable √ Not applicable
IX. Restructuring matters relating to bankruptcy
Applicable √ Not applicable
X. Significant lawsuits and arbitrations
There was major legal action or arbitration during the reporting period √ There was no major legal action or arbitration during the reporting period
1. Lawsuits and arbitrations with no subsequent modifications, after announced publicly in the reporting period (interim announcements).
Applicable √ Not applicable
Summary of the matter Interim Announcement
2. Lawsuits and arbitrations with further subsequent modifications, or not announced publicly in the reporting period (interim announcements).
Applicable √ Not applicable
Unit: RMB During the reporting period The Prosecution
The defendant
The party undertake joint responsibility
Type of litigation (arbitration)
Basic information
The amount involved
Whether causes contingent liabilities and its amount
Progress of the litigation (arbitration)
Result and influence of the litigation (arbitration)
Execution of the judgment
3. Other statements
Applicable √ Not applicable
2016 Annual Report
49 / 169
XI. Judgments or fines rendered against the listed Company and its Directors, Supervisors, Senior executives, Controlling shareholders, Actual controller or Purchaser
Applicable √ Not applicable In the reporting period, no judgments or fines were rendered against the listed Company and its Directors, Supervisors, Senior executives, Controlling shareholders, or Actual Controller.
XII. Credit status of the company, its controlling shareholder and actual controller in the reporting period
In the reporting period, there were no such cases in which the Company, or its controlling shareholder or the actual controller, failed to perform the effective judgement of a court or failed to repay a significant amount of debts due.
XIII. Implementation of equity incentive plan, employee stock, ownership plan, or other staff incentive measures in the current reporting period
1. Incentive measures with no subsequent modifications, after announced publicly in the reporting period (interim announcements).
Applicable √ Not applicable
2. Incentive measures with further subsequent modifications, or not announced publicly in the reporting period (interim announcements).
Descriptions of equity incentive measures Applicable √ Not applicable Others: Applicable √ Not applicable Employee stock Applicable √ Not applicable Other incentive measures √ Applicable Not applicable In order to help attract and retain “highly qualified” executives with expertise and experience, the Company has set up a long-term incentive plan that can lead to global growth and to motivate executives to create long-term shareholder value and achieve interim milestones. For details, please refer to related footnotes No. 20 in Section 11.
2016 Annual Report
50 / 169
XIV. Significant related-party transactions
1. Related-party transactions in association with daily transactions
(1) Related- party transactions, with no subsequent modifications, announced publicly in the reporting period (interim announcements).
Applicable √ Not applicable
(2) Related party transactions, with further subsequent modifications, announced publicly in the reporting period (interim announcements).
Applicable √ Not applicable
(3) Undisclosed items in interim announcement
Applicable √ Not applicable
2. Related-party transactions in association with the purchase and sale of assets
(1) Matters disclosed in interim announcement and with no progress or change upon subsequent implementation
Applicable √ Not applicable
(2) Related- party transactions announced in interim announcements and with further subsequent changes.
Applicable √ Not applicable
(3) Undisclosed items in interim announcements
Applicable √ Not applicable
(4) Please disclose the actual result generated during the reporting period if it involves a performance guarantee
The net profit with deduction of non-recurring gains and losses realized by exchange-in assets in 2016 amounts to RMB 2,296.95 million which was in excess by of RMB 1,511.58 million in comparison with the projected profit forecast amount for 2016, i.e. RMB 785.37 million (using average exchange rate of 7.3414 for converting Euro into RMB) as set forth in the Profit Forecasting Compensation Agreement.
2016 Annual Report
51 / 169
3. Related Party transactions in association with external investments
(1) Matters disclosed in interim announcement and with no progress or change upon subsequent implementation
Applicable √ Not applicable
(2) Related- party transactions announced in interim announcements and with further subsequent changes.
Applicable √ Not applicable
(3) Undisclosed items in interim announcements
Applicable √ Not applicable
4. Related Party transactions in association with loans and debt
(1) Matters disclosed in interim announcement and with no progress or change upon subsequent implementation
Applicable √ Not applicable
(2) Related- party transactions announced in interim announcements and with further subsequent changes.
Applicable √ Not applicable
(3) Undisclosed items in interim announcements
Applicable √ Not applicable
5. Other Related Party transactions
Applicable √ Not applicable
XV. Major Contracts and Implementation
1. Custody, contracting, leasing
(1) Entrusted Assets
Applicable √ Not applicable
2016 Annual Report
52 / 169
(2) Subcontracted Assets
Applicable √ Not applicable
(3) Leasing Assets
Applicable √ Not applicable
2. Guarantees
Applicable √ Not applicable
3. Cash management entrusted to third parties
(1) Entrusted Funds Investment
Applicable √ Not applicable
(2) Entrusted Loans
Applicable √ Not applicable
(3) Other Investments in funds and derivatives
Applicable √ Not applicable
4. Other major contracts
Applicable √ Not applicable
XVI. Description of Other Important Matters
√Applicable Not applicable The information on changes in the Company’s directors, supervisors or managers has been disclosed in Section 8- “Directors, Supervisors, Senior Managements and Employees”.
XVII. Active Implementation of Social Responsibilities
1. Description of anti-poverty work
Applicable √ Not applicable
2. Fulfilment of social responsibility
√Applicable Not applicable During the reporting period, the Company has implemented its social responsibilities actively, observed
2016 Annual Report
53 / 169
related laws and rules, and endeavored to operate the business in a credit-worthy and sincere manner. The Company is aiming to achieve a win-win solution among society, shareholders, creditors, employees, and suppliers, etc., to balance its business development and social responsibility undertakings. Within Adisseo, sustainable development is an ever-present direction to which each Adisseo employee makes a daily commitment. We are now part of an internationally recognized reference framework, the Global Reporting Initiative (G4 Guidelines; information available on www.globalreporting.org), which allows us to measure and continually improve our performance. Now, the company is issuing sustainable development report on annual basis. Please refer to the Company’s website for details. To guarantee a sustainable growth method that harmoniously balances human protection, economic development and the preservation of the environment, the Company is:
• Keeping safety as the number one priority in all activities. The Company has one constant goal: zero accident. Six golden rules and an annual safety day have been adopted to improve safety performance. The Company ensures all actions and activities work towards improving the safety of our employees, our customers, our production units, our products, transport of products, as well as protection of the environment.
• Investing in the future. The Company has an active investment policy for its international industrial development and for innovation. Over the past several years, Adisseo has significantly invested to sustain the growth of its global industrial tool and to accelerate innovation regarding products, services, and processes, to achieve customers, employees, and shareholders satisfaction, and more generally civil society expectations.
• Implementing Corporate Social Responsibility, which has resulted in a number of initiatives in the areas of governance, staff development, awareness modules , training, creation of multi-cultural teams, and development of the Company’s corporate values. The Company listens to its employees and considers their satisfaction to be a key indicator in its success. Employee satisfaction is measured and action plans are implemented after having listened carefully to their expectations. The Company is now focusing on facilitating training, mobility, health and well-being at work. The Company is also engaged with the communities around it and lends its support to education and assistance for the most disadvantaged or in protection of biodiversity. Specific SD plan has been developed to 1-monitor water and energy consumptions, 2-optimize energy efficiency, 3-identify carbon footprint for Adisseo managed Supply Chain.
3. Environmental issues of listed companies and their subsidiaries declared as major pollutant discharge units by the competent environmental protection authorities
Applicable √ Not applicable
4. Others
Applicable √ Not applicable
XVIII. Convertible corporate bonds
Applicable √ Not applicable
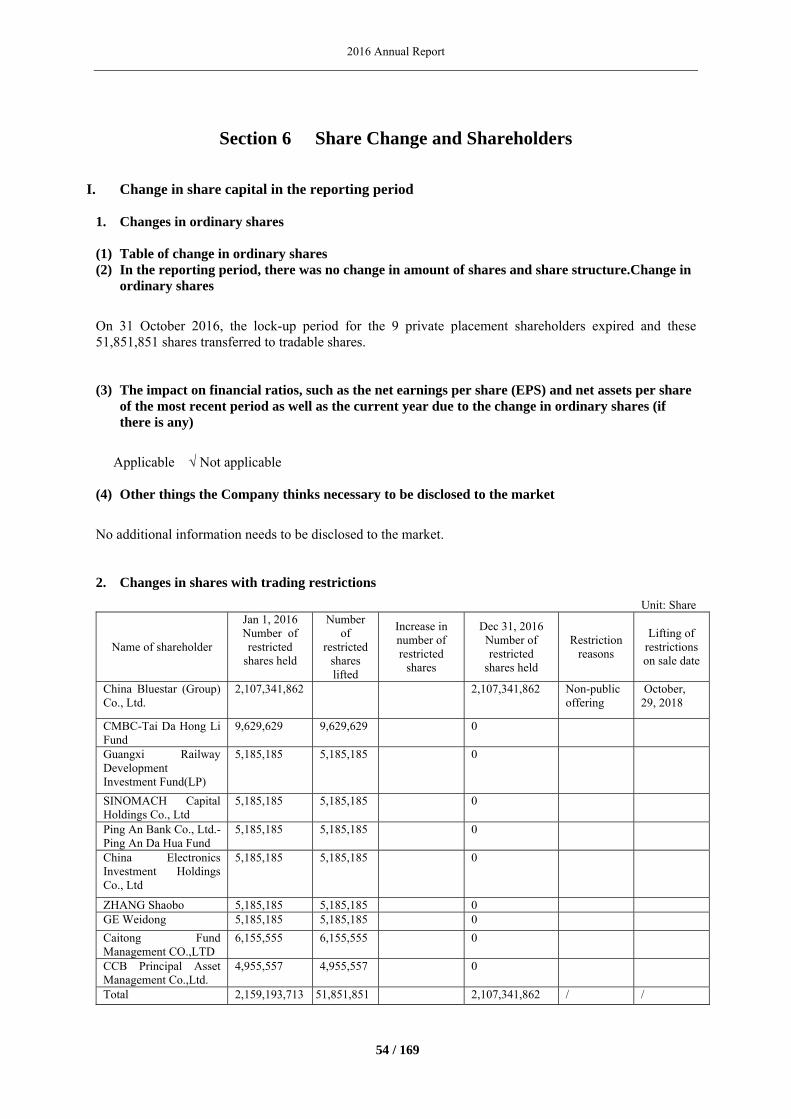
2016 Annual Report
54 / 169
Section 6 Share Change and Shareholders
I. Change in share capital in the reporting period
1. Changes in ordinary shares
(1) Table of change in ordinary shares (2) In the reporting period, there was no change in amount of shares and share structure.Change in
ordinary shares
On 31 October 2016, the lock-up period for the 9 private placement shareholders expired and these 51,851,851 shares transferred to tradable shares.
(3) The impact on financial ratios, such as the net earnings per share (EPS) and net assets per share of the most recent period as well as the current year due to the change in ordinary shares (if there is any)
Applicable √ Not applicable
(4) Other things the Company thinks necessary to be disclosed to the market
No additional information needs to be disclosed to the market.
2. Changes in shares with trading restrictions
Unit: Share
Name of shareholder
Jan 1, 2016 Number of restricted
shares held
Number of
restricted shares lifted
Increase in number of restricted
shares
Dec 31, 2016 Number of restricted
shares held
Restriction reasons
Lifting of restrictions on sale date
China Bluestar (Group) Co., Ltd.
2,107,341,862 2,107,341,862 Non-public offering
October, 29, 2018
CMBC-Tai Da Hong Li Fund
9,629,629 9,629,629 0
Guangxi Railway Development Investment Fund(LP)
5,185,185 5,185,185 0
SINOMACH Capital Holdings Co., Ltd
5,185,185 5,185,185 0
Ping An Bank Co., Ltd.- Ping An Da Hua Fund
5,185,185 5,185,185 0
China Electronics Investment Holdings Co., Ltd
5,185,185 5,185,185 0
ZHANG Shaobo 5,185,185 5,185,185 0 GE Weidong 5,185,185 5,185,185 0
Caitong Fund Management CO.,LTD
6,155,555 6,155,555 0
CCB Principal Asset Management Co.,Ltd.
4,955,557 4,955,557 0
Total 2,159,193,713 51,851,851 2,107,341,862 / /
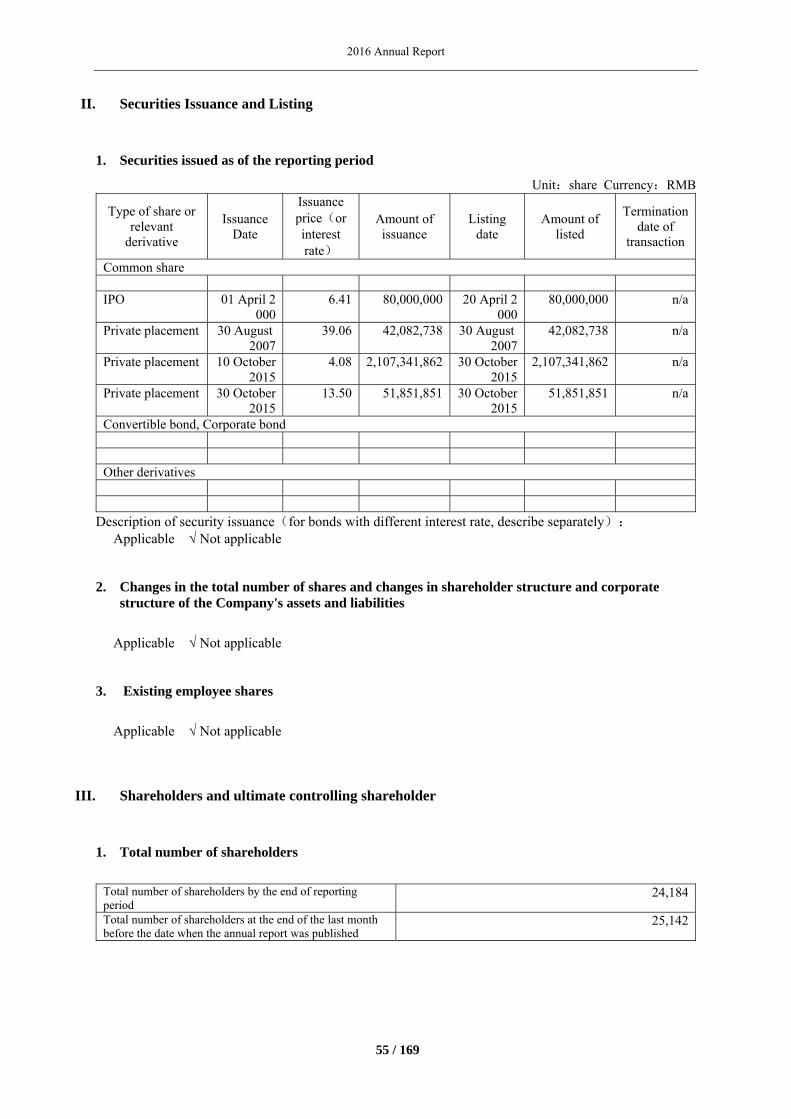
2016 Annual Report
55 / 169
II. Securities Issuance and Listing
1. Securities issued as of the reporting period
Unit:share Currency:RMB
Type of share or relevant
derivative
Issuance Date
Issuance price(or interest rate)
Amount of issuance
Listing date
Amount of listed
Termination date of
transaction
Common share
IPO 01 April 2000
6.41 80,000,000 20 April 2000
80,000,000 n/a
Private placement 30 August 2007
39.06 42,082,738 30 August 2007
42,082,738 n/a
Private placement 10 October 2015
4.08 2,107,341,862 30 October 2015
2,107,341,862 n/a
Private placement 30 October 2015
13.50 51,851,851 30 October 2015
51,851,851 n/a
Convertible bond, Corporate bond
Other derivatives
Description of security issuance(for bonds with different interest rate, describe separately): Applicable √ Not applicable
2. Changes in the total number of shares and changes in shareholder structure and corporate structure of the Company's assets and liabilities
Applicable √ Not applicable
3. Existing employee shares
Applicable √ Not applicable
III. Shareholders and ultimate controlling shareholder
1. Total number of shareholders
Total number of shareholders by the end of reporting period
24,184
Total number of shareholders at the end of the last month before the date when the annual report was published
25,142
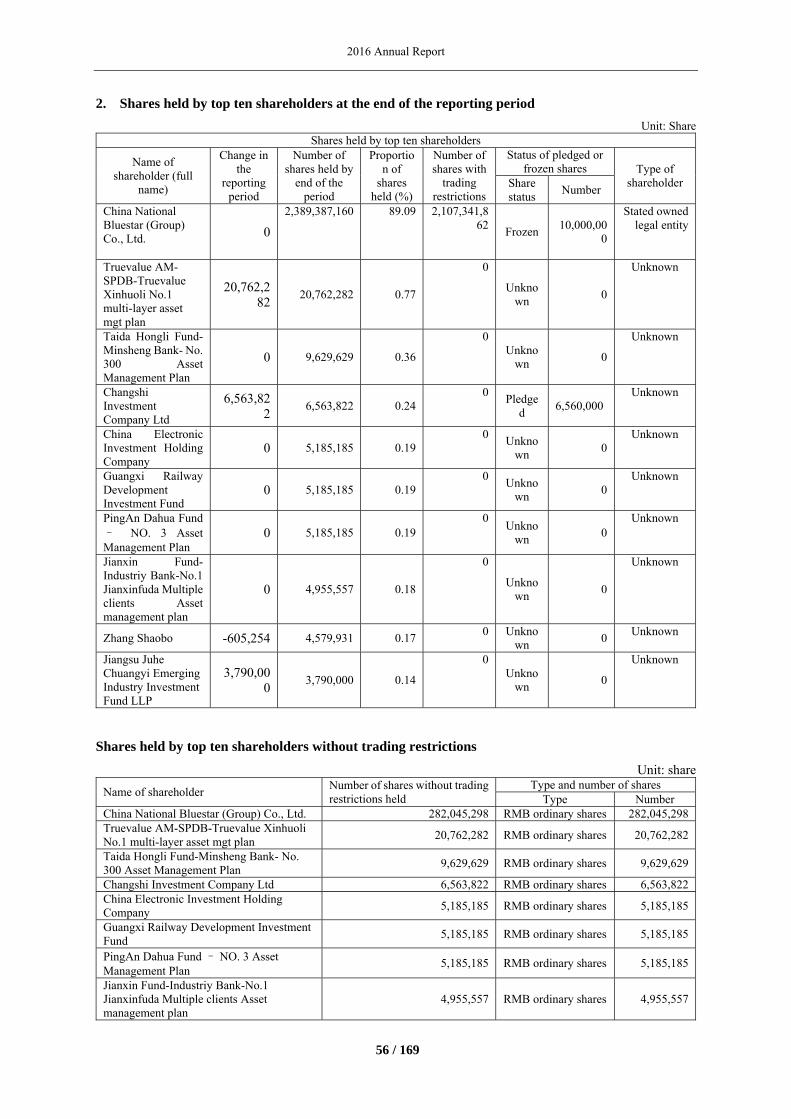
2016 Annual Report
56 / 169
2. Shares held by top ten shareholders at the end of the reporting period
Unit: Share Shares held by top ten shareholders
Name of shareholder (full
name)
Change in the
reporting period
Number of shares held by
end of the period
Proportion of
shares held (%)
Number of shares with
trading restrictions
Status of pledged or frozen shares Type of
shareholder Share status
Number
China National Bluestar (Group) Co., Ltd.
0
2,389,387,160 89.09 2,107,341,862
Frozen10,000,00
0
Stated owned legal entity
Truevalue AM-SPDB-Truevalue Xinhuoli No.1 multi-layer asset mgt plan
20,762,282
20,762,282 0.77
0
Unknown
0
Unknown
Taida Hongli Fund-Minsheng Bank- No. 300 Asset Management Plan
0 9,629,629 0.36
0Unkno
wn 0
Unknown
Changshi Investment Company Ltd
6,563,822
6,563,822 0.240
Pledged
6,560,000 Unknown
China Electronic Investment Holding Company
0 5,185,185 0.190
Unknown
0 Unknown
Guangxi Railway Development Investment Fund
0 5,185,185 0.190
Unknown
0 Unknown
PingAn Dahua Fund – NO. 3 Asset Management Plan
0 5,185,185 0.190
Unknown
0 Unknown
Jianxin Fund-Industriy Bank-No.1 Jianxinfuda Multiple clients Asset management plan
0 4,955,557 0.18
0
Unknown
0
Unknown
Zhang Shaobo -605,254 4,579,931 0.170 Unkno
wn 0
Unknown
Jiangsu Juhe Chuangyi Emerging Industry Investment Fund LLP
3,790,000
3,790,000 0.14
0Unkno
wn 0
Unknown
Shares held by top ten shareholders without trading restrictions
Unit: share
Name of shareholder Number of shares without trading restrictions held
Type and number of shares Type Number
China National Bluestar (Group) Co., Ltd. 282,045,298 RMB ordinary shares 282,045,298Truevalue AM-SPDB-Truevalue Xinhuoli No.1 multi-layer asset mgt plan
20,762,282 RMB ordinary shares 20,762,282
Taida Hongli Fund-Minsheng Bank- No. 300 Asset Management Plan
9,629,629 RMB ordinary shares 9,629,629
Changshi Investment Company Ltd 6,563,822 RMB ordinary shares 6,563,822China Electronic Investment Holding Company
5,185,185 RMB ordinary shares 5,185,185
Guangxi Railway Development Investment Fund
5,185,185 RMB ordinary shares 5,185,185
PingAn Dahua Fund – NO. 3 Asset Management Plan 5,185,185 RMB ordinary shares 5,185,185
Jianxin Fund-Industriy Bank-No.1 Jianxinfuda Multiple clients Asset management plan
4,955,557 RMB ordinary shares 4,955,557
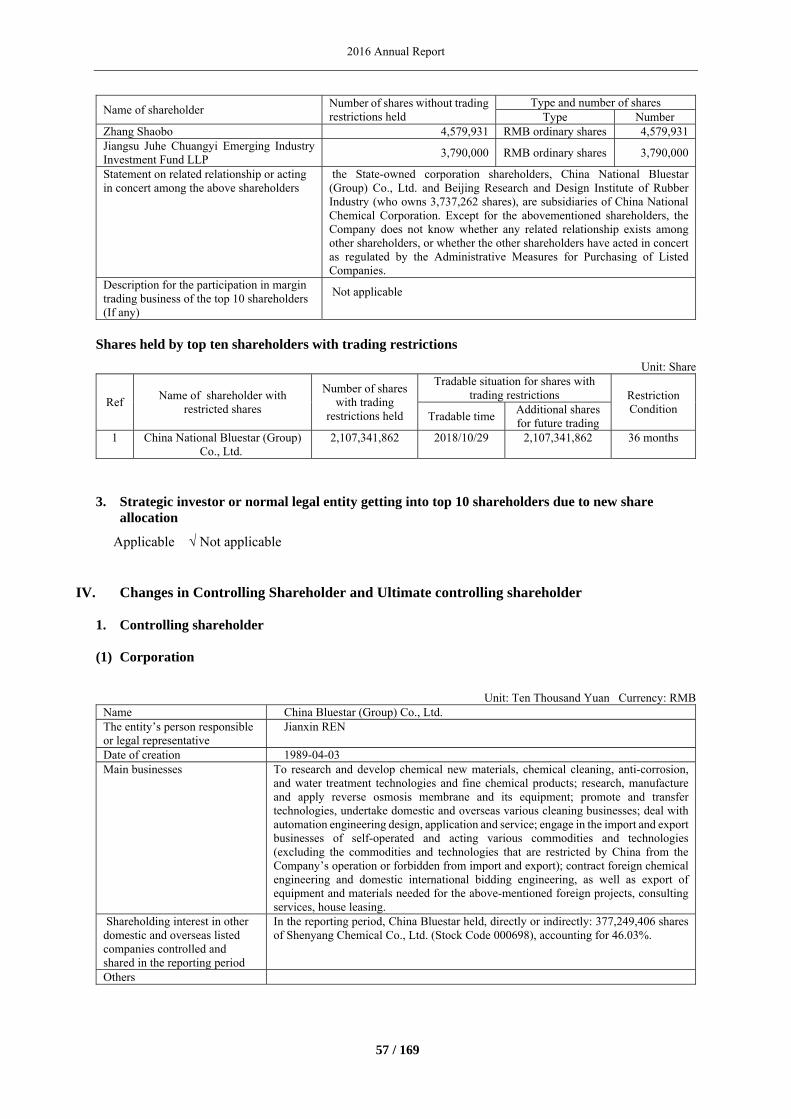
2016 Annual Report
57 / 169
Name of shareholder Number of shares without trading restrictions held
Type and number of shares Type Number
Zhang Shaobo 4,579,931 RMB ordinary shares 4,579,931Jiangsu Juhe Chuangyi Emerging Industry Investment Fund LLP
3,790,000 RMB ordinary shares 3,790,000
Statement on related relationship or acting in concert among the above shareholders
the State-owned corporation shareholders, China National Bluestar (Group) Co., Ltd. and Beijing Research and Design Institute of Rubber Industry (who owns 3,737,262 shares), are subsidiaries of China National Chemical Corporation. Except for the abovementioned shareholders, the Company does not know whether any related relationship exists among other shareholders, or whether the other shareholders have acted in concert as regulated by the Administrative Measures for Purchasing of Listed Companies.
Description for the participation in margin trading business of the top 10 shareholders (If any)
Not applicable
Shares held by top ten shareholders with trading restrictions
Unit: Share
Ref Name of shareholder with
restricted shares
Number of shares with trading
restrictions held
Tradable situation for shares with trading restrictions Restriction
Condition Tradable time
Additional shares for future trading
1 China National Bluestar (Group) Co., Ltd.
2,107,341,862 2018/10/29 2,107,341,862 36 months
3. Strategic investor or normal legal entity getting into top 10 shareholders due to new share allocation
Applicable √ Not applicable
IV. Changes in Controlling Shareholder and Ultimate controlling shareholder
1. Controlling shareholder
(1) Corporation
Unit: Ten Thousand Yuan Currency: RMB
Name China Bluestar (Group) Co., Ltd. The entity’s person responsible or legal representative
Jianxin REN
Date of creation 1989-04-03 Main businesses To research and develop chemical new materials, chemical cleaning, anti-corrosion,
and water treatment technologies and fine chemical products; research, manufacture and apply reverse osmosis membrane and its equipment; promote and transfer technologies, undertake domestic and overseas various cleaning businesses; deal with automation engineering design, application and service; engage in the import and export businesses of self-operated and acting various commodities and technologies (excluding the commodities and technologies that are restricted by China from the Company’s operation or forbidden from import and export); contract foreign chemical engineering and domestic international bidding engineering, as well as export of equipment and materials needed for the above-mentioned foreign projects, consulting services, house leasing.
Shareholding interest in other domestic and overseas listed companies controlled and shared in the reporting period
In the reporting period, China Bluestar held, directly or indirectly: 377,249,406 shares of Shenyang Chemical Co., Ltd. (Stock Code 000698), accounting for 46.03%.
Others
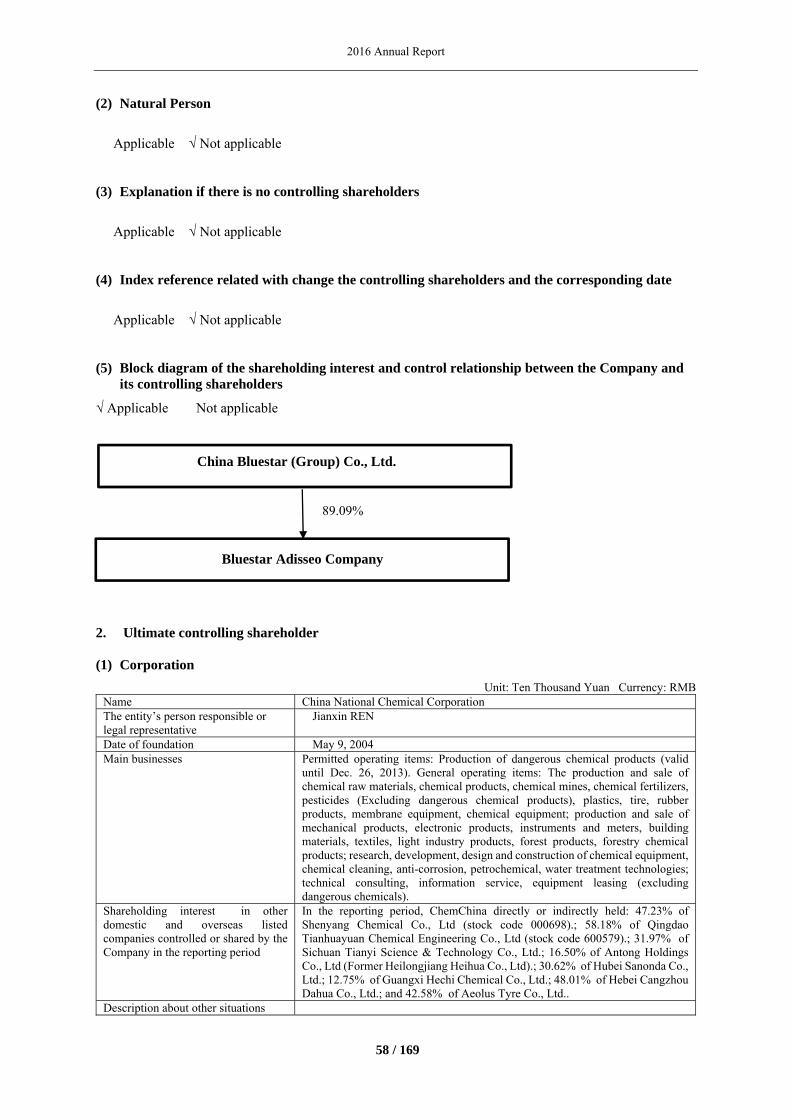
2016 Annual Report
58 / 169
(2) Natural Person
Applicable √ Not applicable
(3) Explanation if there is no controlling shareholders
Applicable √ Not applicable
(4) Index reference related with change the controlling shareholders and the corresponding date
Applicable √ Not applicable
(5) Block diagram of the shareholding interest and control relationship between the Company and its controlling shareholders
√ Applicable Not applicable
2. Ultimate controlling shareholder
(1) Corporation
Unit: Ten Thousand Yuan Currency: RMB Name China National Chemical Corporation The entity’s person responsible or legal representative
Jianxin REN
Date of foundation May 9, 2004 Main businesses Permitted operating items: Production of dangerous chemical products (valid
until Dec. 26, 2013). General operating items: The production and sale of chemical raw materials, chemical products, chemical mines, chemical fertilizers, pesticides (Excluding dangerous chemical products), plastics, tire, rubber products, membrane equipment, chemical equipment; production and sale of mechanical products, electronic products, instruments and meters, building materials, textiles, light industry products, forest products, forestry chemical products; research, development, design and construction of chemical equipment, chemical cleaning, anti-corrosion, petrochemical, water treatment technologies; technical consulting, information service, equipment leasing (excluding dangerous chemicals).
Shareholding interest in other domestic and overseas listed companies controlled or shared by the Company in the reporting period
In the reporting period, ChemChina directly or indirectly held: 47.23% of Shenyang Chemical Co., Ltd (stock code 000698).; 58.18% of Qingdao Tianhuayuan Chemical Engineering Co., Ltd (stock code 600579).; 31.97% of Sichuan Tianyi Science & Technology Co., Ltd.; 16.50% of Antong Holdings Co., Ltd (Former Heilongjiang Heihua Co., Ltd).; 30.62% of Hubei Sanonda Co., Ltd.; 12.75% of Guangxi Hechi Chemical Co., Ltd.; 48.01% of Hebei Cangzhou Dahua Co., Ltd.; and 42.58% of Aeolus Tyre Co., Ltd..
Description about other situations
China Bluestar (Group) Co., Ltd.
89.09%
Bluestar Adisseo Company
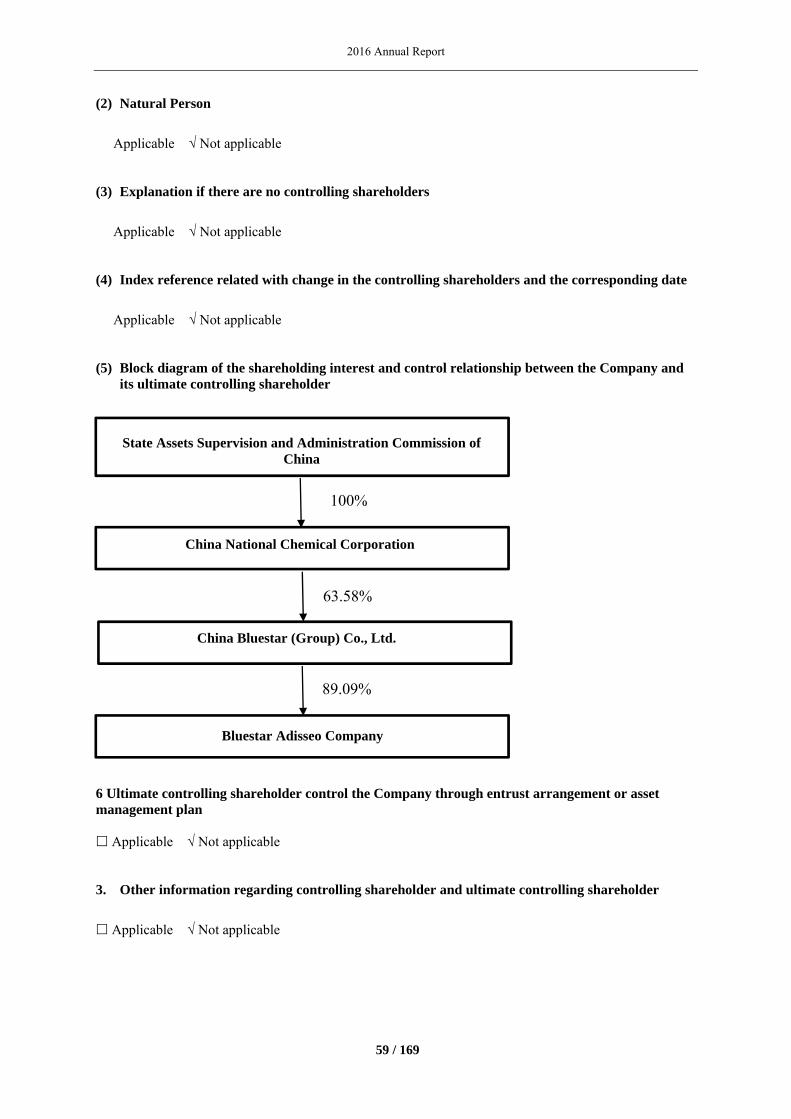
2016 Annual Report
59 / 169
(2) Natural Person
Applicable √ Not applicable
(3) Explanation if there are no controlling shareholders
Applicable √ Not applicable
(4) Index reference related with change in the controlling shareholders and the corresponding date
Applicable √ Not applicable
(5) Block diagram of the shareholding interest and control relationship between the Company and its ultimate controlling shareholder
6 Ultimate controlling shareholder control the Company through entrust arrangement or asset management plan Applicable √ Not applicable
3. Other information regarding controlling shareholder and ultimate controlling shareholder
Applicable √ Not applicable
State Assets Supervision and Administration Commission of China
100%
China National Chemical Corporation
63.58%
China Bluestar (Group) Co., Ltd.
89.09%
Bluestar Adisseo Company

2016 Annual Report
60 / 169
V. Other shareholders in the form of corporations with shares ownership of more than 10%
Applicable √ Not applicable
VI. Introduction of limit on share disposal
Applicable √ Not applicable

2016 Annual Report
61 / 169
Section 7 Information on Preferred Shares The Company did not have any issue concerning preferred shares in the reporting period.
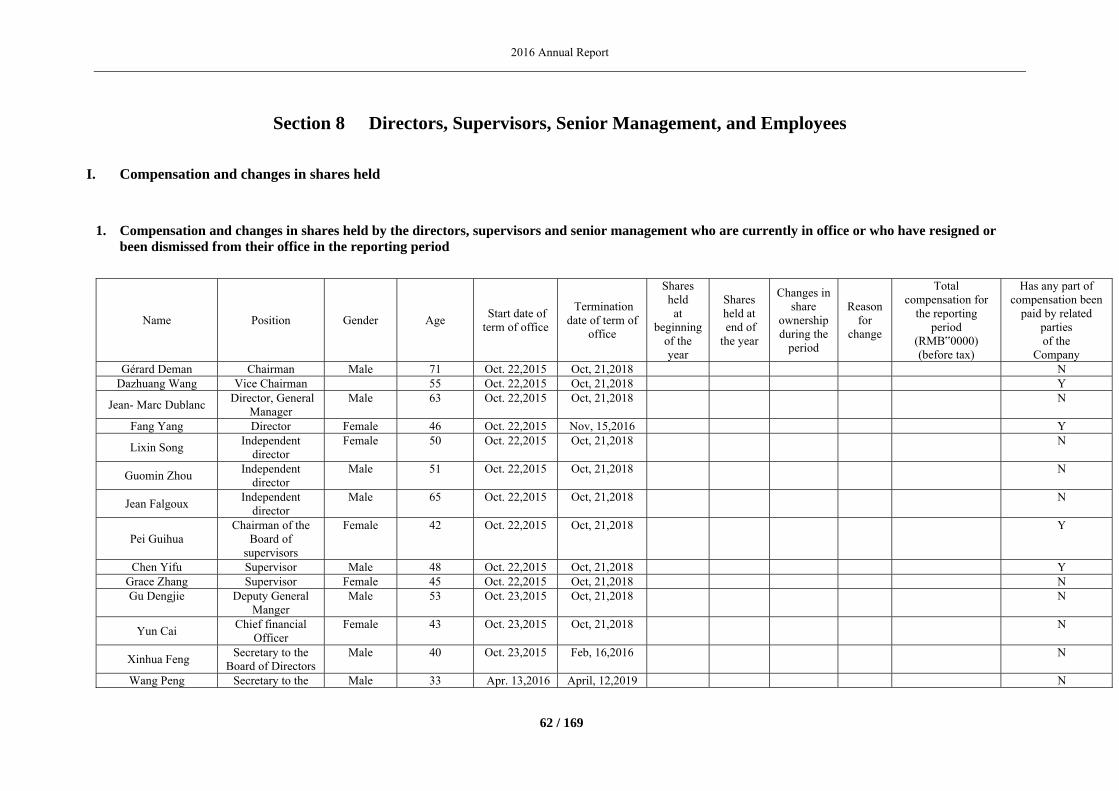
2016 Annual Report
62 / 169
Section 8 Directors, Supervisors, Senior Management, and Employees
I. Compensation and changes in shares held
1. Compensation and changes in shares held by the directors, supervisors and senior management who are currently in office or who have resigned or been dismissed from their office in the reporting period
Name Position Gender Age Start date of term of office
Termination date of term of
office
Shares held at
beginningof the year
Shares held at end of the year
Changes in share
ownership during the
period
Reason for
change
Total compensation for
the reporting period
(RMB‟0000) (before tax)
Has any part of compensation been
paid by related parties of the
Company Gérard Deman Chairman Male 71 Oct. 22,2015 Oct, 21,2018 N
Dazhuang Wang Vice Chairman 55 Oct. 22,2015 Oct, 21,2018 Y
Jean- Marc Dublanc Director, General
Manager Male 63 Oct. 22,2015 Oct, 21,2018 N
Fang Yang Director Female 46 Oct. 22,2015 Nov, 15,2016 Y
Lixin Song Independent
director Female 50 Oct. 22,2015 Oct, 21,2018 N
Guomin Zhou Independent
director Male 51 Oct. 22,2015 Oct, 21,2018 N
Jean Falgoux Independent
director Male 65 Oct. 22,2015 Oct, 21,2018 N
Pei Guihua Chairman of the
Board of supervisors
Female 42 Oct. 22,2015 Oct, 21,2018 Y
Chen Yifu Supervisor Male 48 Oct. 22,2015 Oct, 21,2018 Y Grace Zhang Supervisor Female 45 Oct. 22,2015 Oct, 21,2018 N Gu Dengjie
Deputy General
Manger Male 53 Oct. 23,2015 Oct, 21,2018 N
Yun Cai Chief financial
Officer Female 43 Oct. 23,2015 Oct, 21,2018 N
Xinhua Feng Secretary to the
Board of Directors Male 40 Oct. 23,2015 Feb, 16,2016 N
Wang Peng Secretary to the Male 33 Apr. 13,2016 April, 12,2019 N
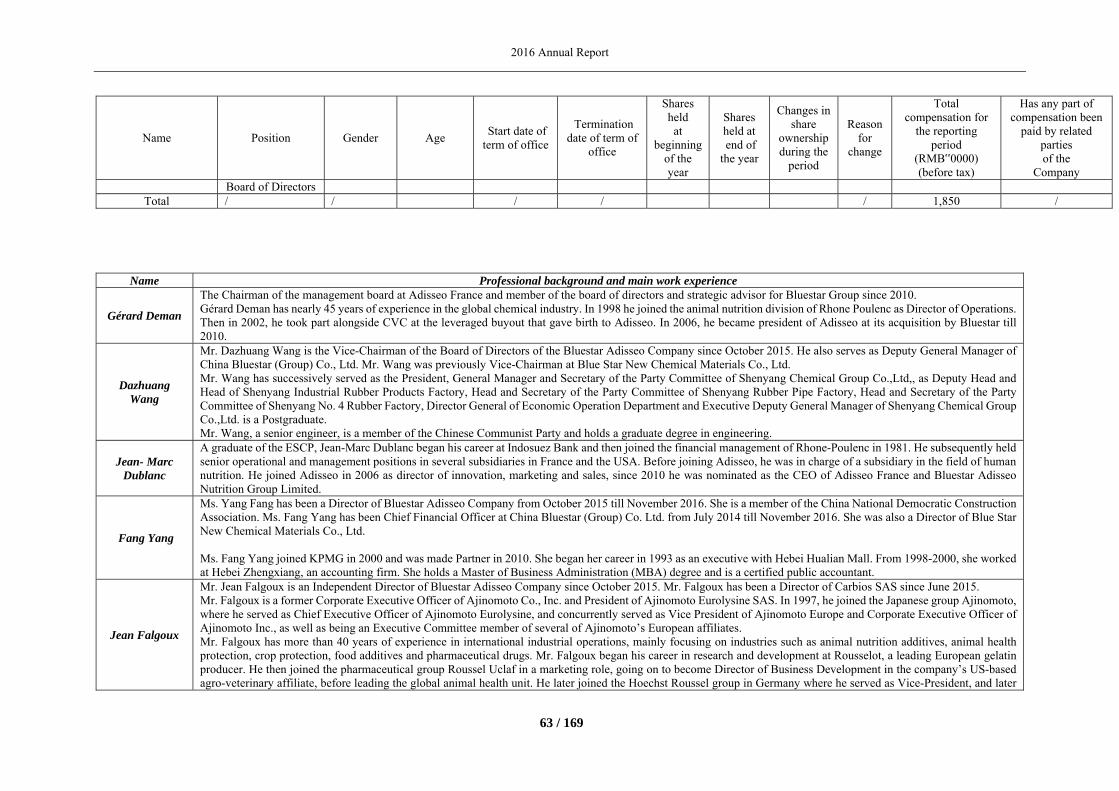
2016 Annual Report
63 / 169
Name Position Gender Age Start date of term of office
Termination date of term of
office
Shares held at
beginningof the year
Shares held at end of the year
Changes in share
ownership during the
period
Reason for
change
Total compensation for
the reporting period
(RMB‟0000) (before tax)
Has any part of compensation been
paid by related parties of the
Company Board of Directors
Total / / / / / 1,850 /
Name Professional background and main work experience
Gérard Deman
The Chairman of the management board at Adisseo France and member of the board of directors and strategic advisor for Bluestar Group since 2010. Gérard Deman has nearly 45 years of experience in the global chemical industry. In 1998 he joined the animal nutrition division of Rhone Poulenc as Director of Operations. Then in 2002, he took part alongside CVC at the leveraged buyout that gave birth to Adisseo. In 2006, he became president of Adisseo at its acquisition by Bluestar till 2010.
Dazhuang Wang
Mr. Dazhuang Wang is the Vice-Chairman of the Board of Directors of the Bluestar Adisseo Company since October 2015. He also serves as Deputy General Manager of China Bluestar (Group) Co., Ltd. Mr. Wang was previously Vice-Chairman at Blue Star New Chemical Materials Co., Ltd. Mr. Wang has successively served as the President, General Manager and Secretary of the Party Committee of Shenyang Chemical Group Co.,Ltd,, as Deputy Head and Head of Shenyang Industrial Rubber Products Factory, Head and Secretary of the Party Committee of Shenyang Rubber Pipe Factory, Head and Secretary of the Party Committee of Shenyang No. 4 Rubber Factory, Director General of Economic Operation Department and Executive Deputy General Manager of Shenyang Chemical Group Co.,Ltd. is a Postgraduate. Mr. Wang, a senior engineer, is a member of the Chinese Communist Party and holds a graduate degree in engineering.
Jean- Marc Dublanc
A graduate of the ESCP, Jean-Marc Dublanc began his career at Indosuez Bank and then joined the financial management of Rhone-Poulenc in 1981. He subsequently held senior operational and management positions in several subsidiaries in France and the USA. Before joining Adisseo, he was in charge of a subsidiary in the field of human nutrition. He joined Adisseo in 2006 as director of innovation, marketing and sales, since 2010 he was nominated as the CEO of Adisseo France and Bluestar Adisseo Nutrition Group Limited.
Fang Yang
Ms. Yang Fang has been a Director of Bluestar Adisseo Company from October 2015 till November 2016. She is a member of the China National Democratic Construction Association. Ms. Fang Yang has been Chief Financial Officer at China Bluestar (Group) Co. Ltd. from July 2014 till November 2016. She was also a Director of Blue Star New Chemical Materials Co., Ltd. Ms. Fang Yang joined KPMG in 2000 and was made Partner in 2010. She began her career in 1993 as an executive with Hebei Hualian Mall. From 1998-2000, she worked at Hebei Zhengxiang, an accounting firm. She holds a Master of Business Administration (MBA) degree and is a certified public accountant.
Jean Falgoux
Mr. Jean Falgoux is an Independent Director of Bluestar Adisseo Company since October 2015. Mr. Falgoux has been a Director of Carbios SAS since June 2015. Mr. Falgoux is a former Corporate Executive Officer of Ajinomoto Co., Inc. and President of Ajinomoto Eurolysine SAS. In 1997, he joined the Japanese group Ajinomoto, where he served as Chief Executive Officer of Ajinomoto Eurolysine, and concurrently served as Vice President of Ajinomoto Europe and Corporate Executive Officer of Ajinomoto Inc., as well as being an Executive Committee member of several of Ajinomoto’s European affiliates. Mr. Falgoux has more than 40 years of experience in international industrial operations, mainly focusing on industries such as animal nutrition additives, animal health protection, crop protection, food additives and pharmaceutical drugs. Mr. Falgoux began his career in research and development at Rousselot, a leading European gelatin producer. He then joined the pharmaceutical group Roussel Uclaf in a marketing role, going on to become Director of Business Development in the company’s US-based agro-veterinary affiliate, before leading the global animal health unit. He later joined the Hoechst Roussel group in Germany where he served as Vice-President, and later
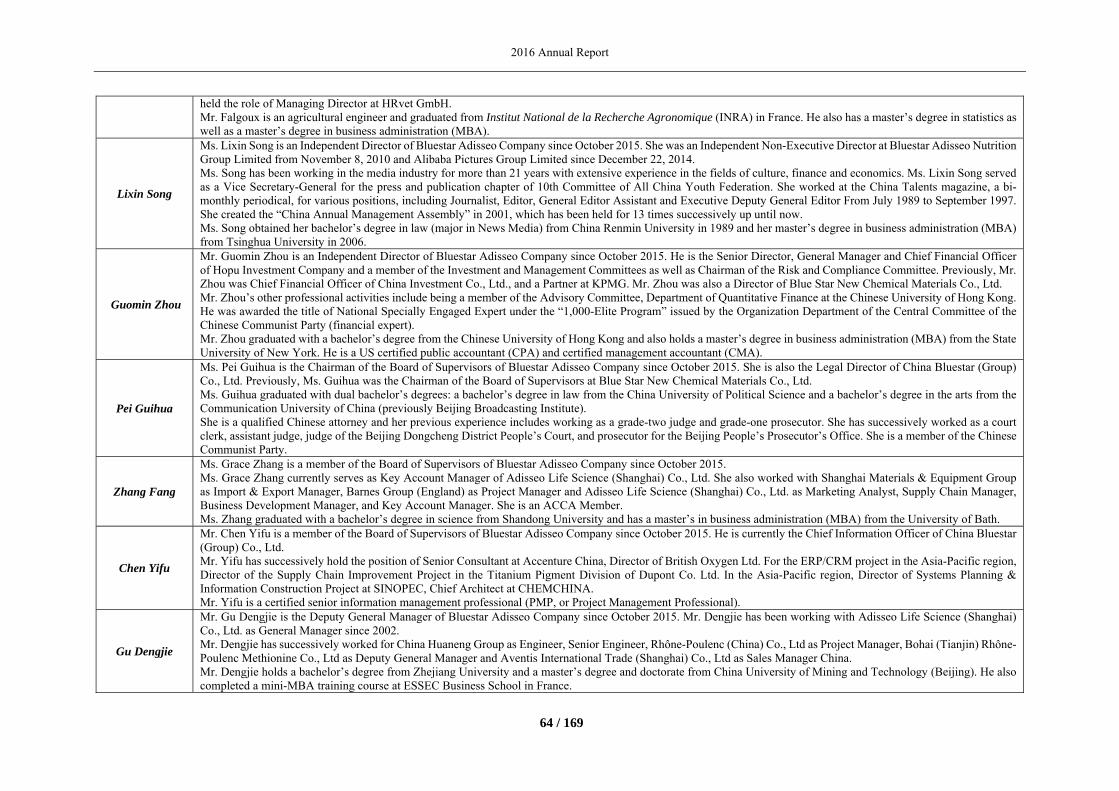
2016 Annual Report
64 / 169
held the role of Managing Director at HRvet GmbH. Mr. Falgoux is an agricultural engineer and graduated from Institut National de la Recherche Agronomique (INRA) in France. He also has a master’s degree in statistics as well as a master’s degree in business administration (MBA).
Lixin Song
Ms. Lixin Song is an Independent Director of Bluestar Adisseo Company since October 2015. She was an Independent Non-Executive Director at Bluestar Adisseo Nutrition Group Limited from November 8, 2010 and Alibaba Pictures Group Limited since December 22, 2014. Ms. Song has been working in the media industry for more than 21 years with extensive experience in the fields of culture, finance and economics. Ms. Lixin Song served as a Vice Secretary-General for the press and publication chapter of 10th Committee of All China Youth Federation. She worked at the China Talents magazine, a bi-monthly periodical, for various positions, including Journalist, Editor, General Editor Assistant and Executive Deputy General Editor From July 1989 to September 1997. She created the “China Annual Management Assembly” in 2001, which has been held for 13 times successively up until now. Ms. Song obtained her bachelor’s degree in law (major in News Media) from China Renmin University in 1989 and her master’s degree in business administration (MBA) from Tsinghua University in 2006.
Guomin Zhou
Mr. Guomin Zhou is an Independent Director of Bluestar Adisseo Company since October 2015. He is the Senior Director, General Manager and Chief Financial Officer of Hopu Investment Company and a member of the Investment and Management Committees as well as Chairman of the Risk and Compliance Committee. Previously, Mr. Zhou was Chief Financial Officer of China Investment Co., Ltd., and a Partner at KPMG. Mr. Zhou was also a Director of Blue Star New Chemical Materials Co., Ltd. Mr. Zhou’s other professional activities include being a member of the Advisory Committee, Department of Quantitative Finance at the Chinese University of Hong Kong. He was awarded the title of National Specially Engaged Expert under the “1,000-Elite Program” issued by the Organization Department of the Central Committee of the Chinese Communist Party (financial expert). Mr. Zhou graduated with a bachelor’s degree from the Chinese University of Hong Kong and also holds a master’s degree in business administration (MBA) from the State University of New York. He is a US certified public accountant (CPA) and certified management accountant (CMA).
Pei Guihua
Ms. Pei Guihua is the Chairman of the Board of Supervisors of Bluestar Adisseo Company since October 2015. She is also the Legal Director of China Bluestar (Group) Co., Ltd. Previously, Ms. Guihua was the Chairman of the Board of Supervisors at Blue Star New Chemical Materials Co., Ltd. Ms. Guihua graduated with dual bachelor’s degrees: a bachelor’s degree in law from the China University of Political Science and a bachelor’s degree in the arts from the Communication University of China (previously Beijing Broadcasting Institute). She is a qualified Chinese attorney and her previous experience includes working as a grade-two judge and grade-one prosecutor. She has successively worked as a court clerk, assistant judge, judge of the Beijing Dongcheng District People’s Court, and prosecutor for the Beijing People’s Prosecutor’s Office. She is a member of the Chinese Communist Party.
Zhang Fang
Ms. Grace Zhang is a member of the Board of Supervisors of Bluestar Adisseo Company since October 2015. Ms. Grace Zhang currently serves as Key Account Manager of Adisseo Life Science (Shanghai) Co., Ltd. She also worked with Shanghai Materials & Equipment Group as Import & Export Manager, Barnes Group (England) as Project Manager and Adisseo Life Science (Shanghai) Co., Ltd. as Marketing Analyst, Supply Chain Manager, Business Development Manager, and Key Account Manager. She is an ACCA Member. Ms. Zhang graduated with a bachelor’s degree in science from Shandong University and has a master’s in business administration (MBA) from the University of Bath.
Chen Yifu
Mr. Chen Yifu is a member of the Board of Supervisors of Bluestar Adisseo Company since October 2015. He is currently the Chief Information Officer of China Bluestar (Group) Co., Ltd. Mr. Yifu has successively hold the position of Senior Consultant at Accenture China, Director of British Oxygen Ltd. For the ERP/CRM project in the Asia-Pacific region, Director of the Supply Chain Improvement Project in the Titanium Pigment Division of Dupont Co. Ltd. In the Asia-Pacific region, Director of Systems Planning & Information Construction Project at SINOPEC, Chief Architect at CHEMCHINA. Mr. Yifu is a certified senior information management professional (PMP, or Project Management Professional).
Gu Dengjie
Mr. Gu Dengjie is the Deputy General Manager of Bluestar Adisseo Company since October 2015. Mr. Dengjie has been working with Adisseo Life Science (Shanghai) Co., Ltd. as General Manager since 2002. Mr. Dengjie has successively worked for China Huaneng Group as Engineer, Senior Engineer, Rhône-Poulenc (China) Co., Ltd as Project Manager, Bohai (Tianjin) Rhône-Poulenc Methionine Co., Ltd as Deputy General Manager and Aventis International Trade (Shanghai) Co., Ltd as Sales Manager China. Mr. Dengjie holds a bachelor’s degree from Zhejiang University and a master’s degree and doctorate from China University of Mining and Technology (Beijing). He also completed a mini-MBA training course at ESSEC Business School in France.
2016 Annual Report
65 / 169
Yun Cai
Ms. Yun Cai is the Chief Financial Officer of Bluestar Adisseo Company since October 2015. She has been Group Project & Internal Audit Director since April 2015. Previously, Ms. Cai has successively worked for PricewaterhouseCoopers in their Shanghai office as an auditor and then as a senior auditor. Finally, she became Finance & HR manager, Deputy General Manager at Adisseo Life Science (Shanghai) Co., Ltd. (Previously: Aventis International Trading (Shanghai) Co., Ltd). She has a bachelor’s degree in international economics from Fudan University and is a CICPA member. She also completed a mini-MBA training course at ESSEC Business School in France.
Xinhua Feng
Mr. Xinhua Feng was the Secretary to the Board of Directors of Bluestar Adisseo Company from October 2015 to Feb. 2016. Previously, he worked with China Bluestar (Group) Co., Ltd. as an accountant and Bluestar Chemical New Material Co., Ltd. as a security representative. He became Secretary to the Board of Directors of Bluestar Chemical New Material Co., Ltd in 2006. Mr. Feng graduated from Beijing Industry and Commerce University (Originally Beijing Merchant College) and is a qualified senior economic engineer.
Wang Peng WANG Peng, aged 32, graduated from University of International Business and Economics with dual bachelor degree in accounting and finance in 2006. Worked as Manager in Audit Department in KPMG Huazhen LLP from 2006 through 2014. Worked as Assistance to the Principal of Finance/Capital Department in China National Bluestar (Group) Co.,Ltd. since 2014 and became the Secretary of the Board of Directors of Bluestar Adisseo Company since April 2016.
Other: Applicable √ Not applicable
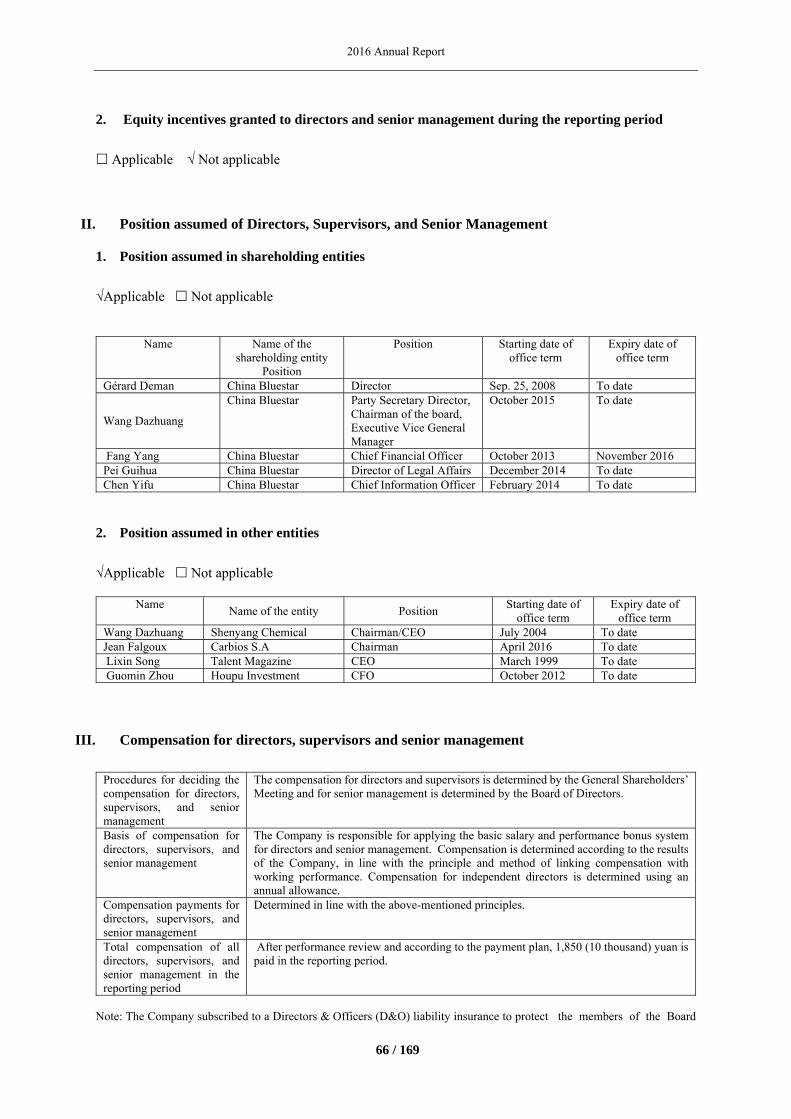
2016 Annual Report
66 / 169
2. Equity incentives granted to directors and senior management during the reporting period
Applicable √ Not applicable
II. Position assumed of Directors, Supervisors, and Senior Management
1. Position assumed in shareholding entities
√Applicable Not applicable
Name Name of the shareholding entity
Position
Position Starting date of office term
Expiry date of office term
Gérard Deman China Bluestar Director Sep. 25, 2008 To date
Wang Dazhuang
China Bluestar Party Secretary Director, Chairman of the board, Executive Vice General Manager
October 2015 To date
Fang Yang China Bluestar Chief Financial Officer October 2013 November 2016 Pei Guihua China Bluestar Director of Legal Affairs December 2014 To date Chen Yifu China Bluestar Chief Information Officer February 2014 To date
2. Position assumed in other entities
√Applicable Not applicable
Name Name of the entity Position
Starting date of office term
Expiry date of office term
Wang Dazhuang Shenyang Chemical Chairman/CEO July 2004 To date Jean Falgoux Carbios S.A Chairman April 2016 To date Lixin Song Talent Magazine CEO March 1999 To date Guomin Zhou Houpu Investment CFO October 2012 To date
III. Compensation for directors, supervisors and senior management
Procedures for deciding the compensation for directors, supervisors, and senior management
The compensation for directors and supervisors is determined by the General Shareholders’ Meeting and for senior management is determined by the Board of Directors.
Basis of compensation for directors, supervisors, and senior management
The Company is responsible for applying the basic salary and performance bonus system for directors and senior management. Compensation is determined according to the results of the Company, in line with the principle and method of linking compensation with working performance. Compensation for independent directors is determined using an annual allowance.
Compensation payments for directors, supervisors, and senior management
Determined in line with the above-mentioned principles.
Total compensation of all directors, supervisors, and senior management in the reporting period
After performance review and according to the payment plan, 1,850 (10 thousand) yuan is paid in the reporting period.
Note: The Company subscribed to a Directors & Officers (D&O) liability insurance to protect the members of the Board
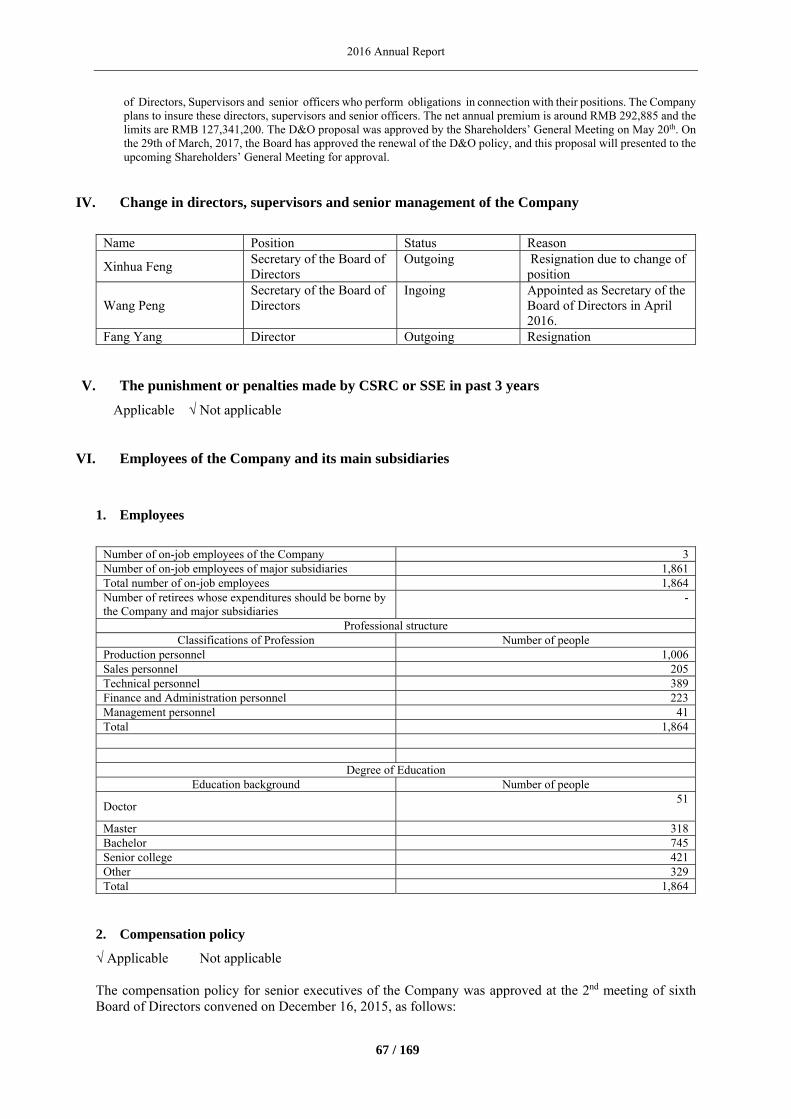
2016 Annual Report
67 / 169
of Directors, Supervisors and senior officers who perform obligations in connection with their positions. The Company plans to insure these directors, supervisors and senior officers. The net annual premium is around RMB 292,885 and the limits are RMB 127,341,200. The D&O proposal was approved by the Shareholders’ General Meeting on May 20th. On the 29th of March, 2017, the Board has approved the renewal of the D&O policy, and this proposal will presented to the upcoming Shareholders’ General Meeting for approval.
IV. Change in directors, supervisors and senior management of the Company
Name Position Status Reason
Xinhua Feng Secretary of the Board of Directors
Outgoing Resignation due to change of position
Wang Peng Secretary of the Board of Directors
Ingoing Appointed as Secretary of the Board of Directors in April 2016.
Fang Yang Director Outgoing Resignation
V. The punishment or penalties made by CSRC or SSE in past 3 years
Applicable √ Not applicable
VI. Employees of the Company and its main subsidiaries
1. Employees
Number of on-job employees of the Company 3Number of on-job employees of major subsidiaries 1,861Total number of on-job employees 1,864Number of retirees whose expenditures should be borne by the Company and major subsidiaries
-
Professional structure Classifications of Profession Number of people
Production personnel 1,006Sales personnel 205Technical personnel 389Finance and Administration personnel 223Management personnel 41Total 1,864
Degree of Education Education background Number of people
Doctor 51
Master 318Bachelor 745Senior college 421Other 329Total 1,864
2. Compensation policy
√ Applicable Not applicable The compensation policy for senior executives of the Company was approved at the 2nd meeting of sixth Board of Directors convened on December 16, 2015, as follows:
2016 Annual Report
68 / 169
Goals: Help attract and retain “highly qualified” executives with expertise and experience that will lead to global growth. Provide compensation opportunities structured to motivate executives to create long-term shareholder value and achieve interim milestones. Deliver actual total compensation that reflects the Company’s performance to goals and possibly relative to comparators, over time. Guiding Principles
Pay Comparator Group—The comparator group will be comprised taking into consideration, comparability of size (primarily based on revenue, as well as market capitalization and assets), industry, international geographic scope (including in terms of location of assets), and complexity of business.
Total Compensation Positioning to Pay Comparator Group—In general, the Company will
position target total compensation referring to the 25th
percentile and 50th
percentile. An individual executive’s target total compensation may be outside of this range based on any of the position’s responsibilities relative to the market standard; his/her experience in the position; sustained performance contributions, or potential for promotion. The range of award opportunities will be structured to provide superior actual compensation in return for superior performance and below-market actual compensation for low performance levels.
Compensation Mix—The Company intends to target a mix of salary, annual bonus, and long-term incentive that places a significant portion of pay at risk.
Performance Comparator Group—To reduce the impact of exogenous risk factors on corporate or business unit performance, the company may assess performance against comparators exposed to similar risk factors.
Performance Measures and Goal-Setting— Long-term performance criteria will be aligned with sustainable shareholder value creation, and therefore could include total shareholder return, return on existing assets, profitable growth, and the quality of corporate earnings. Long-term performance goals will be aligned with shareholder expectations of company performance. Annual performance measure(s) will emphasize line of sight, and link to the value-drivers that can be materially impacted by individual executives in a one-year timeframe. Annual performance goals will be based on the Company’s approved business plan. For all incentive plans, actual payouts should be superior to target when expectations are exceeded, and should be below target when actual performance falls short of objectives.
Emphasis Organizational Linkage—The primary determinant of executive long-term incentive compensation will be performance at corporate level, while annual executive incentives will emphasize line of sight through the granularity of performance metrics and individual performance objectives. Overall individual performance will be recognized through base salary increases and annual incentive payouts.
3. Training program
√ Applicable Not applicable According to the requirements of the Company’s roadmap and to achieve work objectives better, the Company identifies every year the training needs of its employees and designs the annual training program. Through staff training, the Company strengthens the business knowledge and skills of its employees, improves the capability and quality of the employees and ability of the management, and promotes the effective operation of its management system.

2016 Annual Report
69 / 169
4. Labor outsourcing
Applicable √ Not applicable
VII. Others
Applicable √ Not applicable
2016 Annual Report
70 / 169
Section 9 Corporate Governance
I. Governance of the Company and insider registration management
√ Applicable Not applicable
In the reporting period, and in accordance with applicable Corporate Law, Securities Law, the governance principles of listed companies and other relevant laws and rules and related requirements of the CSRC and the SSE, the Company established its information disclosure requirements, constantly improved the corporate governance structure, protected the interests of the Company and its shareholders. The operation and management of the Company meets the requirements of the relevant documents on standardization of governance for listed companies issued by the CSRC. The details are summarized as follows:
1. Shareholders and General Shareholders’ Meetings
The Company manages to organize and convene an Annual General Meeting of shareholders and interim General Shareholders’ Meetings according to the requirements of applicable Corporate Law, the Articles of Association, and the Rules of Procedure of General Shareholders’ Meetings, performed the proposals, complied with the rules of procedure, and voting of General Shareholders’ Meetings strictly according to related regulations and requirements. The Company published its announcements, including all notices, proposals and meeting resolutions via China Securities Journal, Shanghai Securities News and on the official website of the Shanghai Stock Exchange (www.sse.com.cn), The Company made such announcements on time. The resolutions approved by General Shareholders’ Meetings met the regulations, laws and rules, and complied with the lawful rights and interests of all shareholders, especially small and medium-sized shareholders. The General Shareholders’ Meetings was witnessed by the Company’s lawyers and they issued a legal opinion about the validity thereto.
2. Directors and Board of Directors
All the Directors can, based on the rules of Procedure of the Meetings of the Board of Directors and other rules, attend the Board meetings earnestly and all independent directors may perform their duties in good faith and with diligence. The current term of the Board of Directors comprises 7 directors, 3 of who are independent directors. The Board of Directors set up four special committees, namely the Audit Committee, the Strategic Committee, the Nomination Committee, the Compensation and Evaluation Committee, three of which are headed by independent directors, except for the Strategic Committee, headed by the Board Chairman. Committee Chairmen made their own working rules, and gave fully performed heir specialty functions in the operational management of the Company.
3. Supervisors and the Board of Supervisors
The Board of Supervisors carried out strictly their duties in accordance with applicable regulations of Corporate Law and the Articles of Association, met the requirements of laws and rules in terms of number of members and composition, could implement their own responsibilities in earnest according to the Rules of Procedure of the Board of Supervisors, etc., and supervised the legality and compliance of the financial position of the Company as well as the performance of duties by directors and senior management. The Board of Supervisors currently comprises 3 members, one of whom is an employee representative.
2016 Annual Report
71 / 169
4. Information disclosure and transparency
According to related regulations of the Securities Law, Listing Rules of the Shanghai Stock Exchange, Articles of Association, and Measures for Management of Information Disclosure, the Company implemented the information disclosure obligation in an authentic, accurate, complete and timely way. The Company disclosed related information through the website of the Shanghai Stock Exchange, Shanghai Securities News, China Securities Journal, etc., kept related confidential information secret before disclosure to the market, guaranteed publicity, fairness, equality of the information disclosure, and maintained the lawful rights and interests of the Company, investors, and especially small and medium-sized shareholders. Meanwhile, the Company amended the Insiders Registration and Filing System in time. During the reporting period, the Company was not criticized, condemned, or punished by any regulatory institution for violation of rules regarding information disclosure. If the corporate governance situations of the Company has big variance in compared with CSRC requirements, please state the reason as below: Applicable √Not applicable
II. Brief introduction to General Shareholders’ Meetings of shareholders
Meetings Convening Date Index Reference for the
Resolutions published on the website
Disclosure date of the resolution published
2015 Annual General Meeting
May 20, 2016 2016 Temp 015 May 21, 2016
III. Fulfilment of duties by Directors
1. Attendance of directors at board meetings and general shareholders’ meetings
Name of directors
Independent
directors
Attendance at Board meetings
Attendance atgeneral
shareholders’ meetings
Required attendance
at Board
meetings in the term
of office this
year
Attendance in
Person
Participation by other
communications
Attendance
by proxy
Absence
Consecutively Absent
From two meetings
Attendance frequency at the general meeting of shareholders
Gérard Deman
N 6 3 3 0 0 N 1
Wang Dazhuang
N 6 3 3 0 0 N 1
Jean-Marc Dublanc
N 6 3 3 0 0 N 1
Fang Yang N 5 2 3 0 0 N 1Jean Falgoux Y 6 1 5 0 0 N 1
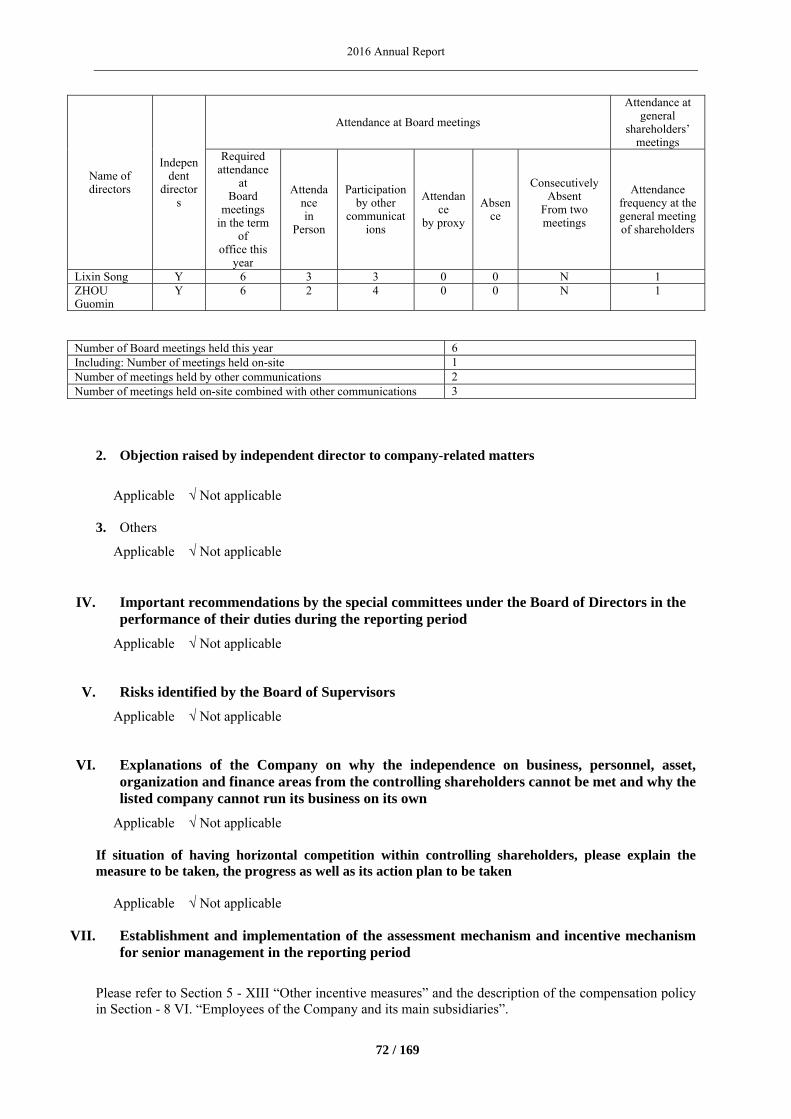
2016 Annual Report
72 / 169
Name of directors
Independent
directors
Attendance at Board meetings
Attendance atgeneral
shareholders’ meetings
Required attendance
at Board
meetings in the term
of office this
year
Attendance in
Person
Participation by other
communications
Attendance
by proxy
Absence
Consecutively Absent
From two meetings
Attendance frequency at the general meeting of shareholders
Lixin Song Y 6 3 3 0 0 N 1ZHOU Guomin
Y 6 2 4 0 0 N 1
Number of Board meetings held this year 6Including: Number of meetings held on-site 1Number of meetings held by other communications 2Number of meetings held on-site combined with other communications 3
2. Objection raised by independent director to company-related matters
Applicable √ Not applicable
3. Others
Applicable √ Not applicable
IV. Important recommendations by the special committees under the Board of Directors in the performance of their duties during the reporting period
Applicable √ Not applicable
V. Risks identified by the Board of Supervisors
Applicable √ Not applicable
VI. Explanations of the Company on why the independence on business, personnel, asset, organization and finance areas from the controlling shareholders cannot be met and why the listed company cannot run its business on its own
Applicable √ Not applicable If situation of having horizontal competition within controlling shareholders, please explain the measure to be taken, the progress as well as its action plan to be taken Applicable √ Not applicable
VII. Establishment and implementation of the assessment mechanism and incentive mechanism for senior management in the reporting period
Please refer to Section 5 - XIII “Other incentive measures” and the description of the compensation policy in Section - 8 VI. “Employees of the Company and its main subsidiaries”.
2016 Annual Report
73 / 169
VIII. Whether to disclose self-assessment report on Internal control
√Applicable Not applicable Since the completion of Major Asset Restructuring by the end of 2015, the Company has started to implement the whole internal control system in line with the C-SOX requirement. The Company has established one dedicated person to be the project leader under the leadership of the Group CFO and the Steering Committee, which is composed of Group CEO, Group CFO, Group General Counsel and Board Secretary of the listed Company. Based on the materiality principle, the Company has established a well-rounded internal control policy for those scope-in business or companies and ensure an effective implementation of the policies. The Company has performed adequate self-assessment on the effectiveness of the design as well as the implementation of the whole internal control system and it is confirmed that the Company has reached its target on the internal control and there is no material deficiency identified during the assessment. The Company will issue its self-assessment report on internal control based on C-SOX requirement. Explanation if there is material deficiency noted during reporting period Applicable √Not applicable
IX. Information related to Audit Report on Internal Control
√Applicable Not applicable KPMG Huazhen LLP issued a clean audit opinion on the Internal Control Report. Whether to disclose the audit report on Internal Control: Yes
X. Others
Applicable √Not applicable

2016 Annual Report
74 / 169
Section 10 Corporate bonds Applicable √ Not applicable

2016 Annual Report
75 / 169
Section 11 Financial Report
I. Audit report
√Applicable Not applicable
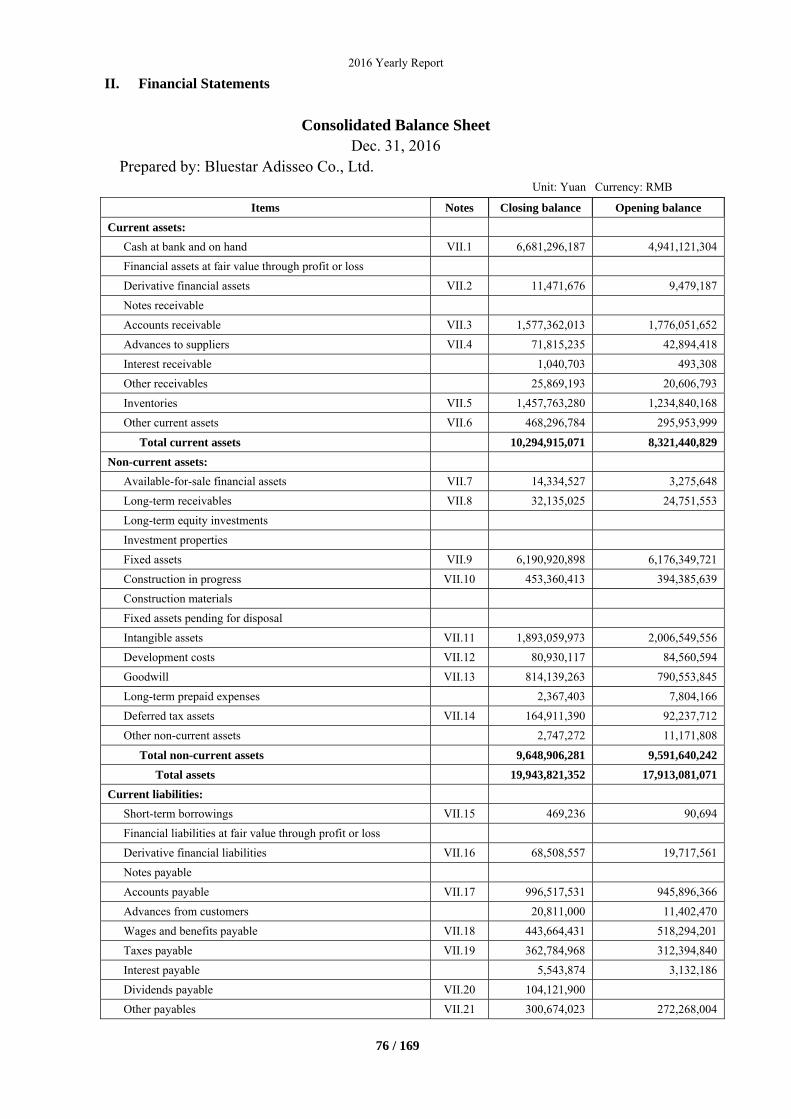
2016 Yearly Report
76 / 169
II. Financial Statements
Consolidated Balance Sheet
Dec. 31, 2016 Prepared by: Bluestar Adisseo Co., Ltd.
Unit: Yuan Currency: RMB
Items Notes Closing balance Opening balance
Current assets:
Cash at bank and on hand VII.1 6,681,296,187 4,941,121,304
Financial assets at fair value through profit or loss
Derivative financial assets VII.2 11,471,676 9,479,187
Notes receivable
Accounts receivable VII.3 1,577,362,013 1,776,051,652
Advances to suppliers VII.4 71,815,235 42,894,418
Interest receivable 1,040,703 493,308
Other receivables 25,869,193 20,606,793
Inventories VII.5 1,457,763,280 1,234,840,168
Other current assets VII.6 468,296,784 295,953,999
Total current assets 10,294,915,071 8,321,440,829
Non-current assets:
Available-for-sale financial assets VII.7 14,334,527 3,275,648
Long-term receivables VII.8 32,135,025 24,751,553
Long-term equity investments
Investment properties
Fixed assets VII.9 6,190,920,898 6,176,349,721
Construction in progress VII.10 453,360,413 394,385,639
Construction materials
Fixed assets pending for disposal
Intangible assets VII.11 1,893,059,973 2,006,549,556
Development costs VII.12 80,930,117 84,560,594
Goodwill VII.13 814,139,263 790,553,845
Long-term prepaid expenses 2,367,403 7,804,166
Deferred tax assets VII.14 164,911,390 92,237,712
Other non-current assets 2,747,272 11,171,808
Total non-current assets 9,648,906,281 9,591,640,242
Total assets 19,943,821,352 17,913,081,071
Current liabilities:
Short-term borrowings VII.15 469,236 90,694
Financial liabilities at fair value through profit or loss
Derivative financial liabilities VII.16 68,508,557 19,717,561
Notes payable
Accounts payable VII.17 996,517,531 945,896,366
Advances from customers 20,811,000 11,402,470
Wages and benefits payable VII.18 443,664,431 518,294,201
Taxes payable VII.19 362,784,968 312,394,840
Interest payable 5,543,874 3,132,186
Dividends payable VII.20 104,121,900
Other payables VII.21 300,674,023 272,268,004
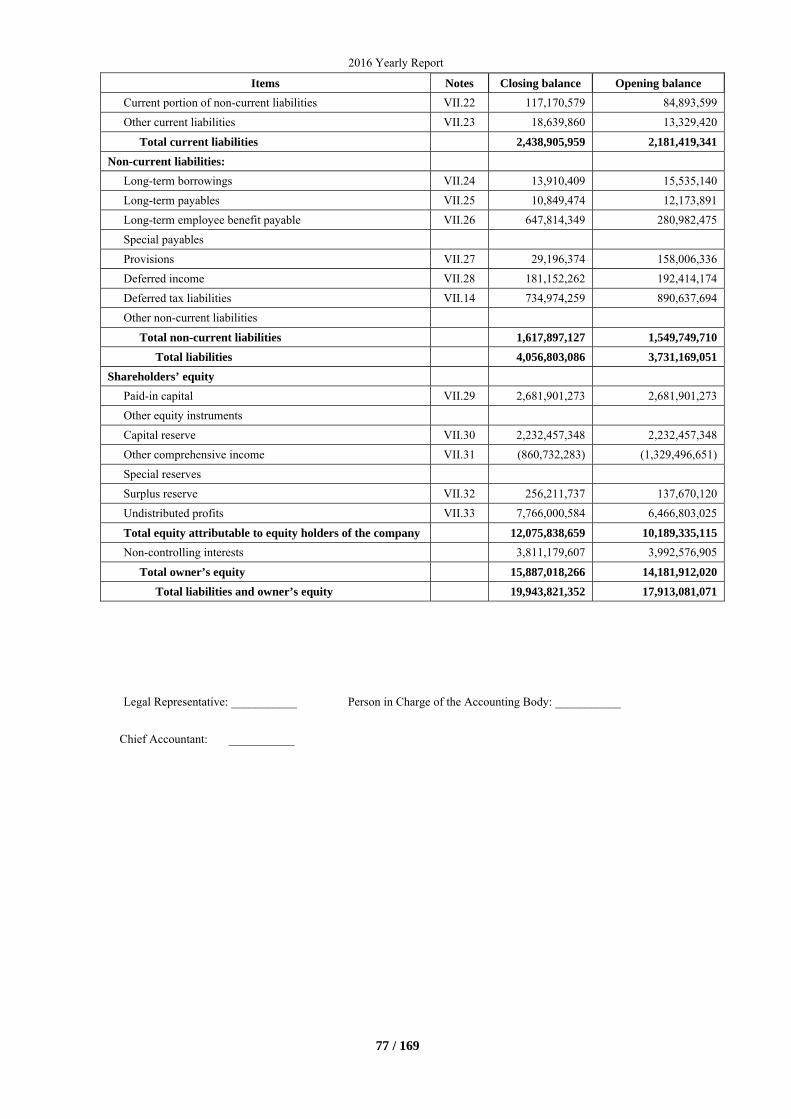
2016 Yearly Report
77 / 169
Items Notes Closing balance Opening balance
Current portion of non-current liabilities VII.22 117,170,579 84,893,599
Other current liabilities VII.23 18,639,860 13,329,420
Total current liabilities 2,438,905,959 2,181,419,341
Non-current liabilities:
Long-term borrowings VII.24 13,910,409 15,535,140
Long-term payables VII.25 10,849,474 12,173,891
Long-term employee benefit payable VII.26 647,814,349 280,982,475
Special payables
Provisions VII.27 29,196,374 158,006,336
Deferred income VII.28 181,152,262 192,414,174
Deferred tax liabilities VII.14 734,974,259 890,637,694
Other non-current liabilities
Total non-current liabilities 1,617,897,127 1,549,749,710
Total liabilities 4,056,803,086 3,731,169,051
Shareholders’ equity
Paid-in capital VII.29 2,681,901,273 2,681,901,273
Other equity instruments
Capital reserve VII.30 2,232,457,348 2,232,457,348
Other comprehensive income VII.31 (860,732,283) (1,329,496,651)
Special reserves
Surplus reserve VII.32 256,211,737 137,670,120
Undistributed profits VII.33 7,766,000,584 6,466,803,025
Total equity attributable to equity holders of the company 12,075,838,659 10,189,335,115
Non-controlling interests 3,811,179,607 3,992,576,905
Total owner’s equity 15,887,018,266 14,181,912,020
Total liabilities and owner’s equity 19,943,821,352 17,913,081,071
Legal Representative: ___________ Person in Charge of the Accounting Body: ___________
Chief Accountant: ___________
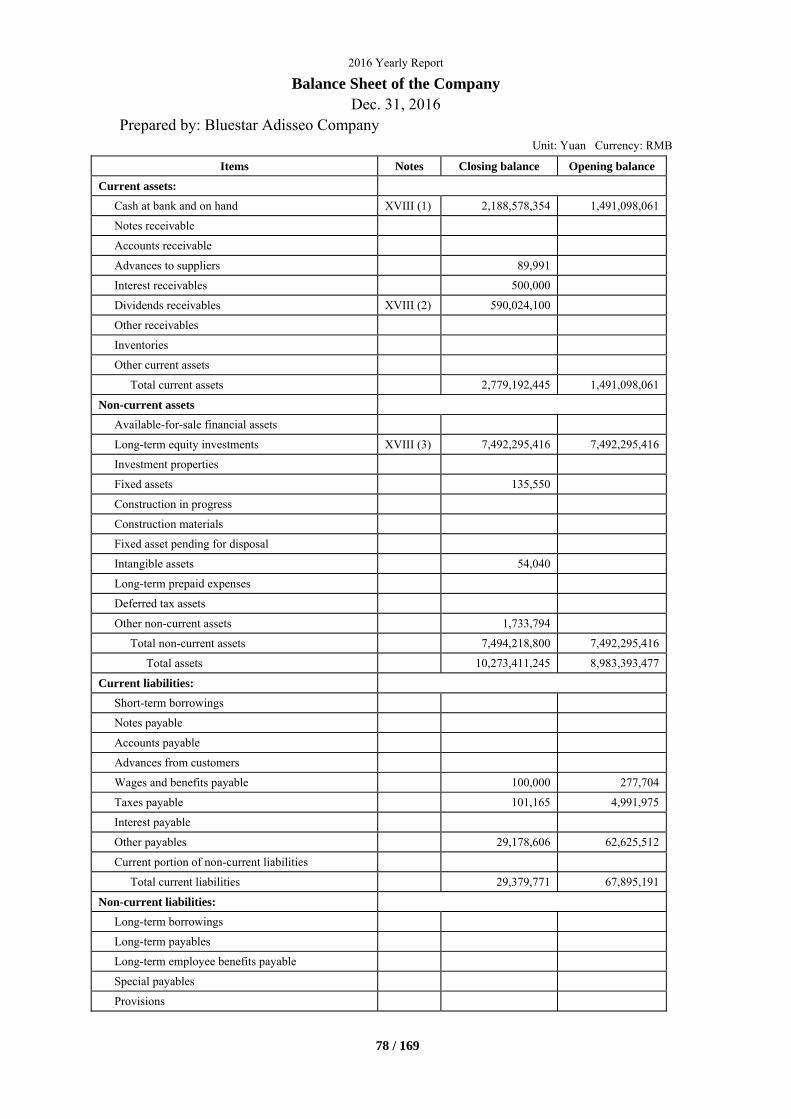
2016 Yearly Report
78 / 169
Balance Sheet of the Company Dec. 31, 2016
Prepared by: Bluestar Adisseo Company Unit: Yuan Currency: RMB
Items Notes Closing balance Opening balance
Current assets:
Cash at bank and on hand XVIII (1) 2,188,578,354 1,491,098,061
Notes receivable
Accounts receivable
Advances to suppliers 89,991
Interest receivables 500,000
Dividends receivables XVIII (2) 590,024,100
Other receivables
Inventories
Other current assets
Total current assets 2,779,192,445 1,491,098,061
Non-current assets
Available-for-sale financial assets
Long-term equity investments XVIII (3) 7,492,295,416 7,492,295,416
Investment properties
Fixed assets 135,550
Construction in progress
Construction materials
Fixed asset pending for disposal
Intangible assets 54,040
Long-term prepaid expenses
Deferred tax assets
Other non-current assets 1,733,794
Total non-current assets 7,494,218,800 7,492,295,416
Total assets 10,273,411,245 8,983,393,477
Current liabilities:
Short-term borrowings
Notes payable
Accounts payable
Advances from customers
Wages and benefits payable 100,000 277,704
Taxes payable 101,165 4,991,975
Interest payable
Other payables 29,178,606 62,625,512
Current portion of non-current liabilities
Total current liabilities 29,379,771 67,895,191
Non-current liabilities:
Long-term borrowings
Long-term payables
Long-term employee benefits payable
Special payables
Provisions
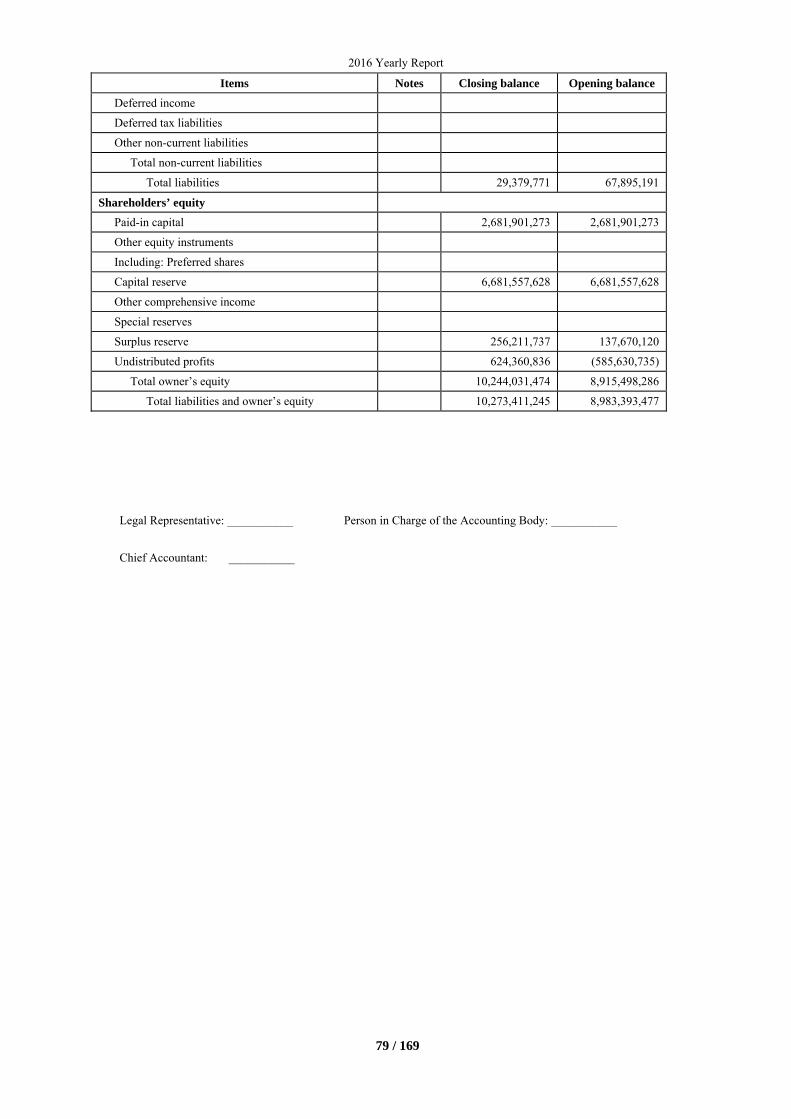
2016 Yearly Report
79 / 169
Items Notes Closing balance Opening balance
Deferred income
Deferred tax liabilities
Other non-current liabilities
Total non-current liabilities
Total liabilities 29,379,771 67,895,191
Shareholders’ equity
Paid-in capital 2,681,901,273 2,681,901,273
Other equity instruments
Including: Preferred shares
Capital reserve 6,681,557,628 6,681,557,628
Other comprehensive income
Special reserves
Surplus reserve 256,211,737 137,670,120
Undistributed profits 624,360,836 (585,630,735)
Total owner’s equity 10,244,031,474 8,915,498,286
Total liabilities and owner’s equity 10,273,411,245 8,983,393,477
Legal Representative: ___________ Person in Charge of the Accounting Body: ___________
Chief Accountant: ___________
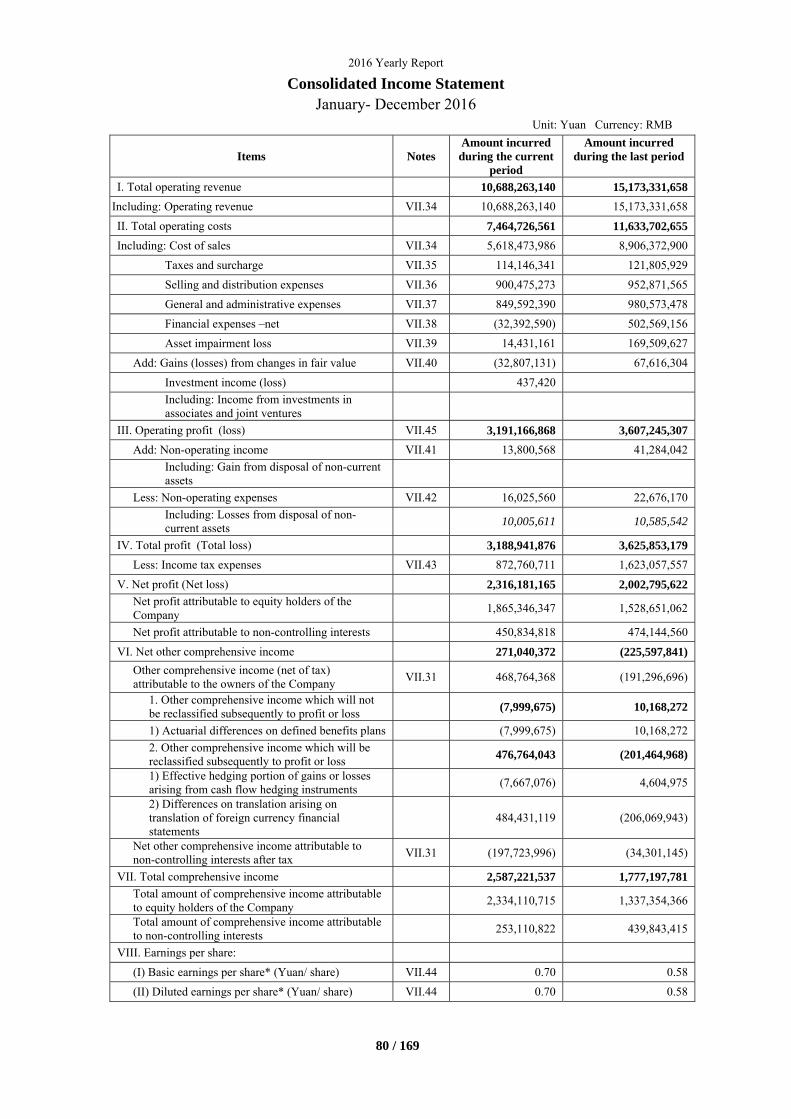
2016 Yearly Report
80 / 169
Consolidated Income Statement January- December 2016
Unit: Yuan Currency: RMB
Items Notes Amount incurred during the current
period
Amount incurred during the last period
I. Total operating revenue 10,688,263,140 15,173,331,658
Including: Operating revenue VII.34 10,688,263,140 15,173,331,658
II. Total operating costs 7,464,726,561 11,633,702,655
Including: Cost of sales VII.34 5,618,473,986 8,906,372,900
Taxes and surcharge VII.35 114,146,341 121,805,929
Selling and distribution expenses VII.36 900,475,273 952,871,565
General and administrative expenses VII.37 849,592,390 980,573,478
Financial expenses –net VII.38 (32,392,590) 502,569,156
Asset impairment loss VII.39 14,431,161 169,509,627
Add: Gains (losses) from changes in fair value VII.40 (32,807,131) 67,616,304
Investment income (loss) 437,420
Including: Income from investments in associates and joint ventures
III. Operating profit (loss) VII.45 3,191,166,868 3,607,245,307
Add: Non-operating income VII.41 13,800,568 41,284,042
Including: Gain from disposal of non-current assets
Less: Non-operating expenses VII.42 16,025,560 22,676,170
Including: Losses from disposal of non-current assets
10,005,611 10,585,542
IV. Total profit (Total loss) 3,188,941,876 3,625,853,179
Less: Income tax expenses VII.43 872,760,711 1,623,057,557
V. Net profit (Net loss) 2,316,181,165 2,002,795,622
Net profit attributable to equity holders of the Company
1,865,346,347 1,528,651,062
Net profit attributable to non-controlling interests 450,834,818 474,144,560
VI. Net other comprehensive income 271,040,372 (225,597,841)
Other comprehensive income (net of tax) attributable to the owners of the Company
VII.31 468,764,368 (191,296,696)
1. Other comprehensive income which will not be reclassified subsequently to profit or loss
(7,999,675) 10,168,272
1) Actuarial differences on defined benefits plans (7,999,675) 10,168,272
2. Other comprehensive income which will be reclassified subsequently to profit or loss
476,764,043 (201,464,968)
1) Effective hedging portion of gains or losses arising from cash flow hedging instruments
(7,667,076) 4,604,975
2) Differences on translation arising on translation of foreign currency financial statements
484,431,119 (206,069,943)
Net other comprehensive income attributable to non-controlling interests after tax
VII.31 (197,723,996) (34,301,145)
VII. Total comprehensive income 2,587,221,537 1,777,197,781
Total amount of comprehensive income attributable to equity holders of the Company
2,334,110,715 1,337,354,366
Total amount of comprehensive income attributable to non-controlling interests
253,110,822 439,843,415
VIII. Earnings per share:
(I) Basic earnings per share* (Yuan/ share) VII.44 0.70 0.58
(II) Diluted earnings per share* (Yuan/ share) VII.44 0.70 0.58

2016 Yearly Report
81 / 169
*For business combination involving entities under common control occurred during last period, net profit of the
acquiree realized before the business combination is RMB 1,548,467,983 for the year ended December 31, 2015.
Legal Representative: ___________ Person in Charge of the Accounting Body: ___________
Chief Accountant: ___________
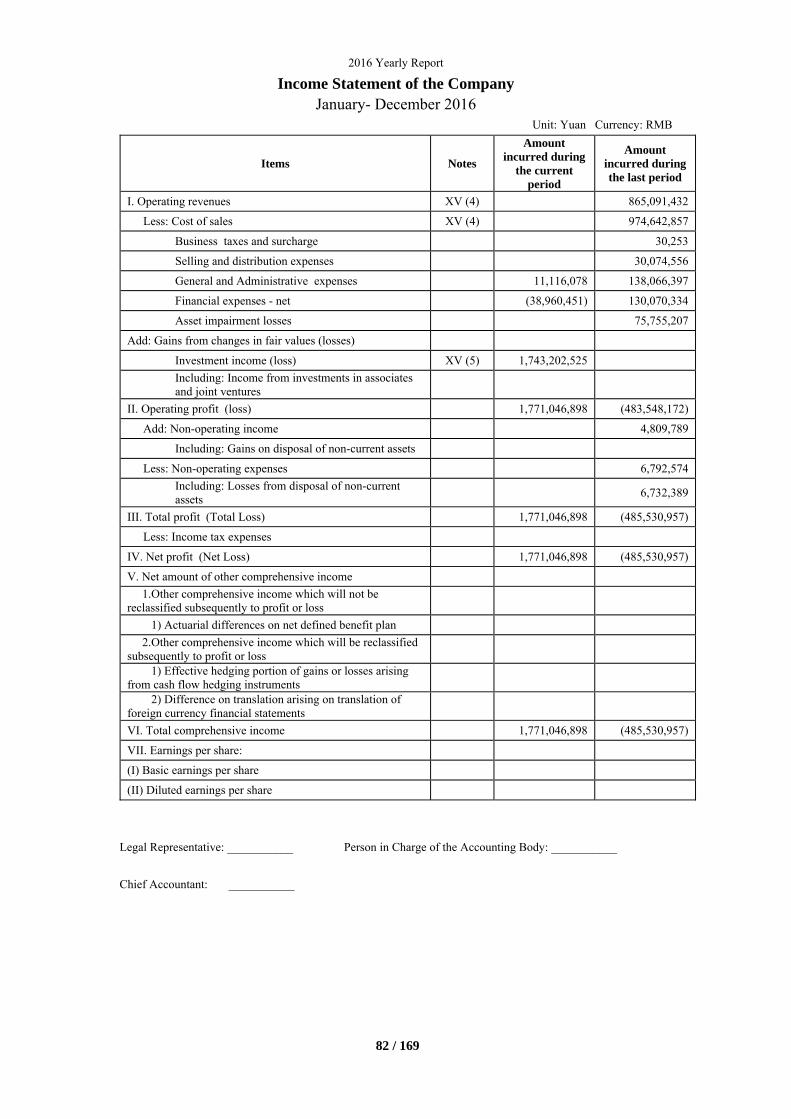
2016 Yearly Report
82 / 169
Income Statement of the Company January- December 2016
Unit: Yuan Currency: RMB
Items Notes
Amount incurred during
the current period
Amount incurred during the last period
I. Operating revenues XV (4) 865,091,432
Less: Cost of sales XV (4) 974,642,857
Business taxes and surcharge 30,253
Selling and distribution expenses 30,074,556
General and Administrative expenses 11,116,078 138,066,397
Financial expenses - net (38,960,451) 130,070,334
Asset impairment losses 75,755,207
Add: Gains from changes in fair values (losses)
Investment income (loss) XV (5) 1,743,202,525
Including: Income from investments in associates and joint ventures
II. Operating profit (loss) 1,771,046,898 (483,548,172)
Add: Non-operating income 4,809,789
Including: Gains on disposal of non-current assets
Less: Non-operating expenses 6,792,574
Including: Losses from disposal of non-current assets
6,732,389
III. Total profit (Total Loss) 1,771,046,898 (485,530,957)
Less: Income tax expenses
IV. Net profit (Net Loss) 1,771,046,898 (485,530,957)
V. Net amount of other comprehensive income
1.Other comprehensive income which will not be reclassified subsequently to profit or loss
1) Actuarial differences on net defined benefit plan
2.Other comprehensive income which will be reclassified subsequently to profit or loss
1) Effective hedging portion of gains or losses arising from cash flow hedging instruments
2) Difference on translation arising on translation of foreign currency financial statements
VI. Total comprehensive income 1,771,046,898 (485,530,957)
VII. Earnings per share:
(I) Basic earnings per share
(II) Diluted earnings per share
Legal Representative: ___________ Person in Charge of the Accounting Body: ___________
Chief Accountant: ___________
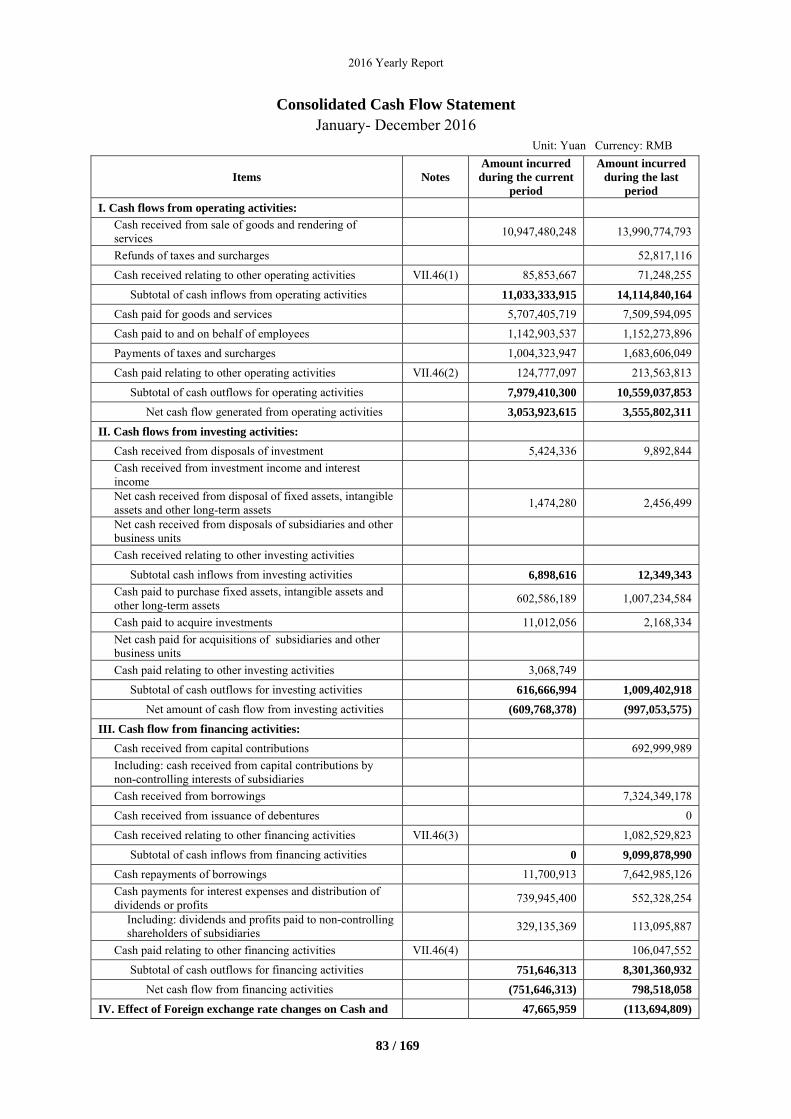
2016 Yearly Report
83 / 169
Consolidated Cash Flow Statement
January- December 2016 Unit: Yuan Currency: RMB
Items Notes Amount incurred during the current
period
Amount incurred during the last
period
I. Cash flows from operating activities:
Cash received from sale of goods and rendering of services
10,947,480,248 13,990,774,793
Refunds of taxes and surcharges 52,817,116
Cash received relating to other operating activities VII.46(1) 85,853,667 71,248,255
Subtotal of cash inflows from operating activities 11,033,333,915 14,114,840,164
Cash paid for goods and services 5,707,405,719 7,509,594,095
Cash paid to and on behalf of employees 1,142,903,537 1,152,273,896
Payments of taxes and surcharges 1,004,323,947 1,683,606,049
Cash paid relating to other operating activities VII.46(2) 124,777,097 213,563,813
Subtotal of cash outflows for operating activities 7,979,410,300 10,559,037,853
Net cash flow generated from operating activities 3,053,923,615 3,555,802,311
II. Cash flows from investing activities:
Cash received from disposals of investment 5,424,336 9,892,844
Cash received from investment income and interest income
Net cash received from disposal of fixed assets, intangible assets and other long-term assets
1,474,280 2,456,499
Net cash received from disposals of subsidiaries and other business units
Cash received relating to other investing activities
Subtotal cash inflows from investing activities 6,898,616 12,349,343
Cash paid to purchase fixed assets, intangible assets and other long-term assets
602,586,189 1,007,234,584
Cash paid to acquire investments 11,012,056 2,168,334
Net cash paid for acquisitions of subsidiaries and other business units
Cash paid relating to other investing activities 3,068,749
Subtotal of cash outflows for investing activities 616,666,994 1,009,402,918
Net amount of cash flow from investing activities (609,768,378) (997,053,575)
III. Cash flow from financing activities:
Cash received from capital contributions 692,999,989
Including: cash received from capital contributions by non-controlling interests of subsidiaries
Cash received from borrowings 7,324,349,178
Cash received from issuance of debentures 0
Cash received relating to other financing activities VII.46(3) 1,082,529,823
Subtotal of cash inflows from financing activities 0 9,099,878,990
Cash repayments of borrowings 11,700,913 7,642,985,126
Cash payments for interest expenses and distribution of dividends or profits
739,945,400 552,328,254
Including: dividends and profits paid to non-controlling shareholders of subsidiaries
329,135,369 113,095,887
Cash paid relating to other financing activities VII.46(4) 106,047,552
Subtotal of cash outflows for financing activities 751,646,313 8,301,360,932
Net cash flow from financing activities (751,646,313) 798,518,058
IV. Effect of Foreign exchange rate changes on Cash and 47,665,959 (113,694,809)
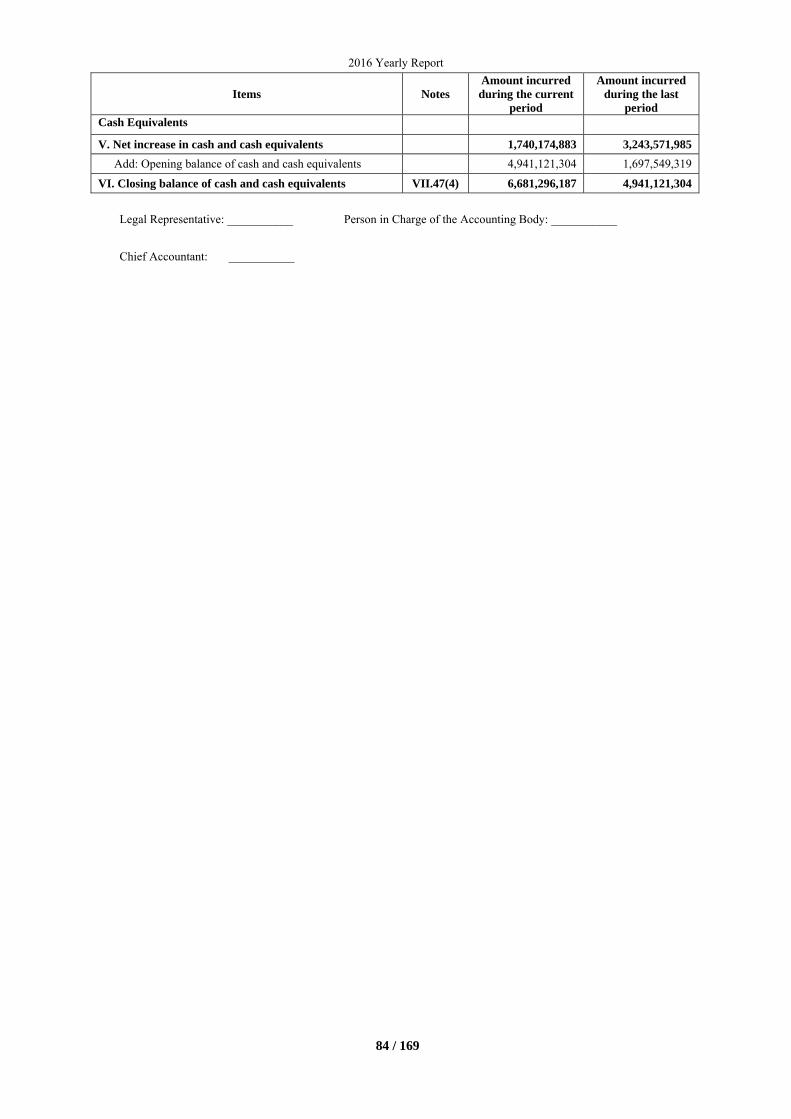
2016 Yearly Report
84 / 169
Items Notes Amount incurred during the current
period
Amount incurred during the last
period Cash Equivalents
V. Net increase in cash and cash equivalents 1,740,174,883 3,243,571,985
Add: Opening balance of cash and cash equivalents 4,941,121,304 1,697,549,319
VI. Closing balance of cash and cash equivalents VII.47(4) 6,681,296,187 4,941,121,304
Legal Representative: ___________ Person in Charge of the Accounting Body: ___________
Chief Accountant: ___________
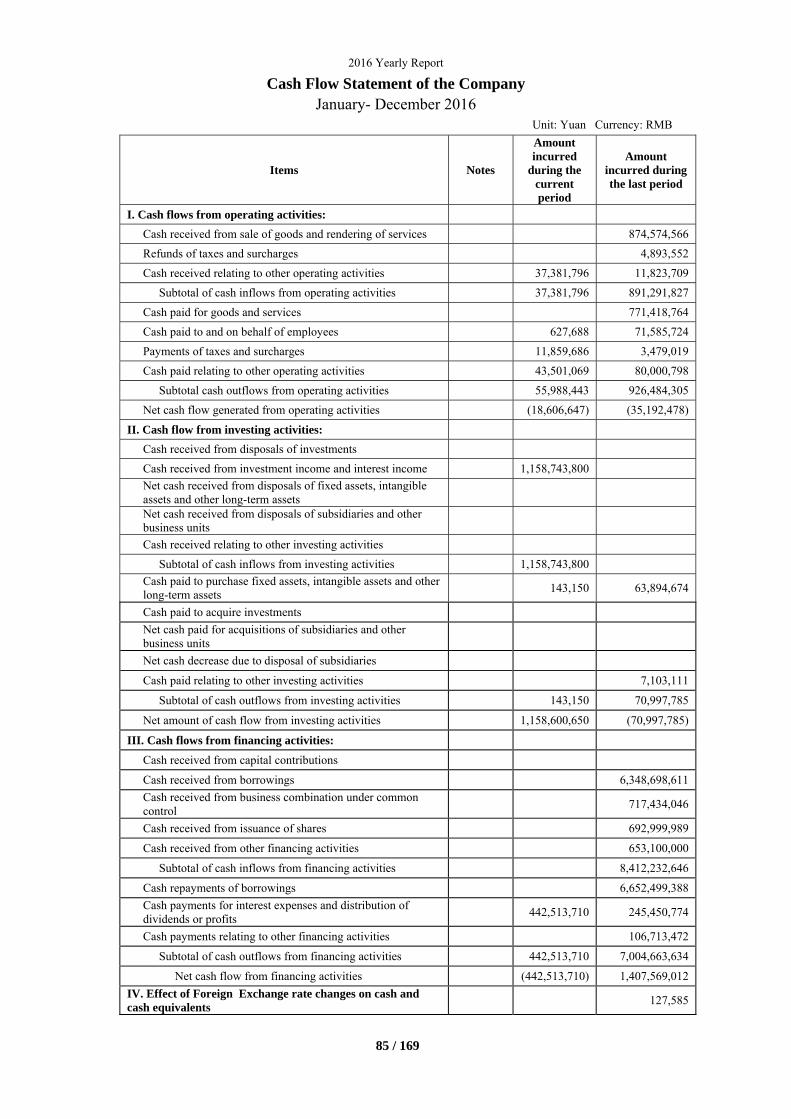
2016 Yearly Report
85 / 169
Cash Flow Statement of the Company January- December 2016
Unit: Yuan Currency: RMB
Items Notes
Amount incurred
during the current period
Amount incurred during the last period
I. Cash flows from operating activities:
Cash received from sale of goods and rendering of services 874,574,566
Refunds of taxes and surcharges 4,893,552
Cash received relating to other operating activities 37,381,796 11,823,709
Subtotal of cash inflows from operating activities 37,381,796 891,291,827
Cash paid for goods and services 771,418,764
Cash paid to and on behalf of employees 627,688 71,585,724
Payments of taxes and surcharges 11,859,686 3,479,019
Cash paid relating to other operating activities 43,501,069 80,000,798
Subtotal cash outflows from operating activities 55,988,443 926,484,305
Net cash flow generated from operating activities (18,606,647) (35,192,478)
II. Cash flow from investing activities:
Cash received from disposals of investments
Cash received from investment income and interest income 1,158,743,800
Net cash received from disposals of fixed assets, intangible assets and other long-term assets
Net cash received from disposals of subsidiaries and other business units
Cash received relating to other investing activities
Subtotal of cash inflows from investing activities 1,158,743,800
Cash paid to purchase fixed assets, intangible assets and other long-term assets
143,150 63,894,674
Cash paid to acquire investments
Net cash paid for acquisitions of subsidiaries and other business units
Net cash decrease due to disposal of subsidiaries
Cash paid relating to other investing activities 7,103,111
Subtotal of cash outflows from investing activities 143,150 70,997,785
Net amount of cash flow from investing activities 1,158,600,650 (70,997,785)
III. Cash flows from financing activities:
Cash received from capital contributions
Cash received from borrowings 6,348,698,611
Cash received from business combination under common control
717,434,046
Cash received from issuance of shares 692,999,989
Cash received from other financing activities 653,100,000
Subtotal of cash inflows from financing activities 8,412,232,646
Cash repayments of borrowings 6,652,499,388
Cash payments for interest expenses and distribution of dividends or profits
442,513,710 245,450,774
Cash payments relating to other financing activities 106,713,472
Subtotal of cash outflows from financing activities 442,513,710 7,004,663,634
Net cash flow from financing activities (442,513,710) 1,407,569,012
IV. Effect of Foreign Exchange rate changes on cash and cash equivalents
127,585
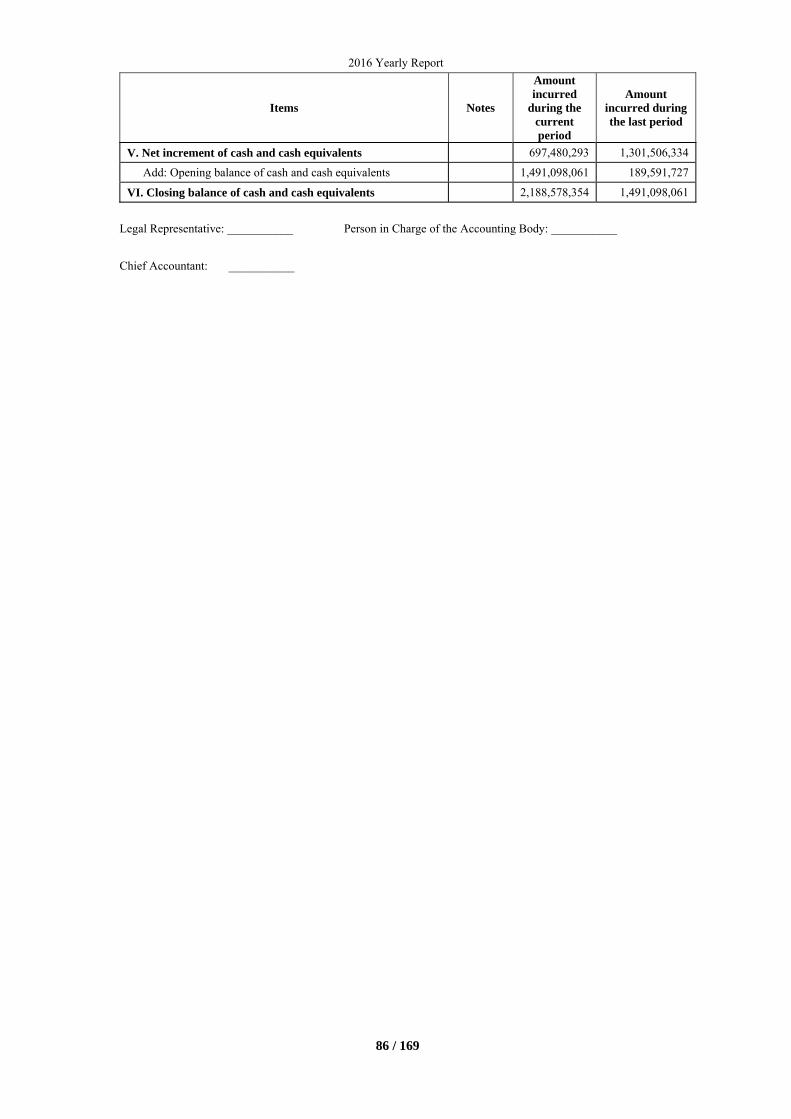
2016 Yearly Report
86 / 169
Items Notes
Amount incurred
during the current period
Amount incurred during the last period
V. Net increment of cash and cash equivalents 697,480,293 1,301,506,334
Add: Opening balance of cash and cash equivalents 1,491,098,061 189,591,727
VI. Closing balance of cash and cash equivalents 2,188,578,354 1,491,098,061
Legal Representative: ___________ Person in Charge of the Accounting Body: ___________
Chief Accountant: ___________
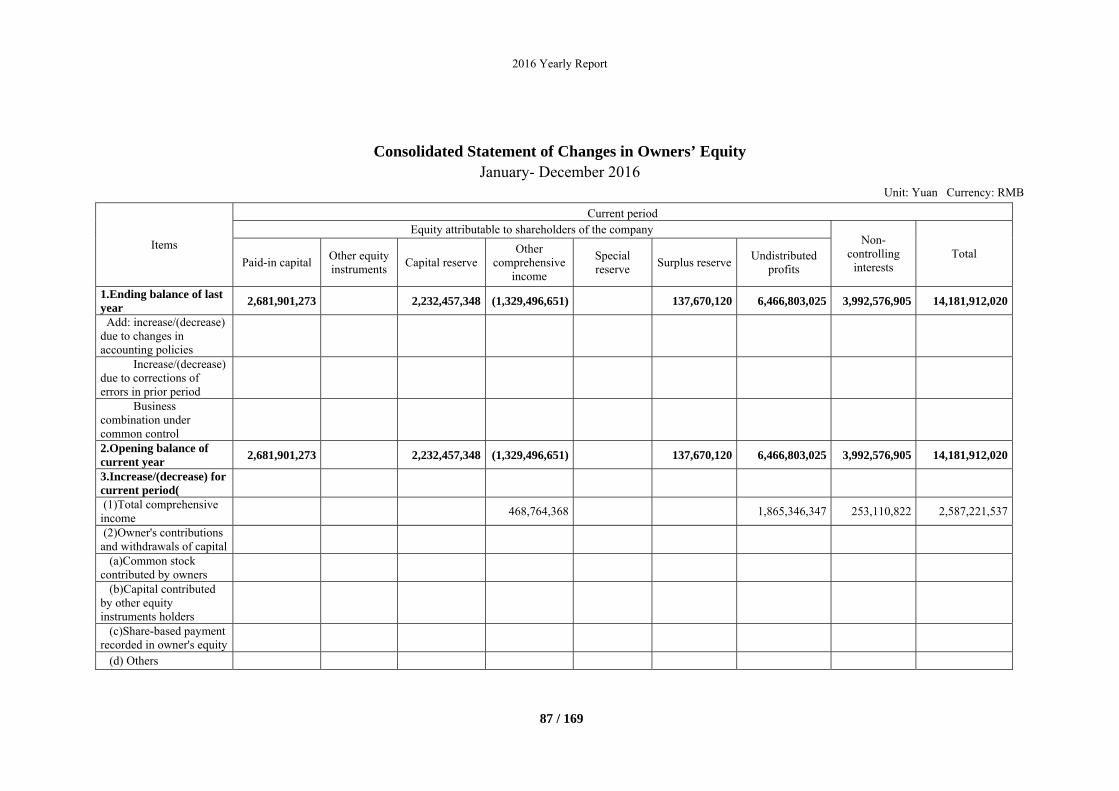
2016 Yearly Report
87 / 169
Consolidated Statement of Changes in Owners’ Equity
January- December 2016 Unit: Yuan Currency: RMB
Items
Current period Equity attributable to shareholders of the company
Non-controlling
interests Total
Paid-in capital Other equity instruments
Capital reserveOther
comprehensive income
Special reserve
Surplus reserveUndistributed
profits
1.Ending balance of last year
2,681,901,273 2,232,457,348 (1,329,496,651) 137,670,120 6,466,803,025 3,992,576,905 14,181,912,020
Add: increase/(decrease) due to changes in accounting policies
Increase/(decrease) due to corrections of errors in prior period
Business combination under common control
2.Opening balance of current year
2,681,901,273 2,232,457,348 (1,329,496,651) 137,670,120 6,466,803,025 3,992,576,905 14,181,912,020
3.Increase/(decrease) for current period(
(1)Total comprehensive income
468,764,368 1,865,346,347 253,110,822 2,587,221,537
(2)Owner's contributions and withdrawals of capital
(a)Common stock contributed by owners
(b)Capital contributed by other equity instruments holders
(c)Share-based payment recorded in owner's equity
(d) Others
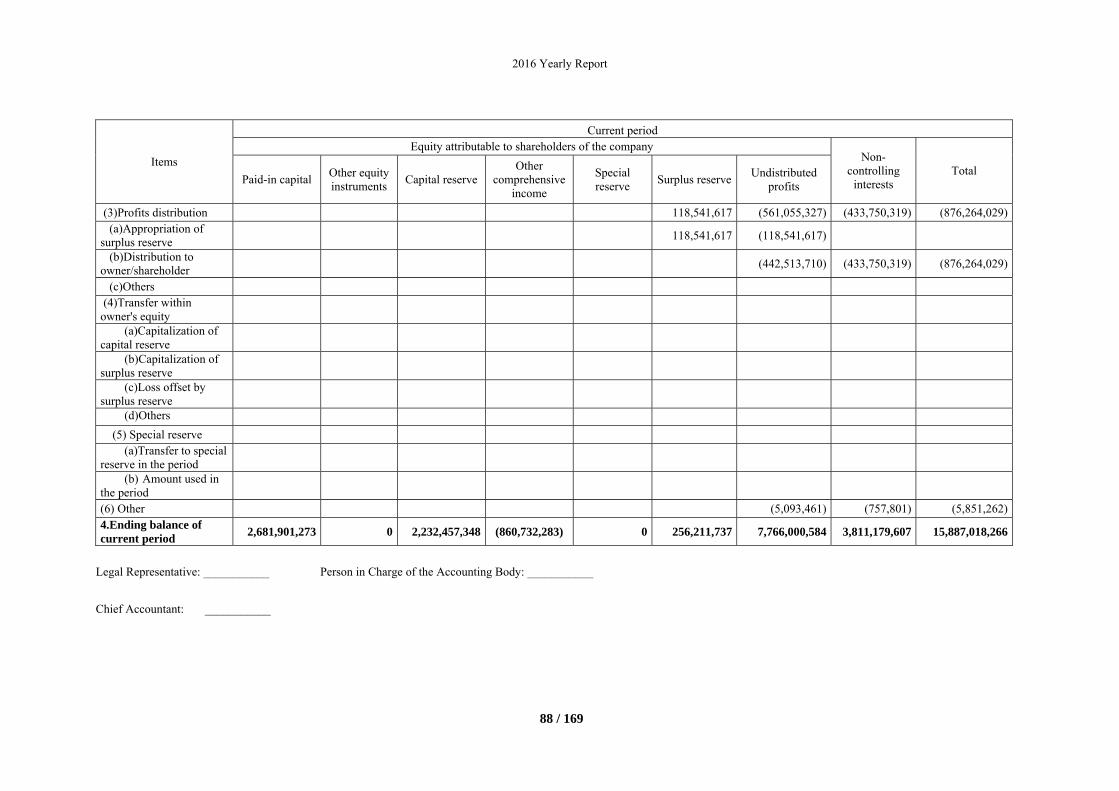
2016 Yearly Report
88 / 169
Items
Current period Equity attributable to shareholders of the company
Non-controlling
interests Total
Paid-in capital Other equity instruments
Capital reserveOther
comprehensive income
Special reserve
Surplus reserveUndistributed
profits
(3)Profits distribution 118,541,617 (561,055,327) (433,750,319) (876,264,029) (a)Appropriation of surplus reserve
118,541,617 (118,541,617)
(b)Distribution to owner/shareholder
(442,513,710) (433,750,319) (876,264,029)
(c)Others (4)Transfer within owner's equity
(a)Capitalization of capital reserve
(b)Capitalization of surplus reserve
(c)Loss offset by surplus reserve
(d)Others
(5) Special reserve (a)Transfer to special reserve in the period
(b) Amount used in the period
(6) Other (5,093,461) (757,801) (5,851,262) 4.Ending balance of current period
2,681,901,273 0 2,232,457,348 (860,732,283) 0 256,211,737 7,766,000,584 3,811,179,607 15,887,018,266
Legal Representative: ___________ Person in Charge of the Accounting Body: ___________
Chief Accountant: ___________
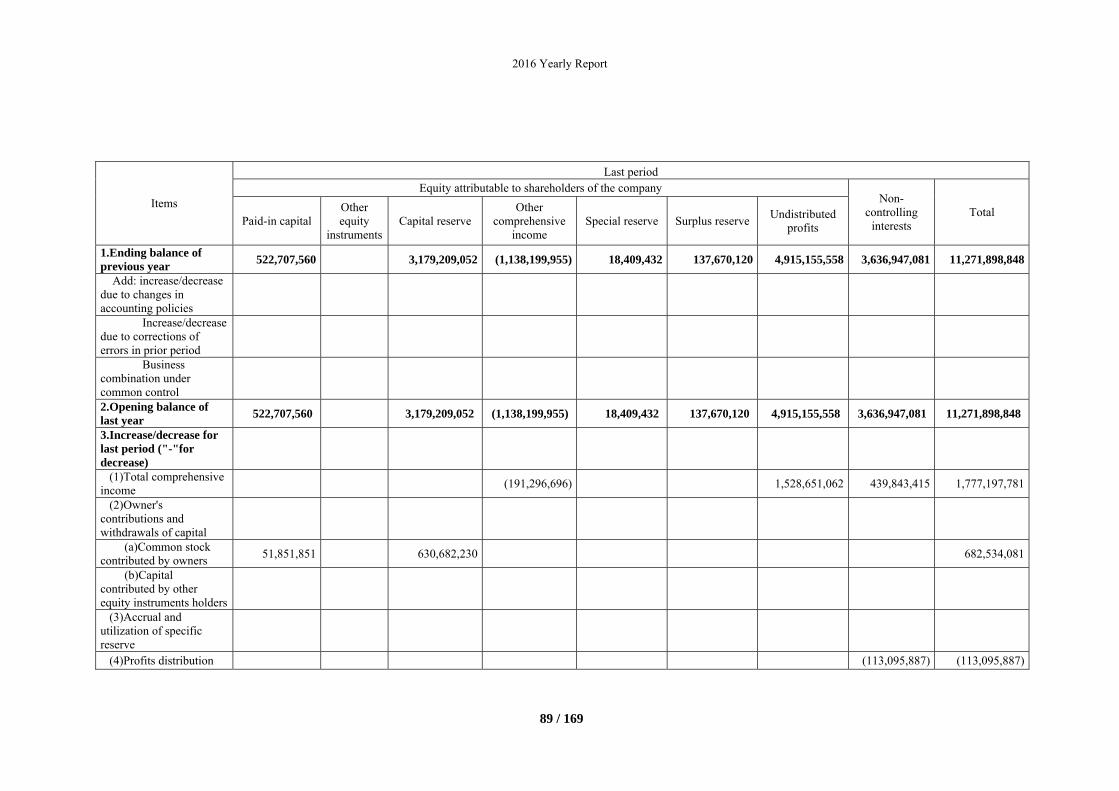
2016 Yearly Report
89 / 169
Items
Last period Equity attributable to shareholders of the company
Non-controlling
interests Total
Paid-in capital Other equity
instrumentsCapital reserve
Other comprehensive
income Special reserve Surplus reserve
Undistributed profits
1.Ending balance of previous year
522,707,560 3,179,209,052 (1,138,199,955) 18,409,432 137,670,120 4,915,155,558 3,636,947,081 11,271,898,848
Add: increase/decrease due to changes in accounting policies
Increase/decrease due to corrections of errors in prior period
Business combination under common control
2.Opening balance of last year
522,707,560 3,179,209,052 (1,138,199,955) 18,409,432 137,670,120 4,915,155,558 3,636,947,081 11,271,898,848
3.Increase/decrease for last period ("-"for decrease)
(1)Total comprehensive income
(191,296,696) 1,528,651,062 439,843,415 1,777,197,781
(2)Owner's contributions and withdrawals of capital
(a)Common stock contributed by owners
51,851,851 630,682,230 682,534,081
(b)Capital contributed by other equity instruments holders
(3)Accrual and utilization of specific reserve
(4)Profits distribution (113,095,887) (113,095,887)
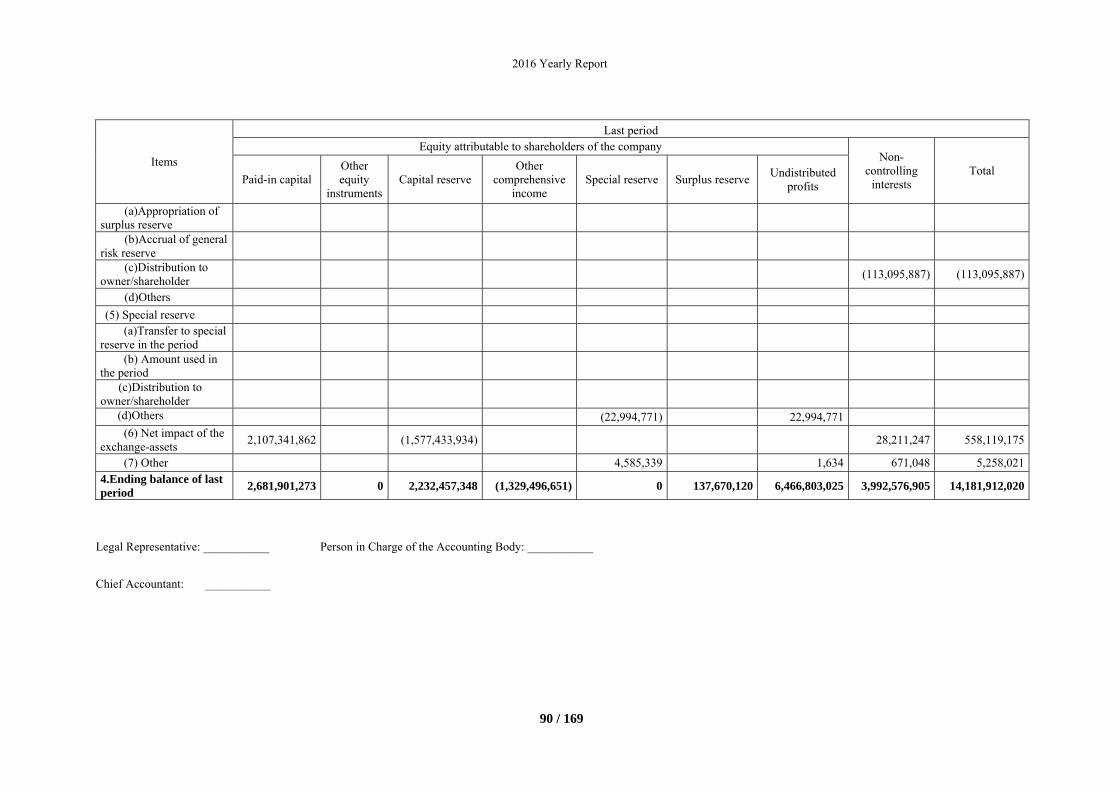
2016 Yearly Report
90 / 169
Items
Last period Equity attributable to shareholders of the company
Non-controlling
interests Total
Paid-in capital Other equity
instrumentsCapital reserve
Other comprehensive
income Special reserve Surplus reserve
Undistributed profits
(a)Appropriation of surplus reserve
(b)Accrual of general risk reserve
(c)Distribution to owner/shareholder
(113,095,887) (113,095,887)
(d)Others
(5) Special reserve (a)Transfer to special
reserve in the period
(b) Amount used in the period
(c)Distribution to owner/shareholder
(d)Others (22,994,771) 22,994,771 (6) Net impact of the
exchange-assets 2,107,341,862 (1,577,433,934) 28,211,247 558,119,175
(7) Other 4,585,339 1,634 671,048 5,258,021 4.Ending balance of last period
2,681,901,273 0 2,232,457,348 (1,329,496,651) 0 137,670,120 6,466,803,025 3,992,576,905 14,181,912,020
Legal Representative: ___________ Person in Charge of the Accounting Body: ___________
Chief Accountant: ___________
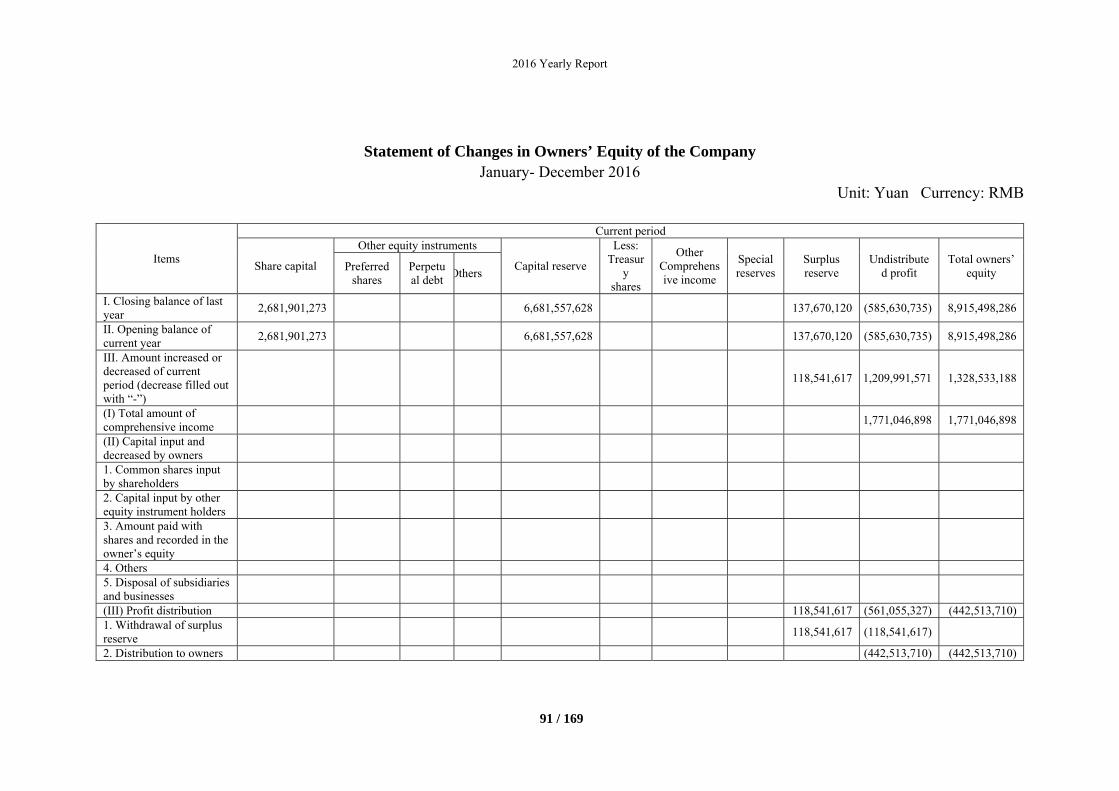
2016 Yearly Report
91 / 169
Statement of Changes in Owners’ Equity of the Company
January- December 2016 Unit: Yuan Currency: RMB
Items
Current period
Share capital
Other equity instruments
Capital reserve
Less: Treasur
y shares
Other Comprehensive income
Special reserves
Surplus reserve
Undistributed profit
Total owners’ equity Preferred
shares Perpetual debt
Others
I. Closing balance of last year
2,681,901,273 6,681,557,628 137,670,120 (585,630,735) 8,915,498,286
II. Opening balance of current year
2,681,901,273 6,681,557,628 137,670,120 (585,630,735) 8,915,498,286
III. Amount increased or decreased of current period (decrease filled out with “-”)
118,541,617 1,209,991,571 1,328,533,188
(I) Total amount of comprehensive income
1,771,046,898 1,771,046,898
(II) Capital input and decreased by owners
1. Common shares input by shareholders
2. Capital input by other equity instrument holders
3. Amount paid with shares and recorded in the owner’s equity
4. Others 5. Disposal of subsidiaries and businesses
(III) Profit distribution 118,541,617 (561,055,327) (442,513,710) 1. Withdrawal of surplus reserve
118,541,617 (118,541,617)
2. Distribution to owners (442,513,710) (442,513,710)
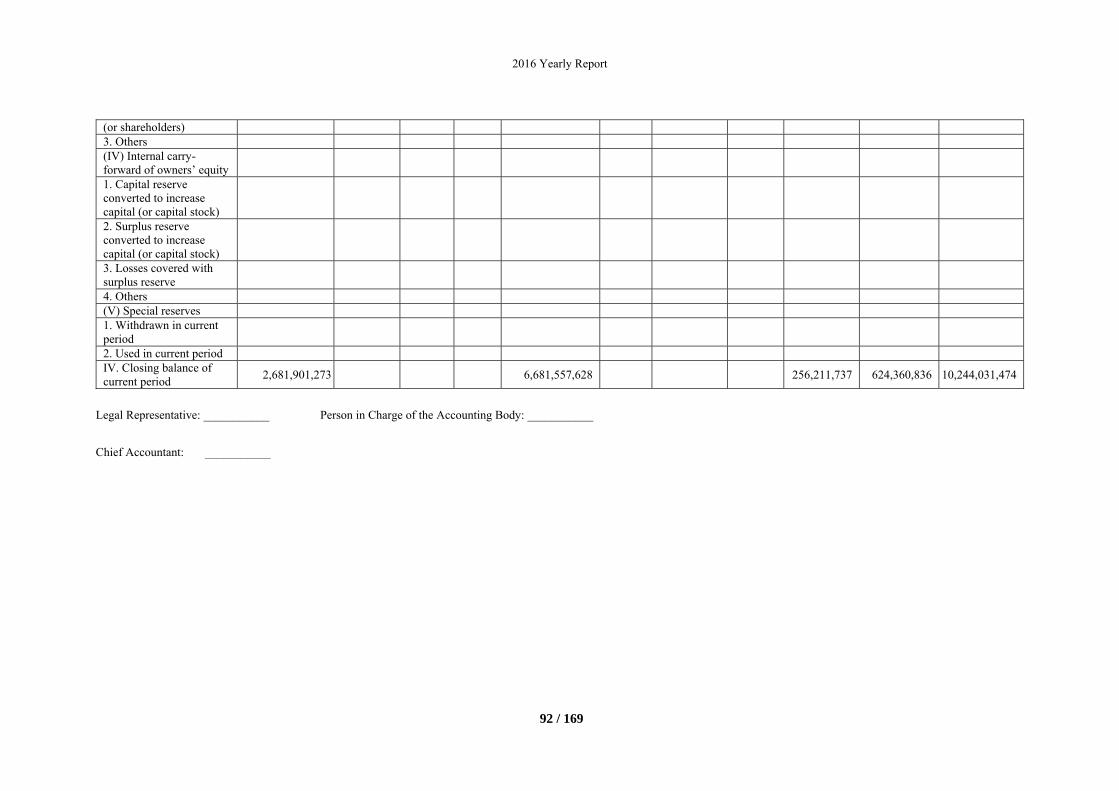
2016 Yearly Report
92 / 169
(or shareholders) 3. Others (IV) Internal carry-forward of owners’ equity
1. Capital reserve converted to increase capital (or capital stock)
2. Surplus reserve converted to increase capital (or capital stock)
3. Losses covered with surplus reserve
4. Others (V) Special reserves 1. Withdrawn in current period
2. Used in current period IV. Closing balance of current period
2,681,901,273 6,681,557,628 256,211,737 624,360,836 10,244,031,474
Legal Representative: ___________ Person in Charge of the Accounting Body: ___________
Chief Accountant: ___________
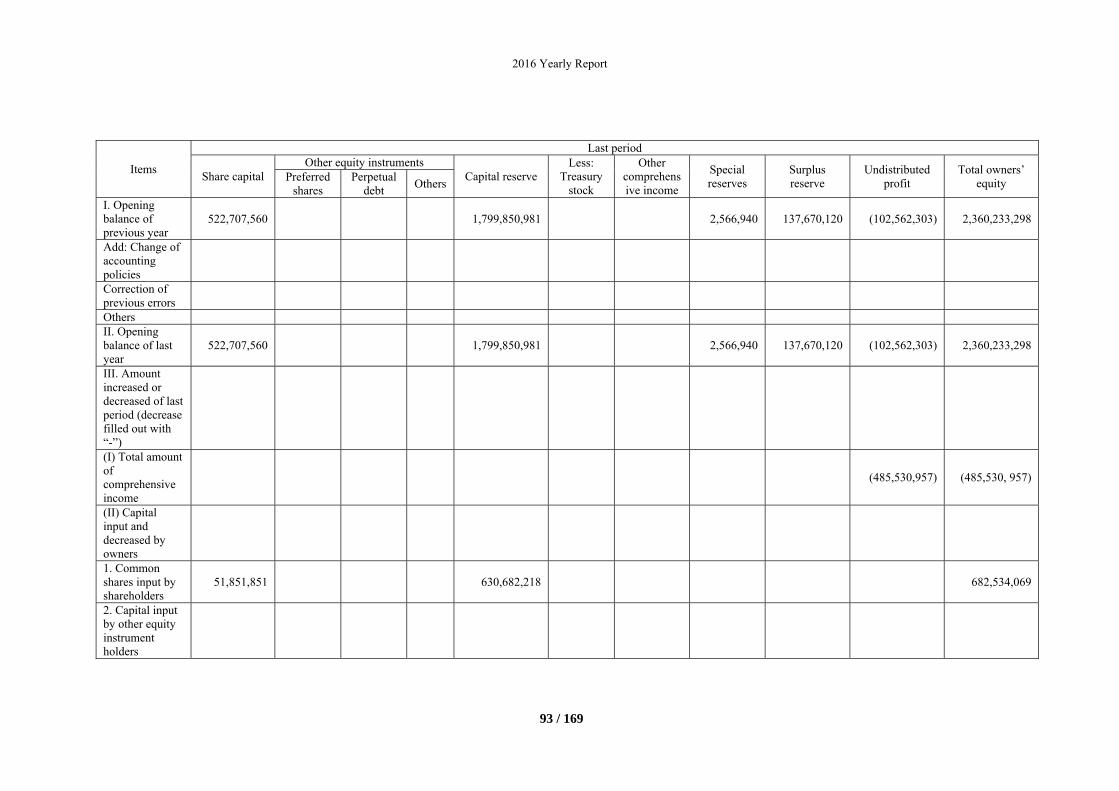
2016 Yearly Report
93 / 169
Items
Last period
Share capital Other equity instruments
Capital reserveLess:
Treasury stock
Other comprehensive income
Special reserves
Surplus reserve
Undistributed profit
Total owners’ equity Preferred
shares Perpetual
debt Others
I. Opening balance of previous year
522,707,560 1,799,850,981 2,566,940 137,670,120 (102,562,303) 2,360,233,298
Add: Change of accounting policies
Correction of previous errors
Others II. Opening balance of last year
522,707,560 1,799,850,981 2,566,940 137,670,120 (102,562,303) 2,360,233,298
III. Amount increased or decreased of last period (decrease filled out with “-”)
(I) Total amount of comprehensive income
(485,530,957) (485,530, 957)
(II) Capital input and decreased by owners
1. Common shares input by shareholders
51,851,851 630,682,218 682,534,069
2. Capital input by other equity instrument holders
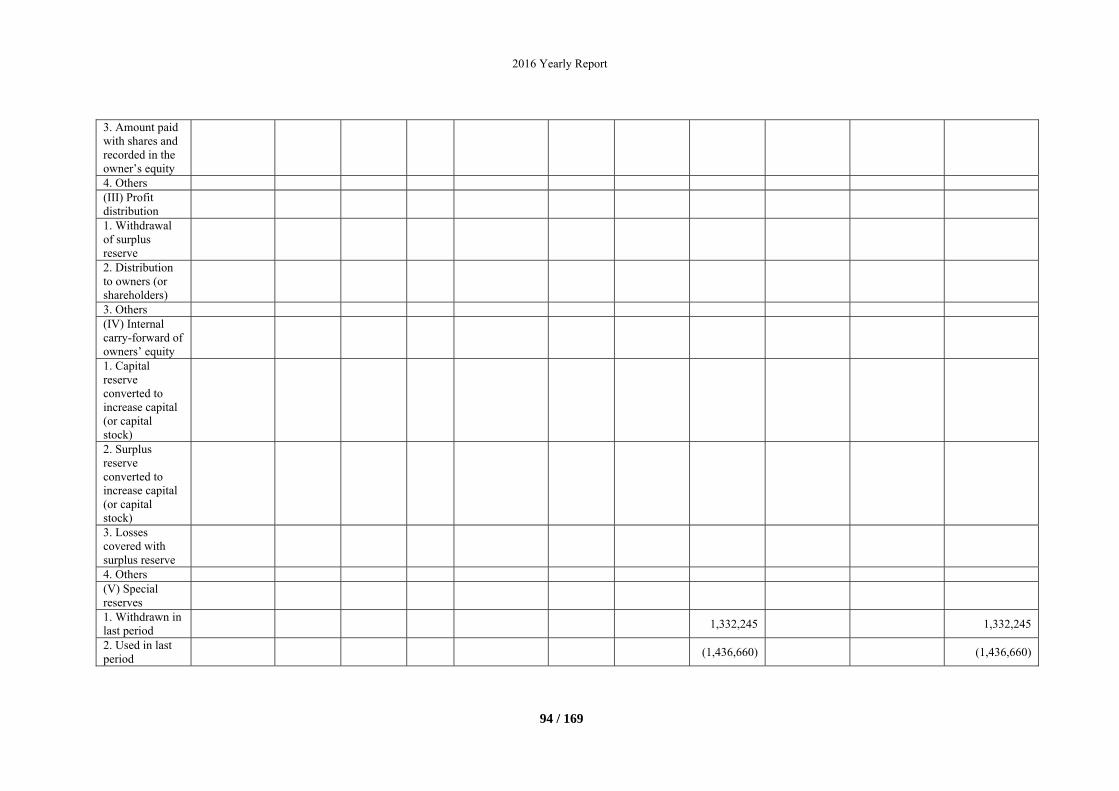
2016 Yearly Report
94 / 169
3. Amount paid with shares and recorded in the owner’s equity
4. Others (III) Profit distribution
1. Withdrawal of surplus reserve
2. Distribution to owners (or shareholders)
3. Others (IV) Internal carry-forward of owners’ equity
1. Capital reserve converted to increase capital (or capital stock)
2. Surplus reserve converted to increase capital (or capital stock)
3. Losses covered with surplus reserve
4. Others (V) Special reserves
1. Withdrawn in last period
1,332,245 1,332,245
2. Used in last period
(1,436,660) (1,436,660)
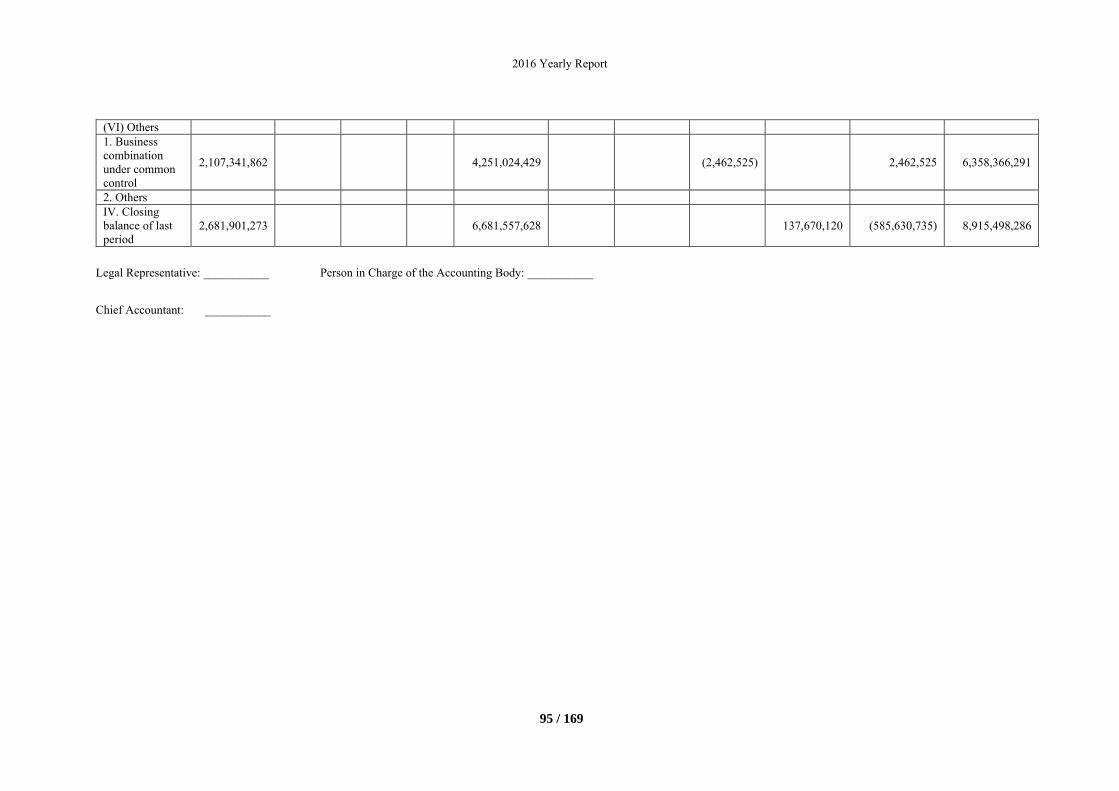
2016 Yearly Report
95 / 169
(VI) Others 1. Business combination under common control
2,107,341,862 4,251,024,429 (2,462,525) 2,462,525 6,358,366,291
2. Others IV. Closing balance of last period
2,681,901,273 6,681,557,628 137,670,120 (585,630,735) 8,915,498,286
Legal Representative: ___________ Person in Charge of the Accounting Body: ___________
Chief Accountant: ___________
2016 Yearly Report
96 / 169
III. Basic Information on the Company 1. Basic information on the Company Prior to the Major Assets Restructuring, Bluestar New Chemical Material Co., Ltd was incorporated on May 31, 1999. China National Bluestar (Group) Co, Ltd. (formerly known as “China National Bluestar (Group) Company”) (the “Bluestar Group”) was the initiative founder, and Ministry of Chemical Beijing Rubber Industry Research Institute, Ministry of Chemical Lianyungang Design Research Institute, Ministry of Chemical Synthetic Material Research Institute and National Changfeng Machinery are the co-founders. The city of registration is Beijing, People’s Republic of China. Bluestar Group is the parent company of BNCM, China National Chemical Corporation is the Company’s ultimate controlling shareholder. In 2015, the Company completed an exchange of assets. The asset replacement and purchase have been paid through cash payment and the issuance of new shares (issuance of 2,159,193,173 ordinary shares). After the transaction, the total share capital increased to RMB 2,681,901,273. The Company’s principal business was significantly changed to research, development, production and sale of feed additives for animal nutrition from chemical material business prior to Major Assets Restructuring. After the Major Assets Restructuring, the Company’s name has been changed from Bluestar New Chemical Material Co., Ltd (“BNCM”) to Bluestar Adisseo Company (the “Company”). After the completion of the restructuring, the Company and its subsidiaries (collectively the “Group”)’s principal place of business included the plants in France, China and Spain, as well as distribution companies worldwide. 2. Scope of consolidated financial statements See Note VIII for the change of consolidation scope and Note IX for rights and interests in other subjects.
2016 Yearly Report
97 / 169
IV. Basis for Preparation of Financial Statements Basis of accounting and principle of measurement The Group has adopted the Accounting Standards for Business Enterprises ("ASBE") issued by the Ministry of Finance ("MoF") (Including the new and amendment version of Accounting Standard for Business Enterprises issued in 2014). The financial statements have been prepared on the going concern basis.
Basis of accounting and principle of measurement
The Group determines the production and management features based on specific accounting policies and accounting estimates, mainly in receivables that are subject to provision for bad debts (Note V (10)), inventory valuation method (Note V (11)), amortization/depreciation for fixed/intangible assets (Note V (13) (16)), condition for capitalized development expenditure (Note V (15)), revenue recognition (Note V (24)), etc.. See Note V (32) for the key judgments in applying the significant accounting policies adopted by Group.
V. Important Accounting Policies and Accounting Estimates 1. Statement of compliance The financial statements prepared by the Company meet the requirements of the Accounting Standards for Business Enterprises issued by MOF, truly and completely reflect the Company’s consolidated financial standing, consolidated operating results, change of shareholders’ equity, and cash flow, etc. These financial statements also comply with the disclosure requirements of “Regulation on the Preparation of Information Disclosures of Companies Issuing Public Shares, No. 15: General Requirements for financial Reports” as revised by the China Securities Regulatory Commission (“CSRC”) in 2014. 2. Fiscal period The Company’s fiscal year is from 1 January to 31 December in the Gregorian calendar. The fiscal period of this financial statements is from 1 January 2016 to 31 December 2016. 3. Business cycle The Company takes the period from the acquisition of assets for processing to their realization in cash or cash equivalents as a normal operating cycle. 4. Functional currency The Group’s financial statements are presented in Renminbi. Functional currency is determined by the Company and its subsidiaries on the basis of the currency in which major income and costs are denominated and settled. Some of the Company’s subsidiaries have functional currencies that are different from the Company’s functional currency. Their financial statements have been translated based on the accounting policy set out in Note V (8). 5. Method for accounting treatment of business combination under and not under common control
(1) Business combination under common control
A business combination involving enterprises under common control is a business combination in which all of the combining enterprises are ultimately controlled by the same party or parties both before and after the business combination, and that control is not transitory. The assets acquired and liabilities assumed are measured based on their carrying amounts in the consolidated financial statements of the ultimate controlling party at the
2016 Yearly Report
98 / 169
combination date. The difference between the carrying amount of the net assets acquired and the consideration paid for the combination (or the total par value of shares issued) is adjusted against share premium in the capital reserve, with any excess adjusted against retained earnings. Any costs directly attributable to the combination are recognized in profit or loss when incurred. The combination date is the date on which one combining enterprise obtains control of other combining enterprises.
(2) Business combination not under common control
A business combination involving enterprises not under common control is a business combination in which all of the combining enterprises are not ultimately controlled by the same party or parties both before and after the business combination. Where (1) the aggregate of the acquisition-date fair value of assets transferred (including the acquirer’s previously held equity interest in the acquiree), liabilities incurred or assumed, and equity securities issued by the acquirer, in exchange for control of the acquiree, exceeds (2) the acquirer’s interest in the acquisition-date fair value of the acquiree’s identifiable net assets, the difference is recognized as goodwill (Note V (17)). If (1) is less than (2), the difference is recognized in profit or loss for the current period. The costs of issuing equity or debt securities as a part of the consideration for the acquisition are included in the carrying amounts of these equity or debt securities upon initial recognition. Other acquisition-related costs are expensed when incurred. Any difference between the fair value and the carrying amount of the assets transferred as consideration is recognized in profit or loss. The acquiree’s identifiable asset, liabilities and contingent liabilities, if the recognition criteria are met, are recognized by the Group at their acquisition-date fair value. The acquisition date is the date on which the acquirer obtains control of the acquiree. 6. Method for preparation of consolidated financial statements
(1) General principles
The scope of consolidated financial statements is based on control and the consolidated financial statements comprise the Company and its subsidiaries. Control exists when the investor has all of following: power over the investee; exposure, or rights, to variable returns from its involvement with the investee and has the ability to affect those returns through its power over the investee. When assessing whether the Group has power, only substantive rights (held by the Group and other parties) are considered. The financial position, financial performance and cash flows of subsidiaries are included in the consolidated financial statements from the date that control commences until the date that control ceases. Non-controlling interests are presented separately in the consolidated balance sheet within owners’ equity. Net profit or loss attributable to non-controlling owners is presented separately in the consolidated income statement below the net profit line item. Total comprehensive income attributable to non-controlling owners is presented separately in the consolidated income statement below the total comprehensive income line item. When the amount of loss for the current period attributable to the non-controlling shareholders of a subsidiary exceeds the non-controlling shareholders’ portion of the opening balance of owners’ equity of the subsidiary, the excess is still allocated against the non-controlling interests. When the accounting period or accounting policies of a subsidiary are different from those of the Company, the Company makes necessary adjustments to the financial statements of the subsidiary based on the Company’s own accounting period or accounting policies. Intra-group balances and transactions, and any unrealized profit or loss arising from intra-group transactions, are eliminated when preparing the consolidated financial statements. Unrealized losses resulting from intra-group transactions are eliminated in the same way as unrealized gains, unless they represent impairment losses that are recognized in the financial statements.
(2) Subsidiaries acquired through a business combination
Where a subsidiary was acquired during the reporting period, through a business combination involving enterprises under common control, the financial statements of the subsidiary are included in the consolidated financial statements as if the combination had occurred at the date that the ultimate controlling party first obtained control. The opening balances and the comparative figures of the consolidated financial statements are
2016 Yearly Report
99 / 169
also restated. In the preparation of the consolidated financial statements, the subsidiary’s assets and liabilities based on their carrying amounts in the financial statements of the ultimate controlling party are included in the consolidated balance sheet, and financial performance is included in the consolidated income statement respectively, from the date that the ultimate parent company of the Company obtains the control of the subsidiary to be consolidated. Where a subsidiary was acquired during the reporting period, through a business combination involving enterprises not under common control, the identifiable assets and liabilities of the acquired subsidiaries are included in the scope of consolidation from the date that control commences, based on the fair value of those identifiable assets and liabilities at the acquisition date.
(3) Disposal of subsidiaries
When the Group loses control of a subsidiary, the Group derecognises assets, liabilities, non-controlling interests and other related items in shareholders’ equity in relation to that subsidiary.
(4) Changes in non-controlling interests
Where the Company acquires a non-controlling interest from a subsidiary’s non-controlling shareholders or disposes of a portion of an interest in a subsidiary without a change in control, the difference between the amount by which the non-controlling interests are adjusted and the amount of the consideration paid or received is adjusted to the capital reserve (share premium) in the consolidated balance sheet, with any excess adjusted to retained earnings. 7. Cash and cash equivalents Cash and cash equivalents comprise cash on hand, deposits that can be readily withdraw on demand, and short-term, highly liquid investments that are readily convertible into known amounts of cash and are subject to an insignificant risk of change in value. 8. Foreign currency businesses and conversion of foreign-currency statements Monetary items denominated in foreign currencies are translated to Renminbi at the spot exchange rate at the balance sheet date. The resulting exchange differences are generally recognized in profit or loss, unless they arise from the re-translation of the principal and interest of specific borrowings for the acquisition, construction or production of qualifying assets (Note V (14)). Non-monetary items that are measured at historical cost in foreign currencies are translated to Renminbi using the exchange rate at the transaction date. Assets and liabilities of foreign operation are translated to Renminbi reporting currency at the spot exchange rate at the balance sheet date. Equity items, excluding “Retained earnings”, are translated to Renminbi at the spot exchange rates at the transaction dates. Income and expenses of foreign operation are translated to Renminbi at the spot exchange rates at the transaction dates. The resulting translation differences are recognized in other comprehensive income. The translation differences accumulated in owners’ equity with respect to a foreign operation is transferred to profit or loss in the period when the foreign operation is disposed. 9. Financial instruments Financial instruments include cash at bank and on hand, equity securities other than those classified as long-term equity investments, receivables, payables, loans and borrowings, debentures payable and paid-in capital.
(1) Recognition and measurement of financial assets and financial liabilities
A financial asset or financial liability is recognized in the balance sheet when the Group becomes a party to the contractual provisions of a financial instrument. The Group classifies financial assets and liabilities into different categories at initial recognition based on the purpose of acquiring assets or assuming liabilities: financial assets and financial liabilities at fair value through profit or loss, loans and receivables, held-to-maturity investments, available-for-sale financial assets and other
2016 Yearly Report
100 / 169
financial liabilities. Financial assets and financial liabilities are measured initially at fair value. For financial assets and financial liabilities at fair value through profit or loss, any related directly attributable transaction costs are charged to profit or loss; for other categories of financial assets and financial liabilities, any related directly attributable transaction costs are included in their initial costs. Subsequent to initial recognition, financial assets and liabilities are measured as follows: - Financial assets and financial liabilities at fair value through profit or loss (including financial assets or
financial liabilities held for trading)
A financial asset or financial liability is classified as at fair value through profit or loss if it is acquired or incurred principally for the purpose of selling or repurchasing in the near term or if it is a derivative, unless the derivative is a designated and effective hedging instrument, or a financial guarantee contract, or a derivative that is linked to and must be settled by delivery of an equity instrument that do not have a quoted market price in an active market, and whose fair value cannot be reliably measured.
Subsequent to initial recognition, financial assets and financial liabilities at fair value through profit or loss are measured at fair value, and changes therein are recognized in profit or loss.
- Receivables
Receivables are non-derivative financial assets with fixed or determinable payments that are not quoted in an active market.
Subsequent to initial recognition, receivables are measured at amortized cost using the effective interest method.
- Available-for-sale financial assets
Available-for-sale financial assets include non-derivative financial assets that are designated upon initial recognition as available for sale and other financial assets which do not fall into any of the above categories.
Available-for-sale investments in equity instruments whose fair value cannot be measured reliably are measured at cost subsequent to initial recognition. Other available-for-sale financial assets are measured at fair value subsequent to initial recognition and changes therein are generally recognized in other comprehensive income, except for impairment losses and foreign exchange gains and losses from monetary financial assets which are recognized directly in profit or loss. When an investment is derecognized, the gain or loss accumulated in equity is reclassified to profit or loss. Dividend income is recognized in profit or loss when the investee approves the dividends. Interest is recognized in profit or loss using the effective interest method.
- Other financial liabilities
Financial liabilities other than the financial liabilities at fair value through profit or loss are classified as other financial liabilities. Other financial liabilities include liabilities arising from financial guarantee contracts. Financial guarantees are contracts that require the Group (i.e. the guarantor) to make specified payments to reimburse the beneficiary of the guarantee (the holder) for a loss the holder incurs because a specified debtor fails to make payment when due in accordance with the terms of a debt instrument. Where the Group issues a financial guarantee, subsequent to initial recognition, the guarantee is measured at the higher of the amount initially recognized less accumulated amortization and the amount of a provision determined in accordance with the
2016 Yearly Report
101 / 169
principles for contingent liabilities (Note V (21)). Liabilities other than those arising from financial guarantee contracts are measured at amortized cost using the effective interest method.
(2) Presentation of financial assets and financial liabilities
Financial assets and financial liabilities are generally presented separately in the balance sheet and are not offset. However, a financial asset and a financial liability are offset and the net amount is presented in the balance sheet when both of the following conditions are satisfied: - the Group currently has a legally enforceable right to set off the recognized amounts; and - the Group intends either to settle on a net basis, or to realize the financial asset and settle the financial liability
simultaneously.
(3) Derecognition of financial assets and financial liabilities
A financial asset is derecognized if the Group’s contractual rights to the cash flows from the financial asset expire or if the Group transfers substantially all the risks and rewards of ownership of the financial asset to another party. Where a transfer of a financial asset in its entirety meets the criteria for derecognition, the difference between the two amounts below is recognized in profit or loss: - the carrying amount of the financial asset transferred - the sum of the consideration received from the transfer and any cumulative gain or loss that has been
recognized directly in equity. The Group derecognizes a financial liability (or part of it) only when it’s contractual obligation (or part of it) is discharged or cancelled or expires.
(4) Impairment of financial assets
The carrying amounts of financial assets (other than those at fair value through profit or loss) are reviewed at each balance sheet date to determine whether there is objective evidence of impairment. If any such evidence exists, an impairment loss is recognized. Objective evidence that a financial asset is impaired includes but is not limited to: - significant financial difficulty of the issuer or obligor - a breach of contract by the borrower, such as a default or delinquency in interest or principal payments - it becoming probable that the borrower will enter bankruptcy or other financial reorganization - the disappearance of an active market for that financial asset because of financial difficulties faced by the
issuer - significant changes with an adverse effect that have taken place in the technological, market, economic or
legal environment in which the issuer operates, indicating that the cost of an investment in an equity instrument may not be recovered by the investor
- a significant or prolonged decline in the fair value of an investment in an equity instrument below its cost. For the calculation method of impairment of receivables, refer to Note V (10). The impairment of other financial assets is measured as follows: - Available-for-sale financial assets Available-for-sale financial assets are assessed for impairment on an individual basis and on a collective group basis. When an available-for-sale financial asset is impaired, the cumulative loss arising from a decline in fair value that has been recognized directly in shareholders’ equity is reclassified to profit or loss even though the financial asset has not been derecognized.
2016 Yearly Report
102 / 169
If, after an impairment loss has been recognized on an available-for-sale debt instrument, the fair value of the debt instrument increases in a subsequent period and the increase can be objectively related to an event occurring after the impairment loss was recognized, the impairment loss is reversed through profit or loss. An impairment loss recognized for an investment in an equity instrument classified as available-for-sale is not reversed through profit or loss. The impairment loss on an investment in an unquoted equity instrument whose fair value cannot be reliably measured is not reversed.
(5) Equity instrument
The consideration received from the issuance of equity instruments net of transaction costs is recognized in owners’ equity. Consideration and transaction costs paid by the Company for repurchasing self-issued equity instruments are deducted from owners’ equity. 10. Impairment of receivables Receivables are assessed for impairment on an individual basis and on a collective group basis as follows. Where impairment is assessed on an individual basis, an impairment loss in respect of a receivable is calculated as the excess of its carrying amount over the present value of the estimated future cash flows (excluding future credit losses that have not been incurred) discounted at the original effective interest rate. Impairment losses are recognized in profit or loss. The assessment is made collectively where receivables share similar credit risk characteristics (including those having not been individually assessed as impaired), based on their historical loss experiences, and adjusted by the observable factors reflecting current economic conditions. If, after an impairment loss has been recognized on receivables, there is a recovery in the value of the financial asset which can be related objectively to an event occurring after the impairment was recognized, the previously recognized impairment loss is reversed through profit or loss. A reversal of an impairment loss will not result in the asset’s carrying amount exceeding what the amortized cost would have been had no impairment loss been recognized in prior years.
(1) Receivables with amounts that are individually significant and assessed individually for impairment
(2) Receivables with amounts that are not individually significant but assessed individually for impairment
Reasons for assessing individually for impairment of receivables that are individually insignificant
There are objective evidence indicate the Group cannot recover the receivables under the original terms.
Method of provisioning for bad and doubtful debts
An impairment loss in respect of a receivable is calculated as the excess of its carrying amount over the present value of the estimated future cash flows discounted at the original effective interest rate.
Judgment basis or criteria for receivables that are individually significant
Receivables individually greater than RMB40,000,000 are significant.
Method of provisioning for bad and doubtful debts for receivables that are individually significant and assessed individually
An impairment loss in respect of a receivable is calculated as the excess of its carrying amount over the present value of the estimated future cash flows (excluding future credit losses that have not been incurred) discounted at the original effective interest rate.
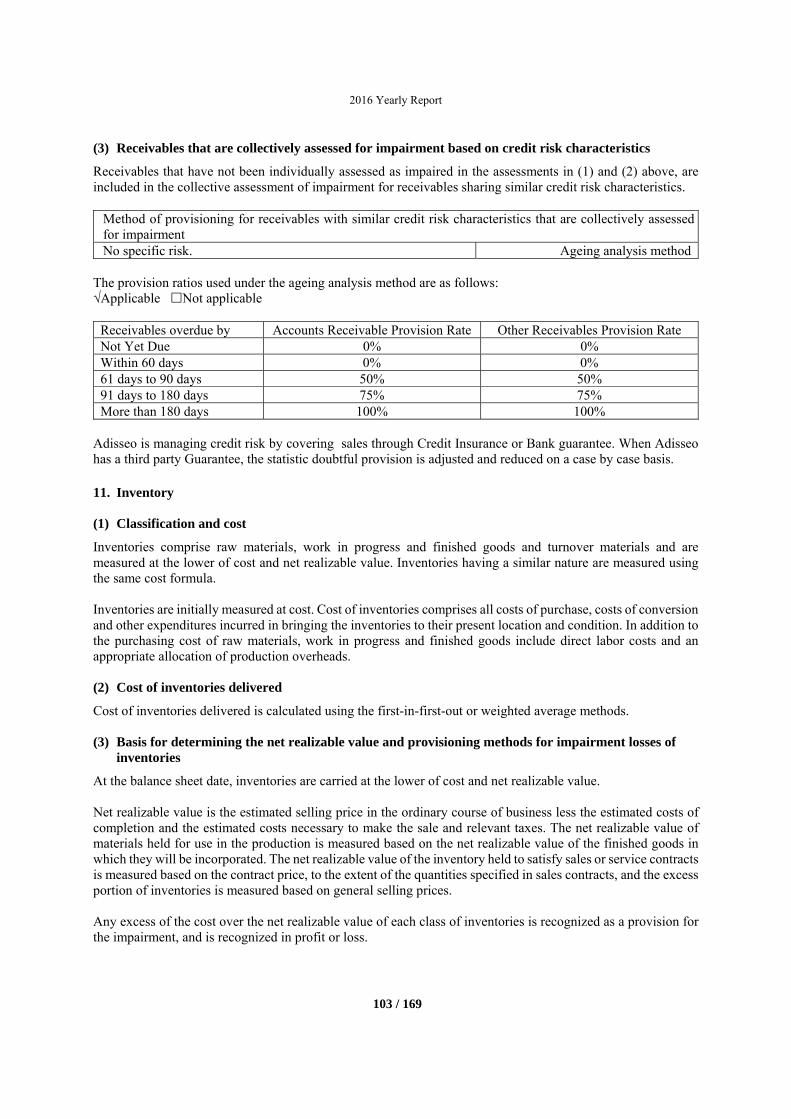
2016 Yearly Report
103 / 169
(3) Receivables that are collectively assessed for impairment based on credit risk characteristics
Receivables that have not been individually assessed as impaired in the assessments in (1) and (2) above, are included in the collective assessment of impairment for receivables sharing similar credit risk characteristics.
Method of provisioning for receivables with similar credit risk characteristics that are collectively assessed for impairment No specific risk. Ageing analysis method
The provision ratios used under the ageing analysis method are as follows: √Applicable Not applicable
Receivables overdue by Accounts Receivable Provision Rate Other Receivables Provision RateNot Yet Due 0% 0% Within 60 days 0% 0% 61 days to 90 days 50% 50% 91 days to 180 days 75% 75% More than 180 days 100% 100%
Adisseo is managing credit risk by covering sales through Credit Insurance or Bank guarantee. When Adisseo has a third party Guarantee, the statistic doubtful provision is adjusted and reduced on a case by case basis. 11. Inventory
(1) Classification and cost
Inventories comprise raw materials, work in progress and finished goods and turnover materials and are measured at the lower of cost and net realizable value. Inventories having a similar nature are measured using the same cost formula. Inventories are initially measured at cost. Cost of inventories comprises all costs of purchase, costs of conversion and other expenditures incurred in bringing the inventories to their present location and condition. In addition to the purchasing cost of raw materials, work in progress and finished goods include direct labor costs and an appropriate allocation of production overheads.
(2) Cost of inventories delivered
Cost of inventories delivered is calculated using the first-in-first-out or weighted average methods.
(3) Basis for determining the net realizable value and provisioning methods for impairment losses of inventories
At the balance sheet date, inventories are carried at the lower of cost and net realizable value.
Net realizable value is the estimated selling price in the ordinary course of business less the estimated costs of completion and the estimated costs necessary to make the sale and relevant taxes. The net realizable value of materials held for use in the production is measured based on the net realizable value of the finished goods in which they will be incorporated. The net realizable value of the inventory held to satisfy sales or service contracts is measured based on the contract price, to the extent of the quantities specified in sales contracts, and the excess portion of inventories is measured based on general selling prices. Any excess of the cost over the net realizable value of each class of inventories is recognized as a provision for the impairment, and is recognized in profit or loss.
2016 Yearly Report
104 / 169
(4) Inventory system of the Group is a perpetual inventory system.
The Group maintains a perpetual inventory system.
(5) Method for amortization of low-value easily-consumed articles and packages
Turnover materials include low-value easily-consumed articles and packages, etc., and here, low-value easily-consumed articles and packages are amortized with one-off write-off method. 12. Long-term equity investments
(1) Investment cost of long-term equity investments
a. Long-term equity investments acquired through a business combination
The initial cost of a long-term equity investment acquired through a business combination involving enterprises under common control is the Company’s share of the carrying amount of the subsidiary’s equity in the consolidated financial statements of the ultimate controlling party at the combination date. The difference between the initial investment cost and the carrying amount of the consideration given is adjusted to the share premium in the capital reserve, with any excess adjusted against retained earnings. For a long-term equity investment obtained through a business combination not involving enterprises under common control, the initial cost comprises the aggregate of the fair value of assets transferred, liabilities incurred or assumed, and equity securities issued by the Company, in exchange for control of the acquiree.
b. Long-term equity investments acquired other than through a business combination
A long-term equity investment acquired other than through a business combination is initially recognized at the amount of cash paid if the Group acquires the investment by cash, or at the fair value of the equity securities issued if an investment is acquired by issuing equity securities.
(2) Subsequent measurement of long-term equity investment
a. Investments in subsidiaries
In the Company’s separate financial statements, long-term equity investments in subsidiaries are accounted for using the cost method for subsequent measurement. Except for cash dividends or profit distributions declared but not yet distributed that have been included in the price or consideration paid in obtaining the investments, the Company recognizes its share of the cash dividends or profit distributions declared by the investee as investment income in the current period.
The investments in subsidiaries are stated in the balance sheet at cost less accumulated impairment losses. For the impairment of the investments in subsidiaries, refer to Note V (18). In the Group’s consolidated financial statements, investments in subsidiaries are accounted for in accordance with the policies described in Note V(6).
b. Investment in joint ventures and associates
A joint venture is an arrangement whereby the Group and other parties have joint control and rights to the net assets of the arrangement. An associate is an enterprise over which the Group has significant influence
2016 Yearly Report
105 / 169
An investment in a joint venture or an associate is accounted for using the equity method for subsequent measurement, unless the investment is classified as held for sale.
Under the equity method: - Where the initial cost of a long-term equity investment exceeds the Group’s interest in the fair value of the
investee’s identifiable net assets at the date of acquisition, the investment is initially recognized at cost. Where the initial investment cost is less than the Group’s interest in the fair value of the investee’s identifiable net assets at the date of acquisition, the investment is initially recognized at the investor’s share of the fair value of the investee’s identifiable net assets, and the difference is recognized in profit or loss.
- After the acquisition of the investment, the Group recognizes its share of the investee’s profit or loss and other comprehensive income as investment income or losses and other comprehensive income respectively, and adjusts the carrying amount of the investment accordingly. Once the investee declares any cash dividends or profit distributions, the carrying amount of the investment is reduced by the amount attributable to the Group. Changes in the Group’s share of the investee’s owners’ equity, other than those arising from the investee’s net profit or loss, other comprehensive income or profit distribution (“other changes in owners’ equity”), is recognized directly in the Group’s equity, and the carrying amount of the investment is adjusted accordingly.
- In calculating its share of the investee’s net profits or losses, other comprehensive income and other changes in owners’ equity, the Group recognizes investment income and other comprehensive income after making appropriate adjustments to align the accounting policies or accounting periods with those of the Group based on the fair value of the investee’s identifiable net assets at the date of acquisition. Unrealized profits and losses resulting from transactions between the Group and its associates or joint ventures are eliminated to the extent of the Group’s interest in the associates or joint ventures. Unrealized losses resulting from transactions between the Group and its associates or joint ventures are eliminated in the same way as unrealized gains but only to the extent that there is no impairment.
- The Group discontinues recognizing its share of further losses of the investee after the carrying amount of the long-term equity investment and any long-term interest that in substance forms part of the Group’s net investment in the joint venture or associate is reduced to zero, except to the extent that the Group has an obligation to assume additional losses. If the joint venture or associate subsequently reports net profits, the Group resumes recognizing its share of those profits only after its share of the profits equals the share of losses not recognized.
For the impairment of the investments in joint ventures and associates, refer to Note V (18).
(3) Criteria for determining the existence of joint control or significant influence over an investee
Joint control is the contractually agreed sharing of control of an arrangement, which exists only when decisions about the relevant activities (activities with significant impact on the returns of the arrangement) require the unanimous consent of the parties sharing control. The following factors are usually considered when assessing whether the Group can exercise joint control over an investee: - Whether no single participant party is in a position to control the investee’s related activities unilaterally.
- Whether strategic decisions relating to the investee’s related activities require the unanimous consent of all participant parties that sharing of control.
Significant influence is the power to participate in the financial and operating policy decisions of an investee but does not have control or joint control over those policies.
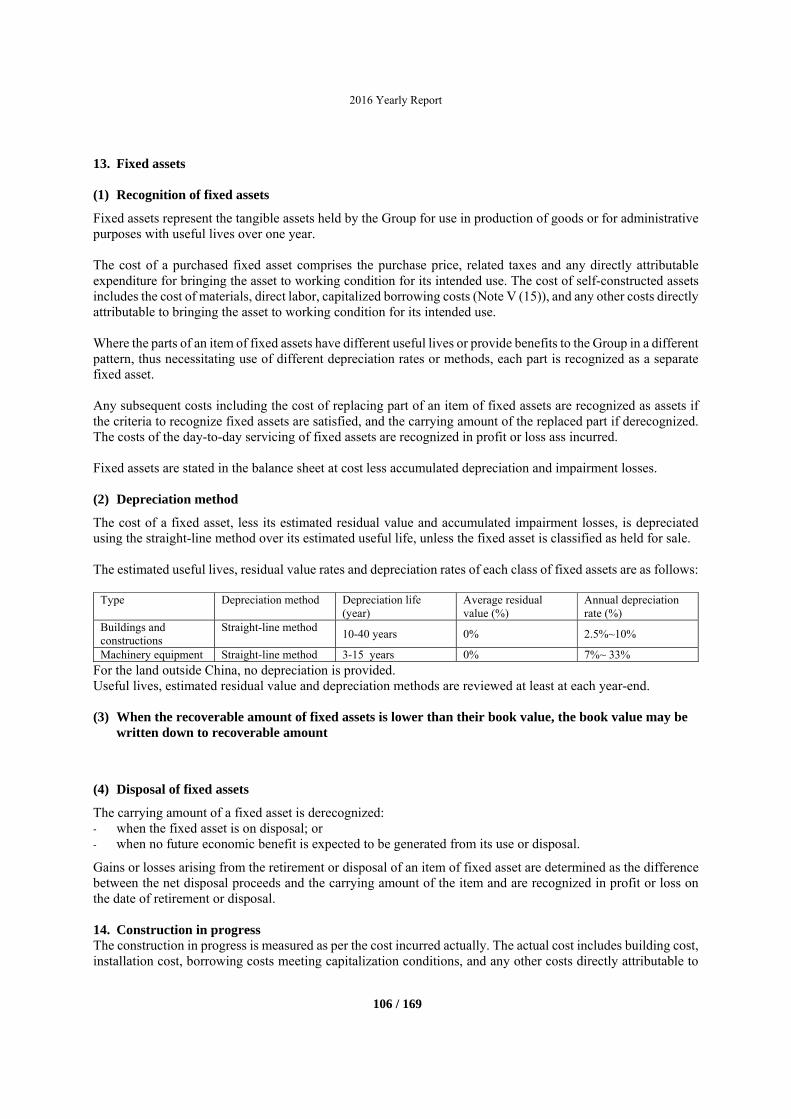
2016 Yearly Report
106 / 169
13. Fixed assets
(1) Recognition of fixed assets
Fixed assets represent the tangible assets held by the Group for use in production of goods or for administrative purposes with useful lives over one year. The cost of a purchased fixed asset comprises the purchase price, related taxes and any directly attributable expenditure for bringing the asset to working condition for its intended use. The cost of self-constructed assets includes the cost of materials, direct labor, capitalized borrowing costs (Note V (15)), and any other costs directly attributable to bringing the asset to working condition for its intended use. Where the parts of an item of fixed assets have different useful lives or provide benefits to the Group in a different pattern, thus necessitating use of different depreciation rates or methods, each part is recognized as a separate fixed asset. Any subsequent costs including the cost of replacing part of an item of fixed assets are recognized as assets if the criteria to recognize fixed assets are satisfied, and the carrying amount of the replaced part if derecognized. The costs of the day-to-day servicing of fixed assets are recognized in profit or loss ass incurred. Fixed assets are stated in the balance sheet at cost less accumulated depreciation and impairment losses.
(2) Depreciation method
The cost of a fixed asset, less its estimated residual value and accumulated impairment losses, is depreciated using the straight-line method over its estimated useful life, unless the fixed asset is classified as held for sale. The estimated useful lives, residual value rates and depreciation rates of each class of fixed assets are as follows:
Type Depreciation method Depreciation life (year)
Average residual value (%)
Annual depreciation rate (%)
Buildings and constructions
Straight-line method 10-40 years 0% 2.5%~10%
Machinery equipment Straight-line method 3-15 years 0% 7%~ 33%
For the land outside China, no depreciation is provided. Useful lives, estimated residual value and depreciation methods are reviewed at least at each year-end.
(3) When the recoverable amount of fixed assets is lower than their book value, the book value may be written down to recoverable amount
(4) Disposal of fixed assets
The carrying amount of a fixed asset is derecognized: - when the fixed asset is on disposal; or - when no future economic benefit is expected to be generated from its use or disposal.
Gains or losses arising from the retirement or disposal of an item of fixed asset are determined as the difference between the net disposal proceeds and the carrying amount of the item and are recognized in profit or loss on the date of retirement or disposal. 14. Construction in progress The construction in progress is measured as per the cost incurred actually. The actual cost includes building cost, installation cost, borrowing costs meeting capitalization conditions, and any other costs directly attributable to
2016 Yearly Report
107 / 169
bringing the asset to working condition for its intended use. The construction in process, when reaching the predicted usable state, will be transferred into fixed assets, and have depreciation withdrawn from the next month. Construction in progress is stated in the balance sheet at cost less accumulated impairment losses (Note V (18)). 15. Borrowing costs Borrowing costs incurred directly attributable to the acquisition and construction of a qualifying asset are capitalized as part of the cost of the asset. Other borrowing costs are recognized as financial expenses when incurred. During the capitalization period, the amount of interest (including amortization of any discount or premium on borrowing) to be capitalized in each accounting period is determined as follows: - Where funds are borrowed specifically for the acquisition and construction of a qualifying asset, the amount
of interest to be capitalized is the interest expense calculated using effective interest rates during the period less any interest income earned from depositing the borrowed funds or any investment income on the temporary investment of those funds before being used on the asset.
- To the extent that the Group borrows funds generally and uses them for the acquisition and construction of a qualifying asset, the amount of borrowing costs eligible for capitalization is determined by applying a capitalization rate to the weighted average of the excess amounts of cumulative expenditure on the asset over the above amounts of specific borrowings. The capitalization rate is the weighted average of the interest rates applicable to the general-purpose borrowings.
The effective interest rate is determined as the rate that exactly discounts estimated future cash flow through the expected life of the borrowing or, when appropriate, a shorter period to the initially recognized amount of the borrowings. During the capitalization period, exchange differences related to the principal and interest on a specific-purpose borrowing denominated in foreign currency are capitalized as part of the cost of the qualifying asset. The exchange differences related to the principal and interest on foreign currency borrowings other than a specific-purpose borrowing are recognized as a financial expense when incurred. The capitalization period is the period from the date of commencement of capitalization of borrowing costs to the date of cessation of capitalization, excluding any period over which capitalization is suspended. Capitalization of borrowing costs commences when expenditure for the asset is being incurred, borrowing costs are being incurred and activities of acquisition and construction [or production] that are necessary to prepare the asset for its intended use are in progress, and ceases when the assets become ready for their intended use. Capitalization of borrowing costs is suspended when the acquisition and construction activities are interrupted abnormally for a period of more than three months. 16. Intangible assets Intangible assets are stated in the balance sheet at cost less accumulated amortization (where the estimated useful life is finite) and impairment losses (Note V (18)). For an intangible asset with finite useful life, its cost less estimated residual value and accumulated impairment losses is amortized using the straight-line method over its estimated useful life, unless the intangible asset is classified as held for sale.
2016 Yearly Report
108 / 169
The respective amortization periods for such intangible assets are as follows:
Amortization period
Land use right 50 years
Software 3-5 years
Patents The legal protection (10-15years) or the useful life if
shorter
Technology Expected benefit life (10-15) or the contractual
useful life if shorter
Customer relationships Expected benefit life (10-20)
An intangible asset is regarded as having an indefinite useful life and is not amortized when there is no foreseeable limit to the period over which the asset is expected to generate economic benefits for the Group. At the balance sheet date, the Group does not have any intangible assets with indefinite useful lives. Expenditure on an internal research and development project is classified into expenditure during the research phase and expenditure during the development phase. Expenditure during the research phase expensed when incurred. Expenditure during the development phase is capitalized if development costs can be measured reliably, the product or process is technically and commercially feasible, and the Group intends to and has sufficient resources to complete the development. Capitalized development costs are stated in the balance sheet at cost less impairment losses (Note V (18)). Other development expenditure is recognized as an expense in the period in which it is incurred. 17. Goodwill The initial cost of goodwill represents the excess of cost of acquisition over the acquirer’s interest in the fair value of the identifiable net assets of the acquiree under a business combination not involving enterprises under common control. Goodwill is not amortized and is stated in the balance sheet at cost less accumulated impairment losses (Note V (18)). On disposal of an asset group or a set of asset groups, any attributable goodwill is written off and included in the calculation of the profit or loss on disposal. 18. Impairment of assets other than inventories and financial assets The carrying amounts of the following assets are reviewed at each balance sheet date based on the internal and external sources of information to determine whether there is any indication of impairment: - fixed assets - construction in progress - intangible assets - long-term equity investments - goodwill - long-term deferred expense If any indication exists, the recoverable amount of the asset is estimated. In addition, the Group estimates the recoverable amounts of goodwill at each year-end, irrespective of whether there is any indication of impairment. Goodwill is allocated to each asset group, or set of asset groups, that is expected to benefit from the synergies of the combination for the purpose of impairment testing. An asset group is composed of assets directly related to cash-generation and is the smallest identifiable group of
2016 Yearly Report
109 / 169
assets that generates cash inflows that are largely independent of the cash inflows from other assets or asset groups. The recoverable amount of an asset (or asset group, set of asset groups) is the higher of its fair value (Note V (19)) less costs to sell and its present value of expected future cash flows. The present value of expected future cash flows of an asset is determined by discounting the future cash flows, estimated to be derived from continuing use of the asset and from its ultimate disposal, to their present value using an appropriate pre-tax discount rate. An impairment loss is recognized in profit or loss when the recoverable amount of an asset is less than its carrying amount. A provision for impairment of the asset is recognized accordingly. Impairment losses related to an asset group or a set of asset groups are allocated first to reduce the carrying amount of any goodwill allocated to the asset group or set of asset groups, and then to reduce the carrying amount of the other assets in the asset group or set of asset groups on a pro rata basis. However, such allocation would not reduce the carrying amount of an asset below the highest of its fair value less costs to sell (if measurable), its present value of expected future cash flows (if determinable) and zero. Once an impairment loss is recognized, it is not reversed in a subsequent period. 19. Fair value measurement Unless otherwise specified, the Group determines fair value measurement as below: Fair value is the price that would be received to sell an asset or paid to transfer a liability in an orderly transaction between market participants at the measurement date. When measuring fair value, the Group takes into account the characteristics of the particular asset or liability (including the condition and location of the asset and restrictions, if any, on the sale or use of the asset) that market participants would consider when pricing the asset or liability at the measurement date, and uses valuation techniques that are appropriate in the circumstances and for which sufficient data and other information are available to measure fair value. Valuation techniques mainly include the market approach, the income approach and the cost approach. 20. Employee benefits
(1) Short-term employee benefits
Short-term employee benefits include employee wages or salaries, bonuses, social security contributions such as medical insurance, work injury insurance, maternity insurance and housing fund, measured at the amount incurred or accured at the applicable benchmarks and rates. The employee benefits are recognized as a liability in the accounting period in which the service has been rendered by the employees, with a corresponding charge to profit or loss or included in the cost of assets where appropriate.
(2) Profit sharing plan
Profit sharing plans gives employees a share in the profits of the company. Each employee receives a percentage of those profits based on the company’s earnings. The Group is eligible for the employee benefits when meets the following conditions: - The Group has legal obligation or constructive obligation to pay such employees benefits resulting of past
events; - Accrued payroll obligations due to profit sharing can be estimated reliably.
(3) Post-employment benefits – defined contribution plans
The Group’s employees participate in the defined basic pension insurance plan set up and administered by local
2016 Yearly Report
110 / 169
labor and social protection authorities. Basic pensions are provided for monthly according to stipulated bases and proportions to local labor and social security institutions. When employees retire, local labor and social security institutions have a duty to pay the basic pension insurance to them. The amounts payable are recognized as liabilities based on the above provisions in the accounting period in which the service has been rendered by the employees, and as costs of assets or expenses to whichever the employee service is attributable.
(4) Post-employment benefits – defined benefit plans
The actuarial estimate of defined benefit plans is calculated using the projected unit credit method. The net liabilities (the present value of the defined benefit plan less fair value of the plan assets) are disclosed under employee benefits in balance sheet. The related services costs (including current service costs, past services costs and settlement gains or losses) and net interests calculated based on net liabilities of the defined benefit plan and appropriate discount rate are recognized through profit and loss for the period in which they occur. Actuarial gains and losses on pensions and other post-employment benefits arising from experience adjustments and changes in actuarial assumptions are recognized directly in other comprehensive income for the period in which they occur in consideration of the increase or decrease in the obligation. The Group offers pension plans and other post-employment benefit plans to some employees and retirees of the Group. The specific features of these plans vary depending on the applicable laws and regulations in each country where the employee work.
(5) Long-term bonus payment
In order to attract and motivate high qualified executives with expertise and experience, the Group has set up an incentive plan based on BANG’s (the Company’s subsidiary, which is a Hong-Kong company) phantom stocks. This incentive plan entitles the executives to a cash payment after three years and half or four years of service, with certain performance conditions. The fair value of the incentive plan is based on BANG’s share value, with reference to BAC’s stock value at the date of the evaluation. The bonus will be paid out from April 1, 2018 to June 30, 2020. For incentive plan do not vest until the completion of services for a period, or until the achievement of a specified performance condition, the Group recognizes costs or expenses as services are received, with a corresponding increase in liability, at an amount equal to the fair value of the liability based on the best estimate of the outcome of vesting. Until the liability is settled, the enterprise shall remeasure the fair value of the liability at each balance sheet date and at the date of settlement, with changes recognized in profit or loss for the current period. 21. Provisions and contingent liabilities A provision is recognized for an obligation related to a contingency if the Group has a present obligation that can be estimated reliably, and it is probable that an outflow of economic benefits will be required to settle the obligation. A provision is initially measured at the best estimate of the expenditure required to settle the related present obligation. Where the effect of the time value of money is material, provisions are determined by discounting the expected future cash flows. Factors pertaining to a contingency such as the risks, uncertainties and time value of money are taken into account as a whole in reaching the best estimate. Where there is a continuous range of possible outcomes for the expenditure required, and each possible outcome in that range is as likely as any other, the best estimate is the mid-point of that range. In other cases, the best estimate is determined according to the following circumstances: - Where the contingency involves a single item, the best estimate is the most likely outcome - Where the contingency involves a large population of items, the best estimate is determined by weighting
all possible outcomes by their associated probabilities.
2016 Yearly Report
111 / 169
The Group reviews the carrying amount of a provision at the balance sheet date and adjusts the carrying amount to the current best estimate. 22. Preferred shares At initial recognition, the Group classifies the preferred shares issued or their components as financial assets, financial liabilities or equity instruments based on their contractual terms and their economic substance after considering the definition of financial assets, financial liabilities and equity instruments. Preferred shares issued that should be classified as equity instruments are recognized in equity based on the actual amount received. Any distribution of dividends or interests during the instruments’ duration is treated as profit appropriation. When the preferred shares are redeemed according to the contractual terms, the redemption price is charged to equity.
The preferred shares issued by the Company’s subsidiary is classified as equity instruments, due to the following features: - The board of the directors of the issuer has the discretion to determine whether to declare a dividend
distribution or not. The board resolution of the issuer should include the amount of preferred share dividend to be paid.
- The board of the directors shall be entitled at its sole discretion to pay or delay the payment of the preferred share dividend.
23. Profit distributions to owners Distributions of profit proposed in the profit appropriation plan to be approved after the balance sheet date are not recognized as a liability at the balance sheet date but are disclosed in the notes separately. 24. Revenue recognition Revenue is the gross inflow of economic benefits arising in the course of the Group’s ordinary activities when the inflows result in increase in shareholders’ equity, other than increase relating to contributions from shareholders. Revenue is recognized in profit or loss when it is probable that the economic benefits will flow to the Group, the revenue and costs can be measured reliably and the following conditions are met. The Group recognizes revenue when all the following conditions are met: - The significant risks and rewards of ownership of goods have been transferred to the buyer; - The Group retains neither continuing managerial involvement to the degree usually associated with
ownership nor effective control over the goods sold; - The amount of revenue can be measured reliably; - It is probable that the future economic benefits associated with the transaction will flow to the entity; and - The costs incurred or to be incurred in respect of the transaction can be measured reliably. The amount of revenue is determined in accordance with the fair value of the consideration received or receivable for the sale of goods in the ordinary course of the Group’s activities. Revenue is presented net of discounts and returns. According to the characteristics of production and management of the group, the Group recognizes revenue when goods delivered. 25. Government grants Government grants are non-reciprocal transfers of monetary or non-monetary assets from the government to the Group except for capital contribution from the government in the capacity as an investor in the Group. Specific transfers from the government, such as investment grants that have been clearly defined in official documents as part of “capital reserve” are also dealt with as capital contributions rather than government grants. A government grant is recognized when there is reasonable assurance that the grant will be received and that the Group will comply with the conditions attaching to the grant.
2016 Yearly Report
112 / 169
If a government grant is in the form of a transfer of a monetary asset, it is measured at the amount received or receivable. If a government grant is in the form of a transfer of a non-monetary asset, it is measured at fair value.
Government grants related to assets are grants whose primary condition is that the Group qualifying for them should purchase, construct or otherwise acquire long-term assets. Government grants related to income are grants other than those related to assets. A government grant related to an asset is recognized initially as deferred income and amortized to profit or loss on a straight-line basis over the useful life of the asset. A grant that compensates the Group for expenses to be incurred in the future is recognized initially as deferred income, and released to profit or loss in the periods in which the expenses are recognized. A grant that compensates the Group for expenses already incurred is recognized in profit or loss immediately. 26. Income tax Current tax and deferred tax are recognized in profit or loss except to the extent that they relate to a business combination or items recognized directly in equity (including other comprehensive income). Current tax is the expected tax payable calculated at the applicable tax rate on taxable income for the year, plus any adjustment to tax payable in respect of previous years. At the balance sheet date, current tax assets and liabilities are offset only if the Group has a legally enforceable right to set them off and also intends either to settle on a net basis or to realize the asset and settle the liability simultaneously.
Deferred tax assets and liabilities arise from deductible and taxable temporary differences respectively, being the differences between the carrying amounts of assets and liabilities for financial reporting purposes and their tax bases, which include the deductible tax losses and tax credits carried forward to subsequent periods. Deferred tax assets are recognized to the extent that it is probable that future taxable profits will be available against which deductible temporary differences can be utilized. Deferred tax is not recognized for the temporary differences arising from the initial recognition of assets or liabilities in a transaction that is not a business combination and that affects neither accounting profit nor taxable profit (or deductible loss). Deferred tax is not recognized for taxable temporary differences arising from the initial recognition of goodwill. At the balance sheet date, deferred tax is measured based on the tax consequences that would follow from the expected manner of recovery or settlement of the carrying amount of the assets and liabilities, using tax rates enacted at the reporting date that are expected to be applied in the period when the asset is recovered or the liability is settled. The carrying amount of a deferred tax asset is reviewed at each balance sheet date, and is reduced to the extent that it is no longer probable that the related tax benefits will be utilized. Such reduction is reversed to the extent that it becomes probable that sufficient taxable profits will be available. At the balance sheet date, deferred tax assets and deferred tax liabilities are offset if all the following conditions are met: - The taxable entity has a legally enforceable right to offset current tax liabilities and assets, and - They relate to income taxes levied by the same tax authority on either:
- the same taxable entity; or - different taxable entities which intend either to settle the current tax liabilities and current tax assets on a
net basis, or to realize the assets and settle the liabilities simultaneously, in each future period in which significant amounts of deferred tax liabilities or assets are expected to be settled or recovered.
27. Operating leases and finance leases
2016 Yearly Report
113 / 169
A lease is classified as either a finance lease or an operating lease. A finance lease is a lease that transfers substantially all the risks and rewards incidental to ownership of a leased asset to the lessee, irrespective of whether the legal title to the asset is eventually transferred. An operating lease is a lease other than a finance lease.
(1) Operating lease charges
Rental payments under operating leases are recognized as part of the cost of another related asset or as expenses on a straight-line basis over the lease term.
(2) Assets acquired under finance leases
When the Group acquires an asset under a finance lease, the asset is measured at an amount equal to the lower of its fair value and the present value of the minimum lease payments, each determined at the inception of the lease. At the commencement of the lease term, the minimum lease payments are recorded as long-term payables. The difference between the carrying amount of the leased assets and the minimum lease payments is recognized as unrecognized finance charges. Initial direct costs attributable to a finance lease that are incurred by the Group are added to the carrying amount of the leased asset. Depreciation and impairment losses are accounted for in accordance with the accounting policies described in Notes V (13) and V (18), respectively. If there is reasonable certainty that the Group will obtain ownership of a leased asset at the end of the lease term, the leased asset is depreciated over its estimated useful life. Otherwise, the leased asset is depreciated over the shorter of the lease term and its estimated useful life. Unrecognized finance charge under a finance lease is amortized using an effective interest method over the lease term. The amortization is accounted for in accordance with the principles of borrowing costs (Note V (15)). At the balance sheet date, the long-term payables arising from finance leases, net of the unrecognized finance charges, are analyzed and separately presented as long-term payables or non-current liabilities due within one year. 28. Discontinued operations The Group classifies a component that either has been disposed of or is classified as held for sale, and is separately identifiable operationally and for financial reporting purposes, and satisfies one of the following conditions as a discontinued operation. - It represents a separate major line of business or geographical area of operations. - It is part of a single coordinated plan to dispose of a separate major line of business or geographical area of
operations. - It is a subsidiary acquired exclusively with a view to resale.
29. Hedge accounting Hedge accounting is a method which recognizes in profit or loss the offsetting effect of changes in the fair value of the hedging instrument and the hedged item in the same accounting period(s). Hedged items are the items that expose the Group to risks of changes in fair value or future cash flows and that are designated as being hedged. The Group’s hedged items include a firm commitment that is settled with a fixed amount of foreign currency and exposes the Group to foreign currency risk and other items. A hedging instrument is a designated derivative whose changes in fair value or cash flows are expected to offset changes in the fair value or cash flows of the hedged item. The hedge is assessed by the Group for effectiveness on an ongoing basis and judged whether it was highly effective throughout the accounting periods for which the hedging relationship was designated. A hedge is regarded as highly effective if both of the following conditions are satisfied:
2016 Yearly Report
114 / 169
- At the inception and in subsequent periods, the hedge is expected to be highly effective in achieving offsetting changes in fair value or cash flows attributable to the hedged risk during the period for which the hedge is designated; and
- The actual results of offsetting are within a range of 80% to 125%.
(1) Cash flow hedges
A cash flow hedge is a hedge of the exposure to variability in cash flows. The portion of the gain or loss on the hedging instrument that is determined to be an effective hedge is recognized directly in shareholders’ equity as a separate component. That effective portion is adjusted to the lesser of the following (in absolute amounts): - The cumulative gain or loss on the hedging instrument from inception of the hedge - The cumulative change in present value of the expected future cash flows on the hedged item from inception
of the hedge. The ineffective portion of the gain or loss on the hedging instrument is recognized in profit or loss. If a hedge of a forecast transaction subsequently results in the recognition of a non-financial asset or non-financial liability, the associated gain or loss is recognized in profit or loss in the same periods during which the non-financial asset or non-financial liability affects profit or loss. However, if the Group expects that all or a portion of a net loss recognized directly in shareholders’ equity will not be recovered in future accounting periods, it reclassifies from equity to profit or loss the amount that is not expected to be recovered. If a hedge of a forecast transaction subsequently results in the recognition of a financial asset or a financial liability, the associated gain or loss is removed from equity and recognized in profit or loss in the same period during which the financial asset or financial liability affects profit or loss. However, if the Group expects that all or a portion of a net loss recognized directly in shareholders’ equity will not be recovered in future accounting periods, it reclassifies from equity to profit or loss the amount that is not expected to be recovered. For cash flow hedges, other than those covered by the preceding two policy statements, the associated gain or loss is removed from shareholders’ equity and recognized in profit or loss in the same period or periods during which the hedged forecast transaction affects profit or loss. When a hedging instrument expires or is sold, terminated or exercised, or the hedge no longer meets the criteria for hedge accounting, the Group will discontinue the hedge accounting treatments prospectively. In this case, the gain or loss on the hedging instrument that remains recognized directly in shareholders’ equity from the period when the hedge was effective is not reclassified into profit or loss and is recognized in accordance with the above policy when the forecast transaction occurs. If the forecast transaction is no longer expected to occur, the gain or loss on the hedging instrument that remains recognized directly in shareholders’ equity from the period when the hedge was effective is reclassified into profit or loss immediately.
(2) Fair value hedges
A fair value hedge is a hedge of the exposure to changes in fair value of a recognized asset or liability or an unrecognized firm commitment, or an identified portion of such an asset, liability or firm commitment. The gain or loss from re-measuring the hedging instrument at fair value is recognized in profit or loss. The gain or loss on the hedged item attributable to the hedged risk adjusts the carrying amount of the hedged item and is recognized in profit or loss. When a hedging instrument expires or is sold, terminated or exercised, or no longer meets the criteria for hedge accounting, the Group discontinues prospectively the hedge accounting treatments. If the hedged item is a financial instrument measured at amortized cost, any adjustment to the carrying amount of the hedged item is amortized to profit or loss from the adjustment date to the maturity date using the recalculated effective interest rate at the adjustment date.

2016 Yearly Report
115 / 169
2016 Yearly Report
116 / 169
30. Related parties If a party has the power to control, jointly control or exercise significant influence over another party, or vice versa, or where two or more parties are subject to common control or joint control from another party, they are considered to be related parties. Related parties may be individuals or enterprises. Enterprises with which the Company is under common control only from the State and that have no other related party relationships are not regarded as related parties. In addition to the related parties stated above, the Company determines related parties based on the disclosure requirements of Administrative Procedures on the Information Disclosures of Listed Companies issued by the CSRC.
31. Segment information The Group identifies reportable segments based on operating segments determined based on internal organization structure of the Group, management requirements, and internal reporting system after taking the materiality principle into account. Two or more operating segments may be aggregated into a single operating segment if the segments have the similar economic characteristics and are same or similar in respect of the nature of each segment’s products and services, the nature of production processes, the types or classes of customers for the products and services, the methods used to distribute the products or provide the services, and the nature of the regulatory environment. Inter-segment revenues are measured on the basis of the actual transaction prices for such transactions for segment reporting. Segment accounting policies are consistent with those for the consolidated financial statements. 32. Important accounting estimates and their key assumptions The preparation of financial statements requires management to make estimates and assumptions that affect the application of accounting policies and the reported amounts of assets, liabilities, income and expenses. Actual results may differ from these estimates. Estimates as well as underlying assumptions and uncertainties involved are reviewed on an ongoing basis. Revisions to accounting estimates are recognized in the period in which the estimate is revised and in any future periods affected. Except for accounting estimates relating to depreciation and amortization of assets such as fixed assets and intangible assets (see Notes V (13) and (16)) and provision for impairment of various types of assets (see Notes V (10), (11), (18)). Other significant accounting estimates are as follows: Note VII (26) – Post-employment benefits – defined benefit plans Note XI - Fair value of financial instruments. 33. Change of important accounting policies and accounting estimates
(1) Change of important accounting policies
Applicable √Not applicable
(2) Change of important accounting estimates
Applicable √Not applicable
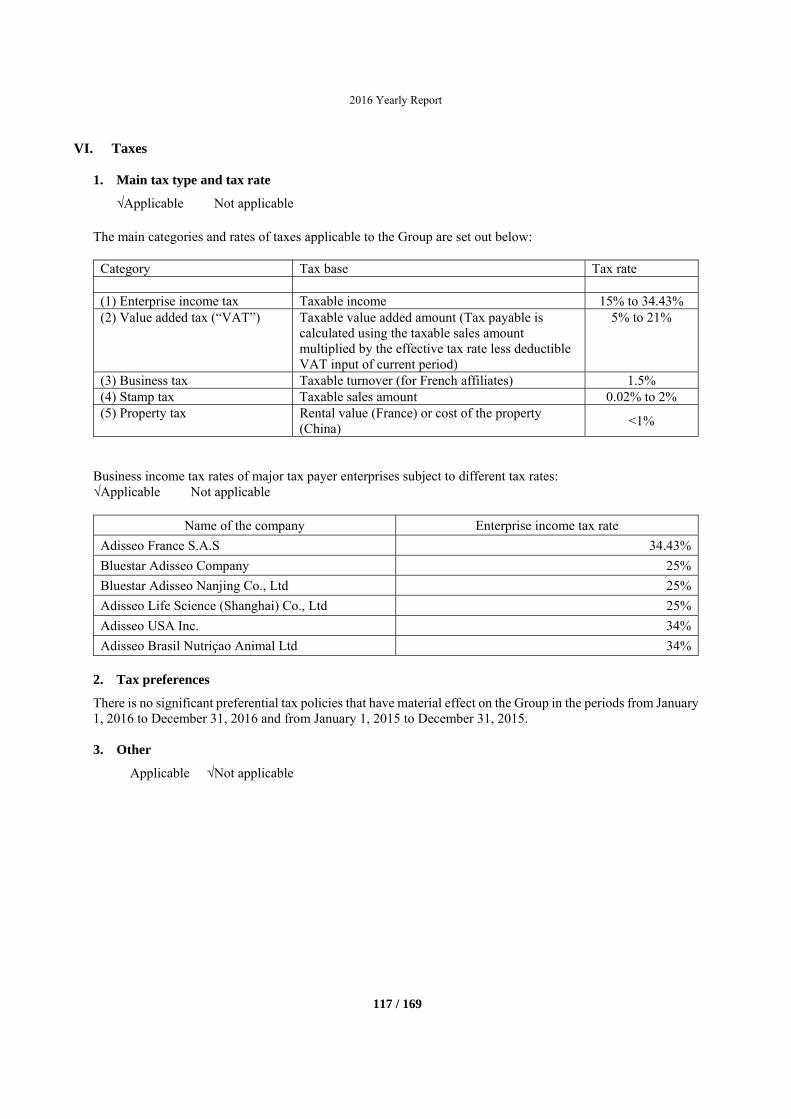
2016 Yearly Report
117 / 169
VI. Taxes
1. Main tax type and tax rate
√Applicable Not applicable The main categories and rates of taxes applicable to the Group are set out below:
Category Tax base Tax rate (1) Enterprise income tax Taxable income 15% to 34.43%(2) Value added tax (“VAT”) Taxable value added amount (Tax payable is
calculated using the taxable sales amount multiplied by the effective tax rate less deductible VAT input of current period)
5% to 21%
(3) Business tax Taxable turnover (for French affiliates) 1.5%(4) Stamp tax Taxable sales amount 0.02% to 2%(5) Property tax Rental value (France) or cost of the property
(China) <1%
Business income tax rates of major tax payer enterprises subject to different tax rates: √Applicable Not applicable
Name of the company Enterprise income tax rate
Adisseo France S.A.S 34.43%
Bluestar Adisseo Company 25%
Bluestar Adisseo Nanjing Co., Ltd 25%
Adisseo Life Science (Shanghai) Co., Ltd 25%
Adisseo USA Inc. 34%
Adisseo Brasil Nutriçao Animal Ltd 34%
2. Tax preferences
There is no significant preferential tax policies that have material effect on the Group in the periods from January 1, 2016 to December 31, 2016 and from January 1, 2015 to December 31, 2015.
3. Other
Applicable √Not applicable
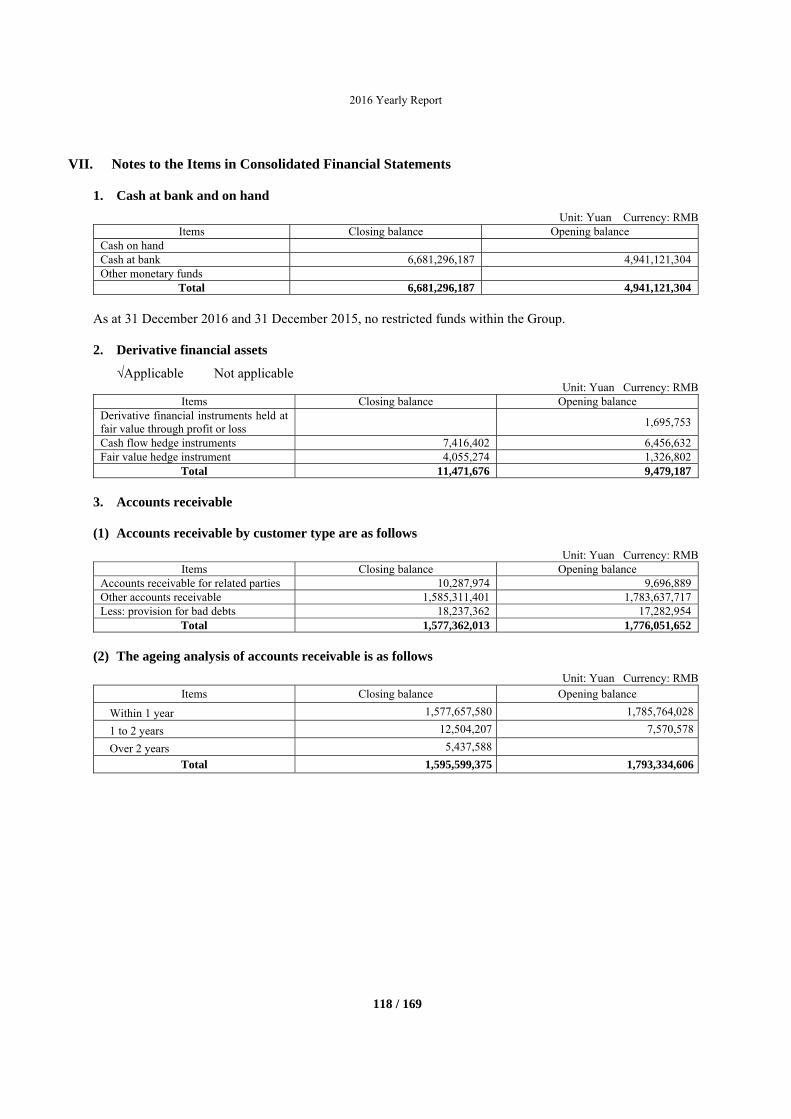
2016 Yearly Report
118 / 169
VII. Notes to the Items in Consolidated Financial Statements
1. Cash at bank and on hand
Unit: Yuan Currency: RMB Items Closing balance Opening balance
Cash on hand Cash at bank 6,681,296,187 4,941,121,304Other monetary funds
Total 6,681,296,187 4,941,121,304 As at 31 December 2016 and 31 December 2015, no restricted funds within the Group.
2. Derivative financial assets
√Applicable Not applicable Unit: Yuan Currency: RMB
Items Closing balance Opening balance Derivative financial instruments held at fair value through profit or loss 1,695,753
Cash flow hedge instruments 7,416,402 6,456,632Fair value hedge instrument 4,055,274 1,326,802
Total 11,471,676 9,479,187
3. Accounts receivable
(1) Accounts receivable by customer type are as follows
Unit: Yuan Currency: RMB Items Closing balance Opening balance
Accounts receivable for related parties 10,287,974 9,696,889Other accounts receivable 1,585,311,401 1,783,637,717Less: provision for bad debts 18,237,362 17,282,954
Total 1,577,362,013 1,776,051,652
(2) The ageing analysis of accounts receivable is as follows
Unit: Yuan Currency: RMB Items Closing balance Opening balance
Within 1 year 1,577,657,580 1,785,764,028
1 to 2 years 12,504,207 7,570,578
Over 2 years 5,437,588
Total 1,595,599,375 1,793,334,606
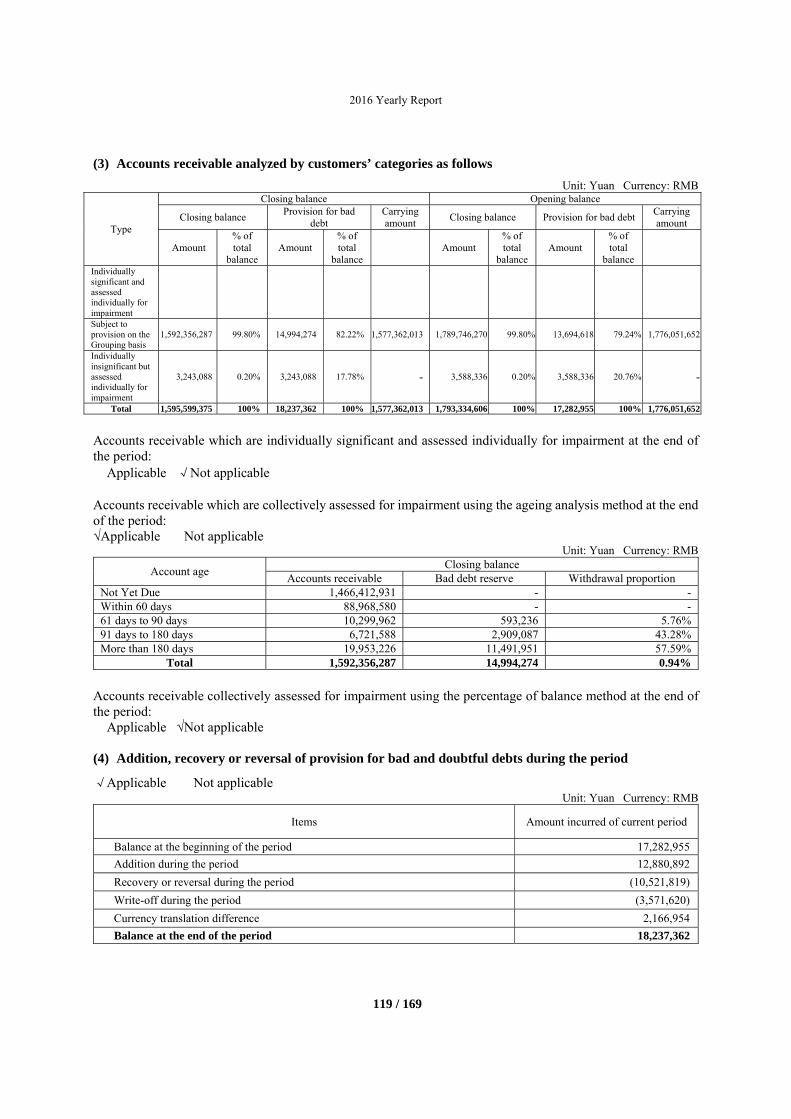
2016 Yearly Report
119 / 169
(3) Accounts receivable analyzed by customers’ categories as follows
Unit: Yuan Currency: RMB
Type
Closing balance Opening balance
Closing balance Provision for bad
debt Carrying amount
Closing balance Provision for bad debt Carrying amount
Amount % of total
balance Amount
% of total
balanceAmount
% of total
balanceAmount
% of total
balance
Individually significant and assessed individually for impairment
Subject to provision on the Grouping basis
1,592,356,287 99.80% 14,994,274 82.22% 1,577,362,013 1,789,746,270 99.80% 13,694,618 79.24% 1,776,051,652
Individually insignificant but assessed individually for impairment
3,243,088 0.20% 3,243,088 17.78% - 3,588,336 0.20% 3,588,336 20.76% -
Total 1,595,599,375 100% 18,237,362 100% 1,577,362,013 1,793,334,606 100% 17,282,955 100% 1,776,051,652
Accounts receivable which are individually significant and assessed individually for impairment at the end of the period: Applicable √Not applicable Accounts receivable which are collectively assessed for impairment using the ageing analysis method at the end of the period: √Applicable Not applicable
Unit: Yuan Currency: RMB
Account age Closing balance
Accounts receivable Bad debt reserve Withdrawal proportion Not Yet Due 1,466,412,931 - -Within 60 days 88,968,580 - -61 days to 90 days 10,299,962 593,236 5.76%91 days to 180 days 6,721,588 2,909,087 43.28%More than 180 days 19,953,226 11,491,951 57.59%
Total 1,592,356,287 14,994,274 0.94%
Accounts receivable collectively assessed for impairment using the percentage of balance method at the end of the period:
Applicable √Not applicable
(4) Addition, recovery or reversal of provision for bad and doubtful debts during the period
√Applicable Not applicable Unit: Yuan Currency: RMB
Items Amount incurred of current period
Balance at the beginning of the period 17,282,955
Addition during the period 12,880,892
Recovery or reversal during the period (10,521,819)
Write-off during the period (3,571,620)
Currency translation difference 2,166,954
Balance at the end of the period 18,237,362
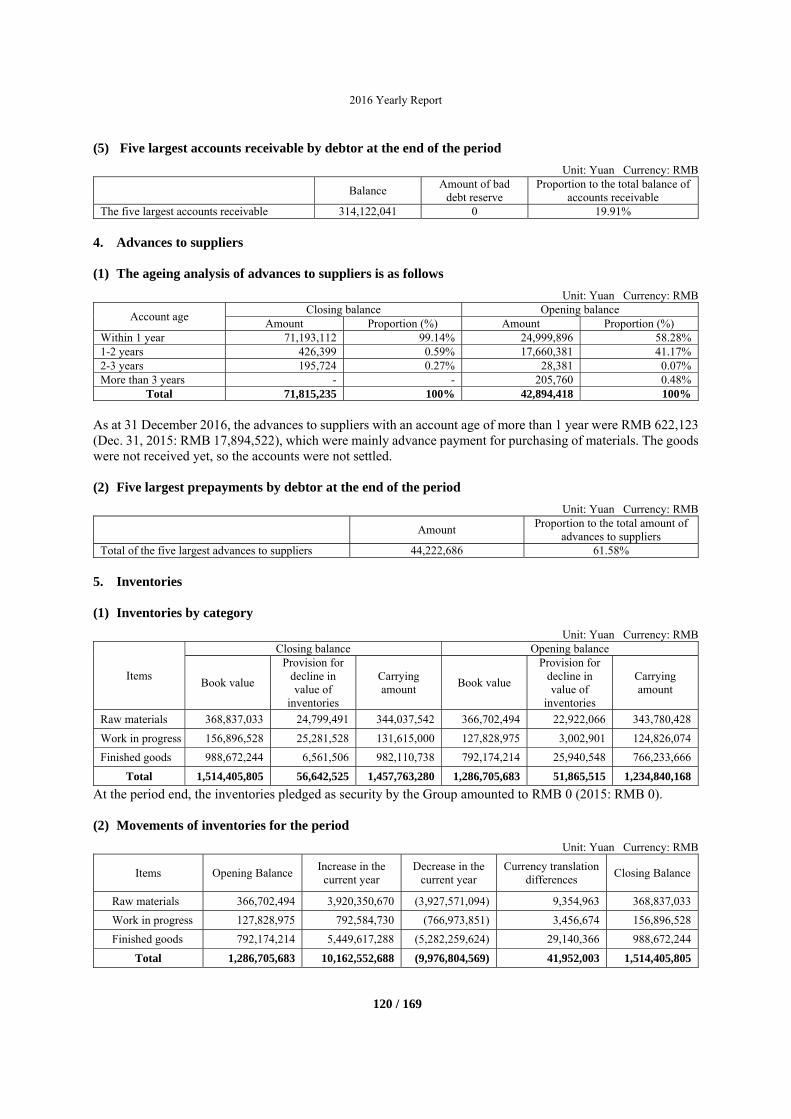
2016 Yearly Report
120 / 169
(5) Five largest accounts receivable by debtor at the end of the period
Unit: Yuan Currency: RMB
Balance Amount of bad
debt reserve Proportion to the total balance of
accounts receivable The five largest accounts receivable 314,122,041 0 19.91%
4. Advances to suppliers
(1) The ageing analysis of advances to suppliers is as follows
Unit: Yuan Currency: RMB
Account age Closing balance Opening balance
Amount Proportion (%) Amount Proportion (%) Within 1 year 71,193,112 99.14% 24,999,896 58.28%1-2 years 426,399 0.59% 17,660,381 41.17%2-3 years 195,724 0.27% 28,381 0.07%More than 3 years - - 205,760 0.48%
Total 71,815,235 100% 42,894,418 100% As at 31 December 2016, the advances to suppliers with an account age of more than 1 year were RMB 622,123 (Dec. 31, 2015: RMB 17,894,522), which were mainly advance payment for purchasing of materials. The goods were not received yet, so the accounts were not settled.
(2) Five largest prepayments by debtor at the end of the period
Unit: Yuan Currency: RMB
Amount Proportion to the total amount of
advances to suppliers Total of the five largest advances to suppliers 44,222,686 61.58%
5. Inventories
(1) Inventories by category
Unit: Yuan Currency: RMB
Items
Closing balance Opening balance
Book value
Provision for decline in value of
inventories
Carrying amount
Book value
Provision for decline in value of
inventories
Carrying amount
Raw materials 368,837,033 24,799,491 344,037,542 366,702,494 22,922,066 343,780,428
Work in progress 156,896,528 25,281,528 131,615,000 127,828,975 3,002,901 124,826,074
Finished goods 988,672,244 6,561,506 982,110,738 792,174,214 25,940,548 766,233,666
Total 1,514,405,805 56,642,525 1,457,763,280 1,286,705,683 51,865,515 1,234,840,168
At the period end, the inventories pledged as security by the Group amounted to RMB 0 (2015: RMB 0).
(2) Movements of inventories for the period
Unit: Yuan Currency: RMB
Items Opening Balance Increase in the
current year Decrease in the
current year Currency translation
differences Closing Balance
Raw materials 366,702,494 3,920,350,670 (3,927,571,094) 9,354,963 368,837,033
Work in progress 127,828,975 792,584,730 (766,973,851) 3,456,674 156,896,528
Finished goods 792,174,214 5,449,617,288 (5,282,259,624) 29,140,366 988,672,244
Total 1,286,705,683 10,162,552,688 (9,976,804,569) 41,952,003 1,514,405,805
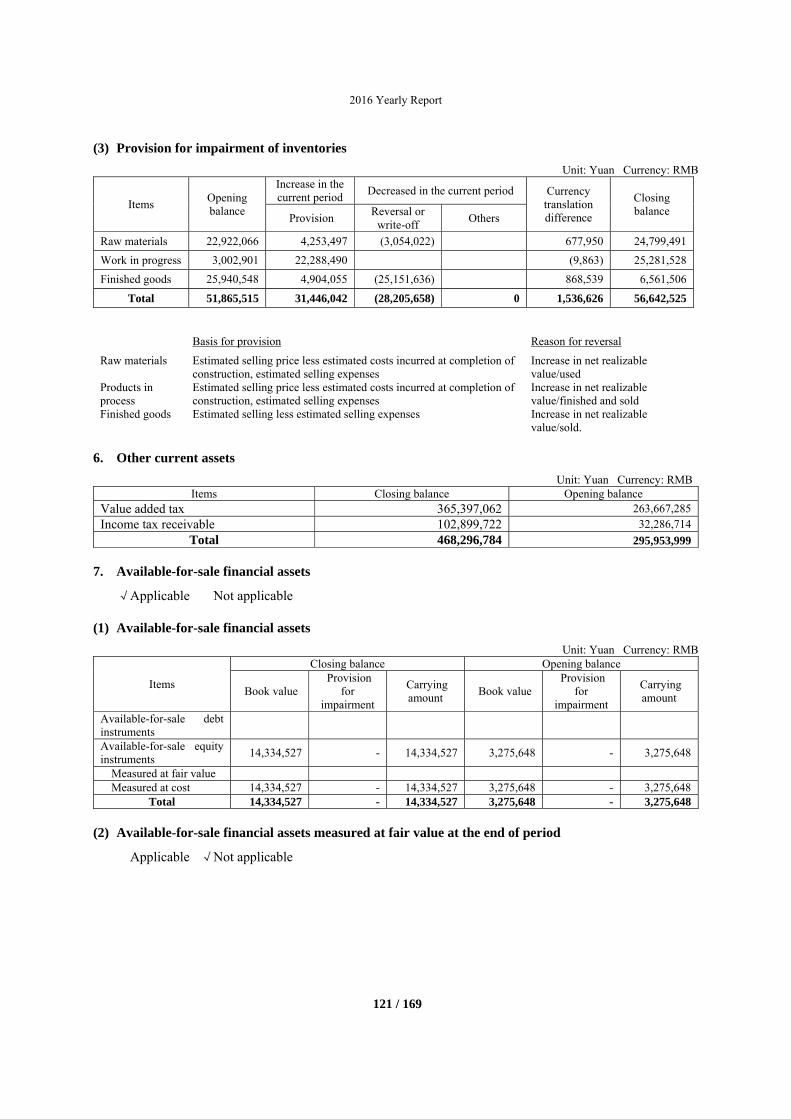
2016 Yearly Report
121 / 169
(3) Provision for impairment of inventories
Unit: Yuan Currency: RMB
Items Opening balance
Increase in the current period
Decreased in the current period Currency translation difference
Closing balance
Provision Reversal or
write-off Others
Raw materials 22,922,066 4,253,497 (3,054,022) 677,950 24,799,491
Work in progress 3,002,901 22,288,490 (9,863) 25,281,528
Finished goods 25,940,548 4,904,055 (25,151,636) 868,539 6,561,506
Total 51,865,515 31,446,042 (28,205,658) 0 1,536,626 56,642,525
Basis for provision Reason for reversal
Raw materials Estimated selling price less estimated costs incurred at completion of construction, estimated selling expenses
Increase in net realizable value/used
Products in process
Estimated selling price less estimated costs incurred at completion of construction, estimated selling expenses
Increase in net realizable value/finished and sold
Finished goods Estimated selling less estimated selling expenses Increase in net realizable value/sold.
6. Other current assets
Unit: Yuan Currency: RMB Items Closing balance Opening balance
Value added tax 365,397,062 263,667,285
Income tax receivable 102,899,722 32,286,714
Total 468,296,784 295,953,999
7. Available-for-sale financial assets
√Applicable Not applicable
(1) Available-for-sale financial assets
Unit: Yuan Currency: RMB
Items
Closing balance Opening balance
Book value Provision
for impairment
Carrying amount
Book value Provision
for impairment
Carrying amount
Available-for-sale debt instruments
Available-for-sale equity instruments
14,334,527 - 14,334,527 3,275,648 - 3,275,648
Measured at fair value Measured at cost 14,334,527 - 14,334,527 3,275,648 - 3,275,648
Total 14,334,527 - 14,334,527 3,275,648 - 3,275,648
(2) Available-for-sale financial assets measured at fair value at the end of period
A pplicable √Not applicable
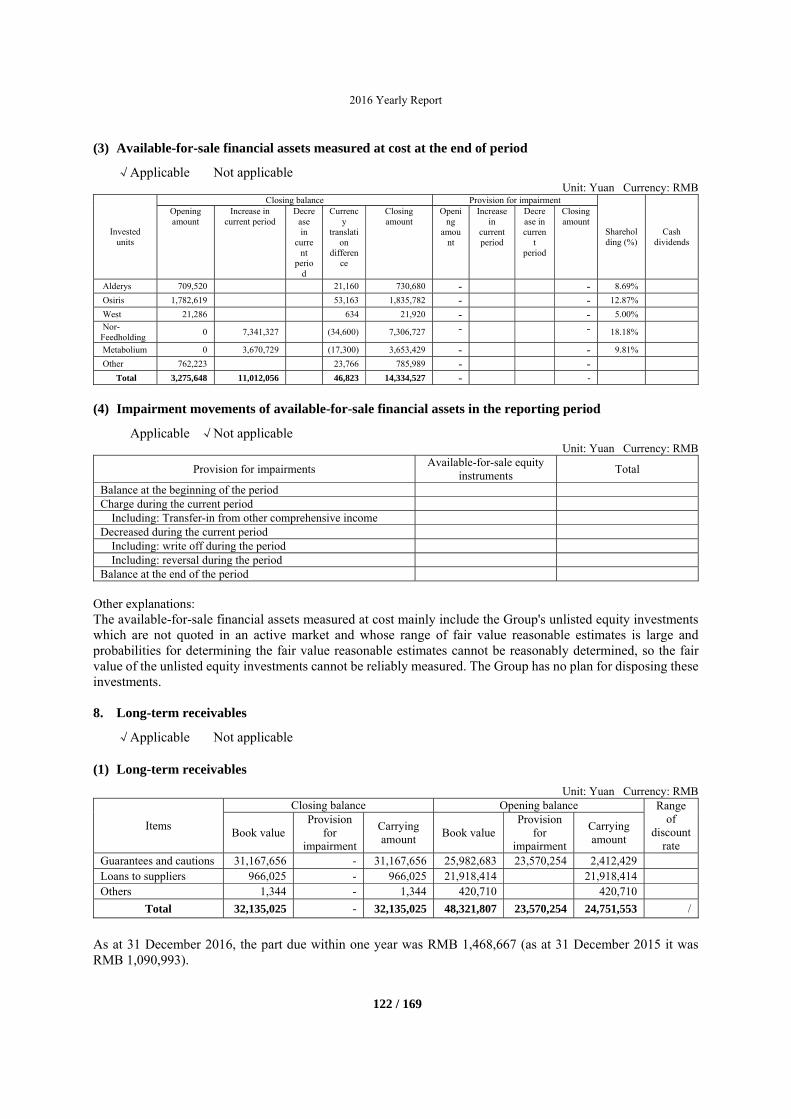
2016 Yearly Report
122 / 169
(3) Available-for-sale financial assets measured at cost at the end of period
√Applicable Not applicable Unit: Yuan Currency: RMB
Invested units
Closing balance Provision for impairment
Shareholding (%)
Cash dividends
Opening amount
Increase in current period
Decrease in
current
period
Currency
translation
difference
Closing amount
Opening
amount
Increase in
current period
Decrease in curren
t period
Closing amount
Alderys 709,520 21,160 730,680 - - 8.69%
Osiris 1,782,619 53,163 1,835,782 - - 12.87%
West 21,286 634 21,920 - - 5.00% Nor-Feedholding
0 7,341,327 (34,600) 7,306,727 - - 18.18%
Metabolium 0 3,670,729 (17,300) 3,653,429 - - 9.81%
Other 762,223 23,766 785,989 - -
Total 3,275,648 11,012,056 46,823 14,334,527 - -
(4) Impairment movements of available-for-sale financial assets in the reporting period
Applicable √Not applicable Unit: Yuan Currency: RMB
Provision for impairments Available-for-sale equity
instruments Total
Balance at the beginning of the period Charge during the current period
Including: Transfer-in from other comprehensive income Decreased during the current period
Including: write off during the period Including: reversal during the period
Balance at the end of the period Other explanations: The available-for-sale financial assets measured at cost mainly include the Group's unlisted equity investments which are not quoted in an active market and whose range of fair value reasonable estimates is large and probabilities for determining the fair value reasonable estimates cannot be reasonably determined, so the fair value of the unlisted equity investments cannot be reliably measured. The Group has no plan for disposing these investments.
8. Long-term receivables
√Applicable Not applicable
(1) Long-term receivables
Unit: Yuan Currency: RMB
Items
Closing balance Opening balance Range of
discount rate
Book value Provision
for impairment
Carrying amount
Book valueProvision
for impairment
Carrying amount
Guarantees and cautions 31,167,656 - 31,167,656 25,982,683 23,570,254 2,412,429 Loans to suppliers 966,025 - 966,025 21,918,414 21,918,414 Others 1,344 - 1,344 420,710 420,710
Total 32,135,025 - 32,135,025 48,321,807 23,570,254 24,751,553 /
As at 31 December 2016, the part due within one year was RMB 1,468,667 (as at 31 December 2015 it was RMB 1,090,993).
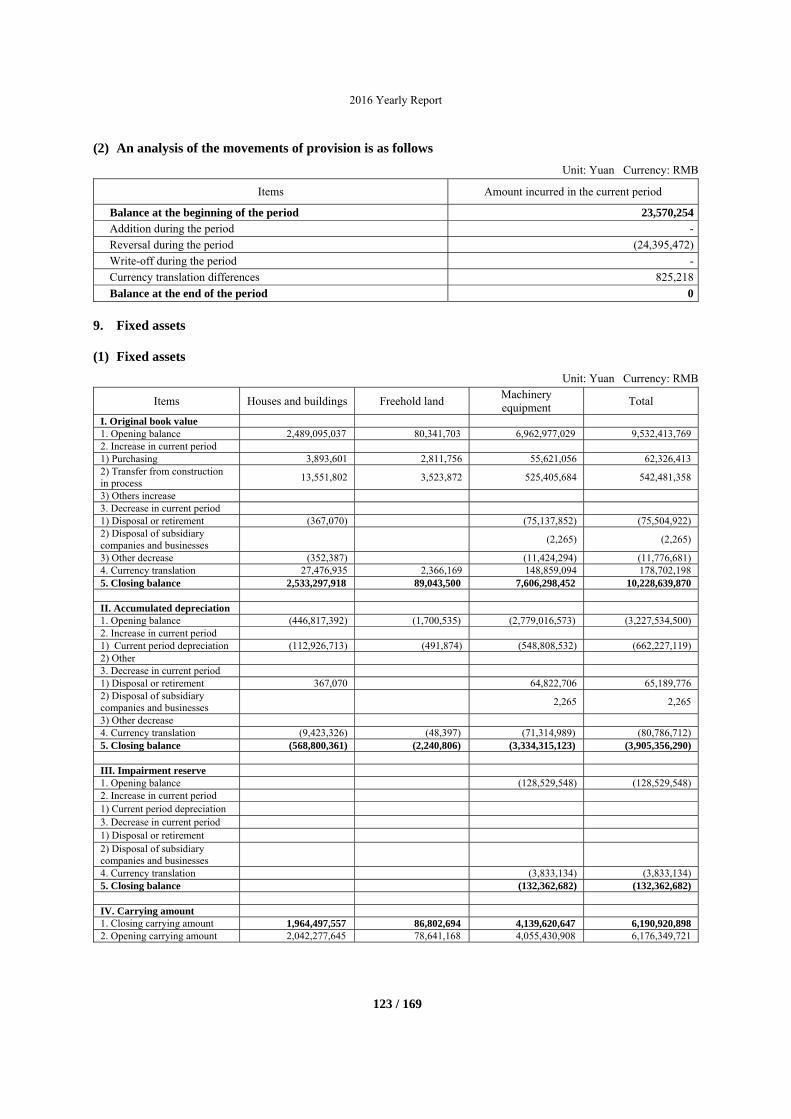
2016 Yearly Report
123 / 169
(2) An analysis of the movements of provision is as follows
Unit: Yuan Currency: RMB
Items Amount incurred in the current period
Balance at the beginning of the period 23,570,254 Addition during the period -
Reversal during the period (24,395,472)
Write-off during the period -
Currency translation differences 825,218
Balance at the end of the period 0
9. Fixed assets
(1) Fixed assets
Unit: Yuan Currency: RMB
Items Houses and buildings Freehold land Machinery equipment
Total
I. Original book value 1. Opening balance 2,489,095,037 80,341,703 6,962,977,029 9,532,413,7692. Increase in current period 1) Purchasing 3,893,601 2,811,756 55,621,056 62,326,4132) Transfer from construction in process 13,551,802 3,523,872 525,405,684 542,481,358
3) Others increase 3. Decrease in current period 1) Disposal or retirement (367,070) (75,137,852) (75,504,922)2) Disposal of subsidiary companies and businesses (2,265) (2,265)
3) Other decrease (352,387) (11,424,294) (11,776,681)4. Currency translation 27,476,935 2,366,169 148,859,094 178,702,1985. Closing balance 2,533,297,918 89,043,500 7,606,298,452 10,228,639,870 II. Accumulated depreciation 1. Opening balance (446,817,392) (1,700,535) (2,779,016,573) (3,227,534,500)2. Increase in current period 1) Current period depreciation (112,926,713) (491,874) (548,808,532) (662,227,119)2) Other 3. Decrease in current period 1) Disposal or retirement 367,070 64,822,706 65,189,7762) Disposal of subsidiary companies and businesses 2,265 2,265
3) Other decrease 4. Currency translation (9,423,326) (48,397) (71,314,989) (80,786,712)5. Closing balance (568,800,361) (2,240,806) (3,334,315,123) (3,905,356,290) III. Impairment reserve 1. Opening balance (128,529,548) (128,529,548)2. Increase in current period 1) Current period depreciation 3. Decrease in current period 1) Disposal or retirement 2) Disposal of subsidiary companies and businesses
4. Currency translation (3,833,134) (3,833,134)5. Closing balance (132,362,682) (132,362,682) IV. Carrying amount 1. Closing carrying amount 1,964,497,557 86,802,694 4,139,620,647 6,190,920,8982. Opening carrying amount 2,042,277,645 78,641,168 4,055,430,908 6,176,349,721
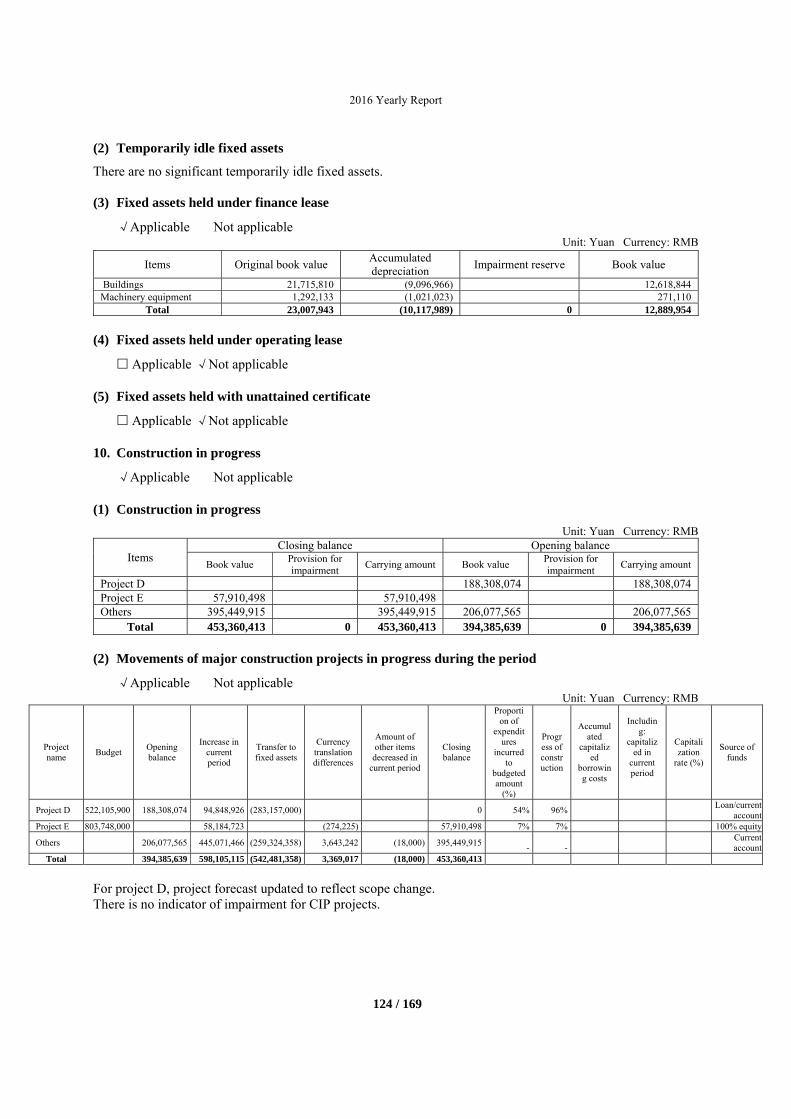
2016 Yearly Report
124 / 169
(2) Temporarily idle fixed assets
There are no significant temporarily idle fixed assets.
(3) Fixed assets held under finance lease
√Applicable Not applicable Unit: Yuan Currency: RMB
(4) Fixed assets held under operating lease
Applicable √Not applicable
(5) Fixed assets held with unattained certificate
Applicable √Not applicable
10. Construction in progress
√Applicable Not applicable
(1) Construction in progress
Unit: Yuan Currency: RMB
Items Closing balance Opening balance
Book value Provision for impairment
Carrying amount Book value Provision for impairment
Carrying amount
Project D 188,308,074 188,308,074 Project E 57,910,498 57,910,498 Others 395,449,915 395,449,915 206,077,565 206,077,565
Total 453,360,413 0 453,360,413 394,385,639 0 394,385,639
(2) Movements of major construction projects in progress during the period
√Applicable Not applicable Unit: Yuan Currency: RMB
Project name
Budget Opening balance
Increase in current period
Transfer to fixed assets
Currency translation differences
Amount of other items
decreased in current period
Closing balance
Proportion of
expenditures
incurred to
budgeted amount
(%)
Progress of construction
Accumulated
capitalized
borrowing costs
Including:
capitalized in
current period
Capitalization
rate (%)
Source of funds
Project D 522,105,900 188,308,074 94,848,926 (283,157,000) 0 54% 96% Loan/current
accountProject E 803,748,000 58,184,723 (274,225) 57,910,498 7% 7% 100% equity
Others 206,077,565 445,071,466 (259,324,358) 3,643,242 (18,000) 395,449,915
-
-
Current account
Total 394,385,639 598,105,115 (542,481,358) 3,369,017 (18,000) 453,360,413
For project D, project forecast updated to reflect scope change. There is no indicator of impairment for CIP projects.
Items Original book value Accumulated depreciation
Impairment reserve Book value
Buildings 21,715,810 (9,096,966) 12,618,844Machinery equipment 1,292,133 (1,021,023) 271,110
Total 23,007,943 (10,117,989) 0 12,889,954
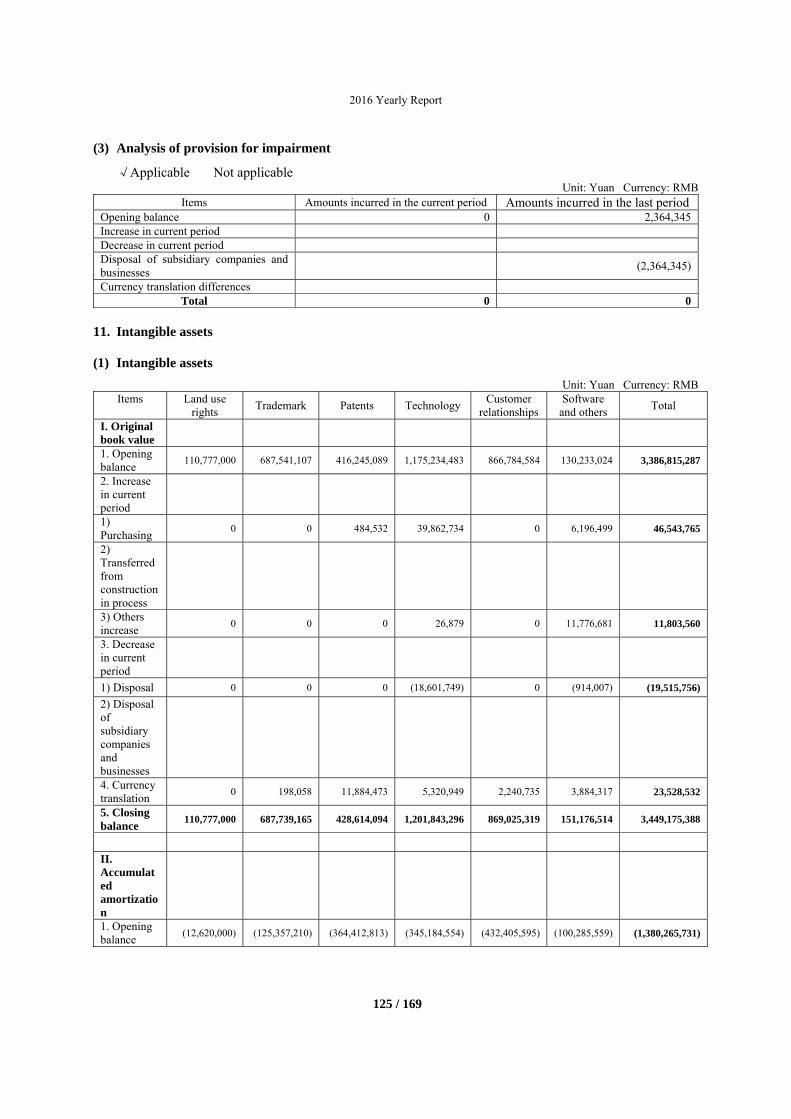
2016 Yearly Report
125 / 169
(3) Analysis of provision for impairment
√Applicable Not applicable Unit: Yuan Currency: RMB
Items Amounts incurred in the current period Amounts incurred in the last periodOpening balance 0 2,364,345 Increase in current period Decrease in current period Disposal of subsidiary companies and businesses
(2,364,345)
Currency translation differences Total 0 0
11. Intangible assets
(1) Intangible assets
Unit: Yuan Currency: RMB Items Land use
rights Trademark Patents Technology
Customer relationships
Software and others
Total
I. Original book value
1. Opening balance
110,777,000 687,541,107 416,245,089 1,175,234,483 866,784,584 130,233,024 3,386,815,287
2. Increase in current period
1) Purchasing
0 0 484,532 39,862,734 0 6,196,499 46,543,765
2) Transferred from construction in process
3) Others increase
0 0 0 26,879 0 11,776,681 11,803,560
3. Decrease in current period
1) Disposal 0 0 0 (18,601,749) 0 (914,007) (19,515,756)
2) Disposal of subsidiary companies and businesses
4. Currency translation
0 198,058 11,884,473 5,320,949 2,240,735 3,884,317 23,528,532
5. Closing balance
110,777,000 687,739,165 428,614,094 1,201,843,296 869,025,319 151,176,514 3,449,175,388
II. Accumulated amortization
1. Opening balance
(12,620,000) (125,357,210) (364,412,813) (345,184,554) (432,405,595) (100,285,559) (1,380,265,731)
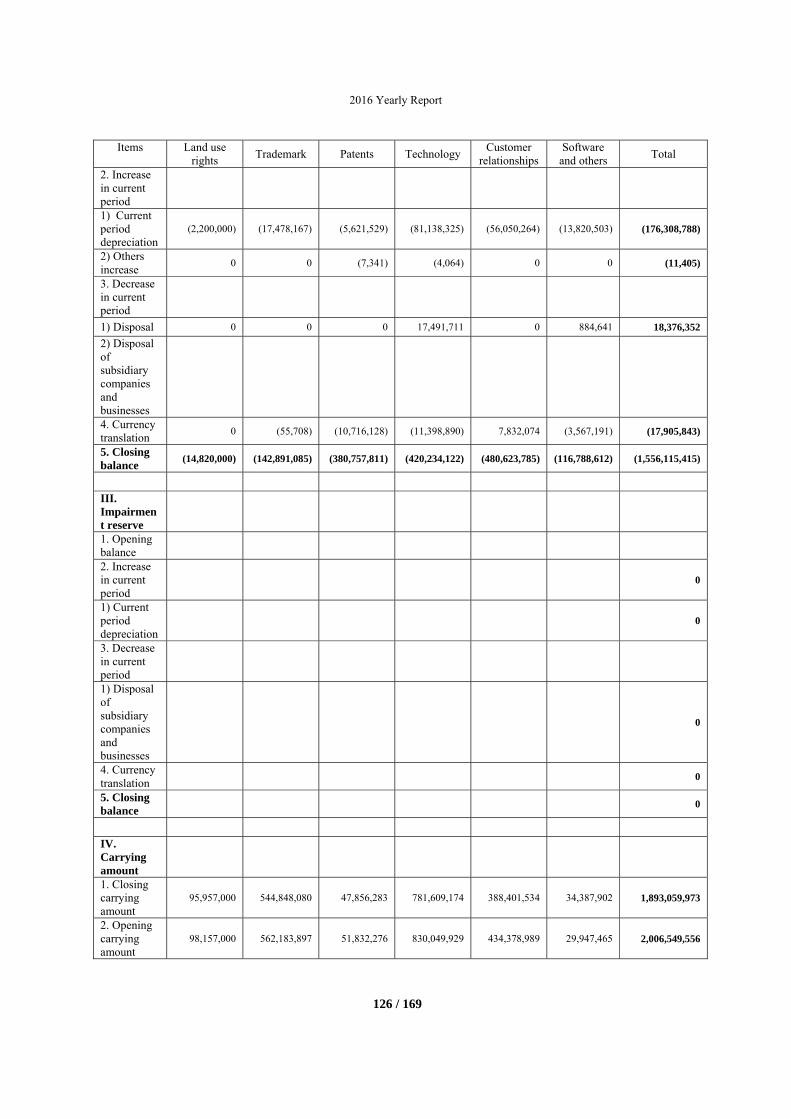
2016 Yearly Report
126 / 169
Items Land use rights
Trademark Patents TechnologyCustomer
relationships Software
and others Total
2. Increase in current period
1) Current period depreciation
(2,200,000) (17,478,167) (5,621,529) (81,138,325) (56,050,264) (13,820,503) (176,308,788)
2) Others increase
0 0 (7,341) (4,064) 0 0 (11,405)
3. Decrease in current period
1) Disposal 0 0 0 17,491,711 0 884,641 18,376,352
2) Disposal of subsidiary companies and businesses
4. Currency translation
0 (55,708) (10,716,128) (11,398,890) 7,832,074 (3,567,191) (17,905,843)
5. Closing balance
(14,820,000) (142,891,085) (380,757,811) (420,234,122) (480,623,785) (116,788,612) (1,556,115,415)
III. Impairment reserve
1. Opening balance
2. Increase in current period
0
1) Current period depreciation
0
3. Decrease in current period
1) Disposal of subsidiary companies and businesses
0
4. Currency translation
0
5. Closing balance
0
IV. Carrying amount
1. Closing carrying amount
95,957,000 544,848,080 47,856,283 781,609,174 388,401,534 34,387,902 1,893,059,973
2. Opening carrying amount
98,157,000 562,183,897 51,832,276 830,049,929 434,378,989 29,947,465 2,006,549,556
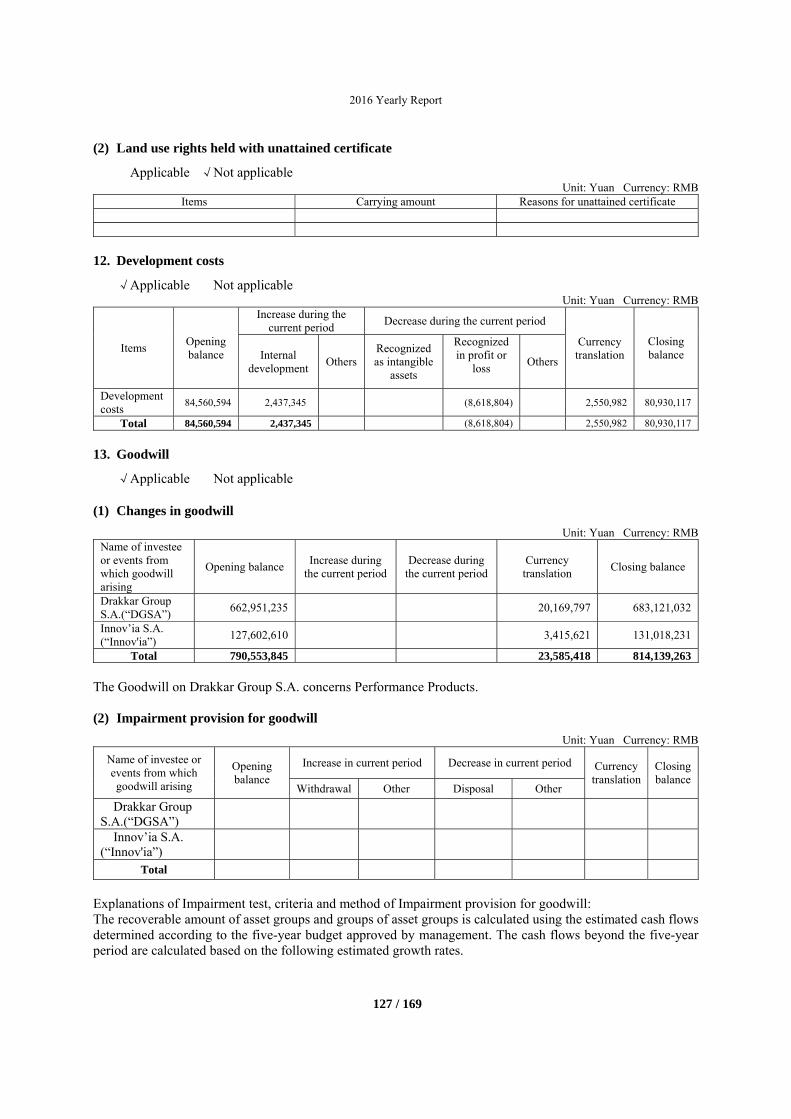
2016 Yearly Report
127 / 169
(2) Land use rights held with unattained certificate
Applicable √Not applicable Unit: Yuan Currency: RMB
Items Carrying amount Reasons for unattained certificate
12. Development costs
√Applicable Not applicable Unit: Yuan Currency: RMB
Items Opening balance
Increase during the current period
Decrease during the current period
Closing balance Internal
development Others
Recognized as intangible
assets
Recognized in profit or
loss
Others
Currency translation
Development costs
84,560,594 2,437,345 (8,618,804) 2,550,982 80,930,117
Total 84,560,594 2,437,345 (8,618,804) 2,550,982 80,930,117
13. Goodwill
√Applicable Not applicable
(1) Changes in goodwill
Unit: Yuan Currency: RMB Name of investee or events from which goodwill arising
Opening balance Increase during
the current periodDecrease during
the current periodCurrency translation
Closing balance
Drakkar Group S.A.(“DGSA”)
662,951,235 20,169,797 683,121,032
Innov’ia S.A. (“Innov'ia”)
127,602,610 3,415,621 131,018,231
Total 790,553,845 23,585,418 814,139,263 The Goodwill on Drakkar Group S.A. concerns Performance Products.
(2) Impairment provision for goodwill
Unit: Yuan Currency: RMB Name of investee or events from which goodwill arising
Opening balance
Increase in current period Decrease in current period Currency translation
Closing balance
Withdrawal Other Disposal Other
Drakkar Group S.A.(“DGSA”)
Innov’ia S.A. (“Innov'ia”)
Total
Explanations of Impairment test, criteria and method of Impairment provision for goodwill: The recoverable amount of asset groups and groups of asset groups is calculated using the estimated cash flows determined according to the five-year budget approved by management. The cash flows beyond the five-year period are calculated based on the following estimated growth rates.
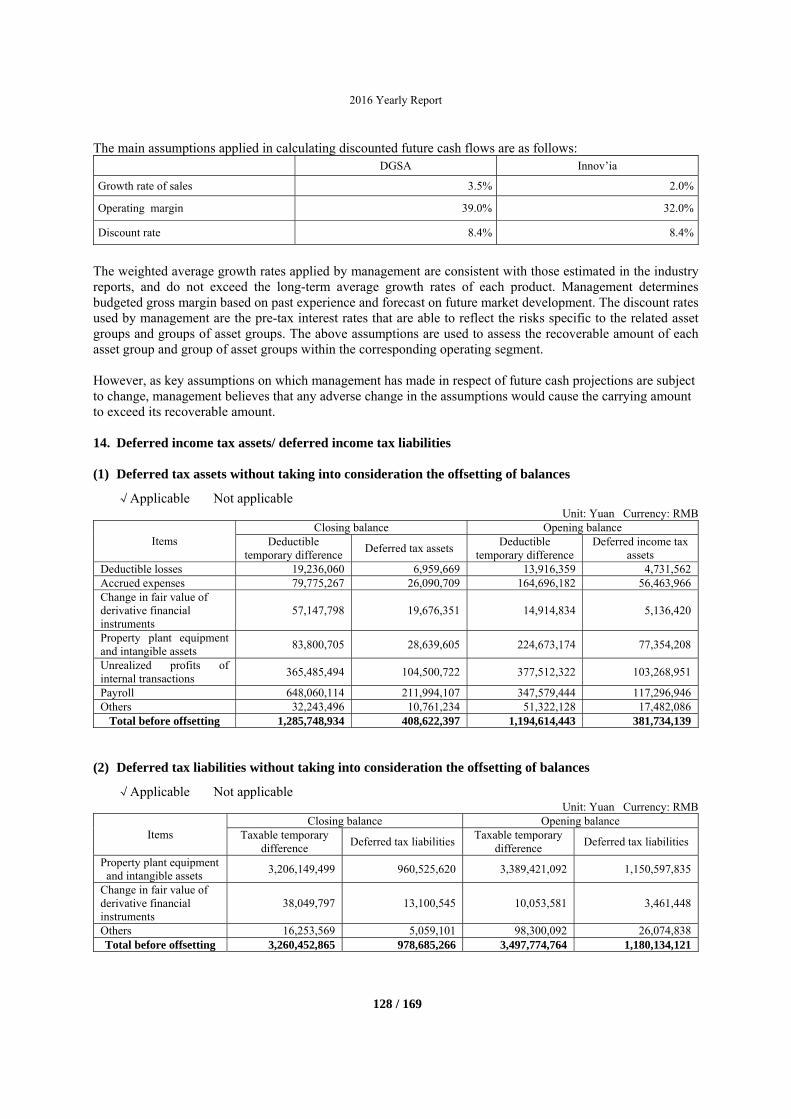
2016 Yearly Report
128 / 169
The main assumptions applied in calculating discounted future cash flows are as follows: DGSA Innov’ia
Growth rate of sales 3.5% 2.0%
Operating margin 39.0% 32.0%
Discount rate 8.4% 8.4%
The weighted average growth rates applied by management are consistent with those estimated in the industry reports, and do not exceed the long-term average growth rates of each product. Management determines budgeted gross margin based on past experience and forecast on future market development. The discount rates used by management are the pre-tax interest rates that are able to reflect the risks specific to the related asset groups and groups of asset groups. The above assumptions are used to assess the recoverable amount of each asset group and group of asset groups within the corresponding operating segment. However, as key assumptions on which management has made in respect of future cash projections are subject to change, management believes that any adverse change in the assumptions would cause the carrying amount to exceed its recoverable amount.
14. Deferred income tax assets/ deferred income tax liabilities
(1) Deferred tax assets without taking into consideration the offsetting of balances
√Applicable Not applicable Unit: Yuan Currency: RMB
Items Closing balance Opening balance
Deductible temporary difference
Deferred tax assets Deductible
temporary difference Deferred income tax
assets Deductible losses 19,236,060 6,959,669 13,916,359 4,731,562Accrued expenses 79,775,267 26,090,709 164,696,182 56,463,966Change in fair value of derivative financial instruments
57,147,798 19,676,351 14,914,834 5,136,420
Property plant equipment and intangible assets
83,800,705 28,639,605 224,673,174 77,354,208
Unrealized profits of internal transactions
365,485,494 104,500,722 377,512,322 103,268,951
Payroll 648,060,114 211,994,107 347,579,444 117,296,946Others 32,243,496 10,761,234 51,322,128 17,482,086
Total before offsetting 1,285,748,934 408,622,397 1,194,614,443 381,734,139
(2) Deferred tax liabilities without taking into consideration the offsetting of balances
√Applicable Not applicable Unit: Yuan Currency: RMB
Items Closing balance Opening balance
Taxable temporary difference
Deferred tax liabilitiesTaxable temporary
difference Deferred tax liabilities
Property plant equipment and intangible assets
3,206,149,499 960,525,620 3,389,421,092 1,150,597,835
Change in fair value of derivative financial instruments
38,049,797 13,100,545 10,053,581 3,461,448
Others 16,253,569 5,059,101 98,300,092 26,074,838Total before offsetting 3,260,452,865 978,685,266 3,497,774,764 1,180,134,121
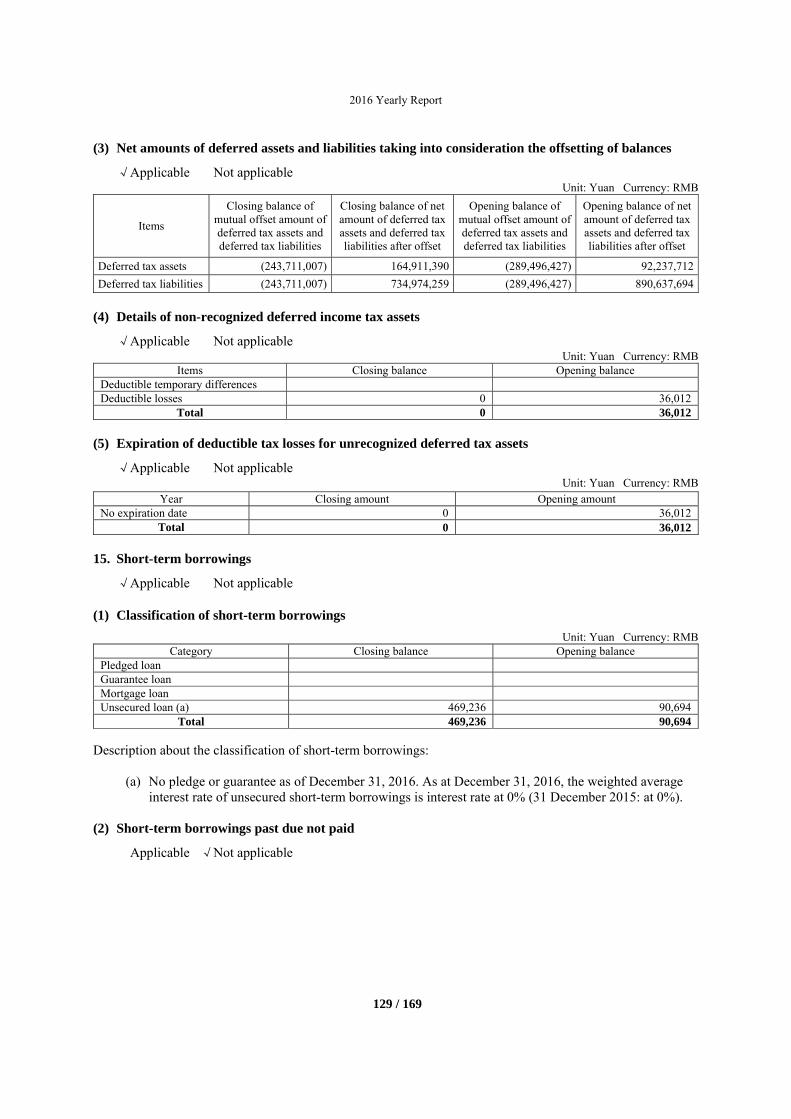
2016 Yearly Report
129 / 169
(3) Net amounts of deferred assets and liabilities taking into consideration the offsetting of balances
√Applicable Not applicable Unit: Yuan Currency: RMB
Items
Closing balance of mutual offset amount of deferred tax assets and deferred tax liabilities
Closing balance of net amount of deferred tax assets and deferred tax liabilities after offset
Opening balance of mutual offset amount of deferred tax assets and deferred tax liabilities
Opening balance of net amount of deferred tax assets and deferred tax liabilities after offset
Deferred tax assets (243,711,007) 164,911,390 (289,496,427) 92,237,712
Deferred tax liabilities (243,711,007) 734,974,259 (289,496,427) 890,637,694
(4) Details of non-recognized deferred income tax assets
√Applicable Not applicable Unit: Yuan Currency: RMB
Items Closing balance Opening balance Deductible temporary differences Deductible losses 0 36,012
Total 0 36,012
(5) Expiration of deductible tax losses for unrecognized deferred tax assets
√Applicable Not applicable Unit: Yuan Currency: RMB
Year Closing amount Opening amount No expiration date 0 36,012
Total 0 36,012
15. Short-term borrowings
√Applicable Not applicable
(1) Classification of short-term borrowings
Unit: Yuan Currency: RMB Category Closing balance Opening balance
Pledged loan Guarantee loan Mortgage loan Unsecured loan (a) 469,236 90,694
Total 469,236 90,694
Description about the classification of short-term borrowings:
(a) No pledge or guarantee as of December 31, 2016. As at December 31, 2016, the weighted average interest rate of unsecured short-term borrowings is interest rate at 0% (31 December 2015: at 0%).
(2) Short-term borrowings past due not paid
Applicable √Not applicable
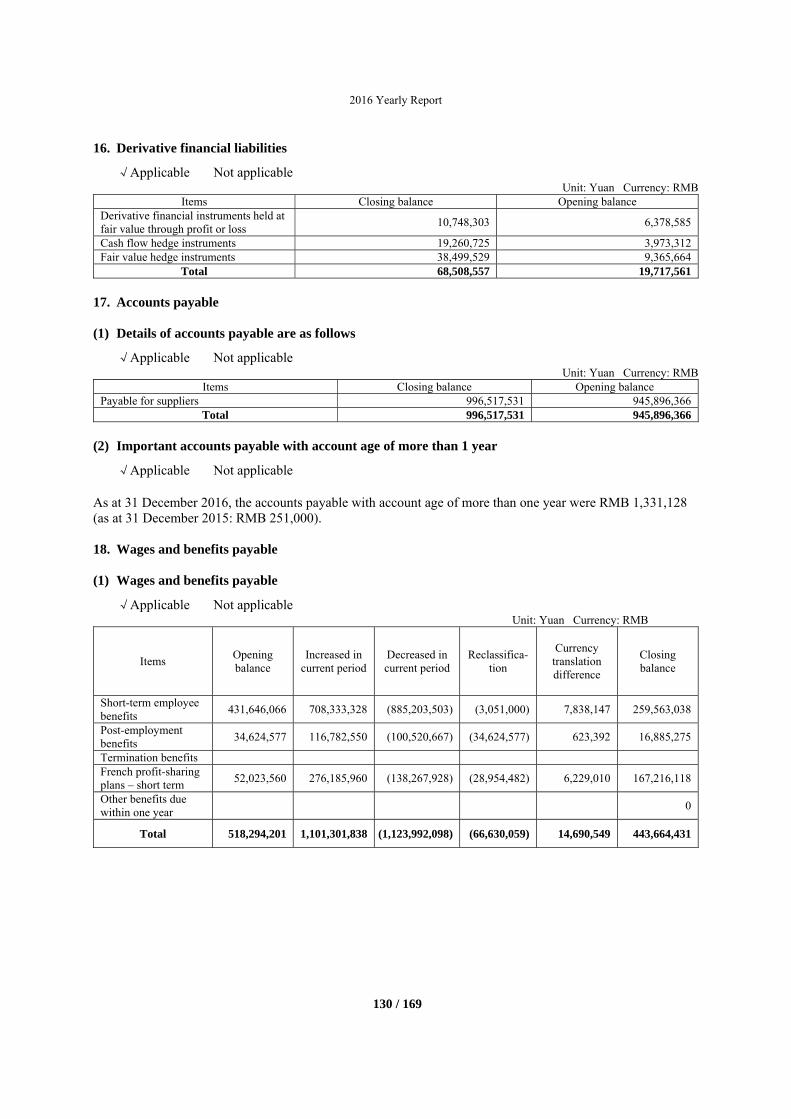
2016 Yearly Report
130 / 169
16. Derivative financial liabilities
√Applicable Not applicable Unit: Yuan Currency: RMB
Items Closing balance Opening balance Derivative financial instruments held at fair value through profit or loss
10,748,303 6,378,585
Cash flow hedge instruments 19,260,725 3,973,312Fair value hedge instruments 38,499,529 9,365,664
Total 68,508,557 19,717,561
17. Accounts payable
(1) Details of accounts payable are as follows
√Applicable Not applicable Unit: Yuan Currency: RMB
Items Closing balance Opening balance Payable for suppliers 996,517,531 945,896,366
Total 996,517,531 945,896,366
(2) Important accounts payable with account age of more than 1 year
√Applicable Not applicable As at 31 December 2016, the accounts payable with account age of more than one year were RMB 1,331,128 (as at 31 December 2015: RMB 251,000).
18. Wages and benefits payable
(1) Wages and benefits payable
√Applicable Not applicable Unit: Yuan Currency: RMB
Items Opening balance
Increased in current period
Decreased in current period
Reclassifica-tion
Currency translation difference
Closing balance
Short-term employee benefits
431,646,066 708,333,328 (885,203,503) (3,051,000) 7,838,147 259,563,038
Post-employment benefits
34,624,577 116,782,550 (100,520,667) (34,624,577) 623,392 16,885,275
Termination benefits French profit-sharing plans – short term
52,023,560 276,185,960 (138,267,928) (28,954,482) 6,229,010 167,216,118
Other benefits due within one year
0
Total 518,294,201 1,101,301,838 (1,123,992,098) (66,630,059) 14,690,549 443,664,431
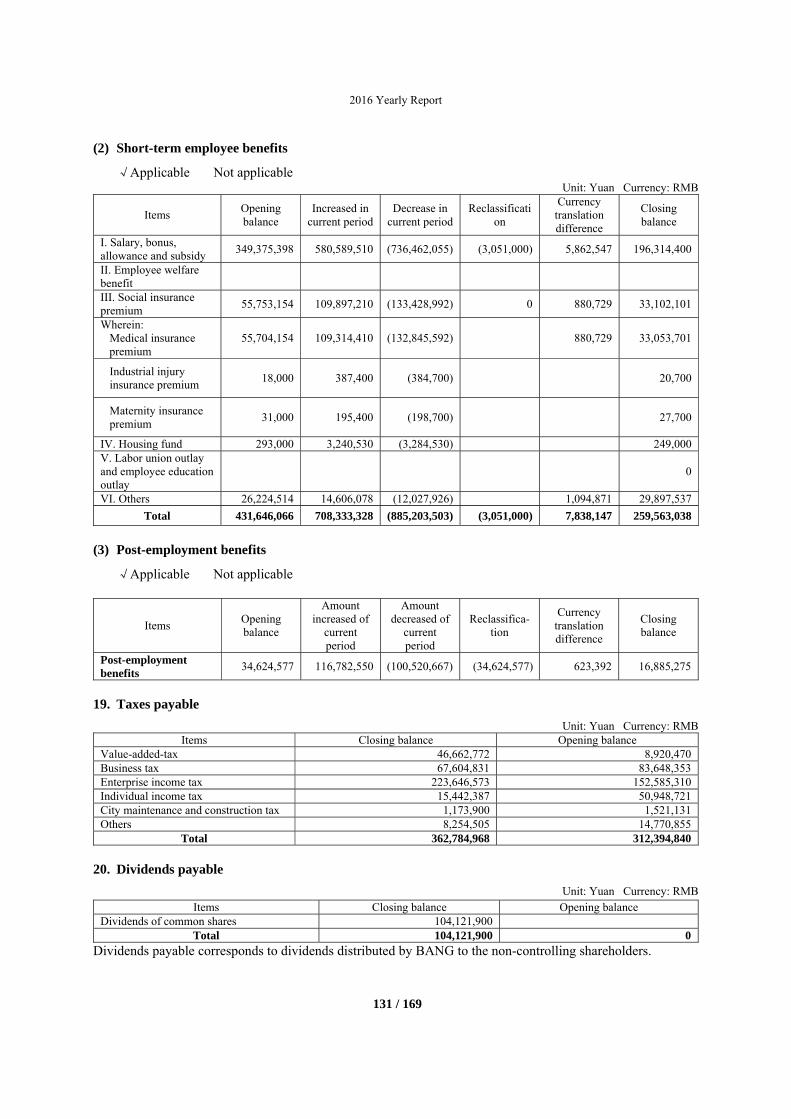
2016 Yearly Report
131 / 169
(2) Short-term employee benefits
√Applicable Not applicable Unit: Yuan Currency: RMB
Items Opening balance
Increased in current period
Decrease in current period
Reclassification
Currency translation difference
Closing balance
I. Salary, bonus, allowance and subsidy
349,375,398 580,589,510 (736,462,055) (3,051,000) 5,862,547 196,314,400
II. Employee welfare benefit
III. Social insurance premium
55,753,154 109,897,210 (133,428,992) 0 880,729 33,102,101
Wherein: Medical insurance premium
55,704,154 109,314,410 (132,845,592) 880,729 33,053,701
Industrial injury insurance premium
18,000 387,400 (384,700) 20,700
Maternity insurance premium
31,000 195,400 (198,700) 27,700
IV. Housing fund 293,000 3,240,530 (3,284,530) 249,000V. Labor union outlay and employee education outlay
0
VI. Others 26,224,514 14,606,078 (12,027,926) 1,094,871 29,897,537
Total 431,646,066 708,333,328 (885,203,503) (3,051,000) 7,838,147 259,563,038
(3) Post-employment benefits
√Applicable Not applicable
Items Opening balance
Amount increased of
current period
Amount decreased of
current period
Reclassifica-tion
Currency translation difference
Closing balance
Post-employment benefits
34,624,577 116,782,550 (100,520,667) (34,624,577) 623,392 16,885,275
19. Taxes payable
Unit: Yuan Currency: RMB Items Closing balance Opening balance
Value-added-tax 46,662,772 8,920,470Business tax 67,604,831 83,648,353Enterprise income tax 223,646,573 152,585,310Individual income tax 15,442,387 50,948,721City maintenance and construction tax 1,173,900 1,521,131Others 8,254,505 14,770,855
Total 362,784,968 312,394,840
20. Dividends payable
Unit: Yuan Currency: RMB Items Closing balance Opening balance
Dividends of common shares 104,121,900Total 104,121,900 0
Dividends payable corresponds to dividends distributed by BANG to the non-controlling shareholders.
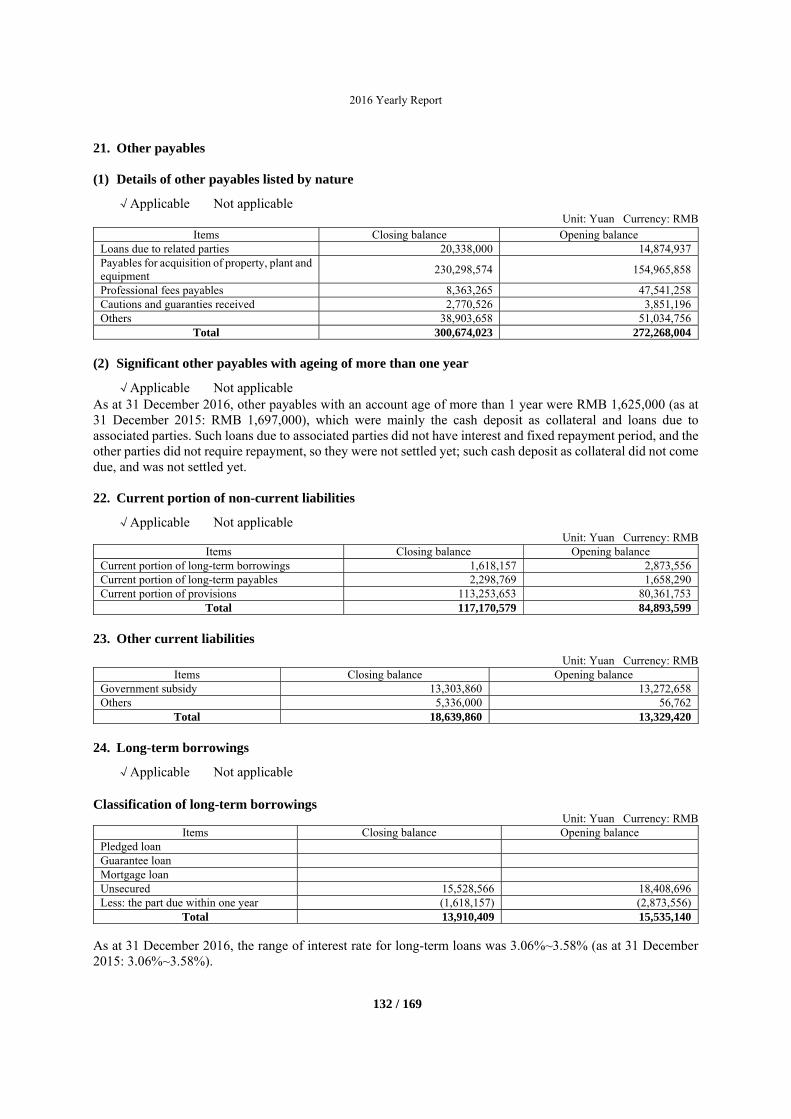
2016 Yearly Report
132 / 169
21. Other payables
(1) Details of other payables listed by nature
√Applicable Not applicable Unit: Yuan Currency: RMB
Items Closing balance Opening balance Loans due to related parties 20,338,000 14,874,937Payables for acquisition of property, plant and equipment
230,298,574 154,965,858
Professional fees payables 8,363,265 47,541,258Cautions and guaranties received 2,770,526 3,851,196Others 38,903,658 51,034,756
Total 300,674,023 272,268,004
(2) Significant other payables with ageing of more than one year
√Applicable Not applicable As at 31 December 2016, other payables with an account age of more than 1 year were RMB 1,625,000 (as at 31 December 2015: RMB 1,697,000), which were mainly the cash deposit as collateral and loans due to associated parties. Such loans due to associated parties did not have interest and fixed repayment period, and the other parties did not require repayment, so they were not settled yet; such cash deposit as collateral did not come due, and was not settled yet.
22. Current portion of non-current liabilities
√Applicable Not applicable Unit: Yuan Currency: RMB
Items Closing balance Opening balance Current portion of long-term borrowings 1,618,157 2,873,556Current portion of long-term payables 2,298,769 1,658,290Current portion of provisions 113,253,653 80,361,753
Total 117,170,579 84,893,599
23. Other current liabilities
Unit: Yuan Currency: RMB Items Closing balance Opening balance
Government subsidy 13,303,860 13,272,658Others 5,336,000 56,762
Total 18,639,860 13,329,420
24. Long-term borrowings
√Applicable Not applicable Classification of long-term borrowings
Unit: Yuan Currency: RMB Items Closing balance Opening balance
Pledged loan Guarantee loan Mortgage loan Unsecured 15,528,566 18,408,696Less: the part due within one year (1,618,157) (2,873,556)
Total 13,910,409 15,535,140
As at 31 December 2016, the range of interest rate for long-term loans was 3.06%~3.58% (as at 31 December 2015: 3.06%~3.58%).
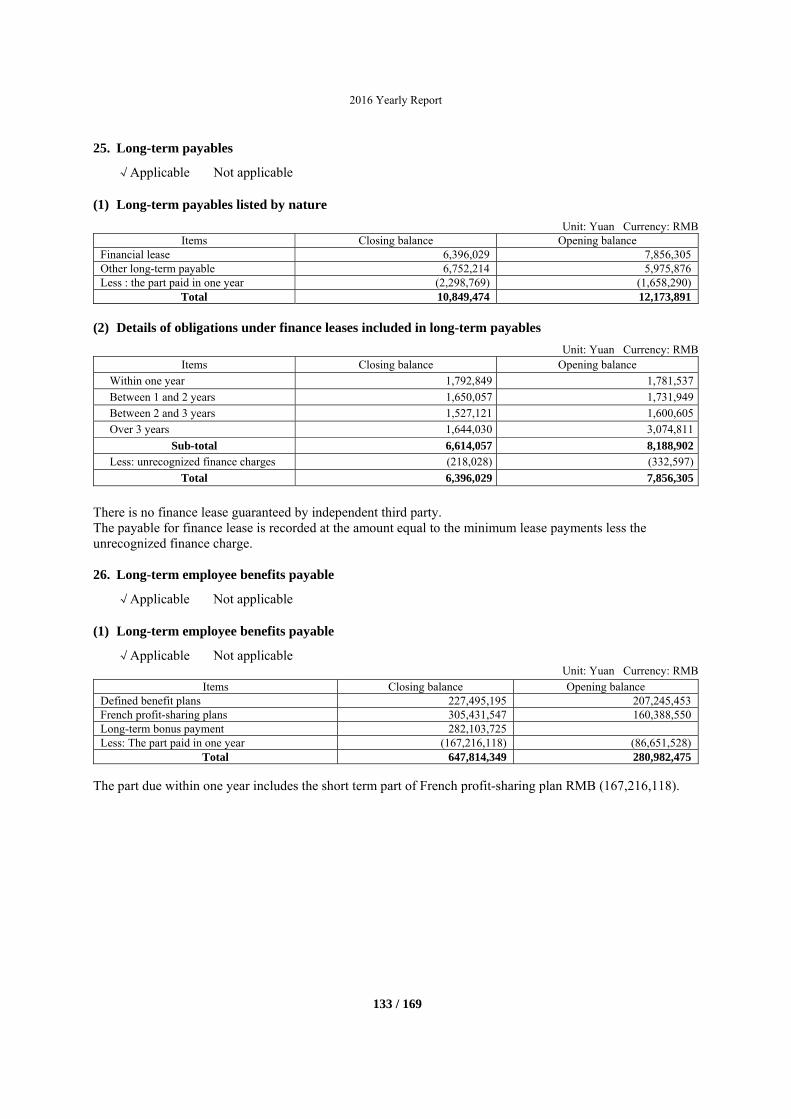
2016 Yearly Report
133 / 169
25. Long-term payables
√Applicable Not applicable
(1) Long-term payables listed by nature
Unit: Yuan Currency: RMB Items Closing balance Opening balance
Financial lease 6,396,029 7,856,305Other long-term payable 6,752,214 5,975,876Less : the part paid in one year (2,298,769) (1,658,290)
Total 10,849,474 12,173,891
(2) Details of obligations under finance leases included in long-term payables
Unit: Yuan Currency: RMB Items Closing balance Opening balance
Within one year 1,792,849 1,781,537
Between 1 and 2 years 1,650,057 1,731,949
Between 2 and 3 years 1,527,121 1,600,605
Over 3 years 1,644,030 3,074,811
Sub-total 6,614,057 8,188,902Less: unrecognized finance charges (218,028) (332,597)
Total 6,396,029 7,856,305
There is no finance lease guaranteed by independent third party. The payable for finance lease is recorded at the amount equal to the minimum lease payments less the unrecognized finance charge.
26. Long-term employee benefits payable
√Applicable Not appli cable
(1) Long-term employee benefits payable
√Applicable Not applicable Unit: Yuan Currency: RMB
Items Closing balance Opening balance Defined benefit plans 227,495,195 207,245,453French profit-sharing plans 305,431,547 160,388,550Long-term bonus payment 282,103,725Less: The part paid in one year (167,216,118) (86,651,528)
Total 647,814,349 280,982,475 The part due within one year includes the short term part of French profit-sharing plan RMB (167,216,118).
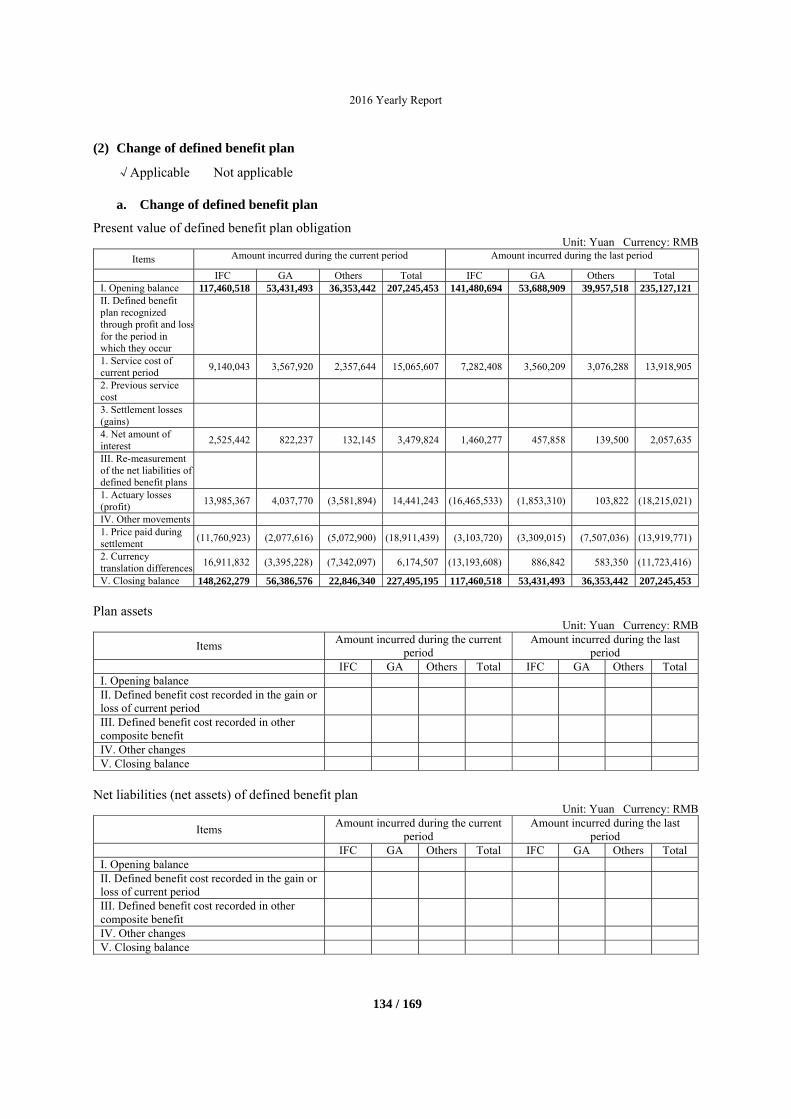
2016 Yearly Report
134 / 169
(2) Change of defined benefit plan
√Applicable Not applicable
a. Change of defined benefit plan
Present value of defined benefit plan obligation Unit: Yuan Currency: RMB
Items Amount incurred during the current period Amount incurred during the last period
IFC GA Others Total IFC GA Others Total I. Opening balance 117,460,518 53,431,493 36,353,442 207,245,453 141,480,694 53,688,909 39,957,518 235,127,121II. Defined benefit plan recognized through profit and lossfor the period in which they occur
1. Service cost of current period
9,140,043 3,567,920 2,357,644 15,065,607 7,282,408 3,560,209 3,076,288 13,918,905
2. Previous service cost
3. Settlement losses (gains)
4. Net amount of interest
2,525,442 822,237 132,145 3,479,824 1,460,277 457,858 139,500 2,057,635
III. Re-measurement of the net liabilities of defined benefit plans
1. Actuary losses (profit)
13,985,367 4,037,770 (3,581,894) 14,441,243 (16,465,533) (1,853,310) 103,822 (18,215,021)
IV. Other movements 1. Price paid during settlement
(11,760,923) (2,077,616) (5,072,900) (18,911,439) (3,103,720) (3,309,015) (7,507,036) (13,919,771)
2. Currency translation differences
16,911,832 (3,395,228) (7,342,097) 6,174,507 (13,193,608) 886,842 583,350 (11,723,416)
V. Closing balance 148,262,279 56,386,576 22,846,340 227,495,195 117,460,518 53,431,493 36,353,442 207,245,453
Plan assets
Unit: Yuan Currency: RMB
Items Amount incurred during the current
period Amount incurred during the last
period IFC GA Others Total IFC GA Others TotalI. Opening balance II. Defined benefit cost recorded in the gain or loss of current period
III. Defined benefit cost recorded in other composite benefit
IV. Other changes V. Closing balance
Net liabilities (net assets) of defined benefit plan
Unit: Yuan Currency: RMB
Items Amount incurred during the current
period Amount incurred during the last
period IFC GA Others Total IFC GA Others TotalI. Opening balance II. Defined benefit cost recorded in the gain or loss of current period
III. Defined benefit cost recorded in other composite benefit
IV. Other changes V. Closing balance
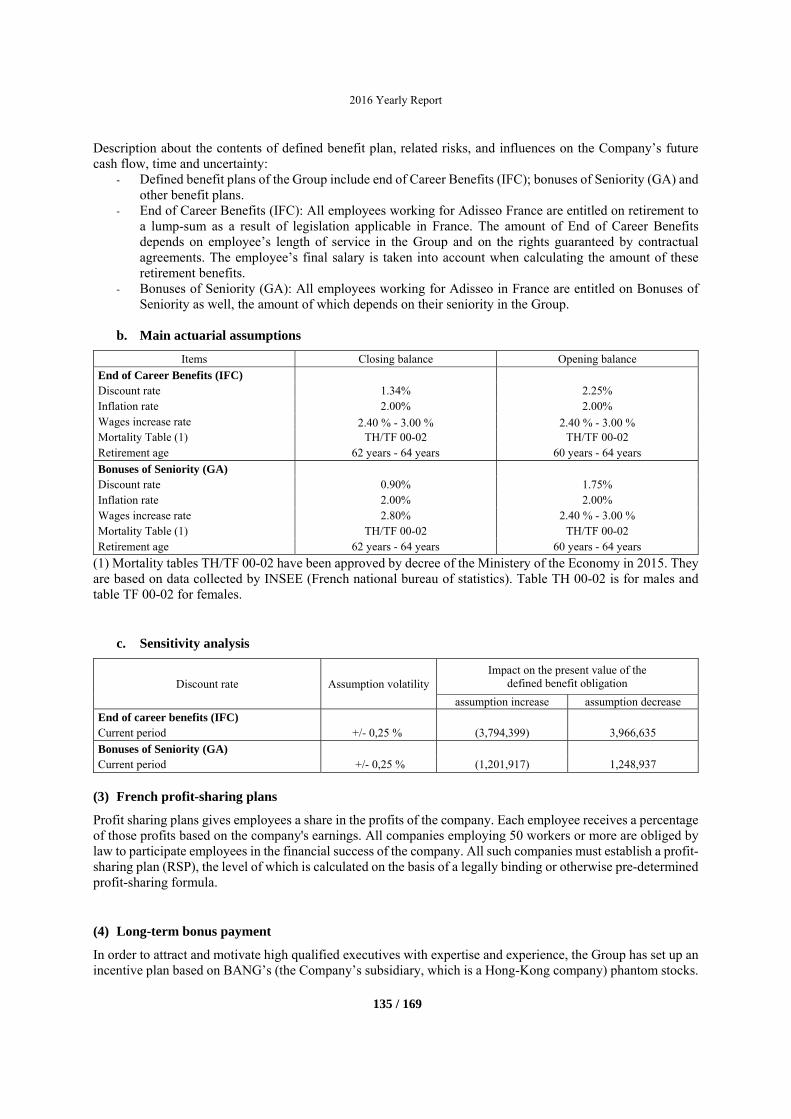
2016 Yearly Report
135 / 169
Description about the contents of defined benefit plan, related risks, and influences on the Company’s future cash flow, time and uncertainty:
- Defined benefit plans of the Group include end of Career Benefits (IFC); bonuses of Seniority (GA) and other benefit plans.
- End of Career Benefits (IFC): All employees working for Adisseo France are entitled on retirement to a lump-sum as a result of legislation applicable in France. The amount of End of Career Benefits depends on employee’s length of service in the Group and on the rights guaranteed by contractual agreements. The employee’s final salary is taken into account when calculating the amount of these retirement benefits.
- Bonuses of Seniority (GA): All employees working for Adisseo in France are entitled on Bonuses of Seniority as well, the amount of which depends on their seniority in the Group.
b. Main actuarial assumptions
Items Closing balance Opening balance
End of Career Benefits (IFC) Discount rate 1.34% 2.25% Inflation rate 2.00% 2.00% Wages increase rate 2.40 % - 3.00 % 2.40 % - 3.00 % Mortality Table (1) TH/TF 00-02 TH/TF 00-02 Retirement age 62 years - 64 years 60 years - 64 years
Bonuses of Seniority (GA) Discount rate 0.90% 1.75% Inflation rate 2.00% 2.00% Wages increase rate 2.80% 2.40 % - 3.00 % Mortality Table (1) TH/TF 00-02 TH/TF 00-02 Retirement age 62 years - 64 years 60 years - 64 years
(1) Mortality tables TH/TF 00-02 have been approved by decree of the Ministery of the Economy in 2015. They are based on data collected by INSEE (French national bureau of statistics). Table TH 00-02 is for males and table TF 00-02 for females.
c. Sensitivity analysis
Discount rate Assumption volatilityImpact on the present value of the
defined benefit obligation
assumption increase assumption decrease End of career benefits (IFC) Current period +/- 0,25 % (3,794,399) 3,966,635
Bonuses of Seniority (GA) Current period +/- 0,25 % (1,201,917) 1,248,937
(3) French profit-sharing plans
Profit sharing plans gives employees a share in the profits of the company. Each employee receives a percentage of those profits based on the company's earnings. All companies employing 50 workers or more are obliged by law to participate employees in the financial success of the company. All such companies must establish a profit-sharing plan (RSP), the level of which is calculated on the basis of a legally binding or otherwise pre-determined profit-sharing formula.
(4) Long-term bonus payment
In order to attract and motivate high qualified executives with expertise and experience, the Group has set up an incentive plan based on BANG’s (the Company’s subsidiary, which is a Hong-Kong company) phantom stocks.
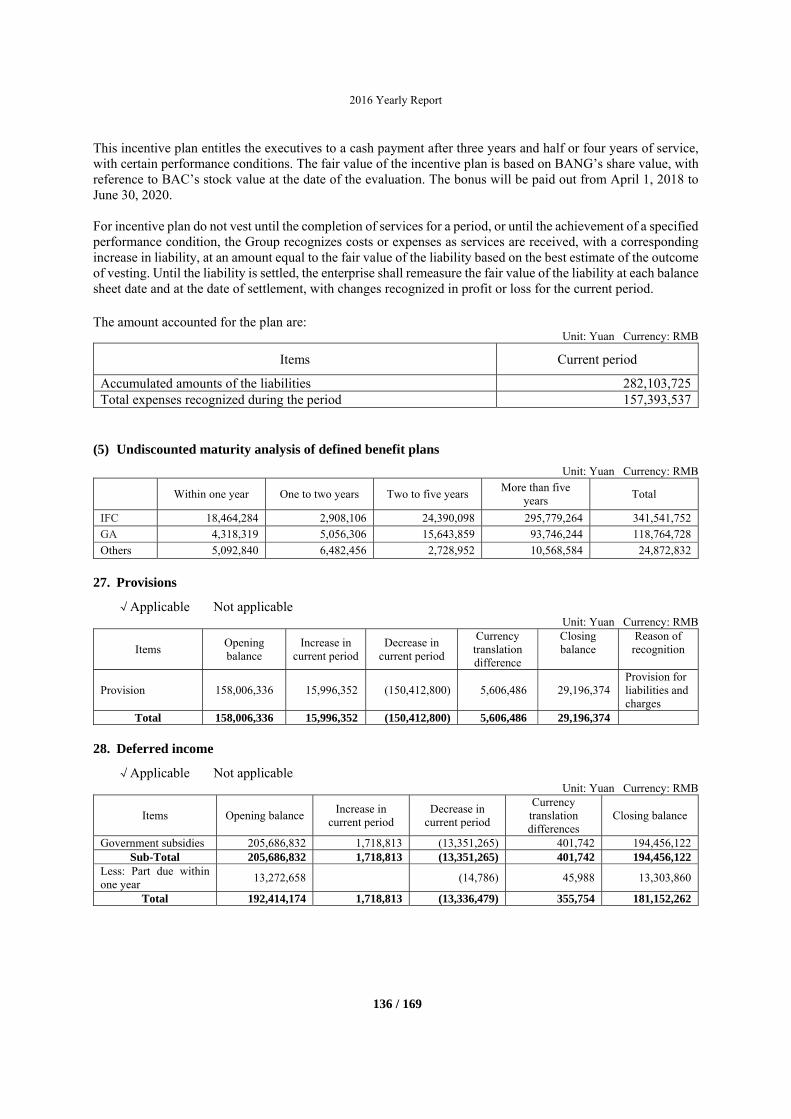
2016 Yearly Report
136 / 169
This incentive plan entitles the executives to a cash payment after three years and half or four years of service, with certain performance conditions. The fair value of the incentive plan is based on BANG’s share value, with reference to BAC’s stock value at the date of the evaluation. The bonus will be paid out from April 1, 2018 to June 30, 2020. For incentive plan do not vest until the completion of services for a period, or until the achievement of a specified performance condition, the Group recognizes costs or expenses as services are received, with a corresponding increase in liability, at an amount equal to the fair value of the liability based on the best estimate of the outcome of vesting. Until the liability is settled, the enterprise shall remeasure the fair value of the liability at each balance sheet date and at the date of settlement, with changes recognized in profit or loss for the current period. The amount accounted for the plan are:
Unit: Yuan Currency: RMB
Items Current period
Accumulated amounts of the liabilities 282,103,725Total expenses recognized during the period 157,393,537
(5) Undiscounted maturity analysis of defined benefit plans
Unit: Yuan Currency: RMB
Within one year One to two years Two to five years More than five
years Total
IFC 18,464,284 2,908,106 24,390,098 295,779,264 341,541,752
GA 4,318,319 5,056,306 15,643,859 93,746,244 118,764,728
Others 5,092,840 6,482,456 2,728,952 10,568,584 24,872,832
27. Provisions
√Applicable Not applicable Unit: Yuan Currency: RMB
Items Opening balance
Increase in current period
Decrease in current period
Currency translation difference
Closing balance
Reason of recognition
Provision 158,006,336 15,996,352 (150,412,800) 5,606,486 29,196,374 Provision for liabilities and charges
Total 158,006,336 15,996,352 (150,412,800) 5,606,486 29,196,374
28. Deferred income
√Applicable Not applicable Unit: Yuan Currency: RMB
Items Opening balance Increase in
current period Decrease in
current period
Currency translation differences
Closing balance
Government subsidies 205,686,832 1,718,813 (13,351,265) 401,742 194,456,122Sub-Total 205,686,832 1,718,813 (13,351,265) 401,742 194,456,122
Less: Part due within one year
13,272,658 (14,786) 45,988 13,303,860
Total 192,414,174 1,718,813 (13,336,479) 355,754 181,152,262
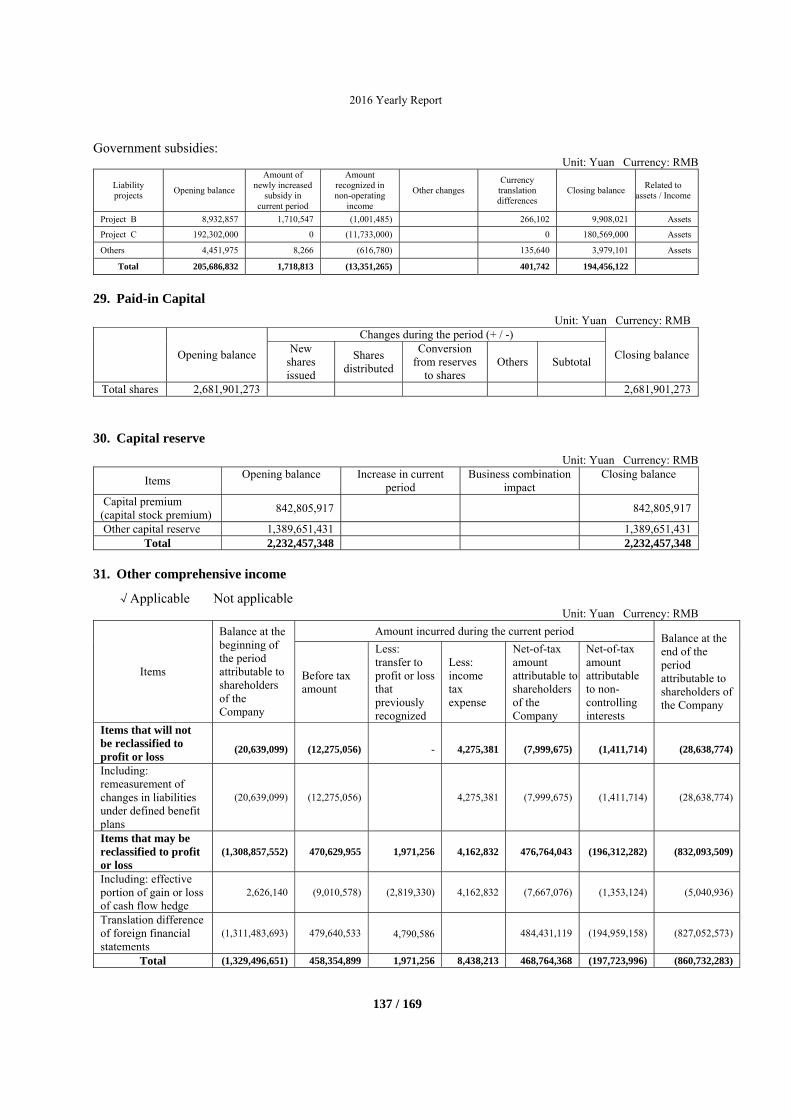
2016 Yearly Report
137 / 169
Government subsidies: Unit: Yuan Currency: RMB
Liability projects
Opening balance
Amount of newly increased
subsidy in current period
Amount recognized in non-operating
income
Other changes Currency translation differences
Closing balance Related to
assets / Income
Project B 8,932,857 1,710,547 (1,001,485) 266,102 9,908,021 Assets
Project C 192,302,000 0 (11,733,000) 0 180,569,000 Assets
Others 4,451,975 8,266 (616,780) 135,640 3,979,101 Assets
Total 205,686,832 1,718,813 (13,351,265) 401,742 194,456,122
29. Paid-in Capital
Unit: Yuan Currency: RMB
Opening balance
Changes during the period (+ / -)
Closing balanceNew shares issued
Shares distributed
Conversion from reserves
to shares Others Subtotal
Total shares 2,681,901,273 2,681,901,273
30. Capital reserve
Unit: Yuan Currency: RMB
Items Opening balance Increase in current
period Business combination
impact Closing balance
Capital premium (capital stock premium)
842,805,917 842,805,917
Other capital reserve 1,389,651,431 1,389,651,431 Total 2,232,457,348 2,232,457,348
31. Other comprehensive income
√Applicable Not applicable Unit: Yuan Currency: RMB
Items
Balance at the beginning of the period attributable to shareholders of the Company
Amount incurred during the current period Balance at the end of the period attributable to shareholders of the Company
Before tax amount
Less: transfer to profit or loss that previously recognized
Less: income tax expense
Net-of-tax amount attributable to shareholders of the Company
Net-of-tax amount attributable to non-controlling interests
Items that will not be reclassified to profit or loss
(20,639,099)
(12,275,056)
-
4,275,381
(7,999,675)
(1,411,714)
(28,638,774)
Including: remeasurement of changes in liabilities under defined benefit plans
(20,639,099) (12,275,056) 4,275,381 (7,999,675) (1,411,714) (28,638,774)
Items that may be reclassified to profit or loss
(1,308,857,552) 470,629,955 1,971,256 4,162,832 476,764,043 (196,312,282) (832,093,509)
Including: effective portion of gain or loss of cash flow hedge
2,626,140 (9,010,578) (2,819,330) 4,162,832 (7,667,076) (1,353,124) (5,040,936)
Translation difference of foreign financial statements
(1,311,483,693) 479,640,533
4,790,586
484,431,119 (194,959,158) (827,052,573)
Total (1,329,496,651) 458,354,899 1,971,256 8,438,213 468,764,368 (197,723,996) (860,732,283)
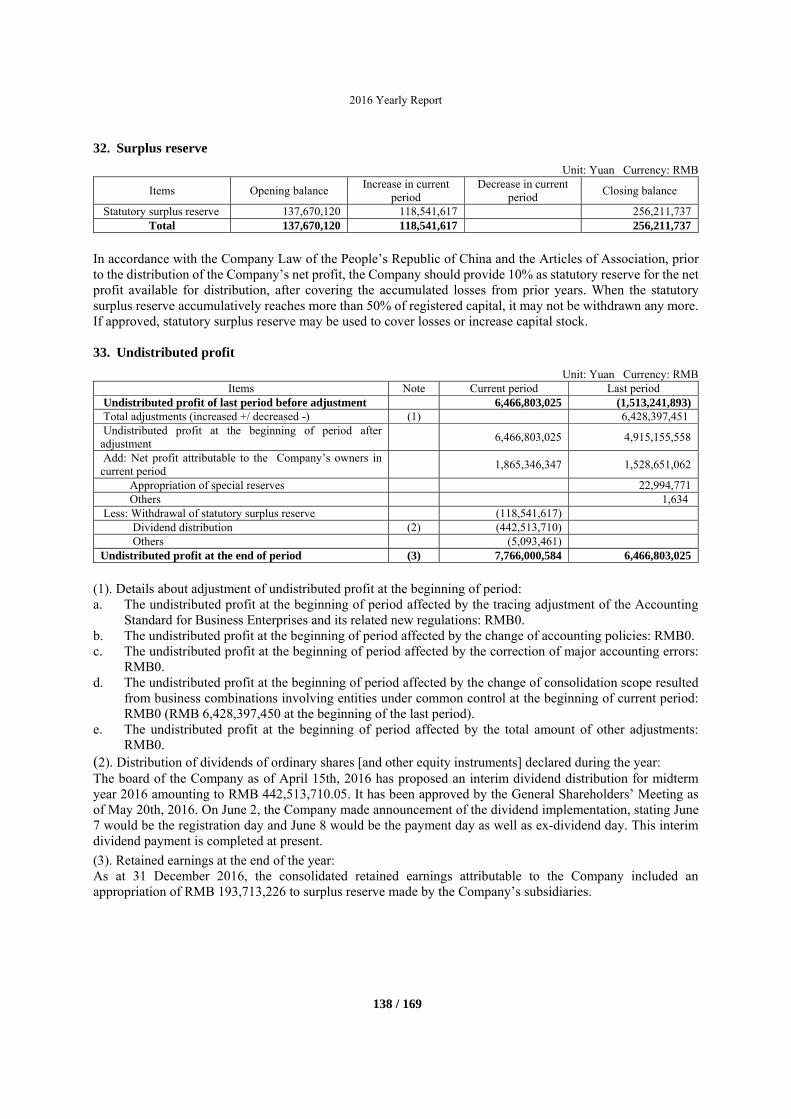
2016 Yearly Report
138 / 169
32. Surplus reserve
Unit: Yuan Currency: RMB Items Opening balance
Increase in current period
Decrease in current period
Closing balance
Statutory surplus reserve 137,670,120 118,541,617 256,211,737 Total 137,670,120 118,541,617 256,211,737
In accordance with the Company Law of the People’s Republic of China and the Articles of Association, prior to the distribution of the Company’s net profit, the Company should provide 10% as statutory reserve for the net profit available for distribution, after covering the accumulated losses from prior years. When the statutory surplus reserve accumulatively reaches more than 50% of registered capital, it may not be withdrawn any more. If approved, statutory surplus reserve may be used to cover losses or increase capital stock.
33. Undistributed profit
Unit: Yuan Currency: RMB Items Note Current period Last period
Undistributed profit of last period before adjustment 6,466,803,025 (1,513,241,893) Total adjustments (increased +/ decreased -) (1) 6,428,397,451 Undistributed profit at the beginning of period after adjustment
6,466,803,025 4,915,155,558
Add: Net profit attributable to the Company’s owners in current period
1,865,346,347 1,528,651,062
Appropriation of special reserves 22,994,771Others 1,634
Less: Withdrawal of statutory surplus reserve (118,541,617) Dividend distribution (2) (442,513,710) Others (5,093,461)
Undistributed profit at the end of period (3) 7,766,000,584 6,466,803,025
(1). Details about adjustment of undistributed profit at the beginning of period: a. The undistributed profit at the beginning of period affected by the tracing adjustment of the Accounting
Standard for Business Enterprises and its related new regulations: RMB0. b. The undistributed profit at the beginning of period affected by the change of accounting policies: RMB0. c. The undistributed profit at the beginning of period affected by the correction of major accounting errors:
RMB0. d. The undistributed profit at the beginning of period affected by the change of consolidation scope resulted
from business combinations involving entities under common control at the beginning of current period: RMB0 (RMB 6,428,397,450 at the beginning of the last period).
e. The undistributed profit at the beginning of period affected by the total amount of other adjustments: RMB0.
(2). Distribution of dividends of ordinary shares [and other equity instruments] declared during the year: The board of the Company as of April 15th, 2016 has proposed an interim dividend distribution for midterm year 2016 amounting to RMB 442,513,710.05. It has been approved by the General Shareholders’ Meeting as of May 20th, 2016. On June 2, the Company made announcement of the dividend implementation, stating June 7 would be the registration day and June 8 would be the payment day as well as ex-dividend day. This interim dividend payment is completed at present.
(3). Retained earnings at the end of the year: As at 31 December 2016, the consolidated retained earnings attributable to the Company included an appropriation of RMB 193,713,226 to surplus reserve made by the Company’s subsidiaries.
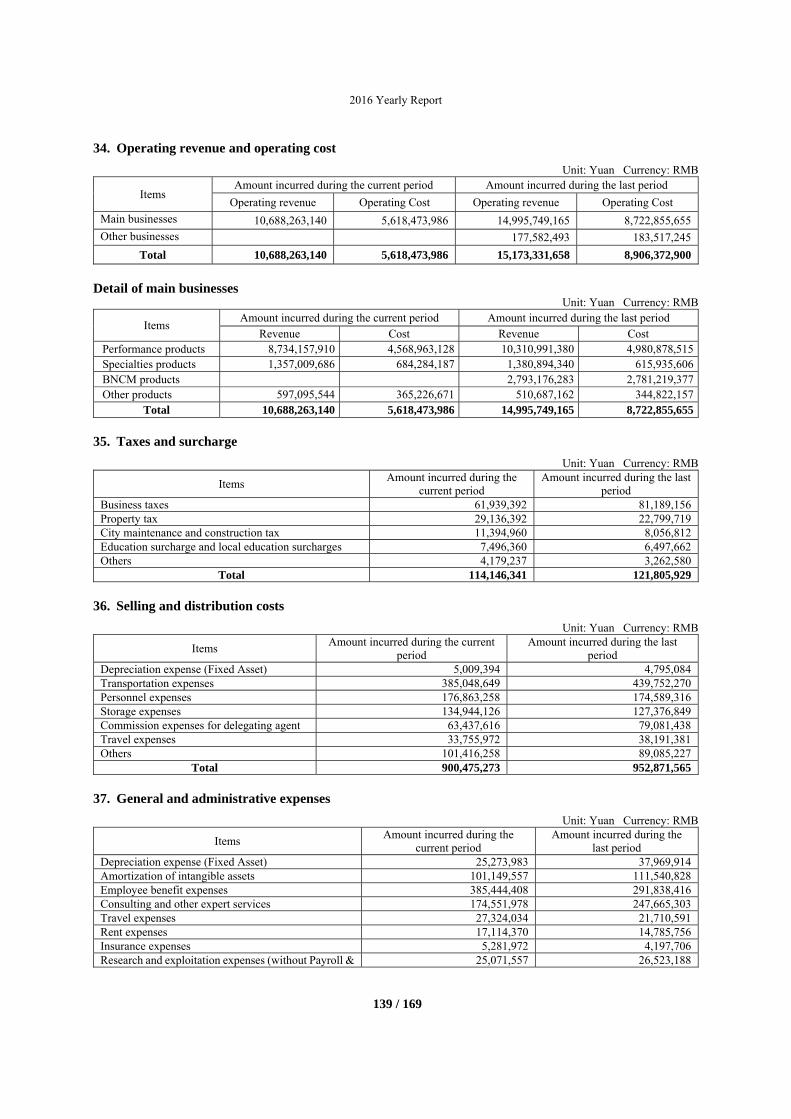
2016 Yearly Report
139 / 169
34. Operating revenue and operating cost
Unit: Yuan Currency: RMB
Items Amount incurred during the current period Amount incurred during the last period
Operating revenue Operating Cost Operating revenue Operating Cost
Main businesses 10,688,263,140 5,618,473,986 14,995,749,165 8,722,855,655Other businesses 177,582,493 183,517,245
Total 10,688,263,140 5,618,473,986 15,173,331,658 8,906,372,900
Detail of main businesses
Unit: Yuan Currency: RMB
Items Amount incurred during the current period Amount incurred during the last period
Revenue Cost Revenue Cost Performance products 8,734,157,910 4,568,963,128 10,310,991,380 4,980,878,515Specialties products 1,357,009,686 684,284,187 1,380,894,340 615,935,606BNCM products 2,793,176,283 2,781,219,377Other products 597,095,544 365,226,671 510,687,162 344,822,157
Total 10,688,263,140 5,618,473,986 14,995,749,165 8,722,855,655
35. Taxes and surcharge
Unit: Yuan Currency: RMB Items
Amount incurred during the current period
Amount incurred during the last period
Business taxes 61,939,392 81,189,156Property tax 29,136,392 22,799,719City maintenance and construction tax 11,394,960 8,056,812Education surcharge and local education surcharges 7,496,360 6,497,662Others 4,179,237 3,262,580
Total 114,146,341 121,805,929
36. Selling and distribution costs
Unit: Yuan Currency: RMB Items
Amount incurred during the current period
Amount incurred during the last period
Depreciation expense (Fixed Asset) 5,009,394 4,795,084Transportation expenses 385,048,649 439,752,270Personnel expenses 176,863,258 174,589,316Storage expenses 134,944,126 127,376,849Commission expenses for delegating agent 63,437,616 79,081,438Travel expenses 33,755,972 38,191,381Others 101,416,258 89,085,227
Total 900,475,273 952,871,565
37. General and administrative expenses
Unit: Yuan Currency: RMB Items
Amount incurred during the current period
Amount incurred during the last period
Depreciation expense (Fixed Asset) 25,273,983 37,969,914Amortization of intangible assets 101,149,557 111,540,828Employee benefit expenses 385,444,408 291,838,416Consulting and other expert services 174,551,978 247,665,303Travel expenses 27,324,034 21,710,591Rent expenses 17,114,370 14,785,756Insurance expenses 5,281,972 4,197,706Research and exploitation expenses (without Payroll & 25,071,557 26,523,188
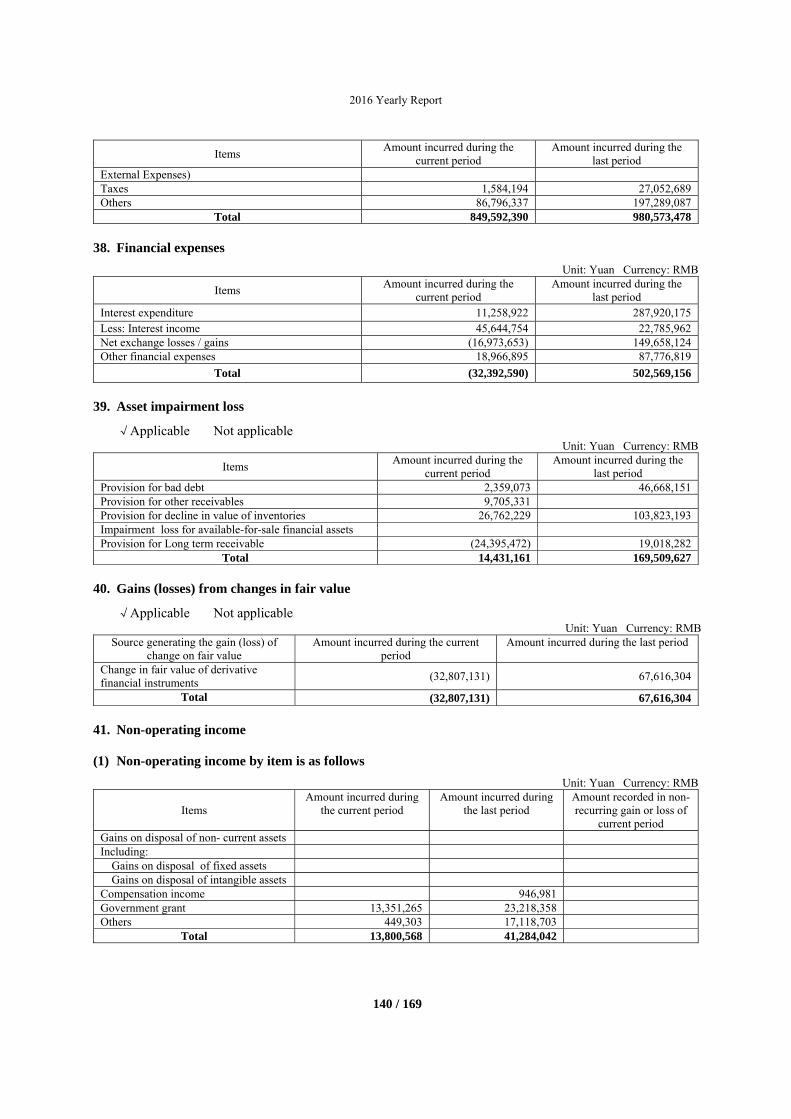
2016 Yearly Report
140 / 169
Items Amount incurred during the
current period Amount incurred during the
last period External Expenses) Taxes 1,584,194 27,052,689Others 86,796,337 197,289,087
Total 849,592,390 980,573,478
38. Financial expenses
Unit: Yuan Currency: RMB Items
Amount incurred during the current period
Amount incurred during the last period
Interest expenditure 11,258,922 287,920,175 Less: Interest income 45,644,754 22,785,962 Net exchange losses / gains (16,973,653) 149,658,124 Other financial expenses 18,966,895 87,776,819
Total (32,392,590) 502,569,156
39. Asset impairment loss
√Applicable Not applicable Unit: Yuan Currency: RMB
Items Amount incurred during the
current period Amount incurred during the
last period Provision for bad debt 2,359,073 46,668,151Provision for other receivables 9,705,331 Provision for decline in value of inventories 26,762,229 103,823,193Impairment loss for available-for-sale financial assets Provision for Long term receivable (24,395,472) 19,018,282
Total 14,431,161 169,509,627
40. Gains (losses) from changes in fair value
√Applicable Not applicable Unit: Yuan Currency: RMB
Source generating the gain (loss) of change on fair value
Amount incurred during the current period
Amount incurred during the last period
Change in fair value of derivative financial instruments
(32,807,131) 67,616,304
Total (32,807,131) 67,616,304
41. Non-operating income
(1) Non-operating income by item is as follows
Unit: Yuan Currency: RMB
Items Amount incurred during
the current period Amount incurred during
the last period Amount recorded in non-recurring gain or loss of
current period Gains on disposal of non- current assets Including:
Gains on disposal of fixed assets Gains on disposal of intangible assets
Compensation income 946,981Government grant 13,351,265 23,218,358Others 449,303 17,118,703
Total 13,800,568 41,284,042
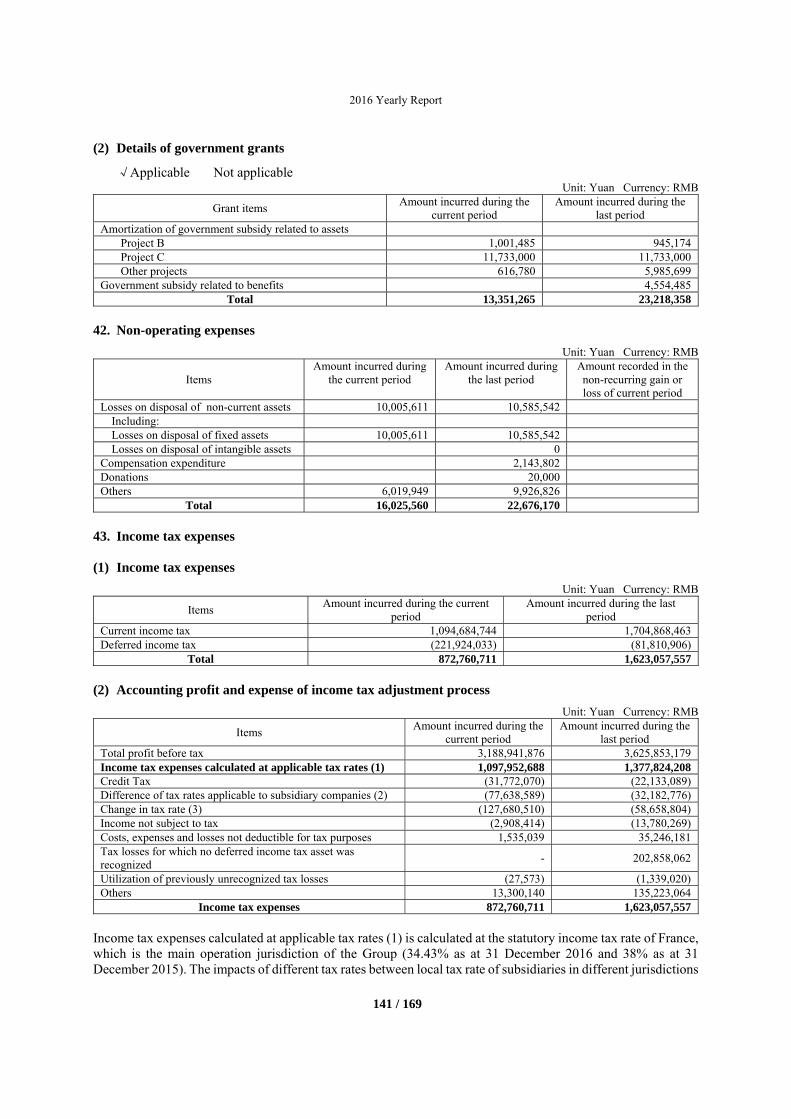
2016 Yearly Report
141 / 169
(2) Details of government grants
√Applicable Not applicable Unit: Yuan Currency: RMB
Grant items Amount incurred during the
current period Amount incurred during the
last period Amortization of government subsidy related to assets
Project B 1,001,485 945,174Project C 11,733,000 11,733,000Other projects 616,780 5,985,699
Government subsidy related to benefits 4,554,485Total 13,351,265 23,218,358
42. Non-operating expenses
Unit: Yuan Currency: RMB
Items Amount incurred during
the current period Amount incurred during
the last period Amount recorded in the non-recurring gain or loss of current period
Losses on disposal of non-current assets 10,005,611 10,585,542 Including: Losses on disposal of fixed assets 10,005,611 10,585,542 Losses on disposal of intangible assets 0
Compensation expenditure 2,143,802 Donations 20,000 Others 6,019,949 9,926,826
Total 16,025,560 22,676,170
43. Income tax expenses
(1) Income tax expenses
Unit: Yuan Currency: RMB Items
Amount incurred during the current period
Amount incurred during the last period
Current income tax 1,094,684,744 1,704,868,463 Deferred income tax (221,924,033) (81,810,906)
Total 872,760,711 1,623,057,557
(2) Accounting profit and expense of income tax adjustment process
Unit: Yuan Currency: RMB
Items Amount incurred during the
current period Amount incurred during the
last period Total profit before tax 3,188,941,876 3,625,853,179 Income tax expenses calculated at applicable tax rates (1) 1,097,952,688 1,377,824,208Credit Tax (31,772,070) (22,133,089)Difference of tax rates applicable to subsidiary companies (2) (77,638,589) (32,182,776)Change in tax rate (3) (127,680,510) (58,658,804)Income not subject to tax (2,908,414) (13,780,269)Costs, expenses and losses not deductible for tax purposes 1,535,039 35,246,181 Tax losses for which no deferred income tax asset was recognized
- 202,858,062
Utilization of previously unrecognized tax losses (27,573) (1,339,020)Others 13,300,140 135,223,064
Income tax expenses 872,760,711 1,623,057,557 Income tax expenses calculated at applicable tax rates (1) is calculated at the statutory income tax rate of France, which is the main operation jurisdiction of the Group (34.43% as at 31 December 2016 and 38% as at 31 December 2015). The impacts of different tax rates between local tax rate of subsidiaries in different jurisdictions
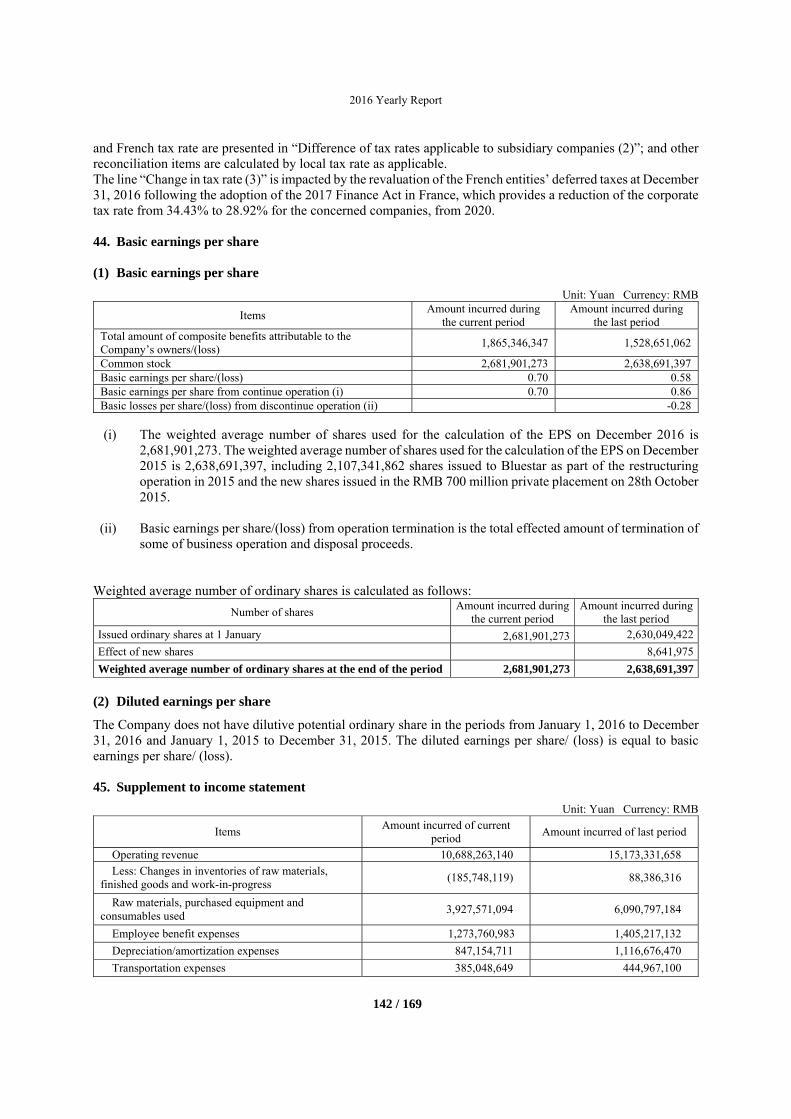
2016 Yearly Report
142 / 169
and French tax rate are presented in “Difference of tax rates applicable to subsidiary companies (2)”; and other reconciliation items are calculated by local tax rate as applicable. The line “Change in tax rate (3)” is impacted by the revaluation of the French entities’ deferred taxes at December 31, 2016 following the adoption of the 2017 Finance Act in France, which provides a reduction of the corporate tax rate from 34.43% to 28.92% for the concerned companies, from 2020.
44. Basic earnings per share
(1) Basic earnings per share
Unit: Yuan Currency: RMB
Items Amount incurred during
the current period Amount incurred during
the last period Total amount of composite benefits attributable to the Company’s owners/(loss)
1,865,346,347 1,528,651,062
Common stock 2,681,901,273 2,638,691,397Basic earnings per share/(loss) 0.70 0.58Basic earnings per share from continue operation (i) 0.70 0.86Basic losses per share/(loss) from discontinue operation (ii) -0.28
(i) The weighted average number of shares used for the calculation of the EPS on December 2016 is
2,681,901,273. The weighted average number of shares used for the calculation of the EPS on December 2015 is 2,638,691,397, including 2,107,341,862 shares issued to Bluestar as part of the restructuring operation in 2015 and the new shares issued in the RMB 700 million private placement on 28th October 2015.
(ii) Basic earnings per share/(loss) from operation termination is the total effected amount of termination of some of business operation and disposal proceeds.
Weighted average number of ordinary shares is calculated as follows:
Number of shares Amount incurred during
the current period Amount incurred during
the last period Issued ordinary shares at 1 January 2,681,901,273 2,630,049,422
Effect of new shares 8,641,975
Weighted average number of ordinary shares at the end of the period 2,681,901,273 2,638,691,397
(2) Diluted earnings per share
The Company does not have dilutive potential ordinary share in the periods from January 1, 2016 to December 31, 2016 and January 1, 2015 to December 31, 2015. The diluted earnings per share/ (loss) is equal to basic earnings per share/ (loss).
45. Supplement to income statement
Unit: Yuan Currency: RMB
Items Amount incurred of current
period Amount incurred of last period
Operating revenue 10,688,263,140 15,173,331,658
Less: Changes in inventories of raw materials, finished goods and work-in-progress
(185,748,119) 88,386,316
Raw materials, purchased equipment and consumables used
3,927,571,094 6,090,797,184
Employee benefit expenses 1,273,760,983 1,405,217,132
Depreciation/amortization expenses 847,154,711 1,116,676,470
Transportation expenses 385,048,649 444,967,100
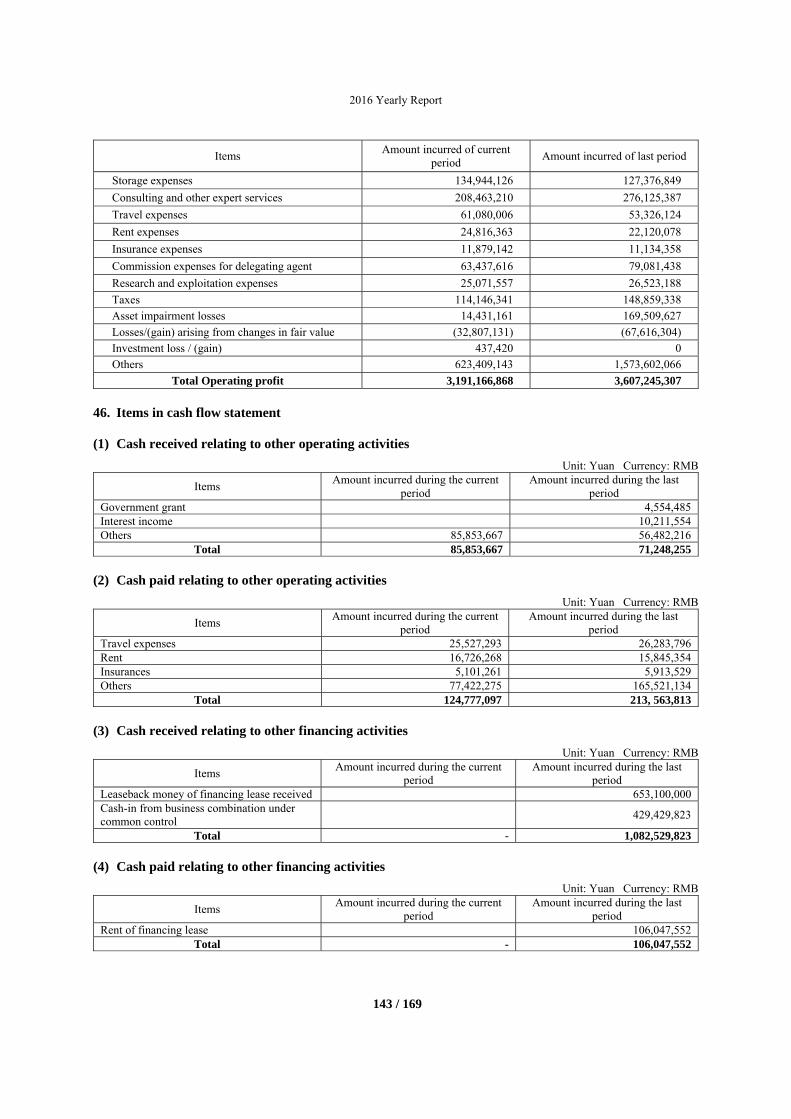
2016 Yearly Report
143 / 169
Items Amount incurred of current
period Amount incurred of last period
Storage expenses 134,944,126 127,376,849
Consulting and other expert services 208,463,210 276,125,387
Travel expenses 61,080,006 53,326,124
Rent expenses 24,816,363 22,120,078
Insurance expenses 11,879,142 11,134,358
Commission expenses for delegating agent 63,437,616 79,081,438
Research and exploitation expenses 25,071,557 26,523,188
Taxes 114,146,341 148,859,338
Asset impairment losses 14,431,161 169,509,627
Losses/(gain) arising from changes in fair value (32,807,131) (67,616,304)
Investment loss / (gain) 437,420 0
Others 623,409,143 1,573,602,066
Total Operating profit 3,191,166,868 3,607,245,307
46. Items in cash flow statement
(1) Cash received relating to other operating activities
Unit: Yuan Currency: RMB
Items Amount incurred during the current
periodAmount incurred during the last
period Government grant 4,554,485 Interest income 10,211,554 Others 85,853,667 56,482,216
Total 85,853,667 71,248,255
(2) Cash paid relating to other operating activities
Unit: Yuan Currency: RMB Items
Amount incurred during the current period
Amount incurred during the last period
Travel expenses 25,527,293 26,283,796Rent 16,726,268 15,845,354Insurances 5,101,261 5,913,529Others 77,422,275 165,521,134
Total 124,777,097 213, 563,813
(3) Cash received relating to other financing activities
Unit: Yuan Currency: RMB
Items Amount incurred during the current
period Amount incurred during the last
period Leaseback money of financing lease received 653,100,000Cash-in from business combination under common control
429,429,823
Total - 1,082,529,823
(4) Cash paid relating to other financing activities
Unit: Yuan Currency: RMB Items
Amount incurred during the current period
Amount incurred during the last period
Rent of financing lease 106,047,552Total - 106,047,552
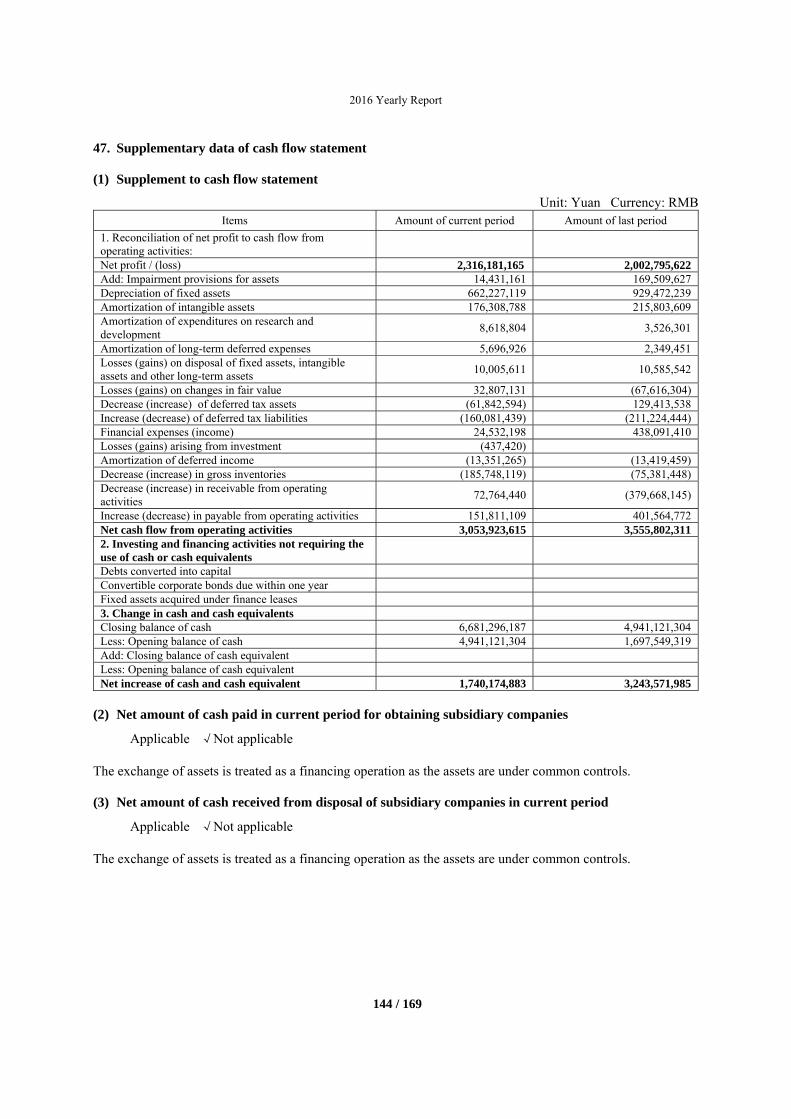
2016 Yearly Report
144 / 169
47. Supplementary data of cash flow statement
(1) Supplement to cash flow statement
Unit: Yuan Currency: RMB Items Amount of current period Amount of last period
1. Reconciliation of net profit to cash flow from operating activities: Net profit / (loss) 2,316,181,165 2,002,795,622Add: Impairment provisions for assets 14,431,161 169,509,627Depreciation of fixed assets 662,227,119 929,472,239Amortization of intangible assets 176,308,788 215,803,609Amortization of expenditures on research and development
8,618,804 3,526,301
Amortization of long-term deferred expenses 5,696,926 2,349,451Losses (gains) on disposal of fixed assets, intangible assets and other long-term assets
10,005,611 10,585,542
Losses (gains) on changes in fair value 32,807,131 (67,616,304)Decrease (increase) of deferred tax assets (61,842,594) 129,413,538Increase (decrease) of deferred tax liabilities (160,081,439) (211,224,444)Financial expenses (income) 24,532,198 438,091,410Losses (gains) arising from investment (437,420)Amortization of deferred income (13,351,265) (13,419,459)Decrease (increase) in gross inventories (185,748,119) (75,381,448)Decrease (increase) in receivable from operating activities
72,764,440 (379,668,145)
Increase (decrease) in payable from operating activities 151,811,109 401,564,772Net cash flow from operating activities 3,053,923,615 3,555,802,3112. Investing and financing activities not requiring the use of cash or cash equivalents Debts converted into capital Convertible corporate bonds due within one year Fixed assets acquired under finance leases 3. Change in cash and cash equivalents Closing balance of cash 6,681,296,187 4,941,121,304Less: Opening balance of cash 4,941,121,304 1,697,549,319Add: Closing balance of cash equivalent Less: Opening balance of cash equivalent Net increase of cash and cash equivalent 1,740,174,883 3,243,571,985
(2) Net amount of cash paid in current period for obtaining subsidiary companies
Applicable √Not applicable
The exchange of assets is treated as a financing operation as the assets are under common controls.
(3) Net amount of cash received from disposal of subsidiary companies in current period
Applicable √Not applicable
The exchange of assets is treated as a financing operation as the assets are under common controls.
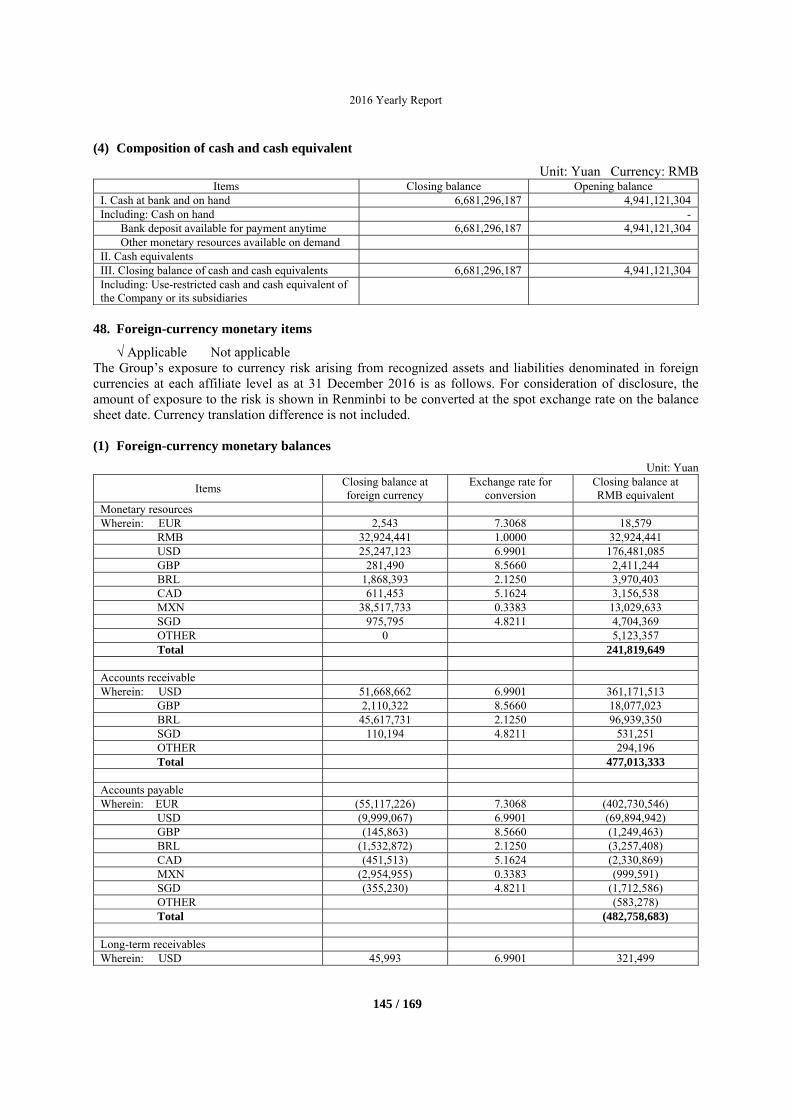
2016 Yearly Report
145 / 169
(4) Composition of cash and cash equivalent
Unit: Yuan Currency: RMB Items Closing balance Opening balance
I. Cash at bank and on hand 6,681,296,187 4,941,121,304 Including: Cash on hand -
Bank deposit available for payment anytime 6,681,296,187 4,941,121,304 Other monetary resources available on demand
II. Cash equivalents III. Closing balance of cash and cash equivalents 6,681,296,187 4,941,121,304 Including: Use-restricted cash and cash equivalent of the Company or its subsidiaries
48. Foreign-currency monetary items
√ Applicable Not applicable The Group’s exposure to currency risk arising from recognized assets and liabilities denominated in foreign currencies at each affiliate level as at 31 December 2016 is as follows. For consideration of disclosure, the amount of exposure to the risk is shown in Renminbi to be converted at the spot exchange rate on the balance sheet date. Currency translation difference is not included.
(1) Foreign-currency monetary balances
Unit: Yuan
Items Closing balance at foreign currency
Exchange rate for conversion
Closing balance at RMB equivalent
Monetary resources Wherein: EUR 2,543 7.3068 18,579
RMB 32,924,441 1.0000 32,924,441 USD 25,247,123 6.9901 176,481,085 GBP 281,490 8.5660 2,411,244 BRL 1,868,393 2.1250 3,970,403 CAD 611,453 5.1624 3,156,538 MXN 38,517,733 0.3383 13,029,633 SGD 975,795 4.8211 4,704,369 OTHER 0 5,123,357 Total 241,819,649
Accounts receivable Wherein: USD 51,668,662 6.9901 361,171,513
GBP 2,110,322 8.5660 18,077,023 BRL 45,617,731 2.1250 96,939,350 SGD 110,194 4.8211 531,251 OTHER 294,196 Total 477,013,333
Accounts payable Wherein: EUR (55,117,226) 7.3068 (402,730,546)
USD (9,999,067) 6.9901 (69,894,942) GBP (145,863) 8.5660 (1,249,463) BRL (1,532,872) 2.1250 (3,257,408) CAD (451,513) 5.1624 (2,330,869) MXN (2,954,955) 0.3383 (999,591)SGD (355,230) 4.8211 (1,712,586) OTHER (583,278) Total (482,758,683)
Long-term receivables Wherein: USD 45,993 6.9901 321,499
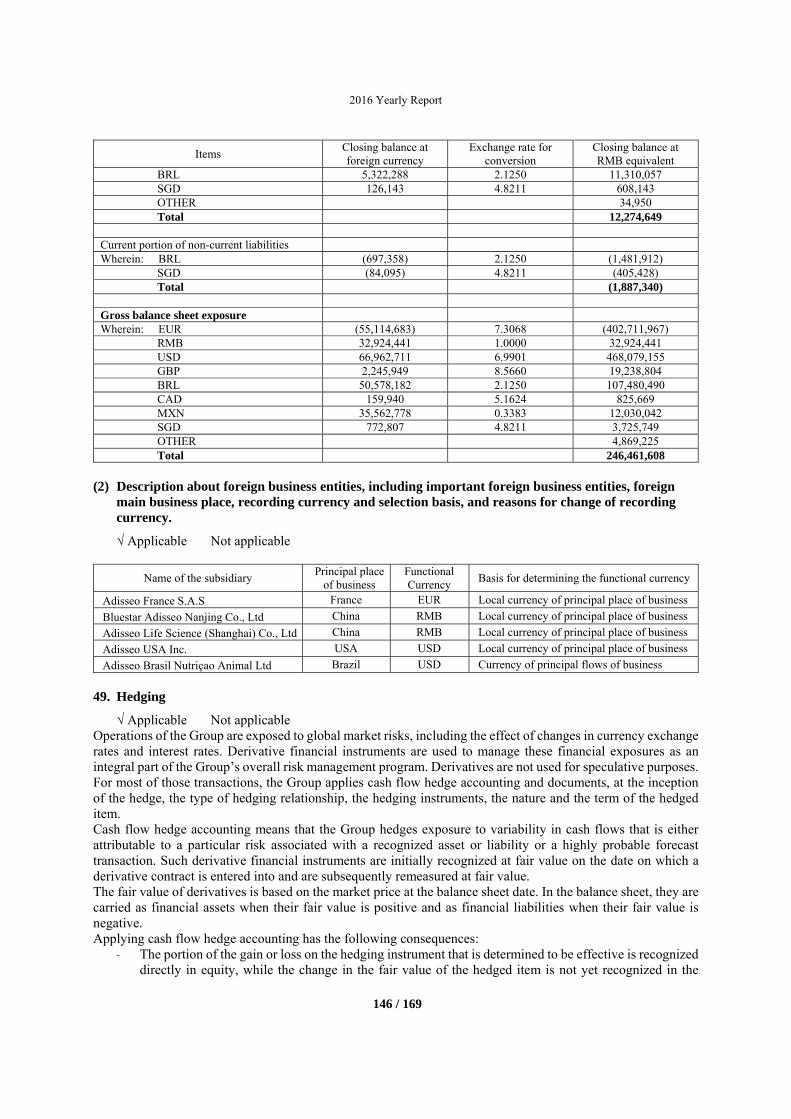
2016 Yearly Report
146 / 169
Items Closing balance at foreign currency
Exchange rate for conversion
Closing balance at RMB equivalent
BRL 5,322,288 2.1250 11,310,057 SGD 126,143 4.8211 608,143 OTHER 34,950 Total 12,274,649
Current portion of non-current liabilities Wherein: BRL (697,358) 2.1250 (1,481,912)
SGD (84,095) 4.8211 (405,428) Total (1,887,340)
Gross balance sheet exposure Wherein: EUR (55,114,683) 7.3068 (402,711,967)
RMB 32,924,441 1.0000 32,924,441 USD 66,962,711 6.9901 468,079,155 GBP 2,245,949 8.5660 19,238,804 BRL 50,578,182 2.1250 107,480,490 CAD 159,940 5.1624 825,669 MXN 35,562,778 0.3383 12,030,042 SGD 772,807 4.8211 3,725,749 OTHER 4,869,225 Total 246,461,608
(2) Description about foreign business entities, including important foreign business entities, foreign main business place, recording currency and selection basis, and reasons for change of recording currency.
√ Applicable Not applicable
Name of the subsidiary Principal place
of business Functional Currency
Basis for determining the functional currency
Adisseo France S.A.S France EUR Local currency of principal place of business
Bluestar Adisseo Nanjing Co., Ltd China RMB Local currency of principal place of business
Adisseo Life Science (Shanghai) Co., Ltd China RMB Local currency of principal place of business
Adisseo USA Inc. USA USD Local currency of principal place of business
Adisseo Brasil Nutriçao Animal Ltd Brazil USD Currency of principal flows of business
49. Hedging
√ Applicable Not applicable Operations of the Group are exposed to global market risks, including the effect of changes in currency exchange rates and interest rates. Derivative financial instruments are used to manage these financial exposures as an integral part of the Group’s overall risk management program. Derivatives are not used for speculative purposes. For most of those transactions, the Group applies cash flow hedge accounting and documents, at the inception of the hedge, the type of hedging relationship, the hedging instruments, the nature and the term of the hedged item. Cash flow hedge accounting means that the Group hedges exposure to variability in cash flows that is either attributable to a particular risk associated with a recognized asset or liability or a highly probable forecast transaction. Such derivative financial instruments are initially recognized at fair value on the date on which a derivative contract is entered into and are subsequently remeasured at fair value. The fair value of derivatives is based on the market price at the balance sheet date. In the balance sheet, they are carried as financial assets when their fair value is positive and as financial liabilities when their fair value is negative. Applying cash flow hedge accounting has the following consequences:
- The portion of the gain or loss on the hedging instrument that is determined to be effective is recognized directly in equity, while the change in the fair value of the hedged item is not yet recognized in the
2016 Yearly Report
147 / 169
balance sheet. The amounts directly recognized in equity are reclassified to profit or loss when the hedged transactions occur and are recorded;
- The change in fair value of the ineffective portion recognized directly in the income statement, in net foreign exchange gains/(losses).
From January to December 2016, the change in fair value on these derivatives has a negative impact of RMB 13,917,539 (December 2015: gains of RMB 8,673,731) recorded in other comprehensive income as cash flow hedge accounting, including RMB 10,600,680 of change in fair value and RMB 3,316,859 of reclassification into P&L. From January to December 2016, the change in fair value on these derivatives has a negative impact of RMB 32,807,131 (December 2015: gains of RMB 67,616,304) charged to the income statement as fair value hedge accounting, cash flow hedge ineffectiveness or non-hedge.
50. Other
None
VIII. Change of Consolidation Scope
1. Business combination not under common control
Applicable √Not applicable
2. Business combination under common control
Applicable √Not applicable
3. Reverse acquisitions
Applicable √Not applicable
4. Disposal of subsidiary companies
Whether the circumstance exists that single disposal of subsidiary company induces the loss of control right Applicable √Not applicable
Whether the circumstance exists that the Company disposes the investments in subsidiary companies by steps through multiple transactions and loses control right in the current period
Applicable √Not applicable
5. Change of consolidation scope for other reasons
√Applicable Not applicable If applicable, description about the change of consolidation scope induced by other reasons (such as establishment of new subsidiary company, and liquidation of subsidiary company, etc.) and related situations. Adisseo Manufacturing Inc. and Adisseo Holding (Thailand) Co., Ltd, two companies without any activity, have been liquidated. Please refer to the Note IX.1.(2).
6. Others
None
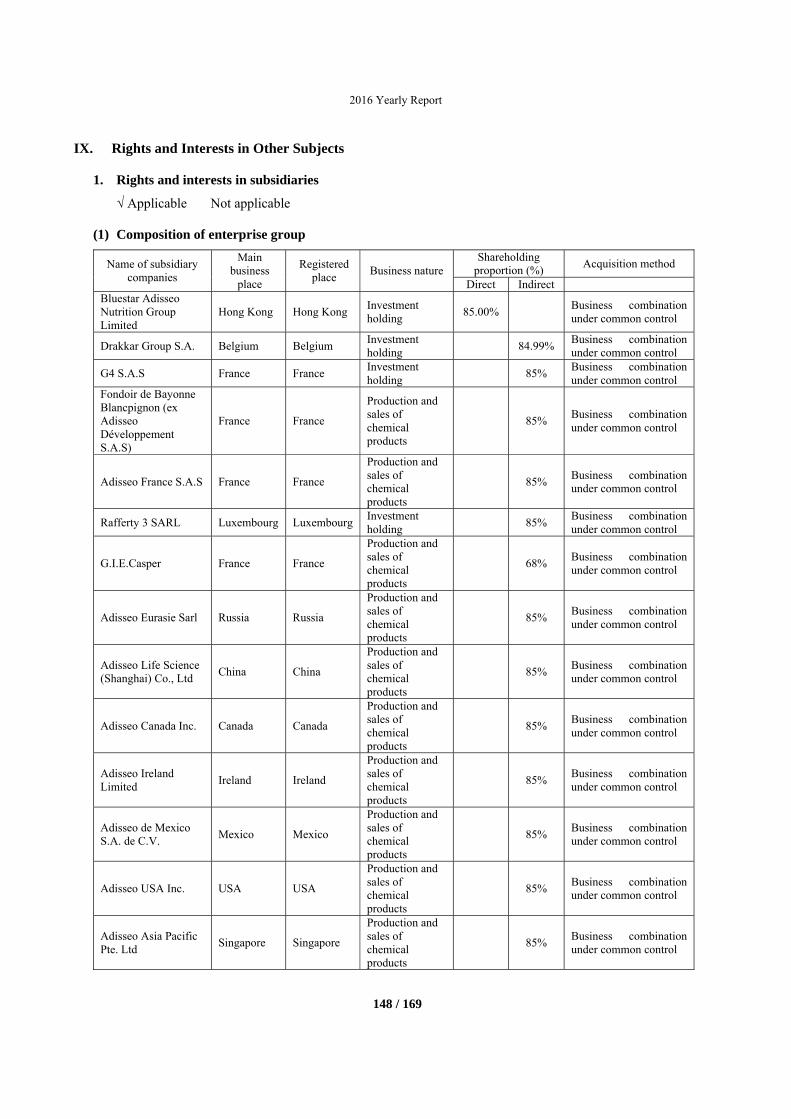
2016 Yearly Report
148 / 169
IX. Rights and Interests in Other Subjects
1. Rights and interests in subsidiaries
√ Applicable Not applicable
(1) Composition of enterprise group
Name of subsidiary companies
Main business
place
Registered place
Business natureShareholding
proportion (%) Acquisition method
Direct Indirect Bluestar Adisseo Nutrition Group Limited
Hong Kong Hong Kong Investment holding
85.00% Business combination under common control
Drakkar Group S.A. Belgium Belgium Investment holding
84.99%Business combination under common control
G4 S.A.S France France Investment holding
85% Business combination under common control
Fondoir de Bayonne Blancpignon (ex Adisseo Développement S.A.S)
France France
Production and sales of chemical products
85% Business combination under common control
Adisseo France S.A.S France France
Production and sales of chemical products
85% Business combination under common control
Rafferty 3 SARL Luxembourg LuxembourgInvestment holding
85% Business combination under common control
G.I.E.Casper France France
Production and sales of chemical products
68% Business combination under common control
Adisseo Eurasie Sarl Russia Russia
Production and sales of chemical products
85% Business combination under common control
Adisseo Life Science (Shanghai) Co., Ltd
China China
Production and sales of chemical products
85% Business combination under common control
Adisseo Canada Inc. Canada Canada
Production and sales of chemical products
85% Business combination under common control
Adisseo Ireland Limited
Ireland Ireland
Production and sales of chemical products
85% Business combination under common control
Adisseo de Mexico S.A. de C.V.
Mexico Mexico
Production and sales of chemical products
85% Business combination under common control
Adisseo USA Inc. USA USA
Production and sales of chemical products
85% Business combination under common control
Adisseo Asia Pacific Pte. Ltd
Singapore Singapore
Production and sales of chemical products
85% Business combination under common control
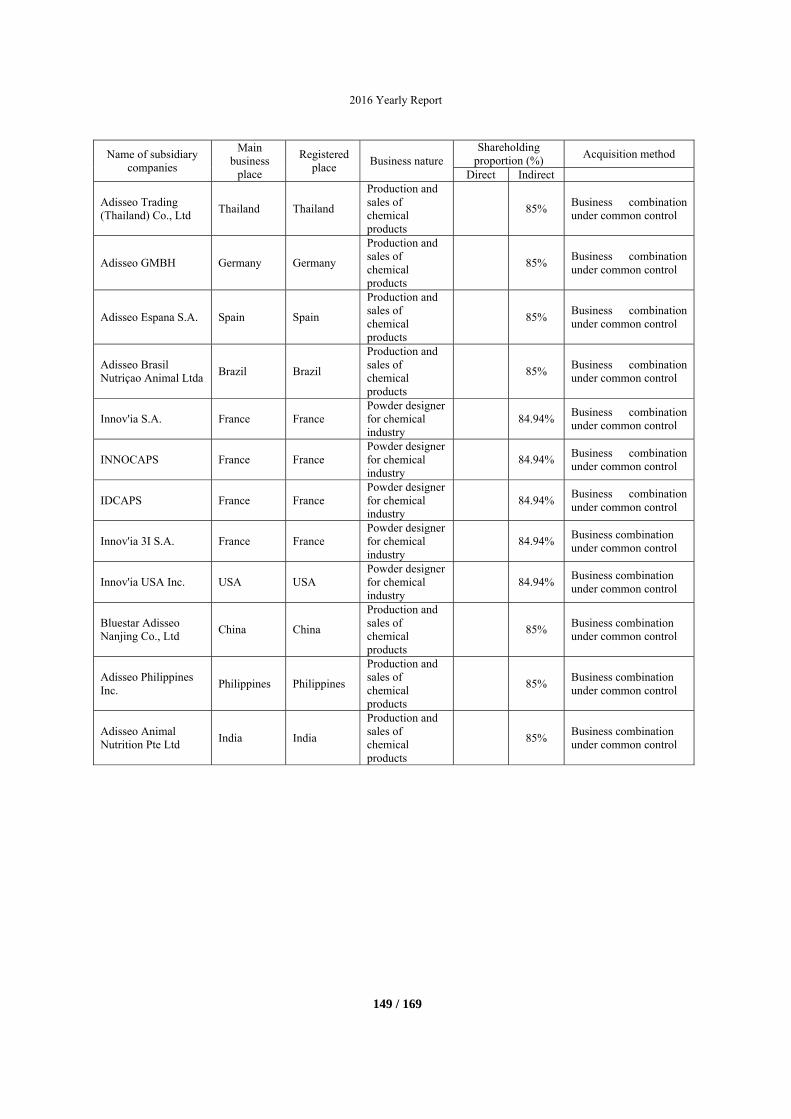
2016 Yearly Report
149 / 169
Name of subsidiary companies
Main business
place
Registered place
Business natureShareholding
proportion (%) Acquisition method
Direct Indirect
Adisseo Trading (Thailand) Co., Ltd
Thailand Thailand
Production and sales of chemical products
85% Business combination under common control
Adisseo GMBH Germany Germany
Production and sales of chemical products
85% Business combination under common control
Adisseo Espana S.A. Spain Spain
Production and sales of chemical products
85% Business combination under common control
Adisseo Brasil Nutriçao Animal Ltda
Brazil Brazil
Production and sales of chemical products
85% Business combination under common control
Innov'ia S.A. France France Powder designer for chemical industry
84.94%Business combination under common control
INNOCAPS France France Powder designer for chemical industry
84.94%Business combination under common control
IDCAPS France France Powder designer for chemical industry
84.94%Business combination under common control
Innov'ia 3I S.A. France France Powder designer for chemical industry
84.94%Business combination under common control
Innov'ia USA Inc. USA USA Powder designer for chemical industry
84.94%Business combination under common control
Bluestar Adisseo Nanjing Co., Ltd
China China
Production and sales of chemical products
85% Business combination under common control
Adisseo Philippines Inc.
Philippines Philippines
Production and sales of chemical products
85% Business combination under common control
Adisseo Animal Nutrition Pte Ltd
India India
Production and sales of chemical products
85% Business combination under common control
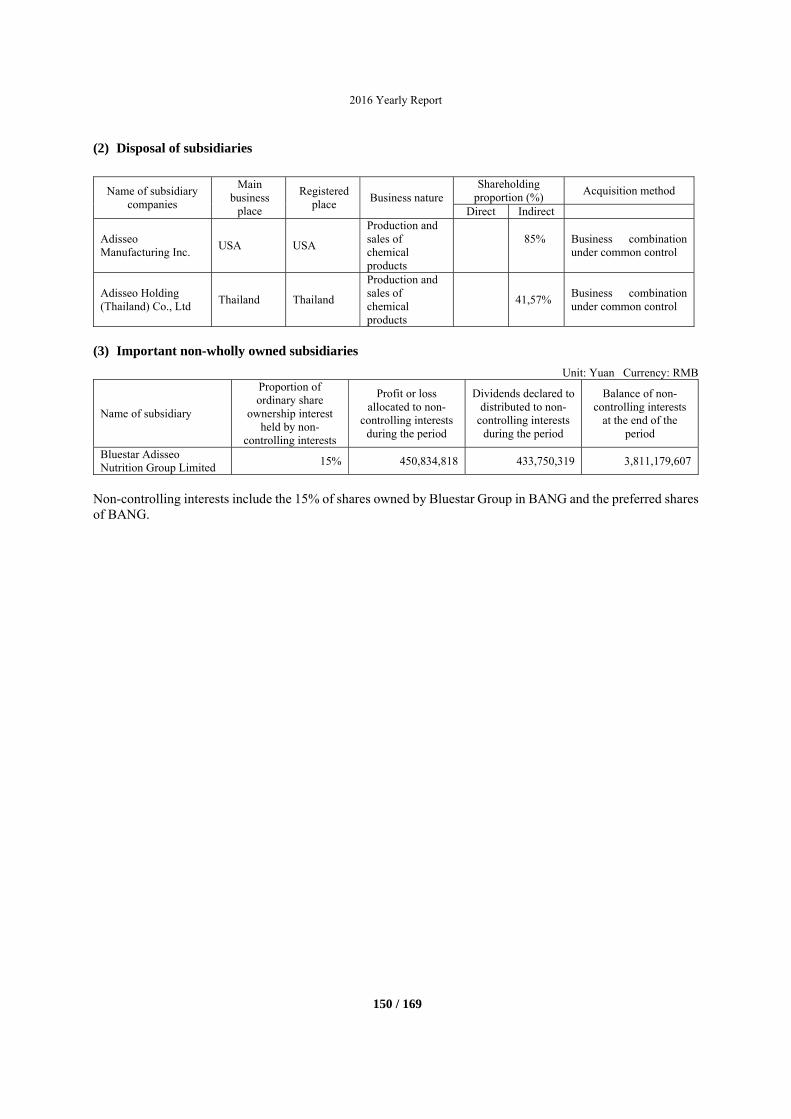
2016 Yearly Report
150 / 169
(2) Disposal of subsidiaries
Name of subsidiary companies
Main business
place
Registered place
Business natureShareholding
proportion (%) Acquisition method
Direct Indirect
Adisseo Manufacturing Inc.
USA USA
Production and sales of chemical products
85%
Business combination under common control
Adisseo Holding (Thailand) Co., Ltd
Thailand Thailand
Production and sales of chemical products
41,57% Business combination under common control
(3) Important non-wholly owned subsidiaries
Unit: Yuan Currency: RMB
Name of subsidiary
Proportion of ordinary share
ownership interest held by non-
controlling interests
Profit or loss allocated to non-
controlling interests during the period
Dividends declared to distributed to non-
controlling interests during the period
Balance of non-controlling interests
at the end of the period
Bluestar Adisseo Nutrition Group Limited
15% 450,834,818 433,750,319 3,811,179,607
Non-controlling interests include the 15% of shares owned by Bluestar Group in BANG and the preferred shares of BANG.
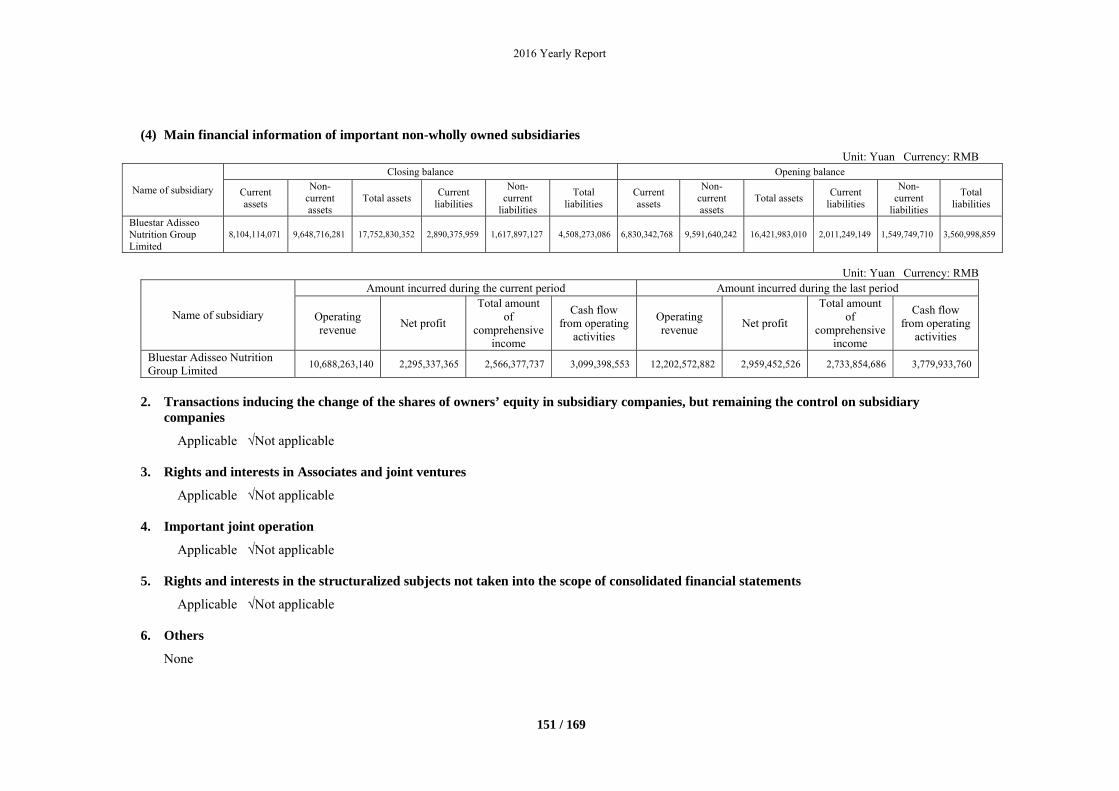
2016 Yearly Report
151 / 169
(4) Main financial information of important non-wholly owned subsidiaries
Unit: Yuan Currency: RMB
Name of subsidiary
Closing balance Opening balance
Current assets
Non-current assets
Total assetsCurrent
liabilities
Non-current
liabilities
Total liabilities
Current assets
Non-current assets
Total assets Current
liabilities
Non-current
liabilities
Total liabilities
Bluestar Adisseo Nutrition Group Limited
8,104,114,071 9,648,716,281 17,752,830,352 2,890,375,959 1,617,897,127 4,508,273,086 6,830,342,768 9,591,640,242 16,421,983,010 2,011,249,149 1,549,749,710 3,560,998,859
Unit: Yuan Currency: RMB
Name of subsidiary
Amount incurred during the current period Amount incurred during the last period
Operating revenue
Net profit
Total amount of
comprehensive income
Cash flow from operating
activities
Operating revenue
Net profit
Total amount of
comprehensive income
Cash flow from operating
activities
Bluestar Adisseo Nutrition Group Limited
10,688,263,140 2,295,337,365 2,566,377,737 3,099,398,553 12,202,572,882 2,959,452,526 2,733,854,686 3,779,933,760
2. Transactions inducing the change of the shares of owners’ equity in subsidiary companies, but remaining the control on subsidiary companies
Applicable √Not applicable
3. Rights and interests in Associates and joint ventures
Applicable √Not applicable
4. Important joint operation
Applicable √Not applicable
5. Rights and interests in the structuralized subjects not taken into the scope of consolidated financial statements
Applicable √Not applicable
6. Others
None
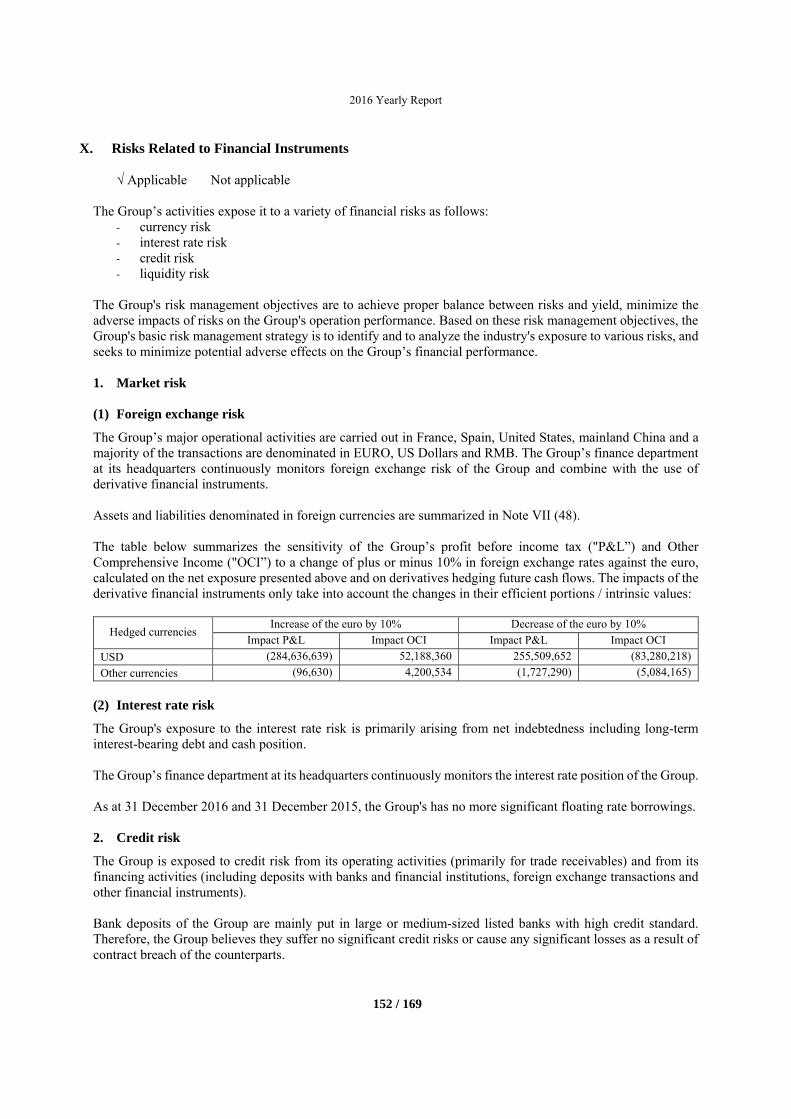
2016 Yearly Report
152 / 169
X. Risks Related to Financial Instruments
√ Applicable Not applicable The Group’s activities expose it to a variety of financial risks as follows:
- currency risk - interest rate risk - credit risk - liquidity risk
The Group's risk management objectives are to achieve proper balance between risks and yield, minimize the adverse impacts of risks on the Group's operation performance. Based on these risk management objectives, the Group's basic risk management strategy is to identify and to analyze the industry's exposure to various risks, and seeks to minimize potential adverse effects on the Group’s financial performance.
1. Market risk
(1) Foreign exchange risk
The Group’s major operational activities are carried out in France, Spain, United States, mainland China and a majority of the transactions are denominated in EURO, US Dollars and RMB. The Group’s finance department at its headquarters continuously monitors foreign exchange risk of the Group and combine with the use of derivative financial instruments. Assets and liabilities denominated in foreign currencies are summarized in Note VII (48). The table below summarizes the sensitivity of the Group’s profit before income tax ("P&L”) and Other Comprehensive Income ("OCI”) to a change of plus or minus 10% in foreign exchange rates against the euro, calculated on the net exposure presented above and on derivatives hedging future cash flows. The impacts of the derivative financial instruments only take into account the changes in their efficient portions / intrinsic values:
Hedged currencies Increase of the euro by 10% Decrease of the euro by 10%
Impact P&L Impact OCI Impact P&L Impact OCI
USD (284,636,639) 52,188,360 255,509,652 (83,280,218)
Other currencies (96,630) 4,200,534 (1,727,290) (5,084,165)
(2) Interest rate risk
The Group's exposure to the interest rate risk is primarily arising from net indebtedness including long-term interest-bearing debt and cash position. The Group’s finance department at its headquarters continuously monitors the interest rate position of the Group. As at 31 December 2016 and 31 December 2015, the Group's has no more significant floating rate borrowings.
2. Credit risk
The Group is exposed to credit risk from its operating activities (primarily for trade receivables) and from its financing activities (including deposits with banks and financial institutions, foreign exchange transactions and other financial instruments). Bank deposits of the Group are mainly put in large or medium-sized listed banks with high credit standard. Therefore, the Group believes they suffer no significant credit risks or cause any significant losses as a result of contract breach of the counterparts.
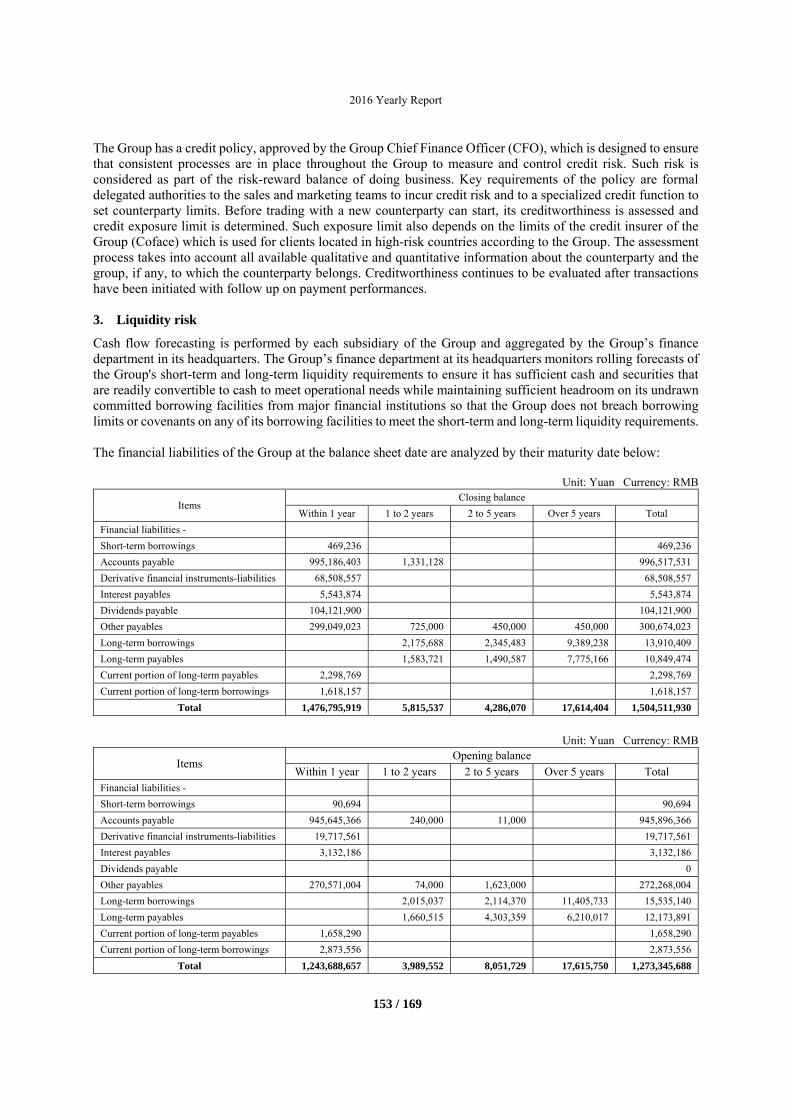
2016 Yearly Report
153 / 169
The Group has a credit policy, approved by the Group Chief Finance Officer (CFO), which is designed to ensure that consistent processes are in place throughout the Group to measure and control credit risk. Such risk is considered as part of the risk-reward balance of doing business. Key requirements of the policy are formal delegated authorities to the sales and marketing teams to incur credit risk and to a specialized credit function to set counterparty limits. Before trading with a new counterparty can start, its creditworthiness is assessed and credit exposure limit is determined. Such exposure limit also depends on the limits of the credit insurer of the Group (Coface) which is used for clients located in high-risk countries according to the Group. The assessment process takes into account all available qualitative and quantitative information about the counterparty and the group, if any, to which the counterparty belongs. Creditworthiness continues to be evaluated after transactions have been initiated with follow up on payment performances.
3. Liquidity risk
Cash flow forecasting is performed by each subsidiary of the Group and aggregated by the Group’s finance department in its headquarters. The Group’s finance department at its headquarters monitors rolling forecasts of the Group's short-term and long-term liquidity requirements to ensure it has sufficient cash and securities that are readily convertible to cash to meet operational needs while maintaining sufficient headroom on its undrawn committed borrowing facilities from major financial institutions so that the Group does not breach borrowing limits or covenants on any of its borrowing facilities to meet the short-term and long-term liquidity requirements. The financial liabilities of the Group at the balance sheet date are analyzed by their maturity date below:
Unit: Yuan Currency: RMB
Items Closing balance
Within 1 year 1 to 2 years 2 to 5 years Over 5 years Total
Financial liabilities -
Short-term borrowings 469,236 469,236
Accounts payable 995,186,403 1,331,128 996,517,531
Derivative financial instruments-liabilities 68,508,557 68,508,557
Interest payables 5,543,874 5,543,874
Dividends payable 104,121,900 104,121,900
Other payables 299,049,023 725,000 450,000 450,000 300,674,023
Long-term borrowings 2,175,688 2,345,483 9,389,238 13,910,409
Long-term payables 1,583,721 1,490,587 7,775,166 10,849,474
Current portion of long-term payables 2,298,769 2,298,769
Current portion of long-term borrowings 1,618,157 1,618,157
Total 1,476,795,919 5,815,537 4,286,070 17,614,404 1,504,511,930
Unit: Yuan Currency: RMB
Items Opening balance
Within 1 year 1 to 2 years 2 to 5 years Over 5 years Total Financial liabilities -
Short-term borrowings 90,694 90,694
Accounts payable 945,645,366 240,000 11,000 945,896,366
Derivative financial instruments-liabilities 19,717,561 19,717,561
Interest payables 3,132,186 3,132,186
Dividends payable 0
Other payables 270,571,004 74,000 1,623,000 272,268,004
Long-term borrowings 2,015,037 2,114,370 11,405,733 15,535,140
Long-term payables 1,660,515 4,303,359 6,210,017 12,173,891
Current portion of long-term payables 1,658,290 1,658,290
Current portion of long-term borrowings 2,873,556 2,873,556
Total 1,243,688,657 3,989,552 8,051,729 17,615,750 1,273,345,688
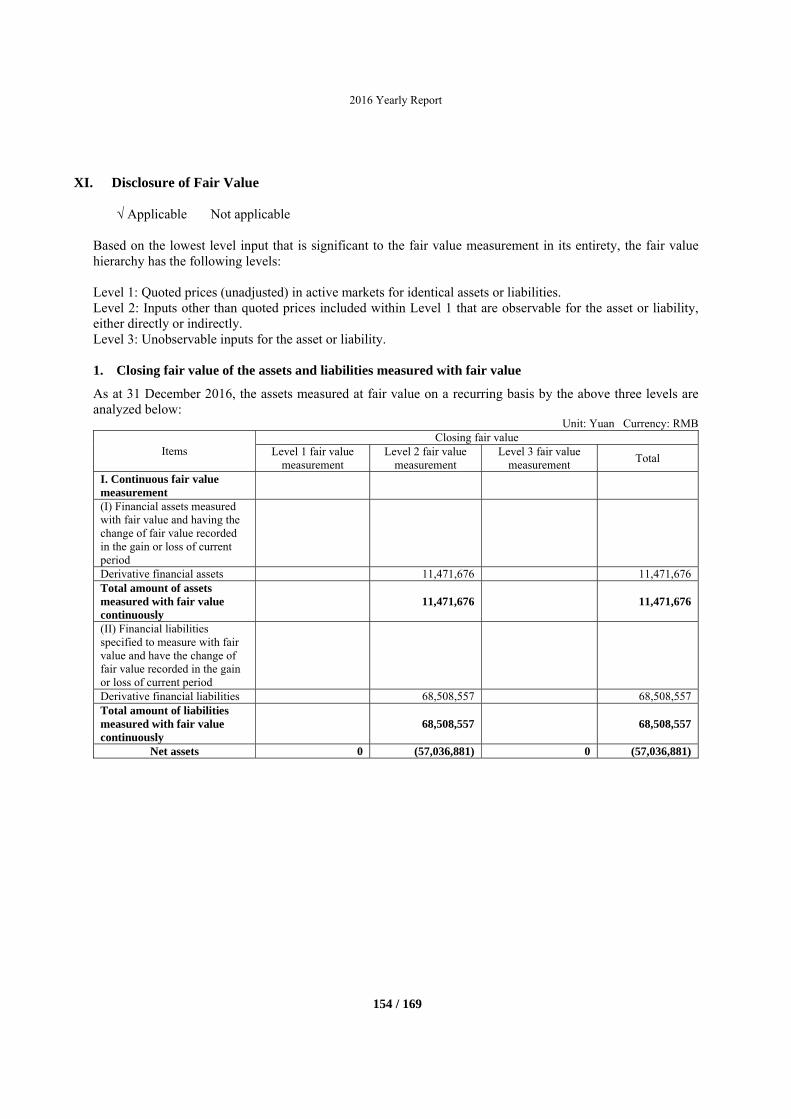
2016 Yearly Report
154 / 169
XI. Disclosure of Fair Value
√ Applicable Not applicable Based on the lowest level input that is significant to the fair value measurement in its entirety, the fair value hierarchy has the following levels: Level 1: Quoted prices (unadjusted) in active markets for identical assets or liabilities. Level 2: Inputs other than quoted prices included within Level 1 that are observable for the asset or liability, either directly or indirectly. Level 3: Unobservable inputs for the asset or liability.
1. Closing fair value of the assets and liabilities measured with fair value
As at 31 December 2016, the assets measured at fair value on a recurring basis by the above three levels are analyzed below:
Unit: Yuan Currency: RMB
Items Closing fair value
Level 1 fair value measurement
Level 2 fair value measurement
Level 3 fair value measurement
Total
I. Continuous fair value measurement
(I) Financial assets measured with fair value and having the change of fair value recorded in the gain or loss of current period
Derivative financial assets 11,471,676 11,471,676Total amount of assets measured with fair value continuously
11,471,676 11,471,676
(II) Financial liabilities specified to measure with fair value and have the change of fair value recorded in the gain or loss of current period
Derivative financial liabilities 68,508,557 68,508,557Total amount of liabilities measured with fair value continuously
68,508,557 68,508,557
Net assets 0 (57,036,881) 0 (57,036,881)
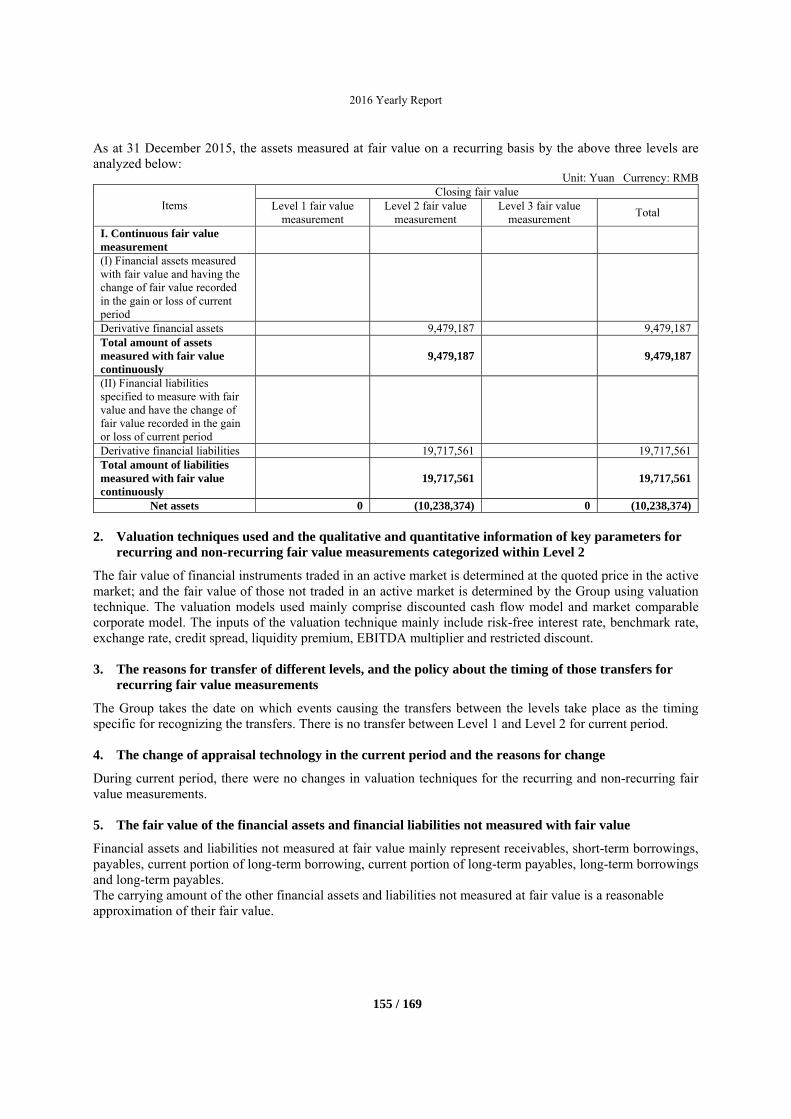
2016 Yearly Report
155 / 169
As at 31 December 2015, the assets measured at fair value on a recurring basis by the above three levels are analyzed below:
Unit: Yuan Currency: RMB
Items Closing fair value
Level 1 fair value measurement
Level 2 fair value measurement
Level 3 fair value measurement
Total
I. Continuous fair value measurement
(I) Financial assets measured with fair value and having the change of fair value recorded in the gain or loss of current period
Derivative financial assets 9,479,187 9,479,187Total amount of assets measured with fair value continuously
9,479,187 9,479,187
(II) Financial liabilities specified to measure with fair value and have the change of fair value recorded in the gain or loss of current period
Derivative financial liabilities 19,717,561 19,717,561Total amount of liabilities measured with fair value continuously
19,717,561 19,717,561
Net assets 0 (10,238,374) 0 (10,238,374)
2. Valuation techniques used and the qualitative and quantitative information of key parameters for recurring and non-recurring fair value measurements categorized within Level 2
The fair value of financial instruments traded in an active market is determined at the quoted price in the active market; and the fair value of those not traded in an active market is determined by the Group using valuation technique. The valuation models used mainly comprise discounted cash flow model and market comparable corporate model. The inputs of the valuation technique mainly include risk-free interest rate, benchmark rate, exchange rate, credit spread, liquidity premium, EBITDA multiplier and restricted discount.
3. The reasons for transfer of different levels, and the policy about the timing of those transfers for recurring fair value measurements
The Group takes the date on which events causing the transfers between the levels take place as the timing specific for recognizing the transfers. There is no transfer between Level 1 and Level 2 for current period.
4. The change of appraisal technology in the current period and the reasons for change
During current period, there were no changes in valuation techniques for the recurring and non-recurring fair value measurements.
5. The fair value of the financial assets and financial liabilities not measured with fair value
Financial assets and liabilities not measured at fair value mainly represent receivables, short-term borrowings, payables, current portion of long-term borrowing, current portion of long-term payables, long-term borrowings and long-term payables. The carrying amount of the other financial assets and liabilities not measured at fair value is a reasonable approximation of their fair value.
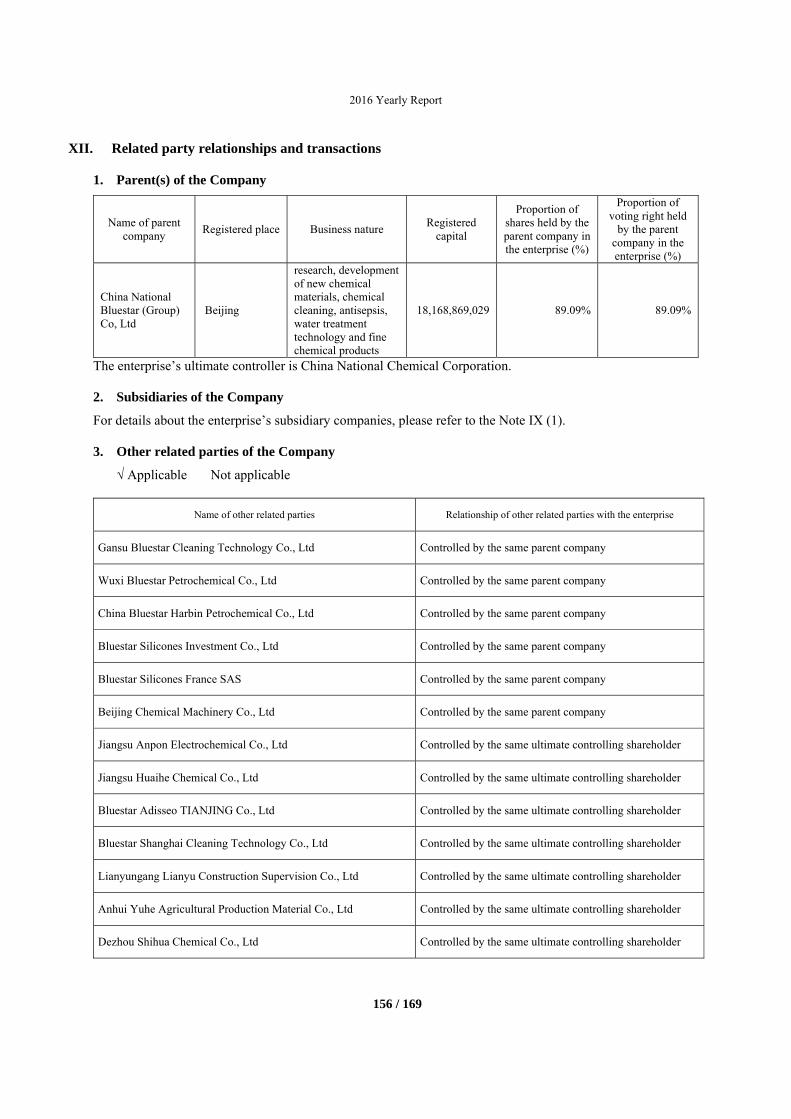
2016 Yearly Report
156 / 169
XII. Related party relationships and transactions
1. Parent(s) of the Company
Name of parent company
Registered place Business nature Registered
capital
Proportion of shares held by the parent company in the enterprise (%)
Proportion of voting right held
by the parent company in the enterprise (%)
China National Bluestar (Group) Co, Ltd
Beijing
research, development of new chemical materials, chemical cleaning, antisepsis, water treatment technology and fine chemical products
18,168,869,029 89.09% 89.09%
The enterprise’s ultimate controller is China National Chemical Corporation.
2. Subsidiaries of the Company
For details about the enterprise’s subsidiary companies, please refer to the Note IX (1).
3. Other related parties of the Company
√ Applicable Not applicable
Name of other related parties Relationship of other related parties with the enterprise
Gansu Bluestar Cleaning Technology Co., Ltd Controlled by the same parent company
Wuxi Bluestar Petrochemical Co., Ltd Controlled by the same parent company
China Bluestar Harbin Petrochemical Co., Ltd Controlled by the same parent company
Bluestar Silicones Investment Co., Ltd Controlled by the same parent company
Bluestar Silicones France SAS Controlled by the same parent company
Beijing Chemical Machinery Co., Ltd Controlled by the same parent company
Jiangsu Anpon Electrochemical Co., Ltd Controlled by the same ultimate controlling shareholder
Jiangsu Huaihe Chemical Co., Ltd Controlled by the same ultimate controlling shareholder
Bluestar Adisseo TIANJING Co., Ltd Controlled by the same ultimate controlling shareholder
Bluestar Shanghai Cleaning Technology Co., Ltd Controlled by the same ultimate controlling shareholder
Lianyungang Lianyu Construction Supervision Co., Ltd Controlled by the same ultimate controlling shareholder
Anhui Yuhe Agricultural Production Material Co., Ltd Controlled by the same ultimate controlling shareholder
Dezhou Shihua Chemical Co., Ltd Controlled by the same ultimate controlling shareholder
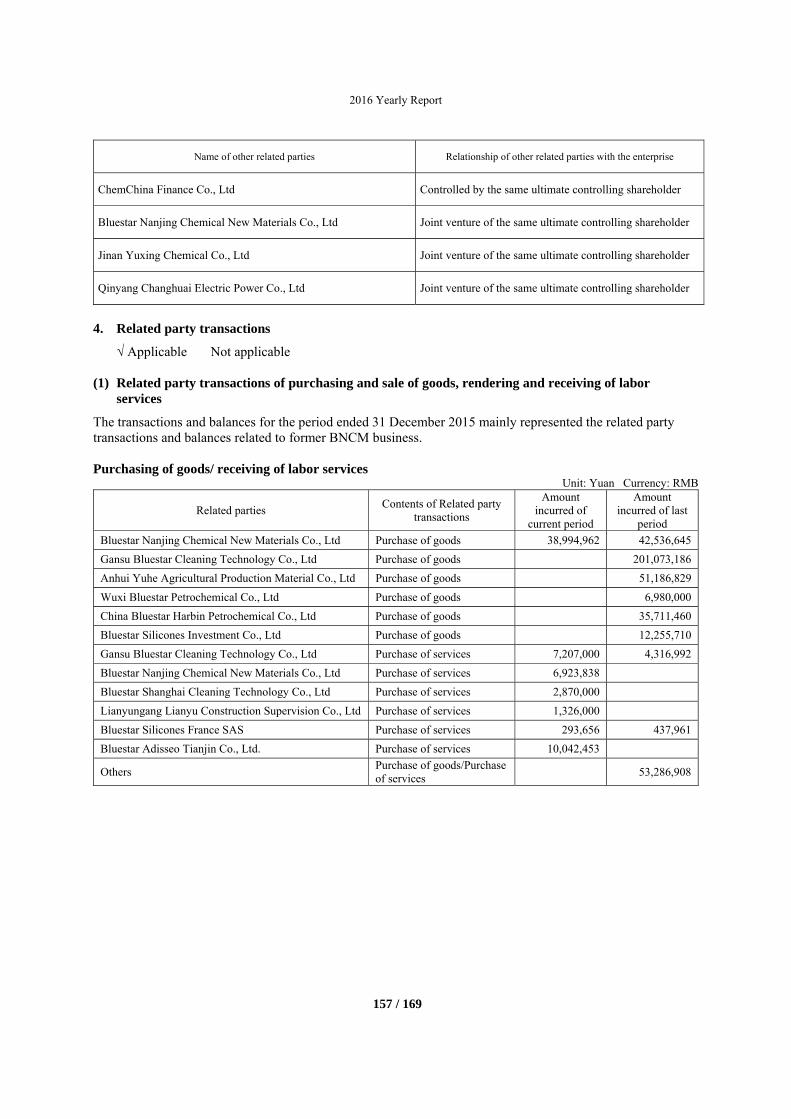
2016 Yearly Report
157 / 169
Name of other related parties Relationship of other related parties with the enterprise
ChemChina Finance Co., Ltd Controlled by the same ultimate controlling shareholder
Bluestar Nanjing Chemical New Materials Co., Ltd Joint venture of the same ultimate controlling shareholder
Jinan Yuxing Chemical Co., Ltd Joint venture of the same ultimate controlling shareholder
Qinyang Changhuai Electric Power Co., Ltd Joint venture of the same ultimate controlling shareholder
4. Related party transactions
√ Applicable Not applicable
(1) Related party transactions of purchasing and sale of goods, rendering and receiving of labor services
The transactions and balances for the period ended 31 December 2015 mainly represented the related party transactions and balances related to former BNCM business. Purchasing of goods/ receiving of labor services
Unit: Yuan Currency: RMB
Related parties Contents of Related party
transactions
Amount incurred of
current period
Amount incurred of last
period
Bluestar Nanjing Chemical New Materials Co., Ltd Purchase of goods 38,994,962 42,536,645
Gansu Bluestar Cleaning Technology Co., Ltd Purchase of goods 201,073,186
Anhui Yuhe Agricultural Production Material Co., Ltd Purchase of goods 51,186,829
Wuxi Bluestar Petrochemical Co., Ltd Purchase of goods 6,980,000
China Bluestar Harbin Petrochemical Co., Ltd Purchase of goods 35,711,460
Bluestar Silicones Investment Co., Ltd Purchase of goods 12,255,710
Gansu Bluestar Cleaning Technology Co., Ltd Purchase of services 7,207,000 4,316,992
Bluestar Nanjing Chemical New Materials Co., Ltd Purchase of services 6,923,838
Bluestar Shanghai Cleaning Technology Co., Ltd Purchase of services 2,870,000
Lianyungang Lianyu Construction Supervision Co., Ltd Purchase of services 1,326,000
Bluestar Silicones France SAS Purchase of services 293,656 437,961
Bluestar Adisseo Tianjin Co., Ltd. Purchase of services 10,042,453
Others Purchase of goods/Purchase of services
53,286,908
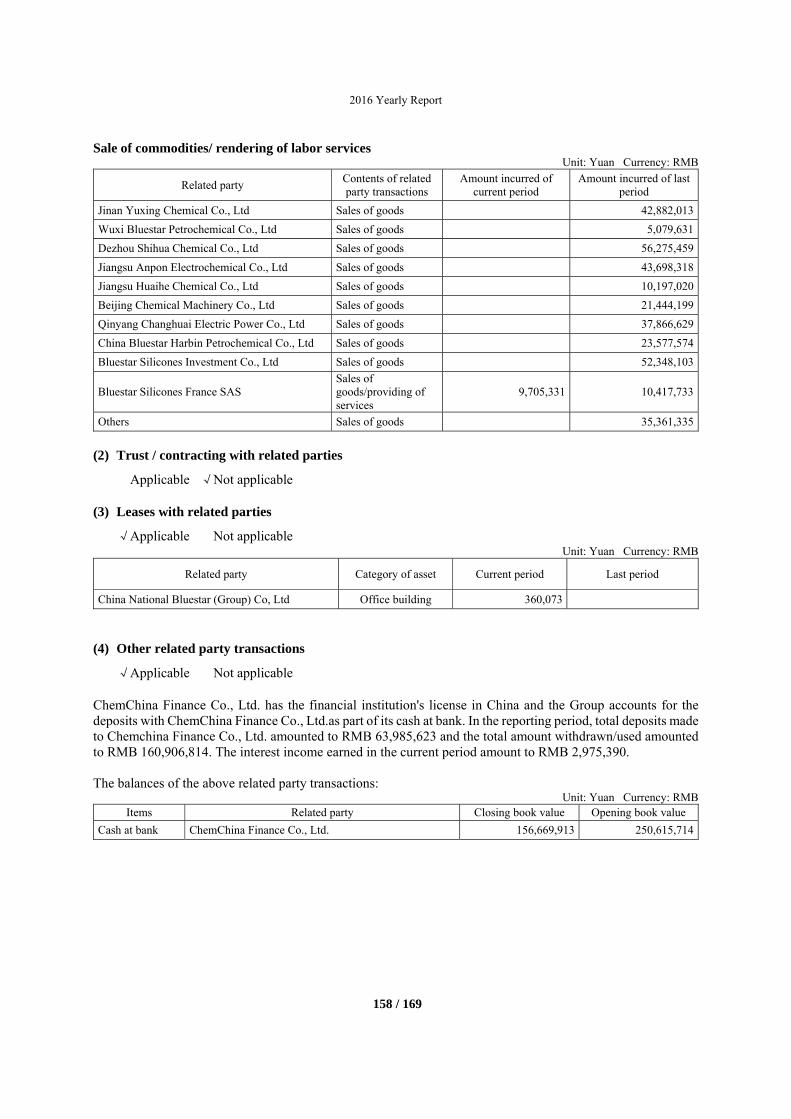
2016 Yearly Report
158 / 169
Sale of commodities/ rendering of labor services Unit: Yuan Currency: RMB
Related party Contents of related party transactions
Amount incurred of current period
Amount incurred of last period
Jinan Yuxing Chemical Co., Ltd Sales of goods 42,882,013
Wuxi Bluestar Petrochemical Co., Ltd Sales of goods 5,079,631
Dezhou Shihua Chemical Co., Ltd Sales of goods 56,275,459
Jiangsu Anpon Electrochemical Co., Ltd Sales of goods 43,698,318
Jiangsu Huaihe Chemical Co., Ltd Sales of goods 10,197,020
Beijing Chemical Machinery Co., Ltd Sales of goods 21,444,199
Qinyang Changhuai Electric Power Co., Ltd Sales of goods 37,866,629
China Bluestar Harbin Petrochemical Co., Ltd Sales of goods 23,577,574
Bluestar Silicones Investment Co., Ltd Sales of goods 52,348,103
Bluestar Silicones France SAS Sales of goods/providing of services
9,705,331 10,417,733
Others Sales of goods 35,361,335
(2) Trust / contracting with related parties
Applicable √Not applicable
(3) Leases with related parties
√Applicable Not applicable Unit: Yuan Currency: RMB
Related party Category of asset Current period Last period
China National Bluestar (Group) Co, Ltd Office building 360,073
(4) Other related party transactions
√Applicable Not applicable
ChemChina Finance Co., Ltd. has the financial institution's license in China and the Group accounts for the deposits with ChemChina Finance Co., Ltd.as part of its cash at bank. In the reporting period, total deposits made to Chemchina Finance Co., Ltd. amounted to RMB 63,985,623 and the total amount withdrawn/used amounted to RMB 160,906,814. The interest income earned in the current period amount to RMB 2,975,390. The balances of the above related party transactions:
Unit: Yuan Currency: RMB Items Related party Closing book value Opening book value
Cash at bank ChemChina Finance Co., Ltd. 156,669,913 250,615,714
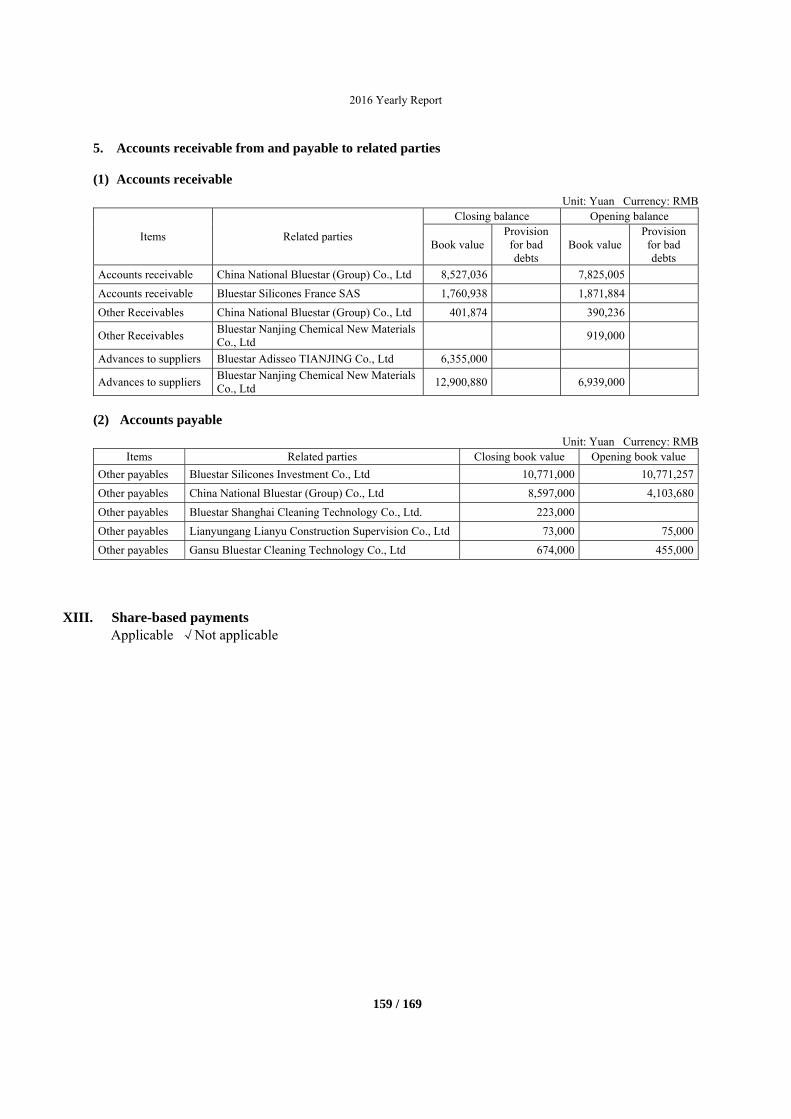
2016 Yearly Report
159 / 169
5. Accounts receivable from and payable to related parties
(1) Accounts receivable
Unit: Yuan Currency: RMB
Items Related parties
Closing balance Opening balance
Book valueProvision for bad debts
Book value Provision for bad debts
Accounts receivable China National Bluestar (Group) Co., Ltd 8,527,036 7,825,005
Accounts receivable Bluestar Silicones France SAS 1,760,938 1,871,884
Other Receivables China National Bluestar (Group) Co., Ltd 401,874 390,236
Other Receivables Bluestar Nanjing Chemical New Materials Co., Ltd
919,000
Advances to suppliers Bluestar Adisseo TIANJING Co., Ltd 6,355,000
Advances to suppliers Bluestar Nanjing Chemical New Materials Co., Ltd
12,900,880 6,939,000
(2) Accounts payable
Unit: Yuan Currency: RMB Items Related parties Closing book value Opening book value
Other payables Bluestar Silicones Investment Co., Ltd 10,771,000 10,771,257
Other payables China National Bluestar (Group) Co., Ltd 8,597,000 4,103,680
Other payables Bluestar Shanghai Cleaning Technology Co., Ltd. 223,000
Other payables Lianyungang Lianyu Construction Supervision Co., Ltd 73,000 75,000
Other payables Gansu Bluestar Cleaning Technology Co., Ltd 674,000 455,000
XIII. Share-based payments Applicable √Not applicable
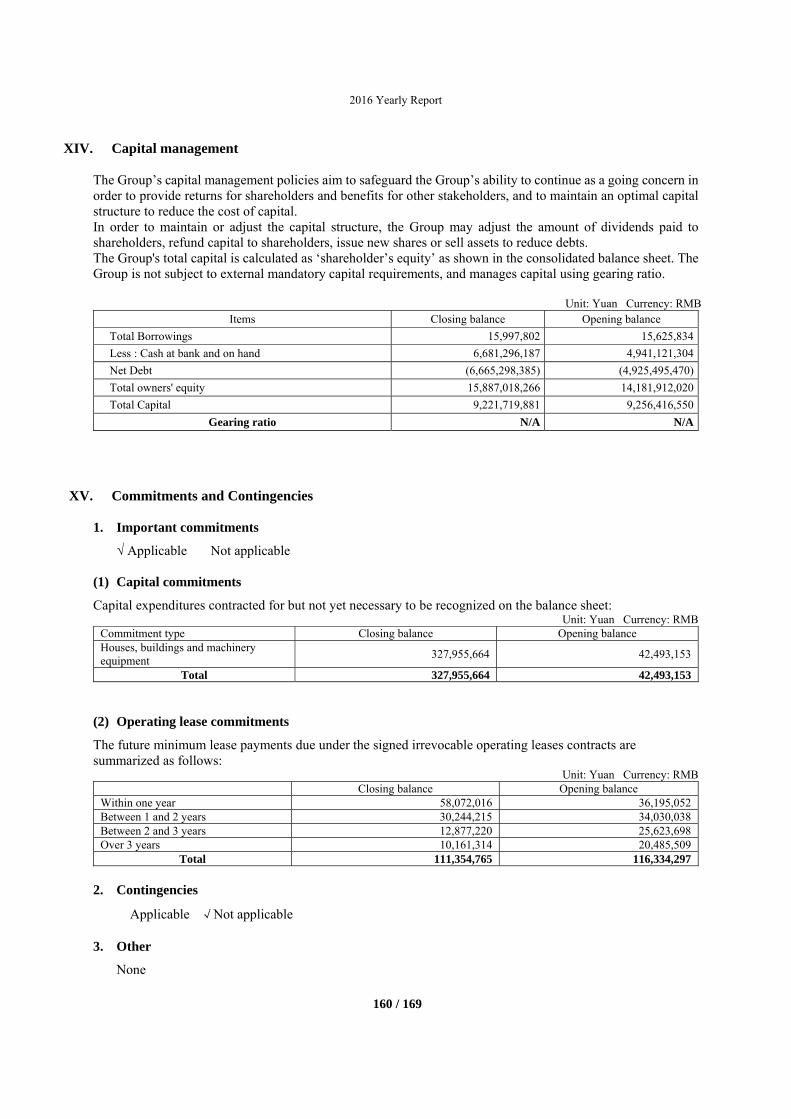
2016 Yearly Report
160 / 169
XIV. Capital management The Group’s capital management policies aim to safeguard the Group’s ability to continue as a going concern in order to provide returns for shareholders and benefits for other stakeholders, and to maintain an optimal capital structure to reduce the cost of capital. In order to maintain or adjust the capital structure, the Group may adjust the amount of dividends paid to shareholders, refund capital to shareholders, issue new shares or sell assets to reduce debts. The Group's total capital is calculated as ‘shareholder’s equity’ as shown in the consolidated balance sheet. The Group is not subject to external mandatory capital requirements, and manages capital using gearing ratio.
Unit: Yuan Currency: RMB Items Closing balance Opening balance
Total Borrowings 15,997,802 15,625,834
Less : Cash at bank and on hand 6,681,296,187 4,941,121,304
Net Debt (6,665,298,385) (4,925,495,470)
Total owners' equity 15,887,018,266 14,181,912,020
Total Capital 9,221,719,881 9,256,416,550
Gearing ratio N/A N/A
XV. Commitments and Contingencies
1. Important commitments
√ Applicable Not applicable
(1) Capital commitments
Capital expenditures contracted for but not yet necessary to be recognized on the balance sheet: Unit: Yuan Currency: RMB
Commitment type Closing balance Opening balance Houses, buildings and machinery equipment
327,955,664 42,493,153
Total 327,955,664 42,493,153
(2) Operating lease commitments
The future minimum lease payments due under the signed irrevocable operating leases contracts are summarized as follows:
Unit: Yuan Currency: RMB Closing balance Opening balance Within one year 58,072,016 36,195,052Between 1 and 2 years 30,244,215 34,030,038Between 2 and 3 years 12,877,220 25,623,698Over 3 years 10,161,314 20,485,509
Total 111,354,765 116,334,297
2. Contingencies
Applicable √Not applicable
3. Other
None
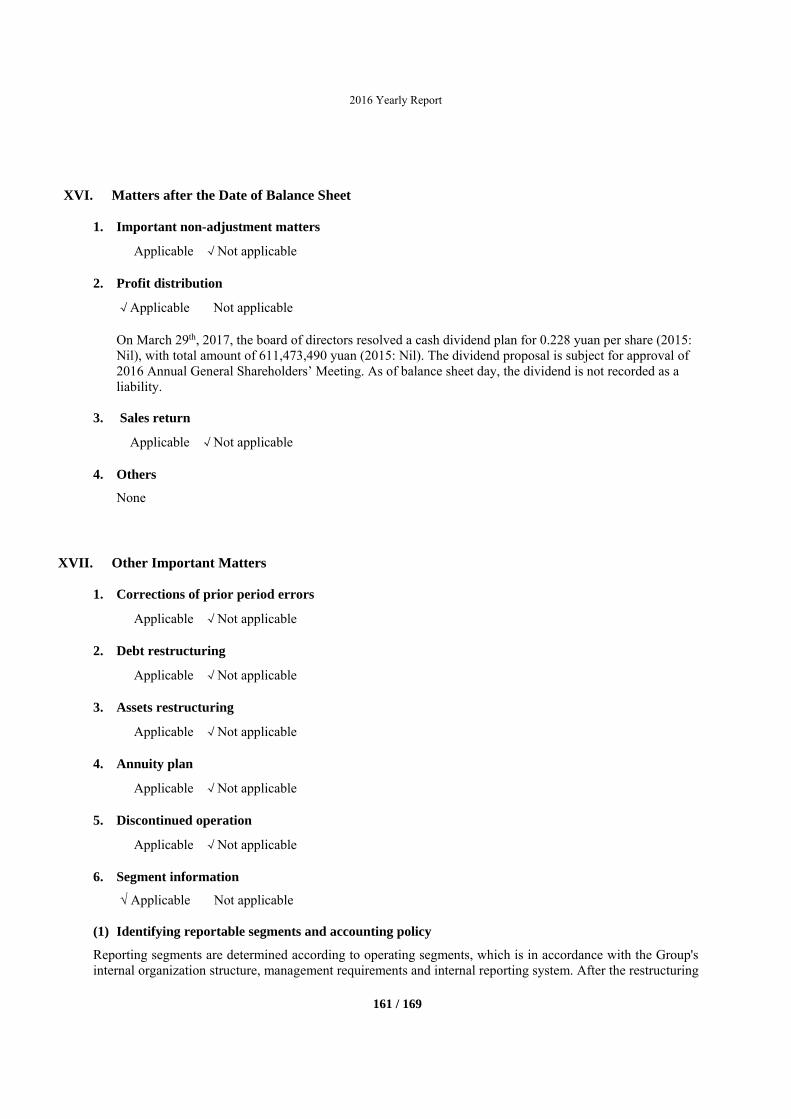
2016 Yearly Report
161 / 169
XVI. Matters after the Date of Balance Sheet
1. Important non-adjustment matters
Applicable √Not applicable
2. Profit distribution
√Applicable Not applicable On March 29th, 2017, the board of directors resolved a cash dividend plan for 0.228 yuan per share (2015: Nil), with total amount of 611,473,490 yuan (2015: Nil). The dividend proposal is subject for approval of 2016 Annual General Shareholders’ Meeting. As of balance sheet day, the dividend is not recorded as a liability.
3. Sales return
Applicable √Not applicable
4. Others
None
XVII. Other Important Matters
1. Corrections of prior period errors
Applicable √Not applicable
2. Debt restructuring
Applicable √Not applicable
3. Assets restructuring
Applicable √Not applicable
4. Annuity plan
Applicable √Not applicable
5. Discontinued operation
Applicable √Not applicable
6. Segment information
√ Applicable Not applicable
(1) Identifying reportable segments and accounting policy
Reporting segments are determined according to operating segments, which is in accordance with the Group's internal organization structure, management requirements and internal reporting system. After the restructuring
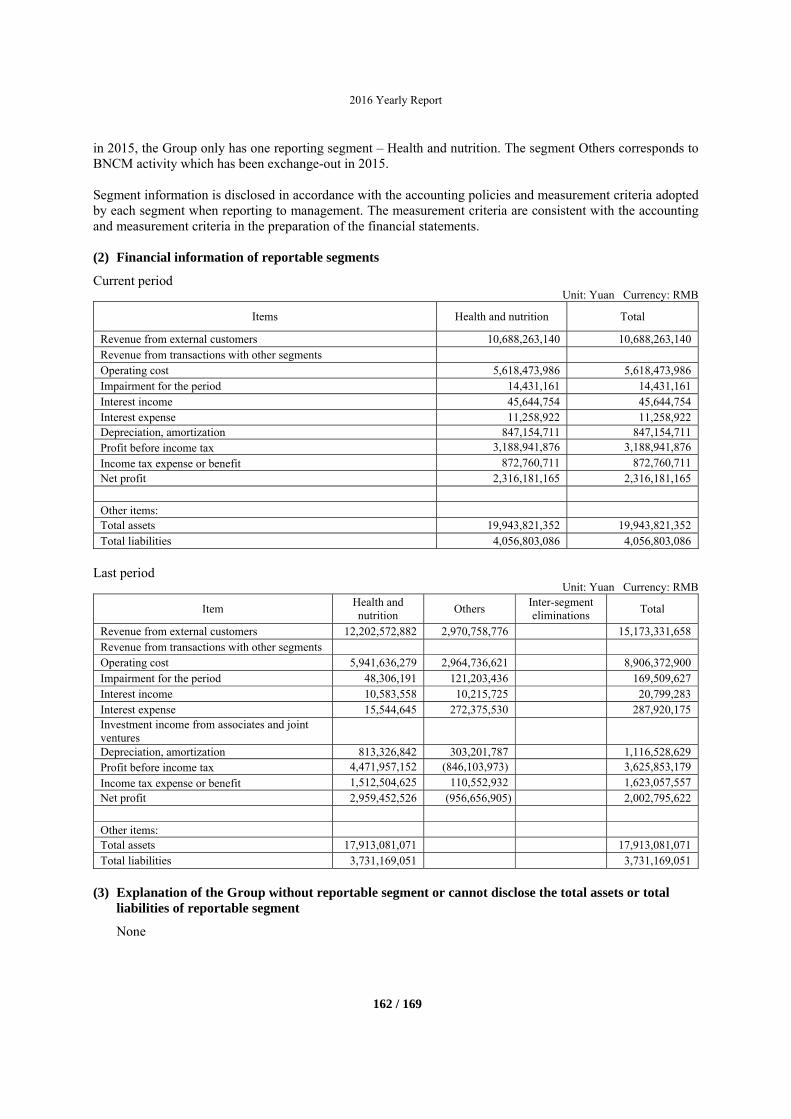
2016 Yearly Report
162 / 169
in 2015, the Group only has one reporting segment – Health and nutrition. The segment Others corresponds to BNCM activity which has been exchange-out in 2015. Segment information is disclosed in accordance with the accounting policies and measurement criteria adopted by each segment when reporting to management. The measurement criteria are consistent with the accounting and measurement criteria in the preparation of the financial statements.
(2) Financial information of reportable segments
Current period Unit: Yuan Currency: RMB
Items Health and nutrition Total
Revenue from external customers 10,688,263,140 10,688,263,140Revenue from transactions with other segments Operating cost 5,618,473,986 5,618,473,986Impairment for the period 14,431,161 14,431,161Interest income 45,644,754 45,644,754Interest expense 11,258,922 11,258,922Depreciation, amortization 847,154,711 847,154,711Profit before income tax 3,188,941,876 3,188,941,876
Income tax expense or benefit 872,760,711 872,760,711Net profit 2,316,181,165 2,316,181,165
Other items: Total assets 19,943,821,352 19,943,821,352Total liabilities 4,056,803,086 4,056,803,086
Last period
Unit: Yuan Currency: RMB
Item Health and nutrition
Others Inter-segment eliminations
Total
Revenue from external customers 12,202,572,882 2,970,758,776 15,173,331,658Revenue from transactions with other segments
Operating cost 5,941,636,279 2,964,736,621 8,906,372,900Impairment for the period 48,306,191 121,203,436 169,509,627Interest income 10,583,558 10,215,725 20,799,283 Interest expense 15,544,645 272,375,530 287,920,175 Investment income from associates and joint ventures
Depreciation, amortization 813,326,842 303,201,787 1,116,528,629 Profit before income tax 4,471,957,152 (846,103,973) 3,625,853,179
Income tax expense or benefit 1,512,504,625 110,552,932 1,623,057,557Net profit 2,959,452,526 (956,656,905) 2,002,795,622
Other items: Total assets 17,913,081,071 17,913,081,071Total liabilities 3,731,169,051 3,731,169,051
(3) Explanation of the Group without reportable segment or cannot disclose the total assets or total liabilities of reportable segment
None
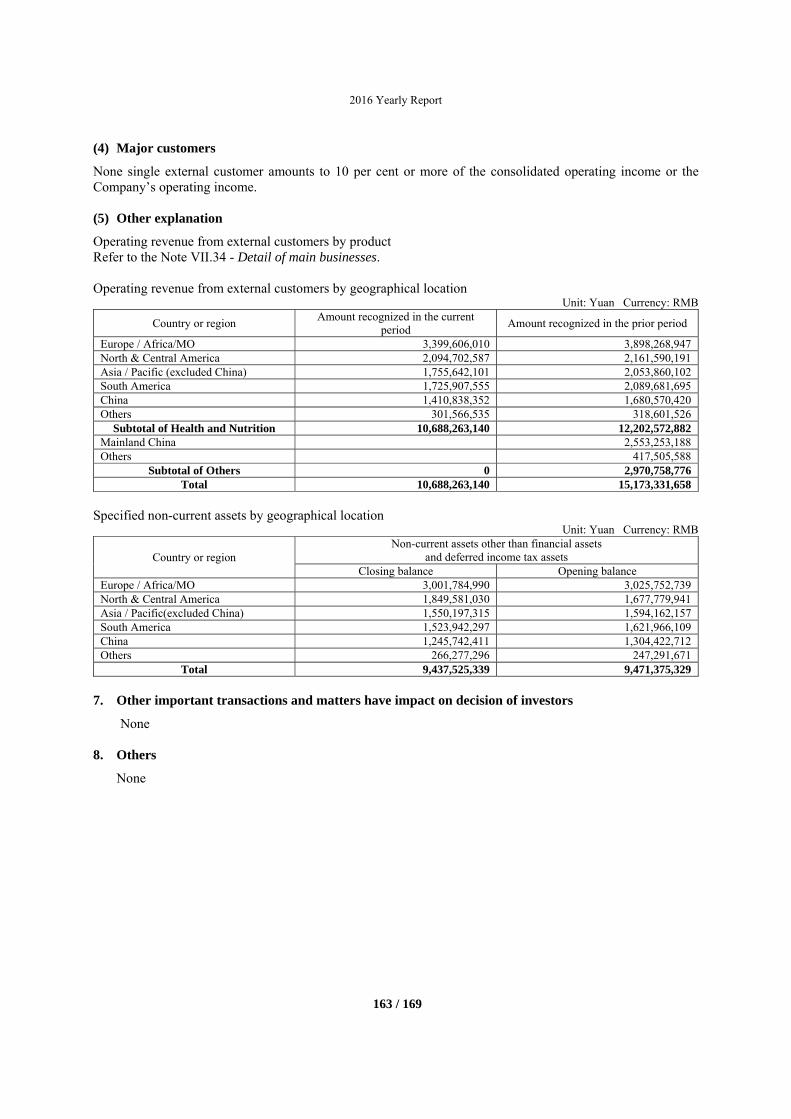
2016 Yearly Report
163 / 169
(4) Major customers
None single external customer amounts to 10 per cent or more of the consolidated operating income or the Company’s operating income.
(5) Other explanation
Operating revenue from external customers by product Refer to the Note VII.34 - Detail of main businesses. Operating revenue from external customers by geographical location
Unit: Yuan Currency: RMB Country or region
Amount recognized in the current period
Amount recognized in the prior period
Europe / Africa/MO 3,399,606,010 3,898,268,947North & Central America 2,094,702,587 2,161,590,191Asia / Pacific (excluded China) 1,755,642,101 2,053,860,102South America 1,725,907,555 2,089,681,695China 1,410,838,352 1,680,570,420Others 301,566,535 318,601,526
Subtotal of Health and Nutrition 10,688,263,140 12,202,572,882Mainland China 2,553,253,188Others 417,505,588
Subtotal of Others 0 2,970,758,776Total 10,688,263,140 15,173,331,658
Specified non-current assets by geographical location
Unit: Yuan Currency: RMB
Country or region Non-current assets other than financial assets
and deferred income tax assets Closing balance Opening balance
Europe / Africa/MO 3,001,784,990 3,025,752,739North & Central America 1,849,581,030 1,677,779,941Asia / Pacific(excluded China) 1,550,197,315 1,594,162,157South America 1,523,942,297 1,621,966,109China 1,245,742,411 1,304,422,712Others 266,277,296 247,291,671
Total 9,437,525,339 9,471,375,329
7. Other important transactions and matters have impact on decision of investors
None
8. Others
None
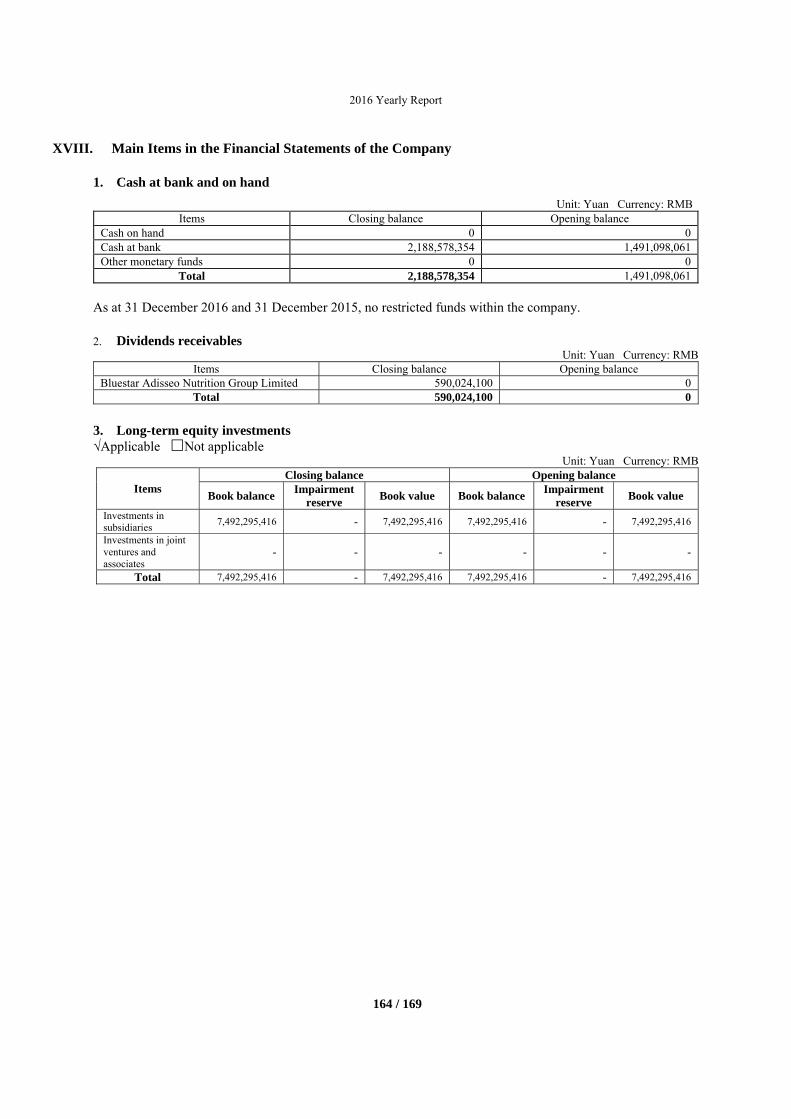
2016 Yearly Report
164 / 169
XVIII. Main Items in the Financial Statements of the Company 1. Cash at bank and on hand
Unit: Yuan Currency: RMB Items Closing balance Opening balance
Cash on hand 0 0Cash at bank 2,188,578,354 1,491,098,061Other monetary funds 0 0
Total 2,188,578,354 1,491,098,061
As at 31 December 2016 and 31 December 2015, no restricted funds within the company. 2. Dividends receivables
Unit: Yuan Currency: RMB Items Closing balance Opening balance
Bluestar Adisseo Nutrition Group Limited 590,024,100 0Total 590,024,100 0
3. Long-term equity investments √Applicable Not applicable
Unit: Yuan Currency: RMB
Items Closing balance Opening balance
Book balance Impairment
reserve Book value Book balance
Impairment reserve
Book value
Investments in subsidiaries
7,492,295,416 - 7,492,295,416 7,492,295,416 - 7,492,295,416
Investments in joint ventures and associates
- - - - - -
Total 7,492,295,416 - 7,492,295,416 7,492,295,416 - 7,492,295,416
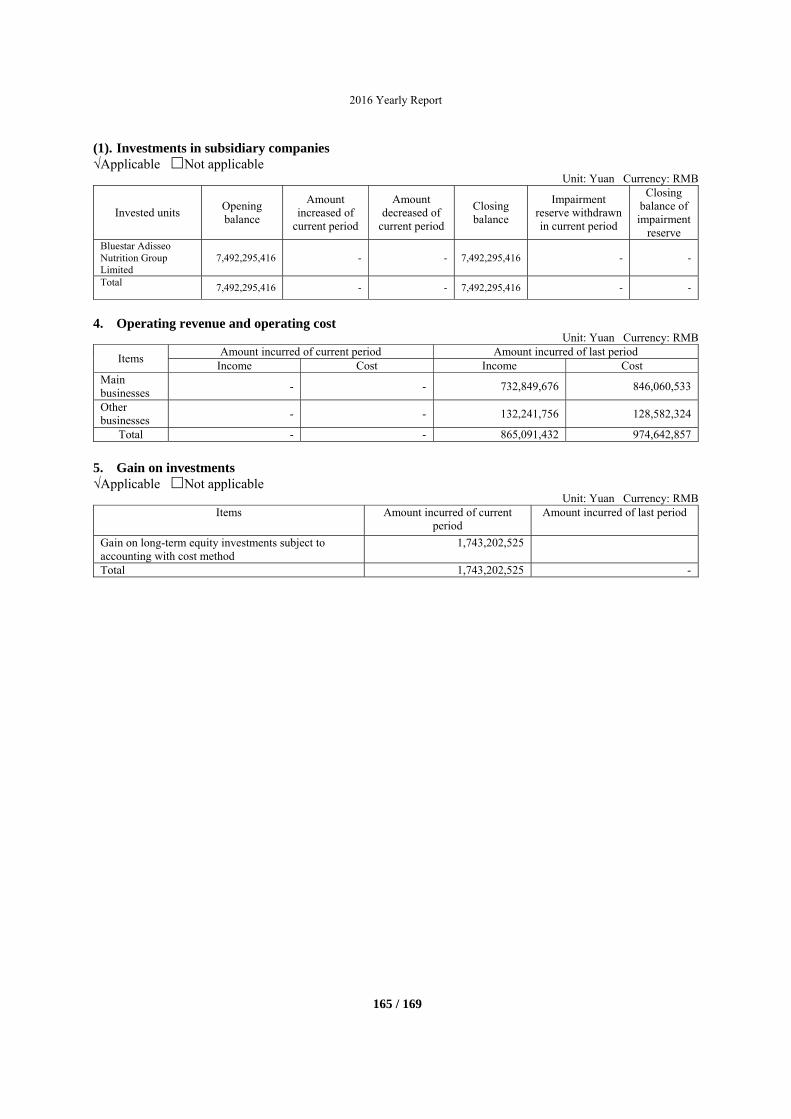
2016 Yearly Report
165 / 169
(1). Investments in subsidiary companies √Applicable Not applicable
Unit: Yuan Currency: RMB
Invested units Opening balance
Amount increased of
current period
Amount decreased of
current period
Closing balance
Impairment reserve withdrawn in current period
Closing balance of impairment
reserve Bluestar Adisseo Nutrition Group Limited
7,492,295,416 - - 7,492,295,416 - -
Total 7,492,295,416 - - 7,492,295,416 - -
4. Operating revenue and operating cost
Unit: Yuan Currency: RMB Items
Amount incurred of current period Amount incurred of last period Income Cost Income Cost
Main businesses
- - 732,849,676 846,060,533
Other businesses
- - 132,241,756 128,582,324
Total - - 865,091,432 974,642,857
5. Gain on investments √Applicable Not applicable
Unit: Yuan Currency: RMB Items Amount incurred of current
period Amount incurred of last period
Gain on long-term equity investments subject to accounting with cost method
1,743,202,525
Total 1,743,202,525 -
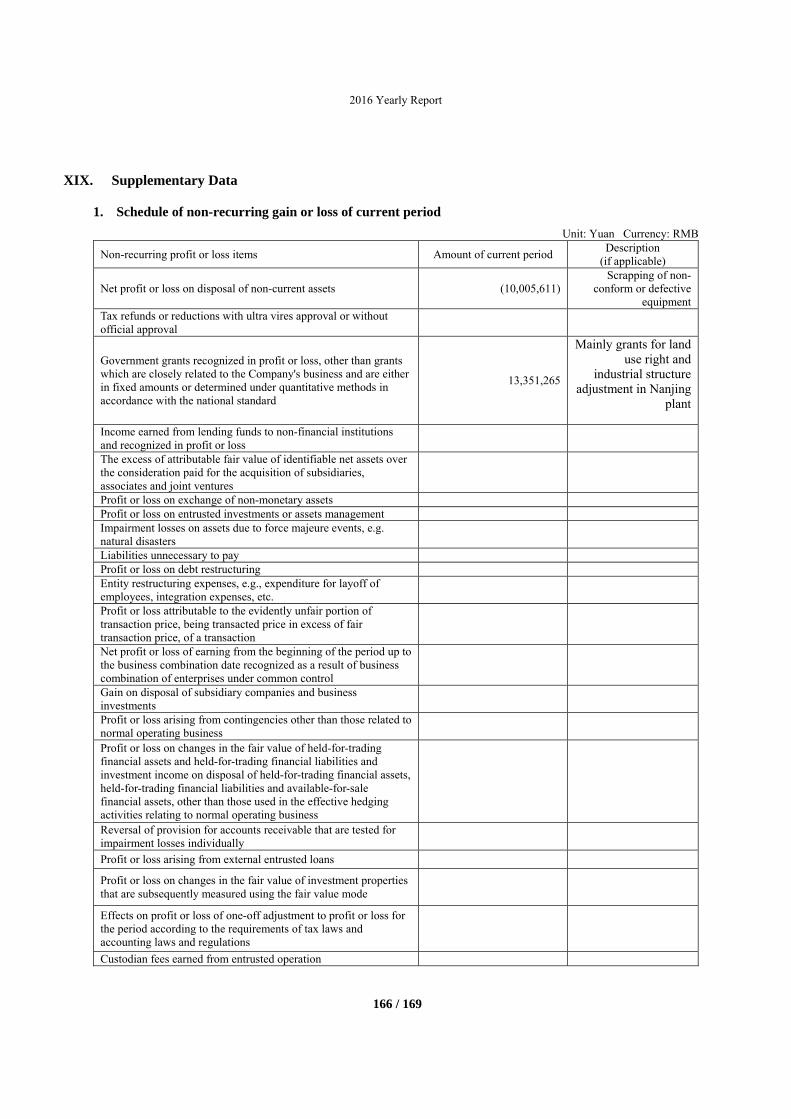
2016 Yearly Report
166 / 169
XIX. Supplementary Data
1. Schedule of non-recurring gain or loss of current period
Unit: Yuan Currency: RMB Non-recurring profit or loss items Amount of current period
Description (if applicable)
Net profit or loss on disposal of non-current assets (10,005,611) Scrapping of non-
conform or defective equipment
Tax refunds or reductions with ultra vires approval or without official approval
Government grants recognized in profit or loss, other than grants which are closely related to the Company's business and are either in fixed amounts or determined under quantitative methods in accordance with the national standard
13,351,265
Mainly grants for land use right and
industrial structure adjustment in Nanjing
plant
Income earned from lending funds to non-financial institutions and recognized in profit or loss
The excess of attributable fair value of identifiable net assets over the consideration paid for the acquisition of subsidiaries, associates and joint ventures
Profit or loss on exchange of non-monetary assets Profit or loss on entrusted investments or assets management Impairment losses on assets due to force majeure events, e.g. natural disasters
Liabilities unnecessary to pay Profit or loss on debt restructuring Entity restructuring expenses, e.g., expenditure for layoff of employees, integration expenses, etc.
Profit or loss attributable to the evidently unfair portion of transaction price, being transacted price in excess of fair transaction price, of a transaction
Net profit or loss of earning from the beginning of the period up to the business combination date recognized as a result of business combination of enterprises under common control
Gain on disposal of subsidiary companies and business investments
Profit or loss arising from contingencies other than those related to normal operating business
Profit or loss on changes in the fair value of held-for-trading financial assets and held-for-trading financial liabilities and investment income on disposal of held-for-trading financial assets, held-for-trading financial liabilities and available-for-sale financial assets, other than those used in the effective hedging activities relating to normal operating business
Reversal of provision for accounts receivable that are tested for impairment losses individually
Profit or loss arising from external entrusted loans
Profit or loss on changes in the fair value of investment properties that are subsequently measured using the fair value mode
Effects on profit or loss of one-off adjustment to profit or loss for the period according to the requirements of tax laws and accounting laws and regulations
Custodian fees earned from entrusted operation
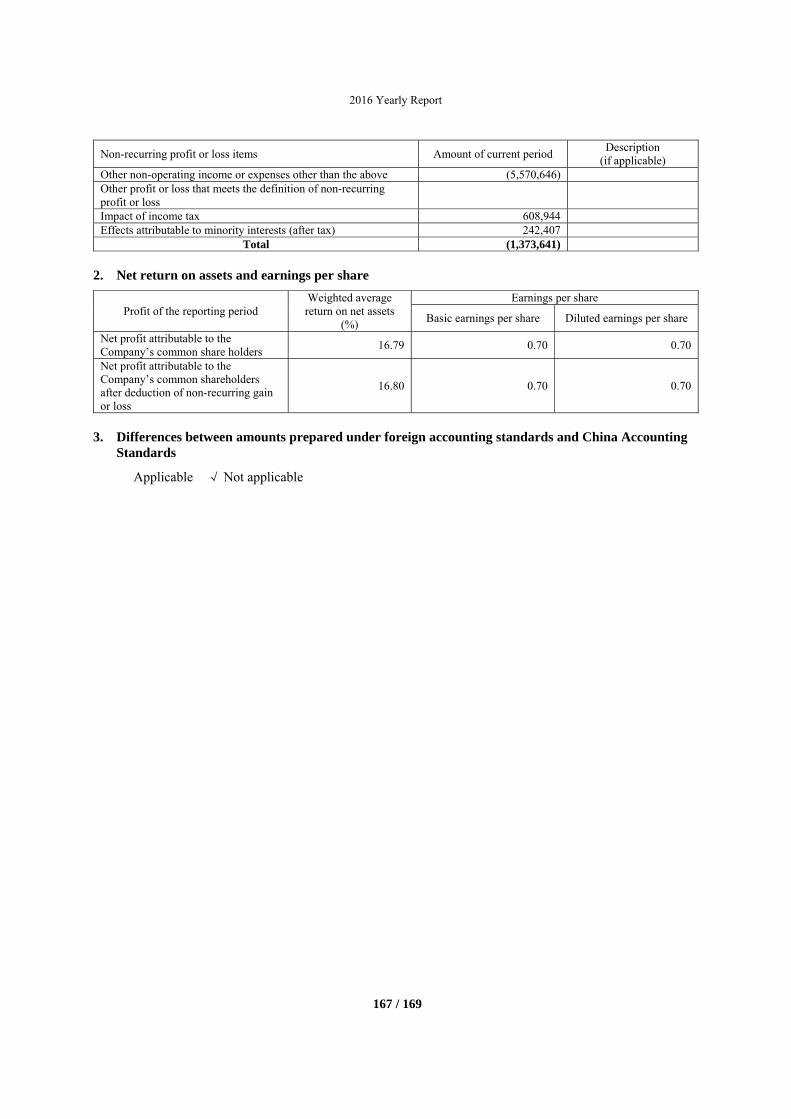
2016 Yearly Report
167 / 169
Non-recurring profit or loss items Amount of current period Description
(if applicable) Other non-operating income or expenses other than the above (5,570,646) Other profit or loss that meets the definition of non-recurring profit or loss
Impact of income tax 608,944 Effects attributable to minority interests (after tax) 242,407
Total (1,373,641)
2. Net return on assets and earnings per share
Profit of the reporting period Weighted average return on net assets
(%)
Earnings per share
Basic earnings per share Diluted earnings per share
Net profit attributable to the Company’s common share holders
16.79 0.70 0.70
Net profit attributable to the Company’s common shareholders after deduction of non-recurring gain or loss
16.80 0.70 0.70
3. Differences between amounts prepared under foreign accounting standards and China Accounting Standards
Applicable √ Not applicable

2016 Yearly Report
168 / 169
Section 12 Bond
Applicable √ Not applicable

2016 Yearly Report
169 / 169
Section 13 Document for Reference
1 Financial statements signed and sealed by principal, person in charge of financial function, person in charge of the financial department.
2 The original copies of all documents and announcements of the Company publicly disclosed in the newspapers designated by the CSRC during the reporting period.
Legal representative: Jean-Marc Dublanc
Approved by the Board for submission on: March 29th, 2017