2016 half-year results investor presentation · 2016 half-year results investor presentation....
TRANSCRIPT

1
16 May 2016
2016 Half-Year Results Investor Presentation
Attached is the investor presentation in connection with the financial results for the 6 month period
ended 31 March 2016.
Elders CEO, Mark Allison, and CFO, Richard Davey, will deliver this presentation by webcast and
simultaneous teleconference at 10.00am (AEST) today.
As advised to the ASX on Thursday 12 May 2016, you can register to view and listen to the live commentary of the presentation by clicking below: Register, view and listen to webcast If you wish to ask a question (or your computer does not have audio) you will need to dial in to a simultaneous teleconference call: Phone: 1800 908 299 Quote conference ID: 418650
The presentation and audio will be archived and available via the Elders Limited website.
Peter Hastings
Company Secretary

2016Half Year ResultsPresentation16 May 2016

FY16 Half Year in ReviewDelivering continued progress
• Statutory net profit after tax of $24.6m up $8.7m
• Underlying net profit after tax of $19.4m up $3.2m
• Underlying EBIT of $25.2m up $3.3m
• Operating cash inflow $13.9m for the half
• Return on capital of 22% up from 18% at March 2015
1

Progress on FY16 Priorities
Operational Performance
Key Relationships
Safety Performance
Efficiency and Growth
$19.4m underlying profit up from $16.2m
ROC at 22%, up 4%
Retail ROC increased from 6% to 12%
Long Haul restructure
36 branches under performance improvement program
Developing online client community for ongoing market research
Integrated national brand campaign
Client focussed online resources (Market Report app, websites, weather app)
Regional sponsorship agreements in key focus regions
Partnership with SwarmFarmTechnology to develop innovative tech solutions
High transparency, communication and engagement with key and potential investors
Refocusing relationships with key suppliers
LTI reduced from 8 to 2 at half year
Developing new safety reporting system
Phase 2 ‘Stand Up Speak Up’ launched
Mental health partnership with North Queensland Cowboys
Controlled underlying cost base
New leadership roles driving Real Estate and Innovation
Review of Banking business efficiency
Launched Elders Grain platform
2 China feeder and slaughter shipments
Elders Insurance acquisition
NSW footprint expansion
Real Estate acquisitions and adjacent businesses
Tasmanian footprint established
New sales offices in China

Half Year Financial Performance
3
$ million 1H FY16Change
1H FY15$m %
Sales revenue 727.8 99.2 15.8% 628.6
Underlying EBIT 25.2 3.3 15.1% 21.9
Underlying finance cost (4.0) 0.9 18.4% (4.9)
Underlying profit after tax 19.4 3.2 19.8% 16.2
Reported profit after tax 24.6 8.7 54.7% 15.9
Operating cash flow 13.9 5.6 67.5% 8.3
Average net debt (144.0) (30.2) 26.5% (113.8)
Average working capital 231.9 33.8 17.1% 198.1
Return on capital (%) 22% 4% 22.2% 18%
Diluted underlying earnings per share (cents) 16.4 5.6 51.9% 10.8

Performance by ProductImproved Retail and Agency performance, offset by underperformance in Live Export
Retail improvement through increased sales activity
Agency upside from continued strong cattle prices and demand for broadacre real estate properties
Margins in the Feed and Processing businesses declined with high cattle prices
Live Export Short Haul markets saw increased competition and declining margins
Controlled underlying costs, offset by higher costs through Eight Point Plan investment
4
16.219.4
6.6
7.4
0.9
(0.5) (1.0)(6.9)
(2.3) (1.0)
1H FY15Underlying
Profit
Retail Products AgencyServices
FinancialServices
Feed &Processing
Services
Live ExportServices
Costs Finance costs Tax & NCI 1H FY16Underlying
Profit
Underlying profit movement$ million
Product margin

Performance by GeographyStrong performance in the Australian geographies, offset by headwinds in International markets
Continued strong cattle prices supported growth across the Australian segments, however adversely impacted earnings of the International businesses through higher input costs
Retail products in northern Australia benefitted from renewed confidence in dryland cotton areas
Strengthening Australian dollar and increased competition placed pressure on the earnings of the International businesses
Benefits from cost reduction activities flowing through Corporate and unallocated costs
5
16.219.4
4.4
4.2
2.1
1.90.9
(9.3)(1.0)
1H FY15Underlying
Profit
NorthernAustralia
SouthernAustralia
WesternAustralia
International Corporate andunallocated
costs
Finance costs Tax & NCI 1H FY16Underlying
Profit
Underlying profit movement$ million

Operating Cash FlowPositive operating cash flow underpinned by strong earnings
Strong underlying EBITDA translated to cash flows for the business
Working capital cash flow usage reflects:
Normal Retail seasonal movements
Higher cattle prices and increased principal cattle in Killara feedlot
Higher debtor balances for Short Haul Live Export resulting from increased volume shipped at half year
6
Retail Agency Financial Feed & Live Other Total
$ million Products Services Services Process Export
Adjusted EBITDA 11.5 26.4 4.0 3.5 (2.6) (16.4) 26.5
Movements in Assets and Liabilities
25.6 (7.8) 1.2 (8.6) (17.0) (2.0) (8.6)
Interest, tax and dividends (4.0) (4.0)
37.1 18.6 5.2 (5.2) (19.6) (22.4) 13.9
26.513.9
25.6
(7.8)1.2
(8.6)
(17.0)
(2.0)(4.0)
EBITDA Retail Agency FinancialServices
Feed &Processing
Live Export Other Interest, taxand
dividends
Operatingcash flow
Operating cash flow$ million

Capital DeployedReturn on capital stable
Working Capital
ROC highlights:
Continued strong Agency earnings, with minimal capital requirement
Retail return improved from 6% to 12%
Offset by reduced return on downstream livestock businesses
Key movements in average working capital from March 2015 relate to:
Increased activity in the Retail business
High livestock prices driving working capital increase in Agency and Feed & Processing businesses
Higher debtor balances for Short Haul Live Export resulting from increased volume shipped for the half
7
Average Working Capital
$ million Mar-15 Sep-15 Mar-16
Retail Products 141.3 150.5 147.8
Agency Services 35.2 31.4 44.2
Feed & Processing Services 29.6 33.1 45.3
Live Export Services 20.1 25.8 28.5
Other (28.1) (25.7) (35.2)
198.1 215.1 230.6
17.8%21.9% 21.9%
Mar 15 Sept 15 Mar-16
Return on Capital

Net DebtKey ratios improving
Increased net debt from March 2015 mainly relates to increased working capital funding requirements
Interest cover has improved with lower interest cost and stronger earnings
Further improvements on leverage and gearing ratios required
8
Key Ratios Mar-15 Sep-15 Mar-16 Change
Leverage [net debt to EBITDA] 2.2 3.3 2.7 (0.5)
Interest cover [EBIT to net interest] 1.9 3.4 5.9 4.0
Gearing [net debt to equity] 73% 122% 93% (20%)
86.8
113.8
136.2
122.4126.0
144.0
At balance date Average YTD
Net debt$ million
At
ba
lan
ced
ate
Ave
rag
e YT
D
Mar-15 Sep-15 Mar-16 Mar-15 Sep-15 Mar-16

Capital StructureCommitted to simplifying capital structure
• Ongoing review of capital structure and options in relation to funding business growth and acquisitions
• Hybrid remarketing process not initiated; 2.5% pa margin step up from 30 June 2016
• Continue to assess options around hybrid capital
• Objective remains to commence dividends for FY17
9

Eight Point Plan
Actions Delivered
Values, Performance & Brand
New leadership roles
WHS improvements
Investment in training and development
Geographical Coverage & Distribution Channels
NSW expansion Established Tasmanian footprint Ongoing branch performance
improvement plan
Retail Products
Capital light programs
Better procurement
Price book improvements
Agency Services
Real Estate leadership and adjacent opportunity growth
Livestock and wool product development
New grain model launched and operating
Financial Services
New General Manager
Elders Insurance acquisition
Productivity review in banking business
Feed & Processing Services
China footprint growth
Killara optimized
Assessment of branded beef opportunities in Asia
Live Export Services
Long Haul restructure
Managing animal welfare throughout supply chain
China feeder and slaughter shipments
Cost, Capital & Efficiency
Controlled cost base
Improved funding structure
Disciplined capital deployment
Successful business acquisitions
10

FY16 OutlookPositive outlook for Australian businesses, with Live Export to remain under pressure
Retail: The winter cropping outlook for northern and western Australia is positive, with average winter crop production expected in southern Australia
Agency: Livestock: Cattle and sheep prices are expected to remain strong due to tight supply and high demand Real Estate: Strong activity in rural real estate is expected to continue with interest rates remaining low and large broadacre
property sales in the pipeline Wool: Revenues and earnings are expected to remain stable for the remainder of the year
Financial Services: Banking: Focus on productivity of workforce Insurance: Acquisition of 10% stake in Elders Insurance is expected to boost earnings in the second half
Feed and Processing: Killara: Margins on principally held cattle will be under pressure with continued high supply costs Indonesia: Peak activity period for the feedlot will occur in the second half, however potential lower than expected cattle
import quotas and high supply prices may present challenges China: Sales activity is expected to increase through new customers and geographical expansion
Live Export: Short Haul: Increased competition and higher supply costs will continue to put pressure on earnings, particularly in Vietnam Long Haul: China feeder slaughter opportunity to become clearer over the next 6 months
Cost and Capital: Investment in strategy and growth initiatives will increase cost and capital usage; albeit continued focus on base cost and improvement in productivity measures
11

Pathway to FY17 Target On track to meet EBIT $60m and ROC 20% target
Declining livestock herd
Challenging Live Export conditions
Margin pressures for Feed and Processing
Livestock prices remain strong
Potential China feeder and slaughter live export market
Increased access to critical west Australian fertiliser market
Strong pipeline of organic and acquisition growth opportunities
Tailwinds
Headwinds
12

Appendix
13

Business Segmentation
$ millionNorthernAustralia
Southern Australia
Western Australia
International Geographies
1H FY16 Margin
Average Working Capital
Retail Products Farm Supplies and Fertiliser 53.1 147.8
Agency Services Livestock, Real Estate, Wool, and Grain 74.6 44.2
Financial Services Banking, Insurance and Financial Planning 12.0 -
Feed & Processing Services
KillaraFeedlot
IndonesiaChina
8.6 45.3
Live Export ServicesShort HaulLong Haul
0.5 28.5
1H FY16 Margin 55.3 66.1 24.1 3.3 148.8
14
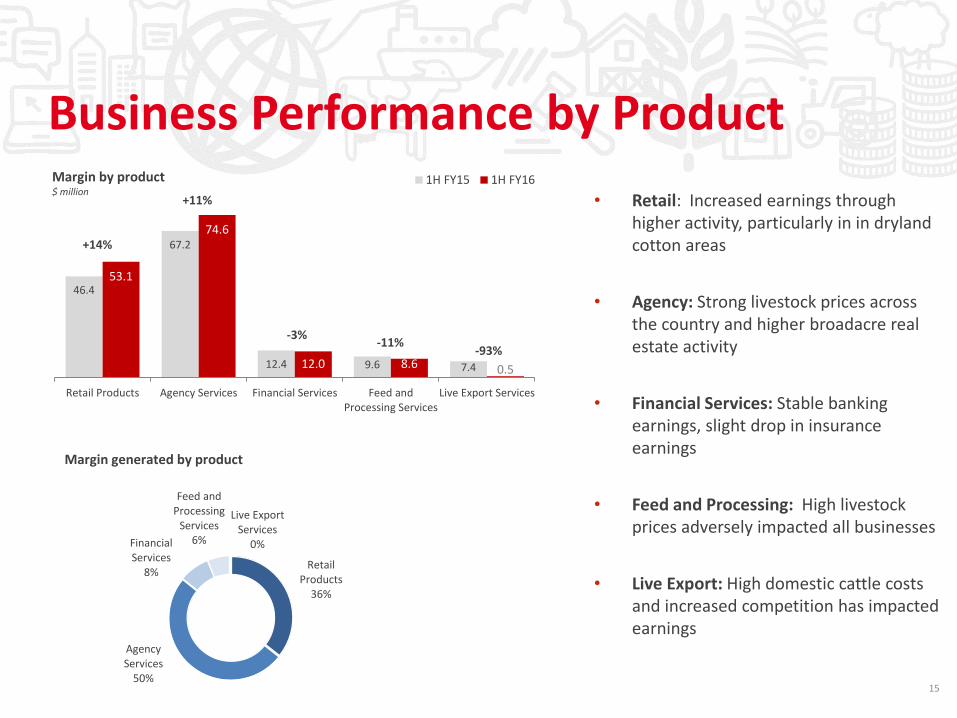
Business Performance by Product
• Retail: Increased earnings through higher activity, particularly in in dryland cotton areas
• Agency: Strong livestock prices across the country and higher broadacre real estate activity
• Financial Services: Stable banking earnings, slight drop in insurance earnings
• Feed and Processing: High livestock prices adversely impacted all businesses
• Live Export: High domestic cattle costs and increased competition has impacted earnings
15
46.4
67.2
12.4 9.6 7.4
53.1
74.6
12.0 8.6 0.5
Retail Products Agency Services Financial Services Feed andProcessing Services
Live Export Services
1H FY15 1H FY16
+11%
-3%-11%
-93%
Margin by product$ million
+14%
Retail Products
36%
Agency Services
50%
Financial Services
8%
Feed and Processing
Services6%
Live Export Services
0%
Margin generated by product

Business Performance by Geography
• North: Increase driven by strong livestock volume and prices, higher broadacre real estate activity and improvement in farm supplies in cotton growing regions
• South: Increase driven by strong livestock prices, higher broadacre real estate activity and improved fertiliser margins
• West: Strong cattle prices and broadacreresidential real estate
• International: High input costs and maturing markets have impacted earnings
16
49.6
61.5
20.9
11.0
55.3
66.1
24.1
3.3
Northern Australia Southern Australia Western Australia International
1H FY15 1H FY16
+11%
+7%
+15%
-70%
Margin by geography$ million
Northern Australia
37%
Southern Australia
45%
Western Australia
16%
International2%
Margin generated by geography
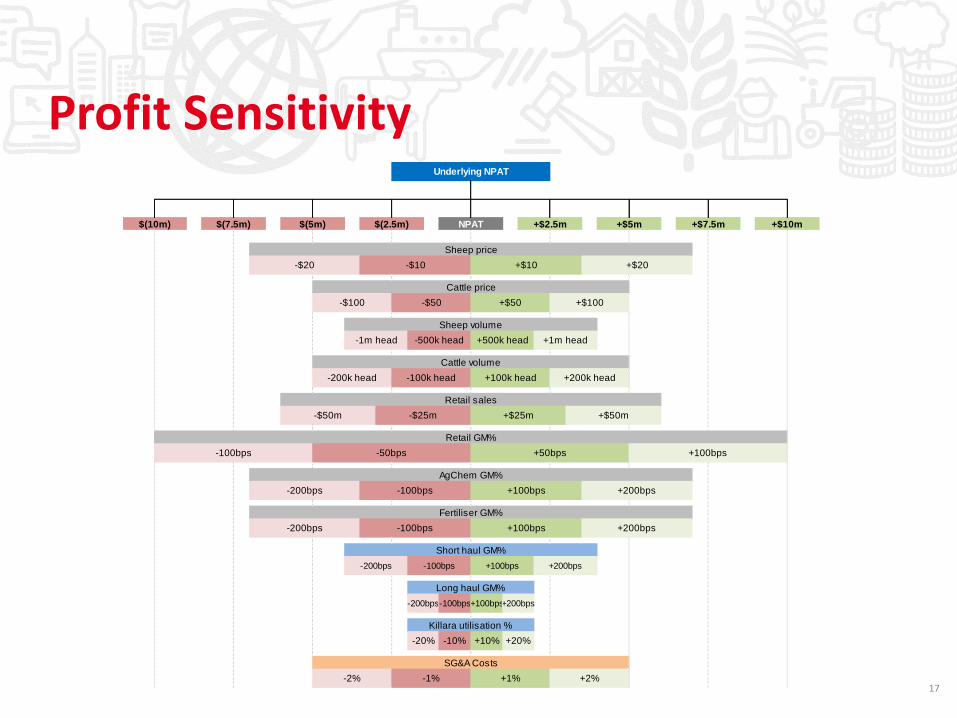
Profit Sensitivity
17
Underlying NPAT
$(10m) $(7.5m) $(5m) $(2.5m) NPAT +$2.5m +$5m +$7.5m +$10m
Sheep price
-$20 -$10 +$10 +$20
Cattle price
-$100 -$50 +$50 +$100
Sheep volume
-1m head -500k head +500k head +1m head
Cattle volume
-200k head -100k head +100k head +200k head
Retail sales
-$50m -$25m +$25m +$50m
Retail GM%
-100bps -50bps +50bps +100bps
AgChem GM%
-200bps -100bps +100bps +200bps
Fertiliser GM%
-200bps -100bps +100bps +200bps
Short haul GM%
-200bps -100bps +100bps +200bps
Long haul GM%
-200bps-100bps+100bps+200bps
Killara utilisation %
-20% -10% +10% +20%
SG&A Costs
-2% -1% +1% +2%

Points of PresenceElders’ footprint in Australian agriculture
• Over 440 points of presence in Australia and overseas including full service branches, real estate and insurance franchises
• Key produce areas covered through our footprint
• Focus on improving reach into horticulture and sugar segments
18


Forward looking statements
This presentation is prepared for informational purposes only. It contains forward looking statements that are subject to risk factors associated with the agriculture industry many of which are beyond the control of Elders. Elders’ future financial results will be highly dependent on the outlook and prospect of the Australian farm sector, and the values and volume growth in internationally traded livestock and fibre. Financial performance for the operations is heavily reliant on, but not limited to, the following factors: weather and rainfall conditions; commodity prices and international trade relations. Whilst every endeavour has been made to ensure the reasonableness of forward looking statements contained in this presentation, they do not constitute a representation and no reliance should be placed on those statements.
Non-IFRS information
This presentation refers to and discusses underlying profit to enable analysis of like-for-like performance between periods, excluding the impact of discontinued operations or events which are not related to ongoing operating performance. Underlying profit measures reported by the Company have been calculated in accordance with the FINSIA/AICD principles for the reporting of underlying profit. Underlying profit is non-IFRS financial information and has not been subject to review by the external auditors, but is derived from audited accounts by removing the impact of discontinued operations and items not considered to be related to ongoing operating performance.
Disclaimer and Important Information