2016 healthcare staffing survey report - nsi · 2016 healthcare staffing survey report ... (sia)...
TRANSCRIPT
Permanent Nurses, Permanent Solutions!
Nursing Solutions, inc
3/23/2016 NSI Proprietary & Confidential www.nsinursingsolutions.com
2016
HEALTHCARE STAFFING SURVEY REPORT
Top Challenges…
Impact of the Nursing Shortage on:
Recruitment, Staffing, Turnover,
Labor Costs, Savings, ROI & Strategies
Permanent Nurses, Permanent Solutions!
Nursing Solutions, inc
3/23/2016 NSI Proprietary & Confidential www.nsinursingsolutions.com
NSI Ninth Annual National Survey:
• This survey and its resulting report consists of information on:
• Nursing Workforce data and trends,
• Impact of the Nursing Shortage on Hospitals,
• Vacancy Rates and Staffing Forecast,
• RN Recruitment Metrics,
• Recruitment & Staffing strategies with effectiveness ratings,
• RN Turnover Rates and Cost,
• Healthcare Economics and Financial Impact, and
• Cost of RN Contract Labor.
• Hospitals Surveyed: 3,451
• Participating Hospitals: 838 (24.3%)
* In keeping with our promise of confidentiality, all participant information, data and worksheets have been purged.
Permanent Nurses, Permanent Solutions!
Nursing Solutions, inc
3/23/2016 NSI Proprietary & Confidential www.nsinursingsolutions.com
Hospitals see shortages NOW!
• Over 77% of hospitals rated the staffing of MDs, RNs and Allied Health Professionals as a top priority for 2017, with agency staffing expected to rise 6%. (SIA)
• 42% of employers plan to add more contract staff. (Harris)
• 45% plan to convert contract staff to permanent staff. (SIA)
• The agency penetration rate is forecasted to rise, which explains why 80% of organizations are willing to increase salaries for existing staff and 64% will increase starting salaries.
• 62% of hospitals plan a 3-4% increase
• 12% plan a 5-9% increase
• 6% plan a 10%+ increase. (SIA)
• 67% of hospitals report RN agency use rising, as reflected by the contract labor index, and is expected to grow 6% per year thru 2018. Therefore, it is no wonder that the forecasted 2016 average travel nurse fee to rise to $68.75/hr, ranging $57.10 to $91.25/hr. This represents, in many instances, more than 2X the average employed RN cost.
Permanent Nurses, Permanent Solutions!
Nursing Solutions, inc
3/23/2016 NSI Proprietary & Confidential www.nsinursingsolutions.com
What could go wrong?• There are 78 million Baby Boomers. Since 2011, every 7.6 seconds another
individual turns 65 years old. This segment represents 12% of the population
but, consume 34% of healthcare services.
• The ANA estimates that 23% or 187,200 RNs plan to retire in the next 2-3
years, and an additional 81,900 will switch to part time status. In total, it is
estimated that 269,100 RNs will exit the work force or reduce hours.
• In addition, the rising demand for Advance Practice Nurses can draw another
198,000 RNs from the bed side.
• The 2016 – 2017 nursing shortage is projected to be up to 327,000 RNs.
This includes the number of GNs expected to pass the NCLEX (140,000).
Sources: McMenamin, Peter, RN Retirements--Tsunami Warning! Nurse Space, ANA, 3/14/14; BLS, FierceHealthcare,
AONE Discussion,
Permanent Nurses, Permanent Solutions!
Nursing Solutions, inc
3/23/2016 NSI Proprietary & Confidential www.nsinursingsolutions.com
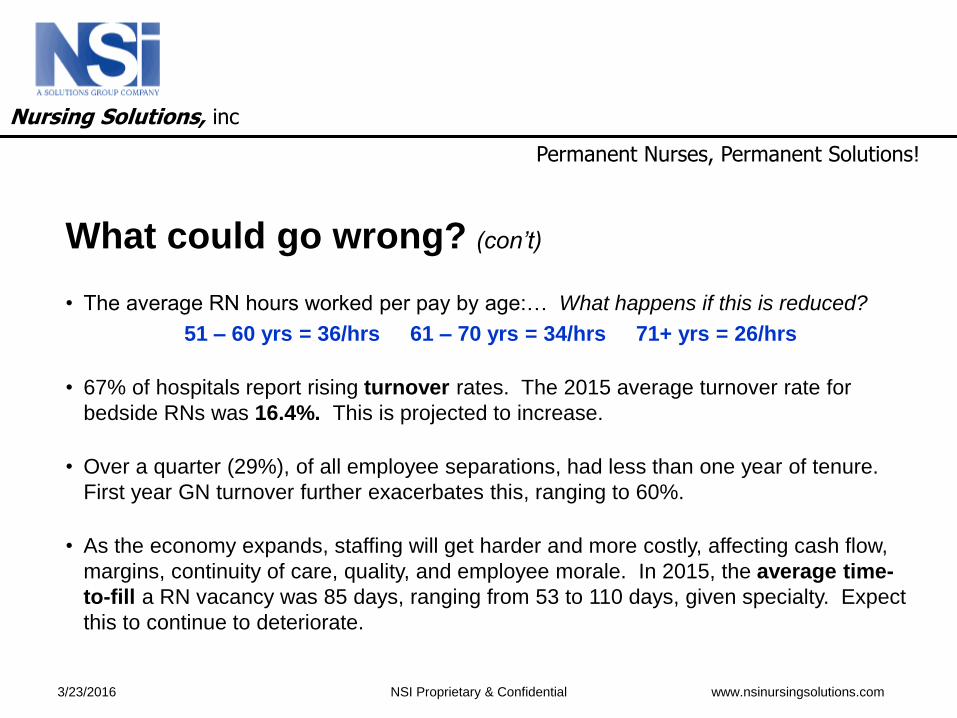
What could go wrong? (con’t)
• The average RN hours worked per pay by age:… What happens if this is reduced?
51 – 60 yrs = 36/hrs 61 – 70 yrs = 34/hrs 71+ yrs = 26/hrs
• 67% of hospitals report rising turnover rates. The 2015 average turnover rate for
bedside RNs was 16.4%. This is projected to increase.
• Over a quarter (29%), of all employee separations, had less than one year of tenure.
First year GN turnover further exacerbates this, ranging to 60%.
• As the economy expands, staffing will get harder and more costly, affecting cash flow,
margins, continuity of care, quality, and employee morale. In 2015, the average time-
to-fill a RN vacancy was 85 days, ranging from 53 to 110 days, given specialty. Expect
this to continue to deteriorate.
Permanent Nurses, Permanent Solutions!
Nursing Solutions, inc
3/23/2016 NSI Proprietary & Confidential www.nsinursingsolutions.com
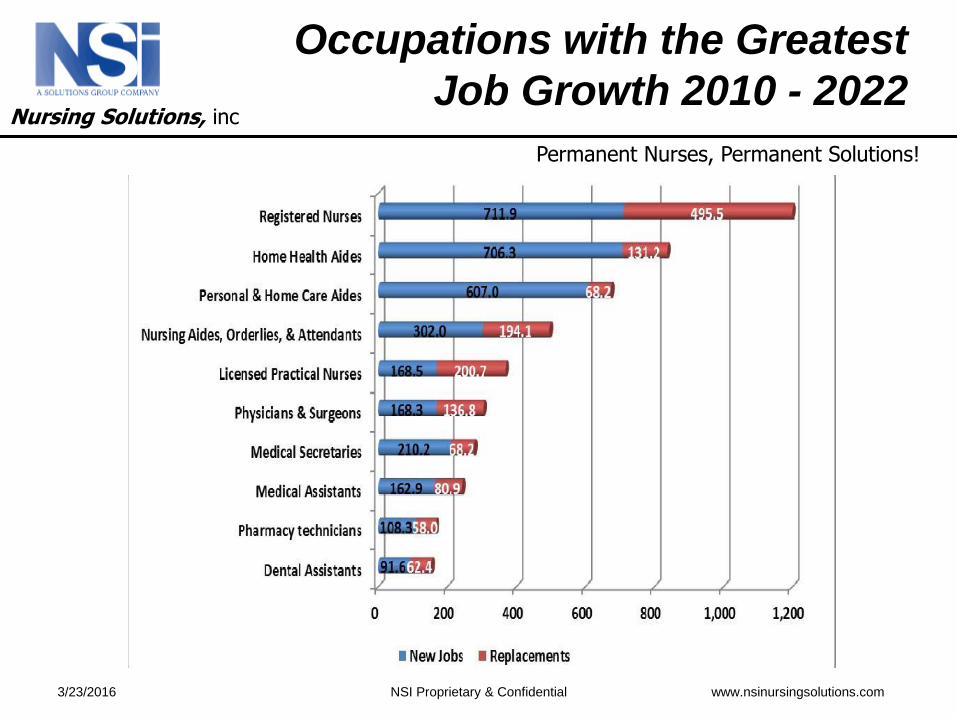
Occupations with the Greatest
Job Growth 2010 - 2022
Permanent Nurses, Permanent Solutions!
Nursing Solutions, inc
3/23/2016 NSI Proprietary & Confidential www.nsinursingsolutions.com
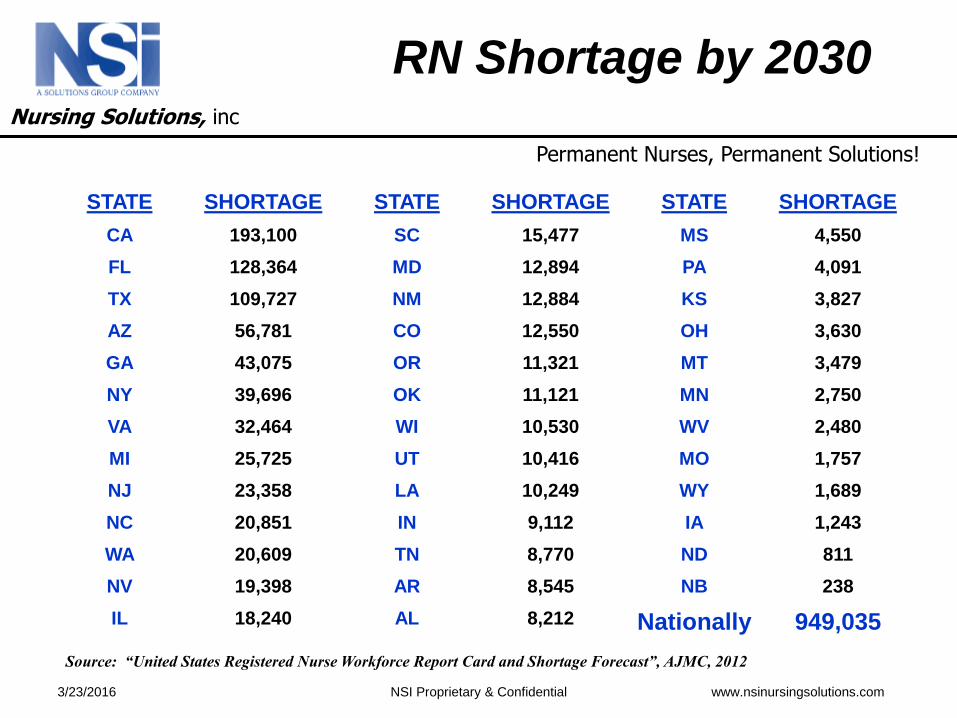
RN Shortage by 2030
STATE SHORTAGE STATE SHORTAGE STATE SHORTAGE
CA 193,100 SC 15,477 MS 4,550
FL 128,364 MD 12,894 PA 4,091
TX 109,727 NM 12,884 KS 3,827
AZ 56,781 CO 12,550 OH 3,630
GA 43,075 OR 11,321 MT 3,479
NY 39,696 OK 11,121 MN 2,750
VA 32,464 WI 10,530 WV 2,480
MI 25,725 UT 10,416 MO 1,757
NJ 23,358 LA 10,249 WY 1,689
NC 20,851 IN 9,112 IA 1,243
WA 20,609 TN 8,770 ND 811
NV 19,398 AR 8,545 NB 238
IL 18,240 AL 8,212 Nationally 949,035
Source: “United States Registered Nurse Workforce Report Card and Shortage Forecast”, AJMC, 2012
Permanent Nurses, Permanent Solutions!
Nursing Solutions, inc
3/23/2016 NSI Proprietary & Confidential www.nsinursingsolutions.com
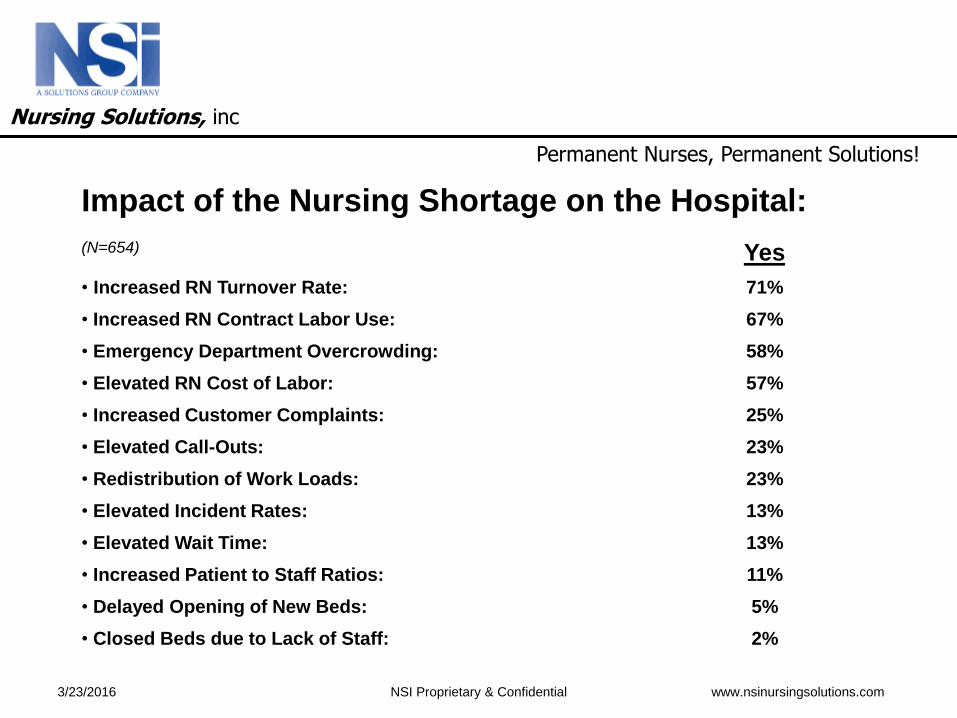
Impact of the Nursing Shortage on the Hospital:
(N=654) Yes
• Increased RN Turnover Rate: 71%
• Increased RN Contract Labor Use: 67%
• Emergency Department Overcrowding: 58%
• Elevated RN Cost of Labor: 57%
• Increased Customer Complaints: 25%
• Elevated Call-Outs: 23%
• Redistribution of Work Loads: 23%
• Elevated Incident Rates: 13%
• Elevated Wait Time: 13%
• Increased Patient to Staff Ratios: 11%
• Delayed Opening of New Beds: 5%
• Closed Beds due to Lack of Staff: 2%
Permanent Nurses, Permanent Solutions!
Nursing Solutions, inc
3/23/2016 NSI Proprietary & Confidential www.nsinursingsolutions.com
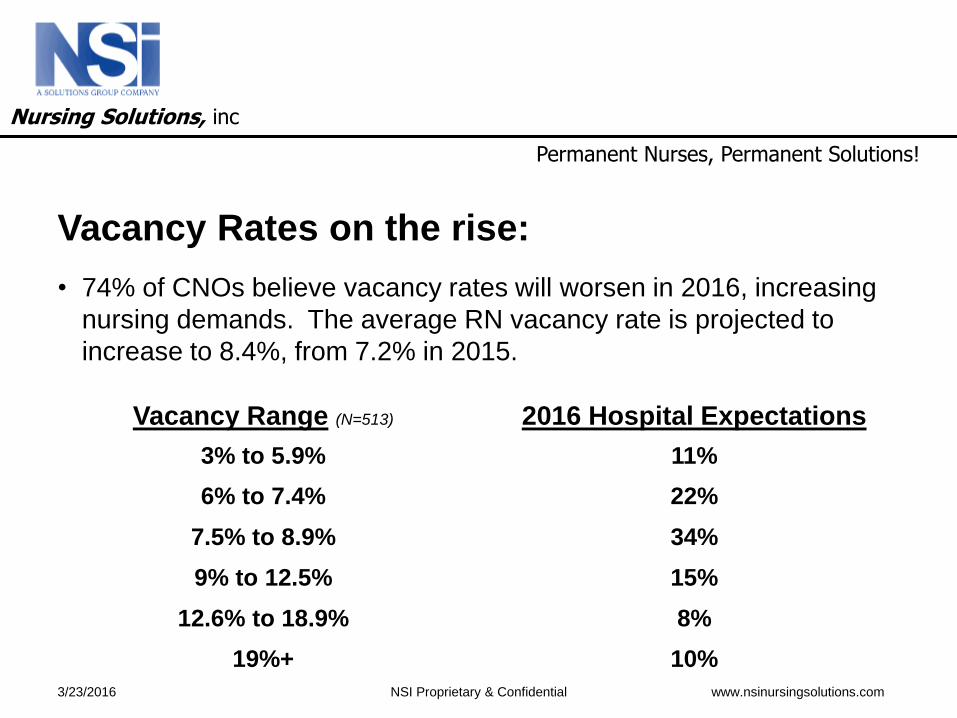
Vacancy Rates on the rise:
• 74% of CNOs believe vacancy rates will worsen in 2016, increasing
nursing demands. The average RN vacancy rate is projected to
increase to 8.4%, from 7.2% in 2015.
Vacancy Range (N=513) 2016 Hospital Expectations
3% to 5.9% 11%
6% to 7.4% 22%
7.5% to 8.9% 34%
9% to 12.5% 15%
12.6% to 18.9% 8%
19%+ 10%
Permanent Nurses, Permanent Solutions!
Nursing Solutions, inc
3/23/2016 NSI Proprietary & Confidential www.nsinursingsolutions.com
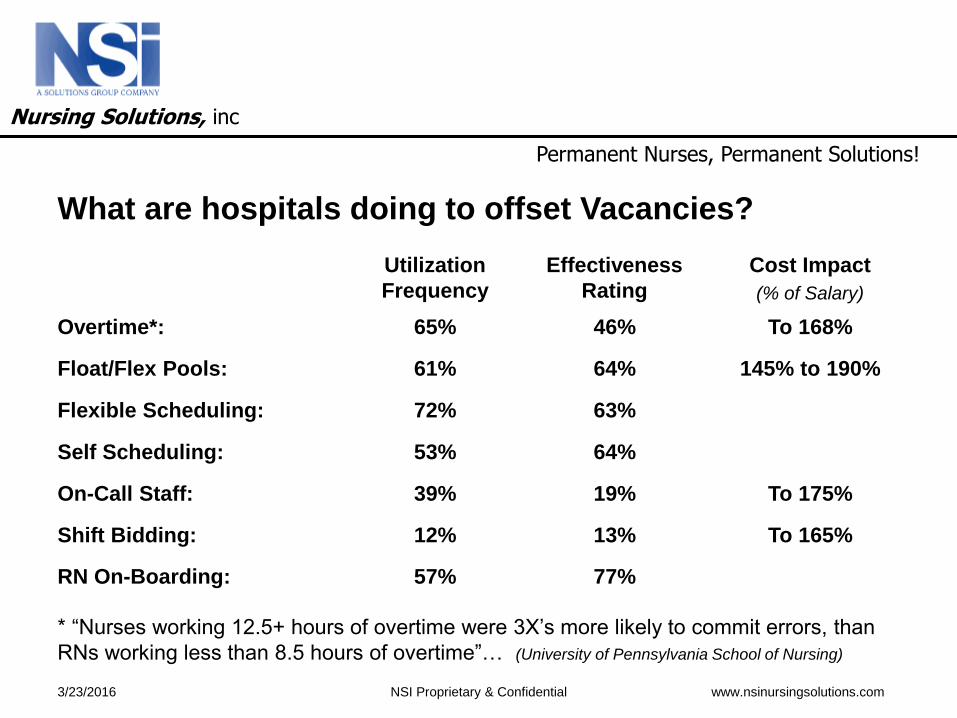
What are hospitals doing to offset Vacancies?
Utilization
Frequency
Effectiveness
Rating
Cost Impact
(% of Salary)
Overtime*: 65% 46% To 168%
Float/Flex Pools: 61% 64% 145% to 190%
Flexible Scheduling: 72% 63%
Self Scheduling: 53% 64%
On-Call Staff: 39% 19% To 175%
Shift Bidding: 12% 13% To 165%
RN On-Boarding: 57% 77%
* “Nurses working 12.5+ hours of overtime were 3X’s more likely to commit errors, than
RNs working less than 8.5 hours of overtime”… (University of Pennsylvania School of Nursing)
Permanent Nurses, Permanent Solutions!
Nursing Solutions, inc
3/23/2016 NSI Proprietary & Confidential www.nsinursingsolutions.com
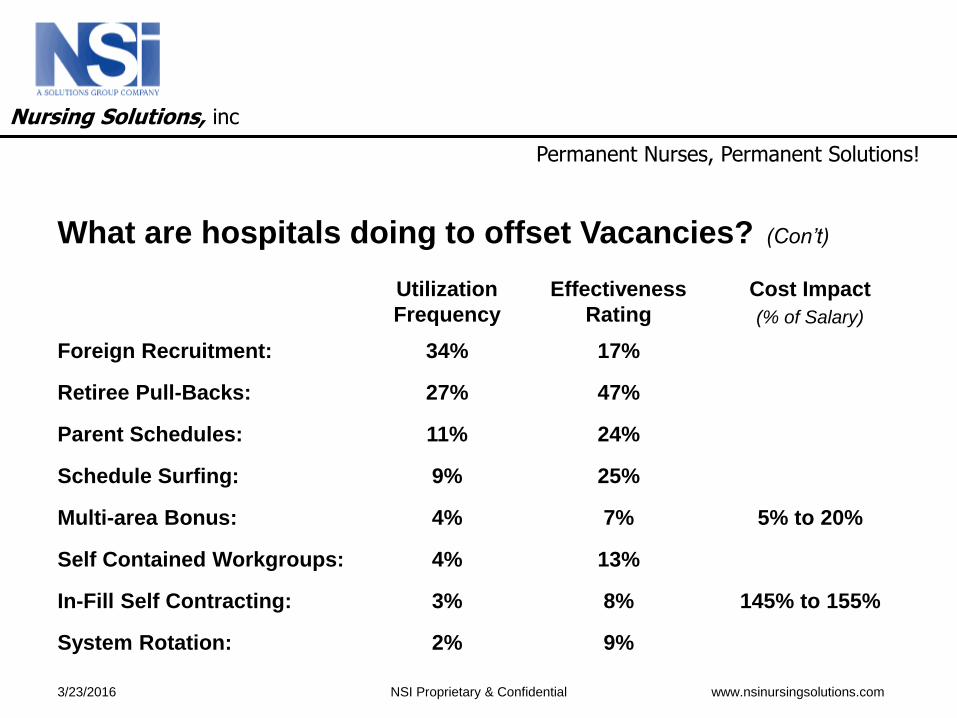
What are hospitals doing to offset Vacancies? (Con’t)
Utilization
Frequency
Effectiveness
Rating
Cost Impact
(% of Salary)
Foreign Recruitment: 34% 17%
Retiree Pull-Backs: 27% 47%
Parent Schedules: 11% 24%
Schedule Surfing: 9% 25%
Multi-area Bonus: 4% 7% 5% to 20%
Self Contained Workgroups: 4% 13%
In-Fill Self Contracting: 3% 8% 145% to 155%
System Rotation: 2% 9%
Permanent Nurses, Permanent Solutions!
Nursing Solutions, inc
3/23/2016 NSI Proprietary & Confidential www.nsinursingsolutions.com
Nurse Overtime is more cost effective than Agency Nursing:
• According to Columbia University School of Nursing “…use of employed more experienced RNs give higher quality of care.”
• The study showed the use of overtime as more cost effective “since the use of overtime fostered continuity of RN staffing, over the use of agency staffing nurses.”
• Unfortunately, overtime use to resolve vacancies also pushes increased RN turnover, negatively impacting cost and quality.
• The cost of overtime runs 165% to 173% of straight time pay. (Social Security, Taxes, Healthcare, Pension, Life Ins, other Benefit cost roll-ups)
• Shorter LOS indicates not only better quality, but more cost effectiveness due to overtime as compared to using agency RNs. Contract nursing can ...increase costs by as much as 2X the cost of a regular RN.
Sources: Nurse.com, SIA, Bloomberg, BLS; HRSA
Permanent Nurses, Permanent Solutions!
Nursing Solutions, inc
3/23/2016 NSI Proprietary & Confidential www.nsinursingsolutions.com
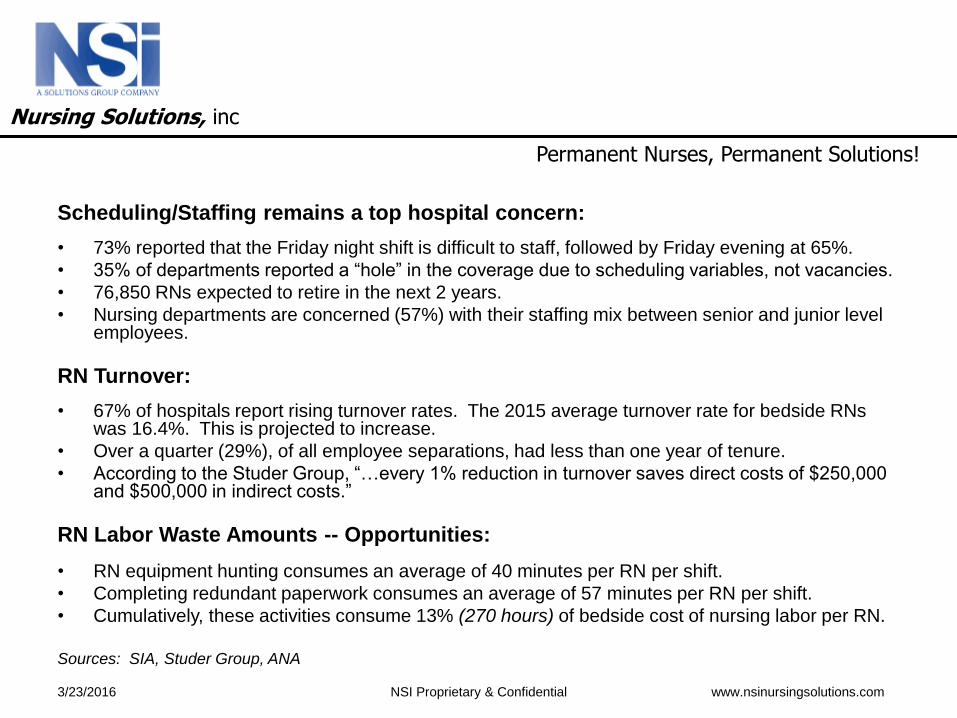
Scheduling/Staffing remains a top hospital concern:
• 73% reported that the Friday night shift is difficult to staff, followed by Friday evening at 65%.
• 35% of departments reported a “hole” in the coverage due to scheduling variables, not vacancies.
• 76,850 RNs expected to retire in the next 2 years.
• Nursing departments are concerned (57%) with their staffing mix between senior and junior level employees.
RN Turnover:
• 67% of hospitals report rising turnover rates. The 2015 average turnover rate for bedside RNs was 16.4%. This is projected to increase.
• Over a quarter (29%), of all employee separations, had less than one year of tenure.
• According to the Studer Group, “…every 1% reduction in turnover saves direct costs of $250,000 and $500,000 in indirect costs.”
RN Labor Waste Amounts -- Opportunities:
• RN equipment hunting consumes an average of 40 minutes per RN per shift.
• Completing redundant paperwork consumes an average of 57 minutes per RN per shift.
• Cumulatively, these activities consume 13% (270 hours) of bedside cost of nursing labor per RN.
Sources: SIA, Studer Group, ANA
Permanent Nurses, Permanent Solutions!
Nursing Solutions, inc
3/23/2016 NSI Proprietary & Confidential www.nsinursingsolutions.com
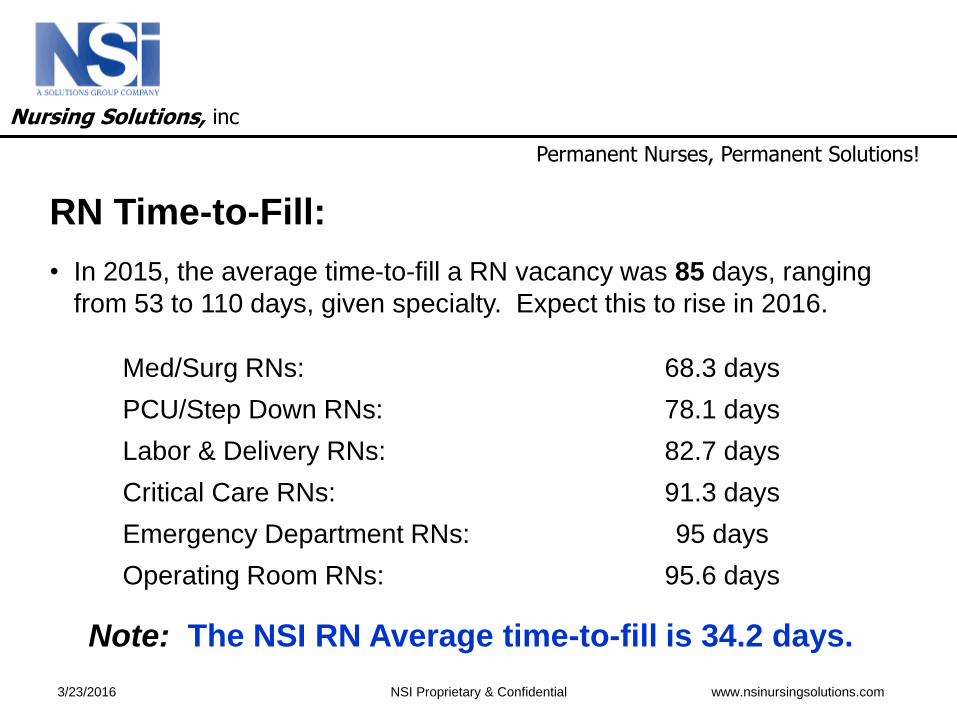
RN Time-to-Fill:
• In 2015, the average time-to-fill a RN vacancy was 85 days, ranging
from 53 to 110 days, given specialty. Expect this to rise in 2016.
Med/Surg RNs: 68.3 days
PCU/Step Down RNs: 78.1 days
Labor & Delivery RNs: 82.7 days
Critical Care RNs: 91.3 days
Emergency Department RNs: 95 days
Operating Room RNs: 95.6 days
Note: The NSI RN Average time-to-fill is 34.2 days.
Permanent Nurses, Permanent Solutions!
Nursing Solutions, inc
3/23/2016 NSI Proprietary & Confidential www.nsinursingsolutions.com
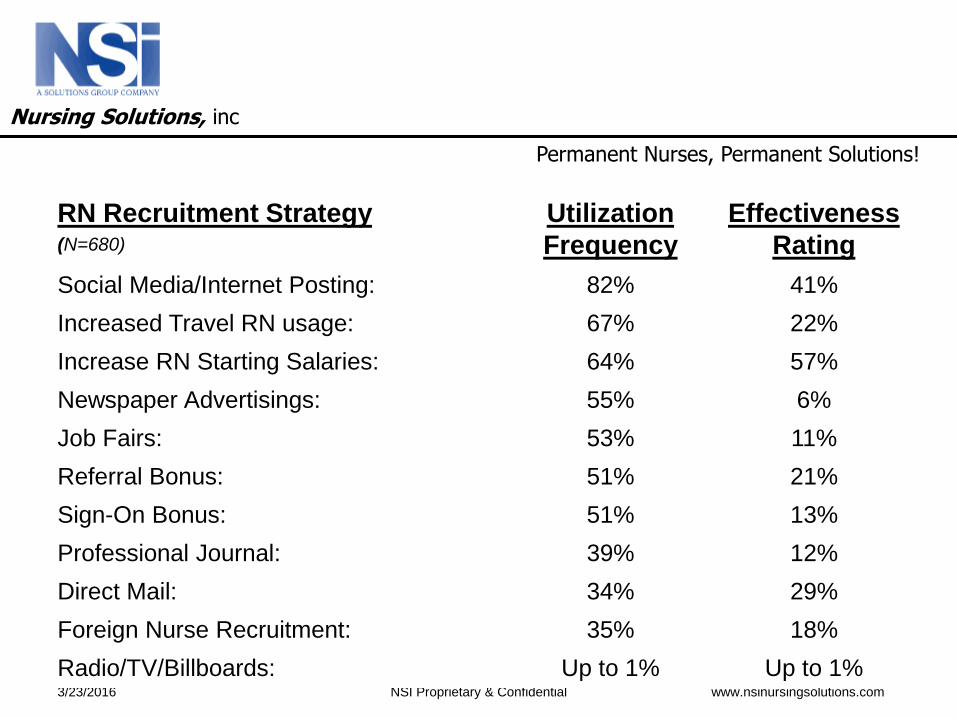
RN Recruitment Strategy(N=680)
Utilization
Frequency
Effectiveness
Rating
Social Media/Internet Posting: 82% 41%
Increased Travel RN usage: 67% 22%
Increase RN Starting Salaries: 64% 57%
Newspaper Advertisings: 55% 6%
Job Fairs: 53% 11%
Referral Bonus: 51% 21%
Sign-On Bonus: 51% 13%
Professional Journal: 39% 12%
Direct Mail: 34% 29%
Foreign Nurse Recruitment: 35% 18%
Radio/TV/Billboards: Up to 1% Up to 1%
Permanent Nurses, Permanent Solutions!
Nursing Solutions, inc
3/23/2016 NSI Proprietary & Confidential www.nsinursingsolutions.com
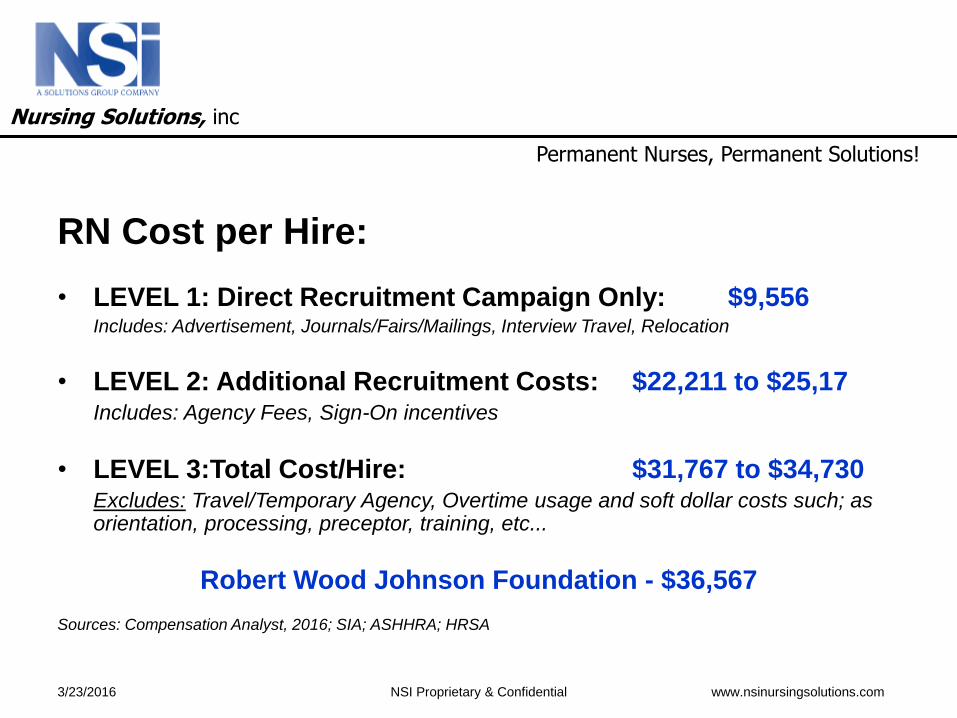
RN Cost per Hire:
• LEVEL 1: Direct Recruitment Campaign Only: $9,556Includes: Advertisement, Journals/Fairs/Mailings, Interview Travel, Relocation
• LEVEL 2: Additional Recruitment Costs: $22,211 to $25,17Includes: Agency Fees, Sign-On incentives
• LEVEL 3:Total Cost/Hire: $31,767 to $34,730Excludes: Travel/Temporary Agency, Overtime usage and soft dollar costs such; as orientation, processing, preceptor, training, etc...
Robert Wood Johnson Foundation - $36,567
Sources: Compensation Analyst, 2016; SIA; ASHHRA; HRSA
Permanent Nurses, Permanent Solutions!
Nursing Solutions, inc
3/23/2016 NSI Proprietary & Confidential www.nsinursingsolutions.com
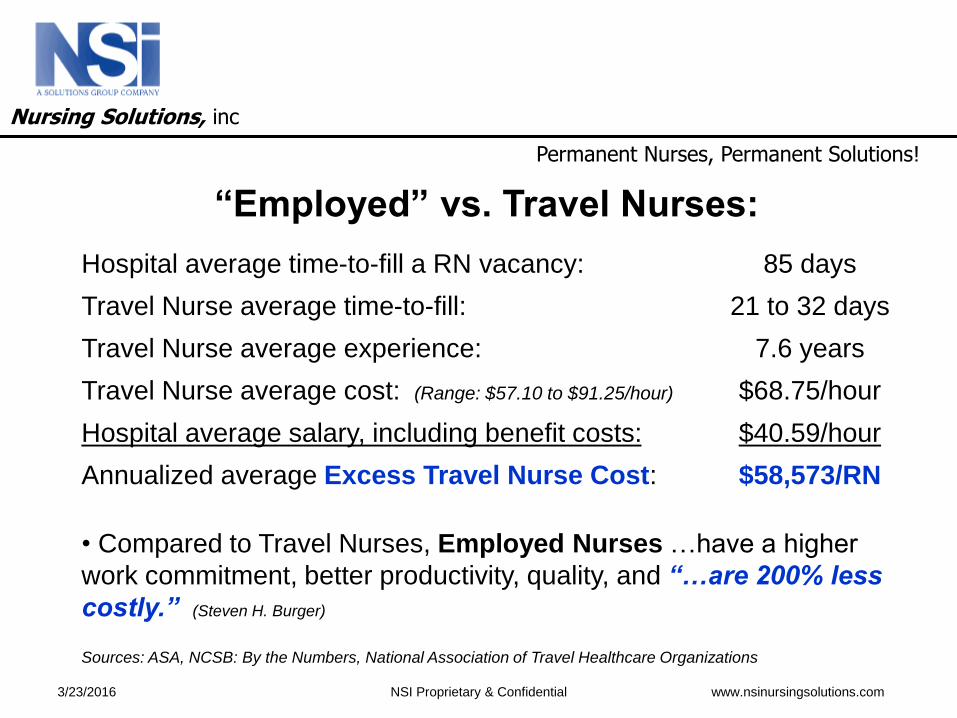
“Employed” vs. Travel Nurses:
Hospital average time-to-fill a RN vacancy: 85 days
Travel Nurse average time-to-fill: 21 to 32 days
Travel Nurse average experience: 7.6 years
Travel Nurse average cost: (Range: $57.10 to $91.25/hour) $68.75/hour
Hospital average salary, including benefit costs: $40.59/hour
Annualized average Excess Travel Nurse Cost: $58,573/RN
• Compared to Travel Nurses, Employed Nurses …have a higher
work commitment, better productivity, quality, and “…are 200% less
costly.” (Steven H. Burger)
Sources: ASA, NCSB: By the Numbers, National Association of Travel Healthcare Organizations
Permanent Nurses, Permanent Solutions!
Nursing Solutions, inc
3/23/2016 NSI Proprietary & Confidential www.nsinursingsolutions.com
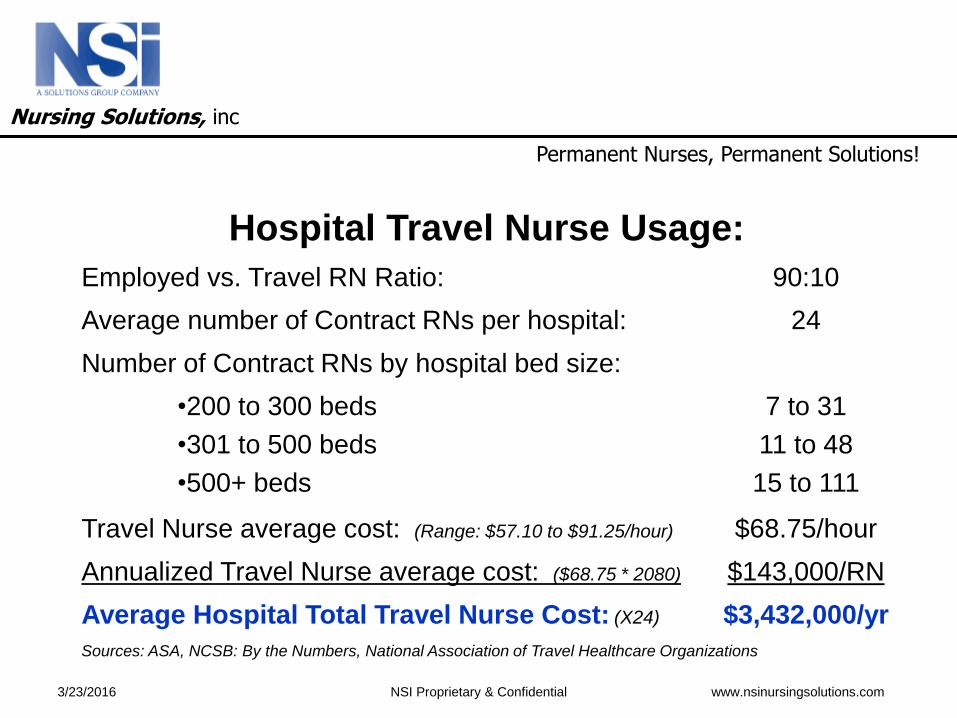
Hospital Travel Nurse Usage:
Employed vs. Travel RN Ratio: 90:10
Average number of Contract RNs per hospital: 24
Number of Contract RNs by hospital bed size:
•200 to 300 beds
•301 to 500 beds
•500+ beds
7 to 31
11 to 48
15 to 111
Travel Nurse average cost: (Range: $57.10 to $91.25/hour) $68.75/hour
Annualized Travel Nurse average cost: ($68.75 * 2080) $143,000/RN
Average Hospital Total Travel Nurse Cost: (X24) $3,432,000/yr
Sources: ASA, NCSB: By the Numbers, National Association of Travel Healthcare Organizations
Permanent Nurses, Permanent Solutions!
Nursing Solutions, inc
3/23/2016 NSI Proprietary & Confidential www.nsinursingsolutions.com
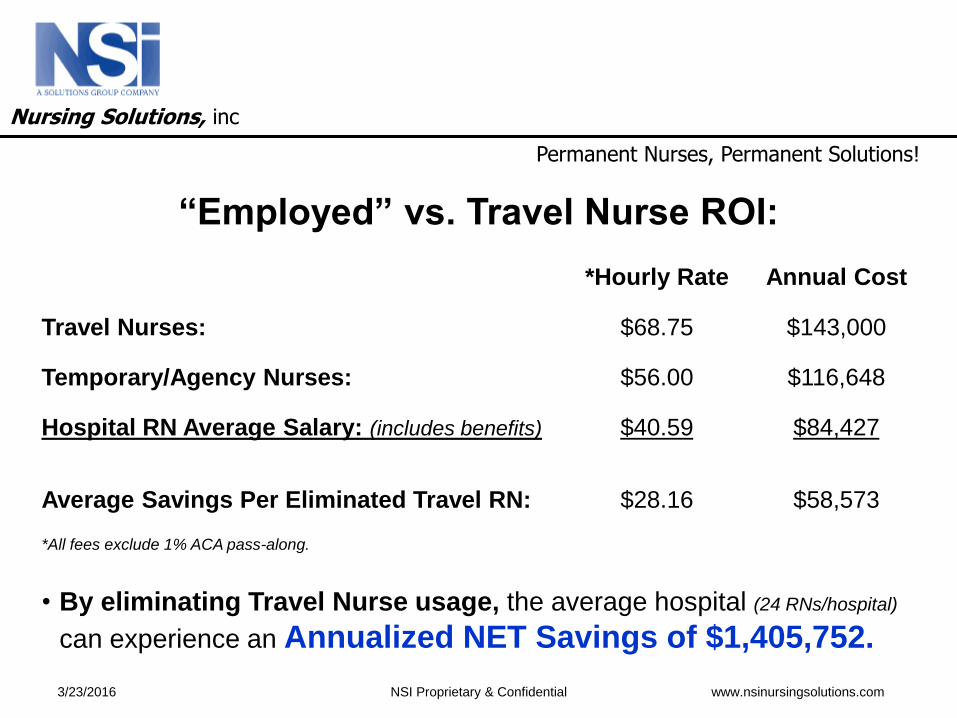
“Employed” vs. Travel Nurse ROI:
*Hourly Rate Annual Cost
Travel Nurses: $68.75 $143,000
Temporary/Agency Nurses: $56.00 $116,648
Hospital RN Average Salary: (includes benefits) $40.59 $84,427
Average Savings Per Eliminated Travel RN: $28.16 $58,573
*All fees exclude 1% ACA pass-along.
• By eliminating Travel Nurse usage, the average hospital (24 RNs/hospital)
can experience an Annualized NET Savings of $1,405,752.
Permanent Nurses, Permanent Solutions!
Nursing Solutions, inc
3/23/2016 NSI Proprietary & Confidential www.nsinursingsolutions.com
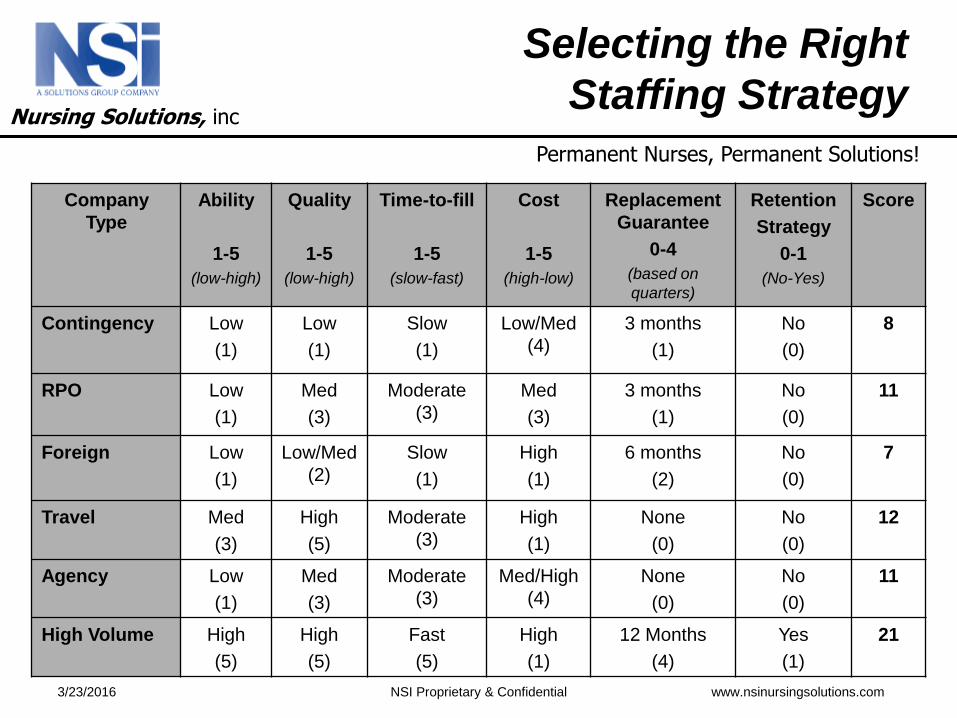
Selecting the Right
Staffing Strategy
Company
Type
Ability
1-5
(low-high)
Quality
1-5
(low-high)
Time-to-fill
1-5
(slow-fast)
Cost
1-5
(high-low)
Replacement
Guarantee
0-4
(based on
quarters)
Retention
Strategy
0-1
(No-Yes)
Score
Contingency Low
(1)
Low
(1)
Slow
(1)
Low/Med
(4)
3 months
(1)
No
(0)
8
RPO Low
(1)
Med
(3)
Moderate
(3)
Med
(3)
3 months
(1)
No
(0)
11
Foreign Low
(1)
Low/Med
(2)
Slow
(1)
High
(1)
6 months
(2)
No
(0)
7
Travel Med
(3)
High
(5)
Moderate
(3)
High
(1)
None
(0)
No
(0)
12
Agency Low
(1)
Med
(3)
Moderate
(3)
Med/High
(4)
None
(0)
No
(0)
11
High Volume High
(5)
High
(5)
Fast
(5)
High
(1)
12 Months
(4)
Yes
(1)
21
Permanent Nurses, Permanent Solutions!
Nursing Solutions, inc
3/23/2016 NSI Proprietary & Confidential www.nsinursingsolutions.com
Why NSI?
• NSI is a high volume nurse recruitment firm; that only recruits within the continental U.S. for “Experienced RNs”, as your core staff.
• NSI utilizes a full service executive search model.
• Focus is on cultural fit and core competencies to enhance retention capacity. NSI first year retention rate of 94.2%.
• Founded in 2000, NSI continues to lead the industry:• Proven success rate with an average time-to-fill of 34 days.
• High quality; with an 82% interview-to-offer rate and an average RN experience rate of 14.5 years.
• One (1) year replacement guarantee.
• All NSI engagements are “Risk Free” since you must hire the nurse before NSI is paid.