2016–17 basin-scale evaluation of commonwealth ... · the hydrology evaluation underpins the...
TRANSCRIPT
2016-17 Hydrology Report Final2016-17 Hydrology Report Final 1
2016–17 Basin-scale evaluation of Commonwealth environmental water – Hydrology
Prepared by: Michael Stewardson and Fiorenzo Guarino
Final Report
La Trobe Publication 188/2018
2016–17 Basin–scale evaluation of Commonwealth environmental water – Hydrology i
2016-17 Basin scale evaluation of Commonwealth environmental water – Hydrology
Final Report prepared for the Commonwealth Environmental Water Office (CEWO) by La Trobe University
For further information contact:
Nick Bond
La Trobe University PO Box 991 Wodonga VIC 3689
Ph: (02) 6024 9650
Email: [email protected] Web: www.latrobe.edu.au Enquiries: [email protected]
Report Citation: Stewardson MJ, Guarino F (2018) 2016–17 Basin scale evaluation of Commonwealth environmental water — Hydrology. Final Report prepared for the Commonwealth Environmental Water Office by La Trobe University, Publication 188/2018, October, 55pp plus annex.
2016–17 Basin–scale evaluation of Commonwealth environmental water – Hydrology ii
This monitoring project was commissioned and funded by Commonwealth Environmental Water Office.
Copyright
© Copyright Commonwealth of Australia, 2018
2016–17 Basin-scale evaluation of Commonwealth environmental water — Hydrology (2018) is licensed by the Commonwealth of Australia for use under a Creative Commons By Attribution 3.0 Australia licence with the exception of the Coat of Arms of the Commonwealth of Australia, the logo of the agency responsible for publishing the report, content supplied by third parties, and any images depicting people. For licence conditions see: http://creativecommons.org/licenses/by/3.0/au/
This report should be attributed as Stewardson MJ, Guarino F (2018) 2016–17 Basin scale evaluation of Commonwealth environmental water — Hydrology. Final Report prepared for the Commonwealth Environmental Water Office by La Trobe University, Publication 188/2018, October, 55pp plus annex.
Disclaimer
The views and opinions expressed in this publication are those of the authors and do not necessarily reflect those of the Australian Government or the Minister for the Environment.
While reasonable efforts have been made to ensure that the contents of this publication are factually correct, the Commonwealth does not accept responsibility for the accuracy or completeness of the contents, and shall not be liable for any loss or damage that may be occasioned directly or indirectly through the use of, or reliance on, the contents of this publication.
The material contained in this publication represents the opinion of the author(s) only. While every effort has been made to ensure that the information in this publication is accurate, the author(s) and La Trobe University do not accept any liability for any loss or damage howsoever arising whether in contract, tort or otherwise which may be incurred by any person as a result of any reliance or use of any statement in this publication. The author(s) and La Trobe University do not give any warranties in relation to the accuracy, completeness and up-to-date status of the information in this publication.
Where legislation implies any condition or warranty which cannot be excluded restricted or modified, such condition or warranty shall be deemed to be included provided that the author’s and La Trobe University’s liability for a breach of such condition or warranty is, at the option of La Trobe University, limited to the supply of the services again or the cost of supplying the services again.
2016–17 Basin–scale evaluation of Commonwealth environmental water – Hydrology iii
Document history and status
Version Date Issued Reviewed by Approved by Revision type
Draft 18/6/2018 M&E Providers
External
Draft 18/6/2018 CEWO External
Final 5/10/2018 Jennifer Hale Nicole Thurgate Internal
Distribution of copies
Version Quantity Issued to
Draft 1 x PDF 1 x Word CEWO and M&E Providers
Final 1 x PDF 1 x Word Paul Marsh, Sam Roseby
Filename and path: Projects\CEWO\CEWH Long Term Monitoring Project\499 LTIM Stage 2 2014-19 Basin evaluation\Final Reports
Author(s): Michael Stewardson and Fiorenzo Guarino
Author affiliation(s): The University of Melbourne and The University of Canberra.
Project Manager: Nicole Thurgate
Client: Commonwealth Environmental Water Office
Project Title: Basin evaluation of the contribution of Commonwealth environmental water to the environmental objectives of the Murray‒Darling Basin Plan
Document Version: Final
Project Number: M/BUS/499
Contract Number: PRN 1213-0427

2016–17 Basin–scale evaluation of Commonwealth environmental water – Hydrology iv
Acknowledgements:
We would like to acknowledge the many individuals and agencies who assisted by providing data to support this evaluation. This included officers within the Commonwealth Environmental Water Office (CEWO), Victorian Environmental Water Holder (VEWH), WaterNSW, Goulburn–Murray Water (GMW), Department of Environment, Water and Natural Resources (DEWNR) South Australia, Office of Environment & Heritage (OEH) New South Wales, Mallee Catchment Management Authority (CMA), North-Central CMA, Goulburn Broken CMA and the Murray–Darling Basin Authority (MDBA). The authors would also like to thank all Long Term Intervention Monitoring (LTIM) Monitoring and Evaluation Provider staff.
La Trobe University offices are located on the land of the Latje Latje and Wiradjuri peoples. We undertake work throughout the Murray–Darling Basin and acknowledge the traditional owners of this land and water. We pay respect to Elders past, present and future.
2016–17 Basin–scale evaluation of Commonwealth environmental water – Hydrology v
1 Introduction ........................................................................................................................................ 7
1.1 Background ................................................................................................................................................ 7 1.2 Context ...................................................................................................................................................... 7
2 Features of this Evaluation .................................................................................................................. 8 2.1 Scale of evaluation .................................................................................................................................... 8 2.2 Hydrological features considered in this report ........................................................................................ 9
3 Context for the Year .......................................................................................................................... 12 3.1 Climate..................................................................................................................................................... 12 3.2 Surface water inflows .............................................................................................................................. 13
4 Environmental Water Delivery in 2016-17 ......................................................................................... 14 4.1 Environmental watering actions .............................................................................................................. 14 4.2 Timing of environmental water delivery ................................................................................................. 15 4.3 Environmental water delivery strategies ................................................................................................ 17
5 Streamflow volumes ......................................................................................................................... 19 5.1 Flow volumes throughout the Basin ........................................................................................................ 19
6 Baseflows .......................................................................................................................................... 22 7 Freshes .............................................................................................................................................. 24 8 Lateral Connectivity .......................................................................................................................... 27 9 Longitudinal Connectivity .................................................................................................................. 29
9.1 End-of-valley flows .................................................................................................................................. 29 9.2 The Coorong, Lower Lakes and Murray Mouth ....................................................................................... 31
References ..................................................................................................................................................... 32 Appendix I: Details of Evaluation Methods .................................................................................................... 33 Data sources for evaluating contribution to flow regimes ............................................................................. 33 Observations of streamflows ......................................................................................................................... 34 Baseline hydrology scenarios ......................................................................................................................... 35 Data sources for evaluating contribution to hydrological connectivity .......................................................... 36
Floodplain inundation extent ..................................................................................................................... 36 Watercourses watered ............................................................................................................................... 37
Evaluation of Basin-wide hydrological impacts .............................................................................................. 39 Flow thresholds .......................................................................................................................................... 39 Flow regime score ...................................................................................................................................... 40 Attribution of Commonwealth environmental water ................................................................................ 41
Method used for comparing valley outflow in pre- and post-CEWH periods .................................................. 42 Appendix II: Detailed Results for The Coorong, Lower Lakes and Murray Mouth ........................................... 43
Water levels in the Lower Lakes ........................................................................................................................ 43 The contribution of Commonwealth environmental water to barrage flows of the Murray Mouth ............... 44 Murray Mouth ................................................................................................................................................... 44 Commonwealth environmental water contribution to salinity ........................................................................ 46
2016–17 Basin–scale evaluation of Commonwealth environmental water – Hydrology vi
List of tables Table 1. Summary of Commonwealth environmental watering actions in the Basin. ......................................... 14 Table 2. Commonwealth environmental water volumes and delivery strategies in 2016–17. ............................ 18 Table 3. Area (in ha) of wetland and floodplain where Commonwealth environmental water contributed in
2016–17. .......................................................................................................................................... 28 Table 4. Simulated annual estimates of salinity concentration across the three management units of the
Coorong: Goolwa Channel, North Lagoon and South Lagoon derived from the CHM model. Values are Mean Salinity (g/l) ± 1 SD. .......................................................................................................... 31
List of figures Figure 1. Valleys assessed in the 2016–17 hydrological evaluation of Commonwealth environmental water. .... 8 Figure 2. Key sites for presenting hydrological outcomes in this report. ............................................................... 9 Figure 3. Conceptual diagram indicating water levels corresponding to the flow freshes and base flows used in
this evaluation. ................................................................................................................................. 10 Figure 4. Gauges evaluated, areas inundated, streams watered by Commonwealth environmental water, and
rainfall conditions during the 2016-17 watering year...................................................................... 12 Figure 5. Annual surface water inflows in the Murray-Darling Basin (Source: BoM National Water Account). .. 13 Figure 6. Aggregate environmental water volumes delivered by all environmental water entitlement holders in
the (a) southern Basin; and (b) northern Basin tributaries. ............................................................. 16 Figure 7. Annual flow volume as a percentage of mean pre-development annual flow volume......................... 19 Figure 8. Percent of annual flow that is sourced from an environmental entitlement. ....................................... 20 Figure 9. Percent of environmental water entitlement that is provided by the CEWH. ...................................... 21 Figure 10. Annual very low base flow score from 0% (extremely dry) to 100% (average conditions). ................ 22 Figure 11. Annual low flow base flow score from 0% (extremely dry) to 100% (average conditions). ................ 23 Figure 12. Annual low-fresh Score from 0% (extremely dry) to 100% (average conditions). ............................... 24 Figure 13. Annual medium fresh score from 0% (extremely dry) to 100% (normal conditions). ......................... 25 Figure 14. Annual high fresh score from 0% (extremely dry) to 100% (average conditions). .............................. 26 Figure 15. Inundation of floodplains as a result of Commonwealth environmental water contributions. .......... 27 Figure 16. End of valley flows. The bar graph reports the proportion of mean valley inflows typically reaching
the valley outlet in an average year. Results are given for the periods before (2000–2008) and after (2012–2017) Commonwealth environmental water recovery. The inset figure shows the net surface water inflows and outflows for the entire Murray-Darling Basin indicating mean inflow conditions with the dashed vertical line. The (log-log) regression lines fitted to data for two periods indicate an increase in outflows post water recovery. See Appendix I for explanation of methods. (Source of Data: BoM National Water Account). ............................................................. 30

2016–17 Basin scale evaluation of Commonwealth environmental water — Hydrology 7
1 Introduction
1.1 Background The management of Commonwealth environmental water is one of the principal means by which the Australian Government seeks to achieve the Basin Plan environmental objectives. The Commonwealth Environmental Water Holder (CEWH) manages Commonwealth environmental water to achieve specified environmental outcomes through a series of watering actions every year. This report seeks to evaluate whether there is no loss of, or degradation in, the following:
a) flow regimes, which include relevant flow components set out in the Basin Plan (Section 8.51(1)(b))
b) hydrological connectivity between the river and floodplain and between hydrologically connected valleys.
Over the course of the Long-term Intervention Monitoring (LTIM) Project, it is envisaged that the capacity to evaluate hydrological outcomes will increase to enable inclusion of all the Basin’s major river valleys and to consider the effects of both individual watering actions and the transfer of water from consumptive use to environmental use on flow regimes.
The Hydrology evaluation underpins the evaluation of ecological outcomes for the other ecological indicators that are evaluated at the Basin scale (called ‘Basin Matters’: Fish, Vegetation Diversity, Ecosystem Diversity, Stream Metabolism and Water Quality, and Generic Diversity). This is a three-step process:
1. Identify flow outcomes to support evaluation of Commonwealth environmental water effects on flow regime.
2. Identify resultant hydraulic outcomes to enable evaluation of whether environmental flow management achieved the expected hydraulic and connectivity outcomes. This takes the form of inundation mapping across the Basin.
3. The hydraulic and connectivity outcomes are then used to evaluate the environmental outcomes and, over time, improve our understanding of environmental water requirements.
This evaluation of the effect of Commonwealth environmental water delivery on flow regime is a collaborative undertaking by the Commonwealth Environmental Water Office (CEWO) and the Murray–Darling Freshwater Research Centre (MDFRC). The CEWO coordinates compilation of operational data to characterise Commonwealth environmental water delivery. The MDFRC and its collaborators undertake the analysis and interpretation of these data to evaluate Basin-scale hydrological outcomes.
1.2 Context This report provides an evaluation of the contribution of Commonwealth environmental water to flow regimes and hydrological connectivity across the Basin. The evaluation focuses on the 2016–17 watering year, with a limited evaluation of the cumulative multi-year outcomes achieved over the period 1 July 2014 to 30 June 2017 in the valleys of the Basin where Commonwealth environmental water was delivered.
This evaluation is one component of the broader LTIM Project for the CEWO, which seeks to evaluate the ecological outcomes of the management of Commonwealth environmental water and its contribution to the environmental objectives of the Basin Plan. Hydrological outcomes inform the broader evaluation of biodiversity, ecosystem function and resilience at the Basin scale. The report does refer to specific outcomes within individual valleys but only where these contribute important information to the Basin-wide outcomes. A systematic account of outcomes at the valley scale can be viewed in the Report Cards – Annex A.

2016–17 Basin scale evaluation of Commonwealth environmental water — Hydrology 8
2 Features of this Evaluation
2.1 Scale of evaluation This report describes the hydrological outcomes from the delivery of Commonwealth environmental water at the site, valley and Basin scales. The valleys used for the LTIM Project Basin-scale hydrological assessment are adapted from the Murray–Darling Basin Sustainable Rivers Audit valley boundaries (Figure 1). These valley boundaries were the most closely aligned with regions targeted for environmental flow delivery. Note that the regulated portion of the River Murray is divided at Lake Victoria into the Central Murray valley, extending from Hume Dam to Lock 10 (upstream of Lake Victoria); and the Lower Murray valley, extending from Lake Victoria to the upstream extent of the Lower Lakes. Although the Basin includes a total of 25 valleys (Figure 1), valley-based reporting is only provided for 18 valleys (Figure 1 and Table 3 in Appendix I) where environmental water was delivered. Hydrological outputs are synthesised at the Basin scale in this report.
We also report on conditions at 72 sites (Figure 2) to represent variation in hydrological outcomes throughout the Basin. This is a sample of a larger set of sites used for the valley and Basin evaluations. Detailed information for the full set of sites including the time-series of environmental water delivery, is provided in the valley Report Cards (Annex A).
Figure 1. Valleys assessed in the 2016–17 hydrological evaluation of Commonwealth environmental water.

2016–17 Basin scale evaluation of Commonwealth environmental water — Hydrology 9
Figure 2. Key sites for presenting hydrological outcomes in this report.
2.2 Hydrological features considered in this report This report examines the contribution of Commonwealth environmental water to four features of the Basin’s hydrology: base flows; freshes; lateral hydrological connectivity with the floodplain; and longitudinal hydrological connectivity downstream through the Basin. Here we provide a brief introduction to these features. The detail of the evaluation methods is provided in Appendix I.
In the case of base flows and freshes, we use scores to indicate improvements in the flow regimes with environmental water delivery. The scores are calculated using two base flow thresholds and three fresh thresholds (Figure 3). We consider flow magnitude relative to these flow thresholds because: (a) they have an environmental significance; and (b) it allows comparison of flows regimes across rivers of different size. In the case of base flows, we are concerned with the duration of flows below these thresholds and for freshes, we are concerned with the occurrence of flows above these thresholds.
Legend Site
Murray and Darling Rivers
Tributaries of the Murray and Darling Rivers
2016–17 Basin scale evaluation of Commonwealth environmental water — Hydrology 10
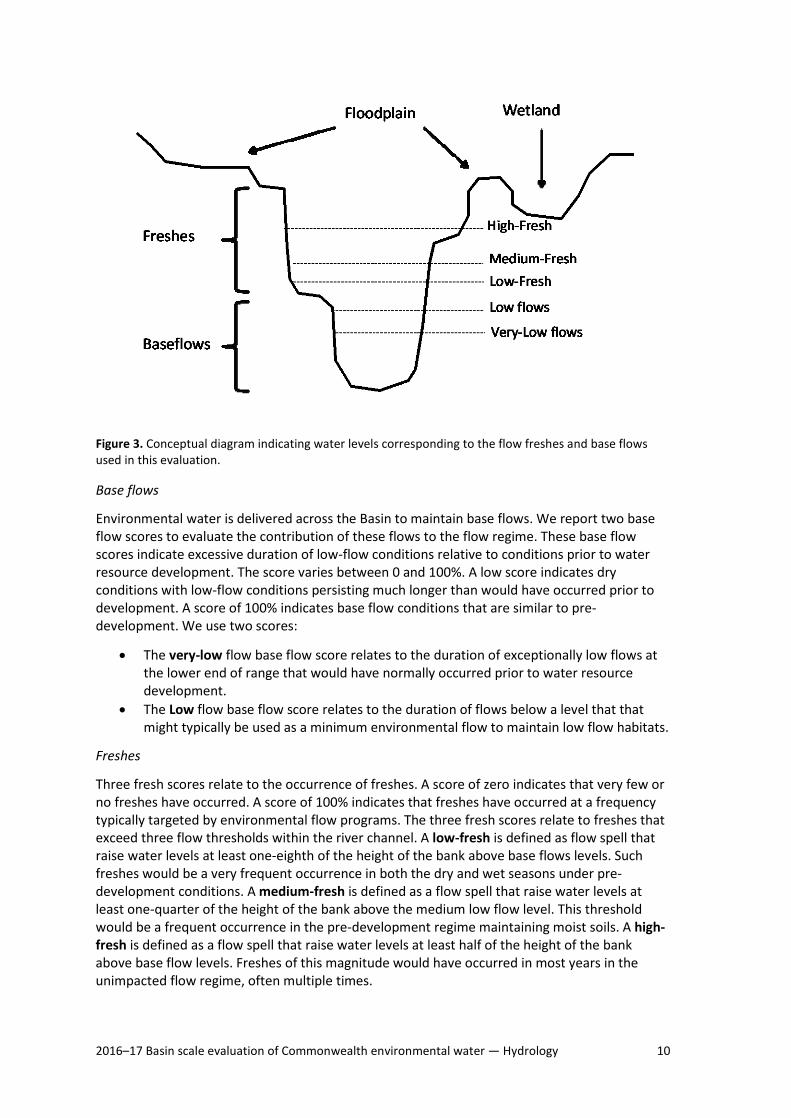
Figure 3. Conceptual diagram indicating water levels corresponding to the flow freshes and base flows used in this evaluation.
Base flows
Environmental water is delivered across the Basin to maintain base flows. We report two base flow scores to evaluate the contribution of these flows to the flow regime. These base flow scores indicate excessive duration of low-flow conditions relative to conditions prior to water resource development. The score varies between 0 and 100%. A low score indicates dry conditions with low-flow conditions persisting much longer than would have occurred prior to development. A score of 100% indicates base flow conditions that are similar to pre-development. We use two scores:
• The very-low flow base flow score relates to the duration of exceptionally low flows at the lower end of range that would have normally occurred prior to water resource development.
• The Low flow base flow score relates to the duration of flows below a level that that might typically be used as a minimum environmental flow to maintain low flow habitats.
Freshes
Three fresh scores relate to the occurrence of freshes. A score of zero indicates that very few or no freshes have occurred. A score of 100% indicates that freshes have occurred at a frequency typically targeted by environmental flow programs. The three fresh scores relate to freshes that exceed three flow thresholds within the river channel. A low-fresh is defined as flow spell that raise water levels at least one-eighth of the height of the bank above base flows levels. Such freshes would be a very frequent occurrence in both the dry and wet seasons under pre-development conditions. A medium-fresh is defined as a flow spell that raise water levels at least one-quarter of the height of the bank above the medium low flow level. This threshold would be a frequent occurrence in the pre-development regime maintaining moist soils. A high-fresh is defined as a flow spell that raise water levels at least half of the height of the bank above base flow levels. Freshes of this magnitude would have occurred in most years in the unimpacted flow regime, often multiple times.
2016–17 Basin scale evaluation of Commonwealth environmental water — Hydrology 11
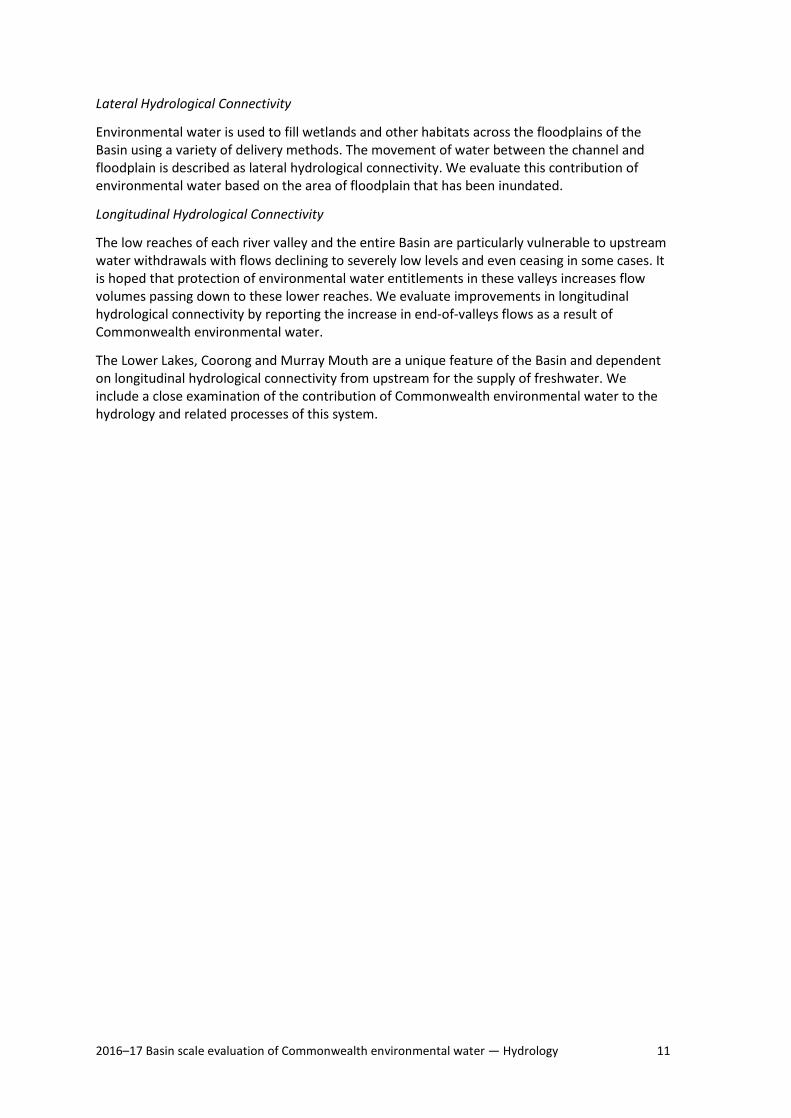
Lateral Hydrological Connectivity
Environmental water is used to fill wetlands and other habitats across the floodplains of the Basin using a variety of delivery methods. The movement of water between the channel and floodplain is described as lateral hydrological connectivity. We evaluate this contribution of environmental water based on the area of floodplain that has been inundated.
Longitudinal Hydrological Connectivity
The low reaches of each river valley and the entire Basin are particularly vulnerable to upstream water withdrawals with flows declining to severely low levels and even ceasing in some cases. It is hoped that protection of environmental water entitlements in these valleys increases flow volumes passing down to these lower reaches. We evaluate improvements in longitudinal hydrological connectivity by reporting the increase in end-of-valleys flows as a result of Commonwealth environmental water.
The Lower Lakes, Coorong and Murray Mouth are a unique feature of the Basin and dependent on longitudinal hydrological connectivity from upstream for the supply of freshwater. We include a close examination of the contribution of Commonwealth environmental water to the hydrology and related processes of this system.
2016–17 Basin scale evaluation of Commonwealth environmental water — Hydrology 12
3 Context for the Year
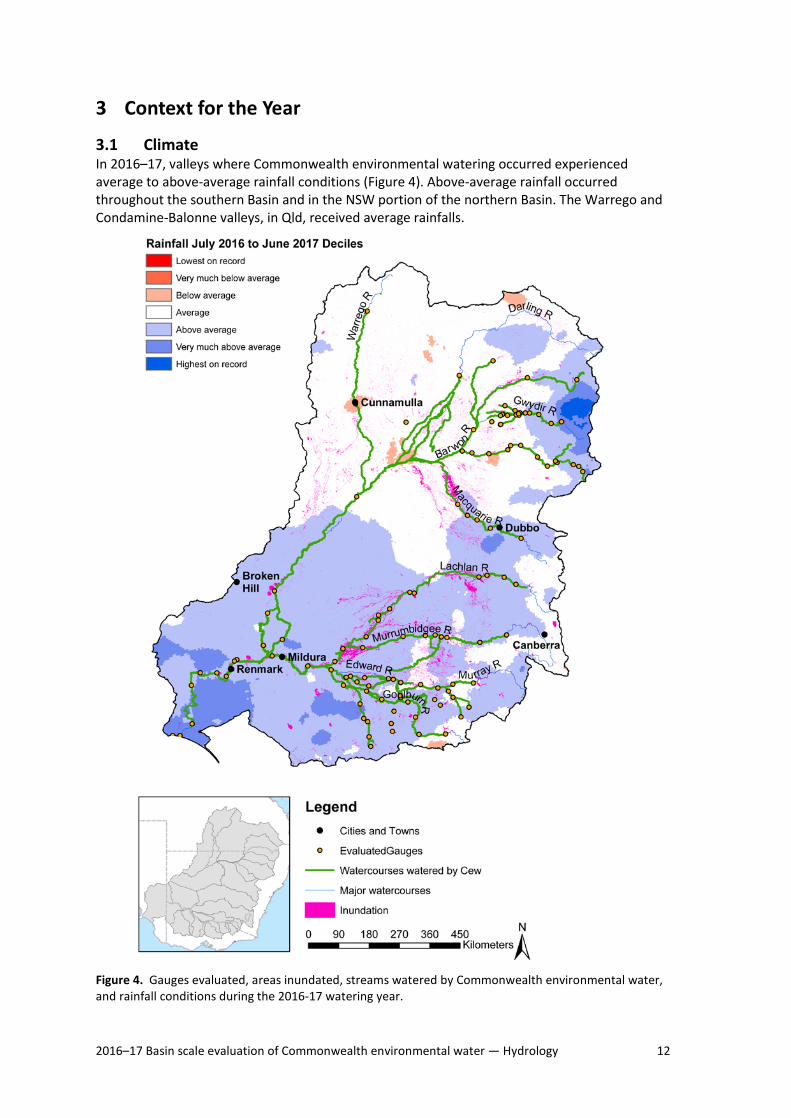
3.1 Climate In 2016–17, valleys where Commonwealth environmental watering occurred experienced average to above-average rainfall conditions (Figure 4). Above-average rainfall occurred throughout the southern Basin and in the NSW portion of the northern Basin. The Warrego and Condamine-Balonne valleys, in Qld, received average rainfalls.
Figure 4. Gauges evaluated, areas inundated, streams watered by Commonwealth environmental water, and rainfall conditions during the 2016-17 watering year.

2016–17 Basin scale evaluation of Commonwealth environmental water — Hydrology 13
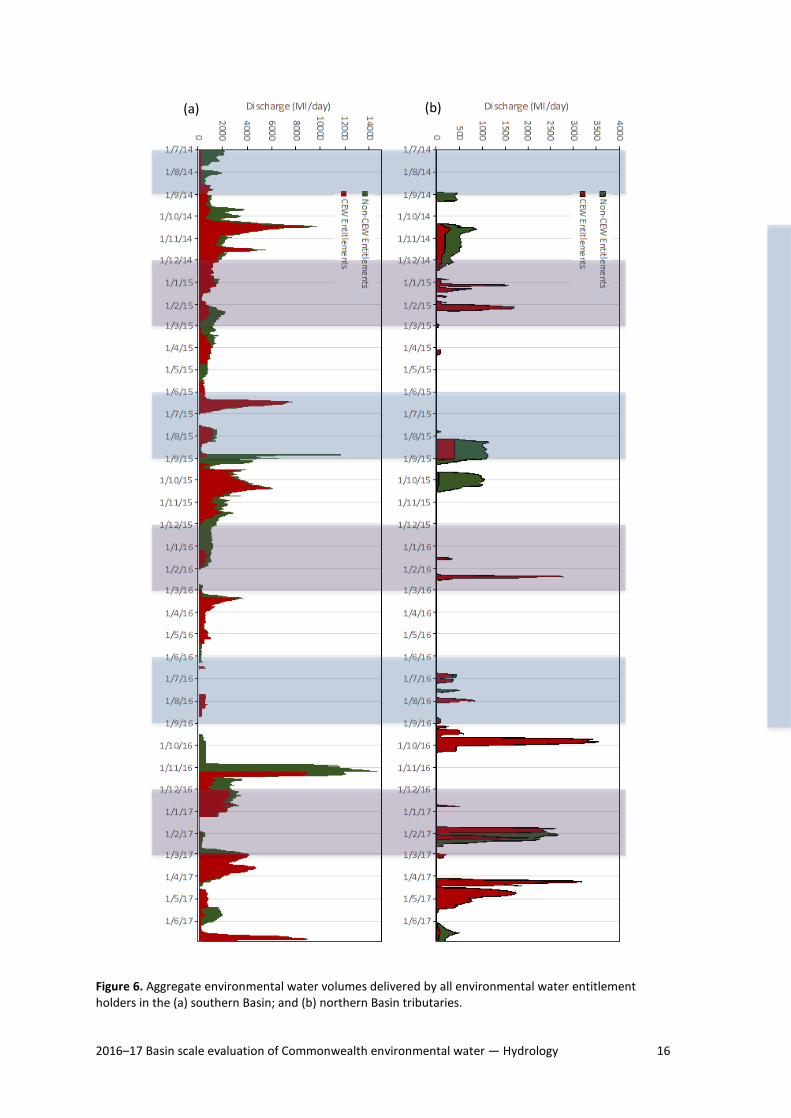
3.2 Surface water inflows Surface water inflows across the Basin have been low for the four year period mid 2012 to mid 2016 (Figure 6) with magnitudes similar to the less severe years of the millenium drought. In 2016–17, surface water inflows in the southern Basin valleys have increased to approximately double inflows over the previous four years. The Loddon and Campaspe Valleys experienced a significantly greater (five-fold) increase on the previous four year average. In contrast, total inflows in the northern Basin only increased slightly from the low levels of the previous four years. There was, however, some variation in inflow conditions across the north reflecting variation in annual rainfalls. The Macquarie valley inflows were close to twice that of previous years, similar to the southern Basin. The other NSW valleys (Namoi, Gwidir and Border Rivers) experienced some minor increases on previous years. The Queensland valleys (Warrego and Condamine-Balonne) remained low for a fifth consecutive year.
Figure 5. Annual surface water inflows in the Murray-Darling Basin (Source: BoM National Water Account).
2016–17 Basin scale evaluation of Commonwealth environmental water — Hydrology 14
4 Environmental Water Delivery in 2016-17
4.1 Environmental watering actions In 2016–17, 1456 gigalitres (GL) of Commonwealth environmental water was debited from the CEWH accounts, realising 93 watering actions across 17 LTIM valleys (Table 1). Through the use of return flows, Commonwealth environmental water was used and reused, effectively contributing 1818 Gl water across the 93 watering actions. These actions improved flow regimes along approximately 21 640 km of waterway (Table 2 and Figure 4). Almost 90% of the Commonwealth environmental water delivered in 2016-17 was used in 17 base flow and 40 fresh actions across both the northern and southern Basin. The remaining 10% contributed to 30 actions filling wetlands, five actions achieving bankfull flows and one action achieved an overbank flow. In 11 valleys there were either one or two actions involving freshes, with three in the Barwon-Darling and Border Rivers, four in the Edward-Wakool, and five in the Warrego. In the River Murray, 12 events were classified as freshes because they produced an increase in water level, but these were artificially produced by weir pool manipulations as opposed to increases in discharge.
Table 1. Summary of Commonwealth environmental watering actions in the Basin.
Valley Summary of environmental watering actions
Barwon Darling • Three freshes delivered during the winter and spring • All actions were delivered passively for resilience, ecological processes and
water quality Border Rivers • Three bankfull actions delivered passively during the spring and autumn
• Three freshes delivered during winter and spring • The majority of watering actions were delivered for fish, connectivity and
resilience Broken • Three base flows delivered between spring and winter
• Watering actions were delivered for fish or water quality Campaspe No Commonwealth environmental water delivered as it was traded into the Murray Central Murray • One base flow delivered into Gunbower Creek over the entire year
• One fresh delivered in the River Murray over the second half of the year • One overbank delivered during the first half of the water year (into Barmah-
Millewa) • The majority of watering actions were delivered for fish, vegetation and
ecological processes Cond-Balonne • One fresh delivered during autumn for connectivity and resilience
• One bankfull delivered during spring for vegetation and waterbirds (in the Narran Lakes)
Edward-Wakool • Four base flows delivered (delivered over the second half of the water year and a couple targeted in the autumn)
• Four freshes delivered (in the spring and late summer) • The majority of watering actions were delivered for fish, vegetation and
water quality Goulburn • Three base flows delivered covering winter, spring/summer and autumn
• Two freshes delivered during autumn and winter • The majority of watering actions were delivered for fish, vegetation and
ecological processes Gwydir • One base flow and one fresh delivered in spring
• Two wetland actions delivered over summer • The majority of watering actions were delivered for ecological processes,
connectivity and vegetation Lachlan • One fresh delivered during late spring / summer

2016–17 Basin scale evaluation of Commonwealth environmental water — Hydrology 15
Valley Summary of environmental watering actions
• One wetland delivered during summer • Watering actions were delivered for waterbirds and water quality
Loddon • One base flow delivered during the autumn • One fresh delivered during the autumn • Majority of actions were delivered for other biota, fish and vegetation
Lower Darling • Great Darling Anabranch: One fresh delivered for the latter nine months of the water year
• Lower Darling River: One fresh/base flow delivered in the second half of the water year
• The majority of watering actions were delivered for fish, vegetation, and water quality
Lower Murray • Eleven freshes scattered throughout the water year and one baseflow/fresh • Eleven wetlands majority delivered during the autumn, with two actions
spanning almost 11 months • The majority of watering actions were delivered for fish, vegetation,
waterbirds and water quality Macquarie • Two freshes delivered in the autumn
• Four wetland actions delivered in the winter, spring, and summer • The majority of watering actions were delivered for fish, vegetation,
waterbirds and connectivity Murrumbidgee • Ten wetland actions (majority delivered during late spring and summer)
• Two freshes delivered in the late spring and autumn • The majority of watering actions were delivered (almost equally) for fish,
vegetation, water quality and waterbirds Namoi • One base flow delivered during autumn
• One fresh delivered during June • Both watering actions were delivered primarily for fish outcomes
Ovens • One fresh delivered in summer • One base flow delivered in summer • Both watering actions were delivered for connectivity
Warrego • Five freshes during winter and early spring • Two wetland events during winter and early spring • One bankfull during the spring • The majority of these flows assisted connectivity and resilience
4.2 Timing of environmental water delivery In 2016–17, most of the southern Basin’s environmental water entitlement (Commonwealth environmental water and other environmental water) was delivered (mainly via dam releases) during three periods: end of October to mid-January, start of March to mid-April and the second half of June (Figure 6). The general seasonal pattern of water delivery was similar to the previous two years although environmental water delivery began later in spring and more environmental water was delivered in autumn. In the northern Basin, environmental water was delivered in pulses throughout the 2016–17 year. This is different to the previous two years when environmental water was concentrated in late winter and spring. Commonwealth environmental water and other environmental water entitlement holders generally deliver water with the same seasonal patterns. Given the strong coordination between environmental water entitlement holders to deliver joint water actions in many cases, any differences in timing are more likely a result of this coordination rather than differences in strategies.
2016–17 Basin scale evaluation of Commonwealth environmental water — Hydrology 16
Figure 6. Aggregate environmental water volumes delivered by all environmental water entitlement holders in the (a) southern Basin; and (b) northern Basin tributaries.
(a)
(b)
(a) (b)
2016–17 Basin scale evaluation of Commonwealth environmental water — Hydrology 17
4.3 Environmental water delivery strategies O'Donnell and Garrick (2017) describe a gradient of passive-to-active environmental flow management roles. In the Basin, active management is possible across the southern Basin and some of the northern rivers where environmental water can be flexibly ordered from a dam. There are also rivers in the northern Basin with little or no water storage and environmental water must be sourced from stream flows delivered from natural catchment runoff. In these systems, environmental flows are triggered when “access-to-take” streamflow thresholds are exceeded. The timing of these events is relatively uncontrolled by the CEWO. This situation is closer to the passive end of the environmental flow management spectrum.
Five delivery strategies have been used by the CEWO to maximise the environmental benefits of available environmental water. These strategies are primarily used with the active management approach. Some may, however, also be employed to a limited extent with the passive management approach. These strategies are briefly described here and discussed in detail by Stewardson and Guarino (2018) and Docker and Johnson (2017).
1. Augmentation is a strategy whereby environmental water is used to augment water released from storages for downstream non-environmental (i.e. consumptive) uses.
2. Coordination is a strategy whereby the CEWO coordinates water delivery with other environmental water holders to achieve synergies with their combined water delivery.
3. Piggy-backing is a strategy used in some valleys where the CEWO seeks to “piggy-back” environmental releases on unregulated flow pulses to achieve the greatest magnitude or duration of flow pulse with the minimum of environmental water.
4. Shepherding is a strategy where the CEWO increases the effectiveness of its environmental water holdings by using the same “parcel” of water for multiple environmental purposes as it flows downstream.
5. Assisted-delivery is a strategy where the CEWO uses one or more of a variety of water supply infrastructure to assist with the delivery of environmental water including: adjusting river stage using weirs; redirecting water down anabranch and distributary channels using regulators; pumping water into riparian wetlands; and constructing levees to increase the volume of ponded water held in floodplain wetlands.
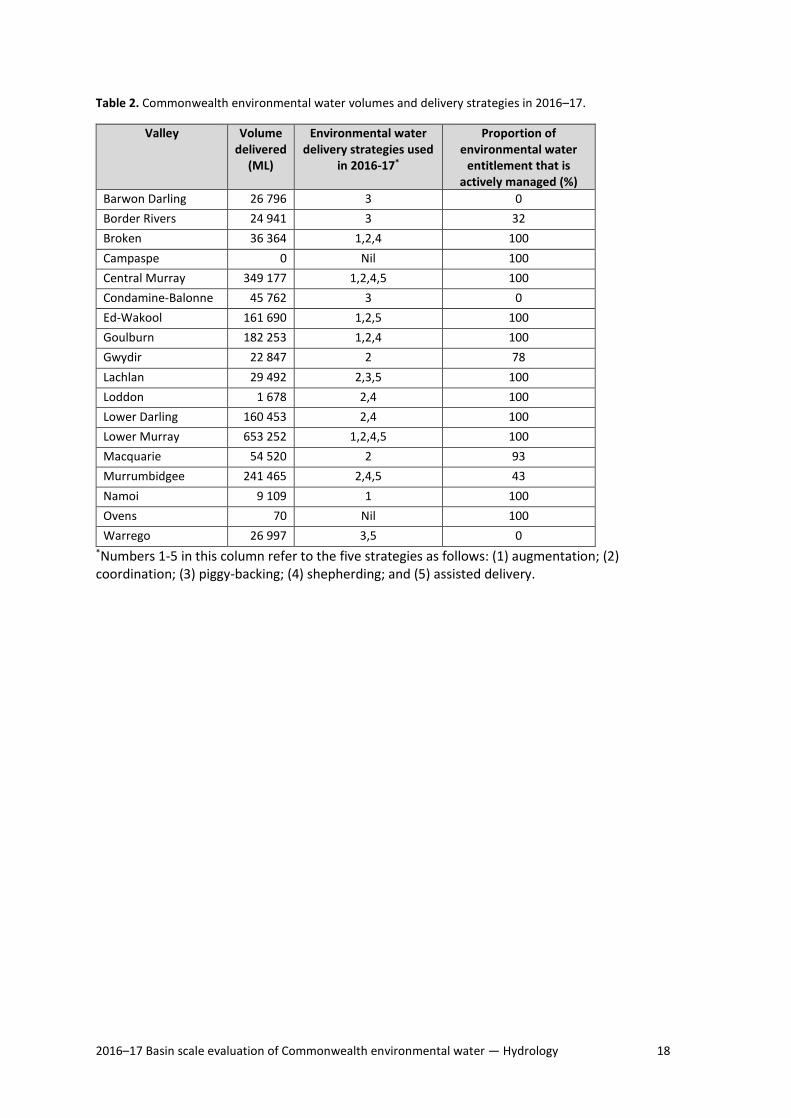
The CEWO applied these five delivery strategies across multiple valleys in 2016–17 (Table 2). They used: coordination in ten valleys; augmentation in five valleys; piggy-backing in four valleys; shepherding in seven valleys; and assisted delivery in five valleys. In the three valleys where none of the environmental water entitlements could be actively managed, there was little flexibility in the strategies available for use in managing components of the flow regime.
A total of 7% of Commonwealth environmental water was used in watering actions that delivered water out of the river channel in 31 watering actions. Approximately 60% of this environmental water was used in 10 watering actions where flows were increased to magnitudes equal to, or greater than bankfull channel capacity in the Central Murray, Gwydir, , Lachlan, Macquarie, and Warrego valleys. The remainder of this environmental water was used to fill wetlands with the assistance of regulating structures and pumps in 21 actions restricted to the Central and Lower Murray, Macquarie and Murrumbidgee valleys. Watering actions involving freshes or infrastructure-assisted wetland inundation were often “coordinated” and delivered in partnership with other environmental water holders combined for these actions.
2016–17 Basin scale evaluation of Commonwealth environmental water — Hydrology 18
Table 2. Commonwealth environmental water volumes and delivery strategies in 2016–17.
Valley Volume delivered
(ML)
Environmental water delivery strategies used
in 2016-17*
Proportion of environmental water
entitlement that is actively managed (%)
Barwon Darling 26 796 3 0 Border Rivers 24 941 3 32 Broken 36 364 1,2,4 100 Campaspe 0 Nil 100 Central Murray 349 177 1,2,4,5 100 Condamine-Balonne 45 762 3 0 Ed-Wakool 161 690 1,2,5 100 Goulburn 182 253 1,2,4 100 Gwydir 22 847 2 78 Lachlan 29 492 2,3,5 100 Loddon 1 678 2,4 100 Lower Darling 160 453 2,4 100 Lower Murray 653 252 1,2,4,5 100 Macquarie 54 520 2 93 Murrumbidgee 241 465 2,4,5 43 Namoi 9 109 1 100 Ovens 70 Nil 100 Warrego 26 997 3,5 0
*Numbers 1-5 in this column refer to the five strategies as follows: (1) augmentation; (2) coordination; (3) piggy-backing; (4) shepherding; and (5) assisted delivery.

2016–17 Basin scale evaluation of Commonwealth environmental water — Hydrology 19
5 Streamflow volumes
5.1 Flow volumes throughout the Basin In 2016–17, the Macquarie, Border Rivers, Warrego, Namoi, Gwydir, Lachlan, Murrumbidgee, Murray, Loddon, and Broken all experienced higher than average annual flows volumes that (Figure 7). The Barwon-Darling, Condamine-Balonne, Goulburn and Campaspe Rivers were the exception where annual flow volumes did not exceed the mean predevelopment during this wetter year. In the case of the two Queensland tributaries, this will be a result of ongoing drier conditions. In the case of the Goulburn and Campaspe Rivers, low mean flows are a consequence of withholding a significant portion of catchment inflows to lift reservoir storage levels. The 2016–17 year was significant wetter than the previous two years. In these earlier years, most of the sites evaluated in this report experienced less than the average mean-predevelopment flow; varying between 10% and 60% below the mean-pre-development flow volumes.
Figure 7. Annual flow volume as a percentage of mean pre-development annual flow volume.
2016–17 Basin scale evaluation of Commonwealth environmental water — Hydrology 20
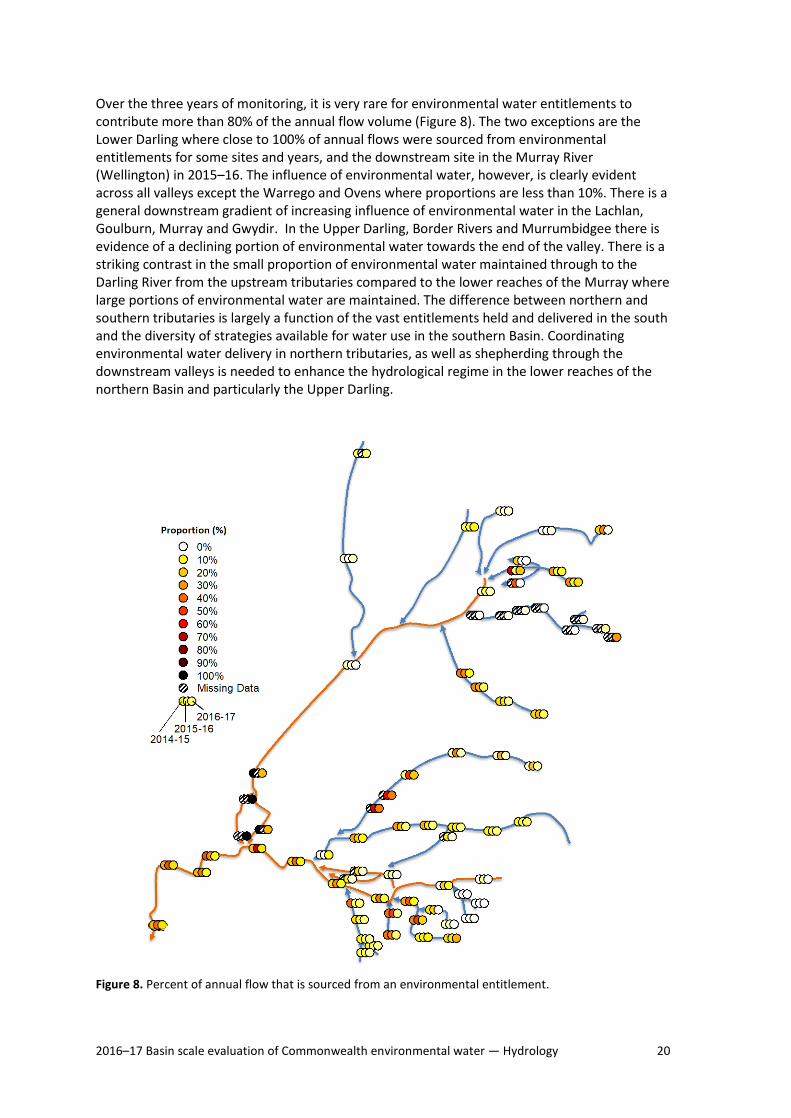
Over the three years of monitoring, it is very rare for environmental water entitlements to contribute more than 80% of the annual flow volume (Figure 8). The two exceptions are the Lower Darling where close to 100% of annual flows were sourced from environmental entitlements for some sites and years, and the downstream site in the Murray River (Wellington) in 2015–16. The influence of environmental water, however, is clearly evident across all valleys except the Warrego and Ovens where proportions are less than 10%. There is a general downstream gradient of increasing influence of environmental water in the Lachlan, Goulburn, Murray and Gwydir. In the Upper Darling, Border Rivers and Murrumbidgee there is evidence of a declining portion of environmental water towards the end of the valley. There is a striking contrast in the small proportion of environmental water maintained through to the Darling River from the upstream tributaries compared to the lower reaches of the Murray where large portions of environmental water are maintained. The difference between northern and southern tributaries is largely a function of the vast entitlements held and delivered in the south and the diversity of strategies available for water use in the southern Basin. Coordinating environmental water delivery in northern tributaries, as well as shepherding through the downstream valleys is needed to enhance the hydrological regime in the lower reaches of the northern Basin and particularly the Upper Darling.
Figure 8. Percent of annual flow that is sourced from an environmental entitlement.

2016–17 Basin scale evaluation of Commonwealth environmental water — Hydrology 21
Since 2014, Commonwealth environmental water entitlements have comprised almost 100% of the environmental flows in the Warrego, Barwon-Darling, Border Rivers, Condamine-Balonne, Namoi, Goulburn, Ovens and Edward-Wakool (Figure 9). These are all the northern Basin rivers considered in this report except the Macquarie and Gwydir. In the other valleys, Commonwealth environmental entitlements have comprised between 10% and 60% reflecting the significant environmental water volumes held by other agencies in these valleys.
Figure 9. Percent of environmental water entitlement that is provided by the CEWH.

2016–17 Basin scale evaluation of Commonwealth environmental water — Hydrology 22
6 Baseflows In this evaluation, we consider the contribution of environmental water to maintaining base flows focusing on periods where flow drops below either the “very-Low” or “low” flow thresholds. In 2016–17, excessive periods below the very-low flow threshold occurred in the Loddon River downstream of Laanecoorie Weir, the Darling River (along its full length), the distributary rivers of the Gwydir floodplain and the unregulated Queensland tributaries: the Warrego, Condamine-Balonne and Moonie Rivers (Figure 10). All other rivers considered in this report avoided excessive periods of very-low flows. Environmental water entitlements contributed to avoiding very-low flows in most cases with important contributions from Commonwealth environmental water in the Lower Murray, Edward-Wakool, Goulburn, Murrumbidgee, Macquarie and Namoi. In the previous two years, periods where flow was below the very-low flow threshold were more widespread than in 2016–17 including the lower Campaspe River, some reaches of the Macquarie and throughout the Gwydir and Border Rivers.
Figure 10. Annual very low base flow score from 0% (extremely dry) to 100% (average conditions).

2016–17 Basin scale evaluation of Commonwealth environmental water — Hydrology 23
Despite a return to normal inflow conditions across much of the Basin in 2016–17, excessive periods when flow was below the low flow threshold occurred in all rivers except the Central Murray (Figure 11). Conditions were particular severe in the Namoi, Condamine-Balonne, Edward-Wakool and some sites in northern Victoria. Environmental water entitlements substantially enhanced base flows (at the low flow level) across all southern Basin rivers and the Macquarie River in the northern Basin. The Commonwealth environmental water made an important contribution to these enhancements in the lower and central Murray, Edward-Wakool, Goulburn, Broken, Murrumbidgee and Macquarie. For NSW rivers, low flow conditions in the previous two years were generally worse than in 2016–17. In contrast, the Victorian tributaries have seen similar low flow conditions on average during this third year of monitoring compared to the first year of monitoring (2014–15) but diminished conditions in the middle year (2015–16).
Figure 11. Annual low flow base flow score from 0% (extremely dry) to 100% (average conditions).
2016–17 Basin scale evaluation of Commonwealth environmental water — Hydrology 24
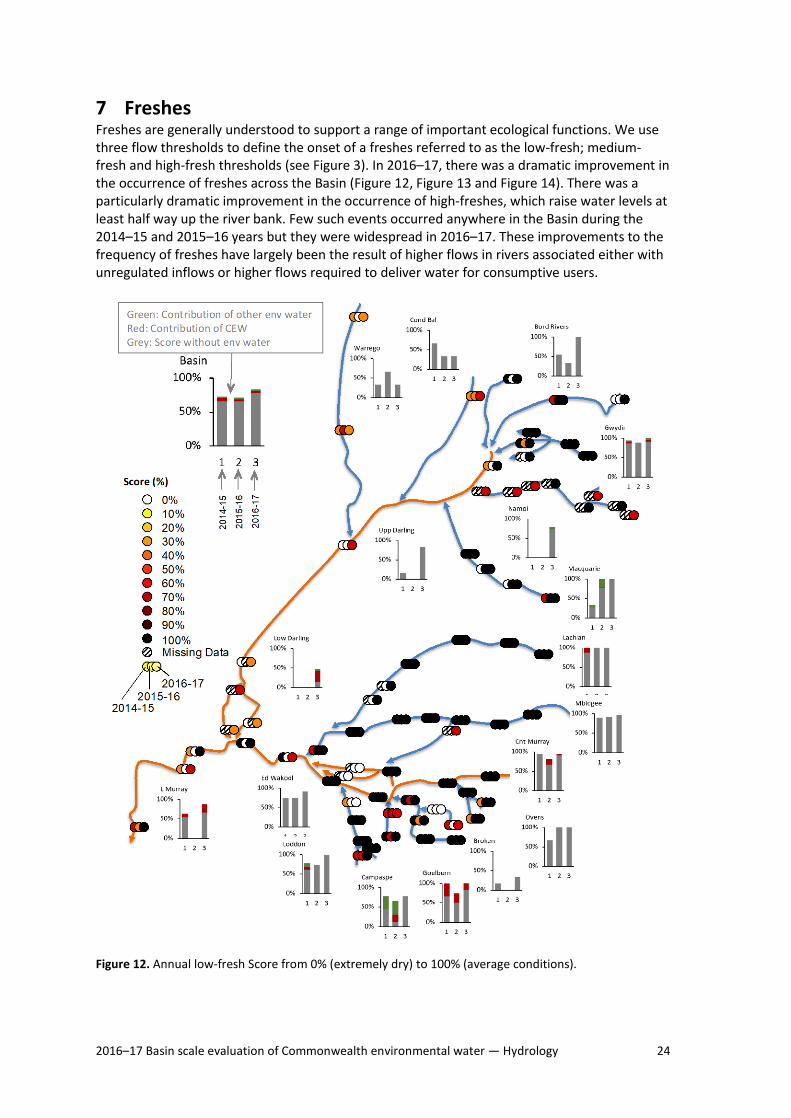
7 Freshes Freshes are generally understood to support a range of important ecological functions. We use three flow thresholds to define the onset of a freshes referred to as the low-fresh; medium-fresh and high-fresh thresholds (see Figure 3). In 2016–17, there was a dramatic improvement in the occurrence of freshes across the Basin (Figure 12, Figure 13 and Figure 14). There was a particularly dramatic improvement in the occurrence of high-freshes, which raise water levels at least half way up the river bank. Few such events occurred anywhere in the Basin during the 2014–15 and 2015–16 years but they were widespread in 2016–17. These improvements to the frequency of freshes have largely been the result of higher flows in rivers associated either with unregulated inflows or higher flows required to deliver water for consumptive users.
Figure 12. Annual low-fresh Score from 0% (extremely dry) to 100% (average conditions).
2016–17 Basin scale evaluation of Commonwealth environmental water — Hydrology 25
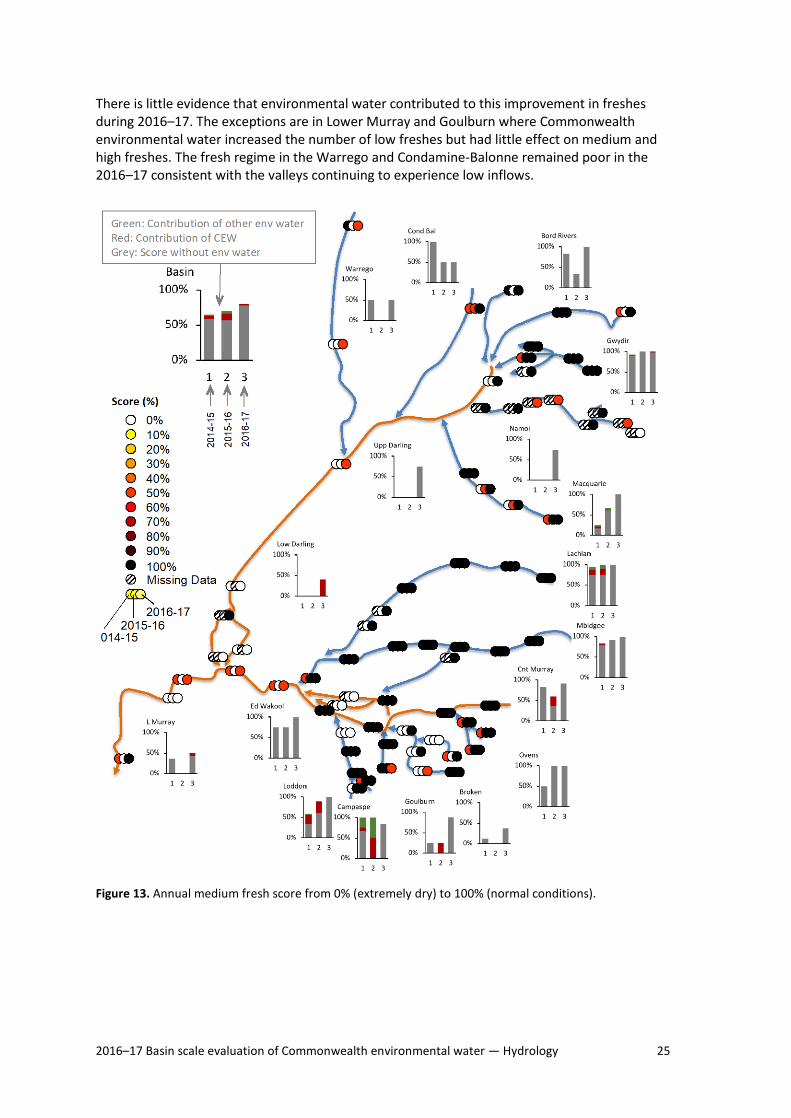
There is little evidence that environmental water contributed to this improvement in freshes during 2016–17. The exceptions are in Lower Murray and Goulburn where Commonwealth environmental water increased the number of low freshes but had little effect on medium and high freshes. The fresh regime in the Warrego and Condamine-Balonne remained poor in the 2016–17 consistent with the valleys continuing to experience low inflows.
Figure 13. Annual medium fresh score from 0% (extremely dry) to 100% (normal conditions).

2016–17 Basin scale evaluation of Commonwealth environmental water — Hydrology 26
Figure 14. Annual high fresh score from 0% (extremely dry) to 100% (average conditions).
2016–17 Basin scale evaluation of Commonwealth environmental water — Hydrology 27
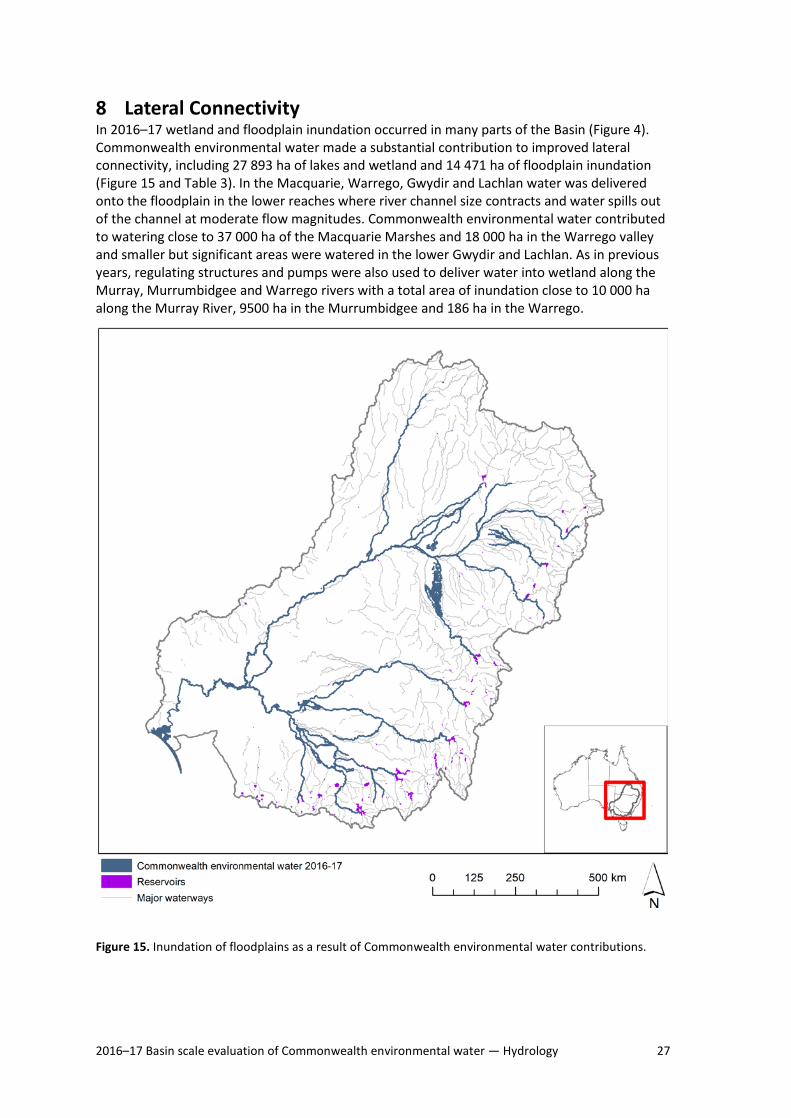
8 Lateral Connectivity In 2016–17 wetland and floodplain inundation occurred in many parts of the Basin (Figure 4). Commonwealth environmental water made a substantial contribution to improved lateral connectivity, including 27 893 ha of lakes and wetland and 14 471 ha of floodplain inundation (Figure 15 and Table 3). In the Macquarie, Warrego, Gwydir and Lachlan water was delivered onto the floodplain in the lower reaches where river channel size contracts and water spills out of the channel at moderate flow magnitudes. Commonwealth environmental water contributed to watering close to 37 000 ha of the Macquarie Marshes and 18 000 ha in the Warrego valley and smaller but significant areas were watered in the lower Gwydir and Lachlan. As in previous years, regulating structures and pumps were also used to deliver water into wetland along the Murray, Murrumbidgee and Warrego rivers with a total area of inundation close to 10 000 ha along the Murray River, 9500 ha in the Murrumbidgee and 186 ha in the Warrego.
Figure 15. Inundation of floodplains as a result of Commonwealth environmental water contributions.

2016–17 Basin scale evaluation of Commonwealth environmental water — Hydrology 28
Table 3. Area (in ha) of wetland and floodplain where Commonwealth environmental water contributed in 2016–17.
Valley Lakes and Wetland area
influenced (ha)
Floodplain area inundated (ha)
Length of waterways
influenced (km)
Barwon Darling 412 – 2611
Border Rivers 74 48 1630
Broken – – 177
Central Murray 3372 209 2538
Condamine Balonne 17 341 34 2141
Edward–Wakool – – 1033
Goulburn – – 523
Gwydir 6730 1 251 846
Lachlan 144 2 047 1506
Loddon – – 528
Lower Darling 32 11 1241
Lower Murray* 6465* 1158 960
Lower Murray (Coorong, Lakes Alexandrina and Albert and Murray Mouth)
Fresh: 118 148 Estuary: 23 850
66 –
Macquarie 36 842 6250 807
Murrumbidgee 6448 3211 2222
Namoi# – – 1027
Ovens – – 483
Warrego 17 734 186 1367 * excludes the Coorong, Lakes Alexandrina and Albert and the Murray Mouth. # includes the Peel River.
2016–17 Basin scale evaluation of Commonwealth environmental water — Hydrology 29
9 Longitudinal Connectivity
9.1 End-of-valley flows We evaluate longitudinal hydrological connectivity based on the extent to which flow is maintained downstream through the river network to the end of the valley and ultimately, the end of the Basin. Prior to water resources development in the Basin, approximately half of surface water inflows were lost from the river network through leakage to groundwater or evapotranspiration. The development of water resources, mostly in the mid to late 20th century, reduced flows throughout the Basin with the downstream end of the Basin’s valleys most severely impacted. Flows in the lower reaches of the Murray were reduced to the point where flow ceased through the Murray mouth in some years. It is to be hoped that one effect of recovering environmental water entitlements in the Basin is to increase flow reaching the downstream river reaches of valleys across the Basin including the lower Murray River, and improving longitudinal connectivity.
Accounts of environmental water allocations contributing to flow volumes at sites in the lower end of many valleys (Figure 8) indicate end-of valley flows have been enhanced. To assess the combined effect of environmental water recovery and altered water withdrawals, we compare the recent end-of-valley annual flow volumes across the Basin with the volumes prior to environmental water recovery. The data collated by the Bureau of Meteorology for their National Water Account are ideal for this comparison and particularly the estimates of surface water inflows and outflows for each of the Basin’s valleys since the 2000-2001 water year. We examine the relation between annual outflows and inflows for the recent 5-year period following much of the environmental water recovery in the Basin to date (i.e. July 2012 to June 2017) and also for the 9-years period prior to commencement of environmental water recovery by the Commonwealth (July 2001 to June 2008).) Recognising that the earlier period falls within the Millennium drought and generally has lower inflows, we compare outflow for each the two periods estimated for the same inflow volume (i.e. the mean inflows for the full data record).
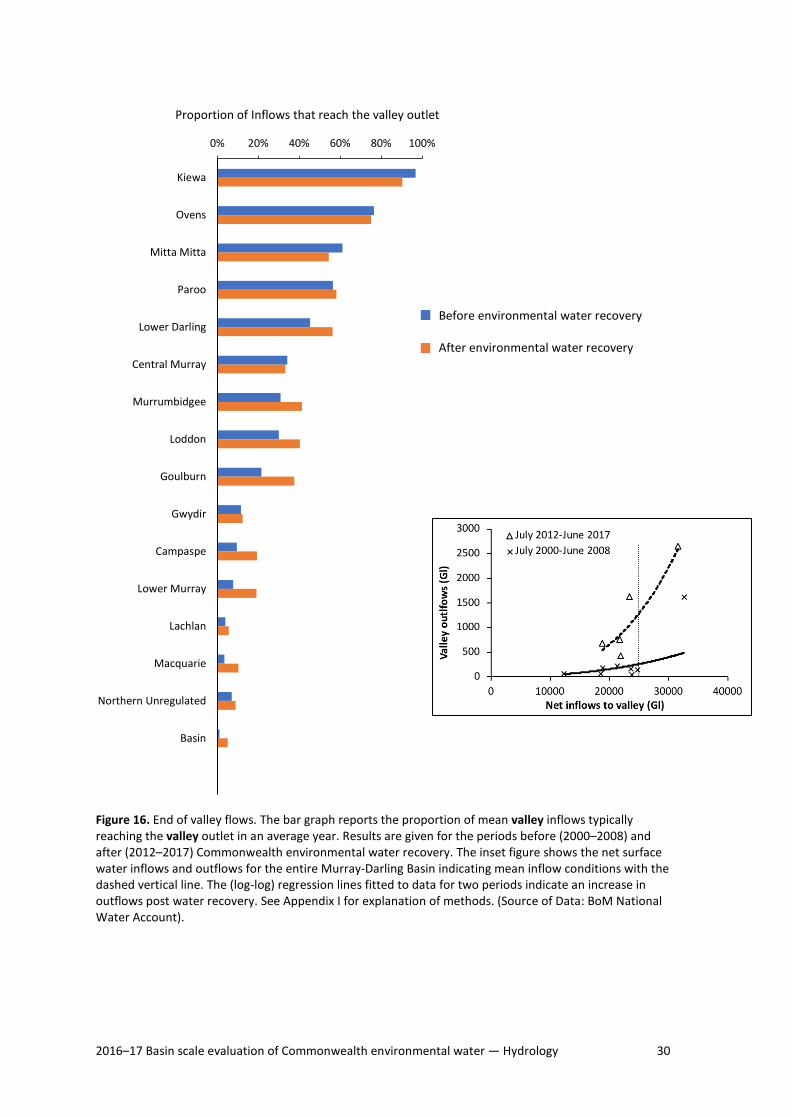
This comparison shows that in almost all valleys where consumptive water withdrawals and other losses are large relative to inflows, end-of-valley flows have increased following the environmental water recovery program (Figure 16). At the downstream extent of the Murray River (at Wellington, just upstream of the lower Lakes) their appears to be approximately 1000 GL additional flow volume in average year (inset graph in Figure 16) which is roughly half of the average annual environmental water entitlement released from storage in the recent 5-year period. Losses of environmental water through the river system are to be expected as a result of seepage, evapotranspiration. These results support the claim that that environmental water recovery has led to increased end of valley flows as a result of reduced water withdrawals.
2016–17 Basin scale evaluation of Commonwealth environmental water — Hydrology 30
Figure 16. End of valley flows. The bar graph reports the proportion of mean valley inflows typically reaching the valley outlet in an average year. Results are given for the periods before (2000–2008) and after (2012–2017) Commonwealth environmental water recovery. The inset figure shows the net surface water inflows and outflows for the entire Murray-Darling Basin indicating mean inflow conditions with the dashed vertical line. The (log-log) regression lines fitted to data for two periods indicate an increase in outflows post water recovery. See Appendix I for explanation of methods. (Source of Data: BoM National Water Account).
0% 20% 40% 60% 80% 100%
Kiewa
Ovens
Mitta Mitta
Paroo
Lower Darling
Central Murray
Murrumbidgee
Loddon
Goulburn
Gwydir
Campaspe
Lower Murray
Lachlan
Macquarie
Northern Unregulated
Basin
Proportion of Inflows that reach the valley outlet
Before environmental water recovery
After environmental water recovery
2016–17 Basin scale evaluation of Commonwealth environmental water — Hydrology 31
9.2 The Coorong, Lower Lakes and Murray Mouth The Coorong, Lower Lakes and Murray Mouth (CLLMM) region is approximately 142 500 ha in size and contains a diverse range of freshwater, estuarine and marine habitats. The region is central to the life and culture of the Ngarrindjeri people, who continue to live on their traditional country (MDBA 2014). It is also a Ramsar site and currently used for a variety of purposes. Recognising the environmental significance of the CLLMM region, the MDBA Basin Watering Strategy sets targets for: the level and variability of the Lower Lakes; minimum annual flows through the barrages to the Coorong; and Murray Mouth openness. Appendix II provides a detailed analysis of these targets for 2016–17. The results show that Commonwealth environmental water contributed to the targets set for the Lower Lakes in the Basin Watering Strategy. Discharge through the barrages and the mouth contributed to the target flows and available habitat (both spatially and temporally) in the Coorong. The key results are summarised here:
• In 2016–17 The minimum three day rolling average water level at Lake Alexandrina was 0.56 m. The daily water level was never less than 0.4 m in Lake Alexandrina. The minimum water levels in Lake Albert were 0.50 m. The use of Commonwealth environmental water to support levels of the Lower Lakes has been effective in mitigating the impact of low water levels in the Lower Lakes and meeting this Basin Watering Strategy target.
• Commonwealth environmental contributed to the barrage flows for 96% of days (equating to only 14 days where no environmental water was released). The maximum contribution on any one day was 33 811 ML / day whilst the minimum contribution was 9 ML / day with contributions of Commonwealth environmental water comprising between 10% and 100% of daily flows into the Coorong.
• Commonwealth environmental water has possibly contributed to Murray Mouth openness via a small increase in depth of the channel through its deliveries of environmental water over the barrages.
Environmental water releases over the barrages provide benefits to the Ramsar-listed Coorong, where the Australian Government holds an international obligation to protect the site under the Ramsar Convention. It is well established that delivering environmental water in the Coorong has a number of benefits, including reducing salinity via the export and dilution of salt, reducing the ingress of sand from the high energy coastline, improving estuarine fish habitat (Ye et al. 2015) and even at low flows driving an increase in productivity in the estuary.
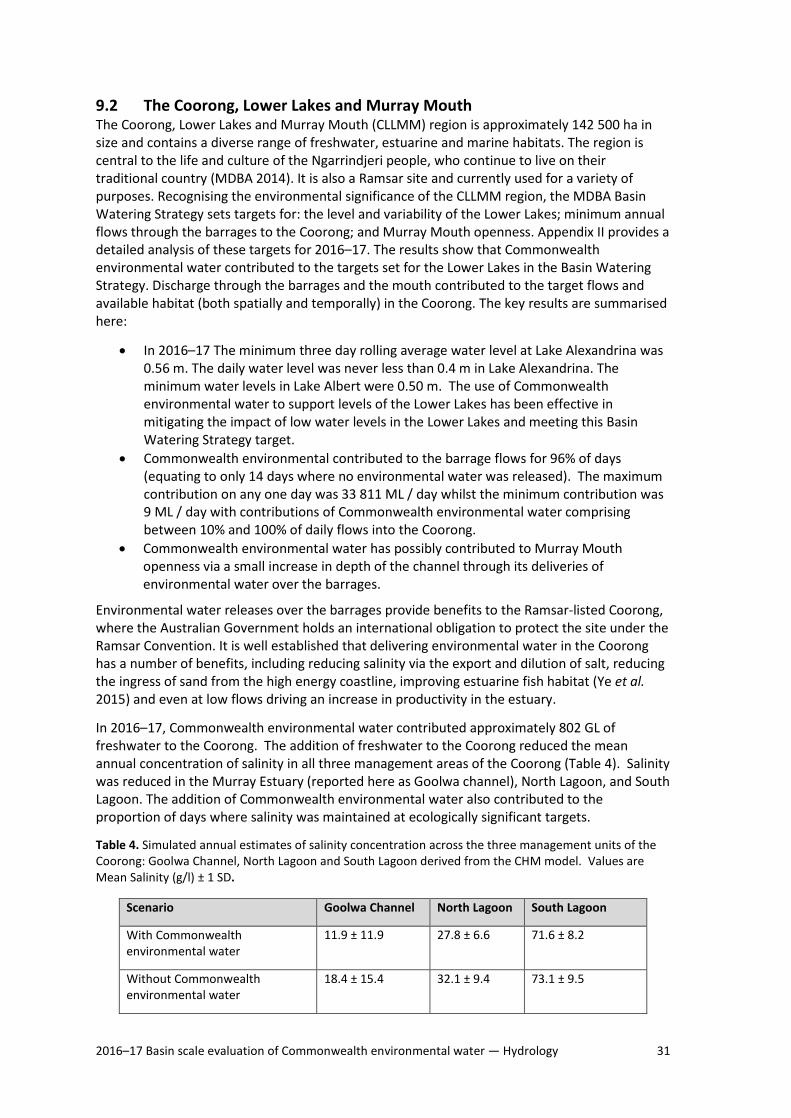
In 2016–17, Commonwealth environmental water contributed approximately 802 GL of freshwater to the Coorong. The addition of freshwater to the Coorong reduced the mean annual concentration of salinity in all three management areas of the Coorong (Table 4). Salinity was reduced in the Murray Estuary (reported here as Goolwa channel), North Lagoon, and South Lagoon. The addition of Commonwealth environmental water also contributed to the proportion of days where salinity was maintained at ecologically significant targets.
Table 4. Simulated annual estimates of salinity concentration across the three management units of the Coorong: Goolwa Channel, North Lagoon and South Lagoon derived from the CHM model. Values are Mean Salinity (g/l) ± 1 SD.
Scenario Goolwa Channel North Lagoon South Lagoon
With Commonwealth environmental water
11.9 ± 11.9 27.8 ± 6.6 71.6 ± 8.2
Without Commonwealth environmental water
18.4 ± 15.4 32.1 ± 9.4 73.1 ± 9.5

2016–17 Basin scale evaluation of Commonwealth environmental water — Hydrology 32
References Colby LH, Maycock SD, Nelligan FA, Pocock HJ, Walker DJ (2010) An investigation into the effect
of dredging on tidal asymmetry at the River Murray Mouth. Journal of Coastal Research 26(5), 843–850.
Docker BB, Johnson HL (2017) Environmental water delivery: Maximising ecological outcomes in a constrained operating environment. In: A.C. Horne & J.A. Webb & M.J. Stewardson & B. Richter & M. Acreman (eds) Water for the Environment: From Policy and Science to Implementation and Management. Elsevier, Cambridge, MA, pp. 563-598.
Geddes, M.C., Shiel, R.,J., Francis, J. Zooplankton n the Murray estuary and Coorong during flow and no-flow periods. Transactions of the Royal Scoiety of South Australia 140(1), 74-89.
Jöhnk, K.D., and Webster, I.T., 2014. Hydrodynamic investigations of the Coorong – Development and application strategy: Water for a Healthy Country National Research Flagship. Canberra.
MDBA (2014) Lower Lakes, Coorong and Murray Mouth Environmental Water Management Plan. MDBA Publication No 10/14. Murray Darling Basin Authority, Canberra, Australia.
O’Donnell EL, Garrick DE (2017) Environmental water organizations and institutional settings. In: A.C. Horne & J.A. Webb & M.J. Stewardson & B. Richter & M. Acreman (eds) Water for the Environment: From Policy and Science to Implementation and Management. Elsevier, Cambridge, MA, pp. 563-598.
Stewardson MJ, Guarino F (2018) Basin-scale environmental water delivery in the Murray–Darling, Australia: A hydrological perspective. Freshwater Biology, Published online doi.org/10.1111/fwb.13102
Webster IT (2010) The hydrodynamics and salinity regime of a coastal lagoon – The Coorong, Australia – seasonal to multi-decadal timescales. Estuarine, Coastal and Shelf Science 90(4), 264–274.
Ye, Q., Livore, J., Aldridge, K., Giatas, G., Hipsey, M., Joehnk, K., Nicol, J., Wilson, P. and Zampatti, B. (2016b). Monitoring ecological response to Commonwealth environmental water delivered to the Lower Murray River in 2013-14. Final Report prepared for the Commonwealth Environmental Water Office. South Australian Research and Development Institute, Aquatic Sciences.

2016–17 Basin scale evaluation of Commonwealth environmental water — Hydrology 33
Appendix I: Details of Evaluation Methods
Data sources for evaluating contribution to flow regimes
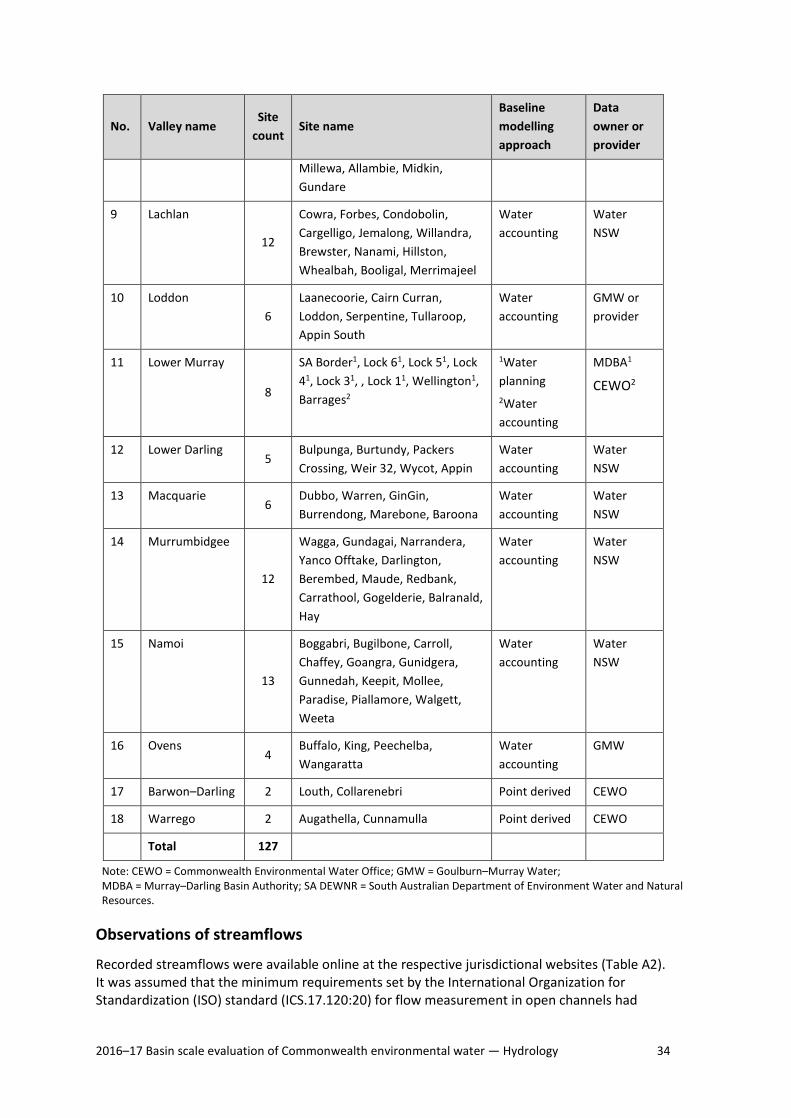
The contribution of Commonwealth environmental water to flow regimes in the Basin is primarily evaluated using streamflow for the 2016–17 watering year. Estimates of the contribution of Commonwealth environmental water were calculated at 128 streamflow sites across 18 valleys within Basin (Table A1). The evaluation of flow regimes is based on a comparison of streamflows recorded at these sites during the 2016–17 year (actual case) with streamflows that would have occurred in the absence of the Commonwealth environmental water program (baseline case). Of the sites where Commonwealth environmental water was delivered, 97 were evaluated to produce flow regime scores.
Table A1. The contribution of Commonwealth environmental water was estimated at 111 streamflow sites across 18 valleys in 2016–17. The names of streamflow sites, the baseline modelling approach and number of sites within each valley is also reported.
No. Valley name Site
count Site name
Baseline modelling approach
Data owner or provider
1 Border Rivers 3 Goondiwindi, Farnbro, Flinton Point derived CEWO
2 Broken 4
Rices Weir, Caseys Weir, Wagarandall, BackCk
Water accounting
GMW
3 Campaspe 3
Barnadown, Rochester, Eppalock Water accounting
GMW
4 Central Murray
11
Doctors, Corowa, Barmah, Yarrawonga, Tocumwal, Torrumbarry, Barham, Swan Hill, Wakool, Euston, Lock 10
Water planning
MDBA
5 Condamine–Balonne
2 Roseleigh, St George Point derived CEWO
6 Edward–Wakool
10
Gee Gee Bridge, Deniliquin, Yallakool Offtake, Colligen Offtake, Tuppal, Niemur R at Barham Rd, Wakool R at Barham Rd, Niemur R at Mallan School, Wakool at offtake regulator, Wakool at Coonamit
Water accounting
Water NSW
7 Goulburn 4
Murchison, Trawool, Eildon, McCoys
Water accounting
GMW
8 Gwydir
20
Pallamallawa, Moree, Yarraman, Carole Offtake, Pinegrove, Gravesend, Copeton, Boolooroo, Combadello, Tareelaroi, Mehi Offtake, Mallowa, Garah, Tyreel, Gingham Diversion, Brageen,
Water accounting
Water NSW
2016–17 Basin scale evaluation of Commonwealth environmental water — Hydrology 34
No. Valley name Site
count Site name
Baseline modelling approach
Data owner or provider
Millewa, Allambie, Midkin, Gundare
9 Lachlan
12
Cowra, Forbes, Condobolin, Cargelligo, Jemalong, Willandra, Brewster, Nanami, Hillston, Whealbah, Booligal, Merrimajeel
Water accounting
Water NSW
10 Loddon 6
Laanecoorie, Cairn Curran, Loddon, Serpentine, Tullaroop, Appin South
Water accounting
GMW or provider
11 Lower Murray
8
SA Border1, Lock 61, Lock 51, Lock 41, Lock 31, , Lock 11, Wellington1, Barrages2
1Water planning 2Water accounting
MDBA1
CEWO2
12 Lower Darling 5
Bulpunga, Burtundy, Packers Crossing, Weir 32, Wycot, Appin
Water accounting
Water NSW
13 Macquarie 6
Dubbo, Warren, GinGin, Burrendong, Marebone, Baroona
Water accounting
Water NSW
14 Murrumbidgee
12
Wagga, Gundagai, Narrandera, Yanco Offtake, Darlington, Berembed, Maude, Redbank, Carrathool, Gogelderie, Balranald, Hay
Water accounting
Water NSW
15 Namoi
13
Boggabri, Bugilbone, Carroll, Chaffey, Goangra, Gunidgera, Gunnedah, Keepit, Mollee, Paradise, Piallamore, Walgett, Weeta
Water accounting
Water NSW
16 Ovens 4
Buffalo, King, Peechelba, Wangaratta
Water accounting
GMW
17 Barwon–Darling 2 Louth, Collarenebri Point derived CEWO
18 Warrego 2 Augathella, Cunnamulla Point derived CEWO
Total 127
Note: CEWO = Commonwealth Environmental Water Office; GMW = Goulburn–Murray Water; MDBA = Murray–Darling Basin Authority; SA DEWNR = South Australian Department of Environment Water and Natural Resources.
Observations of streamflows
Recorded streamflows were available online at the respective jurisdictional websites (Table A2). It was assumed that the minimum requirements set by the International Organization for Standardization (ISO) standard (ICS.17.120:20) for flow measurement in open channels had

2016–17 Basin scale evaluation of Commonwealth environmental water — Hydrology 35
been met by the custodians of the streamflow sites, so we provided no further assessment of data quality other than checking for complete records.
Table A2. Websites used to source discharge data for 111 streamflow sites in the Murray–Darling Basin.
Jurisdiction Water monitoring website
New South Wales http://waterinfo.nsw.gov.au
South Australia https://www.waterconnect.sa.gov.au
Queensland https://water-monitoring.information.qld.gov.au
Victoria http://data.water.vic.gov.au/monitoring.htm
Baseline hydrology scenarios
The evaluation was based on a comparison of observed hydrology (i.e. daily streamflow time series for the 2016-17 watering year) with baseline hydrology represented by daily streamflows for the 2016-17 year in the absence of Commonwealth environmental water. In most cases, the baseline hydrology was estimated as actual flows minus flows delivered from an environmental water entitlement. However, in cases where the baseline was calculated using the water planning model method (described below), a further adjustment was made so that the baseline hydrology represented stream flows that would have occurred in the 2016-17 year if the Commonwealth water portfolio had never been procured (i.e. agricultural water entitlements resemble those before establishment of the Commonwealth environmental water program). This latter case allows evaluation of the combined consequences of the Commonwealth environmental water recovery and delivery program. In the future, we hope to work with data providers to extend the water planning model approach (see below) to more sites.
Baseline hydrology for the 2016–17 year was derived by several agencies using one of the following three approaches: water accounting model; water planning model; and point derivation.
1. Water accounting model: This approach is based on a mass balance of water in river reaches between streamflow sites with a fixed lag time to allow for travel times as well as estimates of losses and gains. Operators enter known factors, such as water orders and water taken, and use empirical data, such as actual unaccounted differences and meteorological data, to calculate saleable components of flow at nominated streamflow sites. Based on these data, the data provider estimates the Commonwealth environmental water and non–Commonwealth environmental water components of the observed time series. The baseline scenario is derived by subtracting the environmental water component from the observed hydrograph at the streamflow gauge. This approach is used by river operators (Goulburn–Murray Water (GMW) and WaterNSW) to provide baseline streamflow series in the Victorian tributaries (Goulburn, Broken, Campaspe, Loddon, Ovens) and regulated valleys of New South Wales (NSW) (Murrumbidgee, Lachlan, Macquarie, Gwydir, Edward–Wakool). This approach is used to provide the time series of environmental water provided by the CEWH and non–Commonwealth environmental water holders separately.
2. Water planning model: The method was developed by the Murray–Darling Basin Authority (MDBA) and applied in the River Murray. In this method, two scenarios were modelled using the MSM-BigMod modelling suite; ‘modelled pre-buyback’ and ‘modelled actual’, for the period between July 2016 and June 2017. The initial conditions of the model were based on

2016–17 Basin scale evaluation of Commonwealth environmental water — Hydrology 36
the 2014-15 model run. The difference between the two model runs measured the impact of environmental water recovery and use during 2016-17. The ‘modelled actual’ flow differs from the actual observed flow at streamflow gauges because of model error. To avoid artefacts associated with this error, we recalculated the ‘pre-buyback’ case by subtracting the difference (i.e. the modelled actual minus the modelled pre-buyback flows) from the actual observed flows. The resulting flow series is used as the baseline. In this model, the total environmental water entitlement is treated as a single component and there is no separate treatment of Commonwealth environmental water and non–Commonwealth environmental water.
3. Point derivation: This method was developed in-house by the CEWO and applies to the unregulated valleys of NSW and Queensland (Border Rivers, and Condamine–Balonne, Warrego and Upper Darling rivers). The CEWO monitors real-time river data to detect when access to Commonwealth unregulated entitlements is triggered. Gauge data, in conjunction with official announcements of water-harvesting access in unregulated valleys (Border Rivers and Lower Balonne and Warrego rivers), are used to estimate in-stream contributions. Volumes are accounted for in accordance with the licence (access) conditions of each entitlement in the same way that other water users manage their take (i.e. water is assumed to be used at all available opportunities when access conditions are triggered). This approach reflects the use pattern of the majority of irrigators in unregulated systems and hence the volumes and pattern of flows that have been reinstated. The baseline scenario was derived by subtracting the Commonwealth environmental water component from the hydrograph.
Commonwealth environmental water delivery is often coordinated with delivery of water by other environmental water holders; hence, the evaluation considers the combined hydrological effect of all environmental water delivery. Where possible, we also indicate the contribution of the Commonwealth environmental water component to the total hydrological effect of all environmental water.
None of these methods comprehensively account for planned environmental water. The focus of this evaluation is on the contribution of Commonwealth environmental water–held environmental water allocations or other environmental water allocations delivered in coordination with this Commonwealth environmental water.
Data sources for evaluating contribution to hydrological connectivity
Floodplain inundation extent
Floodplain and wetland inundation extents in this evaluation are reported as mapped area hectares (ha) and represent monitoring outputs from multiple providers using differing methods (Table A3). The areas reported represent cumulative inundation over the course of the year. An attempt to attribute inundation as Commonwealth environmental water, other environmental water (where the watering actions were separate to Commonwealth actions) and other water (reflecting the inundation associated with natural events) was made. However, this attribution was not straightforward because the information required for attribution was not easily accessible nor determinable and on-ground validation was not comprehensive. Inundation was classified as: Other water (natural events, rainfall/runoff etc), Commonwealth environmental water (high or low certainty), other environmental water, large on farm storages where known and the Coorong Lower Lakes region. High certainty classifications refer to actions such as pumping or where site validation data was provided by environmental water managers whereas low certainty classifications represented inundation areas that included contributions from other environmental water and other water, making attribution difficult to disentangle.
2016–17 Basin scale evaluation of Commonwealth environmental water — Hydrology 37
Attributing inundation Basin wide will remain this way until accurate, reliable and accessible inundation mapping is made available to support defensible and robust monitoring and evaluation.
Watercourses watered
The watercourses watered using Commonwealth environmental water were mapped using information provided via CEWO environmental water delivery personnel and other operational reports. In the regulated rivers where environmental water was ordered from a dam, the reaches downstream to the accounting point (in NSW) were marked as watered (i.e. reaches beyond the end of system were not included) whereas, in Victoria, the reaches watered were extended to the confluence with the River Murray. This distinction was justified on the basis that In Victoria, returning environmental flows are protected whereas in NSW they are not protected. In the unregulated rivers of the northern Basin, CEWO provided advice on the estimated extents of watercourses influenced by Commonwealth environmental water.
2016–17 Basin scale evaluation of Commonwealth environmental water — Hydrology 38
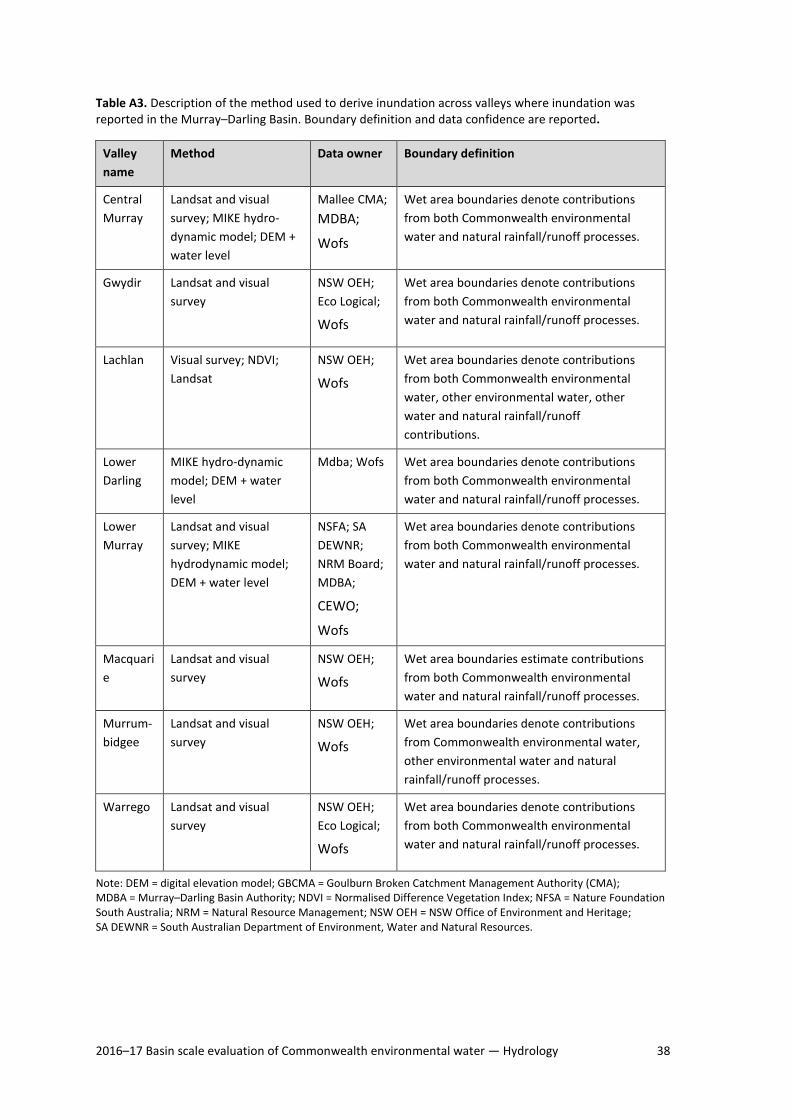
Table A3. Description of the method used to derive inundation across valleys where inundation was reported in the Murray–Darling Basin. Boundary definition and data confidence are reported.
Valley name
Method Data owner Boundary definition
Central Murray
Landsat and visual survey; MIKE hydro-dynamic model; DEM + water level
Mallee CMA; MDBA;
Wofs
Wet area boundaries denote contributions from both Commonwealth environmental water and natural rainfall/runoff processes.
Gwydir Landsat and visual survey
NSW OEH; Eco Logical;
Wofs
Wet area boundaries denote contributions from both Commonwealth environmental water and natural rainfall/runoff processes.
Lachlan Visual survey; NDVI; Landsat
NSW OEH;
Wofs
Wet area boundaries denote contributions from both Commonwealth environmental water, other environmental water, other water and natural rainfall/runoff contributions.
Lower Darling
MIKE hydro-dynamic model; DEM + water level
Mdba; Wofs Wet area boundaries denote contributions from both Commonwealth environmental water and natural rainfall/runoff processes.
Lower Murray
Landsat and visual survey; MIKE hydrodynamic model; DEM + water level
NSFA; SA DEWNR; NRM Board; MDBA;
CEWO;
Wofs
Wet area boundaries denote contributions from both Commonwealth environmental water and natural rainfall/runoff processes.
Macquarie
Landsat and visual survey
NSW OEH;
Wofs
Wet area boundaries estimate contributions from both Commonwealth environmental water and natural rainfall/runoff processes.
Murrum-bidgee
Landsat and visual survey
NSW OEH;
Wofs
Wet area boundaries denote contributions from Commonwealth environmental water, other environmental water and natural rainfall/runoff processes.
Warrego Landsat and visual survey
NSW OEH; Eco Logical;
Wofs
Wet area boundaries denote contributions from both Commonwealth environmental water and natural rainfall/runoff processes.
Note: DEM = digital elevation model; GBCMA = Goulburn Broken Catchment Management Authority (CMA); MDBA = Murray–Darling Basin Authority; NDVI = Normalised Difference Vegetation Index; NFSA = Nature Foundation South Australia; NRM = Natural Resource Management; NSW OEH = NSW Office of Environment and Heritage; SA DEWNR = South Australian Department of Environment, Water and Natural Resources.
2016–17 Basin scale evaluation of Commonwealth environmental water — Hydrology 39
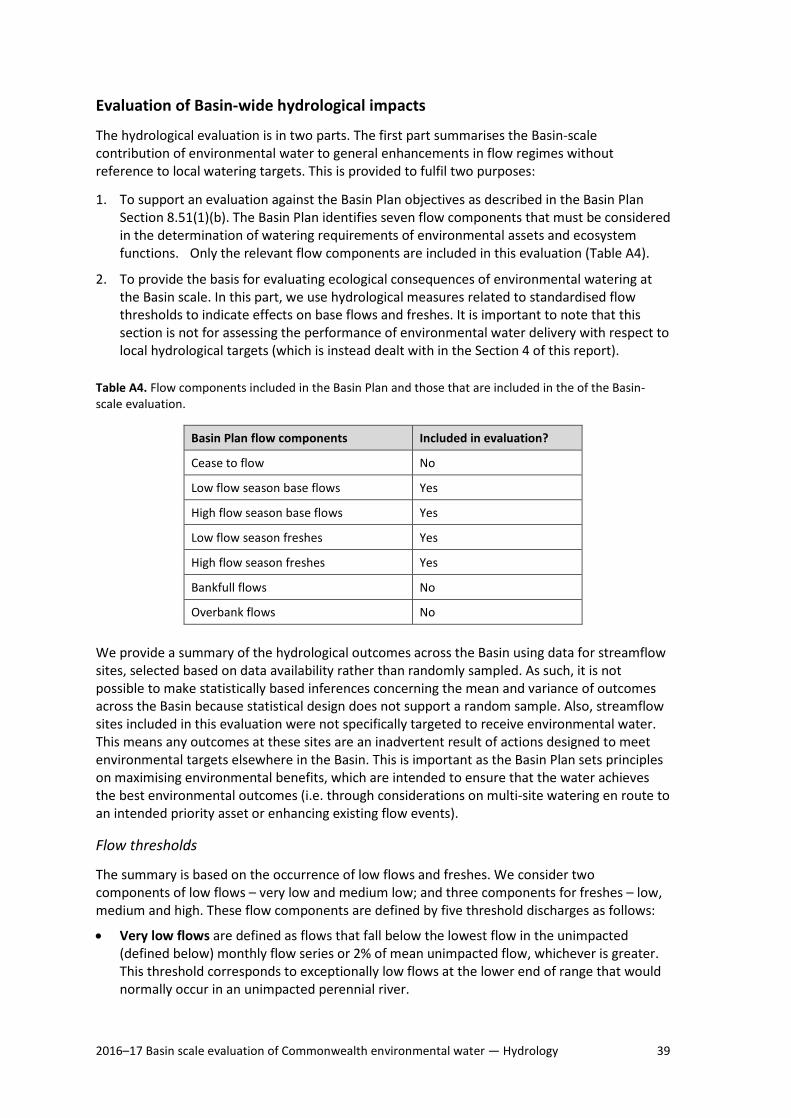
Evaluation of Basin-wide hydrological impacts
The hydrological evaluation is in two parts. The first part summarises the Basin-scale contribution of environmental water to general enhancements in flow regimes without reference to local watering targets. This is provided to fulfil two purposes:
1. To support an evaluation against the Basin Plan objectives as described in the Basin Plan Section 8.51(1)(b). The Basin Plan identifies seven flow components that must be considered in the determination of watering requirements of environmental assets and ecosystem functions. nOnly the relevant flow components are included in this evaluation (Table A4).
2. To provide the basis for evaluating ecological consequences of environmental watering at the Basin scale. In this part, we use hydrological measures related to standardised flow thresholds to indicate effects on base flows and freshes. It is important to note that this section is not for assessing the performance of environmental water delivery with respect to local hydrological targets (which is instead dealt with in the Section 4 of this report).
Table A4. Flow components included in the Basin Plan and those that are included in the of the Basin-scale evaluation.
Basin Plan flow components Included in evaluation?
Cease to flow No
Low flow season base flows Yes
High flow season base flows Yes
Low flow season freshes Yes
High flow season freshes Yes
Bankfull flows No
Overbank flows No
We provide a summary of the hydrological outcomes across the Basin using data for streamflow sites, selected based on data availability rather than randomly sampled. As such, it is not possible to make statistically based inferences concerning the mean and variance of outcomes across the Basin because statistical design does not support a random sample. Also, streamflow sites included in this evaluation were not specifically targeted to receive environmental water. This means any outcomes at these sites are an inadvertent result of actions designed to meet environmental targets elsewhere in the Basin. This is important as the Basin Plan sets principles on maximising environmental benefits, which are intended to ensure that the water achieves the best environmental outcomes (i.e. through considerations on multi-site watering en route to an intended priority asset or enhancing existing flow events).
Flow thresholds
The summary is based on the occurrence of low flows and freshes. We consider two components of low flows – very low and medium low; and three components for freshes – low, medium and high. These flow components are defined by five threshold discharges as follows:
• Very low flows are defined as flows that fall below the lowest flow in the unimpacted (defined below) monthly flow series or 2% of mean unimpacted flow, whichever is greater. This threshold corresponds to exceptionally low flows at the lower end of range that would normally occur in an unimpacted perennial river.
2016–17 Basin scale evaluation of Commonwealth environmental water — Hydrology 40
• Medium low flows are defined as flows that fall below the 95th percentile exceedance flow in the unimpacted monthly flow series or 10% of the mean unimpacted flow, whichever is greater. This flow threshold corresponds to a value that might typically be used as a minimum flow to maintain low flow habitats.
• Low freshes are defined as flow spells that raise water levels at least one-eighth of the height of the bank above the medium low flow level. This threshold corresponds to a slight increase in stage above base flow levels and would be a frequent occurrence in both the dry and wet seasons under unimpacted flow conditions.
• Medium freshes are defined as flow spells that raise water levels at least one-quarter of the height of the bank above the medium low flow level. This threshold corresponds to an increase in stage that wets the lower part of the bank and would be a frequent occurrence in an unimpacted regime maintaining moist soils and is an important component of a variable watering regime for this portion of the channel throughout the year.
• High freshes are defined as flow spells that raise water levels at least half of the height of the bank above the medium low flow level. Freshes of this magnitude would have occurred in most years in the unimpacted flow regime, and it would be common for freshes to exceed this threshold several times per year.
The unimpacted flow is the expected flow series without development conditions under an historical climate. Unimpacted monthly flow series were provided by the MDBA for sites across the Basin. These were not always the same sites as used in this evaluation of Commonwealth environmental water delivery. In most of these cases, the nearest appropriate unimpacted flow data site was chosen. There were a small number of sites where unimpacted flow series were modelled using the various water planning models across the Basin during the development of the Basin Plan. The bankfull discharge was estimated either as the 5th percentile exceedance in the monthly unimpacted flow (×1.5 as a rough estimate of peak daily flow based on the mean monthly value) or from channel dimensions available for sites across the Basin (these were data collected for the Sustainable Rivers Audit II – Physical Form Theme). Dimensions were taken from the site closest to each of our hydrological evaluation sites, and on the same river channel. Bankfull discharge was estimated from these dimensions using equation M15 in Stewardson et al. (2005). We generally used the larger of these two bankfull estimates but made some exceptions based on individual site considerations. The estimates of discharge corresponding to the low, median and high fresh water levels (defined above) were based on widely accepted at-a-station hydraulic geometry equations (Stewardson 2005).
Flow regime score
We calculated a flow regime ‘score’ corresponding to each of the five flow thresholds. The score is a number equal to or between zero and one. The purpose of this score is to provide a summary of the flow regime and identify contributions of environmental water to protection and restoration of flow regimes across the Basin. In the case of the two low flow thresholds, the score relates to the maintenance of flows above the very low and medium low flow thresholds in each calendar season. Under unimpacted conditions, there would have been a broad range of base flow regimes across the Basin, including some intermittent rivers. To allow for this, the score was calculated based on a comparison of 2016-17 low flows with unimpacted low flows. The score measures the duration of flows exceeding our two low flow thresholds in each calendar season relative to the normal duration in the unimpacted state. If the average unimpacted base flow durations were maintained in 2016-17, then the site received the maximum score of ‘1‘. A reduction in the duration compared with unimpacted duration, in any of the four seasons, reduced the score. If we applied this score to an unimpacted regime, we could expect that, in dry years, we would get a lower score than in average and wet years. The score is not an environmental flow objective, rather an indication of the dryness of the low flow

2016–17 Basin scale evaluation of Commonwealth environmental water — Hydrology 41
regime in 2016–17 and the components of the flow regime that are significantly affected by environmental watering actions.
Similarly, a score was calculated for each of the three thresholds corresponding to low, medium and high freshes. However, we did not attempt to adjust these scores based on a comparison with the unimpacted flow regime. Instead, the score relates to the occurrence (or not) of flow freshes exceeding these fresh thresholds. For the low fresh threshold, the duration of flows above this threshold within a calendar season must have exceeded 3 days for a ‘fresh’ to be considered to have occurred. The maximum score (of ‘1’) was achieved for the low fresh if a fresh occurred in three of the calendar seasons. For the medium fresh, the maximum score was achieved if a fresh occurred in at least two calendar seasons. For the high fresh, the maximum score was achieved if a fresh exceeded this threshold at some time over the year.
In Annex A, we report scores for each site but simplify the results by combining the two low flow scores into a single base flow score and the three scores for the flow fresh thresholds into a single freshes score. The freshes score (reported in the Annex A) weights the low, medium and high fresh scores according to the percentage weights 50:30:20, respectively.
We emphasise that these scores are not an evaluation of individual watering actions and their associated objectives. The scores are used to summarise the flow regime at sites across the Basin and support an evaluation of the overall effect of the management of Commonwealth environmental water on flow regimes at the Basin scale. For this reason, a number of the sites included in the analysis were not actually targeted with environmental watering actions.
Attribution of Commonwealth environmental water
Commonwealth environmental water delivery is often coordinated with delivery of other environmental water to achieve a combined outcome. In such cases, it makes little sense to consider the contribution of the Commonwealth environmental water in isolation. For consistency, we have evaluated the aggregate hydrological outcome of all held environmental water.
The total contributions of all environmental water cannot be fully attributable to the Commonwealth environmental water in situations where there is coordinated delivery with other environmental water holders. To address this issue, we have developed a simple procedure for sharing score increases between Commonwealth environmental water and other environmental water:
1. Calculate the total improvement in score with all environmental water entitlements (i.e. compare the score for the observed and baseline flow regimes).
2. Calculate the improvement that would have been achieved if Commonwealth environmental water was delivered on its own.
3. Calculate the improvement if the non–Commonwealth environmental water had been delivered on its own.
4. Apportion the total improvement (from 1 above) to Commonwealth environmental water and non–Commonwealth environmental water based on the ratio of improvements achieved in 2 and 3 above.
2016–17 Basin scale evaluation of Commonwealth environmental water — Hydrology 42
Method used for comparing valley outflow in pre- and post-CEWH periods
We use BoM water account data to estimate changes in Basin outflows as a proportion of mean inflows. We expect that outflows will have increased as a result of environmental water recovery and delivery by the CEWH and other environmental water agencies. The water account data is available by water year for the period July 2000 to June 2017. Our analysis compares outflows for the period July 2012 to June 2017 (the post-CEWH period) with outflows during the period July 2000 to June 2008 (the pre-CEWH period). We do not include the period between July 2008 and June 2012 when commonwealth water holdings were rapidly increasing following the establishment of the CEWH. We describe the analysis methods here for completeness.
For each water year we calculate net inflow to each valley as the sum of inflows from any upstream valleys, and surface water runoff into the river network within the valley, less any change in storage volumes within the valley. We also made a further adjustment to inflows to account for rainfall and evaporation from storages. For simplicity we refer to this net inflow simply as the “the inflow”. Outflows were provided by the BoM for each valley using data from the streamflow gauge furthest downstream in each valley. A key strength of these data is that they have not been derived using water resource models, so they are independent of assumptions regarding water use and losses within the regulated river network.
Valley outflows will generally increase with valley inflows (i.e. greater outflows in wetter years). This is indeed shown for the entire Basin in Figure 15 for each of the two periods. In order to minimise the effect of differences in inflow magnitudes when we compare the pre- and post-CEWH periods, we adjusted the observed outflows to a single reference value for each period corresponding to the same inflow condition. The reference value we taken as the outflow estimated for mean inflow conditions over the period of record (July 2000 to June 2017). In the Basin, the mean inflow over the period of record is close to 25,000 Gl. Using this mean inflow, we estimated the reference outflows for the pre- and post-CEWH periods as 260 and 1,280 Gl respectively (or 1% and 5% of mean inflows). These reference outflows are estimated using a log-log regression fitted to the observed outflows for each of the two periods.
Based on these results, the increase in proportion of mean Basin inflows that reach the downstream end of the Murray River is 4% (i.e. an increase from 1% to 5% of mean inflows). This is the value shown in Figure 14.
It is important to note that the observed changes in outflows between the pre- and post-CEWH periods cannot be solely attributed to commonwealth environmental water recovery and delivery. Other factors that will have contributed to this change include:
• Trade of consumptive water between valleys; • Variation in river operation policy between the two periods; and • Altered evapotranspiration and groundwater recharge/discharge behaviour (along the rivers
and floodplains within the valley) between the two periods noting the dominance of the millennium drought during the pre-CEWH period.
2016–17 Basin scale evaluation of Commonwealth environmental water — Hydrology 43
Appendix II: Detailed Results for The Coorong, Lower Lakes and Murray Mouth
MDBA Environmental Watering Priority: The MDBA Basin-wide Environmental Watering Strategy sets targets for: the level and variability of the Lower Lakes; minimum annual flows through the barrages to the Coorong; and Murray Mouth openness.
Summary of outcomes and Commonwealth environmental water contribution: The Commonwealth environmental water contributed to the targets set for the Lower Lakes in the Basin Watering Strategy. Discharge through the barrages and the mouth contributed to the target flows and available habitat (both spatially and temporally) in the Coorong.
The Coorong, Lower Lakes and Murray Mouth (CLLMM) region is approximately 142 500 ha in size and contains a diverse range of freshwater, estuarine and marine habitats. The region is central to the life and culture of the Ngarrindjeri people, who continue to live on their traditional country1. It is also a Ramsar site and currently used for several purposes, including conservation, recreation, water storage and extraction, grazing, cropping, and urban and residential development.
This region includes Lake Albert, Lake Alexandrina, the Murray estuary and the Murray Mouth. Lake Albert is a terminal lake connected to Lake Alexandrina by a narrow channel. They are collectively referred to as the Lower Lakes and hold fresh to brackish and saline waters. A series of barrages, constructed between 1935 and 1940, maintain a consistent water level in the lakes and to protect agricultural areas from exposure to saltwater moving upstream from the river mouth. The five barrages span the Goolwa, Mundoo, Boundary Creek, Ewe Island and Tauwitchere channels. Downstream of the barrages, The Coorong comprises two lagoons (known as the North and South). Together, they form a long, shallow, lagoon with brackish to hypersaline water, which is more than 100 kilometres long. The Coorong is separated from the Southern Ocean by a narrow sand dune peninsula.
We evaluated hydrological and salinity outcomes in the Coorong, Lower Lakes and Murray Mouth based on the contribution of Commonwealth environmental water to: water levels in the Lower Lakes; Murray Mouth openness, including barrage releases; and indirect hydrological impact on salinity. These criteria reflect Basin Plan objectives and Annual Environmental Watering Priorities.
Water levels in the Lower Lakes
The Basin Plan lists specific end-of-Basin guidance for the Lower Lakes, while the Basin Wide Watering Strategy (BWS) (MDBA 2014) lists quantifiable objectives for end-of-Basin flows. The BWS target for the Lower Lakes is to maintain the level of the lakes at above sea level and 0.4 m Australian height datum (AHD), for 95% of the time, as far as practicable to allow for barrage releases.
In 2016-17 the minimum three day rolling average water level at Lake Alexandrina was 0.56 m. The daily water level was never less than 0.4 m in Lake Alexandrina. The minimum water levels in Lake Albert were 0.50m, intentionally drawn down over autumn to enhance habitat for waterbirds and support riparian vegetation. The use of Commonwealth environmental water to
1 MDBA (2014) Lower Lakes, Coorong and Murray Mouth Environmental Water Management Plan. MDBA Publication No 10/14. Murray Darling Basin Authority, Canberra, Australia.
2016–17 Basin scale evaluation of Commonwealth environmental water — Hydrology 44
support levels of the Lower Lakes has enabled this action to be undertaken, mitigating the impact of extended low water levels in the Lower Lakes, while ensuring the BWS target was met.
The contribution of Commonwealth environmental water to barrage flows of the Murray Mouth
Five barrages exist in the Lower Murray to assist water managers to deliver water into the Coorong and Murray Mouth as well as for managing the water levels of the Lower Lakes.
Approximately 802 GL of Commonwealth environmental water (approximately 12% of flow through the Barrages) was released from the Lower Lakes into the Coorong during the 2016–17 watering year. Commonwealth environmental contributed to the barrage flows for 96% of days (equating to only 14 days where no environmental water was released). The maximum contribution on any one day was 33 811 Ml/day whilst the minimum contribution was nine ML/day with contributions of Commonwealth environmental water comprising between 10% and 100% of daily flows into the Coorong.
Murray Mouth
The Murray Mouth depth is highly variable with increasing depth during high river flows and decreasing depth under low flows. The maintenance of an open river mouth been reliant on the dominance of high flows which flush sediments over the tidal-dominated and coastal processes. It is to no surprise then, that a trend of decreasing flows in this region has contributed to the Murray Mouth filling with ocean-derived sediment for over 150 years (Colby et al. 2010).
In this evaluation, we assessed the contribution that Commonwealth environmental water to keeping the Murray Mouth open using the depth of the Murray Mouth as an indicator. For this, we estimate the effective bed elevation of the Murray Mouth using the model developed by Webster (2010) for two scenarios: (a) without Commonwealth environmental water and (b) with Commonwealth environmental water. More details on the channel dynamics model can be found in Webster (2010); for details on how modelled flow inputs were derived, refer to Section 2.2 of this report. This modelling has not represented dredging undertaken at the Murray Mouth.
Our modelling showed that with the addition of Commonwealth environmental water the mean annual depth of the Murray mouth was slightly deeper (–2.65 ± 1.02 m), than the scenario without Commonwealth environmental water (–2.41 ± 1.06 m) (Figure CLM1). These simulations indicate that Commonwealth environmental water has possibly contributed to Murray Mouth openness via a small increase in depth of the channel through its deliveries of environmental water over the barrages (Figure 2).
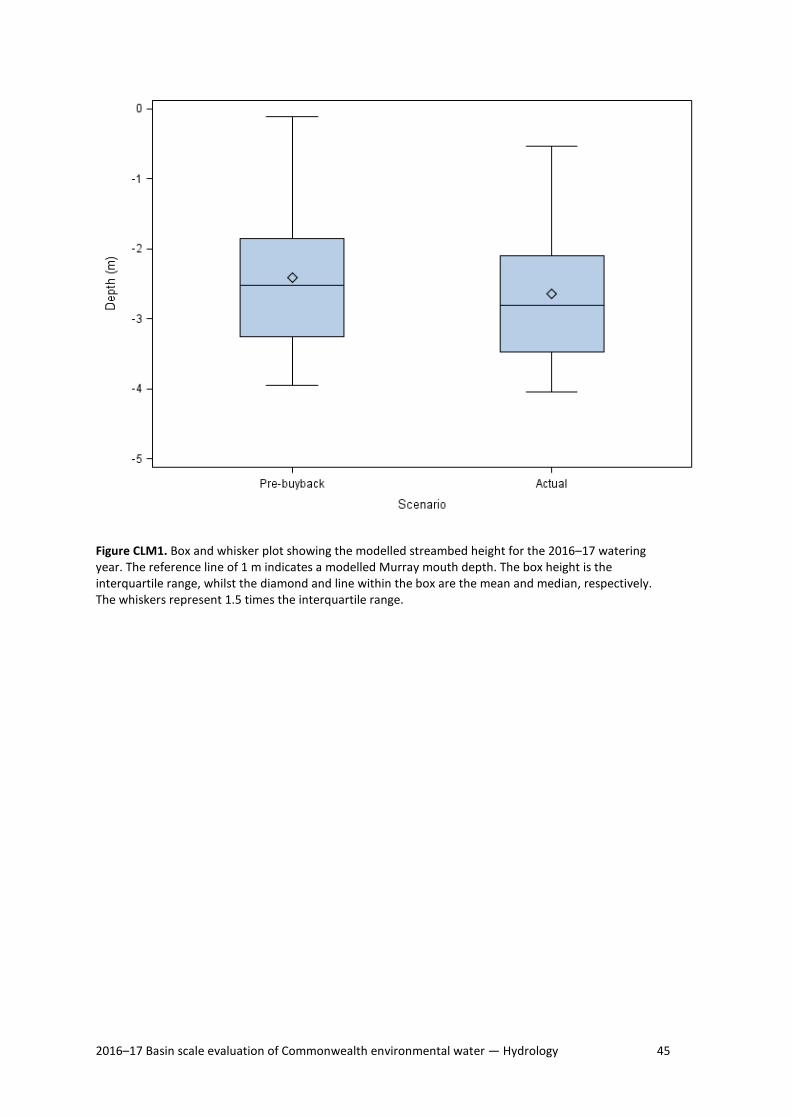
2016–17 Basin scale evaluation of Commonwealth environmental water — Hydrology 45
Figure CLM1. Box and whisker plot showing the modelled streambed height for the 2016–17 watering year. The reference line of 1 m indicates a modelled Murray mouth depth. The box height is the interquartile range, whilst the diamond and line within the box are the mean and median, respectively. The whiskers represent 1.5 times the interquartile range.
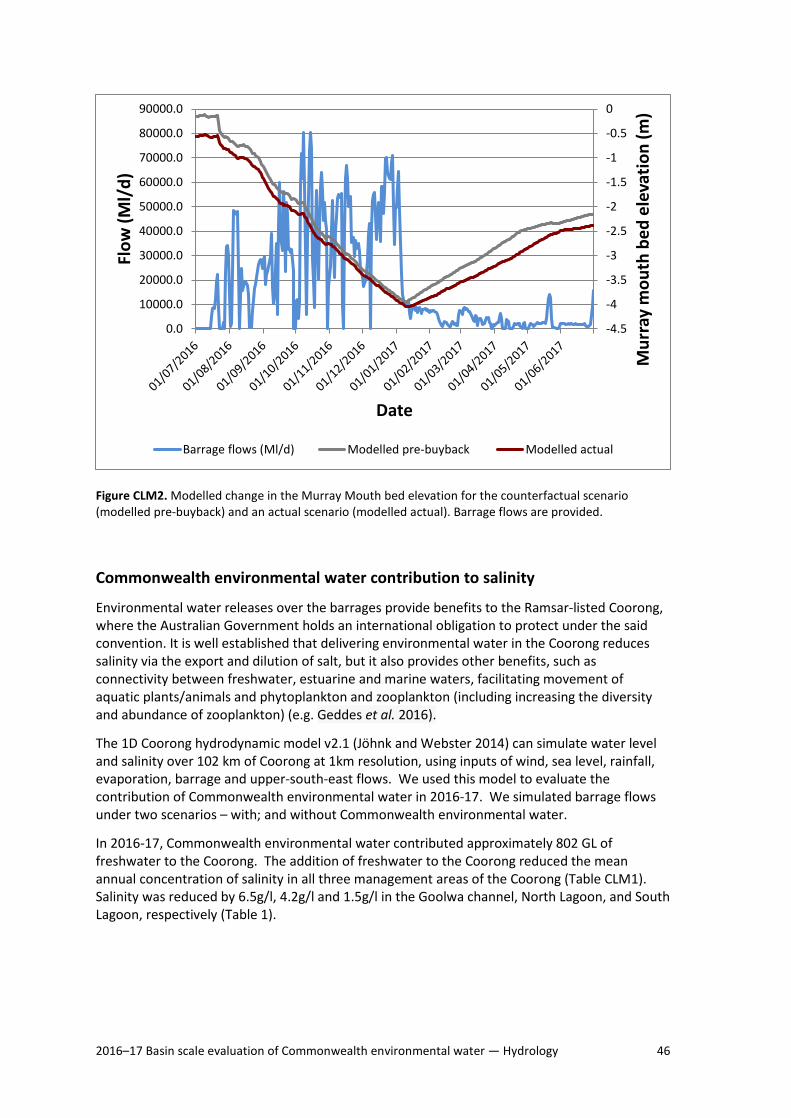
2016–17 Basin scale evaluation of Commonwealth environmental water — Hydrology 46
Figure CLM2. Modelled change in the Murray Mouth bed elevation for the counterfactual scenario (modelled pre-buyback) and an actual scenario (modelled actual). Barrage flows are provided.
Commonwealth environmental water contribution to salinity
Environmental water releases over the barrages provide benefits to the Ramsar-listed Coorong, where the Australian Government holds an international obligation to protect under the said convention. It is well established that delivering environmental water in the Coorong reduces salinity via the export and dilution of salt, but it also provides other benefits, such as connectivity between freshwater, estuarine and marine waters, facilitating movement of aquatic plants/animals and phytoplankton and zooplankton (including increasing the diversity and abundance of zooplankton) (e.g. Geddes et al. 2016).
The 1D Coorong hydrodynamic model v2.1 (Jöhnk and Webster 2014) can simulate water level and salinity over 102 km of Coorong at 1km resolution, using inputs of wind, sea level, rainfall, evaporation, barrage and upper-south-east flows. We used this model to evaluate the contribution of Commonwealth environmental water in 2016-17. We simulated barrage flows under two scenarios – with; and without Commonwealth environmental water.
In 2016-17, Commonwealth environmental water contributed approximately 802 GL of freshwater to the Coorong. The addition of freshwater to the Coorong reduced the mean annual concentration of salinity in all three management areas of the Coorong (Table CLM1). Salinity was reduced by 6.5g/l, 4.2g/l and 1.5g/l in the Goolwa channel, North Lagoon, and South Lagoon, respectively (Table 1).
-4.5
-4
-3.5
-3
-2.5
-2
-1.5
-1
-0.5
0
0.0
10000.0
20000.0
30000.0
40000.0
50000.0
60000.0
70000.0
80000.0
90000.0
Mur
ray
mou
th b
ed e
leva
tion
(m)
Flow
(Ml/
d)
Date
Barrage flows (Ml/d) Modelled pre-buyback Modelled actual
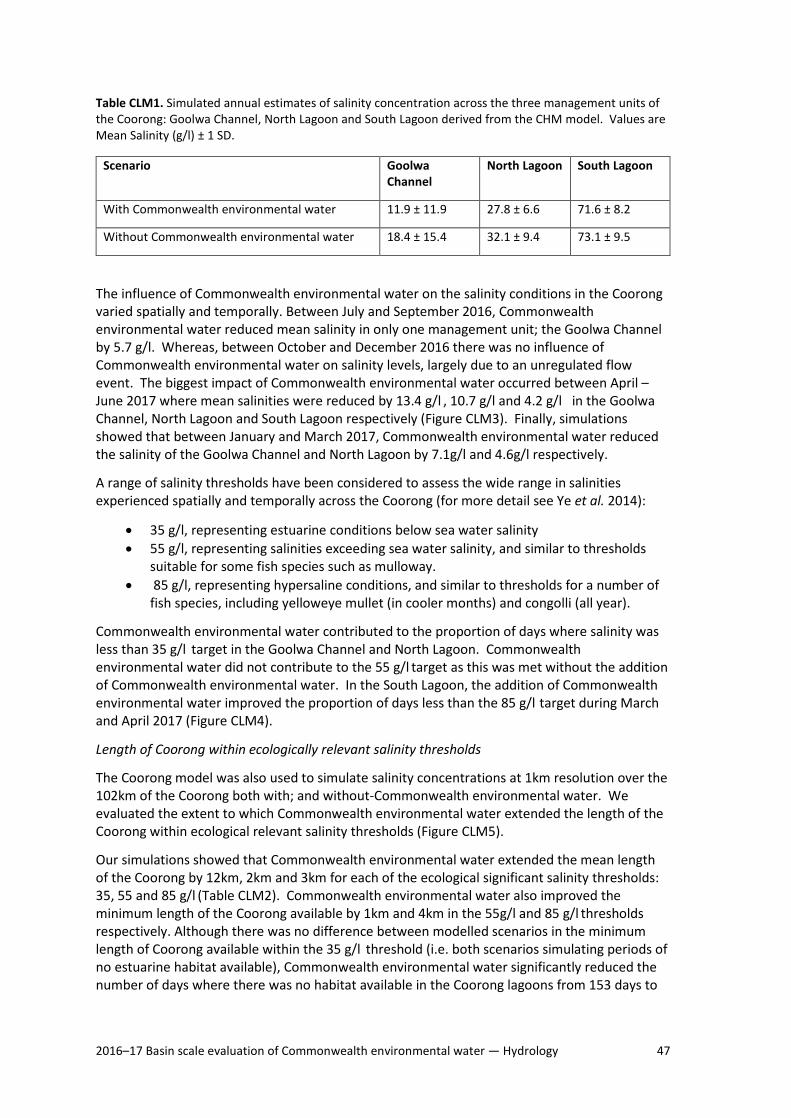
2016–17 Basin scale evaluation of Commonwealth environmental water — Hydrology 47
Table CLM1. Simulated annual estimates of salinity concentration across the three management units of the Coorong: Goolwa Channel, North Lagoon and South Lagoon derived from the CHM model. Values are Mean Salinity (g/l) ± 1 SD.
Scenario Goolwa Channel
North Lagoon South Lagoon
With Commonwealth environmental water 11.9 ± 11.9 27.8 ± 6.6 71.6 ± 8.2
Without Commonwealth environmental water 18.4 ± 15.4 32.1 ± 9.4 73.1 ± 9.5
The influence of Commonwealth environmental water on the salinity conditions in the Coorong varied spatially and temporally. Between July and September 2016, Commonwealth environmental water reduced mean salinity in only one management unit; the Goolwa Channel by 5.7 g/l. Whereas, between October and December 2016 there was no influence of Commonwealth environmental water on salinity levels, largely due to an unregulated flow event. The biggest impact of Commonwealth environmental water occurred between April – June 2017 where mean salinities were reduced by 13.4 g/l , 10.7 g/l and 4.2 g/l in the Goolwa Channel, North Lagoon and South Lagoon respectively (Figure CLM3). Finally, simulations showed that between January and March 2017, Commonwealth environmental water reduced the salinity of the Goolwa Channel and North Lagoon by 7.1g/l and 4.6g/l respectively.
A range of salinity thresholds have been considered to assess the wide range in salinities experienced spatially and temporally across the Coorong (for more detail see Ye et al. 2014):
• 35 g/l, representing estuarine conditions below sea water salinity • 55 g/l, representing salinities exceeding sea water salinity, and similar to thresholds
suitable for some fish species such as mulloway. • 85 g/l, representing hypersaline conditions, and similar to thresholds for a number of
fish species, including yelloweye mullet (in cooler months) and congolli (all year).
Commonwealth environmental water contributed to the proportion of days where salinity was less than 35 g/l target in the Goolwa Channel and North Lagoon. Commonwealth environmental water did not contribute to the 55 g/l target as this was met without the addition of Commonwealth environmental water. In the South Lagoon, the addition of Commonwealth environmental water improved the proportion of days less than the 85 g/l target during March and April 2017 (Figure CLM4).
Length of Coorong within ecologically relevant salinity thresholds
The Coorong model was also used to simulate salinity concentrations at 1km resolution over the 102km of the Coorong both with; and without-Commonwealth environmental water. We evaluated the extent to which Commonwealth environmental water extended the length of the Coorong within ecological relevant salinity thresholds (Figure CLM5).
Our simulations showed that Commonwealth environmental water extended the mean length of the Coorong by 12km, 2km and 3km for each of the ecological significant salinity thresholds: 35, 55 and 85 g/l (Table CLM2). Commonwealth environmental water also improved the minimum length of the Coorong available by 1km and 4km in the 55g/l and 85 g/l thresholds respectively. Although there was no difference between modelled scenarios in the minimum length of Coorong available within the 35 g/l threshold (i.e. both scenarios simulating periods of no estuarine habitat available), Commonwealth environmental water significantly reduced the number of days where there was no habitat available in the Coorong lagoons from 153 days to
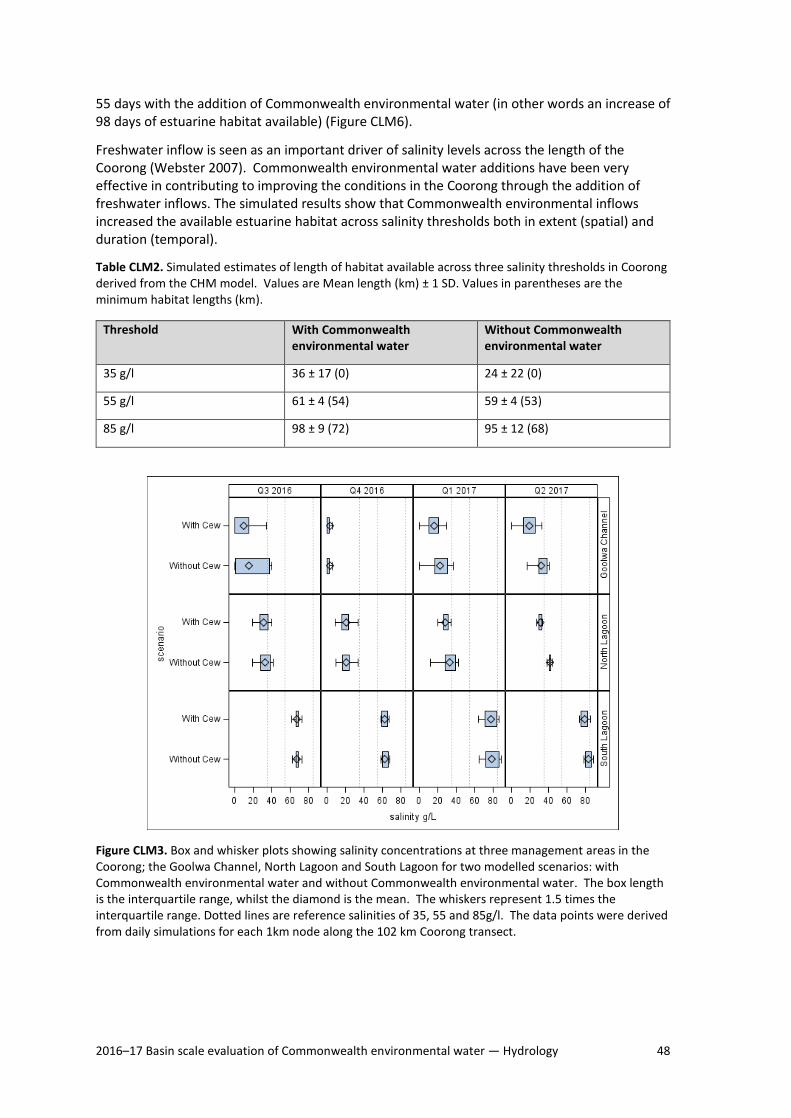
2016–17 Basin scale evaluation of Commonwealth environmental water — Hydrology 48
55 days with the addition of Commonwealth environmental water (in other words an increase of 98 days of estuarine habitat available) (Figure CLM6).
Freshwater inflow is seen as an important driver of salinity levels across the length of the Coorong (Webster 2007). Commonwealth environmental water additions have been very effective in contributing to improving the conditions in the Coorong through the addition of freshwater inflows. The simulated results show that Commonwealth environmental inflows increased the available estuarine habitat across salinity thresholds both in extent (spatial) and duration (temporal).
Table CLM2. Simulated estimates of length of habitat available across three salinity thresholds in Coorong derived from the CHM model. Values are Mean length (km) ± 1 SD. Values in parentheses are the minimum habitat lengths (km).
Threshold With Commonwealth environmental water
Without Commonwealth environmental water
35 g/l 36 ± 17 (0) 24 ± 22 (0)
55 g/l 61 ± 4 (54) 59 ± 4 (53)
85 g/l 98 ± 9 (72) 95 ± 12 (68)
Figure CLM3. Box and whisker plots showing salinity concentrations at three management areas in the Coorong; the Goolwa Channel, North Lagoon and South Lagoon for two modelled scenarios: with Commonwealth environmental water and without Commonwealth environmental water. The box length is the interquartile range, whilst the diamond is the mean. The whiskers represent 1.5 times the interquartile range. Dotted lines are reference salinities of 35, 55 and 85g/l. The data points were derived from daily simulations for each 1km node along the 102 km Coorong transect.
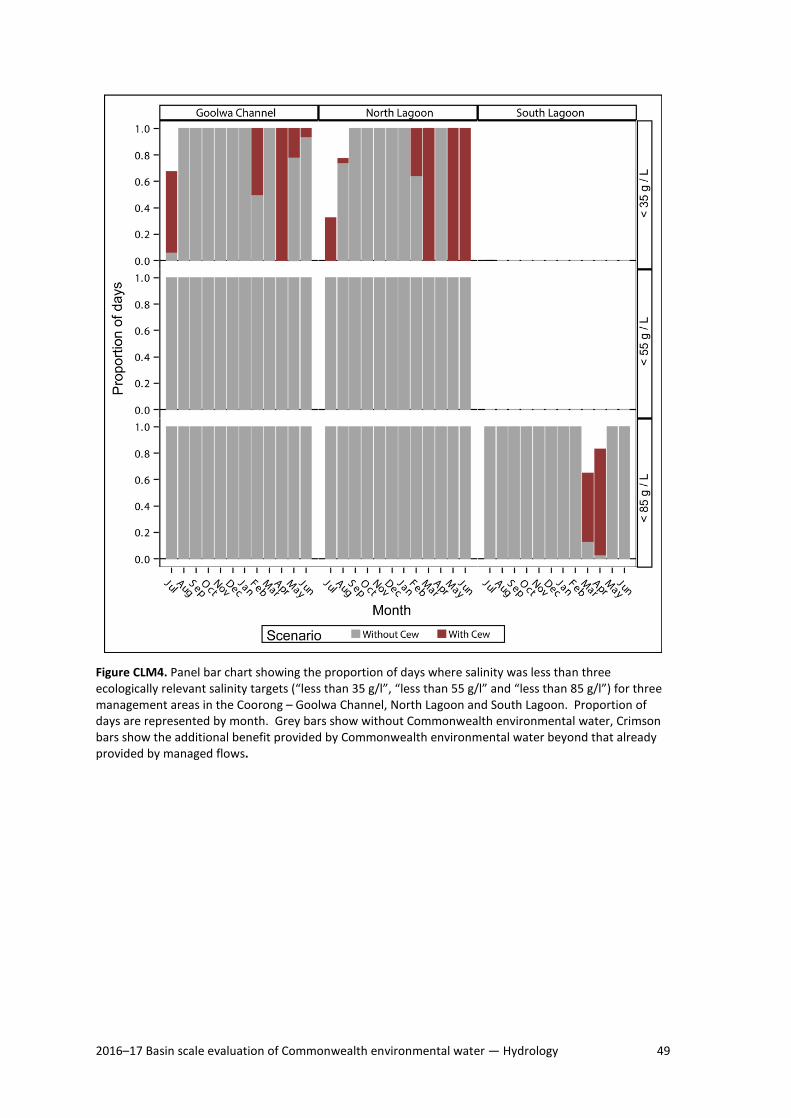
2016–17 Basin scale evaluation of Commonwealth environmental water — Hydrology 49
Figure CLM4. Panel bar chart showing the proportion of days where salinity was less than three ecologically relevant salinity targets (“less than 35 g/l”, “less than 55 g/l” and “less than 85 g/l”) for three management areas in the Coorong – Goolwa Channel, North Lagoon and South Lagoon. Proportion of days are represented by month. Grey bars show without Commonwealth environmental water, Crimson bars show the additional benefit provided by Commonwealth environmental water beyond that already provided by managed flows.

2016–17 Basin scale evaluation of Commonwealth environmental water — Hydrology 50
Figure CLM5. Panel line chart showing the length of Coorong over the 2016 – 2017 water year across four ecologically relevant salinity targets. The simulated outputs are shown for the scenario with Commonwealth environmental water (crimson) and without Commonwealth environmental water (grey).
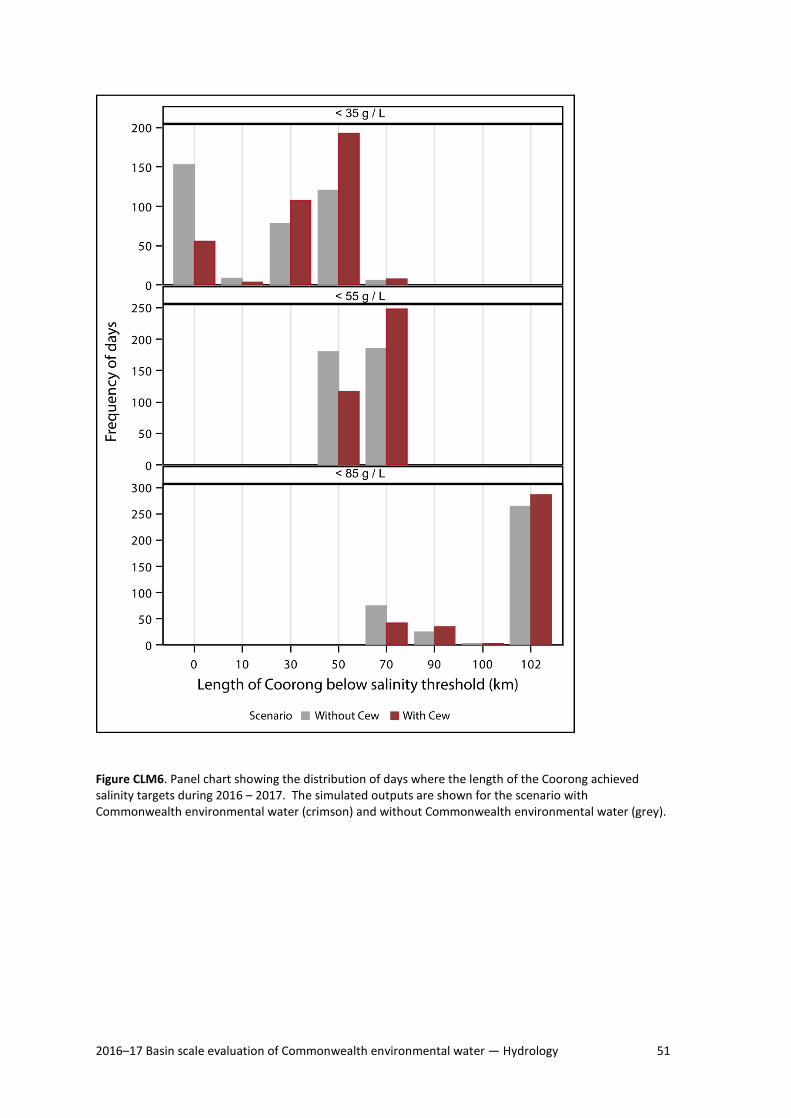
2016–17 Basin scale evaluation of Commonwealth environmental water — Hydrology 51
Figure CLM6. Panel chart showing the distribution of days where the length of the Coorong achieved salinity targets during 2016 – 2017. The simulated outputs are shown for the scenario with Commonwealth environmental water (crimson) and without Commonwealth environmental water (grey).