design of ecological concrete by particle packing ... · ‘groen beton’. besides the ecological...
TRANSCRIPT

Design of ecological concrete by particle packing
optimization
Pieter Ballieu
Supervisor: Prof. dr. ir. Geert De Schutter
Counsellor: Dr. ir. Jeroen Dils
Master's dissertation submitted in order to obtain the academic degree of
Master of Science in Civil Engineering
Department of Structural Engineering
Chairman: Prof. dr. ir. Luc Taerwe
Faculty of Engineering and Architecture
Academic year 2014-2015


I
The author gives permission to make this master dissertation available for consultation and
to copy parts of this master dissertation for personal use.
In the case of any other use, the copyright terms have to be respected, in particular with
regard to the obligation to state expressly the source when quoting results from this master
dissertation.
Gent, 22 May 2015
Pieter Ballieu
II
Foreword
Without the help of a lot of people, writing a thesis wouldn’t be possible. Before starting I
would like to thank those people!
First I would like to thank Prof. dr. ir. Geert De Schutter and Dr. ir. Jeroen Dils for sharing
their knowhow which helped me in the right direction. Accepting me doing this subject was a
first step in writing a successful thesis. Concrete is my passion! Writing a thesis takes a
period of approximately one year. It is very important to have an interesting subject and this
was the case. Thanks!
Also other persons from the University of Ghent were important for writing this thesis. The
total staff of ‘Magnel Laboratory for Concrete Research’ helped me a lot with the tests,
especially Nathan Lampens and Tom Stulemeijer. An example: they crushed 180 cubes of
concrete. This means they measured 1080 times the width and the depth of a cube and 720
times the height… Thanks! Besides the staff of ‘‘Magnel Laboratory for Concrete Research’
also Dr. ir. Steffen Grünewald and ir Philip Van den Heede shared their knowledge.
Thanks ir. Johan Baeten and Steven Daniels from Interbeton! Without sand and
superplasticizer it would be difficult to make concrete I think... Together with ing. Peter Minne
from Odisee you launched me for this thesis. Thanks!
Thanks to Jacques Pareyn for searching for typos and syntax errors! After his corrections,
the length of his pencil was halved. Without having a direct contribution to this thesis also
other persons were important in this process. My parents for the financial support for 6 years
university studies: it results in two Master’s Degrees. My friends for the moments of
relaxation: you changed my personality during the six years in Ghent.
Last but not least: Liselore for giving us beautiful perspectives. You came late but on an ideal
moment. I was very busy and you make it busier but it was with pleasure. You were the
motivation to finish this all.
Pieter Ballieu
May 2015
III
Abstract
Details
Title: Design of ecological concrete by particle packing optimization Author: Pieter Ballieu Supervisor: Prof. dr. ir. Geert De Schutter Counsellor: Dr. ir. Jeroen Dils Master’s dissertation submitted in order to obtain the academic degree of Master of Science in Civil Engineering Department of Structural Engineering Chairman: Prof. dr. ir. Luc Taerwe Faculty of Engineering and architecture Academic year 2014-2015
Summary
This thesis tried to optimize a traditional concrete mixture according to the Compressible
Packing Model. It was inspired by a work of Sonja Fennis in the Netherlands. Applying the
packing model on the aggregate mixture leads to an optimized aggregate composition. That
change should lead to a concrete mixture with a higher workability. To obtain the same
workability as in the reference mixture the amount of water will be lowered. This normally
results in a concrete mixture that is stronger than the reference concrete. Because a gain of
strength is not the goal of this thesis the amount of cement was reduced. Cement
replacement products as limestone powder, quartz powder, portaclay, fly ash and silica fume
were used. Also adding aggregates instead of a cement replacement product was tested.
Reducing the amount of cement is the ecological benefit. These were tested with the tool
‘Groen Beton’. Besides the ecological evaluation also an economic evaluation was done.
Keywords
Ecological concrete, Compressible Packing Model (CPM), cement replacement products,
binder, filler, cement reduction.
IV
Design of ecological concrete by particle
packing optimization
Pieter Ballieu
Supervisor(s): Prof. dr. ir. Geert De Schutter & Dr.ir. Jeroen Dils
Abstract – This master thesis tried to design an
ecological concrete, based on an optimization of
the packing of the aggregates, using the
Compressible Packing Model (CPM). In the first
part all theoretical aspects were discussed. Also
tests and materials were described. The second
part gives a survey of all the produced mixtures,
the calculations for those mixtures and the test
results of those mixtures. Mixtures were
evaluated on workability, durability, strength,
economic cost and ecological cost.
I INTRODUCTION
It is generally accepted: we should do something
to save our environment. The concentration of CO2
increases exponentially. This could be problematic
for future generations. In the world of construction,
cement is the most polluting material. Nowadays,
cement production and consumption is responsible
for approximately 6% of the total global CO2
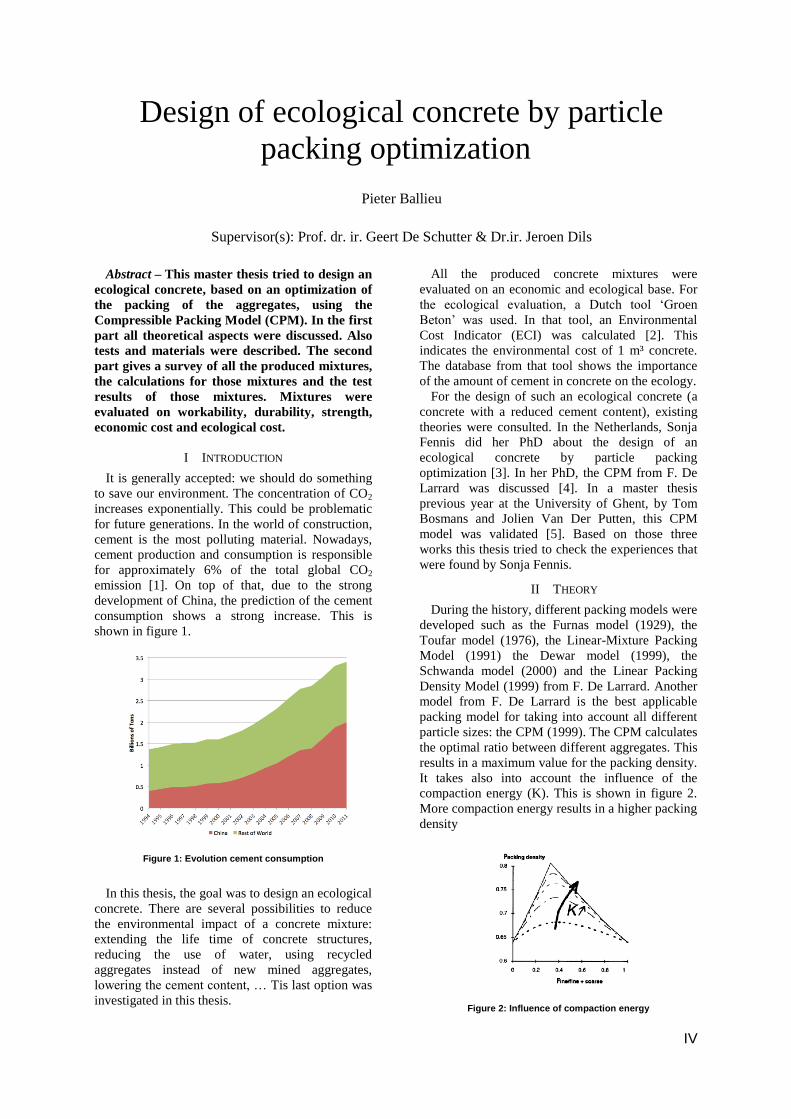
emission [1]. On top of that, due to the strong
development of China, the prediction of the cement
consumption shows a strong increase. This is
shown in figure 1.
Figure 1: Evolution cement consumption
In this thesis, the goal was to design an ecological
concrete. There are several possibilities to reduce
the environmental impact of a concrete mixture:
extending the life time of concrete structures,
reducing the use of water, using recycled
aggregates instead of new mined aggregates,
lowering the cement content, … Tis last option was
investigated in this thesis.
All the produced concrete mixtures were
evaluated on an economic and ecological base. For
the ecological evaluation, a Dutch tool ‘Groen
Beton’ was used. In that tool, an Environmental
Cost Indicator (ECI) was calculated [2]. This
indicates the environmental cost of 1 m³ concrete.
The database from that tool shows the importance
of the amount of cement in concrete on the ecology.
For the design of such an ecological concrete (a
concrete with a reduced cement content), existing
theories were consulted. In the Netherlands, Sonja
Fennis did her PhD about the design of an
ecological concrete by particle packing
optimization [3]. In her PhD, the CPM from F. De
Larrard was discussed [4]. In a master thesis
previous year at the University of Ghent, by Tom
Bosmans and Jolien Van Der Putten, this CPM
model was validated [5]. Based on those three
works this thesis tried to check the experiences that
were found by Sonja Fennis.
II THEORY
During the history, different packing models were
developed such as the Furnas model (1929), the
Toufar model (1976), the Linear-Mixture Packing
Model (1991) the Dewar model (1999), the
Schwanda model (2000) and the Linear Packing
Density Model (1999) from F. De Larrard. Another
model from F. De Larrard is the best applicable
packing model for taking into account all different
particle sizes: the CPM (1999). The CPM calculates
the optimal ratio between different aggregates. This
results in a maximum value for the packing density.
It takes also into account the influence of the
compaction energy (K). This is shown in figure 2.
More compaction energy results in a higher packing
density
Figure 2: Influence of compaction energy

V
Using a packing model like the CPM makes it
possible to optimize the packing of the total
concrete mixture. This should result in a concrete
with an improved/increased packing. An improved
packing results in a higher workability. This makes
it possible to decrease the water content which
results in a gain of strength. In a last design step, a
replacement of an amount cement by other
materials is possible. This is the ecological benefit.
The optimization process could also improve
durability due to a better packing.
To take into account the packing of fine materials
(<125 µm) the CIPM was developed [3]. In this
thesis this was not used. Only the mix of aggregates
(limestone aggregates & sands) was optimized. If
necessary, it is also possible to optimize the
packing of fine materials with the CPM.
Both packing models, the CPM and the CIPM,
take geometrical interactions such as the wall effect
and the loosening effect into account (figure 3), but
the CIPM has coefficients to integrate effects due to
surface forces in its model. Fine materials are due
to surface forces as the van der Waals force, the
electrostatic double layer forces and steric forces
sensitive to phenomena such as agglomeration. This
influences the packing density.
Figure 3: Wall & loosening effect
The packing density is the ratio of the solid
volume of the particles (Vp) to the bulk volume of
the particles (Vb). It is a value that shows something
about the amount of voids in a mixture. The higher
the value for the packing density, the lower the
amount of voids in a mixture. A higher packing
density should result in a higher workability or a
lower water demand, to obtain the same workability
as the reference concrete. This will also have
effects on the concrete strength.
For coarse materials, the packing density can be
determined experimentally on a dry manner, with a
compaction test. Based on a previous thesis, a value
of 9 was validated for the compaction index K [5].
This gave the best fit with the CPM. For fine
materials a wet manner should be used such as the
Marquardt test to determine the packing [5]. This
reduces the surface forces because the particles are
saturated with superplasticizer. In this thesis it was
not necessary to use that because only the aggregate
mix was considered.
III EXPERIMENTAL PART
A first part of the experimental part was the
characterization of the aggregates. The sands and
limestone aggregates were sieved, their density was
determined with pycnometers and with the
compaction test their packing density was
measured. For the materials used to replace cement,
a particle size distribution was defined based on the
Laser Light Scattering (LLS) technique.
In a next step, with an MS Excel tool based on
the CPM, it was possible to determine the packing
density for each combination of aggregates. The
combination with the highest packing density is
considered as the most ideal combination of
aggregates. In this thesis the aggregate composition
of an existing concrete was optimized based on the
CPM. This is the first step in the design of an
ecological concrete. In total, there are three design
steps, shown in figure 4.
Figure 4: Design steps of an ecological concrete
Due to the optimized packing less water is
necessary for the workability of the mixture.
Lowering the water content is the second step in the
design of an ecological concrete. Sonja Fennis has a
theory claiming it is possible to calculate how much
the water content could be reduced due to the
optimized packing (αt), to have a concrete mixture
with a similar workability as the reference concrete.
The parameter mix/ αt determines this, where mix
is the amount of the optimized material in a unit
volume. Due to the decrease of water usage in the
mixture, a gain of strength will occur.
The goal of this thesis was not designing a
stronger concrete, it was designing an ecological
concrete with the same properties as the reference
concrete. So the last design step tried to achieve a
concrete mixture with the same strength as the
reference concrete. This was done with a rule of
thumb: Sonja Fennis calculates the proportional
gain of strength compared with the reference
concrete and reduced the amount of cement in the
optimized mixture with the same percentage. This
is the ecological benefit.
VI
A reduced amount of cement should be
compensated by an increased amount of another
material. Different fillers and binders were tested:
fly ash, limestone powder, quartz powder, silica
fume and portaclay. Also a mixture without a
cement replacement product but with an increased
amount of aggregates was tested.
To evaluate and compare the mixtures, a lot of
data was collected. On fresh concrete the
workability was tested with a slump and a flow
table test. Also the air content and the density were
tested. After 7 days all mixtures were tested on their
strength. After 28 days the strength was tested
again. To say something about the durability also a
resistivity measurement was done and the water
absorption under vacuum was tested. Further on,
the cost of each mixture was calculated. Also the
ECI was calculated based on the tool ‘Groen Beton’
[2]. With all that data, it was possible to make
conclusions.
IV RESULTS AND CONCLUSIONS
In general, the idea behind the work of Sonja
Fennis was confirmed by applying her theory only
on the aggregate mixture. The first design step, the
optimization of the packing, results in an increased
packing by a changed aggregate composition. The
mixture with the increased packing has an increased
workability, as expected.
In order to design a mixture with the same
workability as the reference mixture, the theory of
the ratio φmix/αt was applied. It does not result in a
mixture with the same workability as Sonja Fennis
claimed [3]. Well-chosen guesses were necessary to
obtain the wanted workability. On the other hand
her relation between the ratio φmix/αt and the
measured flow was confirmed. The correlation with
the flow value was higher than the correlation with
the slump value. This is shown in figure 5.
Figure 5: Confirmed relation claimed by Sonja Fennis
By decreasing the water content, in previous
design step, a strength increase was noticed. Also
durability indicators improved. This was as
expected. Because a gain of strength was not
wanted in the last design step the rule of thumb to
decrease the amount of cement (and the strength)
was applied. Several cement replacement products
were tested.
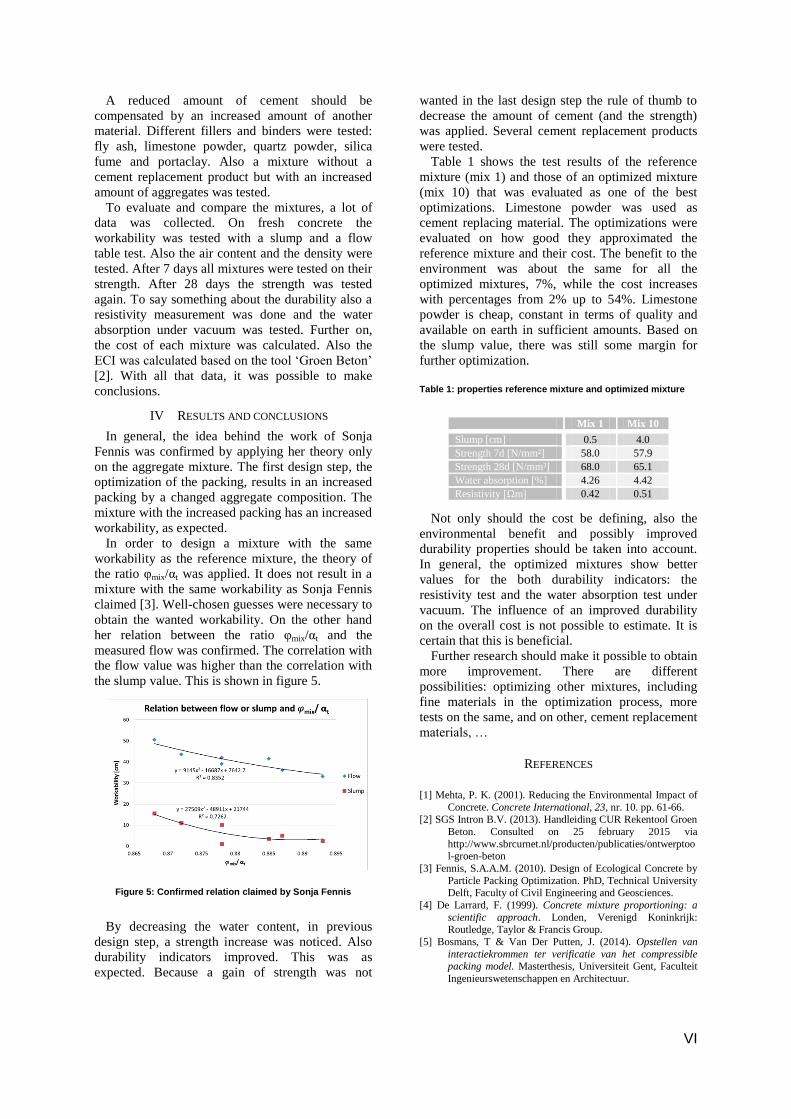
Table 1 shows the test results of the reference
mixture (mix 1) and those of an optimized mixture
(mix 10) that was evaluated as one of the best
optimizations. Limestone powder was used as
cement replacing material. The optimizations were
evaluated on how good they approximated the
reference mixture and their cost. The benefit to the
environment was about the same for all the
optimized mixtures, 7%, while the cost increases
with percentages from 2% up to 54%. Limestone
powder is cheap, constant in terms of quality and
available on earth in sufficient amounts. Based on
the slump value, there was still some margin for
further optimization.
Table 1: properties reference mixture and optimized mixture
Mix 1 Mix 10
Slump [cm] 0.5 4.0
Strength 7d [N/mm²] 58.0 57.9
Strength 28d [N/mm²] 68.0 65.1
Water absorption [%] 4.26 4.42
Resistivity [Ωm] 0.42 0.51
Not only should the cost be defining, also the
environmental benefit and possibly improved
durability properties should be taken into account.
In general, the optimized mixtures show better
values for the both durability indicators: the
resistivity test and the water absorption test under
vacuum. The influence of an improved durability
on the overall cost is not possible to estimate. It is
certain that this is beneficial.
Further research should make it possible to obtain
more improvement. There are different
possibilities: optimizing other mixtures, including
fine materials in the optimization process, more
tests on the same, and on other, cement replacement
materials, …
REFERENCES
[1] Mehta, P. K. (2001). Reducing the Environmental Impact of
Concrete. Concrete International, 23, nr. 10. pp. 61-66. [2] SGS Intron B.V. (2013). Handleiding CUR Rekentool Groen
Beton. Consulted on 25 february 2015 via
http://www.sbrcurnet.nl/producten/publicaties/ontwerptool-groen-beton
[3] Fennis, S.A.A.M. (2010). Design of Ecological Concrete by
Particle Packing Optimization. PhD, Technical University Delft, Faculty of Civil Engineering and Geosciences.
[4] De Larrard, F. (1999). Concrete mixture proportioning: a
scientific approach. Londen, Verenigd Koninkrijk: Routledge, Taylor & Francis Group.
[5] Bosmans, T & Van Der Putten, J. (2014). Opstellen van
interactiekrommen ter verificatie van het compressible packing model. Masterthesis, Universiteit Gent, Faculteit
Ingenieurswetenschappen en Architectuur.
VII
Table of content
Foreword ............................................................................................................................... II
Abstract .................................................................................................................................III
Table of content................................................................................................................... VII
List of figures ....................................................................................................................... XII
List of tables ....................................................................................................................... XIV
Abbreviations and symbols ................................................................................................. XVI
Part 0: Introduction ............................................................................................................. 1
Part I: Literature ................................................................................................................. 3
Chapter 1 Ecological concrete....................................................................................... 4
1.1 Concrete and the environment ............................................................................. 4
1.2 Environmental impact factors ............................................................................... 6
1.2.1 Concrete durability: extending the service life ............................................... 7
1.2.2 Reduction of the amount of water ................................................................. 7
1.2.3 Reduction of the amount of aggregates due to recycling .............................. 8
1.2.4 Reduction of cement and the use of replacement products........................... 9
1.2.5 Influences of fillers .......................................................................................10
1.2.5.1 Workability ...............................................................................................10
1.2.5.2 Strength ...................................................................................................11
1.2.5.3 Mechanical properties and durability ........................................................11
1.2.6 Influence of binders .....................................................................................11
1.3 Particle size optimization methods ......................................................................11
1.3.1 Optimization curves .....................................................................................12
1.3.2 Particle packing models ...............................................................................13
1.4 Evaluation of the environmental impact ..............................................................14
1.5 Evaluation of the economic impact .....................................................................17
VIII
Chapter 2 Packing ........................................................................................................19
2.1 Definitions ...........................................................................................................19
2.2 Influencing factors ...............................................................................................20
2.2.1 The particle size and size distribution ..........................................................20
2.2.2 Shape of the particles ..................................................................................20
2.2.3 Packing method ...........................................................................................21
2.3 Structures ...........................................................................................................22
2.3.1 Geometrical interaction ................................................................................22
2.3.2 Agglomeration .............................................................................................24
2.3.3 Segregation .................................................................................................25
2.3.4 Arch building ................................................................................................25
2.4 Determining the packing .....................................................................................26
2.5 Packing models ..................................................................................................26
Chapter 3 CPM ............................................................................................................29
Chapter 4 Design of an ecological concrete .................................................................33
4.1 Optimization of the packing .................................................................................34
4.2 Optimization of the workability ............................................................................36
4.3 Optimization of the strength ................................................................................38
Chapter 5 Executed tests on aggregates .....................................................................40
5.1 Particle size distribution ......................................................................................40
5.1.1 Sieve curves ................................................................................................40
5.1.2 Laserdiffractometer measurements .............................................................41
5.2 Density ...............................................................................................................43
5.3 Packing density ..................................................................................................44

IX
Chapter 6 Executed tests on concrete ..........................................................................47
6.1 On fresh concrete ...............................................................................................47
6.1.1 Slump test ...................................................................................................47
6.1.2 Flow table test .............................................................................................48
6.1.3 Air content and density ................................................................................50
6.2 On hardened concrete ........................................................................................50
6.2.1 Compression test .........................................................................................51
6.2.2 Water absorption under vacuum ..................................................................51
6.2.3 Resistivity ....................................................................................................52
Chapter 7 Used materials .............................................................................................54
7.1 Cement ...............................................................................................................54
7.2 Superplasticizer ..................................................................................................55
7.3 Coarse aggregates (2) ........................................................................................57
7.4 Sands (3) ............................................................................................................57
7.5 Fillers ..................................................................................................................58
7.5.1 Limestone powder .......................................................................................58
7.5.2 Quartz powder (M400 and M800) ................................................................58
7.6 Binders ...............................................................................................................58
7.6.1 Silica fume ...................................................................................................59
7.6.2 Fly ash .........................................................................................................59
7.7 Portaclay ............................................................................................................60
Chapter 8 Reference concrete .....................................................................................61
8.1 Mixture ................................................................................................................61
8.2 Mixing procedure – characteristics mixer ............................................................61
8.3 Vacuum mixer .....................................................................................................62
X
Part II: Experimental part ...................................................................................................64
Chapter 9 Characterizations .........................................................................................65
9.1 Coarse aggregates .............................................................................................65
9.1.1 Particle size distribution ...............................................................................65
9.1.2 Density ........................................................................................................66
9.1.3 Packing density ...........................................................................................67
9.2 Fine aggregates ..................................................................................................68
9.2.1 Particle size distribution ...............................................................................68
9.2.2 Density ........................................................................................................69
9.3 Reference concrete ............................................................................................70
Chapter 10 Optimization of the packing ..........................................................................72
10.1 Calculations ........................................................................................................72
10.2 Mixture compositions ..........................................................................................74
10.3 Results ...............................................................................................................75
Chapter 11 Optimization of the workability .....................................................................76
11.1 Calculations ........................................................................................................76
11.2 Mixture compositions ..........................................................................................77
11.3 Results ...............................................................................................................78
Chapter 12 Optimization of the strength .........................................................................80
12.1 Calculations ........................................................................................................80
12.2 Mixture compositions ..........................................................................................81
12.3 Results ...............................................................................................................83
XI
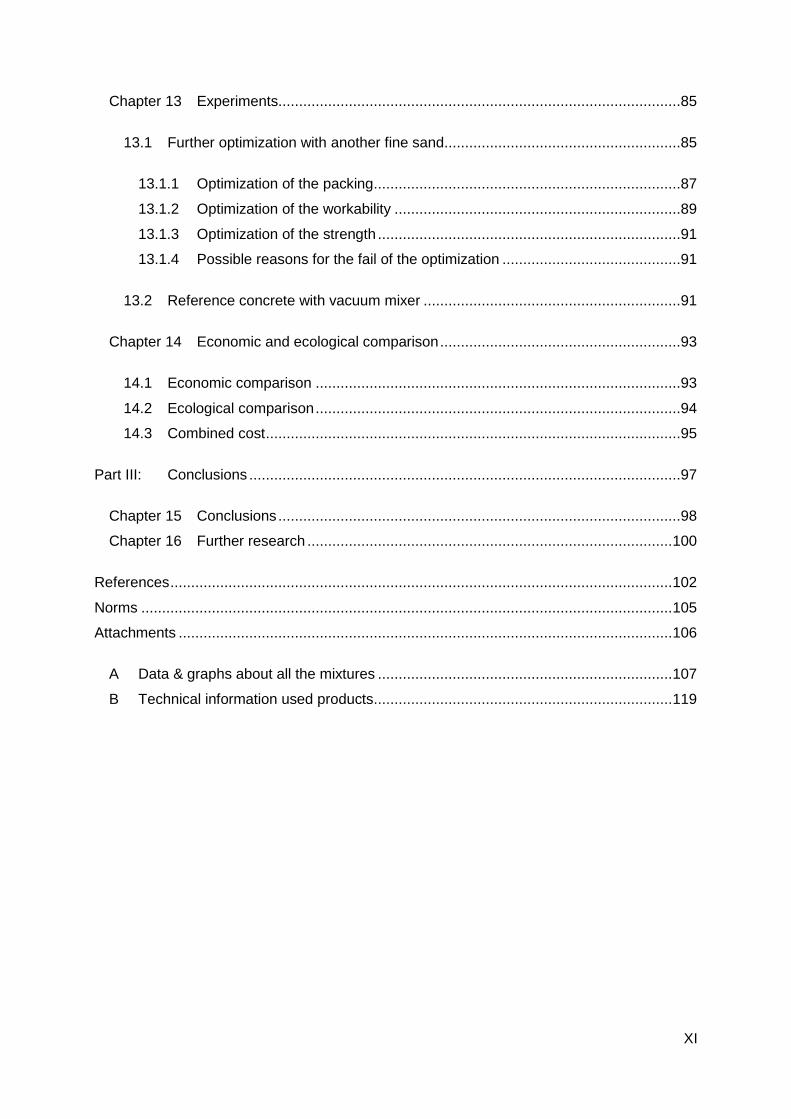
Chapter 13 Experiments.................................................................................................85
13.1 Further optimization with another fine sand.........................................................85
13.1.1 Optimization of the packing ..........................................................................87
13.1.2 Optimization of the workability .....................................................................89
13.1.3 Optimization of the strength .........................................................................91
13.1.4 Possible reasons for the fail of the optimization ...........................................91
13.2 Reference concrete with vacuum mixer ..............................................................91
Chapter 14 Economic and ecological comparison ..........................................................93
14.1 Economic comparison ........................................................................................93
14.2 Ecological comparison ........................................................................................94
14.3 Combined cost ....................................................................................................95
Part III: Conclusions ........................................................................................................97
Chapter 15 Conclusions .................................................................................................98
Chapter 16 Further research ........................................................................................ 100
References ......................................................................................................................... 102
Norms ................................................................................................................................ 105
Attachments ....................................................................................................................... 106
A Data & graphs about all the mixtures ....................................................................... 107
B Technical information used products ........................................................................ 119
XII
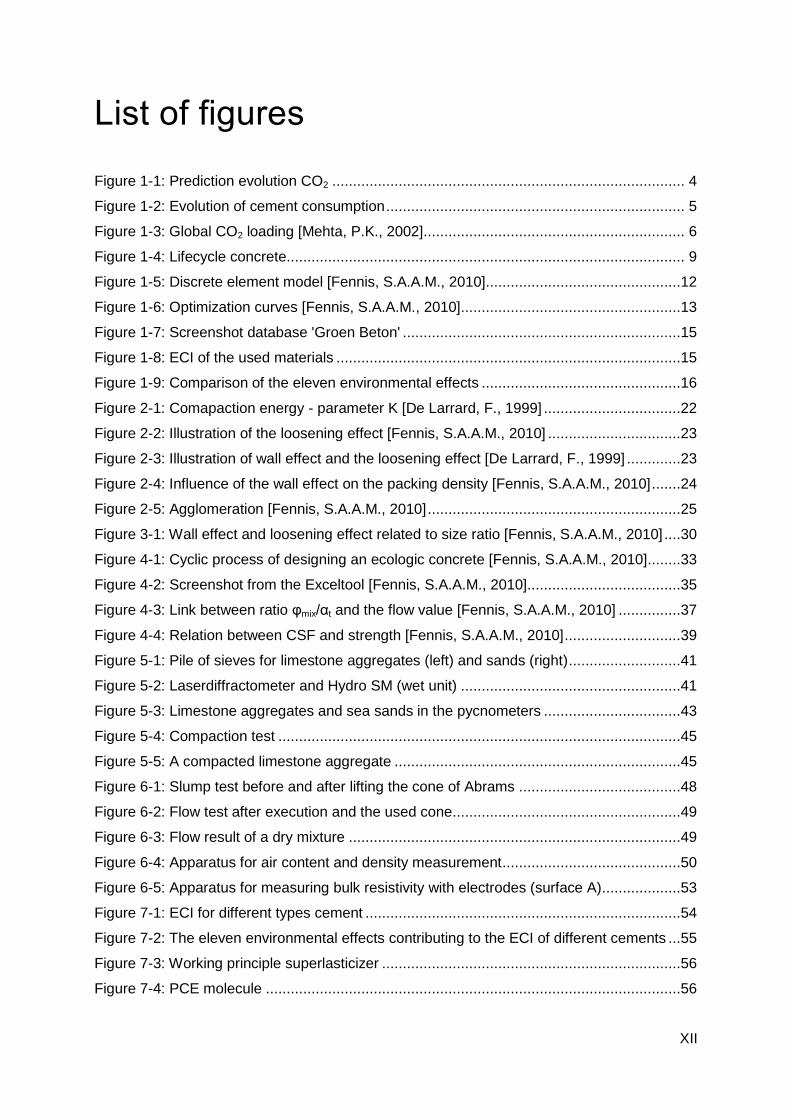
List of figures
Figure 1-1: Prediction evolution CO2 ..................................................................................... 4
Figure 1-2: Evolution of cement consumption ........................................................................ 5
Figure 1-3: Global CO2 loading [Mehta, P.K., 2002] ............................................................... 6
Figure 1-4: Lifecycle concrete................................................................................................ 9
Figure 1-5: Discrete element model [Fennis, S.A.A.M., 2010]...............................................12
Figure 1-6: Optimization curves [Fennis, S.A.A.M., 2010] .....................................................13
Figure 1-7: Screenshot database 'Groen Beton' ...................................................................15
Figure 1-8: ECI of the used materials ...................................................................................15
Figure 1-9: Comparison of the eleven environmental effects ................................................16
Figure 2-1: Comapaction energy - parameter K [De Larrard, F., 1999] .................................22
Figure 2-2: Illustration of the loosening effect [Fennis, S.A.A.M., 2010] ................................23
Figure 2-3: Illustration of wall effect and the loosening effect [De Larrard, F., 1999] .............23
Figure 2-4: Influence of the wall effect on the packing density [Fennis, S.A.A.M., 2010] .......24
Figure 2-5: Agglomeration [Fennis, S.A.A.M., 2010] .............................................................25
Figure 3-1: Wall effect and loosening effect related to size ratio [Fennis, S.A.A.M., 2010] ....30
Figure 4-1: Cyclic process of designing an ecologic concrete [Fennis, S.A.A.M., 2010]........33
Figure 4-2: Screenshot from the Exceltool [Fennis, S.A.A.M., 2010].....................................35
Figure 4-3: Link between ratio φmix/αt and the flow value [Fennis, S.A.A.M., 2010] ...............37
Figure 4-4: Relation between CSF and strength [Fennis, S.A.A.M., 2010] ............................39
Figure 5-1: Pile of sieves for limestone aggregates (left) and sands (right) ...........................41
Figure 5-2: Laserdiffractometer and Hydro SM (wet unit) .....................................................41
Figure 5-3: Limestone aggregates and sea sands in the pycnometers .................................43
Figure 5-4: Compaction test .................................................................................................45
Figure 5-5: A compacted limestone aggregate .....................................................................45
Figure 6-1: Slump test before and after lifting the cone of Abrams .......................................48
Figure 6-2: Flow test after execution and the used cone .......................................................49
Figure 6-3: Flow result of a dry mixture ................................................................................49
Figure 6-4: Apparatus for air content and density measurement ...........................................50
Figure 6-5: Apparatus for measuring bulk resistivity with electrodes (surface A)...................53
Figure 7-1: ECI for different types cement ............................................................................54
Figure 7-2: The eleven environmental effects contributing to the ECI of different cements ...55
Figure 7-3: Working principle superlasticizer ........................................................................56
Figure 7-4: PCE molecule ....................................................................................................56

XIII
Figure 7-5: Steric hindrance by PCE superplasticizers .........................................................57
Figure 7-6: Limestone aggregates and sea sands ................................................................57
Figure 8-1: Concrete mixer in ‘Magnel Laboratory for Concrete Research’ ...........................62
Figure 8-2: Vacuum mixer in ‘Magnel Laboratory for Concrete Research’ ............................63
Figure 9-1: Particle size distribution coarse materials ...........................................................65
Figure 9-2: Densities coarse materials .................................................................................67
Figure 9-3: Packing densities coarse materials ....................................................................68
Figure 9-4: Particle size distribution fine materials ................................................................69
Figure 10-1: Optimization curves & concrete skeletons ........................................................74
Figure 11-1: Relation between flow/slump and mix/ αt .........................................................79
Figure 13-1: Particle size distribution additional sands .........................................................85
Figure 13-2: Packing densities additional sands ...................................................................86
Figure A-1: Comparison strength on 7 and 28 days ............................................................ 110
Figure A-2: Comparison relative strength on 7 and 28 days ............................................... 111
Figure A-3: Comparison strength increase ......................................................................... 112
Figure A-4: Comparison water absorption .......................................................................... 113
Figure A-5: Relative comparison water absorption ............................................................. 114
Figure A-6: Comparison resistivity ...................................................................................... 115
Figure A-7: Relative comparison resistivity ......................................................................... 116
Figure A-8: Relative comparison of the cost & the ECI ....................................................... 117
Figure A-9: Relative comparison of the sum of the cost and the ECI .................................. 118
Figure B-1: Technical datasheet - Cement ......................................................................... 119
Figure B-2: Technical datasheet - Tixo (part 1) ................................................................... 120
Figure B-3: Technical datasheet - Tixo (part 2) ................................................................... 121
Figure B-4: Technical datasheet - Limestone 6.3/20 ........................................................... 122
Figure B-5: Technical datasheet - Limestone 2/6.3 ............................................................. 123
Figure B-6: Technical datasheet - Sea sand 0/4 ................................................................. 124
Figure B-7: Technical datasheet - Sea sand 0/2 ................................................................. 125
Figure B-8: Technical datasheet - Sand S90 ...................................................................... 126
Figure B-9: Technical datasheet - Limestone powder ......................................................... 127
Figure B-10: Technical datasheet - Quartz powders M400 and M800 ................................ 128
Figure B-11: Technical datasheet - Silica fume .................................................................. 129
Figure B-12: Technical datasheet - Fly ash ........................................................................ 130
Figure B-13: Technical datasheet - Portaclay A90 .............................................................. 131
XIV
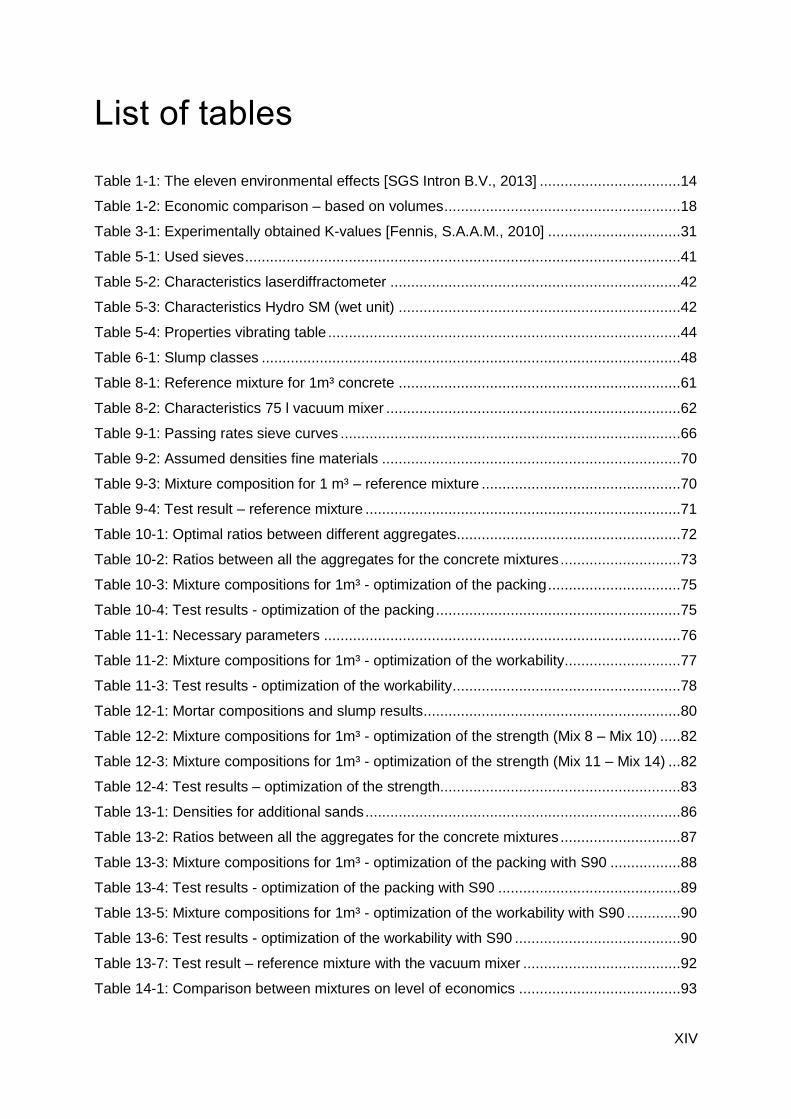
List of tables
Table 1-1: The eleven environmental effects [SGS Intron B.V., 2013] ..................................14
Table 1-2: Economic comparison – based on volumes .........................................................18
Table 3-1: Experimentally obtained K-values [Fennis, S.A.A.M., 2010] ................................31
Table 5-1: Used sieves .........................................................................................................41
Table 5-2: Characteristics laserdiffractometer ......................................................................42
Table 5-3: Characteristics Hydro SM (wet unit) ....................................................................42
Table 5-4: Properties vibrating table .....................................................................................44
Table 6-1: Slump classes .....................................................................................................48
Table 8-1: Reference mixture for 1m³ concrete ....................................................................61
Table 8-2: Characteristics 75 l vacuum mixer .......................................................................62
Table 9-1: Passing rates sieve curves ..................................................................................66
Table 9-2: Assumed densities fine materials ........................................................................70
Table 9-3: Mixture composition for 1 m³ – reference mixture ................................................70
Table 9-4: Test result – reference mixture ............................................................................71
Table 10-1: Optimal ratios between different aggregates ......................................................72
Table 10-2: Ratios between all the aggregates for the concrete mixtures .............................73
Table 10-3: Mixture compositions for 1m³ - optimization of the packing ................................75
Table 10-4: Test results - optimization of the packing ...........................................................75
Table 11-1: Necessary parameters ......................................................................................76
Table 11-2: Mixture compositions for 1m³ - optimization of the workability............................77
Table 11-3: Test results - optimization of the workability .......................................................78
Table 12-1: Mortar compositions and slump results ..............................................................80
Table 12-2: Mixture compositions for 1m³ - optimization of the strength (Mix 8 – Mix 10) .....82
Table 12-3: Mixture compositions for 1m³ - optimization of the strength (Mix 11 – Mix 14) ...82
Table 12-4: Test results – optimization of the strength..........................................................83
Table 13-1: Densities for additional sands ............................................................................86
Table 13-2: Ratios between all the aggregates for the concrete mixtures .............................87
Table 13-3: Mixture compositions for 1m³ - optimization of the packing with S90 .................88
Table 13-4: Test results - optimization of the packing with S90 ............................................89
Table 13-5: Mixture compositions for 1m³ - optimization of the workability with S90 .............90
Table 13-6: Test results - optimization of the workability with S90 ........................................90
Table 13-7: Test result – reference mixture with the vacuum mixer ......................................92
Table 14-1: Comparison between mixtures on level of economics .......................................93

XV
Table 14-2: Comparison between mixtures on level of ecologics ..........................................95
Table 14-3: Comparison of the combined cost .....................................................................96
Table A-1: Description of mixtures and their codes ............................................................. 107
Table A-2: Mixture compositions mix 1 - 9 .......................................................................... 108
Table A-3: Mixture compositions mix 10 - 18 ...................................................................... 108
Table A-4: Test results mix 1 - 9 ......................................................................................... 109
Table A-5: Test results mix 10 - 18 ..................................................................................... 109

XVI
Abbreviations and symbols
Abbreviations
0/2 Sea sand class 0/2
0/4 Sea sand class 0/4
2/6.3 Limestone aggregates class 2/6.3
6.3/20 Limestone aggregates class 6.3/20
AGG Aggregates
CEM CEM I 52.5 N
CIPM Compressible Interaction Packing Model
CSF Cement Spacing Factor
CPM Compressible Packing Model
DLS Dynamic Light Scattering
DLVO Derjaguin, Landau, Verwey en Overbeek
ECI Environmental Cost Indicator
FA Fly ash
LLS Laser light scattering
LP Limestone powder
M400 Quartz powder M400
M800 Quartz powder M800
PC Portaclay
PCE Polycarboxylate ether-based superplasticizers
PD Packing density
S90 Quartz sand S90
SF Silica fume
W/C Water cement ratio
W/P Water powder ratio
Symbols - Greek
α Packing density of a mixture [-]
αaggregate Defined packing density of an aggregate with compaction test [-]
αi Packing density of size class i [-]
αj Packing density of size class j [-]
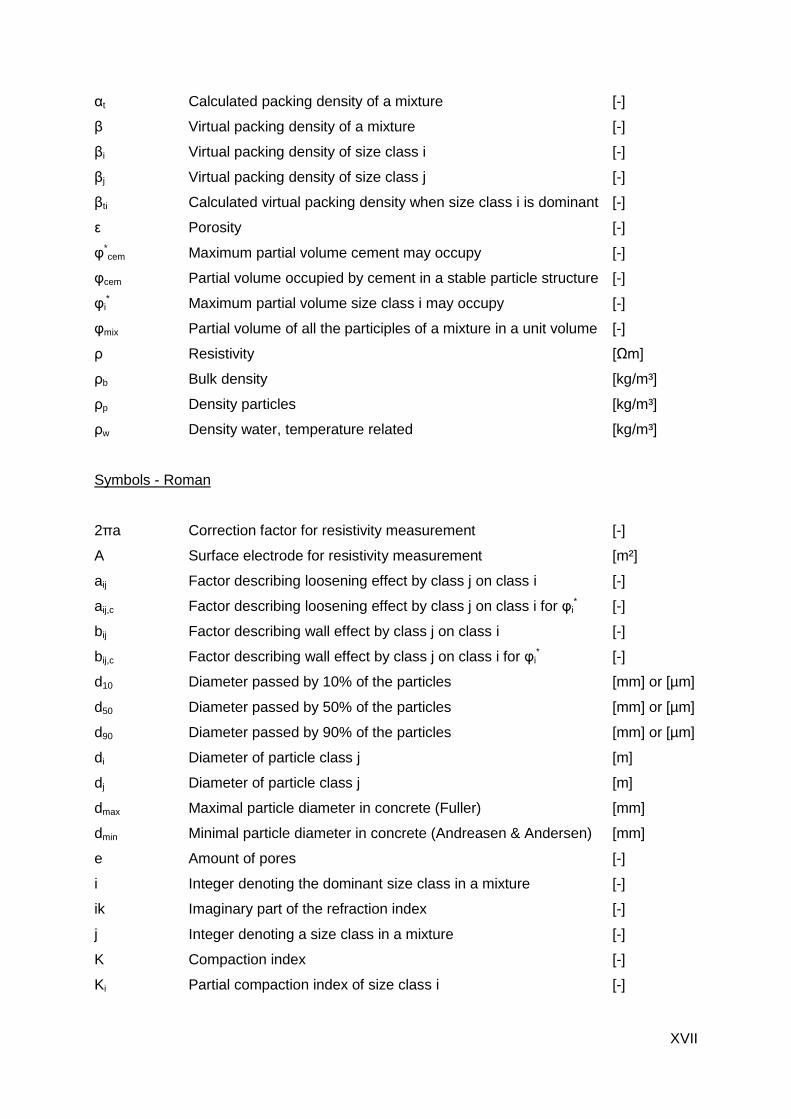
XVII
αt Calculated packing density of a mixture [-]
β Virtual packing density of a mixture [-]
βi Virtual packing density of size class i [-]
βj Virtual packing density of size class j [-]
βti Calculated virtual packing density when size class i is dominant [-]
ε Porosity [-]
φ*cem Maximum partial volume cement may occupy [-]
φcem Partial volume occupied by cement in a stable particle structure [-]
φi* Maximum partial volume size class i may occupy [-]
φmix Partial volume of all the participles of a mixture in a unit volume [-]
ρ Resistivity [Ωm]
ρb Bulk density [kg/m³]
ρp Density particles [kg/m³]
ρw Density water, temperature related [kg/m³]
Symbols - Roman
2πa Correction factor for resistivity measurement [-]
A Surface electrode for resistivity measurement [m²]
aij Factor describing loosening effect by class j on class i [-]
aij,c Factor describing loosening effect by class j on class i for φi* [-]
bij Factor describing wall effect by class j on class i [-]
bij,c Factor describing wall effect by class j on class i for φi* [-]
d10 Diameter passed by 10% of the particles [mm] or [µm]
d50 Diameter passed by 50% of the particles [mm] or [µm]
d90 Diameter passed by 90% of the particles [mm] or [µm]
di Diameter of particle class j [m]
dj Diameter of particle class j [m]
dmax Maximal particle diameter in concrete (Fuller) [mm]
dmin Minimal particle diameter in concrete (Andreasen & Andersen) [mm]
e Amount of pores [-]
i Integer denoting the dominant size class in a mixture [-]
ik Imaginary part of the refraction index [-]
j Integer denoting a size class in a mixture [-]
K Compaction index [-]
Ki Partial compaction index of size class i [-]
XVIII
L Height of the cube for resistivity measurement [m]
madded water Mass added water to define the density [kg]
maggregate Mass aggregate to define the density [kg]
mdry Dry mass of concrete cube for water absorption test [kg]
mmonster Mass monster for compaction test [kg]
mp Mass particles [kg]
msat Saturated mass of concrete cube for water absorption test [kg]
mw Mass water [kg]
N Refraction index [-]
n Number of size classes in a mixture [-]
n Real part of refraction index [-]
R Measured electrical resistance for resistivity test [Ω]
rj Volume fraction of size class j [-]
Vair Volume air in a unit volume of a mixture [m³]
Vb Bulk volume [m³]
Vmonster Volume of the monster for compaction test [m³]
Vp Volume particles [m³]
Vsuperplasticizer Volume superplasticizer in a unit volume of a mixture [m³]
Vtot Unit volume [m³]
Vw+a+s Volume water, air and superplast in a unit volume of a mixture [m³]
Vwater Volume water in a unit volume of a mixture [m³]
W Water absorption under vacuum [%]
Design of ecological concrete by particle packing optimization: Introduction
1
Part 0: Introduction
Design of ecological concrete by particle packing optimization: Introduction
2
Besides the introduction this work consists of three parts: ‘part I: Literature’, ‘part II:
Experimental part’ and ‘part III: Conclusions’
The first part consists of eight different chapters. The first four chapters give a survey of all
the theory and inspiration, upon which this work is based: ecological concrete, packing,
packing models and designing an ecological concrete. The following four chapters consist
the necessary information for the second part: tests on aggregates and concrete in fresh and
hardened state, a survey of the used materials and the reference mixture to begin the
second part.
Part two contains all the information about the executed tests. First all the test results on
aggregates and the reference concrete are listed up. Following chapters show the design
steps to make an ecological concrete: optimization of the packing, optimization of the
workability and optimization of the strength. In a last chapter some other executed
experiments are discussed.
In the last part, conclusions are summarized and some possibilities for further research are
given.
At the end of this document, different attachments are given. The attachments are split up in
two groups. A first group consists of all the data about the mixtures: the mixture
compositions, the test results, graphical representations of all the test results with standard
deviations on tests on cubes and relative comparisons between some of the results. A
second part shows all the available technical datasheets of the used materials for this thesis.
Using this structure should make it as easy as possible for the reader to understand what
was done in this master thesis and to find out the reasoning underneath. I think everything
should be clear. While this text explains the structure of this thesis, following chapter in part I
is an introduction to the importance of ecological concrete.
Design of ecological concrete by particle packing optimization: Literature
3
Part I: Literature
The part ‘Literature’ consists of 8 chapters giving all the necessary information to understand
what was done in the second part ‘Experimental part’. The first 4 chapters consist the theory.
Chapter 1 about concrete and the environment attempts to show the importance of the
subject of this thesis. In Chapter 2 the idea of packing is explained and in Chapter 3 the CPM
is discussed more in detail. Chapter 4 consists of a summary of the design steps for an
ecological concrete [Fennis, S.A.A.M., 2010]. In the following chapters, background
information about the experimental part is given. Chapter 5 explains the tests on the
aggregates while Chapter 6 explains the tests on concrete. Chapter 7 gives a survey of the
used materials and Chapter 8 is the start of the experimental part with the idea behind the
reference concrete.
Design of ecological concrete by particle packing optimization: Literature
Chapter 1: Ecological concrete 4
Chapter 1 Ecological concrete
1.1 Concrete and the environment
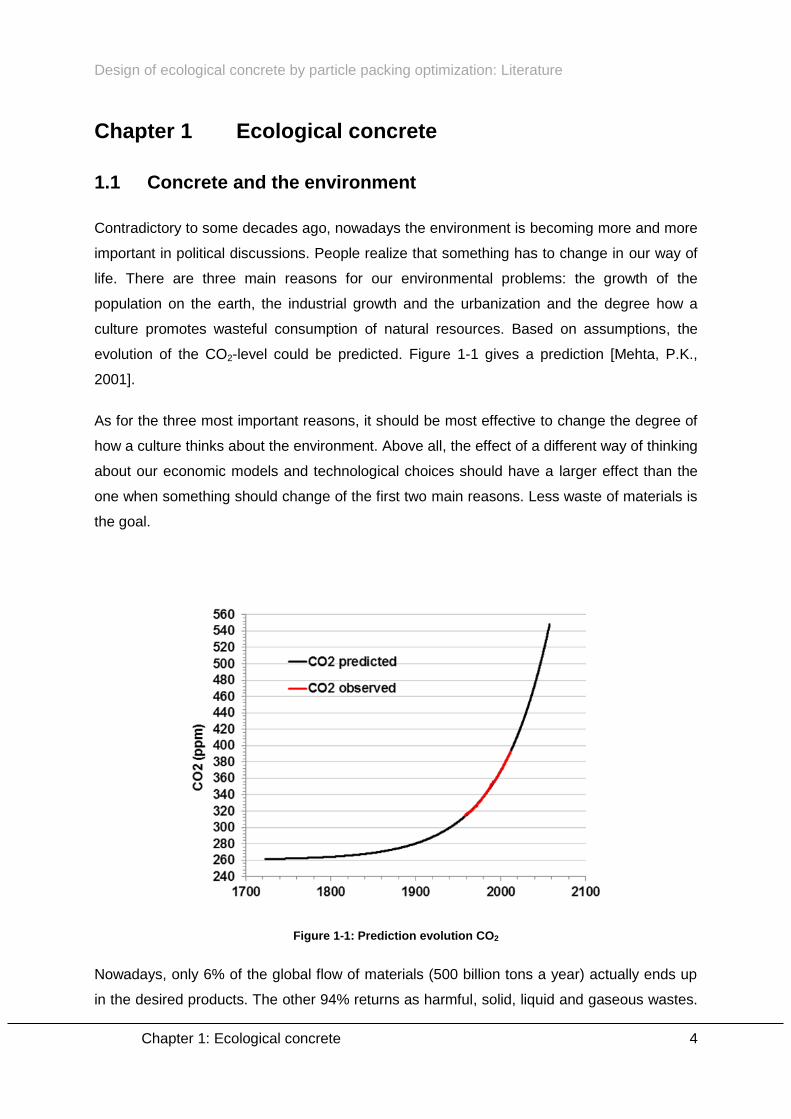
Contradictory to some decades ago, nowadays the environment is becoming more and more
important in political discussions. People realize that something has to change in our way of
life. There are three main reasons for our environmental problems: the growth of the
population on the earth, the industrial growth and the urbanization and the degree how a
culture promotes wasteful consumption of natural resources. Based on assumptions, the
evolution of the CO2-level could be predicted. Figure 1-1 gives a prediction [Mehta, P.K.,
2001].
As for the three most important reasons, it should be most effective to change the degree of
how a culture thinks about the environment. Above all, the effect of a different way of thinking
about our economic models and technological choices should have a larger effect than the
one when something should change of the first two main reasons. Less waste of materials is
the goal.
Figure 1-1: Prediction evolution CO2
Nowadays, only 6% of the global flow of materials (500 billion tons a year) actually ends up
in the desired products. The other 94% returns as harmful, solid, liquid and gaseous wastes.
Design of ecological concrete by particle packing optimization: Literature
Chapter 1: Ecological concrete 5
Research about the way how we produce materials, and choices not only based on
economic reasons, should make it possible to change that ratio in a positive direction.
Certainly there is some margin. The natural capitalism has to be developed. A more efficient
use of materials results in three significant benefits: slower resource depletion, less pollution
and a worldwide employment increase [Mehta, P.K., 2001].
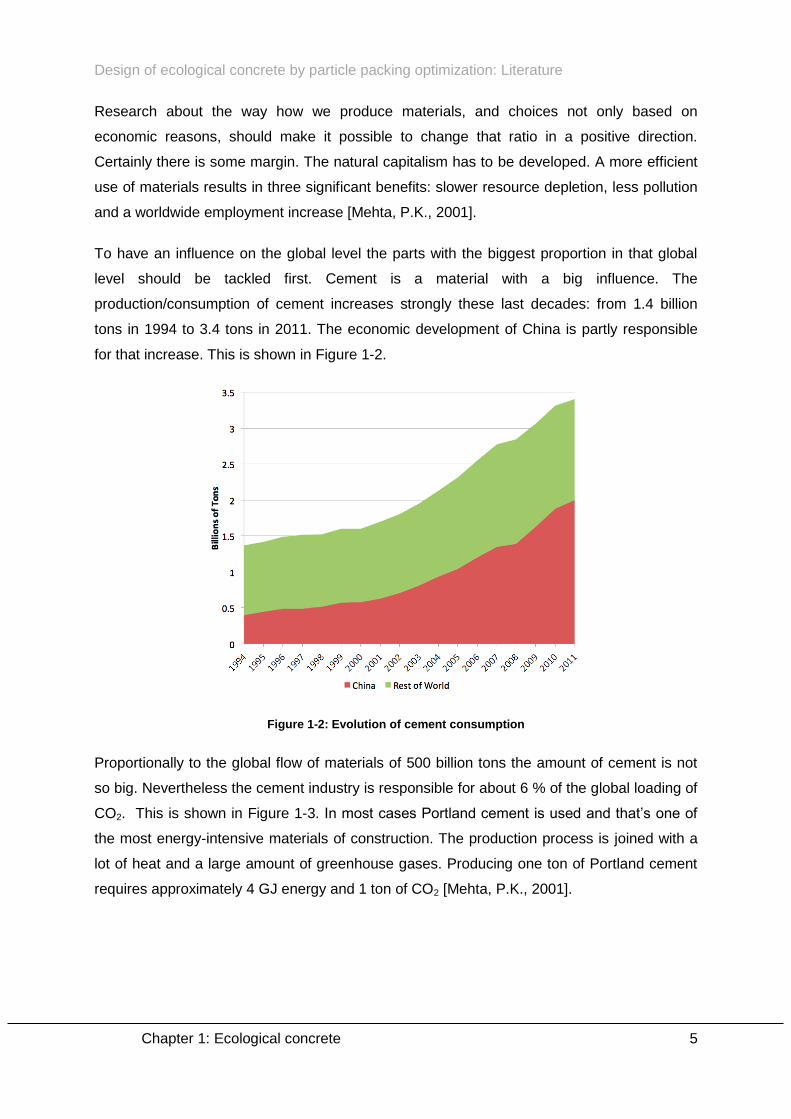
To have an influence on the global level the parts with the biggest proportion in that global
level should be tackled first. Cement is a material with a big influence. The
production/consumption of cement increases strongly these last decades: from 1.4 billion
tons in 1994 to 3.4 tons in 2011. The economic development of China is partly responsible
for that increase. This is shown in Figure 1-2.
Figure 1-2: Evolution of cement consumption
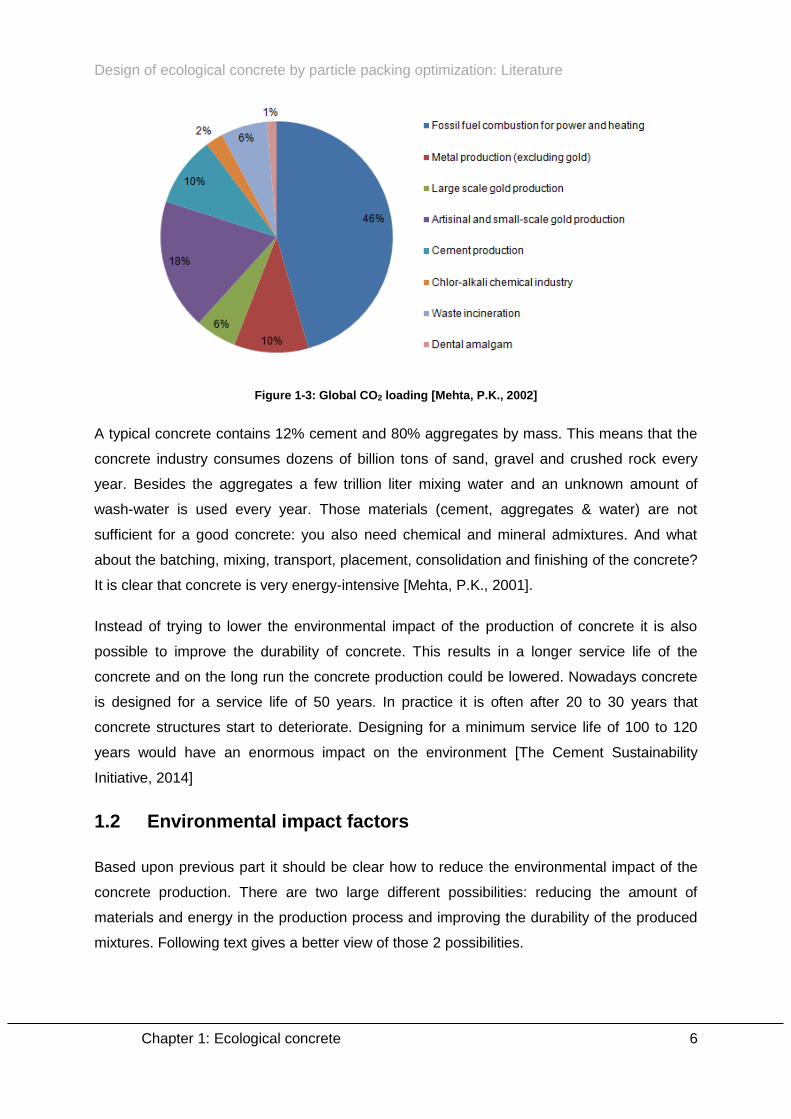
Proportionally to the global flow of materials of 500 billion tons the amount of cement is not
so big. Nevertheless the cement industry is responsible for about 6 % of the global loading of
CO2. This is shown in Figure 1-3. In most cases Portland cement is used and that’s one of
the most energy-intensive materials of construction. The production process is joined with a
lot of heat and a large amount of greenhouse gases. Producing one ton of Portland cement
requires approximately 4 GJ energy and 1 ton of CO2 [Mehta, P.K., 2001].
Design of ecological concrete by particle packing optimization: Literature
Chapter 1: Ecological concrete 6
Figure 1-3: Global CO2 loading [Mehta, P.K., 2002]
A typical concrete contains 12% cement and 80% aggregates by mass. This means that the
concrete industry consumes dozens of billion tons of sand, gravel and crushed rock every
year. Besides the aggregates a few trillion liter mixing water and an unknown amount of
wash-water is used every year. Those materials (cement, aggregates & water) are not
sufficient for a good concrete: you also need chemical and mineral admixtures. And what
about the batching, mixing, transport, placement, consolidation and finishing of the concrete?
It is clear that concrete is very energy-intensive [Mehta, P.K., 2001].
Instead of trying to lower the environmental impact of the production of concrete it is also
possible to improve the durability of concrete. This results in a longer service life of the
concrete and on the long run the concrete production could be lowered. Nowadays concrete
is designed for a service life of 50 years. In practice it is often after 20 to 30 years that
concrete structures start to deteriorate. Designing for a minimum service life of 100 to 120
years would have an enormous impact on the environment [The Cement Sustainability
Initiative, 2014]
1.2 Environmental impact factors
Based upon previous part it should be clear how to reduce the environmental impact of the
concrete production. There are two large different possibilities: reducing the amount of
materials and energy in the production process and improving the durability of the produced
mixtures. Following text gives a better view of those 2 possibilities.

Design of ecological concrete by particle packing optimization: Literature
Chapter 1: Ecological concrete 7
1.2.1 Concrete durability: extending the service life
Improving the concrete durability presents a long-range solution for the improvement of the
resource productivity of the concrete industry. If structural elements have a service life of 500
years instead of 50 years, the resource productivity jumps by a factor 10. What is the reason
that our reinforced concrete structures start to deteriorate after 20 years while some of the
unreinforced Roman concrete is still in a good condition after 2000 years?
Nowadays everything has to go fast in our lives, also the production of concrete elements.
The most important industry goal is labor productivity, not resource maximization. This
should be changed. A lot of Portland cement helps to fasten the hardening process but due
to that there are more thermal contractions and also drying shrinkage and creep relaxation
occur. Modern concrete mixtures are highly crack-prone and therefore they become
permeable, which has a bad influence on the corrosion of the steel reinforcement and also
on the durability. Romans used hydrated lime and volcanic ash in their concrete which led to
a homogeneous hydration product that set and hardened slowly. They also used less water.
Both differences result in a less crack-prone and hence, a highly durable concrete [Mehta,
P.K., 2001].
In conclusion, leaving the way of thinking that high speed of construction and reducing the
water content with the help of a superplasticizer for example, will result in more durable
constructions. This is good for the environment. A practical example of such a project is
already described [Langley, W.S., Mehta, P.K., 2000].
1.2.2 Reduction of the amount of water
At this moment there is not really a shortage of water but in the future this could become a
problem. Only 3% of the water is fresh and a lot is locked up in fast-melting glaciers and ice
caps, and so it is not possible to use all of that 3%. As with water we have the same
problems with energy: we are exhausting non-renewable resources too fast. As with energy,
also for water there should be searched for a more efficient use of the resources.
The concrete industry is one of the largest industrial consumers of fresh water so the impact
of every change in water consumption by the concrete industry will be remarkable. In
addition to approximately 100 l/m³ wash-water the concrete industry use about 1 trillion
mixing water every year. It should be possible to lower this amount by better aggregate
grading and by expanding the use of mineral admixtures and superplasticizers. A first step in
the good direction would be to stop using drinking water for our concrete. Recycled industrial
Design of ecological concrete by particle packing optimization: Literature
Chapter 1: Ecological concrete 8
water is normally suitable for mixing water, wash-water and curing water. The necessary
amounts of wash water and curing water could be minimized by different several measures
[Mehta, P.K., 2001].
In this thesis the amount of water in a mixture should be lower than in the original mixture
due to an optimized packing of the aggregates.
1.2.3 Reduction of the amount of aggregates due to recycling
About 66% of construction and demolition waste consists of concrete and masonry. Trying to
use coarse aggregates derived from those wastes is a great opportunity to improve the
resource productivity of the concrete industry. It is beneficial for the life cycle of the
concrete/aggregates. Recycled concrete used as road fill is an example of down-cycling:
virgin aggregates continue to be used for making new concrete. The more materials are used
again, the lower the mining of new materials.
The problem of the recycled concrete aggregates is the fact that they have a higher porosity
than natural aggregates, especially the masonry aggregates. More water is needed to give
the concrete a same workability and that has a bad influence on mechanical properties of the
hardened concrete. Using blends of natural and recycled aggregates of water-reducing
admixtures with fly ash could cross this effect.
In this thesis the amount of aggregates will increase because the amount of water and
cement will decrease due to an optimized packing and something has to compensate this. As
the environment is concerned, this does not sound too good but there are still opportunities
to use recycled aggregates, so that the environmental impact of the aggregates decreases in
comparison with the actual situation. In this thesis this was not the goal. The goal was to
research the impact of a decrease of the amount of cement on the environment, especially
the emission of CO2. The use of recycled aggregates could be a next step in this process of
creating an ecological concrete. This was the subject of another thesis [Beirnaert, A.,
Ringoot, N., 2015].
Recycling concrete by the production of rubble granulates with the help of crushing plants
creates a concrete life cycle as shown in Figure 1-4. As a consequence there is an
economization on the use of virgin materials. Materials are used again. If there is no
recycling, there is no life cycle. The life time stops with the dismantling process [De
Schepper, M., 2014] [De Belie, N., Van den Heede, P., 2011].

Design of ecological concrete by particle packing optimization: Literature
Chapter 1: Ecological concrete 9
Figure 1-4: Lifecycle concrete
1.2.4 Reduction of cement and the use of replacement products
The energy consumption and greenhouse-gas emissions of concrete are mostly due to the
use of cement. No other cements have the same qualities as the Portland cements for the
setting, hardening and durability of the concrete. A first improvement would be an increased
use of blends of Portland cement containing cementitious or pozzolanic by-products, such as
ground granulated blast-furnace slag and fly ash.
Those materials replace partly the cement and that’s good for the environment. A concrete
with such a cement is sometimes more durable than a neat Portland cement is being used.
The slower setting and hardening rate can be compensated by a reduced amount of water
with the help of superplasticizers.
Due to the gain in strength of the optimized packing the amount of cement in the mixtures
could be lowered in this thesis. This is very interesting for the environment. In this thesis
different fillers will be used to replace the cement. The fillers have a different environmental
impact and they behave different in the mixture: some have pozzolanic properties, other
don’t. A detailed survey and explanation about the fillers used in this thesis follows in
‘Chapter 7: Used materials’, where all the materials used in the mixtures are discussed.
In the replacement products for cement there is a difference between binders and fillers.
Binders are a large group of materials that have a contribution to the strength of the concrete
because their reactions form a product that could create a binding structure between inert
particles. Fillers have no binding effects and act only as inert material: no reactions occur. In
this thesis both types of replacement products will be used.
Design of ecological concrete by particle packing optimization: Literature
Chapter 1: Ecological concrete 10
There are three types of binders: hydraulic binders, latent hydraulic binders and pozzolanic
binders. Hydraulic binders react to water forming a cement gel. Portland cement is an
example of this. Latent hydraulic binders have to be activated by for example alkalis or
sulfates. The third category of binders is the one that could be used as cement replacement
product: the pozzolanic binders/materials. Examples are fly ash and silica fume. They do not
react with water. It is the reaction product of a hydraulic binder (Portland cement) and water
that activates their reaction. An example of such a reaction is shown below. CSH (Calcium
silicate hydrate) causing the binding of concrete is formed by Ca(OH)2 (Calcium Hydroxide)
which is the reaction product from Portland cement and water, SiO2 (silicon dioxide) which is
the main component of fly ash and silica fume and H2O (water).
Ca(OH)2 + SiO2 + H2O → CSH
Contrary to binders, fillers do not react to other materials in the mixture. They are inert.
Examples are quartz powder and limestone powder. In theory this is not completely the case
but because the reactive part is negligible (5 %), it is assumed as inert in this thesis. Fillers
do not have any direct contribution to the strength of the concrete, because they are inert.
Indirectly, they may have a contribution because they may change the packing of the fine
part of the materials and the packing influences the workability and also possibly the
strength.
1.2.5 Influences of fillers
1.2.5.1 Workability
There is no general rule to predict what will be the effect of fillers on the workability. It
depends on what filler is used. Differences can be caused by the size, the shape, the
amount, the original concrete mixture and the use of superplasticizer. The use of a
superplasticizer will always be beneficial, because it prevents flocculation of the filler. Due to
flocculation, fillers would lose their influence of improving the packing partly. There are two
different theories to predict something about the workability. First the water layer theory: the
higher the specific surface (adding fillers), the lower the workability. Secondly the packing
theory: the higher the packing (adding an ideal amount of fillers), the higher the workability.
In practice a good balance between both theories is needed.
Design of ecological concrete by particle packing optimization: Literature
Chapter 1: Ecological concrete 11
1.2.5.2 Strength
Because fillers are inert, it will be especially the size and the amount of the filler that will
influence the strength of the mixture. Of course the effect of the filler on the water demand
will also be important. Is it necessary to increase the amount of water because of the filler
(higher specific surface), the concrete will be weaker. Can the amount of water be decreased
because of the filler (higher packing), the concrete will be stronger. Most researchers agree
that adding fillers will increase the strength [Fennis, S.A.A.M., 2010] [Dils, J., 2015].
1.2.5.3 Mechanical properties and durability
A higher packing and a lower water/cement ratio will restrain creep and shrinkage. The lower
the amount of cement the lower the heat of hydration and drying shrinkage. If this is the
case, the porosity should decrease and the microstructure should be more homogeneous
and dense. This results in a more durable concrete. If adding a filler results in a higher water
demand and consequently a weaker concrete, the effect of the filler would be adversely. So
also in this case the properties of a concrete with fillers will depend on the characteristics of
the filler and the effect on the concrete of adding the filler.
1.2.6 Influence of binders
Binders have two effects: the packing optimization effect of a filler and the effect of an
additional chemical reaction due to its pozzolanic properties. It is difficult to separate both.
Due to its second effect adding binders should result in stronger concrete. In this thesis, fly
ash and silica fume will be used. The size of them has a big influence on the strength
evolution of concrete.
1.3 Particle size optimization methods
The goal of this thesis is to create an ecological concrete by the optimization of the packing
density of the materials in the concrete. That should result in a higher workability. In a next
step it would be possible to reduce the water content, which leads to a stronger concrete.
The last design step can be to decrease the amount of cement, in order to achieve the same
strength as the original concrete. Doing these design steps should lead to an ecological
concrete mix design.
Traditional design of mixtures starts with specifications about the mixture and based on that
minimum contents cement and W/C recommendations can be found in documents such as
the TRA 550 in Belgium. After taking into account air and admixtures, the remaining part of
Design of ecological concrete by particle packing optimization: Literature
Chapter 1: Ecological concrete 12
the design amount (1m³) is filled with aggregates. The question is always: what kind of
aggregates and in which ratio? From the beginning, optimization curves were used to
determine that. Nowadays they are still popular because they possess a lot of practical
experience. With packing models a new and better way of proportioning the aggregates has
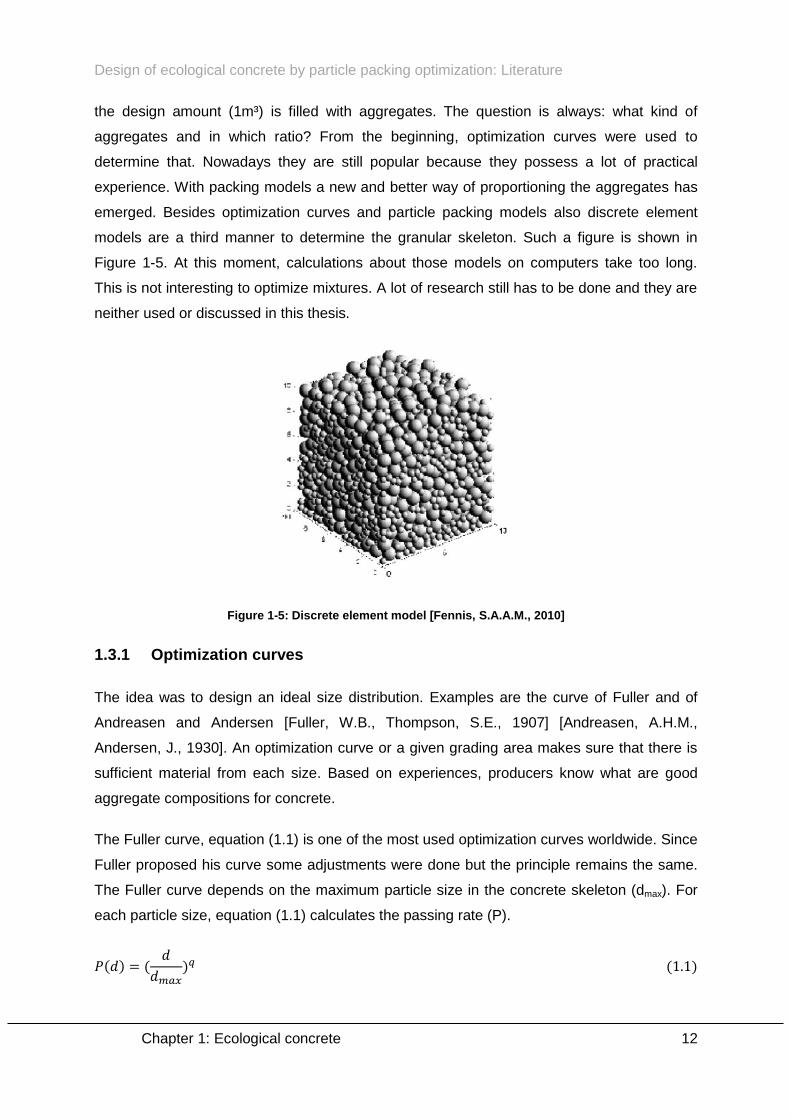
emerged. Besides optimization curves and particle packing models also discrete element
models are a third manner to determine the granular skeleton. Such a figure is shown in
Figure 1-5. At this moment, calculations about those models on computers take too long.
This is not interesting to optimize mixtures. A lot of research still has to be done and they are
neither used or discussed in this thesis.
Figure 1-5: Discrete element model [Fennis, S.A.A.M., 2010]
1.3.1 Optimization curves
The idea was to design an ideal size distribution. Examples are the curve of Fuller and of
Andreasen and Andersen [Fuller, W.B., Thompson, S.E., 1907] [Andreasen, A.H.M.,
Andersen, J., 1930]. An optimization curve or a given grading area makes sure that there is
sufficient material from each size. Based on experiences, producers know what are good
aggregate compositions for concrete.
The Fuller curve, equation (1.1) is one of the most used optimization curves worldwide. Since
Fuller proposed his curve some adjustments were done but the principle remains the same.
The Fuller curve depends on the maximum particle size in the concrete skeleton (dmax). For
each particle size, equation (1.1) calculates the passing rate (P).
( ) (
) ( )
Design of ecological concrete by particle packing optimization: Literature
Chapter 1: Ecological concrete 13
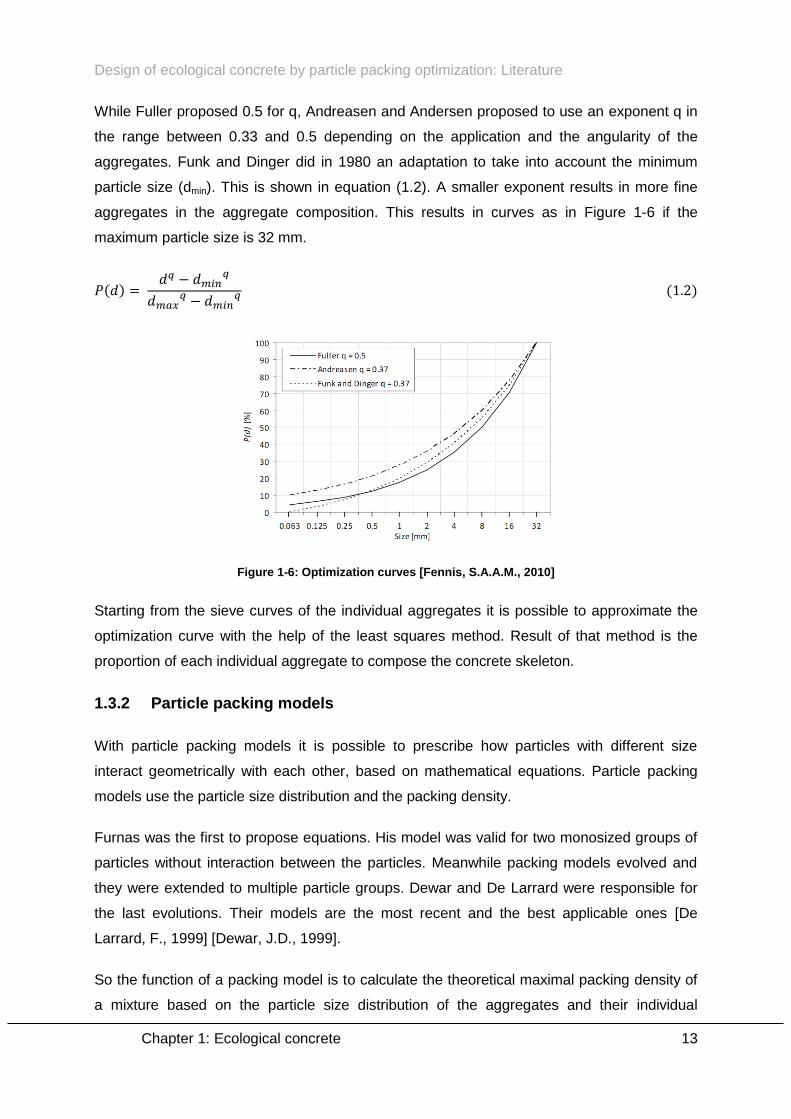
While Fuller proposed 0.5 for q, Andreasen and Andersen proposed to use an exponent q in
the range between 0.33 and 0.5 depending on the application and the angularity of the
aggregates. Funk and Dinger did in 1980 an adaptation to take into account the minimum
particle size (dmin). This is shown in equation (1.2). A smaller exponent results in more fine
aggregates in the aggregate composition. This results in curves as in Figure 1-6 if the
maximum particle size is 32 mm.
( )
( )
Figure 1-6: Optimization curves [Fennis, S.A.A.M., 2010]
Starting from the sieve curves of the individual aggregates it is possible to approximate the
optimization curve with the help of the least squares method. Result of that method is the
proportion of each individual aggregate to compose the concrete skeleton.
1.3.2 Particle packing models
With particle packing models it is possible to prescribe how particles with different size
interact geometrically with each other, based on mathematical equations. Particle packing
models use the particle size distribution and the packing density.
Furnas was the first to propose equations. His model was valid for two monosized groups of
particles without interaction between the particles. Meanwhile packing models evolved and
they were extended to multiple particle groups. Dewar and De Larrard were responsible for
the last evolutions. Their models are the most recent and the best applicable ones [De
Larrard, F., 1999] [Dewar, J.D., 1999].
So the function of a packing model is to calculate the theoretical maximal packing density of
a mixture based on the particle size distribution of the aggregates and their individual
Design of ecological concrete by particle packing optimization: Literature
Chapter 1: Ecological concrete 14
packing density. To find that maximum, it is necessary to calculate the packing density of
each possible combination of volumes between the aggregates. That combination with the
highest packing density is the one that should be applied in the composition of the concrete
skeleton of the concrete mix according to the packing theory. In ‘Chapter 2: Packing’, the
concept packing is defined and explained further. Also some packing models will be
discussed.
1.4 Evaluation of the environmental impact
To investigate the environmental influence of the mixtures the Dutch tool ‘Groen Beton’ was
used. It is a tool developed by SGS Intron for the CUR-organization. That’s an independent
neutral Dutch organization of research in the construction [SGS Intron B.V., 2013].
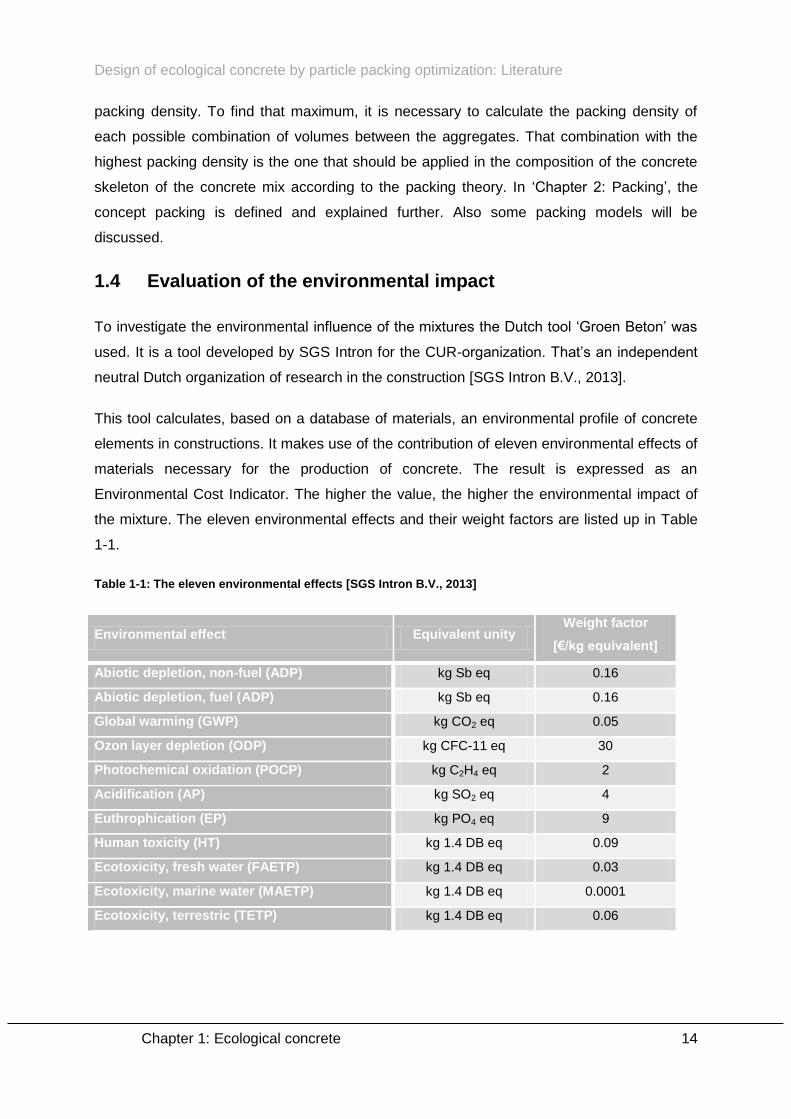
This tool calculates, based on a database of materials, an environmental profile of concrete
elements in constructions. It makes use of the contribution of eleven environmental effects of
materials necessary for the production of concrete. The result is expressed as an
Environmental Cost Indicator. The higher the value, the higher the environmental impact of
the mixture. The eleven environmental effects and their weight factors are listed up in Table
1-1.
Table 1-1: The eleven environmental effects [SGS Intron B.V., 2013]
Environmental effect Equivalent unity Weight factor
[€/kg equivalent]
Abiotic depletion, non-fuel (ADP) kg Sb eq 0.16
Abiotic depletion, fuel (ADP) kg Sb eq 0.16
Global warming (GWP) kg CO2 eq 0.05
Ozon layer depletion (ODP) kg CFC-11 eq 30
Photochemical oxidation (POCP) kg C2H4 eq 2
Acidification (AP) kg SO2 eq 4
Euthrophication (EP) kg PO4 eq 9
Human toxicity (HT) kg 1.4 DB eq 0.09
Ecotoxicity, fresh water (FAETP) kg 1.4 DB eq 0.03
Ecotoxicity, marine water (MAETP) kg 1.4 DB eq 0.0001
Ecotoxicity, terrestric (TETP) kg 1.4 DB eq 0.06
Design of ecological concrete by particle packing optimization: Literature
Chapter 1: Ecological concrete 15
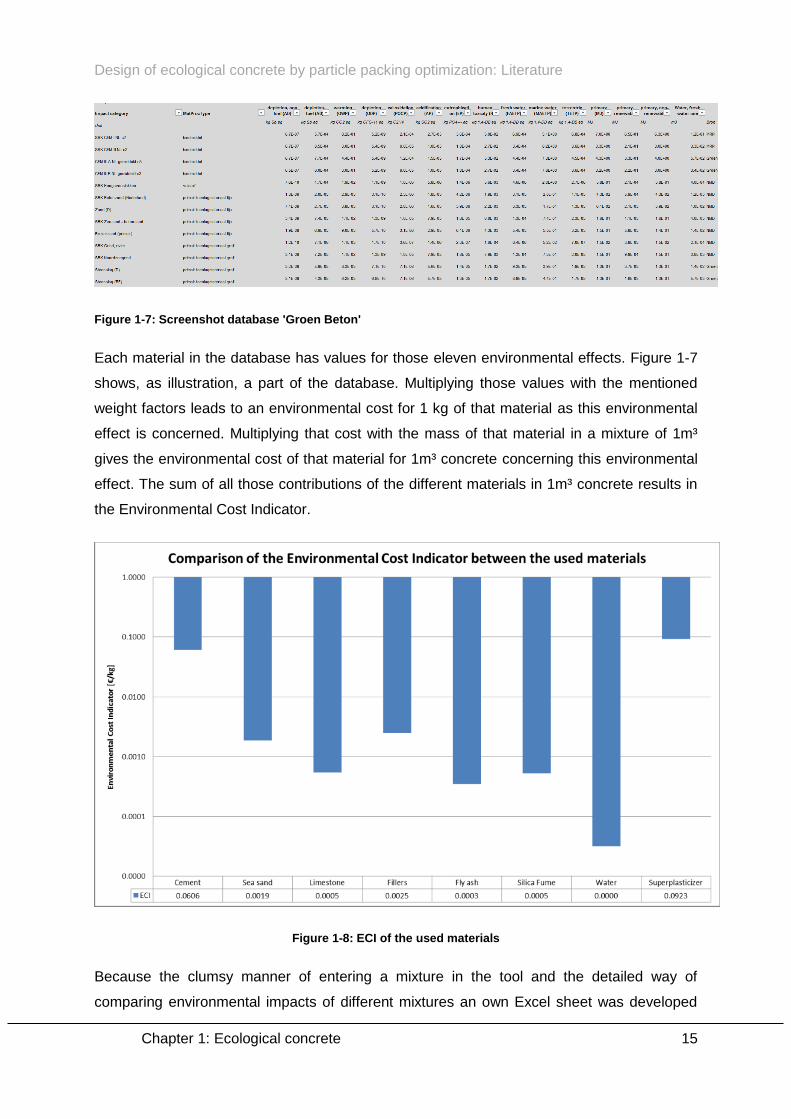
Figure 1-7: Screenshot database 'Groen Beton'
Each material in the database has values for those eleven environmental effects. Figure 1-7
shows, as illustration, a part of the database. Multiplying those values with the mentioned
weight factors leads to an environmental cost for 1 kg of that material as this environmental
effect is concerned. Multiplying that cost with the mass of that material in a mixture of 1m³
gives the environmental cost of that material for 1m³ concrete concerning this environmental
effect. The sum of all those contributions of the different materials in 1m³ concrete results in
the Environmental Cost Indicator.
Figure 1-8: ECI of the used materials
Because the clumsy manner of entering a mixture in the tool and the detailed way of
comparing environmental impacts of different mixtures an own Excel sheet was developed
Design of ecological concrete by particle packing optimization: Literature
Chapter 1: Ecological concrete 16
based on the data in the database of the tool ‘Groen Beton’. That makes it easier to adjust
mixtures and to control results. It makes it also possible to look at intermediate results. In
Figure 1-8 these effects are summed up, which leads to the Environmental Cost Indicator of
each material used in this thesis.
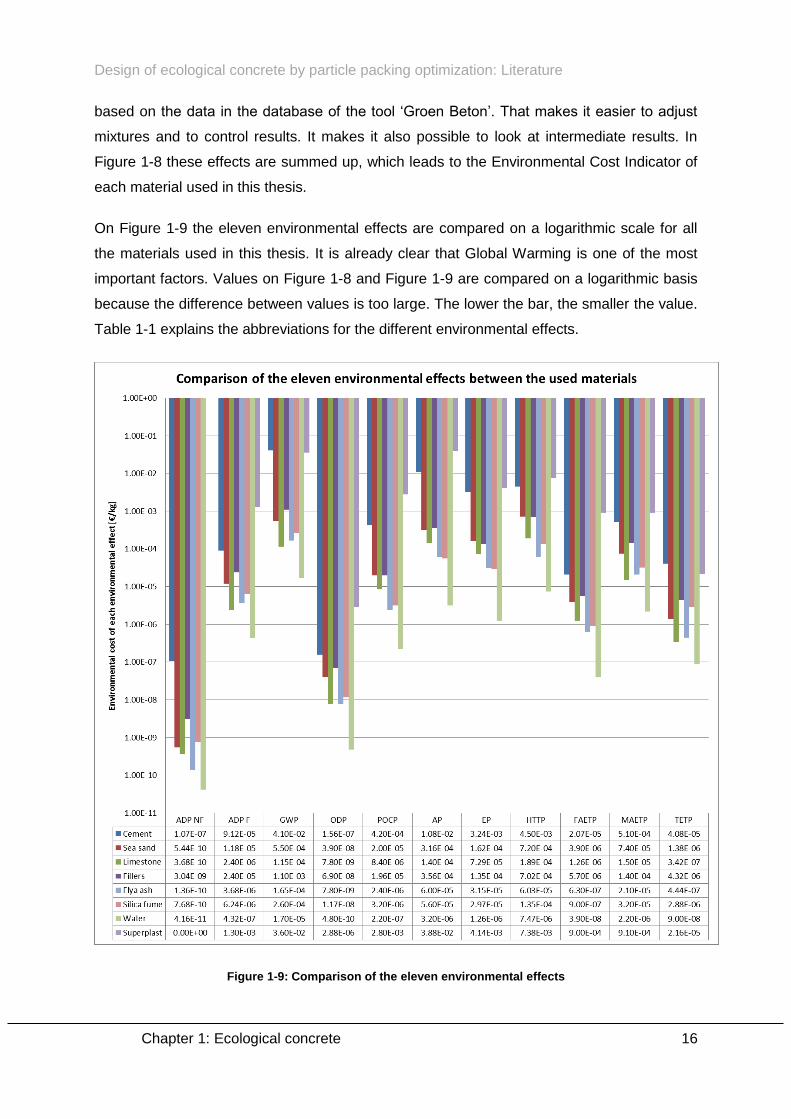
On Figure 1-9 the eleven environmental effects are compared on a logarithmic scale for all
the materials used in this thesis. It is already clear that Global Warming is one of the most
important factors. Values on Figure 1-8 and Figure 1-9 are compared on a logarithmic basis
because the difference between values is too large. The lower the bar, the smaller the value.
Table 1-1 explains the abbreviations for the different environmental effects.
Figure 1-9: Comparison of the eleven environmental effects
Design of ecological concrete by particle packing optimization: Literature
Chapter 1: Ecological concrete 17
In the tool it is possible to add the environmental impact of the transport of materials and for
the production of specific concrete elements. In this thesis the Environmental Cost Indicator
is calculated for 1m³ ready-mixed concrete. Production effects of specific materials or of the
transport of materials were neglected because that is not the issue in this thesis. Only the
impact of the mixtures is important.
From Figure 1-8 it is clear that the environmental impact of 1 kg superplasticizer is the
largest one, but superplasticizer is only a small part in a mixture. According to this tool, it will
always be the cement that has the biggest influence on the environment.
The database of the materials is rather large but in this thesis some special fillers were used
that were not present in the database such as clay and limestone powder. Adding materials
is nearly impossible because it is very difficult to determine the values of a material for these
eleven environmental effects. According to Dr. ir. Steffen Grünewald, it is a good
approximation to take the same values for clay and limestone powder as for quartz powder.
In Figure 1-8 and Figure 1-9 these three cement replacing materials were called ‘Fillers’. This
is not completely correct but an abbreviation was necessary to make the graphs visual
acceptable. In ‘Chapter 7: Used materials’ the difference between those materials are
explained.
The end result of the tool ‘Groen Beton’, the Environmental Cost Indicator, is the summation
of the masses of the used materials for 1m³ concrete times the values for the weight factors
mentioned in Figure 1-8. This is the background information for the calculation and the
results of the Environmental Cost Indicator in the experimental part of this thesis.
1.5 Evaluation of the economic impact
Besides the ecological effect of mixtures, also the economic part of it will be important. This
is also calculated in this thesis, based on the costs for the used materials when they are
ordered in big amounts by big companies. It was asked to keep these costs secret so only
relative values will be mentioned, no absolute values. Table 1-2: Economic comparison
contains the costs of the used materials and the cement was used as a standard.
In the experimental part of this thesis the economic cost of each produced mixture was
calculated. Also for the total cost of 1m³ of a mixture, no absolute values will be used. The
cost of each mixture will be mentioned and compared in the experimental part of this thesis
in the same way as in Table 1-2 with the reference concrete as reference.
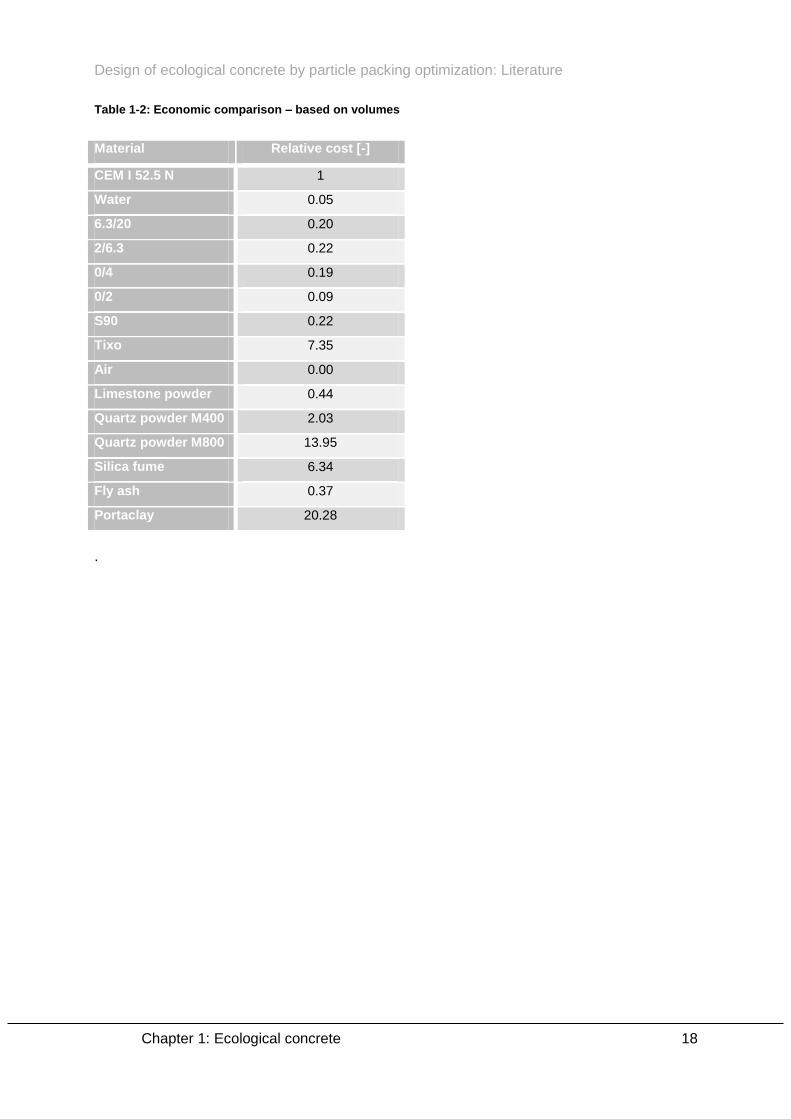
Design of ecological concrete by particle packing optimization: Literature
Chapter 1: Ecological concrete 18
Table 1-2: Economic comparison – based on volumes
Material Relative cost [-]
CEM I 52.5 N 1
Water 0.05
6.3/20 0.20
2/6.3 0.22
0/4 0.19
0/2 0.09
S90 0.22
Tixo 7.35
Air 0.00
Limestone powder 0.44
Quartz powder M400 2.03
Quartz powder M800 13.95
Silica fume 6.34
Fly ash 0.37
Portaclay 20.28
.
Design of ecological concrete by particle packing optimization: Literature
Chapter 2: Packing 19
Chapter 2 Packing
2.1 Definitions
The packing density (α) of a mixture of different aggregates, shown in equation (2.1) is
defined as the ratio of the solid volume of the particles (Vp) to the bulk volume of the particles
(Vb). The bulk volume is the total volume of the container, in which the particles are stored
( )
For coarse and dry materials this could be determined with a compaction test. The bulk
density (ρb) is the ration between the mass of the particles (mp) and the volume of the
container. If the density of the particles (ρp) is known, it is possible to calculate the packing as
in equation (2.1). The density of the particles could be determined by a pycnometer test. It is
also possible to express the packing as a porosity of the mixture (ε) or as the amount of
pores (e). This is shown in equations (2.2) and (2.3).
( )
( )
Concrete is a composite material, consisting of aggregates that are glued by a binder. A
good mix of particles with different sizes, will result in less pores. The higher the packing, the
lower the voids content or the amount of pores. A lower voids content means less cement
paste and is necessary to fill the voids or pores. Also the water demand should be lower.
From an ecological point of view these are beneficial effects.
In concrete packing varies from 0.55 to 0.80. Porosity varies between 0.45 and 0.20. This
has to be filled by the cement paste. Porosity determines the minimum amount of the volume
of cement paste. To give the mix a sufficient workability, it is necessary to give the mixture an
excess amount of the paste [Fennis, S.A.A.M., 2010].
According to the environment, it is already clear that a higher packing is beneficial. Also for
the producers of concrete this would be good, because cement is one of the most expensive
components. Lowering that amount means more margin. Also for the engineer it is
Design of ecological concrete by particle packing optimization: Literature
Chapter 2: Packing 20
interesting to lower the amount of cement because the hydration heat and drying shrinkage
are directly proportional to the amount of cement. Less cement means less cracks.
2.2 Influencing factors
The packing density of a mixture aggregates with different size classes depending on the
particle size and the size distribution, the angularity of the aggregates and the way in which
they are packed individually [De Larrard, F., 1999].
2.2.1 The particle size and size distribution
The particle size is important for the packing density of fine materials, not for the packing
density of coarse materials. There is a fundamental difference between packing of small
materials and packing for coarse materials. The border is situated at a size of approximately
100 µm [Fennis, S.A.A.M., 2010].
Coarse particles are only influenced by granular interaction forces. Gravitation and shear
forces are the most influencing forces. For smaller particles, the packing is normally lower.
This is because they have a higher specific surface and a lower mass: the surface area to
the volume ratio is higher. Also weak short-distance forces have an influence. The most
important surface forces are the van der Waals forces, the electrostatic double layer forces
and the steric forces. The surface forces could be influenced by the water and the
superplasticizer [Fennis, S.A.A.M., 2010].
2.2.2 Shape of the particles
Shape can be characterized by the overall shape, the roundness and the surface texture. In
theory these characteristics are independent of each other. However, it is possible that there
is a relation between them, because physical processes could have influence on more than
one characteristic.
The overall shape expresses the relation between the three dimensions of a particle. So it
indicates when a particle is elongated, flat or rather spherical. The more particles are
spherical, the better for the packing density. The roundness expresses the sharpness of
possible corners. It could be subdivided in rounded, sub-rounded, sub-angular or angular.
The roundness of angles is important to describe the abrasive and crushing resistance. The
roundness of the perimeter is important for interlocking properties and packing density. The
surface texture could be subdivided in very rough, rough, smooth or polished. This is a
Design of ecological concrete by particle packing optimization: Literature
Chapter 2: Packing 21
function of the size and sharpness of protrusions and indentations on the surface. Normally
this is less important for the packing density. It is more determining for the adhesion ability
between the particles and the cement paste [Kwan, A.K.H., Moa, C.F., 2001].
Angular particles have advantages and disadvantages. They help to maintain a homogenous
mixture because they complicate segregation due to interlock. On the other hand, spherical
particles minimize interparticle friction so packing density could be higher. With rounded
particles less compaction energy is needed to achieve the maximum packing because they
improve the workability. Angular aggregates needs more compaction energy to achieve the
same packing density. It is not certain that it will be possible to achieve a same packing
density. Otherwise their structure is stronger and more stable. An ideal situation is a mix. If
the ratio of angular particles is small (+- 10%), the packing density is not significantly
decreased. Due to the higher interparticle friction, the compact strength will be increased.
2.2.3 Packing method
The packing density is in function of the amount of energy that is added to a mixture. There
is a remarkable difference in packing if particles are trilled and mixed or not. If particles are
loosely deposited, the loose packing density is measured. This is the situation where the
amount of pores is the highest.
Adding energy can be done by vibration or by mixing. With the vibrations, the pores will open
themselves and other particles will fill the gaps. The mass of the particles is responsible for
the addition packing. With mixing, an external force is added and gravity will have a higher
influence in comparison with a mixture that is not mixed. The K-value is a constant indicating
how much energy is added to the mixture. More energy results in a higher K-value.
A mixture of two aggregates can illustrate this very well. As you can see in Figure 2-1 the
ratio between the two components is important. This illustrates what was said in paragraph
‘2.2.1: The particle size and size distribution’: there is an ideal amount of fine material to fill
the gaps between coarse materials. More or less fine materials will result in a lower packing
density. Also the influence of the compaction, the K-value, is shown in Figure 2-1. A higher
K-value means more compaction energy is added and results in a increased packing density.
There is also a shift of the optimum to the left. That indicates that less fine materials are
necessary. This is related to the fact that the added energy is responsible for a better
packing of the coarse materials, and so less fine materials are needed to fill those gaps.

Design of ecological concrete by particle packing optimization: Literature
Chapter 2: Packing 22
Figure 2-1: Comapaction energy - parameter K [De Larrard, F., 1999]
2.3 Structures
Based on the forces acting on the particles they could move away from each other or come
closer to each other. That is the way how an independent particle structure is formed. In this
particle structure, different effects could occur, which influences the packing density of the
total mixture.
2.3.1 Geometrical interaction
Depending on the ratio of the particle size, the particle shape and the presence of different
particle classes, two geometrical interactions could occur: the loosening effect and the wall
effect.
When fine particles fill gaps between large particles, the packing will increase. This is the
reason why the packing of an aggregate with a uniform size distribution increases if the size
distribution becomes wider. Not only the number of different size classes is important, also
the amount of material in each size class is important. If there are too much fine materials,
they could push larger particles away from each other. When the fine materials are not fine
enough, it is also possible that they push larger particles away. This is called the loosening
effect and this is one of the reasons why the particle size and the size distribution are
important parameters for the packing. Figure 2-2 illustrates this.
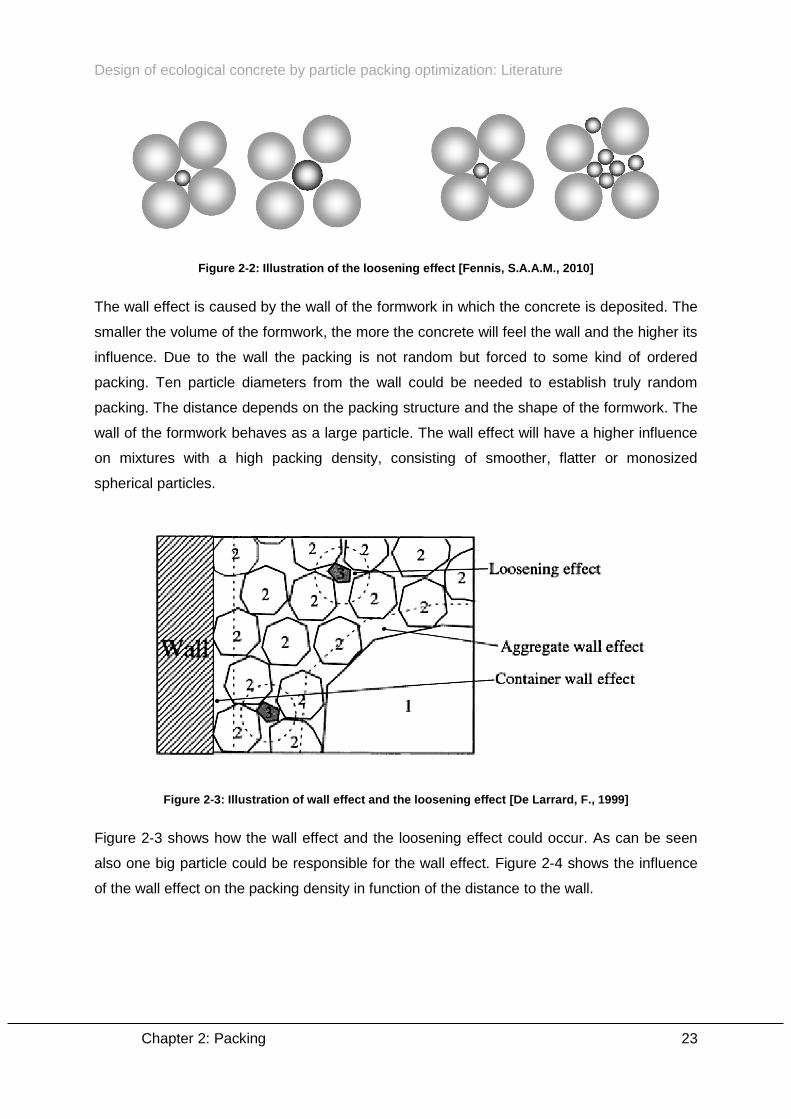
Design of ecological concrete by particle packing optimization: Literature
Chapter 2: Packing 23
Figure 2-2: Illustration of the loosening effect [Fennis, S.A.A.M., 2010]
The wall effect is caused by the wall of the formwork in which the concrete is deposited. The
smaller the volume of the formwork, the more the concrete will feel the wall and the higher its
influence. Due to the wall the packing is not random but forced to some kind of ordered
packing. Ten particle diameters from the wall could be needed to establish truly random
packing. The distance depends on the packing structure and the shape of the formwork. The
wall of the formwork behaves as a large particle. The wall effect will have a higher influence
on mixtures with a high packing density, consisting of smoother, flatter or monosized
spherical particles.
Figure 2-3: Illustration of wall effect and the loosening effect [De Larrard, F., 1999]
Figure 2-3 shows how the wall effect and the loosening effect could occur. As can be seen
also one big particle could be responsible for the wall effect. Figure 2-4 shows the influence
of the wall effect on the packing density in function of the distance to the wall.
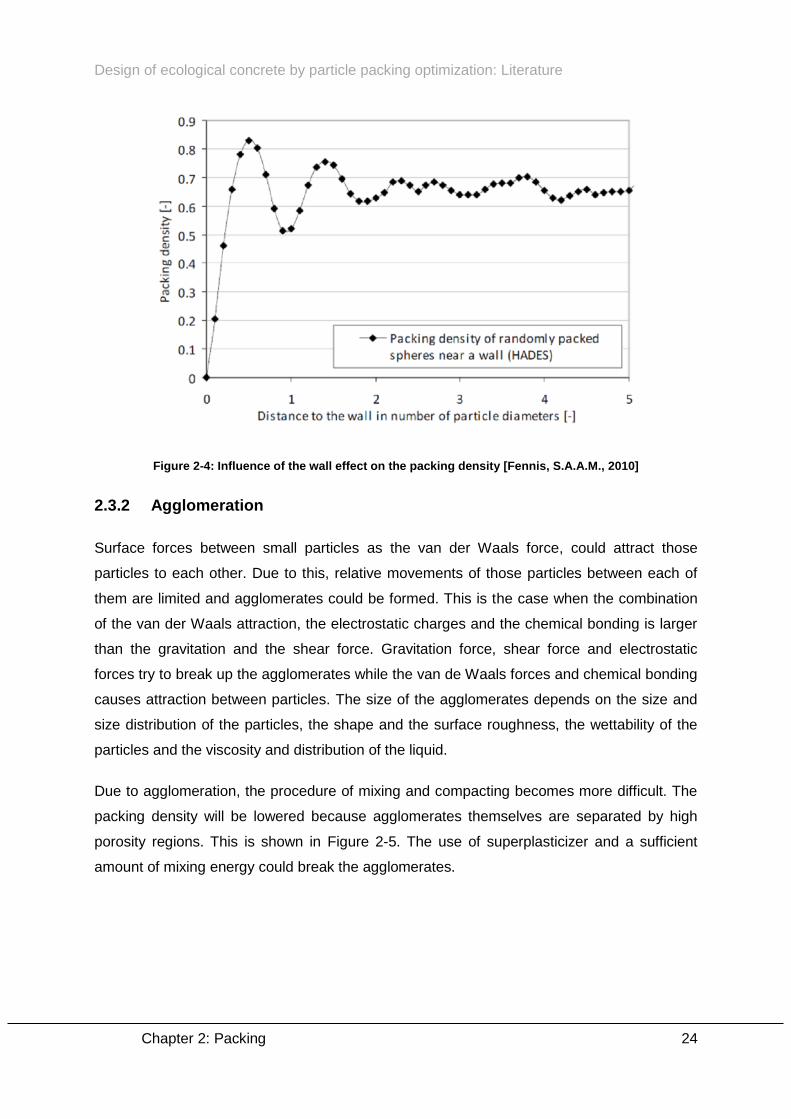
Design of ecological concrete by particle packing optimization: Literature
Chapter 2: Packing 24
Figure 2-4: Influence of the wall effect on the packing density [Fennis, S.A.A.M., 2010]
2.3.2 Agglomeration
Surface forces between small particles as the van der Waals force, could attract those
particles to each other. Due to this, relative movements of those particles between each of
them are limited and agglomerates could be formed. This is the case when the combination
of the van der Waals attraction, the electrostatic charges and the chemical bonding is larger
than the gravitation and the shear force. Gravitation force, shear force and electrostatic
forces try to break up the agglomerates while the van de Waals forces and chemical bonding
causes attraction between particles. The size of the agglomerates depends on the size and
size distribution of the particles, the shape and the surface roughness, the wettability of the
particles and the viscosity and distribution of the liquid.
Due to agglomeration, the procedure of mixing and compacting becomes more difficult. The
packing density will be lowered because agglomerates themselves are separated by high
porosity regions. This is shown in Figure 2-5. The use of superplasticizer and a sufficient
amount of mixing energy could break the agglomerates.
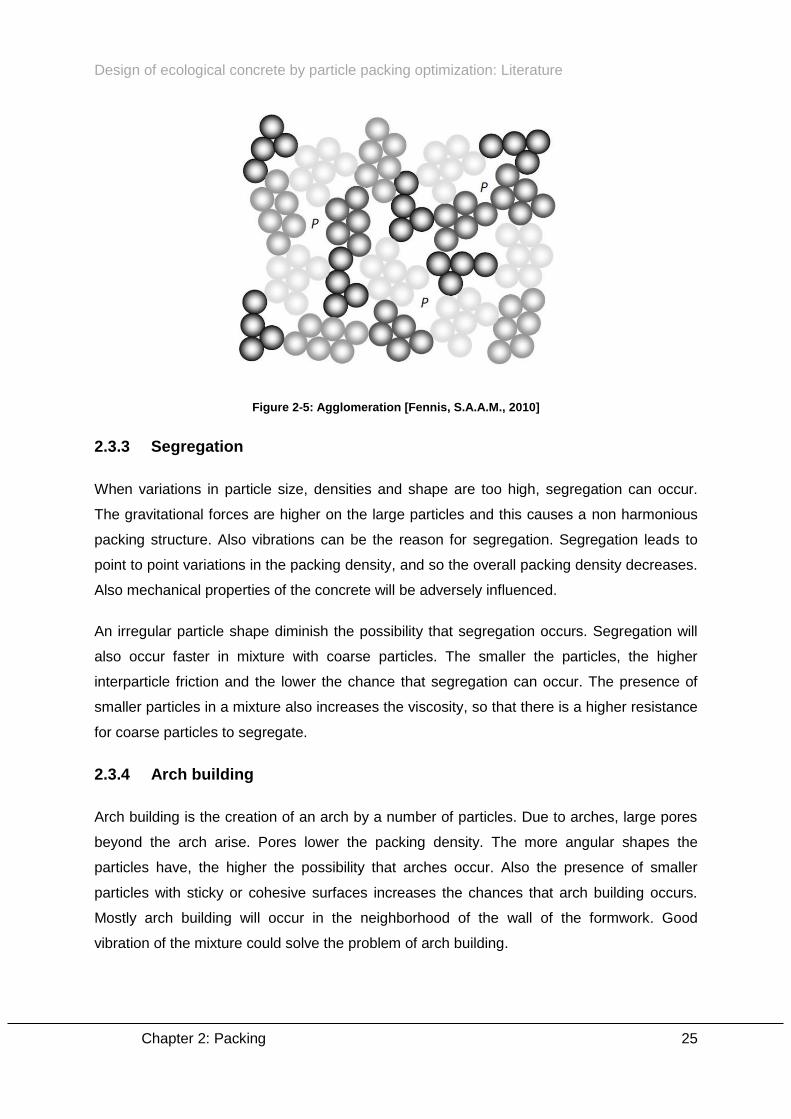
Design of ecological concrete by particle packing optimization: Literature
Chapter 2: Packing 25
Figure 2-5: Agglomeration [Fennis, S.A.A.M., 2010]
2.3.3 Segregation
When variations in particle size, densities and shape are too high, segregation can occur.
The gravitational forces are higher on the large particles and this causes a non harmonious
packing structure. Also vibrations can be the reason for segregation. Segregation leads to
point to point variations in the packing density, and so the overall packing density decreases.
Also mechanical properties of the concrete will be adversely influenced.
An irregular particle shape diminish the possibility that segregation occurs. Segregation will
also occur faster in mixture with coarse particles. The smaller the particles, the higher
interparticle friction and the lower the chance that segregation can occur. The presence of
smaller particles in a mixture also increases the viscosity, so that there is a higher resistance
for coarse particles to segregate.
2.3.4 Arch building
Arch building is the creation of an arch by a number of particles. Due to arches, large pores
beyond the arch arise. Pores lower the packing density. The more angular shapes the
particles have, the higher the possibility that arches occur. Also the presence of smaller
particles with sticky or cohesive surfaces increases the chances that arch building occurs.
Mostly arch building will occur in the neighborhood of the wall of the formwork. Good
vibration of the mixture could solve the problem of arch building.

Design of ecological concrete by particle packing optimization: Literature
Chapter 2: Packing 26
2.4 Determining the packing
There are different methods to determine the packing. Which method has to be used
depends on the size of the particles and personal preferences. General rule is that the
packing has to be determined in the way how the particles are used. Globally seen, there are
two methods to determine the packing: a dry one and a wet one. Because concrete is always
in wet state it is logical to think that packing always must be determined with the wet method.
The advantage of the wet methods is that they reduce the surface forces if the mixture is
saturated. Because coarse particles only are affected by gravitation and shear forces and not
really by surface forces it is also allowed to test them on a dry manner.
So for coarse aggregates (> 1 mm) a dry method is used because little surface forces occur
and it is not necessary to use the wet method. There is a norm available to determine the
loose packing density of a material: NBN EN 1097-3:1998. This describes how to fill a
container and to measure the volume and the mass of them. With those results the packing
could be calculated with expression 2.1. To know the maximal particle packing this method
has to be adapted. In this thesis the adapted dry method was used. Because all executed
tests are described in ‘Chapter 5: Executed tests on aggregates’, I refer to that chapter for
more details.
For particles smaller than 125 µm a wet method has to be used because surface forces are
gaining in importance. Those forces could be responsible for the agglomeration which leads
to a lower packing density. Using a wet method means the mixture is saturated with
polycarboxylate ether-based superplasticizers (PCE’s) to reduce surface forces. Two tests
are proposed by Sonja Fennis: the water demand by determining mixing energy test of
Marquardt and the centrifugal consolidation test of Kjeldsen and Miller [Fennis, S.A.A.M.,
2010]. Because it was not necessary in this thesis to test packing in a wet manner, these
tests are not explained [Bosmans, T., Van Der Putten, J., 2014].
2.5 Packing models
Packing models are used to determine the maximal packing density for different
combinations of coarse aggregates (> 125 µm). There are also packing models to determine
the packing of small particles (< 125 µm) but a lot of research is still necessary to make
those models more accurate.
Design of ecological concrete by particle packing optimization: Literature
Chapter 2: Packing 27
During the history, a lot of packing models were developed, every time with a higher
performance. This thesis makes use of the Compressible Packing Model (CPM) [De Larrard,
F., 1999]. In ‘Chapter 3: CPM‘ this packing model will be discussed in detail. In this
paragraph other packing models will be shortly mentioned [Fennis, S.A.A.M., 2010].
The Furnas model was one of the first packing models in 1929. It was developed by Furnas.
It is only valid for 2 groups of monosized particles without interaction between the particles.
This means that the diameters of both groups monosized particles have to be clearly
different. If they are too similar effect as the wall effect and the loosening effect occur.
Current models make still use of the equations of Furnas.
In 1976 Toufar presented his Toufar model. He tried to implement interaction between
particles if the diameters were rather equal. In his first model something was not correct:
adding fine material in a sample of coarse particles does not lead to an increase of the
packing. Therefore an adaptation was done and the modified Toufar model was developed.
The goal of it was to estimate the packing of a multicomponent system. However, with his
formula, the packing density was always underestimated. The more size classes were used,
the higher the deviation. A stepwise calculation procedure could partly solve that problem.
The modified Toufar model is limited to the prediction of the packing density of a mixture
consisting of two monosized particle classes.
The Dewar model presented in 1999 by Dewar was something not really based on previous
models. It calculates a voids ratio and this is linked to the porosity and the packing density.
Starting with the smallest two size classes, the voids ratio and a new characteristic diameter
is calculated. Step by step, this process goes on with the following size class. Based on the
mean size and the amount of each monosized particle class, a total voids ratio of a concrete
mixture can be calculated. However, due to the stepwise calculation the model becomes
progressively slower with increasing amount of size classes, and the use of an average
diameter leads to an underestimation of the packing density.
The Linear Packing Density Model by Stovall in 1986 and F. De Larrard in 1999 was an
improvement of the Furnas model in two major respects. It was a multi-component model,
instead of a two-component model, and it was able to take into account geometrical
interaction between particles: the wall effect and the loosening effect. The Linear Packing
Density Model has two disadvantages: the way how the mixture is packed does not have any
influence and due to the linearity, the value of the optimal packing density was always
overestimated. Further adaptations and research were necessary.
Design of ecological concrete by particle packing optimization: Literature
Chapter 2: Packing 28
The Schwanda Model looks likes the Dewar Model. It also calculates a maximum voids ratio
which corresponds to the minimum voids content and the maximum packing density. It
considers three cases. Case 1 and 2 can be derived from the Furnas Model. Case 3 is the
transition zone between case 1 and 2. In case 1 small particles fill up the voids between
large particles. In case 2 there are much more fine particles than there are voids. In case 3
this is rather in balance. In 2000 Reschke described that the Schwanda model could be used
for aggregates, fillers or a combination of both. The model can be extended to any desired
amount of size classes. The set-up of the model creates possibilities to implement additional
interaction effects.
The Linear-Mixture Packing Model from Yu and Standisch developed in 1991, makes a
distinction between filling or additive components and occupying or mixing components. If
particles are so small that they only fill gaps and they do not disturb the packing, than they
are regarded as a filling or additive component. If they do not fit into the voids, they disturb
the packing and a new packing structure is formed. The model is developed for predicting the
packing density of mixtures, consisting of spherical particles. Initially, the model was not able
to handle varying monosized packing densities and this is often the case for angular particles
or very fine agglomerated particles. The Modified Linear Packing Model solved that problem.
Besides the CPM, discussed in next chapter, also the CIPM exists. This was developed by
Sonja Fennis in her PhD [Fennis, S.A.A.M., 2010]. It is an extension of the CPM with
additional factors to directly take into account effects by small particles, such as the creation
of agglomerates or other phenomena during mixing and compaction.
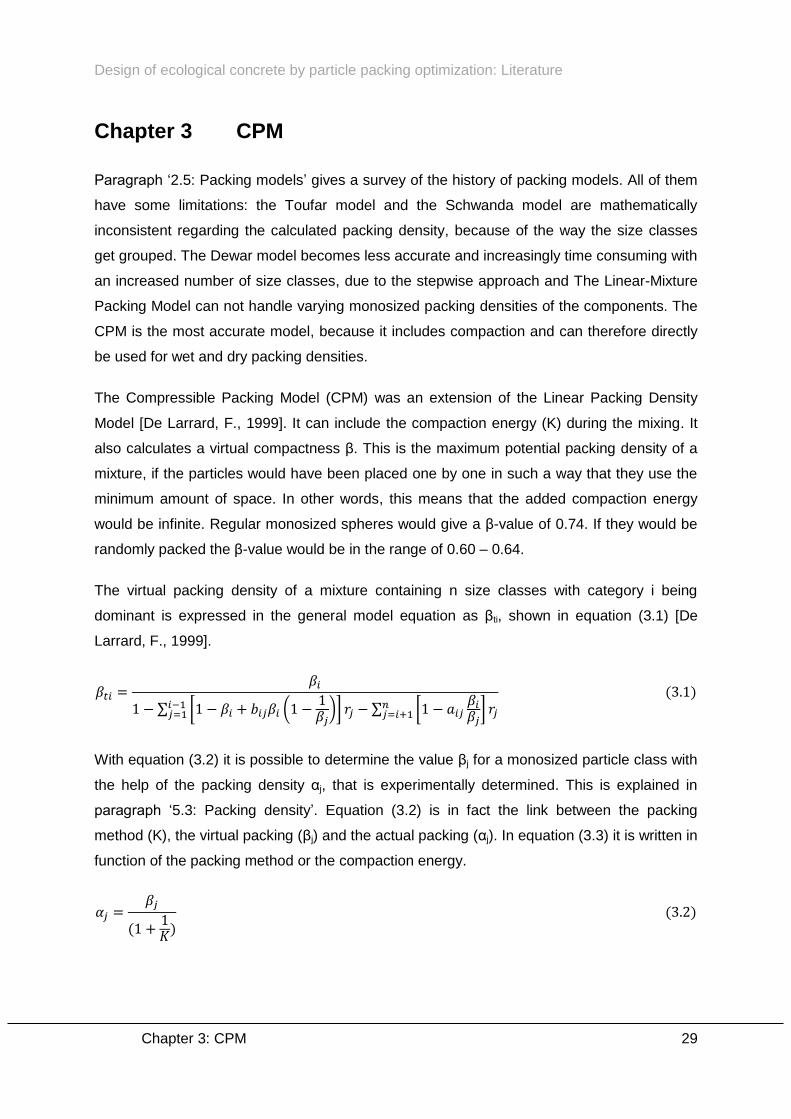
Design of ecological concrete by particle packing optimization: Literature
Chapter 3: CPM 29
Chapter 3 CPM
Paragraph ‘2.5: Packing models’ gives a survey of the history of packing models. All of them
have some limitations: the Toufar model and the Schwanda model are mathematically
inconsistent regarding the calculated packing density, because of the way the size classes
get grouped. The Dewar model becomes less accurate and increasingly time consuming with
an increased number of size classes, due to the stepwise approach and The Linear-Mixture
Packing Model can not handle varying monosized packing densities of the components. The
CPM is the most accurate model, because it includes compaction and can therefore directly
be used for wet and dry packing densities.
The Compressible Packing Model (CPM) was an extension of the Linear Packing Density
Model [De Larrard, F., 1999]. It can include the compaction energy (K) during the mixing. It
also calculates a virtual compactness β. This is the maximum potential packing density of a
mixture, if the particles would have been placed one by one in such a way that they use the
minimum amount of space. In other words, this means that the added compaction energy
would be infinite. Regular monosized spheres would give a β-value of 0.74. If they would be
randomly packed the β-value would be in the range of 0.60 – 0.64.
The virtual packing density of a mixture containing n size classes with category i being
dominant is expressed in the general model equation as βti, shown in equation (3.1) [De
Larrard, F., 1999].
∑ [ ( )] ∑ [
]
( )
With equation (3.2) it is possible to determine the value βj for a monosized particle class with
the help of the packing density αj, that is experimentally determined. This is explained in
paragraph ‘5.3: Packing density’. Equation (3.2) is in fact the link between the packing
method (K), the virtual packing (βj) and the actual packing (αj). In equation (3.3) it is written in
function of the packing method or the compaction energy.
( ) ( )

Design of ecological concrete by particle packing optimization: Literature
Chapter 3: CPM 30
( )
In the general model equation, also factors aij and bij are present. They represent the
loosening effect, equation (3.4), and the wall effect, equation (3.5). They depend on the ratio
between the particle diameters of class i and class j. They are determined by an evaluation
with the CPM for binary mixtures [De Larrard, F., 1999].
√ (
) ( )
( ) ( )
The coefficients aij and bij from equations (3.4) and (3.5) are constant for a given size-ratio.
The size ratio is a value between 0 and 1 and is defined as the diameter of a small size
class, divided by the diameter of a large size class. The number of size classes is ‘n’ and the
diameters of the size classes are ordered from d1 (largest size class) to dn (smallest size
class). For the loosening effect the size-ratio is dj/di. For the wall effect the size-ratio
becomes di/dj. This is because index j (of the larger size class) is always smaller than index i
(of the dominating size class). Figure 3-1 is a graphical representation of the value for the
wall effect and the loosening effect depending on their size-ratio. The loosening effect is
larger for small size-ratios. For a size-ratio higher than 0.72 the wall effect becomes the most
important geometrical interaction.
Figure 3-1: Wall effect and loosening effect related to size ratio [Fennis, S.A.A.M., 2010]
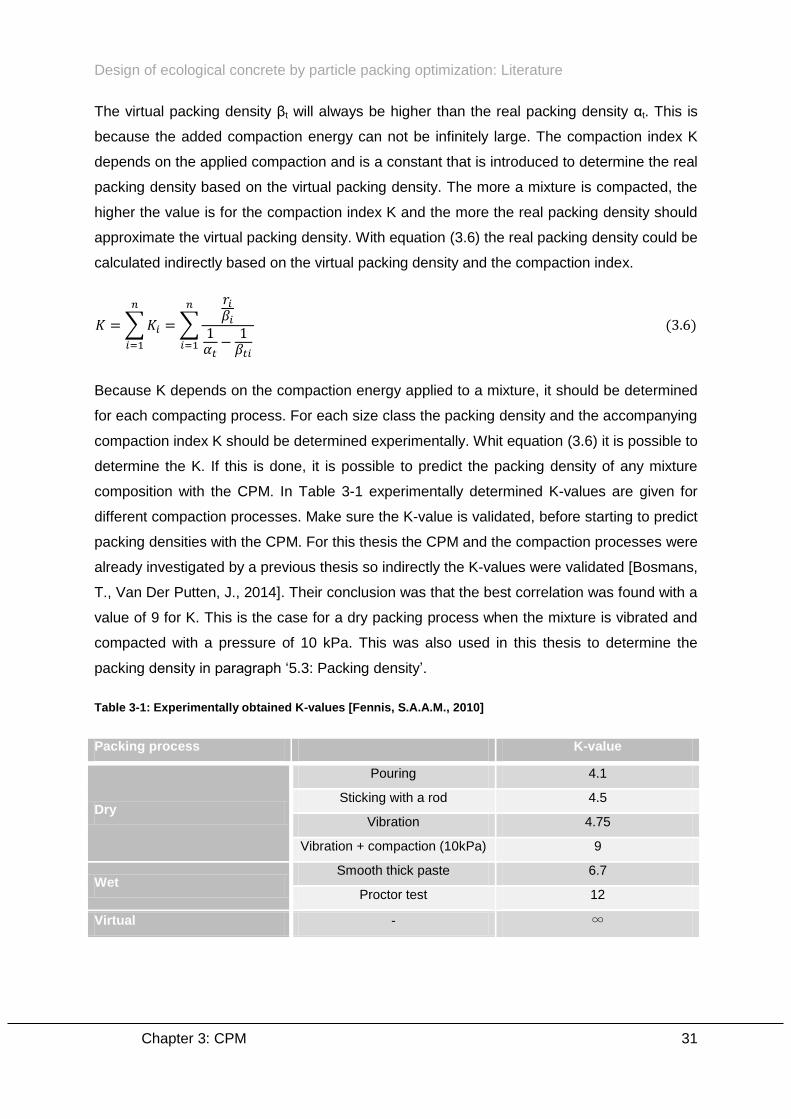
Design of ecological concrete by particle packing optimization: Literature
Chapter 3: CPM 31
The virtual packing density βt will always be higher than the real packing density αt. This is
because the added compaction energy can not be infinitely large. The compaction index K
depends on the applied compaction and is a constant that is introduced to determine the real
packing density based on the virtual packing density. The more a mixture is compacted, the
higher the value is for the compaction index K and the more the real packing density should
approximate the virtual packing density. With equation (3.6) the real packing density could be
calculated indirectly based on the virtual packing density and the compaction index.
∑
∑
( )
Because K depends on the compaction energy applied to a mixture, it should be determined
for each compacting process. For each size class the packing density and the accompanying
compaction index K should be determined experimentally. Whit equation (3.6) it is possible to
determine the K. If this is done, it is possible to predict the packing density of any mixture
composition with the CPM. In Table 3-1 experimentally determined K-values are given for
different compaction processes. Make sure the K-value is validated, before starting to predict
packing densities with the CPM. For this thesis the CPM and the compaction processes were
already investigated by a previous thesis so indirectly the K-values were validated [Bosmans,
T., Van Der Putten, J., 2014]. Their conclusion was that the best correlation was found with a
value of 9 for K. This is the case for a dry packing process when the mixture is vibrated and
compacted with a pressure of 10 kPa. This was also used in this thesis to determine the
packing density in paragraph ‘5.3: Packing density’.
Table 3-1: Experimentally obtained K-values [Fennis, S.A.A.M., 2010]
Packing process K-value
Dry
Pouring 4.1
Sticking with a rod 4.5
Vibration 4.75
Vibration + compaction (10kPa) 9
Wet Smooth thick paste 6.7
Proctor test 12
Virtual - ∞

Design of ecological concrete by particle packing optimization: Literature
Chapter 3: CPM 32
In conclusion, the CPM predicts the packing density of a mixture based on the size
distribution and the packing densities of each monosized particle class. By way of α the
particle shape and surface texture is indirectly taken into account. The interaction formulas aij
and bij and the value for K determines the accuracy of the model.
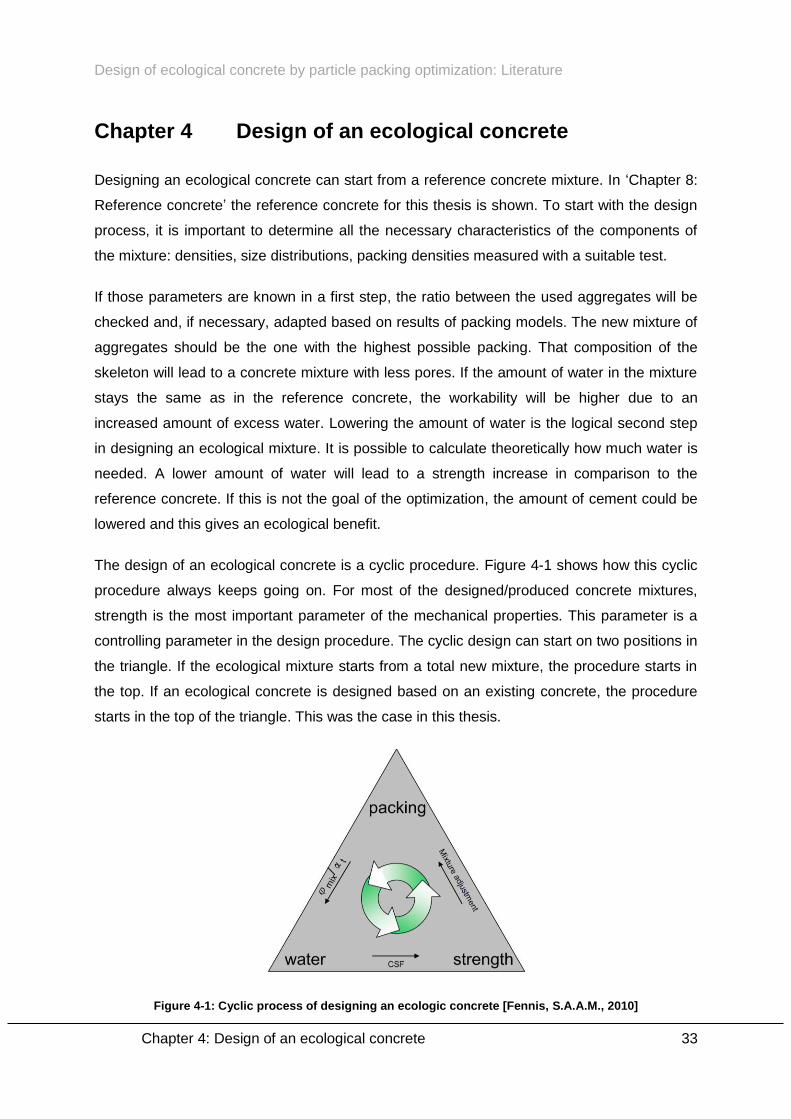
Design of ecological concrete by particle packing optimization: Literature
Chapter 4: Design of an ecological concrete 33
Chapter 4 Design of an ecological concrete
Designing an ecological concrete can start from a reference concrete mixture. In ‘Chapter 8:
Reference concrete’ the reference concrete for this thesis is shown. To start with the design
process, it is important to determine all the necessary characteristics of the components of
the mixture: densities, size distributions, packing densities measured with a suitable test.
If those parameters are known in a first step, the ratio between the used aggregates will be
checked and, if necessary, adapted based on results of packing models. The new mixture of
aggregates should be the one with the highest possible packing. That composition of the
skeleton will lead to a concrete mixture with less pores. If the amount of water in the mixture
stays the same as in the reference concrete, the workability will be higher due to an
increased amount of excess water. Lowering the amount of water is the logical second step
in designing an ecological mixture. It is possible to calculate theoretically how much water is
needed. A lower amount of water will lead to a strength increase in comparison to the
reference concrete. If this is not the goal of the optimization, the amount of cement could be
lowered and this gives an ecological benefit.
The design of an ecological concrete is a cyclic procedure. Figure 4-1 shows how this cyclic
procedure always keeps going on. For most of the designed/produced concrete mixtures,
strength is the most important parameter of the mechanical properties. This parameter is a
controlling parameter in the design procedure. The cyclic design can start on two positions in
the triangle. If the ecological mixture starts from a total new mixture, the procedure starts in
the top. If an ecological concrete is designed based on an existing concrete, the procedure
starts in the top of the triangle. This was the case in this thesis.
Figure 4-1: Cyclic process of designing an ecologic concrete [Fennis, S.A.A.M., 2010]
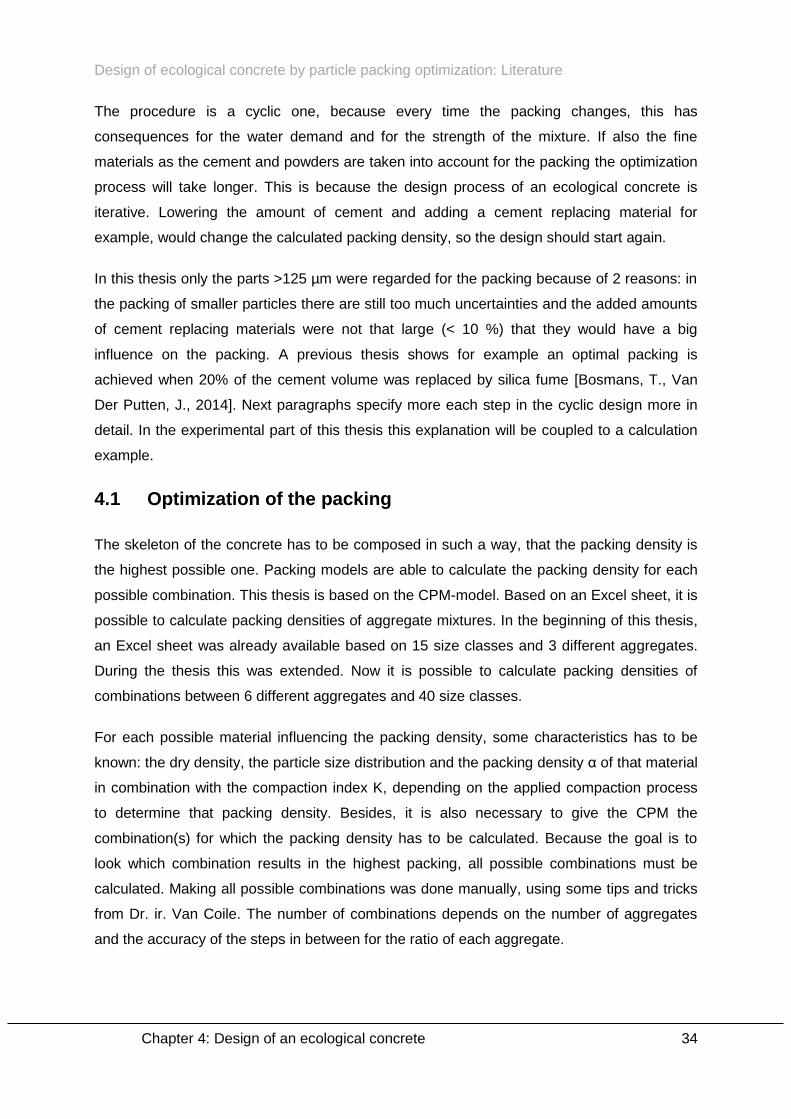
Design of ecological concrete by particle packing optimization: Literature
Chapter 4: Design of an ecological concrete 34
The procedure is a cyclic one, because every time the packing changes, this has
consequences for the water demand and for the strength of the mixture. If also the fine
materials as the cement and powders are taken into account for the packing the optimization
process will take longer. This is because the design process of an ecological concrete is
iterative. Lowering the amount of cement and adding a cement replacing material for
example, would change the calculated packing density, so the design should start again.
In this thesis only the parts >125 µm were regarded for the packing because of 2 reasons: in
the packing of smaller particles there are still too much uncertainties and the added amounts
of cement replacing materials were not that large (< 10 %) that they would have a big
influence on the packing. A previous thesis shows for example an optimal packing is
achieved when 20% of the cement volume was replaced by silica fume [Bosmans, T., Van
Der Putten, J., 2014]. Next paragraphs specify more each step in the cyclic design more in
detail. In the experimental part of this thesis this explanation will be coupled to a calculation
example.
4.1 Optimization of the packing
The skeleton of the concrete has to be composed in such a way, that the packing density is
the highest possible one. Packing models are able to calculate the packing density for each
possible combination. This thesis is based on the CPM-model. Based on an Excel sheet, it is
possible to calculate packing densities of aggregate mixtures. In the beginning of this thesis,
an Excel sheet was already available based on 15 size classes and 3 different aggregates.
During the thesis this was extended. Now it is possible to calculate packing densities of
combinations between 6 different aggregates and 40 size classes.
For each possible material influencing the packing density, some characteristics has to be
known: the dry density, the particle size distribution and the packing density α of that material
in combination with the compaction index K, depending on the applied compaction process
to determine that packing density. Besides, it is also necessary to give the CPM the
combination(s) for which the packing density has to be calculated. Because the goal is to
look which combination results in the highest packing, all possible combinations must be
calculated. Making all possible combinations was done manually, using some tips and tricks
from Dr. ir. Van Coile. The number of combinations depends on the number of aggregates
and the accuracy of the steps in between for the ratio of each aggregate.
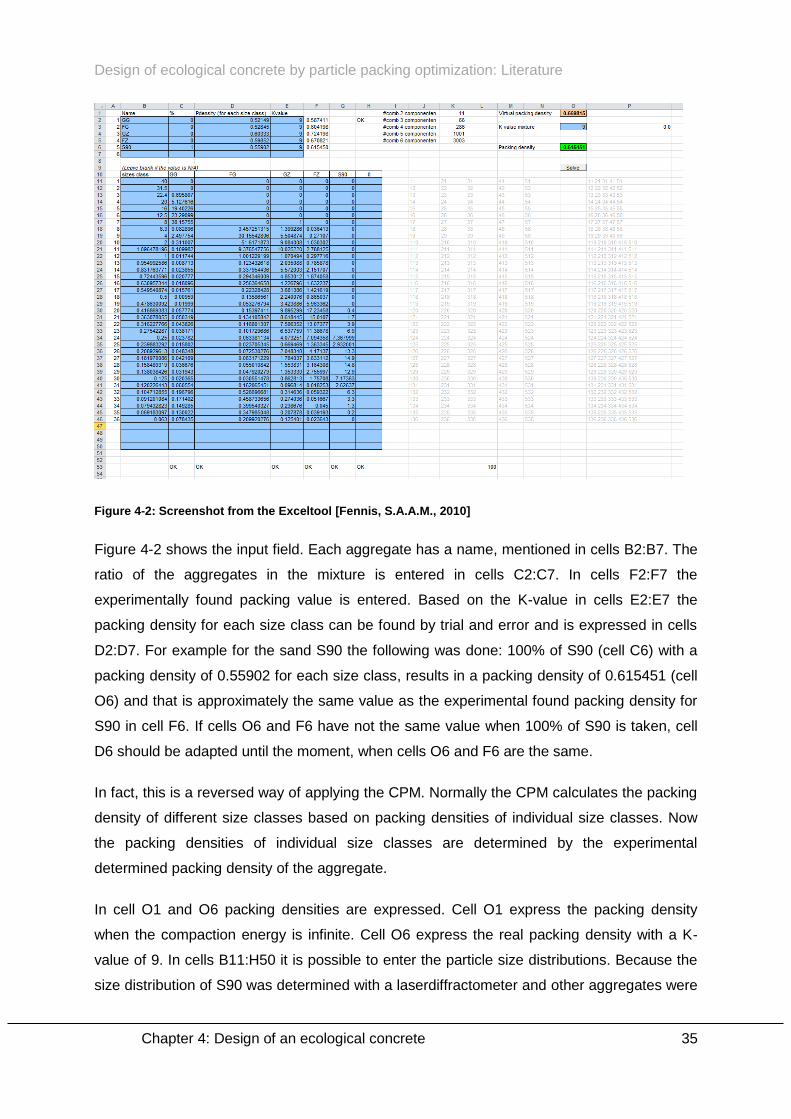
Design of ecological concrete by particle packing optimization: Literature
Chapter 4: Design of an ecological concrete 35
Figure 4-2: Screenshot from the Exceltool [Fennis, S.A.A.M., 2010]
Figure 4-2 shows the input field. Each aggregate has a name, mentioned in cells B2:B7. The
ratio of the aggregates in the mixture is entered in cells C2:C7. In cells F2:F7 the
experimentally found packing value is entered. Based on the K-value in cells E2:E7 the
packing density for each size class can be found by trial and error and is expressed in cells
D2:D7. For example for the sand S90 the following was done: 100% of S90 (cell C6) with a
packing density of 0.55902 for each size class, results in a packing density of 0.615451 (cell
O6) and that is approximately the same value as the experimental found packing density for
S90 in cell F6. If cells O6 and F6 have not the same value when 100% of S90 is taken, cell
D6 should be adapted until the moment, when cells O6 and F6 are the same.
In fact, this is a reversed way of applying the CPM. Normally the CPM calculates the packing
density of different size classes based on packing densities of individual size classes. Now
the packing densities of individual size classes are determined by the experimental
determined packing density of the aggregate.
In cell O1 and O6 packing densities are expressed. Cell O1 express the packing density
when the compaction energy is infinite. Cell O6 express the real packing density with a K-
value of 9. In cells B11:H50 it is possible to enter the particle size distributions. Because the
size distribution of S90 was determined with a laserdiffractometer and other aggregates were

Design of ecological concrete by particle packing optimization: Literature
Chapter 4: Design of an ecological concrete 36
manually sieved some interpolation calculations were done. With these interpolations
calculations it is possible to have values for each size class, even if they were not measured.
In cell H2 it was checked if the sum of C2:C7 is 1, which should always be the case. Cells
B53:H53 check if the sum of all the size classes is 1. Also this should always be the case.
Also attention has to be paid to the K-value of 9 in cell O3. This is related to the manner how
the compaction test, described in paragraph ‘5.3: Packing density’, is executed to obtain a
value for the packing.
Calculating the packing density for each combination was done with a VBA script, that takes
the values of each combination, copies them in cells C2:C7, calculates the packing density
and copies the result from cell O6 to a cell next to the relevant combination.
4.2 Optimization of the workability
The concrete mixture composed according to the aggregate composition with the highest
packing determined in previous step should have a higher workability because the amount of
pores is minimal. If the design of an ecological concrete starts from an existing mixture this
would be especially the case. This is because the optimized mixture has less pores
compared to the original aggregate mixture, which results in an increased amount excess
water. Because the strength of concrete is related to the W/C factor, the overdose of water
created by the packing optimization could decrease the strength of the concrete mixture.
According to the theory of Sonja Fennis [2010], there is a link between the workability of a
mixture and the amount of water in combination with the packing density of the mixture. The
packing density of the mixture is expressed with the parameter αt and is by way of the
compaction index K related to the virtual packing density βt. This explanation was already
given in paragraph ‘2.2.3: Packing method’. The amount of water is expressed by a new
parameter mix, which represents the amount of solids in the mixture. Equations (4.1) and
(4.2) show the relation.
( )
( )
The ratio mix/ αt is directly related to the workability, which could for example be expressed
by a flow value [Fennis, S.A.A.M., 2010]. This is shown in Figure 4-3. Due to the optimization
of the packing of the mixture in previous step, the value for αt will increase. The ratio mix/αt
Design of ecological concrete by particle packing optimization: Literature
Chapter 4: Design of an ecological concrete 37
should decrease. Figure 4-3 shows that the flow value or the workability would increase. This
corresponds to the theoretical idea: higher packing results in less pores and this means an
additional surplus of water in the mixture, to improve the workability. Based on the relation it
should be possible to calculate/predict the flow values based on the ratio mix/αt but this is
not the case in this thesis because that relation is not generally valid. It is a relation which is
specific for a mixture, for the type of superplasticizer and the dose of it. If sufficient data
would be available, a similar relation could be proposed. This was done in the experimental
part.
Figure 4-3: Link between ratio φmix/αt and the flow value [Fennis, S.A.A.M., 2010]
In case the ecological concrete was not based on an existing mixture, a ratio mix/ αt
equivalent with a desired flow value could be chosen. Because αt is known from the CPM,
the value for mix could be calculated and then it is possible to calculate the amount of water.
In this thesis a reference concrete was used as a starting point. To reduce the increased
workability of the optimized mixture, the ratio mix/ αt of the optimized mixture should be
equalized to the ratio mix/ αt of the reference mixture, while adjusting the amount of water
( mix) in the optimized mixture. This is expressed in equation (4.3). Equation (4.4) calculates
the mix of the optimized mixture. Based on equations (4.1) and (4.2) equation (4.5) could be
written, with ‘water, air, superplasticizer’ abbreviated to ‘w,a,s’. In equation (4.6), equation
(4.5) is rewritten in function of the unknown. Equation (4.7) calculates what was searched for.
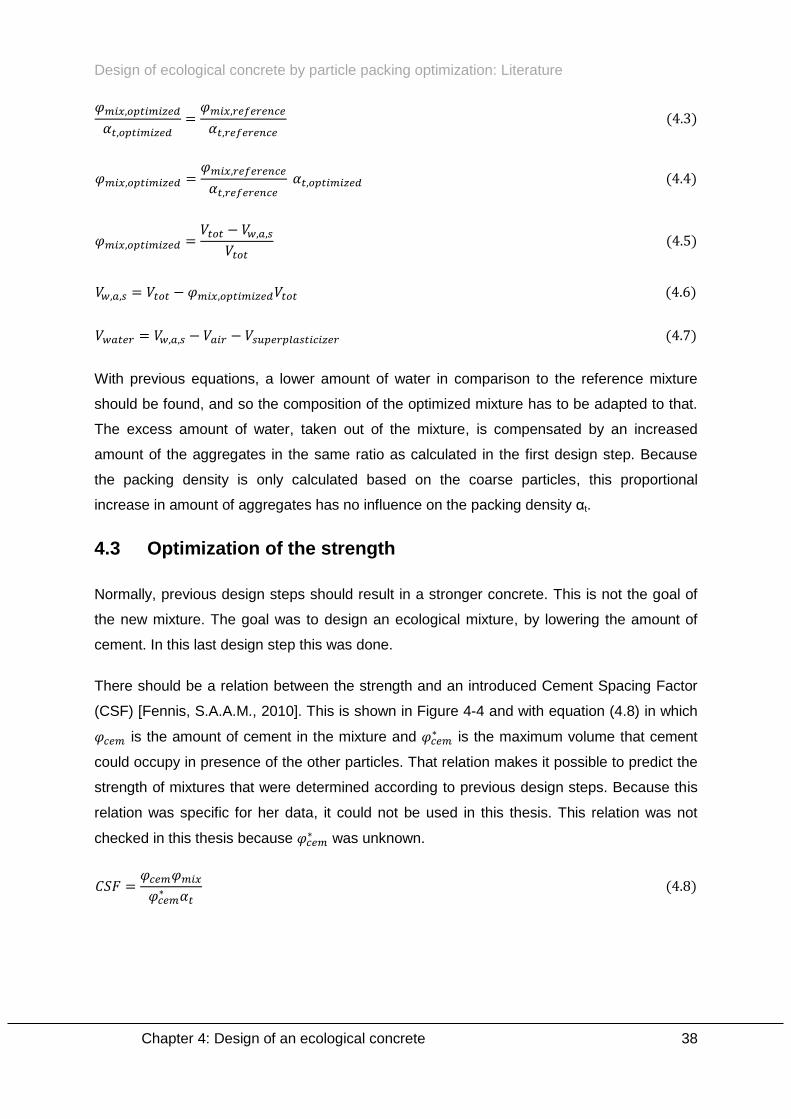
Design of ecological concrete by particle packing optimization: Literature
Chapter 4: Design of an ecological concrete 38
( )
( )
( )
( )
( )
With previous equations, a lower amount of water in comparison to the reference mixture
should be found, and so the composition of the optimized mixture has to be adapted to that.
The excess amount of water, taken out of the mixture, is compensated by an increased
amount of the aggregates in the same ratio as calculated in the first design step. Because
the packing density is only calculated based on the coarse particles, this proportional
increase in amount of aggregates has no influence on the packing density αt.
4.3 Optimization of the strength
Normally, previous design steps should result in a stronger concrete. This is not the goal of
the new mixture. The goal was to design an ecological mixture, by lowering the amount of
cement. In this last design step this was done.
There should be a relation between the strength and an introduced Cement Spacing Factor
(CSF) [Fennis, S.A.A.M., 2010]. This is shown in Figure 4-4 and with equation (4.8) in which
is the amount of cement in the mixture and is the maximum volume that cement
could occupy in presence of the other particles. That relation makes it possible to predict the
strength of mixtures that were determined according to previous design steps. Because this
relation was specific for her data, it could not be used in this thesis. This relation was not
checked in this thesis because was unknown.
( )
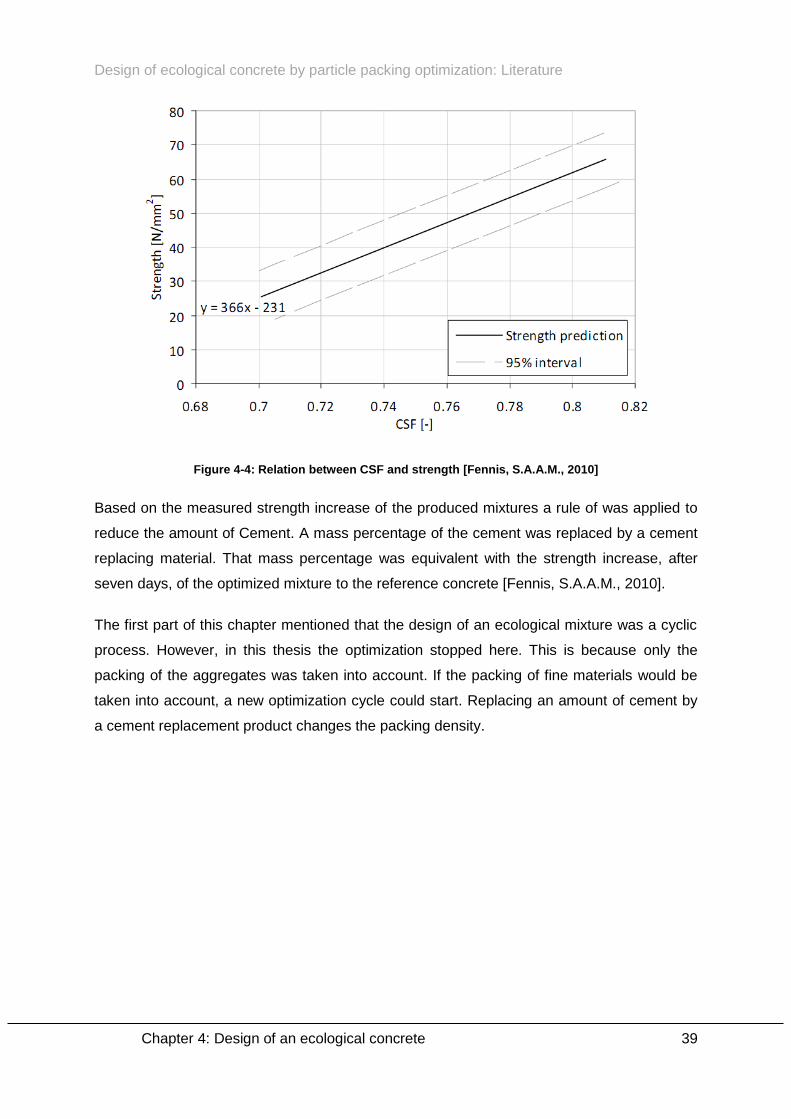
Design of ecological concrete by particle packing optimization: Literature
Chapter 4: Design of an ecological concrete 39
Figure 4-4: Relation between CSF and strength [Fennis, S.A.A.M., 2010]
Based on the measured strength increase of the produced mixtures a rule of was applied to
reduce the amount of Cement. A mass percentage of the cement was replaced by a cement
replacing material. That mass percentage was equivalent with the strength increase, after
seven days, of the optimized mixture to the reference concrete [Fennis, S.A.A.M., 2010].
The first part of this chapter mentioned that the design of an ecological mixture was a cyclic
process. However, in this thesis the optimization stopped here. This is because only the
packing of the aggregates was taken into account. If the packing of fine materials would be
taken into account, a new optimization cycle could start. Replacing an amount of cement by
a cement replacement product changes the packing density.

Design of ecological concrete by particle packing optimization: Literature
Chapter 5: Executed tests on aggregates 40
Chapter 5 Executed tests on aggregates
As mentioned in previous chapter, tests have to be done on the aggregates to know their
characteristics. These tests are necessary for the CPM. The CPM needs the particle size
distribution and the packing density of each aggregate. To determine the packing density,
also the density of particles has to be determined. Following paragraphs describe which tests
were done on the aggregates and how they were executed. A survey of the used aggregates
in this thesis is given in ‘Chapter 7: Used materials’. The results of the tests are given in the
experimental part of this thesis.
5.1 Particle size distribution
The particle size distribution is necessary because packing models are based on size
classes. The size distribution is an indication of how many particles are present in a size
class. Coarse materials could be sieved. For finer materials a laserdiffractometer should be
used. In theory, for this thesis, it was not necessary to have a particle size distribution of the
fine materials but it was done to make it possible to compare the fine materials with each
other, and to have an idea of the mean size.
5.1.1 Sieve curves
The sieve test of materials was executed in agreement with the NBN EN 933-1:2012 and
with sieves of the ISO-3310 series. The used sieves were the same as in the work of Sonja
Fennis and are listed up in Table 5-1 [Fennis, S.A.A.M., 2010]. For the limestone aggregates
all the sieves were used, for the sand the 6 largest ones were not used. The aggregates
were not washed before they were sieved because the amount of fine materials in them was
assumed limited. From every aggregate, three independent sieve tests were done. An
average of them was further on used for the calculations. Attention was paid to the starting
mass, which is related to the maximum particle size and has to satisfy a minimum value. No
mechanical vibration was used. The total pile of sieves was shaken manually and then every
sieve was shaken separately and manually during one minute until the amount of
aggregates, falling through the sieve, was lower than the directive in the norm. Figure 5-1
shows the pile of sieves.
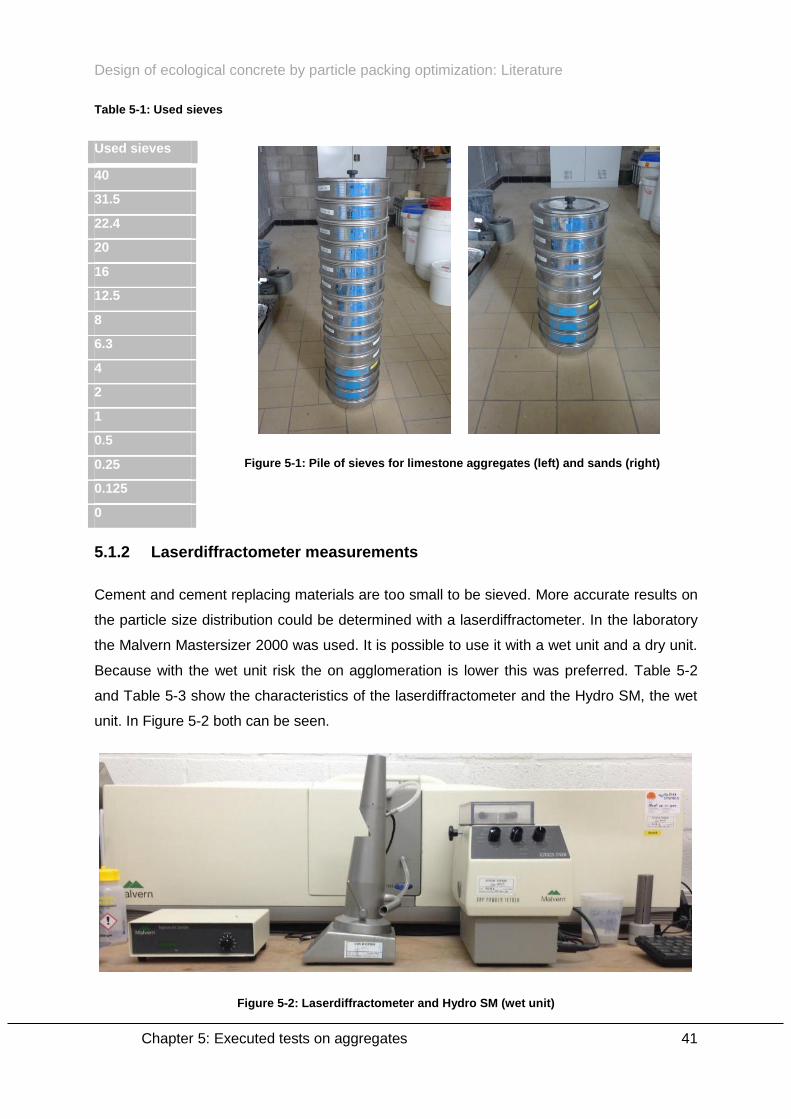
Design of ecological concrete by particle packing optimization: Literature
Chapter 5: Executed tests on aggregates 41
Table 5-1: Used sieves
Used sieves
40
31.5
22.4
20
16
12.5
8
6.3
4
2
1
0.5
0.25
0.125
0
5.1.2 Laserdiffractometer measurements
Cement and cement replacing materials are too small to be sieved. More accurate results on
the particle size distribution could be determined with a laserdiffractometer. In the laboratory
the Malvern Mastersizer 2000 was used. It is possible to use it with a wet unit and a dry unit.
Because with the wet unit risk the on agglomeration is lower this was preferred. Table 5-2
and Table 5-3 show the characteristics of the laserdiffractometer and the Hydro SM, the wet
unit. In Figure 5-2 both can be seen.
Figure 5-2: Laserdiffractometer and Hydro SM (wet unit)
Figure 5-1: Pile of sieves for limestone aggregates (left) and sands (right)
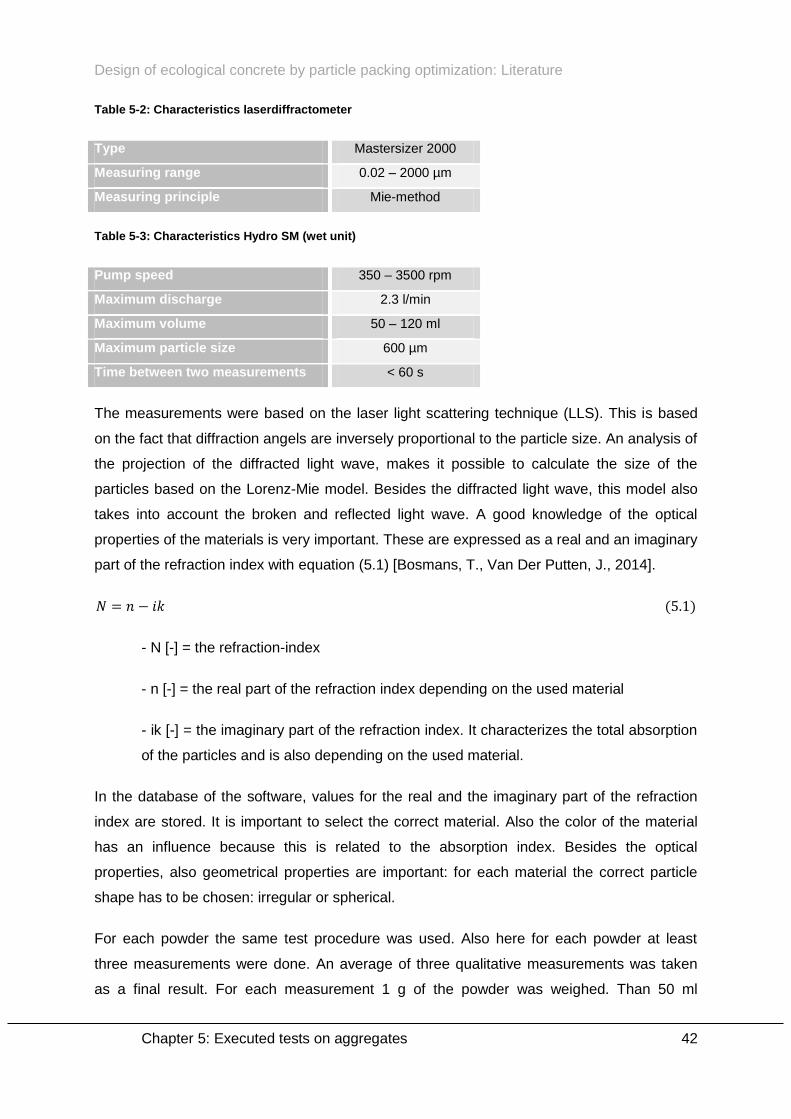
Design of ecological concrete by particle packing optimization: Literature
Chapter 5: Executed tests on aggregates 42
Table 5-2: Characteristics laserdiffractometer
Type Mastersizer 2000
Measuring range 0.02 – 2000 µm
Measuring principle Mie-method
Table 5-3: Characteristics Hydro SM (wet unit)
Pump speed 350 – 3500 rpm
Maximum discharge 2.3 l/min
Maximum volume 50 – 120 ml
Maximum particle size 600 µm
Time between two measurements < 60 s
The measurements were based on the laser light scattering technique (LLS). This is based
on the fact that diffraction angels are inversely proportional to the particle size. An analysis of
the projection of the diffracted light wave, makes it possible to calculate the size of the
particles based on the Lorenz-Mie model. Besides the diffracted light wave, this model also
takes into account the broken and reflected light wave. A good knowledge of the optical
properties of the materials is very important. These are expressed as a real and an imaginary
part of the refraction index with equation (5.1) [Bosmans, T., Van Der Putten, J., 2014].
( )
- N [-] = the refraction-index
- n [-] = the real part of the refraction index depending on the used material
- ik [-] = the imaginary part of the refraction index. It characterizes the total absorption
of the particles and is also depending on the used material.
In the database of the software, values for the real and the imaginary part of the refraction
index are stored. It is important to select the correct material. Also the color of the material
has an influence because this is related to the absorption index. Besides the optical
properties, also geometrical properties are important: for each material the correct particle
shape has to be chosen: irregular or spherical.
For each powder the same test procedure was used. Also here for each powder at least
three measurements were done. An average of three qualitative measurements was taken
as a final result. For each measurement 1 g of the powder was weighed. Than 50 ml
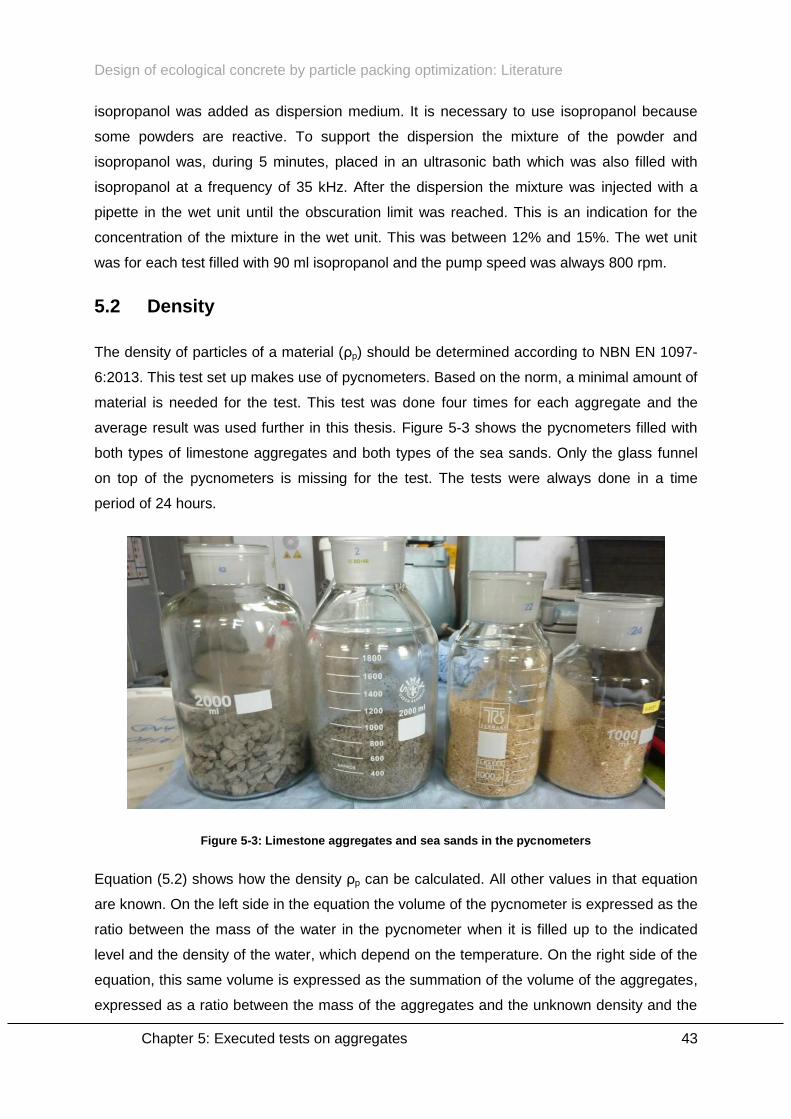
Design of ecological concrete by particle packing optimization: Literature
Chapter 5: Executed tests on aggregates 43
isopropanol was added as dispersion medium. It is necessary to use isopropanol because
some powders are reactive. To support the dispersion the mixture of the powder and
isopropanol was, during 5 minutes, placed in an ultrasonic bath which was also filled with
isopropanol at a frequency of 35 kHz. After the dispersion the mixture was injected with a
pipette in the wet unit until the obscuration limit was reached. This is an indication for the
concentration of the mixture in the wet unit. This was between 12% and 15%. The wet unit
was for each test filled with 90 ml isopropanol and the pump speed was always 800 rpm.
5.2 Density
The density of particles of a material (ρp) should be determined according to NBN EN 1097-
6:2013. This test set up makes use of pycnometers. Based on the norm, a minimal amount of
material is needed for the test. This test was done four times for each aggregate and the
average result was used further in this thesis. Figure 5-3 shows the pycnometers filled with
both types of limestone aggregates and both types of the sea sands. Only the glass funnel
on top of the pycnometers is missing for the test. The tests were always done in a time
period of 24 hours.
Figure 5-3: Limestone aggregates and sea sands in the pycnometers
Equation (5.2) shows how the density ρp can be calculated. All other values in that equation
are known. On the left side in the equation the volume of the pycnometer is expressed as the
ratio between the mass of the water in the pycnometer when it is filled up to the indicated
level and the density of the water, which depend on the temperature. On the right side of the
equation, this same volume is expressed as the summation of the volume of the aggregates,
expressed as a ratio between the mass of the aggregates and the unknown density and the

Design of ecological concrete by particle packing optimization: Literature
Chapter 5: Executed tests on aggregates 44
volume of the water added, to fill the pycnometer up to the indicated level. That last volume
is also expressed as a ratio between the mass of the added water and the density of the
water, depending on the temperature. The mass of the added water could be calculated as
the difference between the mass of the pycnometer, filled with aggregates and water, minus
the mass of the aggregates and the mass of the dry and empty pycnometer.
( )
5.3 Packing density
The packing densities were only determined for the coarse aggregates, and so a dry method
could be used. An example of a dry method is the compaction test, which makes use of a
light weight vibration table from the German manufacturer Testing. This method was used
and validated in a previous thesis [Bosmans, T., Van Der Putten, J., 2014]. In Table 5-4
some properties are listed up.
Table 5-4: Properties vibrating table
Type Light weight vibration table met on/off switch
Effective surface 350 x 350 x 225 mm
Speed engine 3000 rpm
Frequency 50 Hz
The test set-up consists of a steel base plate. A steel cylinder is placed UPON. The
connection is taped, in a way that there are no openings and no small particles can escape
from the monster. The aggregate is placed in the cylinder. The cylinder has a height of
128.52 mm and a diameter of 153.28 mm. The mass of the monster was always taken at 1.5
kg constantly. Above the monster, a mass of 8.253 kg was placed which resulted in an
average pressure of 4.39 kPa. Also a device, guiding the mass and preventing the mass
from irregular sinking, was necessary. That device makes sure that the mass can only move
vertical. It has a mass of 1.723 kg, and so the total pressure in the monster increased to 5.30
kPa. To make sure there was a good transmission of energy the plate with the cylinder was
fixed to the vibrating table with clamps. Figure 5-4 gives a survey of the test set-up. This test
set-up correlate with a K value of 9 for the compaction [Bosmans, T., Van Der Putten, J.,
2014].

Design of ecological concrete by particle packing optimization: Literature
Chapter 5: Executed tests on aggregates 45
Figure 5-4: Compaction test
The test procedure starts with taking a monster of 1.5 kg and placing it in the cylinder, which
is taped to the base plate. When the masses are placed on it and the clamps are installed,
the vibrating table is switched on, and during two minutes the mixture is vibrated at a
frequency of 50 Hz, so that a good compaction of the mixture is realized. This is not the
procedure proposed by De Larrard. He proposed to use three different frequencies: first 2
minutes vibrating with an amplitude of 0.4mm, than during 40 seconds an amplitude of 0.2
mm and in finally 1 minute of vibrating with an amplitude of 0.08 mm. However, tests of ing.
P. Minne shows that it has no influence on the measurements to vibrate a mixture longer
than 2 minutes, and that is the reason why this was also the compaction time in this thesis.
The fact only 1 frequency was used is related to limitations of the vibrating table. Figure 5-5
shows how a compacted mixture looks.
Figure 5-5: A compacted limestone aggregate

Design of ecological concrete by particle packing optimization: Literature
Chapter 5: Executed tests on aggregates 46
After vibrating the monster, the volume taken by the monster of this aggregate has to be
determined. The diameter is known. To determine the height, the distance between the top of
the cylinder and the top of the monster was measured at 4 different locations with a caliper.
This is necessary, because the top level of the compacted monster was not always perfectly
flat. The total height of the cylinder minus the average of the 4 measurements is the height of
the monster. Based on the height and the diameter a bulk density could be calculated. The
packing density is the ratio between the bulk density from the compaction test, and the
density of the particles, tested with the pycnometers as described in paragraph ‘5.2: Density’.
This is shown in equation (5.3).
( )
For each aggregate, one monster was taken but it was tested five times. So after the
necessary measurements, the monster was taken out the cylinder and mixed. Then the
procedure started again. The absolute deviation of the average was checked. Measurements
of which the packing deviates more than two hundreds were neglected. The final result is an
input parameter for the CPM
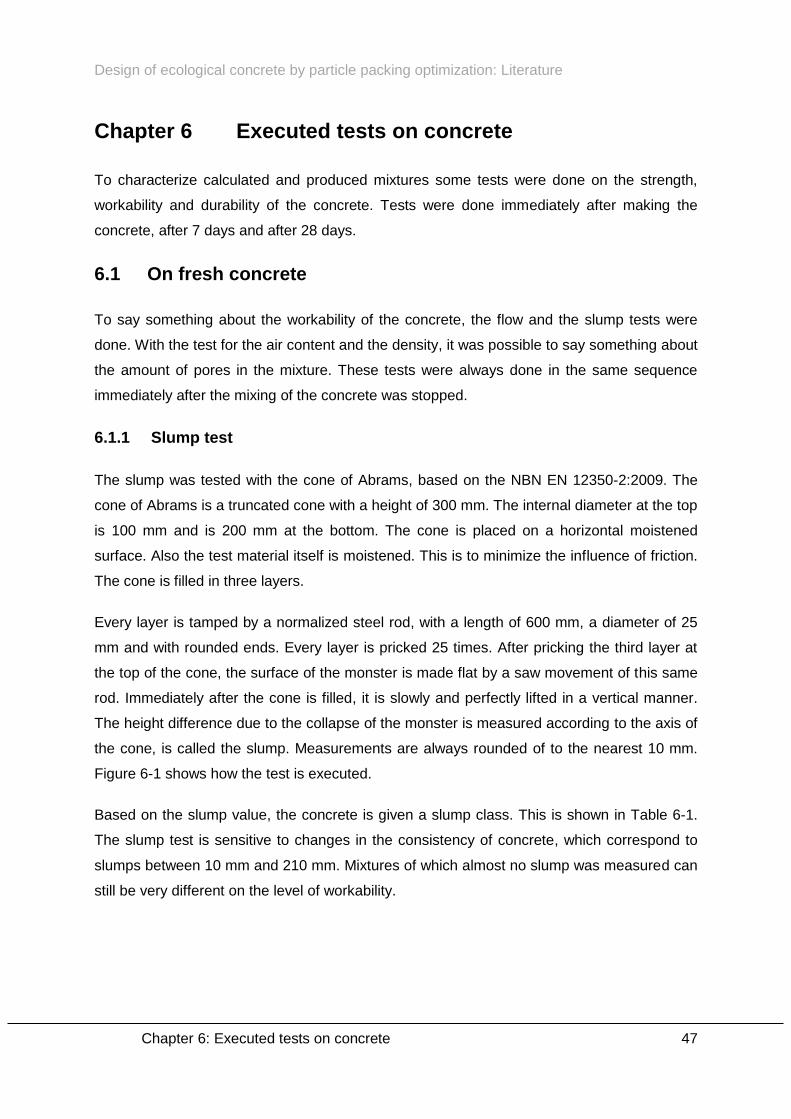
Design of ecological concrete by particle packing optimization: Literature
Chapter 6: Executed tests on concrete 47
Chapter 6 Executed tests on concrete
To characterize calculated and produced mixtures some tests were done on the strength,
workability and durability of the concrete. Tests were done immediately after making the
concrete, after 7 days and after 28 days.
6.1 On fresh concrete
To say something about the workability of the concrete, the flow and the slump tests were
done. With the test for the air content and the density, it was possible to say something about
the amount of pores in the mixture. These tests were always done in the same sequence
immediately after the mixing of the concrete was stopped.
6.1.1 Slump test
The slump was tested with the cone of Abrams, based on the NBN EN 12350-2:2009. The
cone of Abrams is a truncated cone with a height of 300 mm. The internal diameter at the top
is 100 mm and is 200 mm at the bottom. The cone is placed on a horizontal moistened
surface. Also the test material itself is moistened. This is to minimize the influence of friction.
The cone is filled in three layers.
Every layer is tamped by a normalized steel rod, with a length of 600 mm, a diameter of 25
mm and with rounded ends. Every layer is pricked 25 times. After pricking the third layer at
the top of the cone, the surface of the monster is made flat by a saw movement of this same
rod. Immediately after the cone is filled, it is slowly and perfectly lifted in a vertical manner.
The height difference due to the collapse of the monster is measured according to the axis of
the cone, is called the slump. Measurements are always rounded of to the nearest 10 mm.
Figure 6-1 shows how the test is executed.
Based on the slump value, the concrete is given a slump class. This is shown in Table 6-1.
The slump test is sensitive to changes in the consistency of concrete, which correspond to
slumps between 10 mm and 210 mm. Mixtures of which almost no slump was measured can
still be very different on the level of workability.
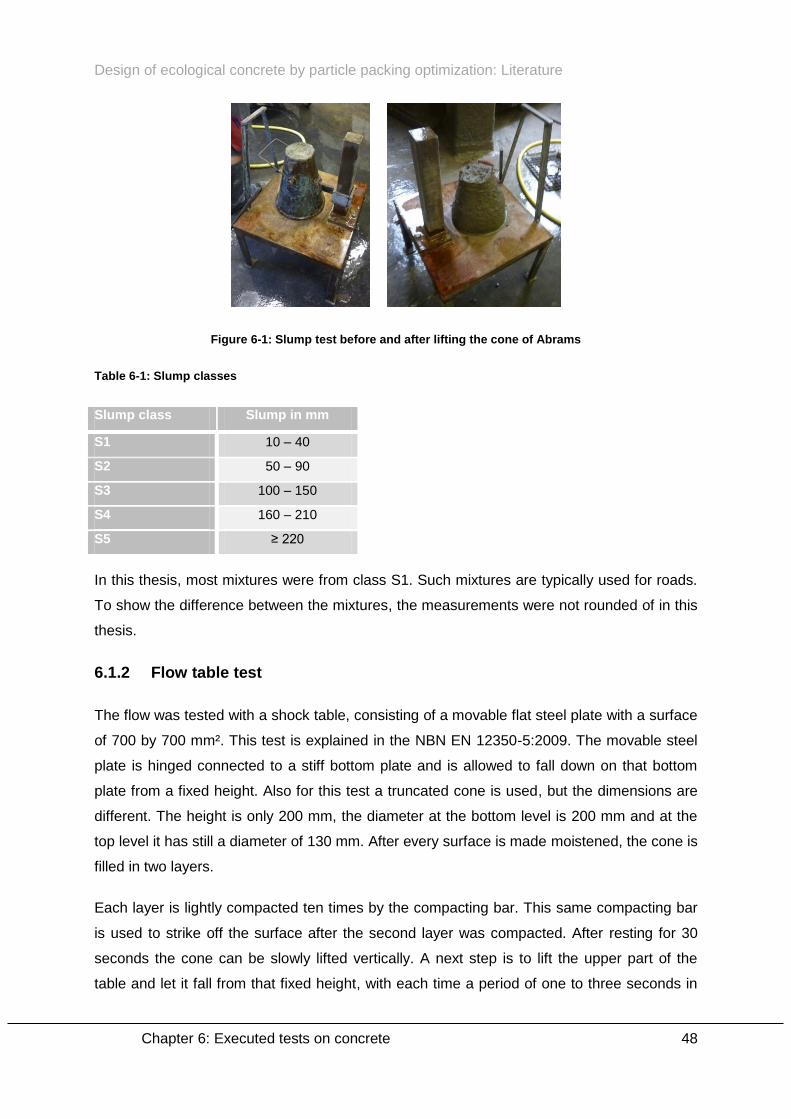
Design of ecological concrete by particle packing optimization: Literature
Chapter 6: Executed tests on concrete 48
Figure 6-1: Slump test before and after lifting the cone of Abrams
Table 6-1: Slump classes
Slump class Slump in mm
S1 10 – 40
S2 50 – 90
S3 100 – 150
S4 160 – 210
S5 ≥ 220
In this thesis, most mixtures were from class S1. Such mixtures are typically used for roads.
To show the difference between the mixtures, the measurements were not rounded of in this
thesis.
6.1.2 Flow table test
The flow was tested with a shock table, consisting of a movable flat steel plate with a surface
of 700 by 700 mm². This test is explained in the NBN EN 12350-5:2009. The movable steel
plate is hinged connected to a stiff bottom plate and is allowed to fall down on that bottom
plate from a fixed height. Also for this test a truncated cone is used, but the dimensions are
different. The height is only 200 mm, the diameter at the bottom level is 200 mm and at the
top level it has still a diameter of 130 mm. After every surface is made moistened, the cone is
filled in two layers.
Each layer is lightly compacted ten times by the compacting bar. This same compacting bar
is used to strike off the surface after the second layer was compacted. After resting for 30
seconds the cone can be slowly lifted vertically. A next step is to lift the upper part of the
table and let it fall from that fixed height, with each time a period of one to three seconds in
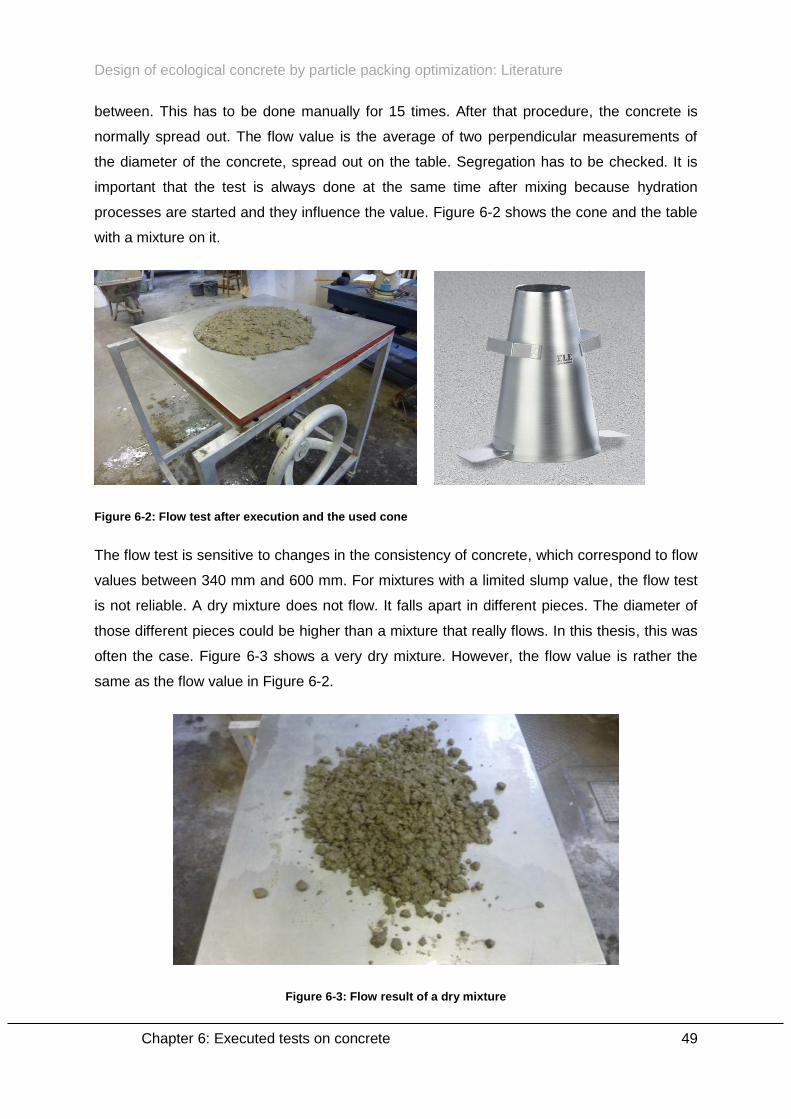
Design of ecological concrete by particle packing optimization: Literature
Chapter 6: Executed tests on concrete 49
between. This has to be done manually for 15 times. After that procedure, the concrete is
normally spread out. The flow value is the average of two perpendicular measurements of
the diameter of the concrete, spread out on the table. Segregation has to be checked. It is
important that the test is always done at the same time after mixing because hydration
processes are started and they influence the value. Figure 6-2 shows the cone and the table
with a mixture on it.
Figure 6-2: Flow test after execution and the used cone
The flow test is sensitive to changes in the consistency of concrete, which correspond to flow
values between 340 mm and 600 mm. For mixtures with a limited slump value, the flow test
is not reliable. A dry mixture does not flow. It falls apart in different pieces. The diameter of
those different pieces could be higher than a mixture that really flows. In this thesis, this was
often the case. Figure 6-3 shows a very dry mixture. However, the flow value is rather the
same as the flow value in Figure 6-2.
Figure 6-3: Flow result of a dry mixture
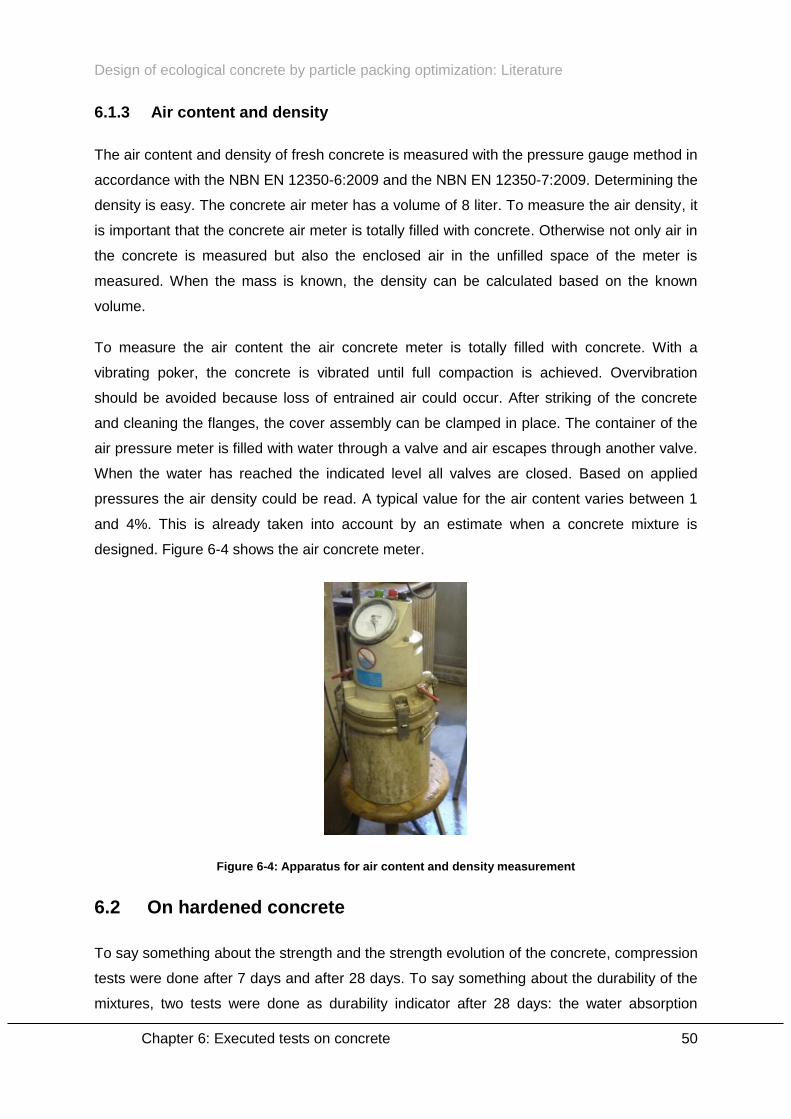
Design of ecological concrete by particle packing optimization: Literature
Chapter 6: Executed tests on concrete 50
6.1.3 Air content and density
The air content and density of fresh concrete is measured with the pressure gauge method in
accordance with the NBN EN 12350-6:2009 and the NBN EN 12350-7:2009. Determining the
density is easy. The concrete air meter has a volume of 8 liter. To measure the air density, it
is important that the concrete air meter is totally filled with concrete. Otherwise not only air in
the concrete is measured but also the enclosed air in the unfilled space of the meter is
measured. When the mass is known, the density can be calculated based on the known
volume.
To measure the air content the air concrete meter is totally filled with concrete. With a
vibrating poker, the concrete is vibrated until full compaction is achieved. Overvibration
should be avoided because loss of entrained air could occur. After striking of the concrete
and cleaning the flanges, the cover assembly can be clamped in place. The container of the
air pressure meter is filled with water through a valve and air escapes through another valve.
When the water has reached the indicated level all valves are closed. Based on applied
pressures the air density could be read. A typical value for the air content varies between 1
and 4%. This is already taken into account by an estimate when a concrete mixture is
designed. Figure 6-4 shows the air concrete meter.
Figure 6-4: Apparatus for air content and density measurement
6.2 On hardened concrete
To say something about the strength and the strength evolution of the concrete, compression
tests were done after 7 days and after 28 days. To say something about the durability of the
mixtures, two tests were done as durability indicator after 28 days: the water absorption
Design of ecological concrete by particle packing optimization: Literature
Chapter 6: Executed tests on concrete 51
under vacuum and the resistivity of cubes. These are only indicators of durability because
they don’t say something about a specific durability topic. They only say something about the
internal structure of the concrete and this is important for the durability of concrete.
Until the moment the cubes were tested they were stored in a room with a constant
temperature of 20°C and a relative humidity of 90%, as prescribed in the norm. With the test
for the air content and the density, it was possible to say something about the amount of
pores in the mixture. These tests were always done in the same sequence, immediately after
the mixing of the concrete was stopped.
6.2.1 Compression test
After 7 and after 28 days, each time 3 cubes of 150*150*150mm³ were compressed in the
lab with the compression testing machine, according to the NBN EN 12390-3:2009. Before
testing the depth and the width were measured 6 times. Based on the average depth and
width of the cubes, the area of the compression surface could be calculated. Together with
the measured force at the moment the cube crushed it makes it possible to calculate the
compression stress at which the concrete fails. Also the height was measured 4 times.
Based on the mass of the cube it was also possible to calculate the density.
6.2.2 Water absorption under vacuum
The water absorption was tested at an age of 28 days on two cubes. The average of both
measured values was taken as final result. The used test is a destructive test method.
The ability of absorbing water is interesting because it says something about the amount of
pores and how fast and how much water can be absorbed when the concrete is in a wet and
possible aggressive environment. If the concrete can take a lot of water, the risk that harmful
substances are absorbed is higher. Previous research shows two possibilities to test the
water absorption under vacuum [Craenen, E., 2013].
A first possibility is following the procedure of the NBN B24-213:1976. In this test the cubes
are first dried at a temperature of 105+-5°C. If the mass is constant (change in mass over 24
hours lower than 0.1%) they were placed in a vacuum tank. After 2h30’, water comes slowly
in the tank at a speed of 5 cm/h and is absorbed by the cubes. The cubes are immersend in
water for 24h. Based on masses when the cubes were oven dry, in suspension and surface
dry, the water porosity is calculated. Tests show that due to the high temperature the
structure of the concrete changes. For UHPC this heat treatment has a beneficial effect. For
Design of ecological concrete by particle packing optimization: Literature
Chapter 6: Executed tests on concrete 52
normal concrete this was adverse: due to the applied heat, cracks were caused and that
influences the result of the measurement [Craenen, E., 2013].
Because tests according to previous procedure give unreliable results, another procedure
was used. The sequence of the steps was reversed. This is comparable with the desription in
the NBN B15-215:1989, except for some details: in the norm the test is not done under
vacuum pressure. So in a first step, the cubes are placed in a compression tank where
vacuum pressure is applied. After 2h30’ water comes in the tank with a speed of 5 cm/h, still
under vacuum pressure. If the tank is filled, normal pressure is allowed. The cubes stay for
24 hours in the tank. When they are taken out of the tank their mass is determined surface
dried. In a last step they are oven dried until constant mass over a period of 24 hours at a
temperature of 105°C. This could take 10 days. The water absorption W is expressed as a
percentage, according to equation (6.1).
( )
The water absorption under vacuum says something about the amount of pores in the
concrete. A general assumption is that the higher the value for the water absorption, the
easier it is for fluids to enter the concrete structure. This will result to a less durable concrete
[Zhan, S.P., Zong L., 2014]. However there is a doubt about that. Research concluded that
there was no direct link between the water absorption under immersion and concrete
durability issues like carbonatation and chloride migration. The water absorption test tells
only something about the volume of the pores, nothing about the concrete durability, which is
more important [Audenaert, K., De Schutter, G., 2004].
6.2.3 Resistivity
To measure resistivity of concrete normally the surface resistivity is measured but because
that is done on a cylinder and only cubes were produced, the bulk resistivity was measured.
Literature proves that they are linked to each other [Pratanu, G., Quang, T., 2014]. It is a
non-destructive test method. For this test a Resipod resistivity meter from PCTE was used. It
is a fully integrated 4-point Wenner probe, that could be transformed to measuring bulk
resistivity by using 2 metal contacts and sponges. Figure 6-5 shows how it looks in both
ways [Repisod Family, 2013].
To measure surface resistivity on cylinders, the outer probes sends a current through the
concrete and the inner probes measure the potential difference. The current is carried by
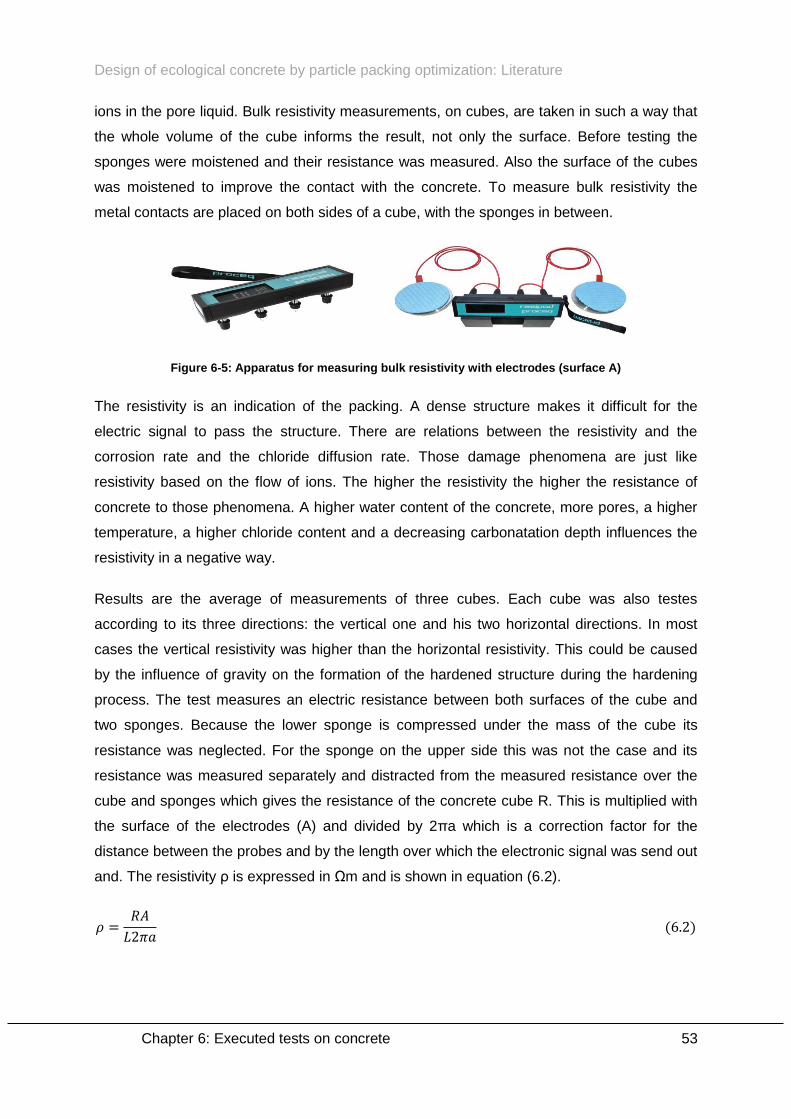
Design of ecological concrete by particle packing optimization: Literature
Chapter 6: Executed tests on concrete 53
ions in the pore liquid. Bulk resistivity measurements, on cubes, are taken in such a way that
the whole volume of the cube informs the result, not only the surface. Before testing the
sponges were moistened and their resistance was measured. Also the surface of the cubes
was moistened to improve the contact with the concrete. To measure bulk resistivity the
metal contacts are placed on both sides of a cube, with the sponges in between.
Figure 6-5: Apparatus for measuring bulk resistivity with electrodes (surface A)
The resistivity is an indication of the packing. A dense structure makes it difficult for the
electric signal to pass the structure. There are relations between the resistivity and the
corrosion rate and the chloride diffusion rate. Those damage phenomena are just like
resistivity based on the flow of ions. The higher the resistivity the higher the resistance of
concrete to those phenomena. A higher water content of the concrete, more pores, a higher
temperature, a higher chloride content and a decreasing carbonatation depth influences the
resistivity in a negative way.
Results are the average of measurements of three cubes. Each cube was also testes
according to its three directions: the vertical one and his two horizontal directions. In most
cases the vertical resistivity was higher than the horizontal resistivity. This could be caused
by the influence of gravity on the formation of the hardened structure during the hardening
process. The test measures an electric resistance between both surfaces of the cube and
two sponges. Because the lower sponge is compressed under the mass of the cube its
resistance was neglected. For the sponge on the upper side this was not the case and its
resistance was measured separately and distracted from the measured resistance over the
cube and sponges which gives the resistance of the concrete cube R. This is multiplied with
the surface of the electrodes (A) and divided by 2πa which is a correction factor for the
distance between the probes and by the length over which the electronic signal was send out
and. The resistivity ρ is expressed in Ωm and is shown in equation (6.2).
( )
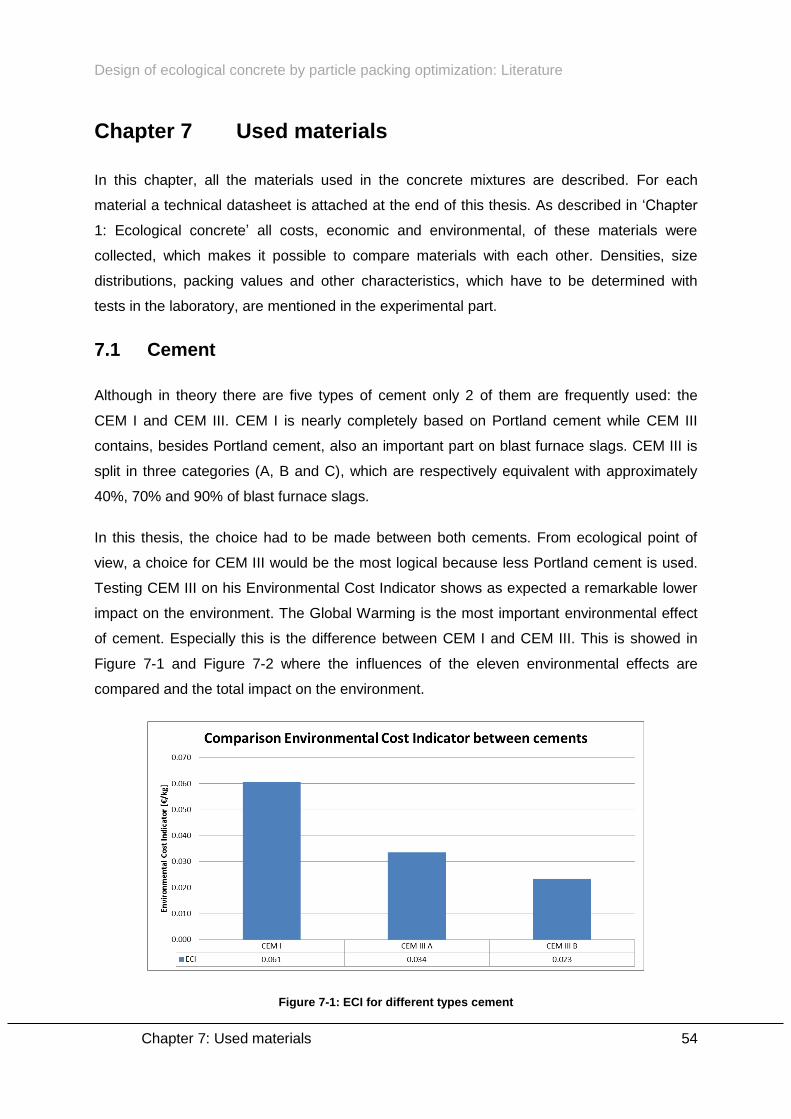
Design of ecological concrete by particle packing optimization: Literature
Chapter 7: Used materials 54
Chapter 7 Used materials
In this chapter, all the materials used in the concrete mixtures are described. For each
material a technical datasheet is attached at the end of this thesis. As described in ‘Chapter
1: Ecological concrete’ all costs, economic and environmental, of these materials were
collected, which makes it possible to compare materials with each other. Densities, size
distributions, packing values and other characteristics, which have to be determined with
tests in the laboratory, are mentioned in the experimental part.
7.1 Cement
Although in theory there are five types of cement only 2 of them are frequently used: the
CEM I and CEM III. CEM I is nearly completely based on Portland cement while CEM III
contains, besides Portland cement, also an important part on blast furnace slags. CEM III is
split in three categories (A, B and C), which are respectively equivalent with approximately
40%, 70% and 90% of blast furnace slags.
In this thesis, the choice had to be made between both cements. From ecological point of
view, a choice for CEM III would be the most logical because less Portland cement is used.
Testing CEM III on his Environmental Cost Indicator shows as expected a remarkable lower
impact on the environment. The Global Warming is the most important environmental effect
of cement. Especially this is the difference between CEM I and CEM III. This is showed in
Figure 7-1 and Figure 7-2 where the influences of the eleven environmental effects are
compared and the total impact on the environment.
Figure 7-1: ECI for different types cement
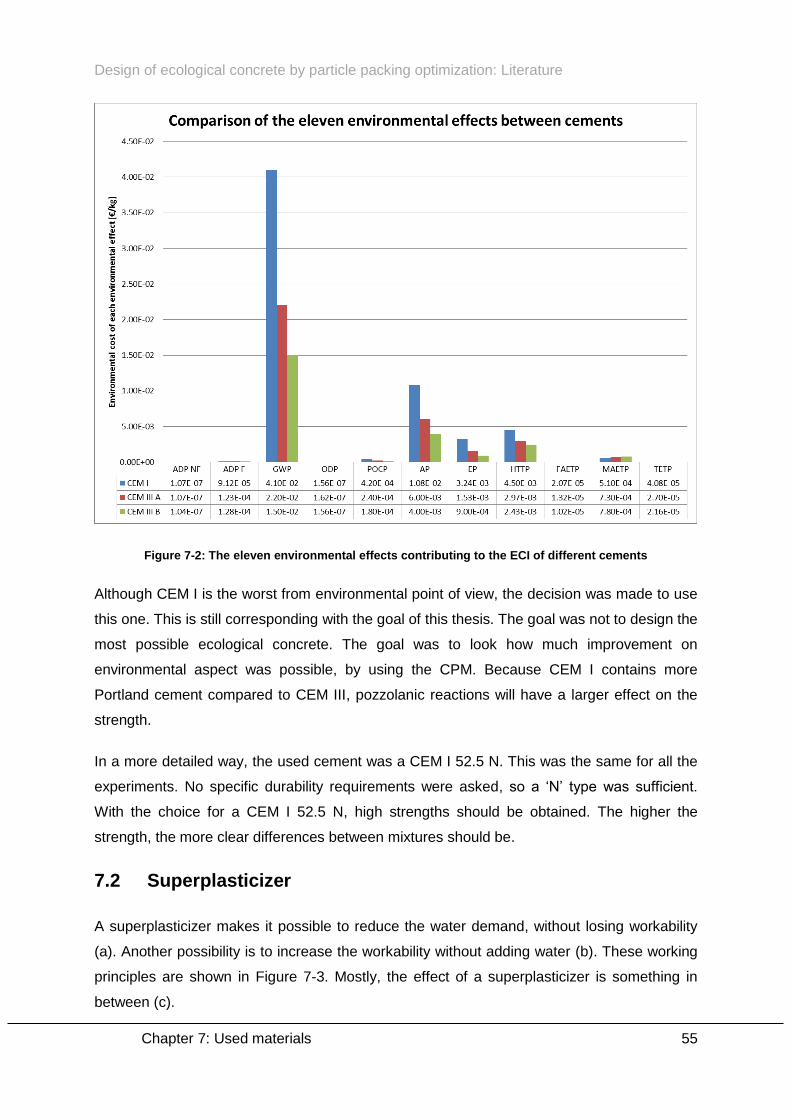
Design of ecological concrete by particle packing optimization: Literature
Chapter 7: Used materials 55
Figure 7-2: The eleven environmental effects contributing to the ECI of different cements
Although CEM I is the worst from environmental point of view, the decision was made to use
this one. This is still corresponding with the goal of this thesis. The goal was not to design the
most possible ecological concrete. The goal was to look how much improvement on
environmental aspect was possible, by using the CPM. Because CEM I contains more
Portland cement compared to CEM III, pozzolanic reactions will have a larger effect on the
strength.
In a more detailed way, the used cement was a CEM I 52.5 N. This was the same for all the
experiments. No specific durability requirements were asked, so a ‘N’ type was sufficient.
With the choice for a CEM I 52.5 N, high strengths should be obtained. The higher the
strength, the more clear differences between mixtures should be.
7.2 Superplasticizer
A superplasticizer makes it possible to reduce the water demand, without losing workability
(a). Another possibility is to increase the workability without adding water (b). These working
principles are shown in Figure 7-3. Mostly, the effect of a superplasticizer is something in
between (c).
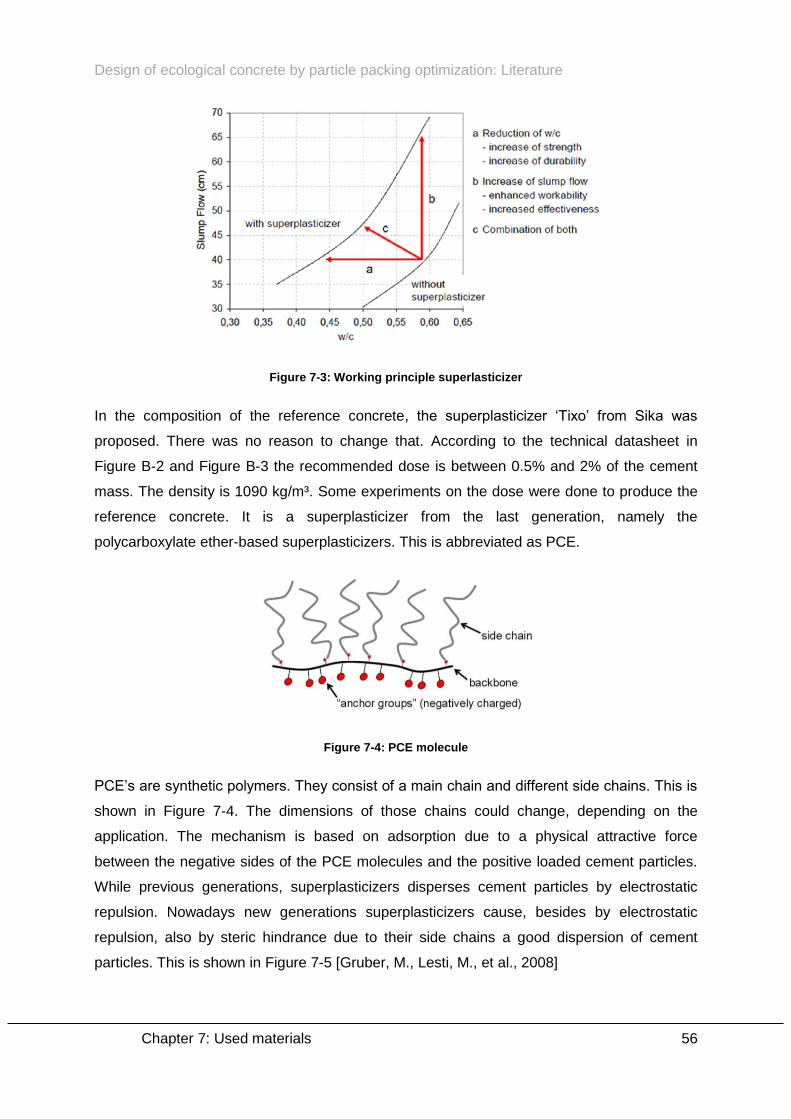
Design of ecological concrete by particle packing optimization: Literature
Chapter 7: Used materials 56
Figure 7-3: Working principle superlasticizer
In the composition of the reference concrete, the superplasticizer ‘Tixo’ from Sika was
proposed. There was no reason to change that. According to the technical datasheet in
Figure B-2 and Figure B-3 the recommended dose is between 0.5% and 2% of the cement
mass. The density is 1090 kg/m³. Some experiments on the dose were done to produce the
reference concrete. It is a superplasticizer from the last generation, namely the
polycarboxylate ether-based superplasticizers. This is abbreviated as PCE.
Figure 7-4: PCE molecule
PCE’s are synthetic polymers. They consist of a main chain and different side chains. This is
shown in Figure 7-4. The dimensions of those chains could change, depending on the
application. The mechanism is based on adsorption due to a physical attractive force
between the negative sides of the PCE molecules and the positive loaded cement particles.
While previous generations, superplasticizers disperses cement particles by electrostatic
repulsion. Nowadays new generations superplasticizers cause, besides by electrostatic
repulsion, also by steric hindrance due to their side chains a good dispersion of cement
particles. This is shown in Figure 7-5 [Gruber, M., Lesti, M., et al., 2008]
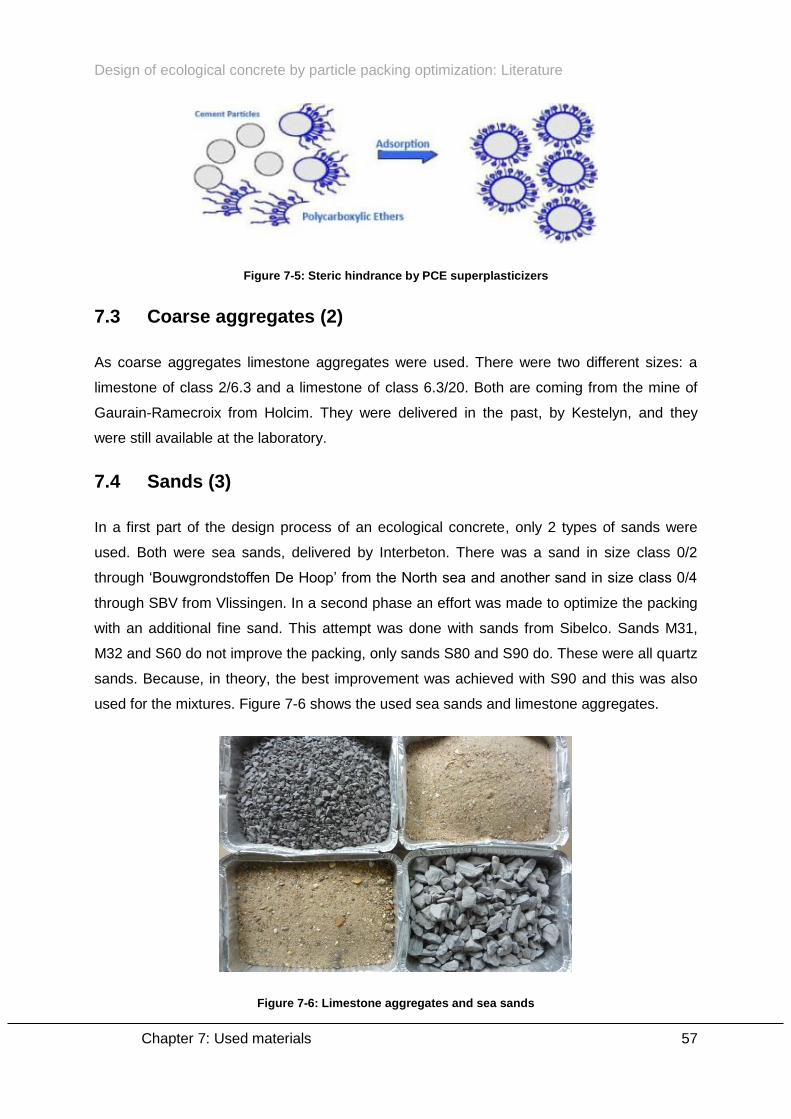
Design of ecological concrete by particle packing optimization: Literature
Chapter 7: Used materials 57
Figure 7-5: Steric hindrance by PCE superplasticizers
7.3 Coarse aggregates (2)
As coarse aggregates limestone aggregates were used. There were two different sizes: a
limestone of class 2/6.3 and a limestone of class 6.3/20. Both are coming from the mine of
Gaurain-Ramecroix from Holcim. They were delivered in the past, by Kestelyn, and they
were still available at the laboratory.
7.4 Sands (3)
In a first part of the design process of an ecological concrete, only 2 types of sands were
used. Both were sea sands, delivered by Interbeton. There was a sand in size class 0/2
through ‘Bouwgrondstoffen De Hoop’ from the North sea and another sand in size class 0/4
through SBV from Vlissingen. In a second phase an effort was made to optimize the packing
with an additional fine sand. This attempt was done with sands from Sibelco. Sands M31,
M32 and S60 do not improve the packing, only sands S80 and S90 do. These were all quartz
sands. Because, in theory, the best improvement was achieved with S90 and this was also
used for the mixtures. Figure 7-6 shows the used sea sands and limestone aggregates.
Figure 7-6: Limestone aggregates and sea sands
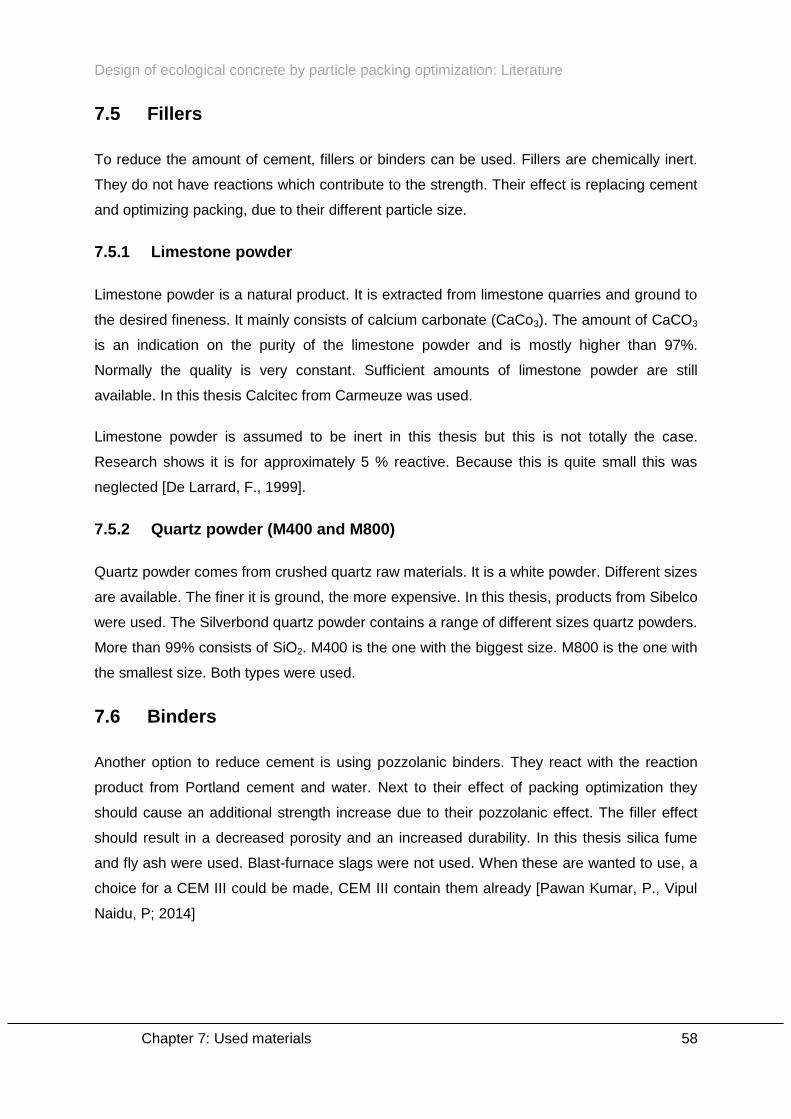
Design of ecological concrete by particle packing optimization: Literature
Chapter 7: Used materials 58
7.5 Fillers
To reduce the amount of cement, fillers or binders can be used. Fillers are chemically inert.
They do not have reactions which contribute to the strength. Their effect is replacing cement
and optimizing packing, due to their different particle size.
7.5.1 Limestone powder
Limestone powder is a natural product. It is extracted from limestone quarries and ground to
the desired fineness. It mainly consists of calcium carbonate (CaCo3). The amount of CaCO3
is an indication on the purity of the limestone powder and is mostly higher than 97%.
Normally the quality is very constant. Sufficient amounts of limestone powder are still
available. In this thesis Calcitec from Carmeuze was used.
Limestone powder is assumed to be inert in this thesis but this is not totally the case.
Research shows it is for approximately 5 % reactive. Because this is quite small this was
neglected [De Larrard, F., 1999].
7.5.2 Quartz powder (M400 and M800)
Quartz powder comes from crushed quartz raw materials. It is a white powder. Different sizes
are available. The finer it is ground, the more expensive. In this thesis, products from Sibelco
were used. The Silverbond quartz powder contains a range of different sizes quartz powders.
More than 99% consists of SiO2. M400 is the one with the biggest size. M800 is the one with
the smallest size. Both types were used.
7.6 Binders
Another option to reduce cement is using pozzolanic binders. They react with the reaction
product from Portland cement and water. Next to their effect of packing optimization they
should cause an additional strength increase due to their pozzolanic effect. The filler effect
should result in a decreased porosity and an increased durability. In this thesis silica fume
and fly ash were used. Blast-furnace slags were not used. When these are wanted to use, a
choice for a CEM III could be made, CEM III contain them already [Pawan Kumar, P., Vipul
Naidu, P; 2014]

Design of ecological concrete by particle packing optimization: Literature
Chapter 7: Used materials 59
7.6.1 Silica fume
Silica fume or microsilica is an ultrafine powder, collected as by-product of the silicon and
ferrosilicon alloy production. It consists of very small spherical particles. Different sizes are
available. In 1952 it was used for the first time in concrete based on Portland cement. Since
1970-1980 it became more common to use it, especially in Scandinavia [Chandra Sekhara
Reddy, T., Elumalai, J.K., 2014].
Because of its fineness and the high silica content (> 80 % SiO2), it is a very effective
pozzolanic material. Different types of silica fume are available. Their size, densification and
chemical composition can vary. A different chemical composition results in a different color.
A more white kind of Silica fume contains less carbon in comparison to a grey one.
According to De Larrard, carbon absorb superplasticizer. And so, concrete based on white
silica fume should have a higher workability than using grey silica fume. In general the
workability decreases, if silica fume is added. Due to the very small particle size surface
forces come more important and the risk of agglomeration increases.
For this thesis, the Silica fume Elkem Grade 920 was used. It has a grey look. Silica fume is
normally dosed as a percentage of the cement mass. Mostly it varies between 5 to 10 %.
7.6.2 Fly ash
Fly ash is one of the naturally-occurring products from the coal combustion process. It is very
similar to volcanic ash. Thousands years ago, Romans already used volcanic ash in their
concrete structures such as the Colosseum. Nowadays, during burning of coal in electric
generating plants, temperatures of combustion can reach 1500 °C. Non-combustible
minerals forms bottom ash and fly ash. Bottom ash does not rise, while fly ash rises with the
flue gases.
Fly ash can replace 20 to 30% of cement mass. It has a spherical shape, which has a
favorable influence on the workability. Using fly ash results in a cheaper concrete: fly ash is
far less expensive than Portland cement.
The fly ash used in this thesis comes from Govaerts Recycling NV in Alken. A Chemical
analysis was done by Geos. It shows that the most important components were SiO2 and
Al2O3. Normally there is also an important part Fe2O3 and CaO but in this fly ash, this was not
the case. It has a grey color.
Design of ecological concrete by particle packing optimization: Literature
Chapter 7: Used materials 60
7.7 Portaclay
Comparing the materials mentioned here on top of their availability on our planet, silica fume
and fly ash scores bad. Most of those available materials are already used in the production
of concrete. Limestone powder, quartz powder and clay are far more interesting in this
prospective. Their stock is practical inexhaustible.
Portaclay is a raw form of the clay mineral kaolinite and has a strange property: it is not really
a filler and not really a binder. On its own, it acts as a filler. When it is combined with
limestone powder it acts as a binder. The combination of both causes chemical activity. Its
particle size is between the one from cement and from silica fume.
A disadvantage of portaclay is the enormous water demand. Values for water absorption are
extremely high. In this thesis only a small amount of portaclay was used. Tests were done in
advance on mortars to estimate the effects on workability. At the University of Ghent, ir
Florent Fornest is doing research on how raw clays could be useful in concrete mixtures.
The CaCO3 from the limestone powder reacts with the alumina from the portaclay and forms
supplementary AFm phase and stabilizing ettringite. Literature said that it would be possible
to replace 45% of Portland cement by 30% portaclay and 15% limestone powder [Scrivener,
K, Rossen, J., et al., 2014] [Justice, J.M., 2005]. In this thesis that was not possible: the
mixture became too dry.
In this thesis Portaclay A90 was used. It is produced from a natural Sodium-bentonite, which
is a very plastic clay. Portaclay A90 is produced by grinding that clay to a constant grain size
and moisture content. The mean constituent is the clay-mineral montmorillonite. A chemical
analyses shows SiO2 and Al2O3 as the most important parts.
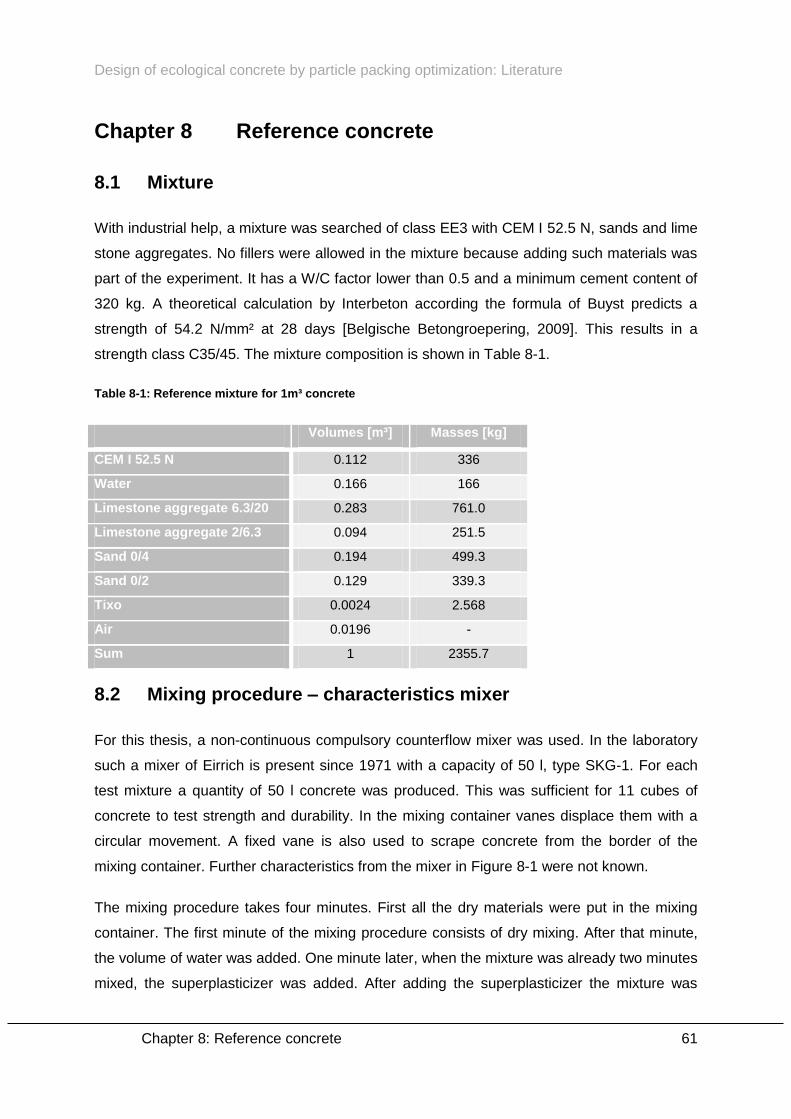
Design of ecological concrete by particle packing optimization: Literature
Chapter 8: Reference concrete 61
Chapter 8 Reference concrete
8.1 Mixture
With industrial help, a mixture was searched of class EE3 with CEM I 52.5 N, sands and lime
stone aggregates. No fillers were allowed in the mixture because adding such materials was
part of the experiment. It has a W/C factor lower than 0.5 and a minimum cement content of
320 kg. A theoretical calculation by Interbeton according the formula of Buyst predicts a
strength of 54.2 N/mm² at 28 days [Belgische Betongroepering, 2009]. This results in a
strength class C35/45. The mixture composition is shown in Table 8-1.
Table 8-1: Reference mixture for 1m³ concrete
Volumes [m³] Masses [kg]
CEM I 52.5 N 0.112 336
Water 0.166 166
Limestone aggregate 6.3/20 0.283 761.0
Limestone aggregate 2/6.3 0.094 251.5
Sand 0/4 0.194 499.3
Sand 0/2 0.129 339.3
Tixo 0.0024 2.568
Air 0.0196 -
Sum 1 2355.7
8.2 Mixing procedure – characteristics mixer
For this thesis, a non-continuous compulsory counterflow mixer was used. In the laboratory
such a mixer of Eirrich is present since 1971 with a capacity of 50 l, type SKG-1. For each
test mixture a quantity of 50 l concrete was produced. This was sufficient for 11 cubes of
concrete to test strength and durability. In the mixing container vanes displace them with a
circular movement. A fixed vane is also used to scrape concrete from the border of the
mixing container. Further characteristics from the mixer in Figure 8-1 were not known.
The mixing procedure takes four minutes. First all the dry materials were put in the mixing
container. The first minute of the mixing procedure consists of dry mixing. After that minute,
the volume of water was added. One minute later, when the mixture was already two minutes
mixed, the superplasticizer was added. After adding the superplasticizer the mixture was

Design of ecological concrete by particle packing optimization: Literature
Chapter 8: Reference concrete 62
mixed for another two minutes. After four minutes, the mixing procedure was stopped and
tests on fresh concrete were immediately executed. It was assumed that this mixing process
was equivalent to a value of 9 for the compaction index K. This was not checked. If this was
not the case, this could cause the optimal packing is not reached.
Figure 8-1: Concrete mixer in ‘Magnel Laboratory for Concrete Research’
8.3 Vacuum mixer
Table 8-2: Characteristics 75 l vacuum mixer
Maximum mass [kg] 120
Speed mixing pan [rpm] 8 – 41
Speed rotor [rpm] 175 – 520
Maximum pressure [mbar] 40
Diameter mixing pan [mm] 750
Height mixing pan [mm] 380
Diameter rotor [cm] 30.9
Filling volume (l) 50
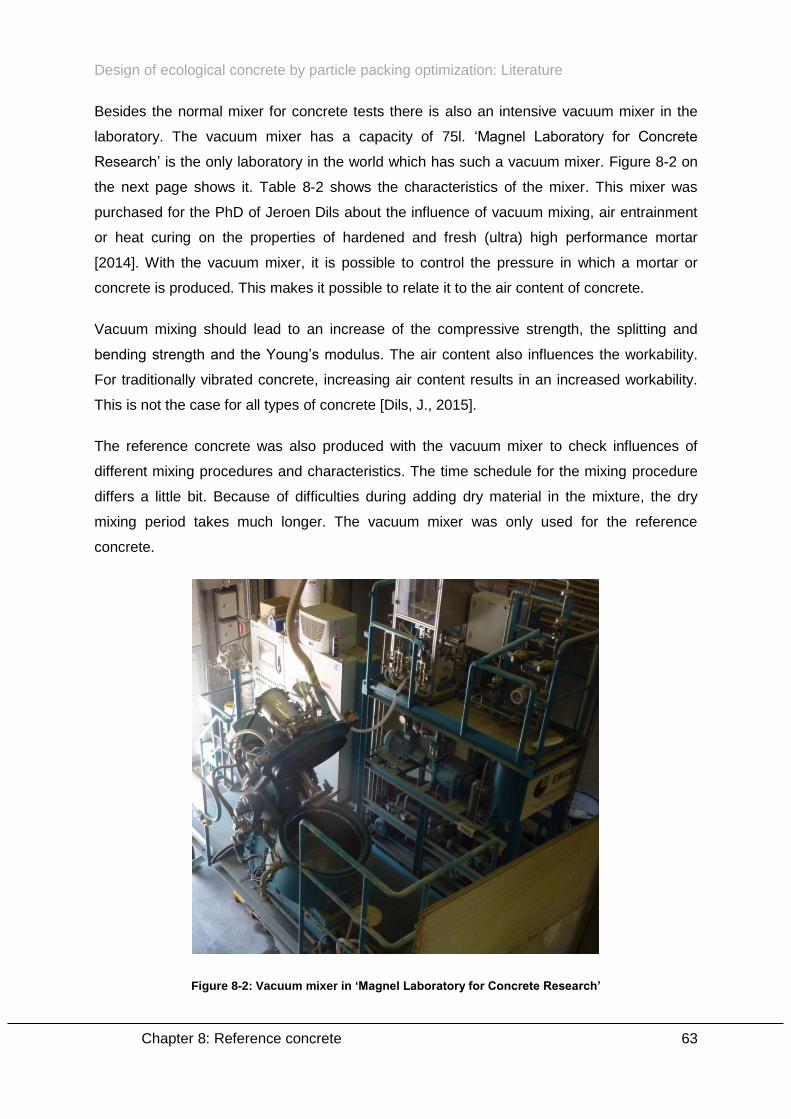
Design of ecological concrete by particle packing optimization: Literature
Chapter 8: Reference concrete 63
Besides the normal mixer for concrete tests there is also an intensive vacuum mixer in the
laboratory. The vacuum mixer has a capacity of 75l. ‘Magnel Laboratory for Concrete
Research’ is the only laboratory in the world which has such a vacuum mixer. Figure 8-2 on
the next page shows it. Table 8-2 shows the characteristics of the mixer. This mixer was
purchased for the PhD of Jeroen Dils about the influence of vacuum mixing, air entrainment
or heat curing on the properties of hardened and fresh (ultra) high performance mortar
[2014]. With the vacuum mixer, it is possible to control the pressure in which a mortar or
concrete is produced. This makes it possible to relate it to the air content of concrete.
Vacuum mixing should lead to an increase of the compressive strength, the splitting and
bending strength and the Young’s modulus. The air content also influences the workability.
For traditionally vibrated concrete, increasing air content results in an increased workability.
This is not the case for all types of concrete [Dils, J., 2015].
The reference concrete was also produced with the vacuum mixer to check influences of
different mixing procedures and characteristics. The time schedule for the mixing procedure
differs a little bit. Because of difficulties during adding dry material in the mixture, the dry
mixing period takes much longer. The vacuum mixer was only used for the reference
concrete.
Figure 8-2: Vacuum mixer in ‘Magnel Laboratory for Concrete Research’
Design of ecological concrete by particle packing optimization: Experimental part
64
Part II: Experimental part
In this second big, and important, part of this thesis all the tests and the intermediate
conclusions and interpretations are given. In Chapter 9 all the characteristics of the used
materials and the reference concrete is determined. Chapter 10, Chapter 11 and Chapter 12
explain the three different design steps in the design of an ecological concrete: optimization
of the packing, optimization of the workability and optimization of the strength [Fennis,
S.A.A.M., 2010]. In Chapter 13 two experiments not immediately linked to previous chapters
are described. Finally in Chapter 14 all mixtures are evaluated on economic and ecologic
aspects. Standard deviations for tests on concrete are given on the figures in the
attachments.

Design of ecological concrete by particle packing optimization: Experimental part
Chapter 9: Characterizations 65
Chapter 9 Characterizations
9.1 Coarse aggregates
As mentioned in paragraphs ‘7.3: Coarse aggregates (2)’ and ‘7.4: Sands (3)’ two limestone
aggregates (6.3/20 – 2/6.3) and three sands were used (0/4 – 0/2 – S90). To limit the length
of the labels the abbreviations 6.3/20, 2/6.3, 0/4, 0/2 and S90 will be used. Sand S90 was
only used for tests at the end of the experimental part, ‘Chapter 13: Experiments’. The test
results are already given in this chapter makes it possible to compare S90 to the other used
materials.
9.1.1 Particle size distribution
Both limestone aggregates and the sea sands were sieved according to the procedure in
paragraph ‘5.1.1: Sieve curves’. For fine quartz sand S90 data of a previous thesis was taken
[Breyne, S., De Vos, B., 2013]. The sieve curves are shown in Figure 9-1. Also the standard
deviations for the manual sieving (3) are represented. These are quite small.
Figure 9-1: Particle size distribution coarse materials
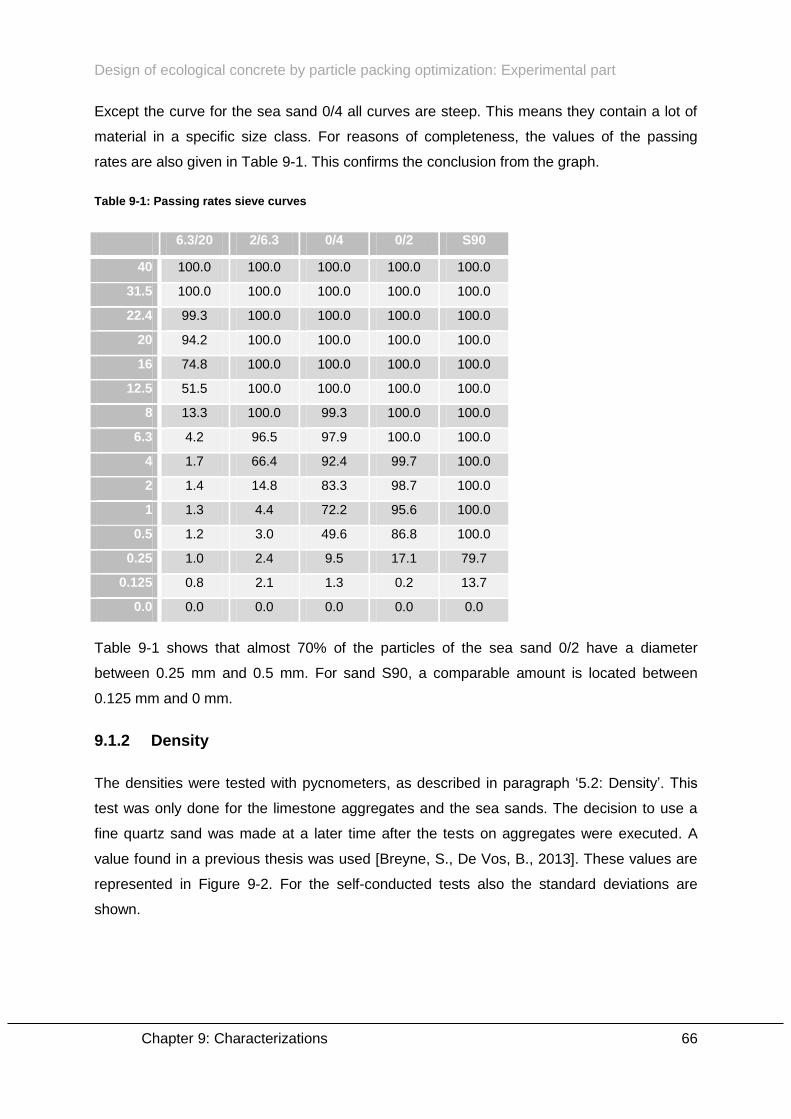
Design of ecological concrete by particle packing optimization: Experimental part
Chapter 9: Characterizations 66
Except the curve for the sea sand 0/4 all curves are steep. This means they contain a lot of
material in a specific size class. For reasons of completeness, the values of the passing
rates are also given in Table 9-1. This confirms the conclusion from the graph.
Table 9-1: Passing rates sieve curves
6.3/20 2/6.3 0/4 0/2 S90
40 100.0 100.0 100.0 100.0 100.0
31.5 100.0 100.0 100.0 100.0 100.0
22.4 99.3 100.0 100.0 100.0 100.0
20 94.2 100.0 100.0 100.0 100.0
16 74.8 100.0 100.0 100.0 100.0
12.5 51.5 100.0 100.0 100.0 100.0
8 13.3 100.0 99.3 100.0 100.0
6.3 4.2 96.5 97.9 100.0 100.0
4 1.7 66.4 92.4 99.7 100.0
2 1.4 14.8 83.3 98.7 100.0
1 1.3 4.4 72.2 95.6 100.0
0.5 1.2 3.0 49.6 86.8 100.0
0.25 1.0 2.4 9.5 17.1 79.7
0.125 0.8 2.1 1.3 0.2 13.7
0.0 0.0 0.0 0.0 0.0 0.0
Table 9-1 shows that almost 70% of the particles of the sea sand 0/2 have a diameter
between 0.25 mm and 0.5 mm. For sand S90, a comparable amount is located between
0.125 mm and 0 mm.
9.1.2 Density
The densities were tested with pycnometers, as described in paragraph ‘5.2: Density’. This
test was only done for the limestone aggregates and the sea sands. The decision to use a
fine quartz sand was made at a later time after the tests on aggregates were executed. A
value found in a previous thesis was used [Breyne, S., De Vos, B., 2013]. These values are
represented in Figure 9-2. For the self-conducted tests also the standard deviations are
shown.
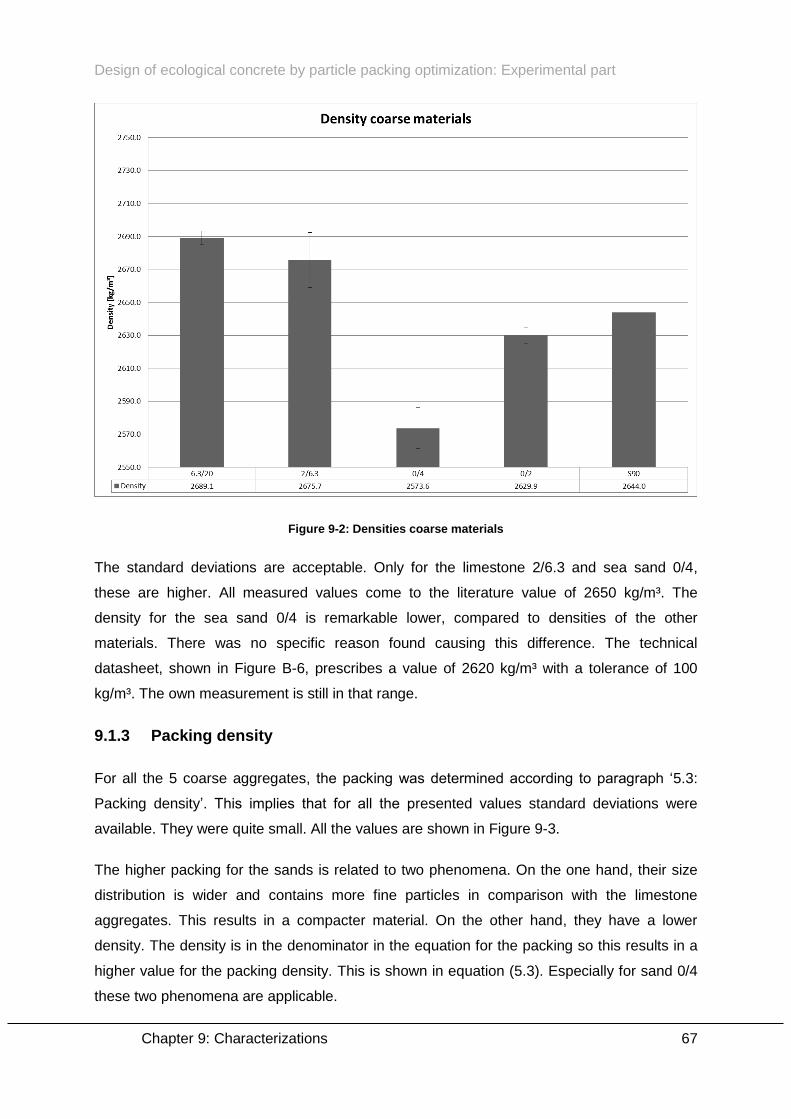
Design of ecological concrete by particle packing optimization: Experimental part
Chapter 9: Characterizations 67
Figure 9-2: Densities coarse materials
The standard deviations are acceptable. Only for the limestone 2/6.3 and sea sand 0/4,
these are higher. All measured values come to the literature value of 2650 kg/m³. The
density for the sea sand 0/4 is remarkable lower, compared to densities of the other
materials. There was no specific reason found causing this difference. The technical
datasheet, shown in Figure B-6, prescribes a value of 2620 kg/m³ with a tolerance of 100
kg/m³. The own measurement is still in that range.
9.1.3 Packing density
For all the 5 coarse aggregates, the packing was determined according to paragraph ‘5.3:
Packing density’. This implies that for all the presented values standard deviations were
available. They were quite small. All the values are shown in Figure 9-3.
The higher packing for the sands is related to two phenomena. On the one hand, their size
distribution is wider and contains more fine particles in comparison with the limestone
aggregates. This results in a compacter material. On the other hand, they have a lower
density. The density is in the denominator in the equation for the packing so this results in a
higher value for the packing density. This is shown in equation (5.3). Especially for sand 0/4
these two phenomena are applicable.
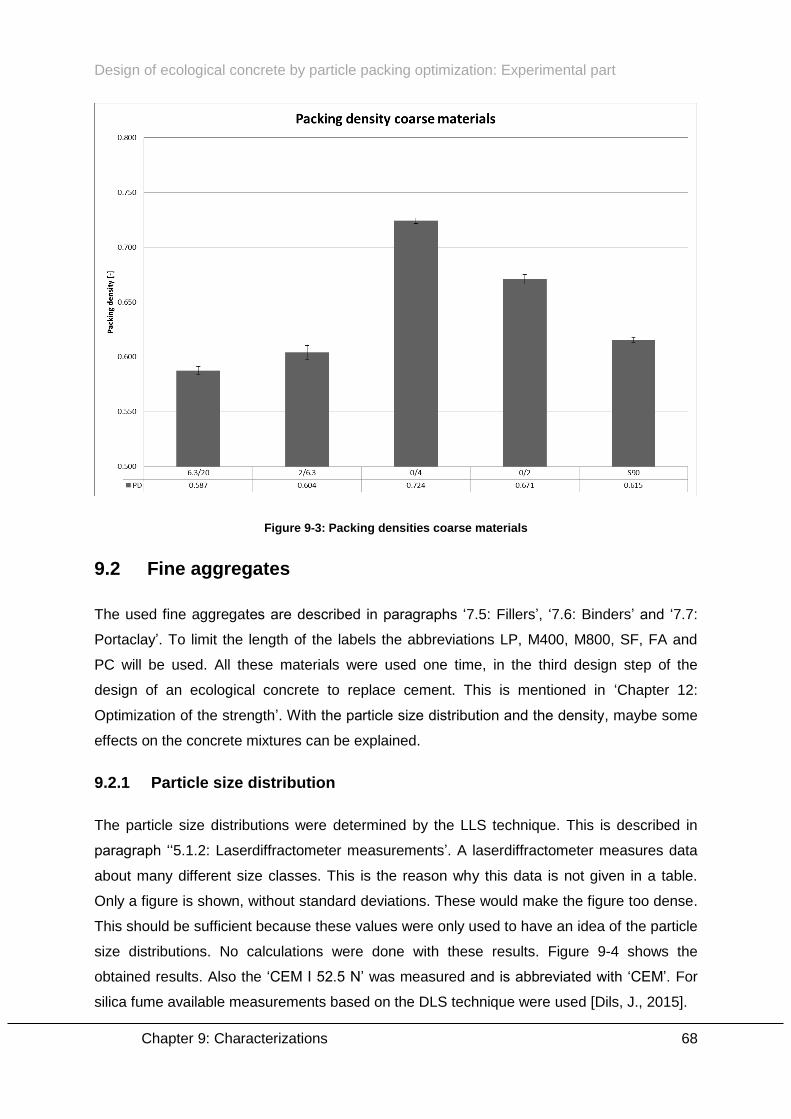
Design of ecological concrete by particle packing optimization: Experimental part
Chapter 9: Characterizations 68
Figure 9-3: Packing densities coarse materials
9.2 Fine aggregates
The used fine aggregates are described in paragraphs ‘7.5: Fillers’, ‘7.6: Binders’ and ‘7.7:
Portaclay’. To limit the length of the labels the abbreviations LP, M400, M800, SF, FA and
PC will be used. All these materials were used one time, in the third design step of the
design of an ecological concrete to replace cement. This is mentioned in ‘Chapter 12:
Optimization of the strength’. With the particle size distribution and the density, maybe some
effects on the concrete mixtures can be explained.
9.2.1 Particle size distribution
The particle size distributions were determined by the LLS technique. This is described in
paragraph ‘‘5.1.2: Laserdiffractometer measurements’. A laserdiffractometer measures data
about many different size classes. This is the reason why this data is not given in a table.
Only a figure is shown, without standard deviations. These would make the figure too dense.
This should be sufficient because these values were only used to have an idea of the particle
size distributions. No calculations were done with these results. Figure 9-4 shows the
obtained results. Also the ‘CEM I 52.5 N’ was measured and is abbreviated with ‘CEM’. For
silica fume available measurements based on the DLS technique were used [Dils, J., 2015].
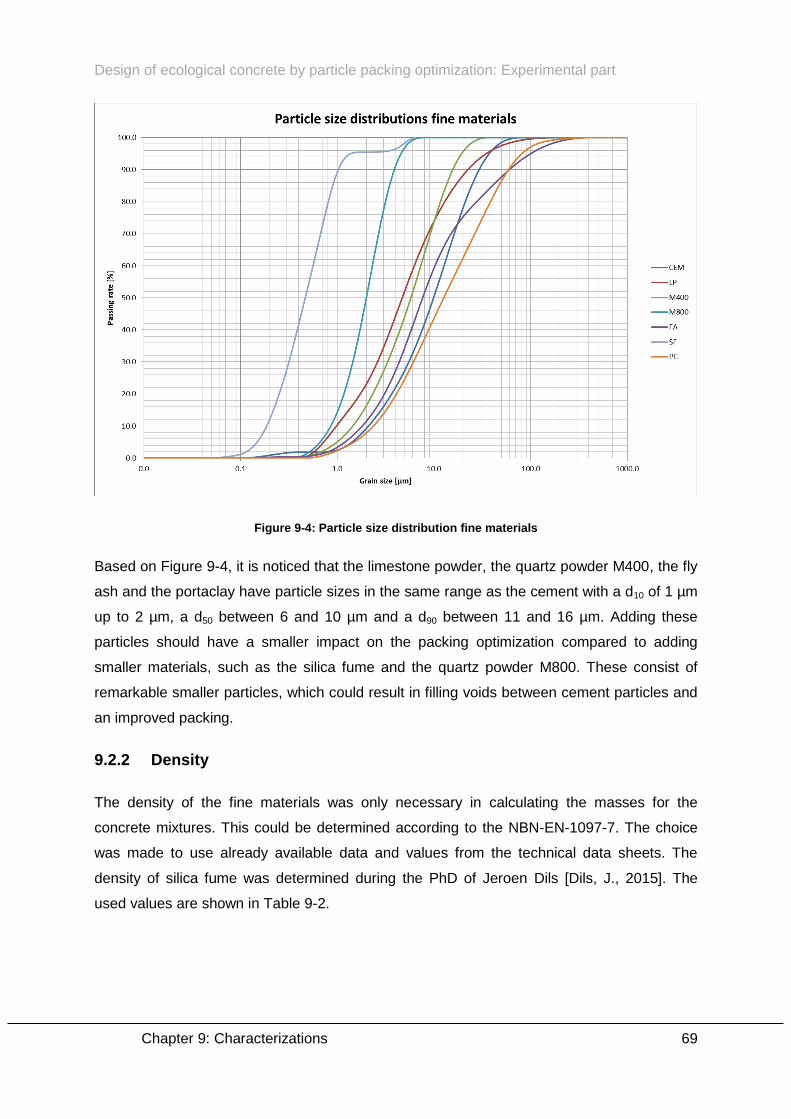
Design of ecological concrete by particle packing optimization: Experimental part
Chapter 9: Characterizations 69
Figure 9-4: Particle size distribution fine materials
Based on Figure 9-4, it is noticed that the limestone powder, the quartz powder M400, the fly
ash and the portaclay have particle sizes in the same range as the cement with a d10 of 1 µm
up to 2 µm, a d50 between 6 and 10 µm and a d90 between 11 and 16 µm. Adding these
particles should have a smaller impact on the packing optimization compared to adding
smaller materials, such as the silica fume and the quartz powder M800. These consist of
remarkable smaller particles, which could result in filling voids between cement particles and
an improved packing.
9.2.2 Density
The density of the fine materials was only necessary in calculating the masses for the
concrete mixtures. This could be determined according to the NBN-EN-1097-7. The choice
was made to use already available data and values from the technical data sheets. The
density of silica fume was determined during the PhD of Jeroen Dils [Dils, J., 2015]. The
used values are shown in Table 9-2.
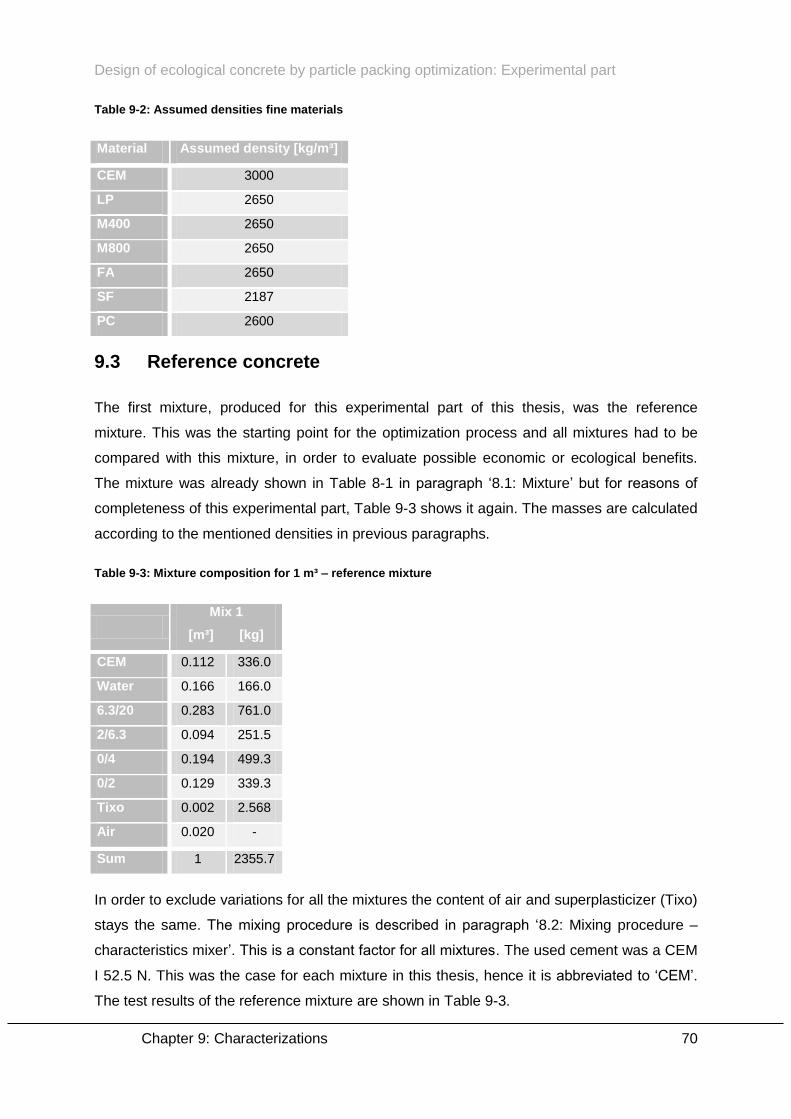
Design of ecological concrete by particle packing optimization: Experimental part
Chapter 9: Characterizations 70
Table 9-2: Assumed densities fine materials
Material Assumed density [kg/m³]
CEM 3000
LP 2650
M400 2650
M800 2650
FA 2650
SF 2187
PC 2600
9.3 Reference concrete
The first mixture, produced for this experimental part of this thesis, was the reference
mixture. This was the starting point for the optimization process and all mixtures had to be
compared with this mixture, in order to evaluate possible economic or ecological benefits.
The mixture was already shown in Table 8-1 in paragraph ‘8.1: Mixture’ but for reasons of
completeness of this experimental part, Table 9-3 shows it again. The masses are calculated
according to the mentioned densities in previous paragraphs.
Table 9-3: Mixture composition for 1 m³ – reference mixture
Mix 1
[m³] [kg]
CEM 0.112 336.0
Water 0.166 166.0
6.3/20 0.283 761.0
2/6.3 0.094 251.5
0/4 0.194 499.3
0/2 0.129 339.3
Tixo 0.002 2.568
Air 0.020 -
Sum 1 2355.7
In order to exclude variations for all the mixtures the content of air and superplasticizer (Tixo)
stays the same. The mixing procedure is described in paragraph ‘8.2: Mixing procedure –
characteristics mixer’. This is a constant factor for all mixtures. The used cement was a CEM
I 52.5 N. This was the case for each mixture in this thesis, hence it is abbreviated to ‘CEM’.
The test results of the reference mixture are shown in Table 9-3.
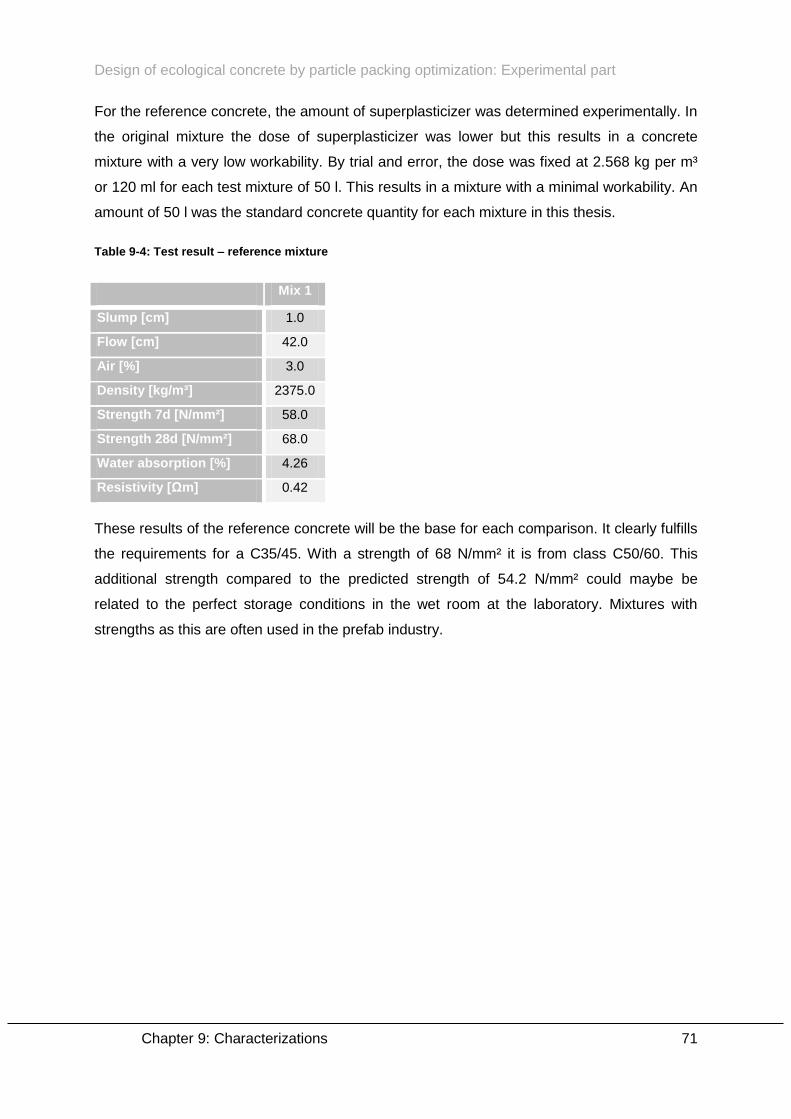
Design of ecological concrete by particle packing optimization: Experimental part
Chapter 9: Characterizations 71
For the reference concrete, the amount of superplasticizer was determined experimentally. In
the original mixture the dose of superplasticizer was lower but this results in a concrete
mixture with a very low workability. By trial and error, the dose was fixed at 2.568 kg per m³
or 120 ml for each test mixture of 50 l. This results in a mixture with a minimal workability. An
amount of 50 l was the standard concrete quantity for each mixture in this thesis.
Table 9-4: Test result – reference mixture
Mix 1
Slump [cm] 1.0
Flow [cm] 42.0
Air [%] 3.0
Density [kg/m³] 2375.0
Strength 7d [N/mm²] 58.0
Strength 28d [N/mm²] 68.0
Water absorption [%] 4.26
Resistivity [Ωm] 0.42
These results of the reference concrete will be the base for each comparison. It clearly fulfills
the requirements for a C35/45. With a strength of 68 N/mm² it is from class C50/60. This
additional strength compared to the predicted strength of 54.2 N/mm² could maybe be
related to the perfect storage conditions in the wet room at the laboratory. Mixtures with
strengths as this are often used in the prefab industry.
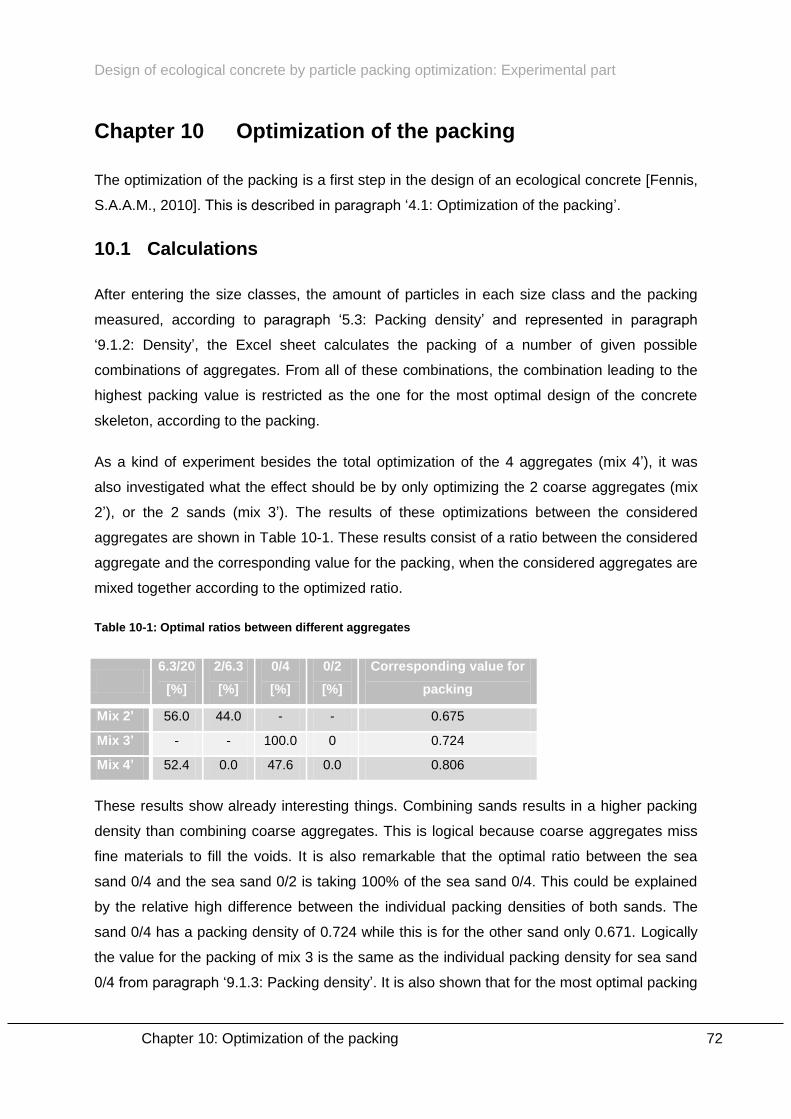
Design of ecological concrete by particle packing optimization: Experimental part
Chapter 10: Optimization of the packing 72
Chapter 10 Optimization of the packing
The optimization of the packing is a first step in the design of an ecological concrete [Fennis,
S.A.A.M., 2010]. This is described in paragraph ‘4.1: Optimization of the packing’.
10.1 Calculations
After entering the size classes, the amount of particles in each size class and the packing
measured, according to paragraph ‘5.3: Packing density’ and represented in paragraph
‘9.1.2: Density’, the Excel sheet calculates the packing of a number of given possible
combinations of aggregates. From all of these combinations, the combination leading to the
highest packing value is restricted as the one for the most optimal design of the concrete
skeleton, according to the packing.
As a kind of experiment besides the total optimization of the 4 aggregates (mix 4’), it was
also investigated what the effect should be by only optimizing the 2 coarse aggregates (mix
2’), or the 2 sands (mix 3’). The results of these optimizations between the considered
aggregates are shown in Table 10-1. These results consist of a ratio between the considered
aggregate and the corresponding value for the packing, when the considered aggregates are
mixed together according to the optimized ratio.
Table 10-1: Optimal ratios between different aggregates
6.3/20
[%]
2/6.3
[%]
0/4
[%]
0/2
[%]
Corresponding value for
packing
Mix 2’ 56.0 44.0 - - 0.675
Mix 3’ - - 100.0 0 0.724
Mix 4’ 52.4 0.0 47.6 0.0 0.806
These results show already interesting things. Combining sands results in a higher packing
density than combining coarse aggregates. This is logical because coarse aggregates miss
fine materials to fill the voids. It is also remarkable that the optimal ratio between the sea
sand 0/4 and the sea sand 0/2 is taking 100% of the sea sand 0/4. This could be explained
by the relative high difference between the individual packing densities of both sands. The
sand 0/4 has a packing density of 0.724 while this is for the other sand only 0.671. Logically
the value for the packing of mix 3 is the same as the individual packing density for sea sand
0/4 from paragraph ‘9.1.3: Packing density’. It is also shown that for the most optimal packing
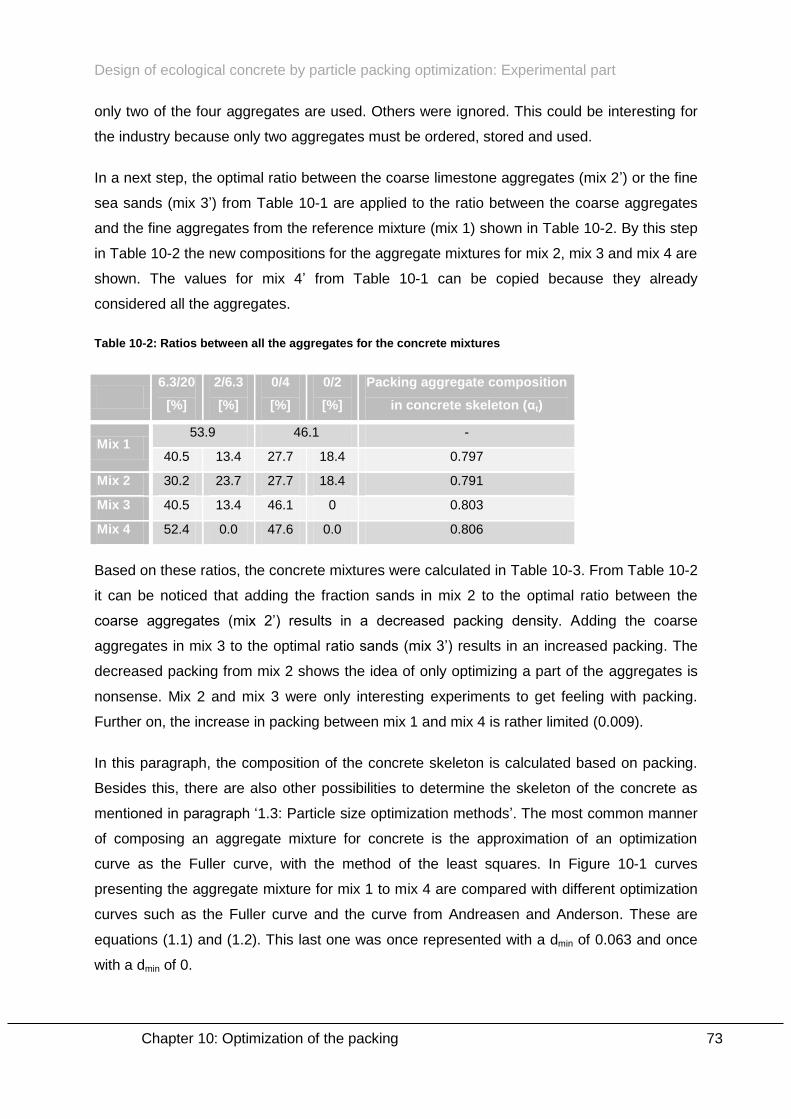
Design of ecological concrete by particle packing optimization: Experimental part
Chapter 10: Optimization of the packing 73
only two of the four aggregates are used. Others were ignored. This could be interesting for
the industry because only two aggregates must be ordered, stored and used.
In a next step, the optimal ratio between the coarse limestone aggregates (mix 2’) or the fine
sea sands (mix 3’) from Table 10-1 are applied to the ratio between the coarse aggregates
and the fine aggregates from the reference mixture (mix 1) shown in Table 10-2. By this step
in Table 10-2 the new compositions for the aggregate mixtures for mix 2, mix 3 and mix 4 are
shown. The values for mix 4’ from Table 10-1 can be copied because they already
considered all the aggregates.
Table 10-2: Ratios between all the aggregates for the concrete mixtures
6.3/20
[%]
2/6.3
[%]
0/4
[%]
0/2
[%]
Packing aggregate composition
in concrete skeleton (αt)
Mix 1 53.9 46.1 -
40.5 13.4 27.7 18.4 0.797
Mix 2 30.2 23.7 27.7 18.4 0.791
Mix 3 40.5 13.4 46.1 0 0.803
Mix 4 52.4 0.0 47.6 0.0 0.806
Based on these ratios, the concrete mixtures were calculated in Table 10-3. From Table 10-2
it can be noticed that adding the fraction sands in mix 2 to the optimal ratio between the
coarse aggregates (mix 2’) results in a decreased packing density. Adding the coarse
aggregates in mix 3 to the optimal ratio sands (mix 3’) results in an increased packing. The
decreased packing from mix 2 shows the idea of only optimizing a part of the aggregates is
nonsense. Mix 2 and mix 3 were only interesting experiments to get feeling with packing.
Further on, the increase in packing between mix 1 and mix 4 is rather limited (0.009).
In this paragraph, the composition of the concrete skeleton is calculated based on packing.
Besides this, there are also other possibilities to determine the skeleton of the concrete as
mentioned in paragraph ‘1.3: Particle size optimization methods’. The most common manner
of composing an aggregate mixture for concrete is the approximation of an optimization
curve as the Fuller curve, with the method of the least squares. In Figure 10-1 curves
presenting the aggregate mixture for mix 1 to mix 4 are compared with different optimization
curves such as the Fuller curve and the curve from Andreasen and Anderson. These are
equations (1.1) and (1.2). This last one was once represented with a dmin of 0.063 and once
with a dmin of 0.
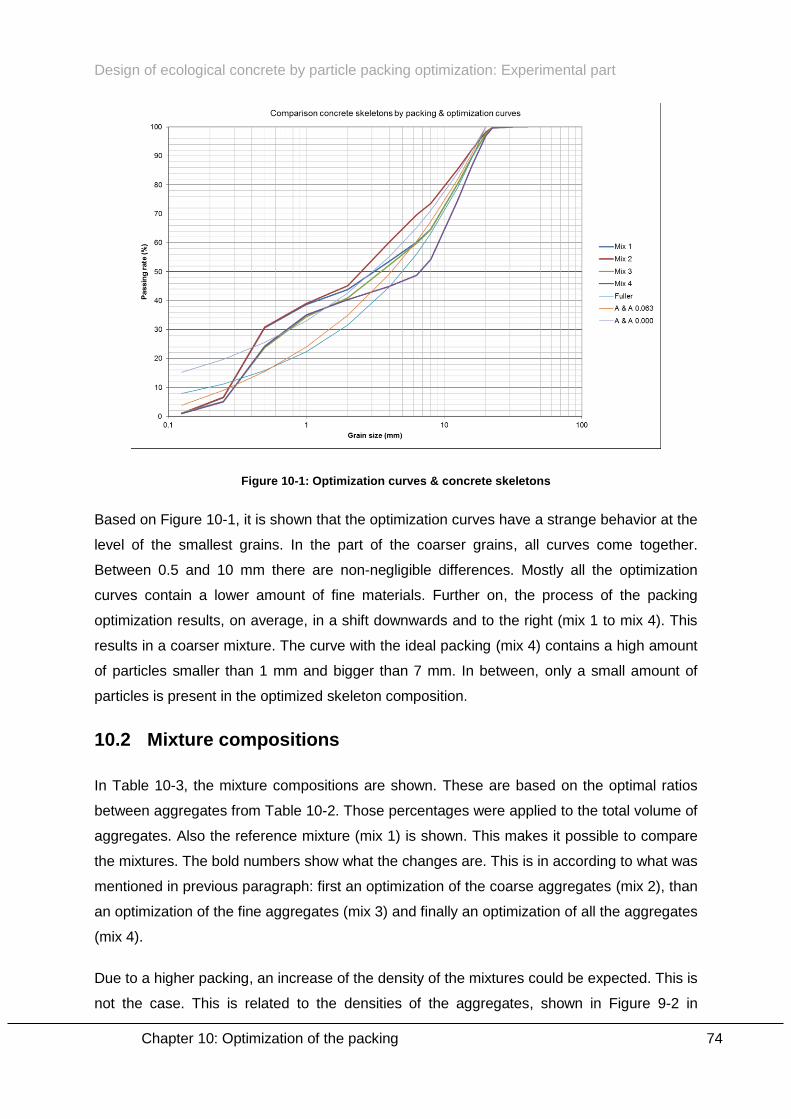
Design of ecological concrete by particle packing optimization: Experimental part
Chapter 10: Optimization of the packing 74
Figure 10-1: Optimization curves & concrete skeletons
Based on Figure 10-1, it is shown that the optimization curves have a strange behavior at the
level of the smallest grains. In the part of the coarser grains, all curves come together.
Between 0.5 and 10 mm there are non-negligible differences. Mostly all the optimization
curves contain a lower amount of fine materials. Further on, the process of the packing
optimization results, on average, in a shift downwards and to the right (mix 1 to mix 4). This
results in a coarser mixture. The curve with the ideal packing (mix 4) contains a high amount
of particles smaller than 1 mm and bigger than 7 mm. In between, only a small amount of
particles is present in the optimized skeleton composition.
10.2 Mixture compositions
In Table 10-3, the mixture compositions are shown. These are based on the optimal ratios
between aggregates from Table 10-2. Those percentages were applied to the total volume of
aggregates. Also the reference mixture (mix 1) is shown. This makes it possible to compare
the mixtures. The bold numbers show what the changes are. This is in according to what was
mentioned in previous paragraph: first an optimization of the coarse aggregates (mix 2), than
an optimization of the fine aggregates (mix 3) and finally an optimization of all the aggregates
(mix 4).
Due to a higher packing, an increase of the density of the mixtures could be expected. This is
not the case. This is related to the densities of the aggregates, shown in Figure 9-2 in
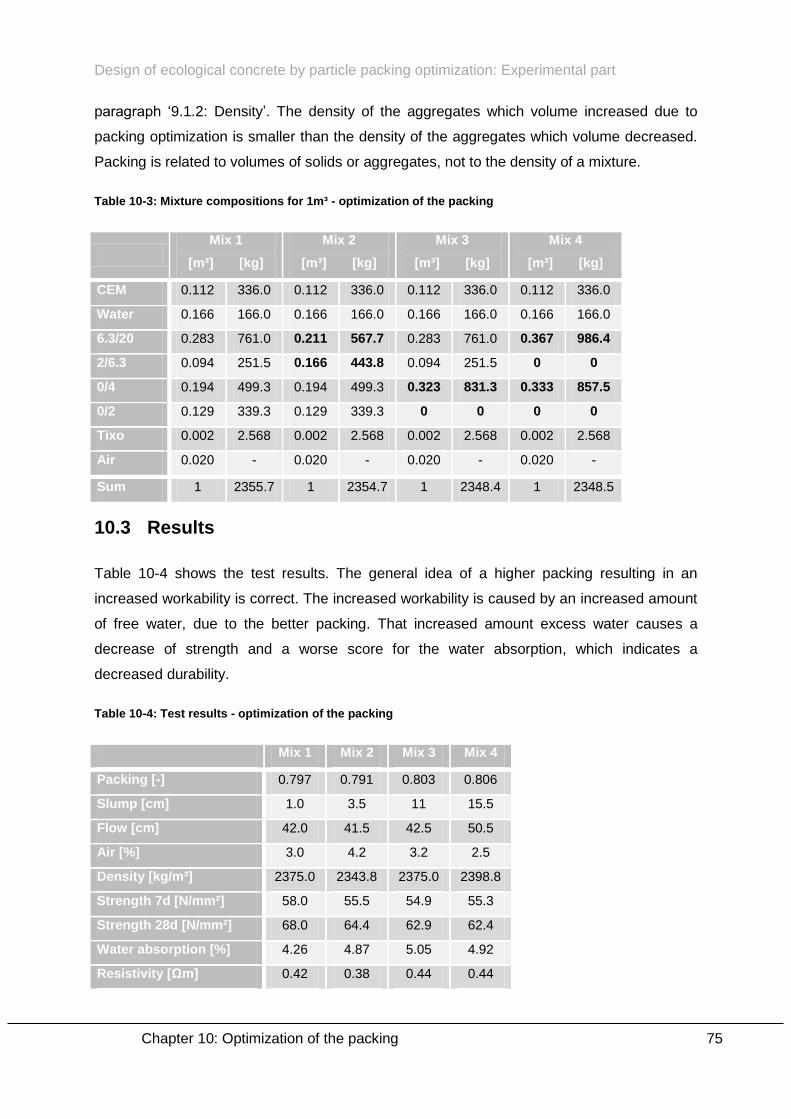
Design of ecological concrete by particle packing optimization: Experimental part
Chapter 10: Optimization of the packing 75
paragraph ‘9.1.2: Density’. The density of the aggregates which volume increased due to
packing optimization is smaller than the density of the aggregates which volume decreased.
Packing is related to volumes of solids or aggregates, not to the density of a mixture.
Table 10-3: Mixture compositions for 1m³ - optimization of the packing
Mix 1
[m³] [kg]
Mix 2
[m³] [kg]
Mix 3
[m³] [kg]
Mix 4
[m³] [kg]
CEM 0.112 336.0 0.112 336.0 0.112 336.0 0.112 336.0
Water 0.166 166.0 0.166 166.0 0.166 166.0 0.166 166.0
6.3/20 0.283 761.0 0.211 567.7 0.283 761.0 0.367 986.4
2/6.3 0.094 251.5 0.166 443.8 0.094 251.5 0 0
0/4 0.194 499.3 0.194 499.3 0.323 831.3 0.333 857.5
0/2 0.129 339.3 0.129 339.3 0 0 0 0
Tixo 0.002 2.568 0.002 2.568 0.002 2.568 0.002 2.568
Air 0.020 - 0.020 - 0.020 - 0.020 -
Sum 1 2355.7 1 2354.7 1 2348.4 1 2348.5
10.3 Results
Table 10-4 shows the test results. The general idea of a higher packing resulting in an
increased workability is correct. The increased workability is caused by an increased amount
of free water, due to the better packing. That increased amount excess water causes a
decrease of strength and a worse score for the water absorption, which indicates a
decreased durability.
Table 10-4: Test results - optimization of the packing
Mix 1 Mix 2 Mix 3 Mix 4
Packing [-] 0.797 0.791 0.803 0.806
Slump [cm] 1.0 3.5 11 15.5
Flow [cm] 42.0 41.5 42.5 50.5
Air [%] 3.0 4.2 3.2 2.5
Density [kg/m³] 2375.0 2343.8 2375.0 2398.8
Strength 7d [N/mm²] 58.0 55.5 54.9 55.3
Strength 28d [N/mm²] 68.0 64.4 62.9 62.4
Water absorption [%] 4.26 4.87 5.05 4.92
Resistivity [Ωm] 0.42 0.38 0.44 0.44
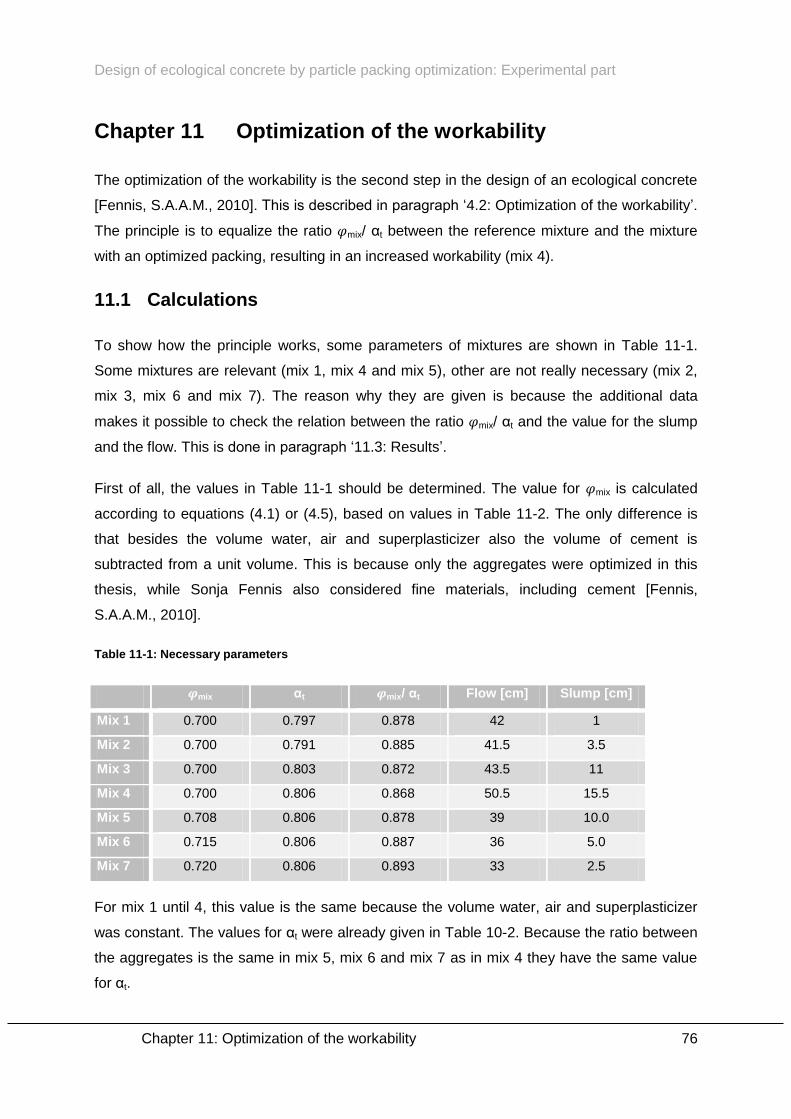
Design of ecological concrete by particle packing optimization: Experimental part
Chapter 11: Optimization of the workability 76
Chapter 11 Optimization of the workability
The optimization of the workability is the second step in the design of an ecological concrete
[Fennis, S.A.A.M., 2010]. This is described in paragraph ‘4.2: Optimization of the workability’.
The principle is to equalize the ratio mix/ αt between the reference mixture and the mixture
with an optimized packing, resulting in an increased workability (mix 4).
11.1 Calculations
To show how the principle works, some parameters of mixtures are shown in Table 11-1.
Some mixtures are relevant (mix 1, mix 4 and mix 5), other are not really necessary (mix 2,
mix 3, mix 6 and mix 7). The reason why they are given is because the additional data
makes it possible to check the relation between the ratio mix/ αt and the value for the slump
and the flow. This is done in paragraph ‘11.3: Results’.
First of all, the values in Table 11-1 should be determined. The value for mix is calculated
according to equations (4.1) or (4.5), based on values in Table 11-2. The only difference is
that besides the volume water, air and superplasticizer also the volume of cement is
subtracted from a unit volume. This is because only the aggregates were optimized in this
thesis, while Sonja Fennis also considered fine materials, including cement [Fennis,
S.A.A.M., 2010].
Table 11-1: Necessary parameters
mix αt mix/ αt Flow [cm] Slump [cm]
Mix 1 0.700 0.797 0.878 42 1
Mix 2 0.700 0.791 0.885 41.5 3.5
Mix 3 0.700 0.803 0.872 43.5 11
Mix 4 0.700 0.806 0.868 50.5 15.5
Mix 5 0.708 0.806 0.878 39 10.0
Mix 6 0.715 0.806 0.887 36 5.0
Mix 7 0.720 0.806 0.893 33 2.5
For mix 1 until 4, this value is the same because the volume water, air and superplasticizer
was constant. The values for αt were already given in Table 10-2. Because the ratio between
the aggregates is the same in mix 5, mix 6 and mix 7 as in mix 4 they have the same value
for αt.
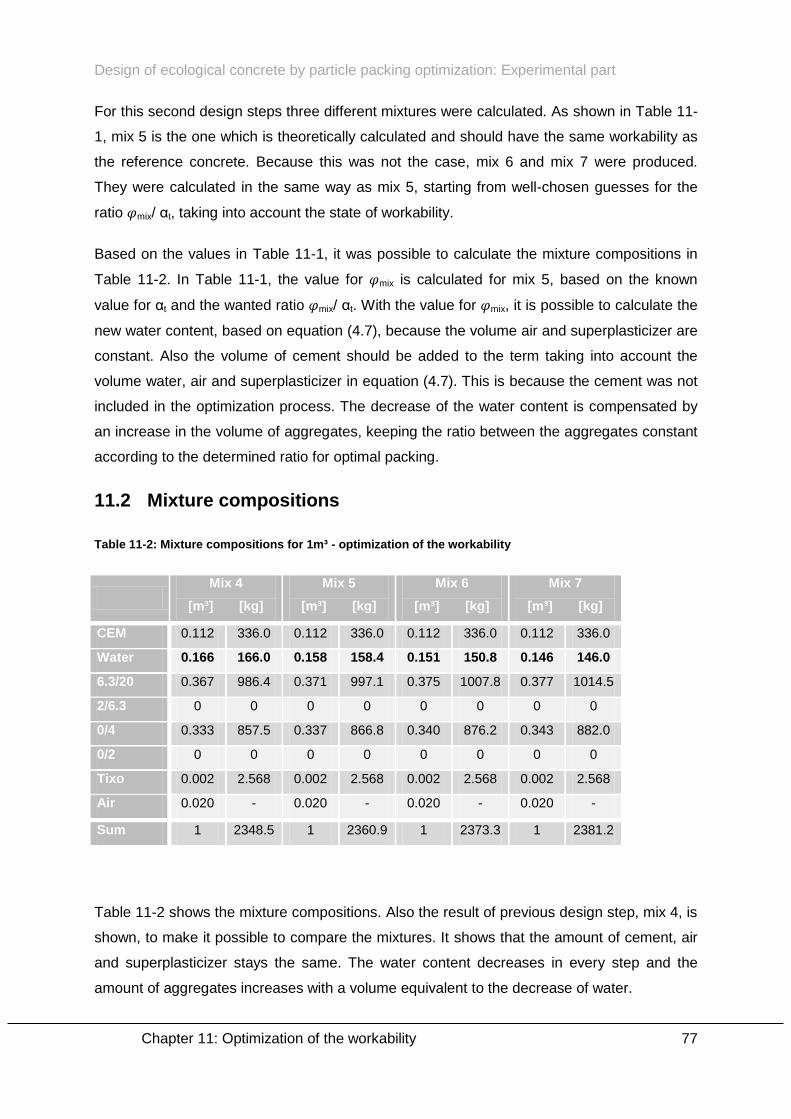
Design of ecological concrete by particle packing optimization: Experimental part
Chapter 11: Optimization of the workability 77
For this second design steps three different mixtures were calculated. As shown in Table 11-
1, mix 5 is the one which is theoretically calculated and should have the same workability as
the reference concrete. Because this was not the case, mix 6 and mix 7 were produced.
They were calculated in the same way as mix 5, starting from well-chosen guesses for the
ratio mix/ αt, taking into account the state of workability.
Based on the values in Table 11-1, it was possible to calculate the mixture compositions in
Table 11-2. In Table 11-1, the value for mix is calculated for mix 5, based on the known
value for αt and the wanted ratio mix/ αt. With the value for mix, it is possible to calculate the
new water content, based on equation (4.7), because the volume air and superplasticizer are
constant. Also the volume of cement should be added to the term taking into account the
volume water, air and superplasticizer in equation (4.7). This is because the cement was not
included in the optimization process. The decrease of the water content is compensated by
an increase in the volume of aggregates, keeping the ratio between the aggregates constant
according to the determined ratio for optimal packing.
11.2 Mixture compositions
Table 11-2: Mixture compositions for 1m³ - optimization of the workability
Mix 4
[m³] [kg]
Mix 5
[m³] [kg]
Mix 6
[m³] [kg]
Mix 7
[m³] [kg]
CEM 0.112 336.0 0.112 336.0 0.112 336.0 0.112 336.0
Water 0.166 166.0 0.158 158.4 0.151 150.8 0.146 146.0
6.3/20 0.367 986.4 0.371 997.1 0.375 1007.8 0.377 1014.5
2/6.3 0 0 0 0 0 0 0 0
0/4 0.333 857.5 0.337 866.8 0.340 876.2 0.343 882.0
0/2 0 0 0 0 0 0 0 0
Tixo 0.002 2.568 0.002 2.568 0.002 2.568 0.002 2.568
Air 0.020 - 0.020 - 0.020 - 0.020 -
Sum 1 2348.5 1 2360.9 1 2373.3 1 2381.2
Table 11-2 shows the mixture compositions. Also the result of previous design step, mix 4, is
shown, to make it possible to compare the mixtures. It shows that the amount of cement, air
and superplasticizer stays the same. The water content decreases in every step and the
amount of aggregates increases with a volume equivalent to the decrease of water.
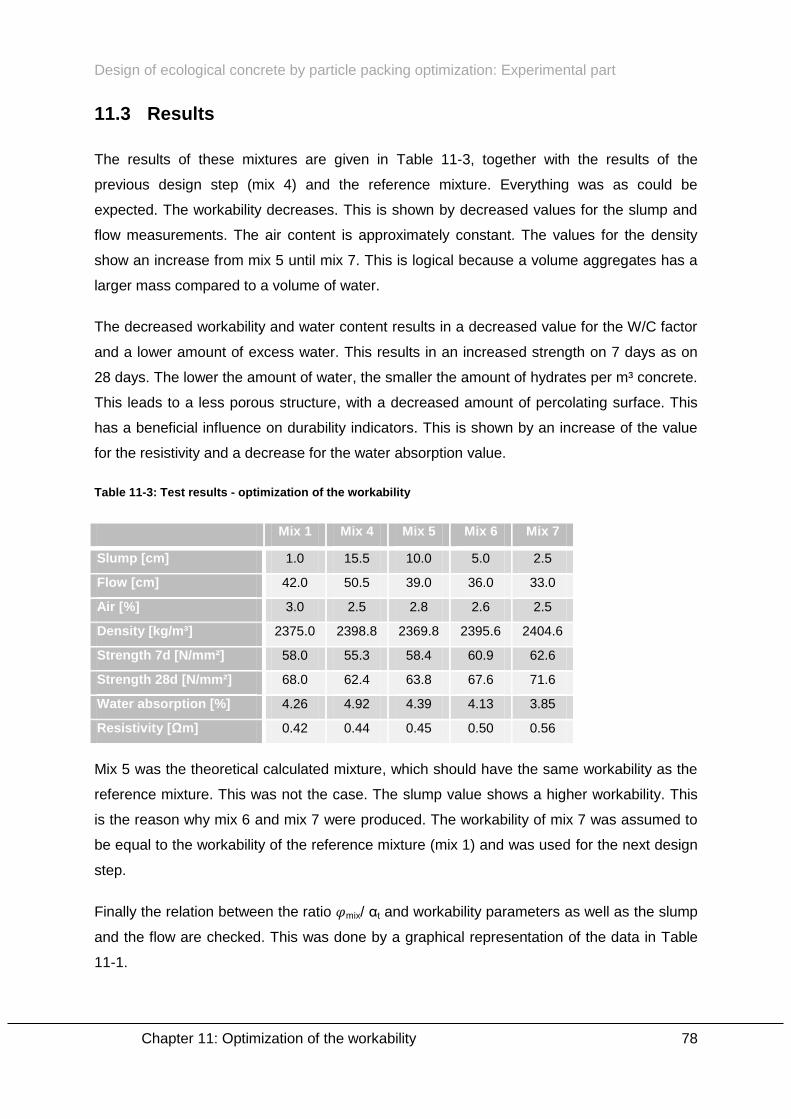
Design of ecological concrete by particle packing optimization: Experimental part
Chapter 11: Optimization of the workability 78
11.3 Results
The results of these mixtures are given in Table 11-3, together with the results of the
previous design step (mix 4) and the reference mixture. Everything was as could be
expected. The workability decreases. This is shown by decreased values for the slump and
flow measurements. The air content is approximately constant. The values for the density
show an increase from mix 5 until mix 7. This is logical because a volume aggregates has a
larger mass compared to a volume of water.
The decreased workability and water content results in a decreased value for the W/C factor
and a lower amount of excess water. This results in an increased strength on 7 days as on
28 days. The lower the amount of water, the smaller the amount of hydrates per m³ concrete.
This leads to a less porous structure, with a decreased amount of percolating surface. This
has a beneficial influence on durability indicators. This is shown by an increase of the value
for the resistivity and a decrease for the water absorption value.
Table 11-3: Test results - optimization of the workability
Mix 1 Mix 4 Mix 5 Mix 6 Mix 7
Slump [cm] 1.0 15.5 10.0 5.0 2.5
Flow [cm] 42.0 50.5 39.0 36.0 33.0
Air [%] 3.0 2.5 2.8 2.6 2.5
Density [kg/m³] 2375.0 2398.8 2369.8 2395.6 2404.6
Strength 7d [N/mm²] 58.0 55.3 58.4 60.9 62.6
Strength 28d [N/mm²] 68.0 62.4 63.8 67.6 71.6
Water absorption [%] 4.26 4.92 4.39 4.13 3.85
Resistivity [Ωm] 0.42 0.44 0.45 0.50 0.56
Mix 5 was the theoretical calculated mixture, which should have the same workability as the
reference mixture. This was not the case. The slump value shows a higher workability. This
is the reason why mix 6 and mix 7 were produced. The workability of mix 7 was assumed to
be equal to the workability of the reference mixture (mix 1) and was used for the next design
step.
Finally the relation between the ratio mix/ αt and workability parameters as well as the slump
and the flow are checked. This was done by a graphical representation of the data in Table
11-1.
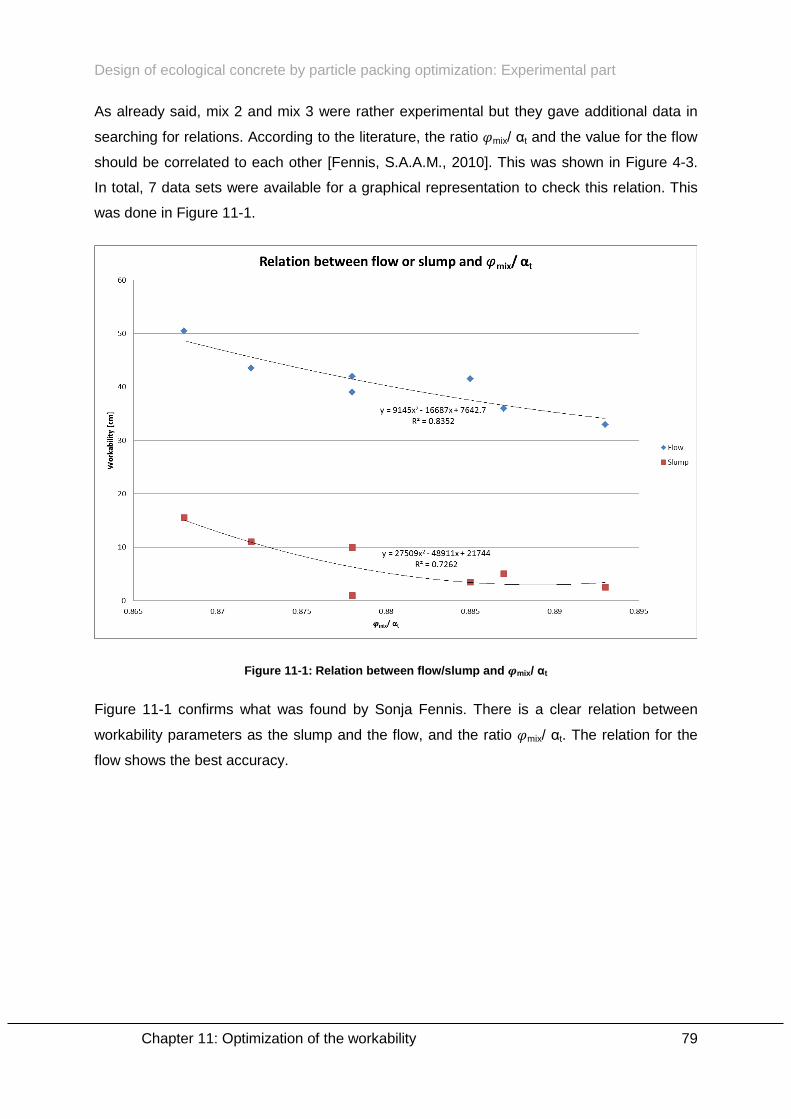
Design of ecological concrete by particle packing optimization: Experimental part
Chapter 11: Optimization of the workability 79
As already said, mix 2 and mix 3 were rather experimental but they gave additional data in
searching for relations. According to the literature, the ratio mix/ αt and the value for the flow
should be correlated to each other [Fennis, S.A.A.M., 2010]. This was shown in Figure 4-3.
In total, 7 data sets were available for a graphical representation to check this relation. This
was done in Figure 11-1.
Figure 11-1: Relation between flow/slump and mix/ αt
Figure 11-1 confirms what was found by Sonja Fennis. There is a clear relation between
workability parameters as the slump and the flow, and the ratio mix/ αt. The relation for the
flow shows the best accuracy.
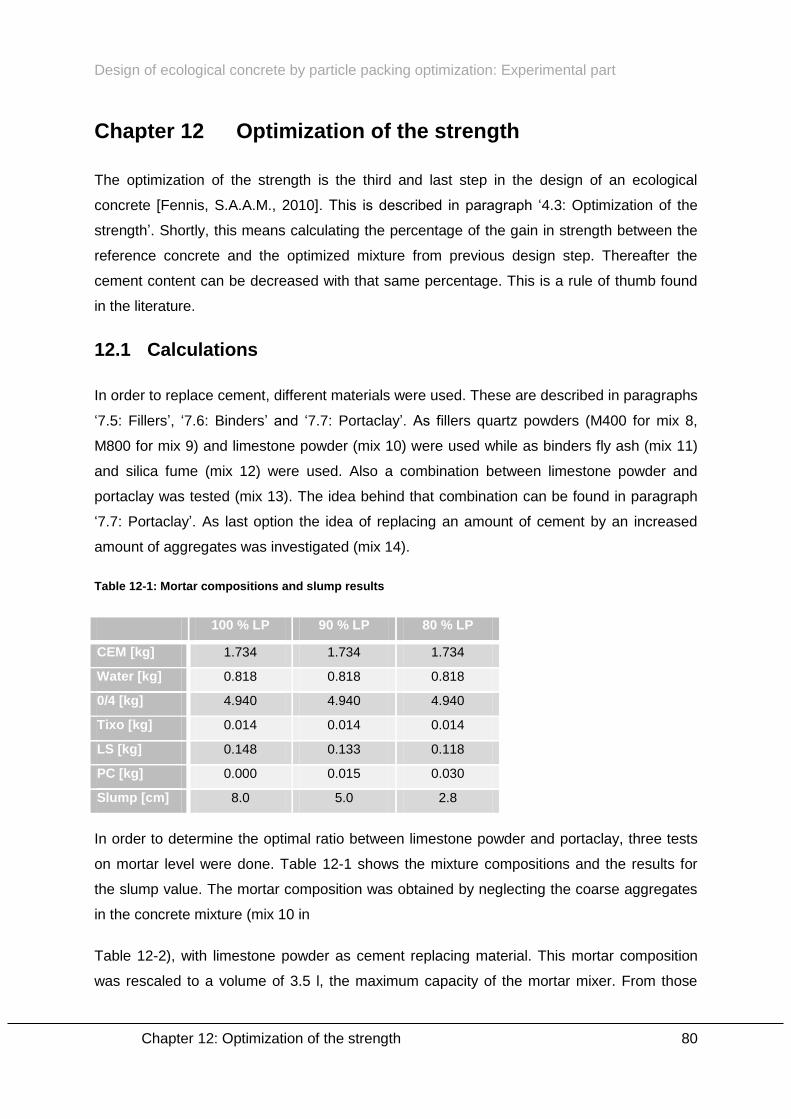
Design of ecological concrete by particle packing optimization: Experimental part
Chapter 12: Optimization of the strength 80
Chapter 12 Optimization of the strength
The optimization of the strength is the third and last step in the design of an ecological
concrete [Fennis, S.A.A.M., 2010]. This is described in paragraph ‘4.3: Optimization of the
strength’. Shortly, this means calculating the percentage of the gain in strength between the
reference concrete and the optimized mixture from previous design step. Thereafter the
cement content can be decreased with that same percentage. This is a rule of thumb found
in the literature.
12.1 Calculations
In order to replace cement, different materials were used. These are described in paragraphs
‘7.5: Fillers’, ‘7.6: Binders’ and ‘7.7: Portaclay’. As fillers quartz powders (M400 for mix 8,
M800 for mix 9) and limestone powder (mix 10) were used while as binders fly ash (mix 11)
and silica fume (mix 12) were used. Also a combination between limestone powder and
portaclay was tested (mix 13). The idea behind that combination can be found in paragraph
‘7.7: Portaclay’. As last option the idea of replacing an amount of cement by an increased
amount of aggregates was investigated (mix 14).
Table 12-1: Mortar compositions and slump results
100 % LP 90 % LP 80 % LP
CEM [kg] 1.734 1.734 1.734
Water [kg] 0.818 0.818 0.818
0/4 [kg] 4.940 4.940 4.940
Tixo [kg] 0.014 0.014 0.014
LS [kg] 0.148 0.133 0.118
PC [kg] 0.000 0.015 0.030
Slump [cm] 8.0 5.0 2.8
In order to determine the optimal ratio between limestone powder and portaclay, three tests
on mortar level were done. Table 12-1 shows the mixture compositions and the results for
the slump value. The mortar composition was obtained by neglecting the coarse aggregates
in the concrete mixture (mix 10 in
Table 12-2), with limestone powder as cement replacing material. This mortar composition
was rescaled to a volume of 3.5 l, the maximum capacity of the mortar mixer. From those
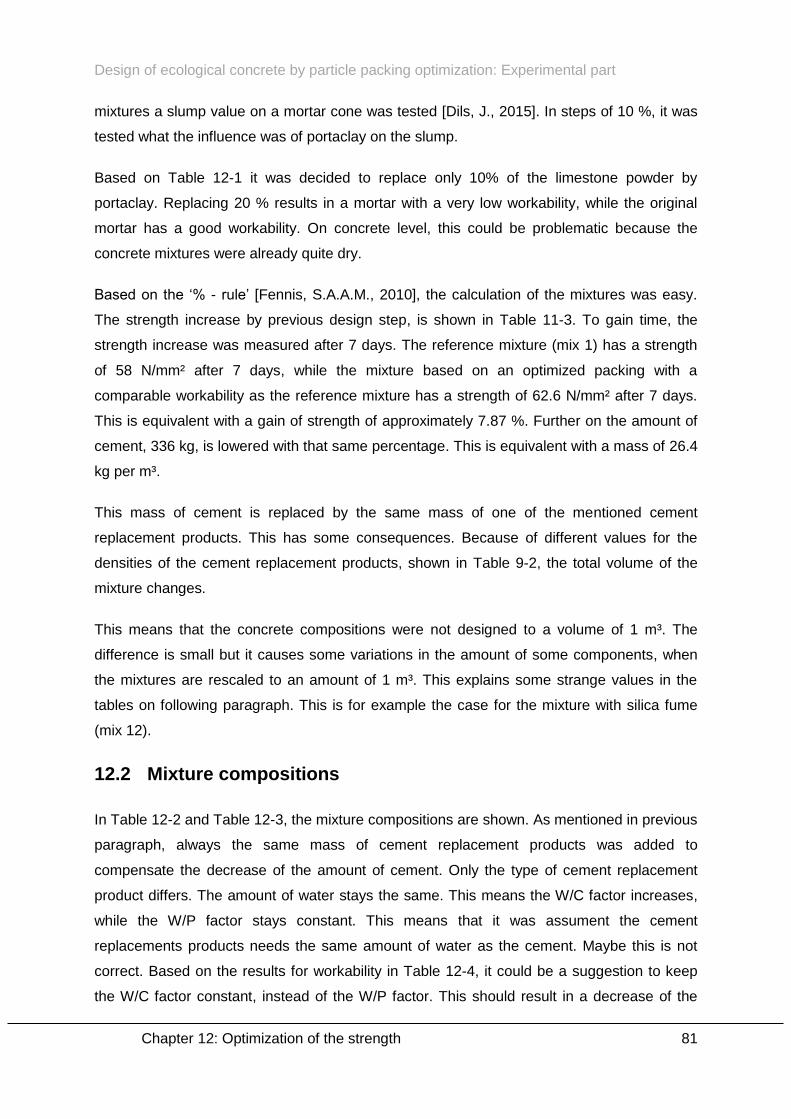
Design of ecological concrete by particle packing optimization: Experimental part
Chapter 12: Optimization of the strength 81
mixtures a slump value on a mortar cone was tested [Dils, J., 2015]. In steps of 10 %, it was
tested what the influence was of portaclay on the slump.
Based on Table 12-1 it was decided to replace only 10% of the limestone powder by
portaclay. Replacing 20 % results in a mortar with a very low workability, while the original
mortar has a good workability. On concrete level, this could be problematic because the
concrete mixtures were already quite dry.
Based on the ‘% - rule’ [Fennis, S.A.A.M., 2010], the calculation of the mixtures was easy.
The strength increase by previous design step, is shown in Table 11-3. To gain time, the
strength increase was measured after 7 days. The reference mixture (mix 1) has a strength
of 58 N/mm² after 7 days, while the mixture based on an optimized packing with a
comparable workability as the reference mixture has a strength of 62.6 N/mm² after 7 days.
This is equivalent with a gain of strength of approximately 7.87 %. Further on the amount of
cement, 336 kg, is lowered with that same percentage. This is equivalent with a mass of 26.4
kg per m³.
This mass of cement is replaced by the same mass of one of the mentioned cement
replacement products. This has some consequences. Because of different values for the
densities of the cement replacement products, shown in Table 9-2, the total volume of the
mixture changes.
This means that the concrete compositions were not designed to a volume of 1 m³. The
difference is small but it causes some variations in the amount of some components, when
the mixtures are rescaled to an amount of 1 m³. This explains some strange values in the
tables on following paragraph. This is for example the case for the mixture with silica fume
(mix 12).
12.2 Mixture compositions
In Table 12-2 and Table 12-3, the mixture compositions are shown. As mentioned in previous
paragraph, always the same mass of cement replacement products was added to
compensate the decrease of the amount of cement. Only the type of cement replacement
product differs. The amount of water stays the same. This means the W/C factor increases,
while the W/P factor stays constant. This means that it was assument the cement
replacements products needs the same amount of water as the cement. Maybe this is not
correct. Based on the results for workability in Table 12-4, it could be a suggestion to keep
the W/C factor constant, instead of the W/P factor. This should result in a decrease of the
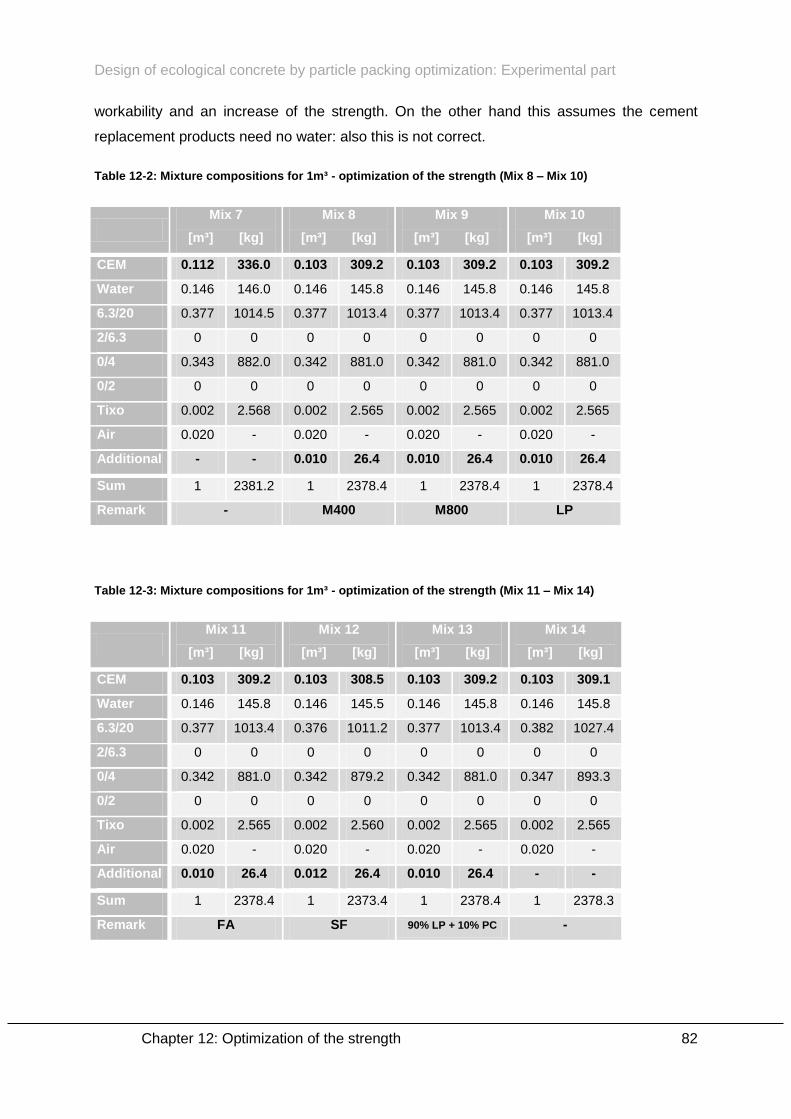
Design of ecological concrete by particle packing optimization: Experimental part
Chapter 12: Optimization of the strength 82
workability and an increase of the strength. On the other hand this assumes the cement
replacement products need no water: also this is not correct.
Table 12-2: Mixture compositions for 1m³ - optimization of the strength (Mix 8 – Mix 10)
Mix 7
[m³] [kg]
Mix 8
[m³] [kg]
Mix 9
[m³] [kg]
Mix 10
[m³] [kg]
CEM 0.112 336.0 0.103 309.2 0.103 309.2 0.103 309.2
Water 0.146 146.0 0.146 145.8 0.146 145.8 0.146 145.8
6.3/20 0.377 1014.5 0.377 1013.4 0.377 1013.4 0.377 1013.4
2/6.3 0 0 0 0 0 0 0 0
0/4 0.343 882.0 0.342 881.0 0.342 881.0 0.342 881.0
0/2 0 0 0 0 0 0 0 0
Tixo 0.002 2.568 0.002 2.565 0.002 2.565 0.002 2.565
Air 0.020 - 0.020 - 0.020 - 0.020 -
Additional - - 0.010 26.4 0.010 26.4 0.010 26.4
Sum 1 2381.2 1 2378.4 1 2378.4 1 2378.4
Remark - M400 M800 LP
Table 12-3: Mixture compositions for 1m³ - optimization of the strength (Mix 11 – Mix 14)
Mix 11
[m³] [kg]
Mix 12
[m³] [kg]
Mix 13
[m³] [kg]
Mix 14
[m³] [kg]
CEM 0.103 309.2 0.103 308.5 0.103 309.2 0.103 309.1
Water 0.146 145.8 0.146 145.5 0.146 145.8 0.146 145.8
6.3/20 0.377 1013.4 0.376 1011.2 0.377 1013.4 0.382 1027.4
2/6.3 0 0 0 0 0 0 0 0
0/4 0.342 881.0 0.342 879.2 0.342 881.0 0.347 893.3
0/2 0 0 0 0 0 0 0 0
Tixo 0.002 2.565 0.002 2.560 0.002 2.565 0.002 2.565
Air 0.020 - 0.020 - 0.020 - 0.020 -
Additional 0.010 26.4 0.012 26.4 0.010 26.4 - -
Sum 1 2378.4 1 2373.4 1 2378.4 1 2378.3
Remark FA SF 90% LP + 10% PC -
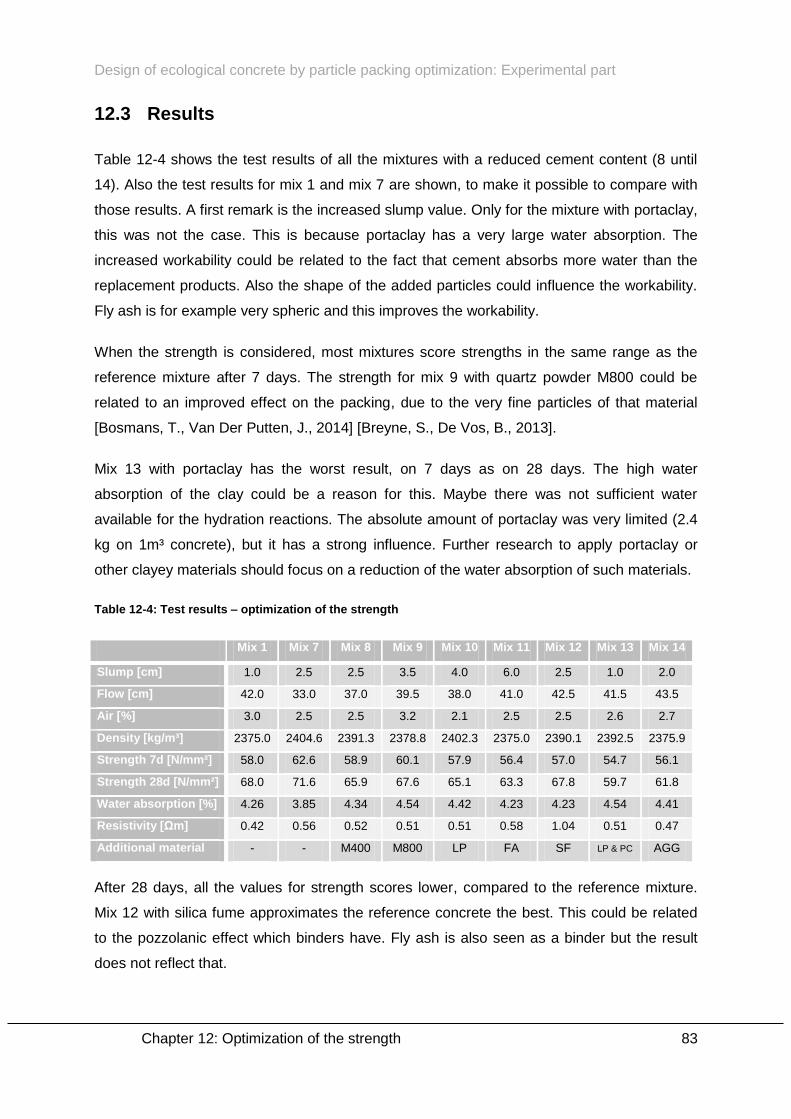
Design of ecological concrete by particle packing optimization: Experimental part
Chapter 12: Optimization of the strength 83
12.3 Results
Table 12-4 shows the test results of all the mixtures with a reduced cement content (8 until
14). Also the test results for mix 1 and mix 7 are shown, to make it possible to compare with
those results. A first remark is the increased slump value. Only for the mixture with portaclay,
this was not the case. This is because portaclay has a very large water absorption. The
increased workability could be related to the fact that cement absorbs more water than the
replacement products. Also the shape of the added particles could influence the workability.
Fly ash is for example very spheric and this improves the workability.
When the strength is considered, most mixtures score strengths in the same range as the
reference mixture after 7 days. The strength for mix 9 with quartz powder M800 could be
related to an improved effect on the packing, due to the very fine particles of that material
[Bosmans, T., Van Der Putten, J., 2014] [Breyne, S., De Vos, B., 2013].
Mix 13 with portaclay has the worst result, on 7 days as on 28 days. The high water
absorption of the clay could be a reason for this. Maybe there was not sufficient water
available for the hydration reactions. The absolute amount of portaclay was very limited (2.4
kg on 1m³ concrete), but it has a strong influence. Further research to apply portaclay or
other clayey materials should focus on a reduction of the water absorption of such materials.
Table 12-4: Test results – optimization of the strength
Mix 1 Mix 7 Mix 8 Mix 9 Mix 10 Mix 11 Mix 12 Mix 13 Mix 14
Slump [cm] 1.0 2.5 2.5 3.5 4.0 6.0 2.5 1.0 2.0
Flow [cm] 42.0 33.0 37.0 39.5 38.0 41.0 42.5 41.5 43.5
Air [%] 3.0 2.5 2.5 3.2 2.1 2.5 2.5 2.6 2.7
Density [kg/m³] 2375.0 2404.6 2391.3 2378.8 2402.3 2375.0 2390.1 2392.5 2375.9
Strength 7d [N/mm²] 58.0 62.6 58.9 60.1 57.9 56.4 57.0 54.7 56.1
Strength 28d [N/mm²] 68.0 71.6 65.9 67.6 65.1 63.3 67.8 59.7 61.8
Water absorption [%] 4.26 3.85 4.34 4.54 4.42 4.23 4.23 4.54 4.41
Resistivity [Ωm] 0.42 0.56 0.52 0.51 0.51 0.58 1.04 0.51 0.47
Additional material - - M400 M800 LP FA SF LP & PC AGG
After 28 days, all the values for strength scores lower, compared to the reference mixture.
Mix 12 with silica fume approximates the reference concrete the best. This could be related
to the pozzolanic effect which binders have. Fly ash is also seen as a binder but the result
does not reflect that.

Design of ecological concrete by particle packing optimization: Experimental part
Chapter 12: Optimization of the strength 84
The mixture with an additional amount of aggregates (mix 14) has also not sufficient
strength. This could be related to a lack of fine materials: an amount of 26.4 kg per m³ (7.87
%) was taken away from the mixture and was replaced by a material with total other grain
sizes. All the values for strength are compared graphically on Figure A-1 and Figure A-2 in
the attachments.
On durability level, the values for the water absorption show in general a small increase,
which is normally not beneficial for the durability. However, the difference is negligible. The
values for resistivity all show a clear increase. This is beneficial. It is assumed that a better
packing is the reason: on the level of the aggregates by the optimization of the packing in
design step 1, and on the level of the fine materials by the combination of cement particles
and other fine particles with slightly different sizes.
The value for the resistivity for mix 12 with silica fume is extremely good. This is a nice
example of two effects: an improved packing of the fine materials by the very fine silica fume
particles, and the pozzolanic effect resulting in more reactions on a very small scale between
the silica fume particles and the cement particles. This results in a denser and stronger
structure.

Design of ecological concrete by particle packing optimization: Experimental part
Chapter 13: Experiment 85
Chapter 13 Experiments
13.1 Further optimization with another fine sand
Because in the first design step in paragraph ‘10.1: Calculations’, besides the limestone
aggregate 2/6.3 also the fine sea sand 0/2 was neglected, the idea raises that maybe with
the help of another fine sand the packing could be further optimized, by filling some voids in
the mixture. In order to investigate that, different fine quartz sands from Sibelco were
considered.
The same material characteristics as determined in paragraph ‘9.1: Coarse aggregates’ were
needed to check which sand should be the best. The particle size distribution was already
determined in a previous thesis [Breyne, S., De Vos, B., 2013]. This data was copied and is
represented in Figure 13-1.
Figure 13-1: Particle size distribution additional sands
Besides the particle size distribution, also for the densities values determined by a previous
thesis were used. These values are shown in Table 13-1. It was necessary to know these

Design of ecological concrete by particle packing optimization: Experimental part
Chapter 13: Experiment 86
densities: for the determination of the packing densities, and for the calculations of the
concrete mixtures.
Table 13-1: Densities for additional sands
Sand Density [kg/m³]
M31 2640
M32 2634
S60 2667
S80 2661
S90 2644
With these densities it was possible to determine the packing density. For the materials
present in the laboratory the compaction test, described in paragraph ‘5.3: Packing density’,
was done and the standard deviations were calculated. Only for sand M31 this was not
possible. This value was calculated, based on measurements on different fractions of that
sand in a previous thesis [Bosmans, T., Van Der Putten, J., 2014]. The results for the
packing densities are shown in Figure 13-2.
Figure 13-2: Packing densities additional sands
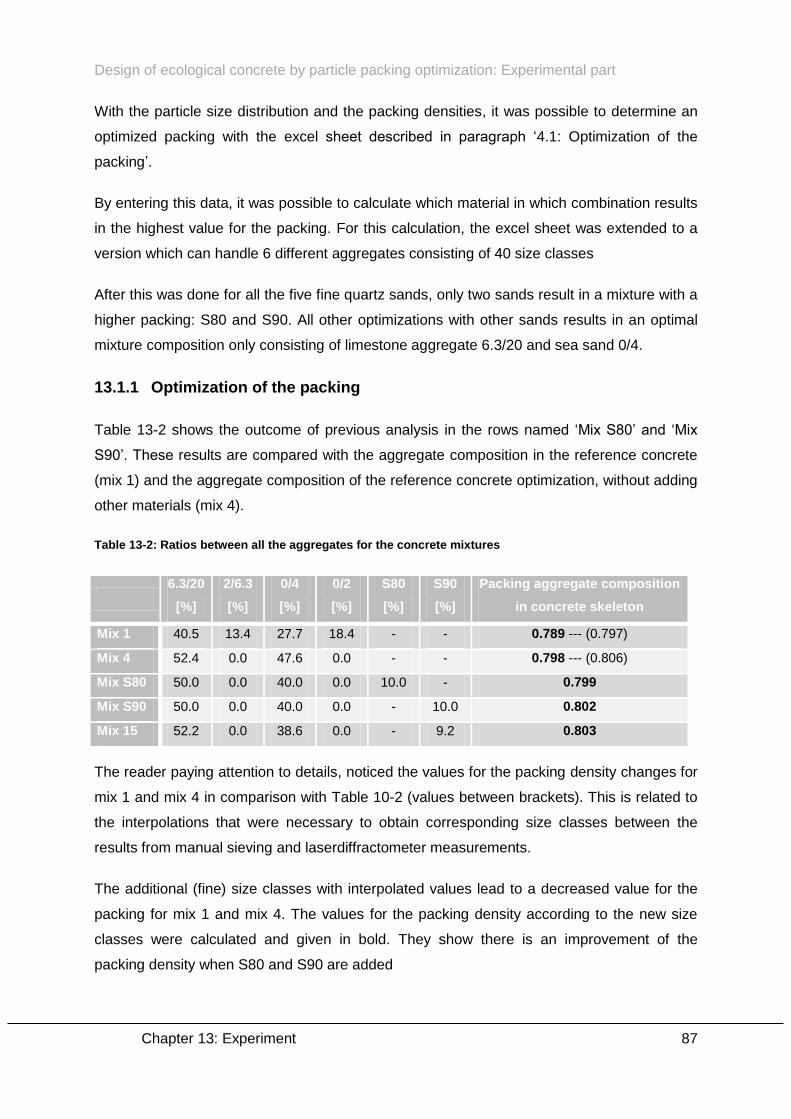
Design of ecological concrete by particle packing optimization: Experimental part
Chapter 13: Experiment 87
With the particle size distribution and the packing densities, it was possible to determine an
optimized packing with the excel sheet described in paragraph ‘4.1: Optimization of the
packing’.
By entering this data, it was possible to calculate which material in which combination results
in the highest value for the packing. For this calculation, the excel sheet was extended to a
version which can handle 6 different aggregates consisting of 40 size classes
After this was done for all the five fine quartz sands, only two sands result in a mixture with a
higher packing: S80 and S90. All other optimizations with other sands results in an optimal
mixture composition only consisting of limestone aggregate 6.3/20 and sea sand 0/4.
13.1.1 Optimization of the packing
Table 13-2 shows the outcome of previous analysis in the rows named ‘Mix S80’ and ‘Mix
S90’. These results are compared with the aggregate composition in the reference concrete
(mix 1) and the aggregate composition of the reference concrete optimization, without adding
other materials (mix 4).
Table 13-2: Ratios between all the aggregates for the concrete mixtures
6.3/20
[%]
2/6.3
[%]
0/4
[%]
0/2
[%]
S80
[%]
S90
[%]
Packing aggregate composition
in concrete skeleton
Mix 1 40.5 13.4 27.7 18.4 - - 0.789 --- (0.797)
Mix 4 52.4 0.0 47.6 0.0 - - 0.798 --- (0.806)
Mix S80 50.0 0.0 40.0 0.0 10.0 - 0.799
Mix S90 50.0 0.0 40.0 0.0 - 10.0 0.802
Mix 15 52.2 0.0 38.6 0.0 - 9.2 0.803
The reader paying attention to details, noticed the values for the packing density changes for
mix 1 and mix 4 in comparison with Table 10-2 (values between brackets). This is related to
the interpolations that were necessary to obtain corresponding size classes between the
results from manual sieving and laserdiffractometer measurements.
The additional (fine) size classes with interpolated values lead to a decreased value for the
packing for mix 1 and mix 4. The values for the packing density according to the new size
classes were calculated and given in bold. They show there is an improvement of the
packing density when S80 and S90 are added
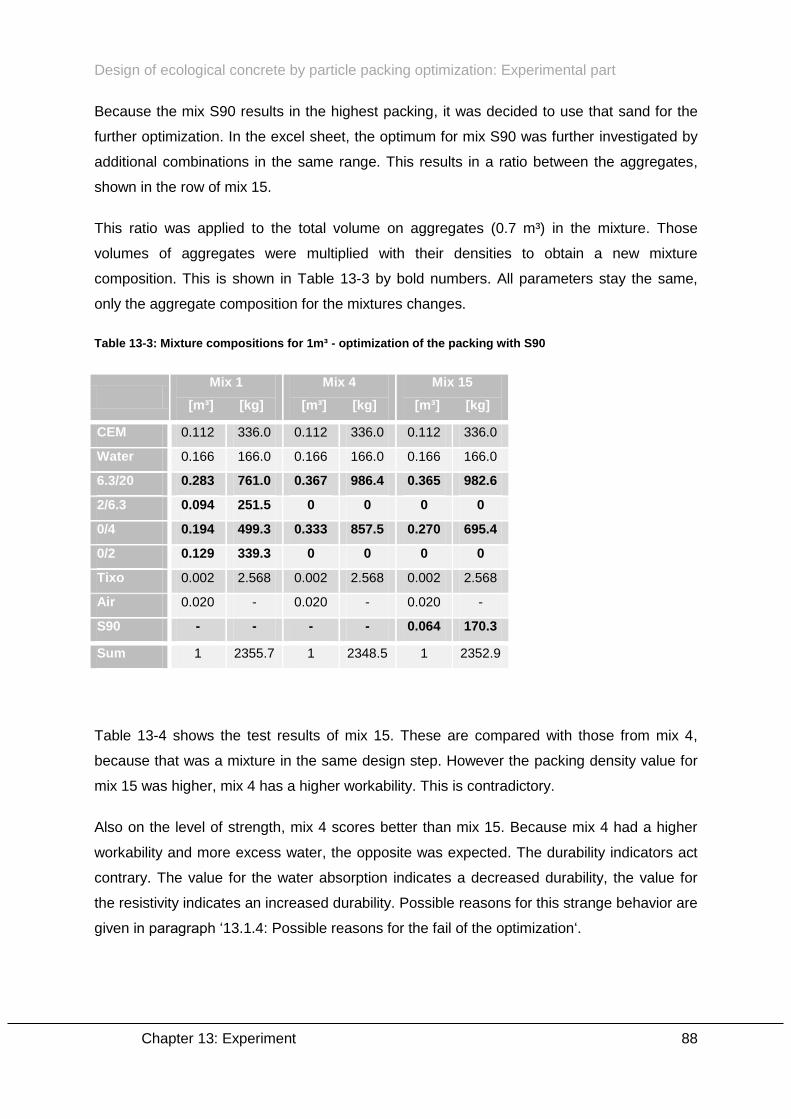
Design of ecological concrete by particle packing optimization: Experimental part
Chapter 13: Experiment 88
Because the mix S90 results in the highest packing, it was decided to use that sand for the
further optimization. In the excel sheet, the optimum for mix S90 was further investigated by
additional combinations in the same range. This results in a ratio between the aggregates,
shown in the row of mix 15.
This ratio was applied to the total volume on aggregates (0.7 m³) in the mixture. Those
volumes of aggregates were multiplied with their densities to obtain a new mixture
composition. This is shown in Table 13-3 by bold numbers. All parameters stay the same,
only the aggregate composition for the mixtures changes.
Table 13-3: Mixture compositions for 1m³ - optimization of the packing with S90
Mix 1
[m³] [kg]
Mix 4
[m³] [kg]
Mix 15
[m³] [kg]
CEM 0.112 336.0 0.112 336.0 0.112 336.0
Water 0.166 166.0 0.166 166.0 0.166 166.0
6.3/20 0.283 761.0 0.367 986.4 0.365 982.6
2/6.3 0.094 251.5 0 0 0 0
0/4 0.194 499.3 0.333 857.5 0.270 695.4
0/2 0.129 339.3 0 0 0 0
Tixo 0.002 2.568 0.002 2.568 0.002 2.568
Air 0.020 - 0.020 - 0.020 -
S90 - - - - 0.064 170.3
Sum 1 2355.7 1 2348.5 1 2352.9
Table 13-4 shows the test results of mix 15. These are compared with those from mix 4,
because that was a mixture in the same design step. However the packing density value for
mix 15 was higher, mix 4 has a higher workability. This is contradictory.
Also on the level of strength, mix 4 scores better than mix 15. Because mix 4 had a higher
workability and more excess water, the opposite was expected. The durability indicators act
contrary. The value for the water absorption indicates a decreased durability, the value for
the resistivity indicates an increased durability. Possible reasons for this strange behavior are
given in paragraph ‘13.1.4: Possible reasons for the fail of the optimization‘.

Design of ecological concrete by particle packing optimization: Experimental part
Chapter 13: Experiment 89
Table 13-4: Test results - optimization of the packing with S90
Mix 1 Mix 4 Mix 15
Slump [cm] 1.0 15.5 8.0
Flow [cm] 42.0 50.5 43.0
Air [%] 3.0 2.5 2.3
Density [kg/m³] 2375.0 2398.8 2370.0
Strength 7d [N/mm²] 58.0 55.3 51.8
Strength 28d [N/mm²] 68.0 62.4 60.5
Water absorption [%] 4.26 4.92 5.23
Resistivity [Ωm] 0.42 0.44 0.48
13.1.2 Optimization of the workability
However, as the results were not what could be expected the optimization process was
continued. In a next step, the workability from the optimized mixture (mix 15) should be
reduced to the workability of the reference mixture. This was done in the same way as
mentioned in ‘Chapter 11: Optimization of the workability’.
The results of these calculations are shown in Table 13-5. Mix 16 is the theoretical calculated
identical mixture on level of workability, according to the theory [Fennis, S.A.A.M., 2010].
This could be compared with mix 5, which was the theoretical calculated identical mixture on
level of workability in previous optimization process. In mix 16 the amount of water is lower
now.
In contradiction to previous design step, the theoretical identical calculated mixture was too
dry now. Table 13-6 shows that the value for the slump was the same as for the reference
concrete, but the structure of the concrete was totally different. This is indicated by the flow
value. There was no cohesion in the mixture. It collapses in loose pieces of concrete.
While in mix 5 it was possible to further decrease the water content (mix 6 and mix 7), now
the water content must be increased in mix 16. Mix 17 has the same slump value as mix 16
but there was more cohesion, resulting in a smaller flow value. It was not ideal but this
mixture was accepted as the one with the same workability as the reference concrete. Based
on a possible gain of strength this mixture was the starting point for the third design step.
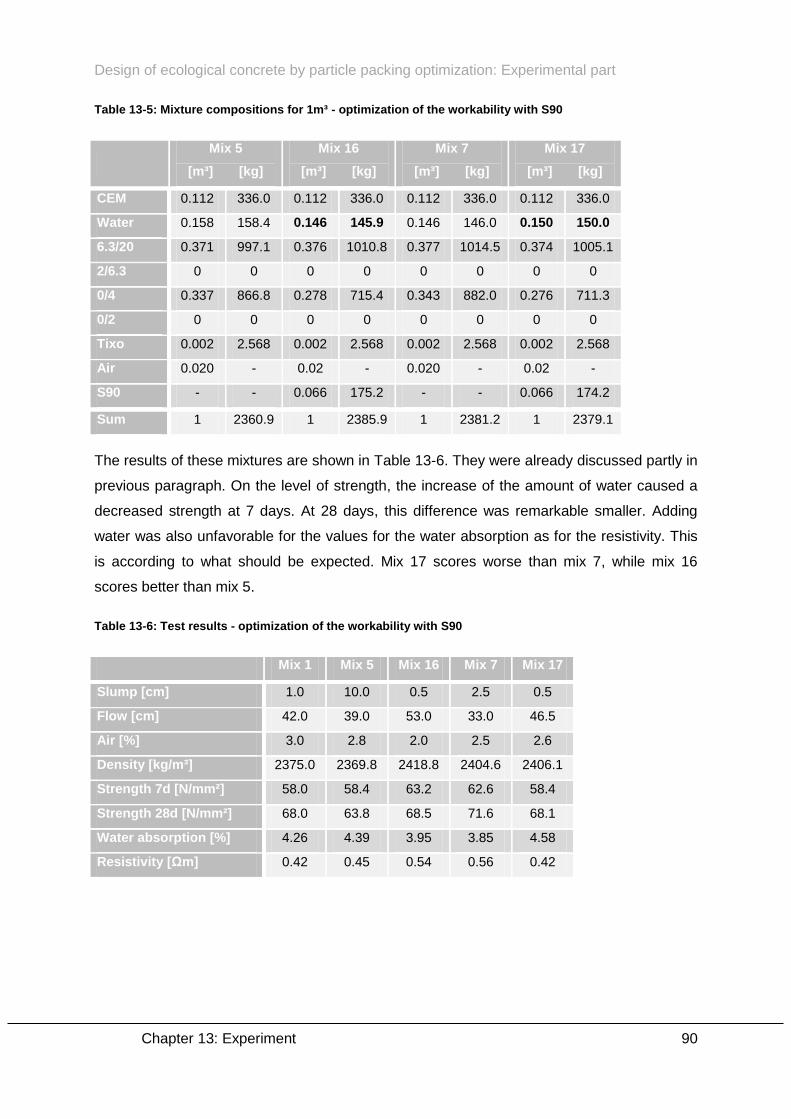
Design of ecological concrete by particle packing optimization: Experimental part
Chapter 13: Experiment 90
Table 13-5: Mixture compositions for 1m³ - optimization of the workability with S90
Mix 5
[m³] [kg]
Mix 16
[m³] [kg]
Mix 7
[m³] [kg]
Mix 17
[m³] [kg]
CEM 0.112 336.0 0.112 336.0 0.112 336.0 0.112 336.0
Water 0.158 158.4 0.146 145.9 0.146 146.0 0.150 150.0
6.3/20 0.371 997.1 0.376 1010.8 0.377 1014.5 0.374 1005.1
2/6.3 0 0 0 0 0 0 0 0
0/4 0.337 866.8 0.278 715.4 0.343 882.0 0.276 711.3
0/2 0 0 0 0 0 0 0 0
Tixo 0.002 2.568 0.002 2.568 0.002 2.568 0.002 2.568
Air 0.020 - 0.02 - 0.020 - 0.02 -
S90 - - 0.066 175.2 - - 0.066 174.2
Sum 1 2360.9 1 2385.9 1 2381.2 1 2379.1
The results of these mixtures are shown in Table 13-6. They were already discussed partly in
previous paragraph. On the level of strength, the increase of the amount of water caused a
decreased strength at 7 days. At 28 days, this difference was remarkable smaller. Adding
water was also unfavorable for the values for the water absorption as for the resistivity. This
is according to what should be expected. Mix 17 scores worse than mix 7, while mix 16
scores better than mix 5.
Table 13-6: Test results - optimization of the workability with S90
Mix 1 Mix 5 Mix 16 Mix 7 Mix 17
Slump [cm] 1.0 10.0 0.5 2.5 0.5
Flow [cm] 42.0 39.0 53.0 33.0 46.5
Air [%] 3.0 2.8 2.0 2.5 2.6
Density [kg/m³] 2375.0 2369.8 2418.8 2404.6 2406.1
Strength 7d [N/mm²] 58.0 58.4 63.2 62.6 58.4
Strength 28d [N/mm²] 68.0 63.8 68.5 71.6 68.1
Water absorption [%] 4.26 4.39 3.95 3.85 4.58
Resistivity [Ωm] 0.42 0.45 0.54 0.56 0.42
Design of ecological concrete by particle packing optimization: Experimental part
Chapter 13: Experiment 91
13.1.3 Optimization of the strength
Unfortunately, it was not possible or useful to do this last step. Normally in this step, based
on the gain of strength of mix 17, an amount of the cement should be placed. The strength of
mix 17 after 7 days is 58.4 N/mm², while the strength of the reference concrete was 58
N/mm². The increase in strength is too small to continue this optimization.
13.1.4 Possible reasons for the fail of the optimization
Previous results are strange. With S90 the packing is higher, according to the CPM and the
excel sheet, but it does not result in a further optimization of the design of an ecological
concrete. The optimization failed due to small strength increase, maybe linked with the too
low workability.
Quartz sands does not absorb important amounts water normally. If that is the case, this
could not be the reason of the low workability. An explanation for the strongly decreased
workability is the fineness of the sand. The finer a material, the larger the specific surface.
The specific surface of S90 is much higher compared to the specific surface of the other
aggregates. Adding S90 to the composition of the aggregate mix increases its specific
surface. The function of water in a mixture is to form a water layer around the particles, to fill
voids and to give the mixture a sufficient workability. An increase of the specific surface
means more water is needed to form a water layer around the particles. Less water is
available to give the mixture sufficient workability.
However the specific surface of fine materials, as cement, is much larger compared to the
specific surface of sands or aggregates, it is not correct to take that into account.
Superplasticizer works on the surface of those small materials. For sands, this is not the
case. Only the specific surface of the aggregate mixture counts.
13.2 Reference concrete with vacuum mixer
To investigate the impact of the mixing procedure, the reference mixture was also made with
the vacuum mixer close to the end of the thesis. All the information about the mixing
procedure and the characteristics for both ways of mixing (standard mixer and vacuum
mixer) are discussed in ‘Chapter 8: Reference concrete’. The mixture was not mixed
vacuum. It was mixed with the vacuum mixer, which results in another, more intense mixing
procedure. The mixture composition for the reference concrete was already given in Table 9-
3.

Design of ecological concrete by particle packing optimization: Experimental part
Chapter 13: Experiment 92
Table 13-7: Test result – reference mixture with the vacuum mixer
Mix 1 Mix 18
Slump [cm] 1.0 3.0
Flow [cm] 42.0 39.0
Air [%] 3.0 4.2
Density [kg/m³] 2375.0 2335.0
Strength 7d [N/mm²] 58.0 49.1
Strength 28d [N/mm²] 68.0 51.2
Water absorption [%] 4.26 5.21
Resistivity [Ωm] 0.42 0.37
Table 13-7 contains the results for the reference mixture, when it was mixed with the vacuum
mixer (mix 18). These are compared to the results for the reference mixture mixed according
to the standard procedure (mix 1). Important differences can be noticed.
In fresh state, the mixture has an increased workability. The values for the flow are not
relevant for mixture with such a low slump value. The increased air content could partially
explain the decreased density. An increased air content results in an increased workability
for traditionally vibrated concrete [Dils, J., 2015].
In hardened state, the properties of the mix 18 are remarkable bad, in comparison with mix 1.
It was the first time the vacuum mixer was used to mix lime stone aggregates. In the PhD of
Jeroen Dils always gravel was used. Maybe the mixing procedure is too intensive for
limestone aggregates, which could result in broken aggregate and in a negative influenced
packing and weaker test specimens. Comparing the strength at 7 days to the strength at 28
days it is also noticed there is almost no gain of strength. Also on the level of durability mix
18 scores worse results compared with mix 1.
Based on these results, and the importance of the reference mixture in this thesis, it should
be useful to make mix 1 and mix 18 again. In this thesis this was not done. Mix 18 was made
during the last possible test day. When the first results of it were available the time to obtain
test results for new mixtures was too short, according to the deadline of this thesis.
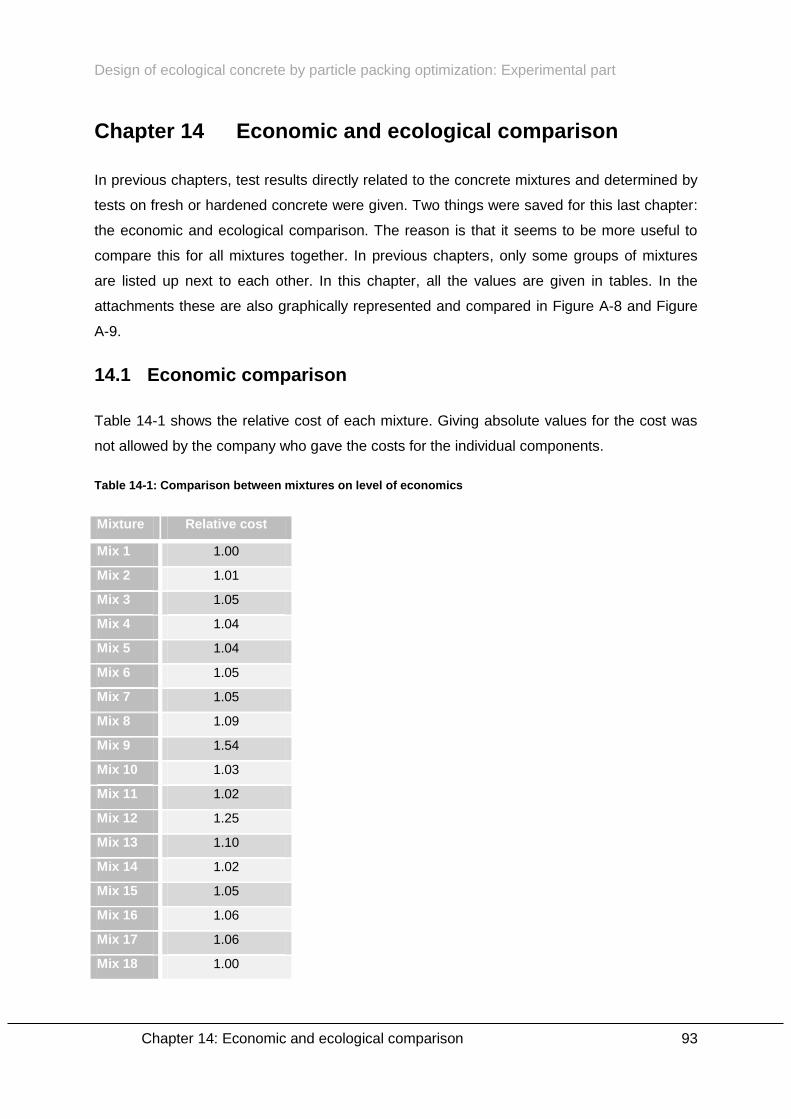
Design of ecological concrete by particle packing optimization: Experimental part
Chapter 14: Economic and ecological comparison 93
Chapter 14 Economic and ecological comparison
In previous chapters, test results directly related to the concrete mixtures and determined by
tests on fresh or hardened concrete were given. Two things were saved for this last chapter:
the economic and ecological comparison. The reason is that it seems to be more useful to
compare this for all mixtures together. In previous chapters, only some groups of mixtures
are listed up next to each other. In this chapter, all the values are given in tables. In the
attachments these are also graphically represented and compared in Figure A-8 and Figure
A-9.
14.1 Economic comparison
Table 14-1 shows the relative cost of each mixture. Giving absolute values for the cost was
not allowed by the company who gave the costs for the individual components.
Table 14-1: Comparison between mixtures on level of economics
Mixture Relative cost
Mix 1 1.00
Mix 2 1.01
Mix 3 1.05
Mix 4 1.04
Mix 5 1.04
Mix 6 1.05
Mix 7 1.05
Mix 8 1.09
Mix 9 1.54
Mix 10 1.03
Mix 11 1.02
Mix 12 1.25
Mix 13 1.10
Mix 14 1.02
Mix 15 1.05
Mix 16 1.06
Mix 17 1.06
Mix 18 1.00
Design of ecological concrete by particle packing optimization: Experimental part
Chapter 14: Economic and ecological comparison 94
Table 14-1 shows that no cheaper mixtures were produced during this optimization process.
Due to the optimization of the packing, the amount of the more expensive materials
increases (mix 1 until 4). In the next design step (mix 5 until 7), the amount of water is
decreased and compensated by an increased amount of aggregates. This also results in a
higher cost.
In the third and last design step (mix 8 until 14), a decrease of the cost is possible when the
cement replacing material is cheaper than the cement. For limestone powder (mix 10), fly
ash (mix 11) and replacement by an additional amount of aggregates (mix 14), this is the
case. Other materials, as quartz powder M800 (mix 9) and silica fume (mix 12) are far too
expensive in comparison to cement and results in a strong increase of the costs. Also
portaclay (mix 13) is expensive, but it was only used for a small part. The relative cost for the
individual components of the concrete, is shown in Table 1-2.
On the other hand it is also important to think about the durability. Reparations and
replacements have influences on the transport side. Also diversions have a high economic
impact [Denarié, E., Gabert, G. et al., 2013]. The impact of traffic and durability on the
economic and ecologic impact of concrete, should be investigated. The fact that traffic has
also an impact on the environment makes it complicated. An increased durability is of course
beneficial. This seems to be the case with the optimized mixtures.
14.2 Ecological comparison
The ecological comparison between the mixtures is quite easy, when Table 14-2 is
considered. All the mixtures part of design step 3, the reduction of the amount of cement,
have a lower value for the ECI than the other mixtures. In general, it seems that adjustments
on the level of the water content, or the level of the amount of aggregates (mix 1 unitl 7),
have a negligible influence.
In return, the small decrease of the cement content with 7.87 %, due to a gain of strength
with the same percentage at 7 days caused by the optimization process, result in a decrease
of 7 % of the ECI for mix 8 until 14. This is quite interesting on the level of decreasing the
ecological impact. A further research, resulting in a higher reduction of the cement content,
could be useful. The differences for the ECI between mix 8 until 14 are caused by the
different environmental impact of the cement replacement materials mentioned in Figure 1-8.
Also in the ecological comparison, the durability should be kept in mind. An improved
durability results in a longer service life time. In this thesis values for resistivity

Design of ecological concrete by particle packing optimization: Experimental part
Chapter 14: Economic and ecological comparison 95
measurements, and water absorption tests under vacuum, show that the durability should be
increased, by the optimization process. An increased durability and a longer service life
saves new raw materials. The lower the production of materials, the better for the
environment.
Table 14-2: Comparison between mixtures on level of ecologics
Mixture Absolute ECI [€/m³] Relative ECI
Mix 1 22.72 1.00
Mix 2 22.72 1.00
Mix 3 22.71 1.00
Mix 4 22.74 1.00
Mix 5 22.77 1.00
Mix 6 22.79 1.00
Mix 7 22.80 1.00
Mix 8 21.24 0.93
Mix 9 21.24 0.93
Mix 10 21.24 0.93
Mix 11 21.18 0.93
Mix 12 21.14 0.93
Mix 13 21.24 0.93
Mix 14 21.20 0.93
Mix 15 22.76 1.00
Mix 16 22.82 1.00
Mix 17 22.80 1.00
Mix 18 22.72 1.00
14.3 Combined cost
Attention should be paid to the fact that a gain of 7% on the ecological cost and an increase
of 2% on the economic cost could result in a total cost that is higher than the reference cost.
This is the case if the weight of the economic cost is higher than the weight of the ecological
cost. This is the case. The comparison of the values for the relative combined cost is given in
Table 14-3. This is also shown by Figure A-9.
From Table 14-1, it was already clear that the design of an ecological concrete does not
result in a cheaper concrete. On the other hand, maybe taking into account the cost to the
environment could make it cheaper in total. However, in Table 14-3 it is shown that this is
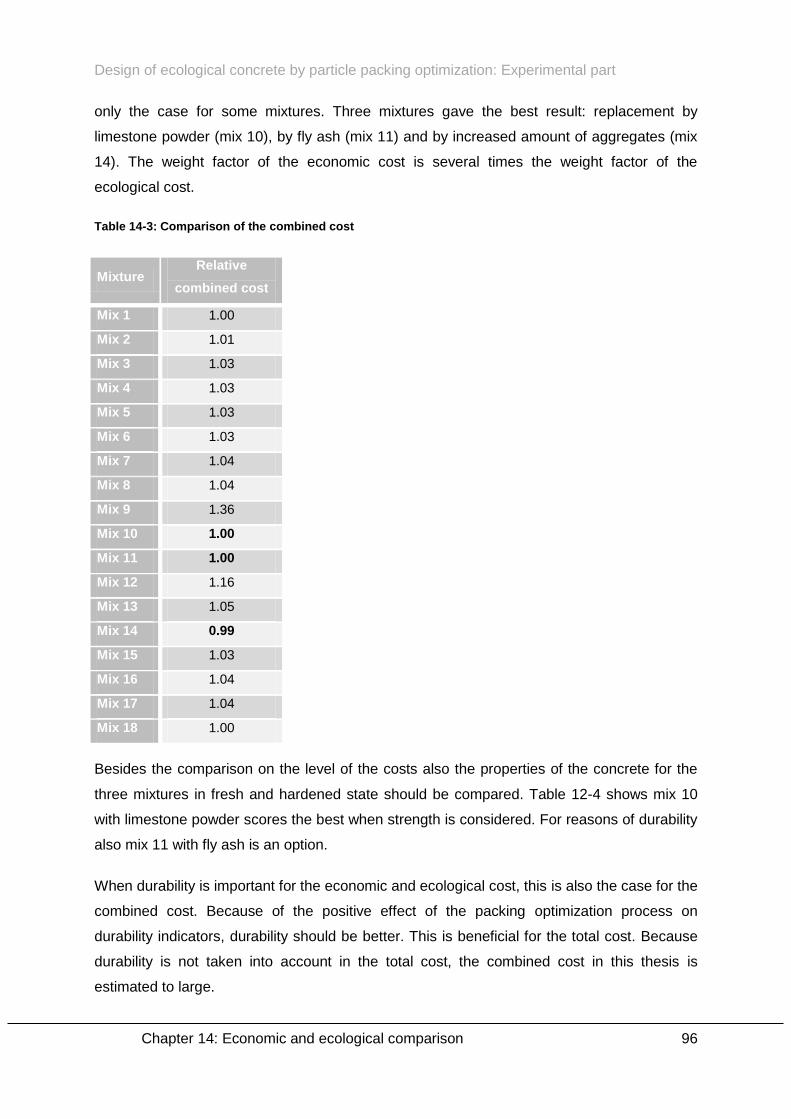
Design of ecological concrete by particle packing optimization: Experimental part
Chapter 14: Economic and ecological comparison 96
only the case for some mixtures. Three mixtures gave the best result: replacement by
limestone powder (mix 10), by fly ash (mix 11) and by increased amount of aggregates (mix
14). The weight factor of the economic cost is several times the weight factor of the
ecological cost.
Table 14-3: Comparison of the combined cost
Mixture Relative
combined cost
Mix 1 1.00
Mix 2 1.01
Mix 3 1.03
Mix 4 1.03
Mix 5 1.03
Mix 6 1.03
Mix 7 1.04
Mix 8 1.04
Mix 9 1.36
Mix 10 1.00
Mix 11 1.00
Mix 12 1.16
Mix 13 1.05
Mix 14 0.99
Mix 15 1.03
Mix 16 1.04
Mix 17 1.04
Mix 18 1.00
Besides the comparison on the level of the costs also the properties of the concrete for the
three mixtures in fresh and hardened state should be compared. Table 12-4 shows mix 10
with limestone powder scores the best when strength is considered. For reasons of durability
also mix 11 with fly ash is an option.
When durability is important for the economic and ecological cost, this is also the case for the
combined cost. Because of the positive effect of the packing optimization process on
durability indicators, durability should be better. This is beneficial for the total cost. Because
durability is not taken into account in the total cost, the combined cost in this thesis is
estimated to large.
Design of ecological concrete by particle packing optimization: Conclusions
97
Part III: Conclusions
In the last part the conclusions are collected in Chapter 15 and Chapter 16 gives some
recommendations for possible further research.
Design of ecological concrete by particle packing optimization: Conclusions
Chapter 15: Conclusions 98
Chapter 15 Conclusions
The general conclusion is that the applied design process to obtain an ecological concrete
with a lower cement works, even when the packing optimization is only applied on the
aggregates. The evaluation tool ‘Groen Beton’ shows that reducing the cement content is the
most efficient way in the design of ecological concrete.
In the first design step, an optimization of the packing results in a different aggregate
composition for the mixture. The influence of the increased packing was, as expected, an
increased workability of the mixture by a higher amount of excess water. On the other hand,
this results in a decrease of the strength and an increased value for the water absorption test
under vacuum, and a decreased value for the resistivity measurement.
In the next design step the workability was reduced to the workability of reference concrete.
According to the theory of Sonja Fennis, this should be possible, based on the ratio mix/ αt.
This was tested, but the mixture calculated with such an equal ratio as the reference
concrete gives a higher workability as was expected. However this theory does not result in a
mixture with the expected workability, the relation between mix/ αt and the value for the flow
was proven, based on a limited amount of tests. Decreasing the water content results, as
expected, in improved values for strength, water absorption and resistivity. This is because of
the decreasing amount of excess water.
In the third and last design step, the gain of strength was reduced by lowering the cement
content. This reduction was calculated based on a percentage, equivalent to the percentage
related to the gain of strength after 7 days, between the optimized and the reference mixture.
Different cement replacement materials were used. The way of calculating the reduction of
the cement content, results in a reduction of the strength which was slightly too high. This
was maybe related to the fact that the W/C ratio increases, due to the amount of water,
which was kept constant.
The optimized mixtures were about 7% more ecologic than the reference concrete while the
production cost only shows a small increase, depending on what cement replacement
material was used. Using the quartz powder M800 or silica fume results in mixtures with
good test results but also in a strong increase of the cost. The cost increased with both 54 %
and 25 %.
Design of ecological concrete by particle packing optimization: Conclusions
Chapter 15: Conclusions 99
On top of that, the mixture with silica fume has better properties, compared to the mixture
with quartz powder M800. Because of the cost and results for strength and durability, it
seems to be more interesting to use silica fume instead of quartz powder M800. Quartz
powder M400 results in an increase of the cost by 9 %.
Based on the cost, the mixture with limestone powder and fly ash give the best results, with
an increase of only 2 to 3 %. Their properties on level of strength and durability are
comparable with the reference concrete, which was the goal. Also the mixture without
cement replacement products and an increased amount of aggregates to replace the
decreased amount of cement was only 2 % more expensive. Because the properties in
hardened state were worse, the mixtures using limestone powder or fly ash seems to be the
most interesting.
On the other hand, the production cost is not the most important factor. When the
Environmental Cost Indicator was taken into account, the total costs of the three mixtures
mentioned in the paragraph above were the same or slightly lower compared to the cost for
the reference concrete. An increased durability is another beneficial effect on the total cost.
Durability indicators, such as the water absorption and the resistivity, show favorable
changes by designing an ecological concrete. The effect of a more durable mixture on the
total cost is not known, but it is sure it is beneficial. The question is how big the contribution
by the durability is, on the level of the cost.
The experiment with portaclay was interesting but it is not good for common application yet.
Due to the fact portaclay is not a common used product, the cost was very high. Due to the
water absorption it was only usable for a very low amount. The expected reaction between
the limestone powder and the portaclay was not noticed.
Besides this positive story also some remarks are posed. A first remark is the results for the
reference mixture when it was mixed with the vacuum mixer. However reasons were given to
explain the difference, this cause some uncertainty about the properties for the reference
mixture. A second remark is the failed optimization based on using a fine quartz sand (S90).
This was strange because the packing was improved by adding S90. Because no strength
increase was achieved, the optimization process was stopped. It is assumed this is related to
the low workability of the mixture. This could be caused by a strong increase of the specific
surface, due to the fineness of S90. This results in a higher water demand.
Design of ecological concrete by particle packing optimization: Conclusions
Chapter 16: Further research 100
Chapter 16 Further research
The results of this thesis open perspectives for further optimization. The reduction of the
amount of cement with 8%, results in a reduction of the ECI with 7%. The relation between
the environment and the use of cement is clear. Certainly, it is worth trying to optimize the
design of an ecological concrete further.
A continuation of this thesis should start with a confirmation of the test results for the
reference mixture, when it is mixed according to the normal procedure, and when it is mixed
by the vacuum mixer. Those results are too different to neglect this. In general, this could be
extended in research about the influence of the mixing procedure on the optimization
process.
Another interesting mixture to produce is a mixture where the aggregate composition is
determined by an optimization according to an optimization curve, as the Fuller curve. With
the method of the least squares, it is possible to approximate such a curve. The mixture with
optimized according to the packing theory could be compared with the mixture optimized
according the optimization curve. This could give interesting information about the difference
between both ways of determining the aggregate composition. This idea came too late to
execute it in this thesis.
Further on, this optimization procedure should be tested on big scale with different and
especially other reference mixtures. This could check if results and conclusions from this
thesis are always the case or not.
Doing tests in other regions of workability could also result in interesting information. Now the
reference mixture does not have a high workability. This results in mixtures that were often to
dry. By setting another standard of workability this problem is avoided.
Also about the cement replacement products, further research is necessary. Their influence
was only tested on one mixture. This is not sufficient. More tests on the same cement
replacement products seem to be more interesting than testing other cement replacement
products. This is due to the fact that already many cement replacement products were used.
About the portaclay further research is necessary, in order to limit its water absorption. An
increased use of clayey materials should result in a strongly decrease of the cost of the
material, because of the high amounts of clayey materials present in our environment.
Design of ecological concrete by particle packing optimization: Conclusions
Chapter 16: Further research 101
To investigate the environmental benefits and the overall cost, including life time cycle
analysis, a study about the sustainability could be useful. This coud go very wide. Even traffic
and diversions due to roadworks, caused by less durable concrete, should be taken into
account. Traffic influences strongly our environment. Combining packing optimization, the
use of recycled aggregates and recycled cement, an increased workability and other ideas to
reduce the environmental impact of concrete is the future.
Besides the extension of the research in this thesis, other slightly different optimization
methods should be taken into account. There are several possibilities.
First of all, based on the results of this thesis, it seems to be useful to take into account the
packing of the total amount of solids as Sonja Fennis did. Because of the limited time in this
thesis only the limestone aggregates and sands were optimized on the level of packing. By
taking into account also cement and cement replacement materials for the packing, it will be
more realistic. On the other hand, this will result in a more iterative process of optimization.
The reduction of cement by a cement replacement material will not be the final step but an
intermediate step in the design. That replacement will influence the packing and the
optimization could start again.
Secondly, changes in the way in how the research was done in this thesis are possible. In
the third design step, when the amount of cement reduces, the amount of water was kept
constant. This results in an increased W/C ratio. All the optimized mixtures had a little less
strength than the reference mixture, and a little increased workability. Also reducing the
water content, together with the cement content, could be the solution.
Al these ideas should result in a general accepted way of thinking of optimizing concrete
mixtures according to the principles of packing. This reduces the amount of cement and the
environmental impact of concrete consumption and production. Further research should also
make it possible to replace more cement by less polluting materials. This should result in a
higher environmental improvement. The higher the possible improvement, the more chance
that this way of thinking becomes the standard way of designing concrete!
Design of ecological concrete by particle packing optimization: Conclusions
References 102
References
Andreasen, A.H.M. & Andersen, J. (1930). Über die beziehung zwischen Kornabstufung und
Zwischenraum in Produckten aus losen Körnern (mit einigen Experimenten). Colloid &
Polymer Sciense, 50, nr. 3, pp. 217-228.
Antoni, M. & Martirena, F. & Rossen, J. & Scrivener, K. (2012). Cement substitution by a
combination of metakaolin and limestone. Cement and Concrete Research – Elsevier, 42,
pp. 1579-1589.
Audenaert, K & De Schutter, G. (2004). Evaluation of water absorption of concrete as a
measure for resistance against carbonation and chloride migration. Materials and Structures,
37, nr. 11, pp 591-596.
Ballieu, P. & Simpelaere, M. (2013). Invloed van de zandkarakteristieken op de
verwerkbaarheid van vers beton. Masterthesis, KaHo Sint-Lieven, Opleiding Bouwkunde.
Beirnaert, A. & Ringoot, N. (2015). High quality recycling of bottom ashes. Masterthesis,
University of Ghent, Faculty of Engineering and Architecture.
Belgische BetonGroepering (2009). Betontechnologie. Dilbeek: De Bouwkroniek.
Bosmans, T. & Van Der Putten, J. (2014). Opstellen van interactiekrommen ter verificatie van
het compressible packing model. Masterthesis, Universiteit Gent, Faculteit
Ingenieurswetenschappen en Architectuur.
Breye, S. & De Vos, B. (2013). Optimalisatie van de samenstelling van ultra hoge sterkte
beton. Masterthesis, Universiteit Gent, Faculteit Ingenieurswetenschappen en Architectuur.
Chandra Sekhara Reddy, T. & Elumalai, J.K. (2014). Study of macro mechanical properties
of ultra high strength concrete using quartz sand and silica fume. International Journal of
Research in Engineering and Technology, 3, nr. 9, pp. 391-396.
Craenen, E. (2013). Duurzaamheidsaspecten van ultra hogesterktebeton. Masterthesis,
Universiteit Gent, Faculteit Ingenieurswetenschappen en Architectuur.

Design of ecological concrete by particle packing optimization: Conclusions
References 103
De Belie, N. & De Schepper, M. & Van den Heede, P. & Windels, C. (2011). Life cycle
assessment of completely recyclable concrete. Non-Traditional Cement & Concrete,
Proceedings. p.67-76.
De Larrard, F. (1999). Concrete mixture proportioning: a scientific approach. Londen,
Verenigd Koninkrijk: Routledge, Taylor & Francis Group.
De Schepper, M. (2014). Concrete for a More Environment-Friendly Construction. PhD,
University of Ghent, Faculty of Engineering and Architecture.
Denarié, E. & Habert, G. & Rossi, P. & Sajina, A. (2013). Lowering the global warming
impact of bridge rehabilitations by using Ultra High Performance Fibre Reinforced Concretes.
Cement and Concrete Composites, 38, nr. 4, pp. 1-11.
Dewar, J.D. (1999). Computer Modelling of Concrete Mixtures. Londen. E & FN Spon.
Dils, J. (2015). Influence of Vacuum Mixing, Air Entrainment or Heat Curing on the Properties
of Hardened and Fresh (Ultra) High Performance Mortar. PhD, University of Ghent, Faculty
of Engineering and Architecture.
Fennis, S.A.A.M. (2010). Design of Ecological Concrete by Particle Packing Optimization.
PhD, Technical University of Delft, Faculty of Civil Engineering and Geosciences.
Fethullah, C. & Tarun Naik, R. & Yoon-moon, C. (2003). Limestone powder use in cement
and concrete. Draft report center for by-products utilization. University of Wisconsin.
Milwaukee.
Fuller, W.B. & Thompson, S.E. (1907). The laws of proportioning concrete. ASCE J.
Transport, 59, pp. 67-143.
Gruber, M. & Lesti, M. & Plank, J. & Schroefl, C. & Sieber, R. (2008). Effectiveness of
Polycarboxylate Superplasticizers in Ultra-High Strength Concrete: The Importance of PCE
Compatibility with Silica Fume. Journal of Advanced Concrete Technology, 7, nr. 1, pp. 5-12.
Justice, J. M. (2005). Evaluation of metakaolins for use as supplementary cementitious
materials. Masterthesis. Georgia Institute of Technology.
Kwan, A.K.H & Moa, C.F. (2001). Effects of various shape parameters on packing of
aggregate particles. Magazine of Concrete Research, 53 (2), pp. 91-100.
Design of ecological concrete by particle packing optimization: Conclusions
References 104
Langley, W.S. & Mehta, P.K. (2000). Monolith Foundation: Built to last a 1000 years.
Concrete International, 22 (7), pp. 27-32.
Malvern (2014). Dynamic Light Scattering: An Introduction in 30 minutes – Technical Note
version 4. Consulted on May 4th 2015 via http://www.malvern.com/en/support/resource-
center/technical-notes/TN101104DynamicLightScatteringIntroduction.aspx
Mehta, P. K. (2001). Reducing the Environmental Impact of Concrete. Concrete International,
23, nr. 10. pp. 61-66.
Mehta, P. K. (2002). Greening of the Concrete Industry for Sustainable Development.
Concrete International, 24, nr. 7. pp. 23-28.
Pawan Kumar, P. & Vipul Naidu, P. (2014). Replacement of Cement in Concrete.
International Journal of Environmental Research and Development, 4, nr. 1, pp. 91-98.
Ployaert, D. (2009). Duurzaam beton door beheersing van de waterabsorptie. Technologie –
Febelcem, November 2009.
Pratanu, G. & Quang, Tran. (2014). Correlation between bulk and surface resistivity of
concrete. International Journal of Concrete Structures and Materials, 9, nr. 1, pp. 119-132.
Repisod Family. (2013). Operating Instructions Concrete Durability Testing. Proceq.
Consulted on December 13th 2015 via http://www.proceq.com/fileadmin/documents/
proceq/products/Concrete/Resipod/English/resipod_family_OI_E_2013.01.07_low.pdf
SGS Intron B.V. (2013). Handleiding CUR Rekentool Groen Beton. Consulted on February
27th 2015 via http://www.sbrcurnet.nl/producten/publicaties/ontwerptool-groen-beton
The Cement Sustainability Initiative (2009). Recycling Concrete. World Business Council for
Sustainable Development. Consulted on October 26th 2014 via
http://www.wbcsdcement.org/pdf/CSI-RecyclingConcrete-FullReport.pdf
Zhan, S. P. & Zong, L. (2014). Evaluation of Relationship between Water Absorption and
Durability of Concrete Materials. Hindawi Publishing Corporation – Advances in Materials
Science and Angineering. Consulted on February 15th via
http://www.hindawi.com/journals/amse/2014/650373/

Design of ecological concrete by particle packing optimization: Conclusions
List of norms 105
Norms
NBN B24-213:1976 Masonry units testing - Water absorption under vacuum
NBN B15-215:1989 Concrete testing - Absorption of water by immersion
NBN EN 933-1:2012 Tests for geometrical properties of aggregates - Part 1:
Determination of particle size distribution - Sieving method
NBN EN 1097-3:1998 Tests for mechanical and physical properties of aggregates -
Part 3: Determination of loose bulk density and voids
NBN EN 1097-6:2013 Tests for mechanical and physical properties of aggregates -
Part 6: Determination of particle density and water absorption
NBN EN 12350-2:2009 Testing fresh concrete - Part 2: Slump-test
NBN EN 12350-5:2009 Testing fresh concrete - Part 5: Flow table test
NBN EN 12350-6:2009 Testing fresh concrete - Part 6: Density
NBN EN 12350-7:2009 Testing fresh concrete - Part 7: Air content - Pressure methods
NBN EN 12390-3:2009 Testing hardened concrete - Part 3: Compressive strength of
test specimens (+ AC:2011)

Design of ecological concrete by particle packing optimization: Attachments
Attachments 106
Attachments
The attachments consist of 2 big parts. First all the data about the produced mixtures is
summarized in tables: the mixture compositions and the test results. Further on some figures
compares all test results graphically and contain also standard deviations for the tests on
concrete cubes. The second part of the attachments contains all technical datasheets from
the used materials.
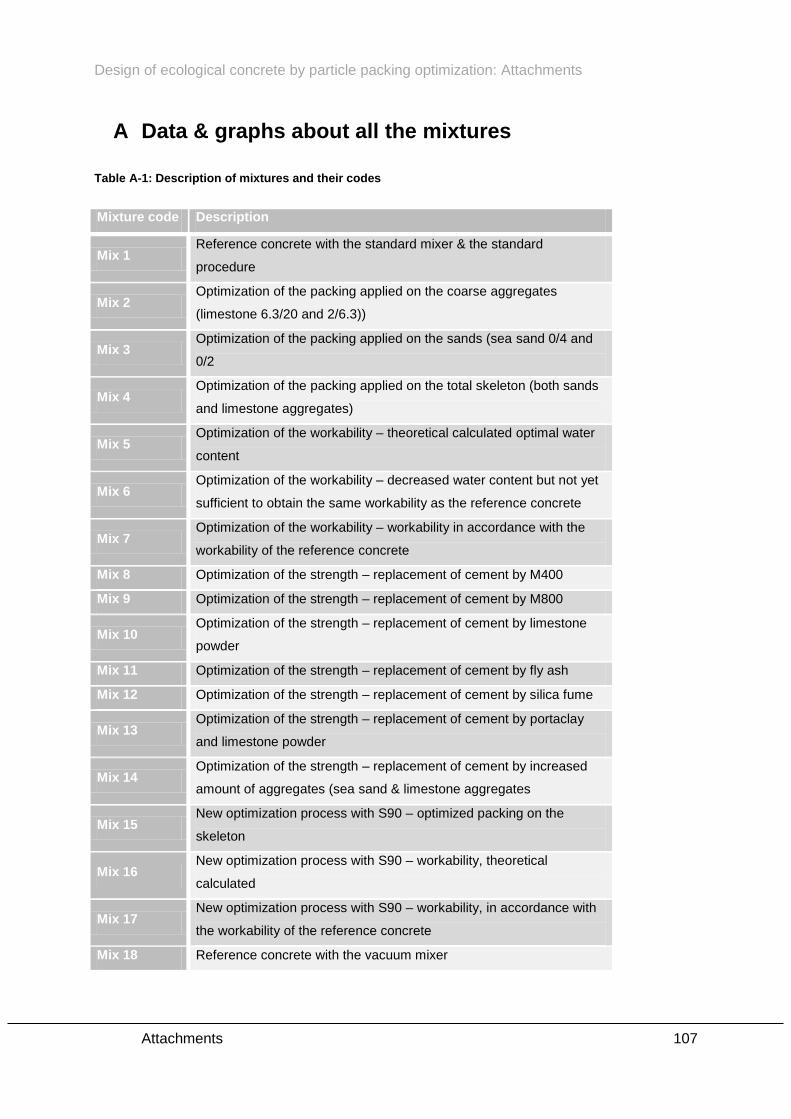
Design of ecological concrete by particle packing optimization: Attachments
Attachments 107
A Data & graphs about all the mixtures
Table A-1: Description of mixtures and their codes
Mixture code Description
Mix 1 Reference concrete with the standard mixer & the standard
procedure
Mix 2 Optimization of the packing applied on the coarse aggregates
(limestone 6.3/20 and 2/6.3))
Mix 3 Optimization of the packing applied on the sands (sea sand 0/4 and
0/2
Mix 4 Optimization of the packing applied on the total skeleton (both sands
and limestone aggregates)
Mix 5 Optimization of the workability – theoretical calculated optimal water
content
Mix 6 Optimization of the workability – decreased water content but not yet
sufficient to obtain the same workability as the reference concrete
Mix 7 Optimization of the workability – workability in accordance with the
workability of the reference concrete
Mix 8 Optimization of the strength – replacement of cement by M400
Mix 9 Optimization of the strength – replacement of cement by M800
Mix 10 Optimization of the strength – replacement of cement by limestone
powder
Mix 11 Optimization of the strength – replacement of cement by fly ash
Mix 12 Optimization of the strength – replacement of cement by silica fume
Mix 13 Optimization of the strength – replacement of cement by portaclay
and limestone powder
Mix 14 Optimization of the strength – replacement of cement by increased
amount of aggregates (sea sand & limestone aggregates
Mix 15 New optimization process with S90 – optimized packing on the
skeleton
Mix 16 New optimization process with S90 – workability, theoretical
calculated
Mix 17 New optimization process with S90 – workability, in accordance with
the workability of the reference concrete
Mix 18 Reference concrete with the vacuum mixer
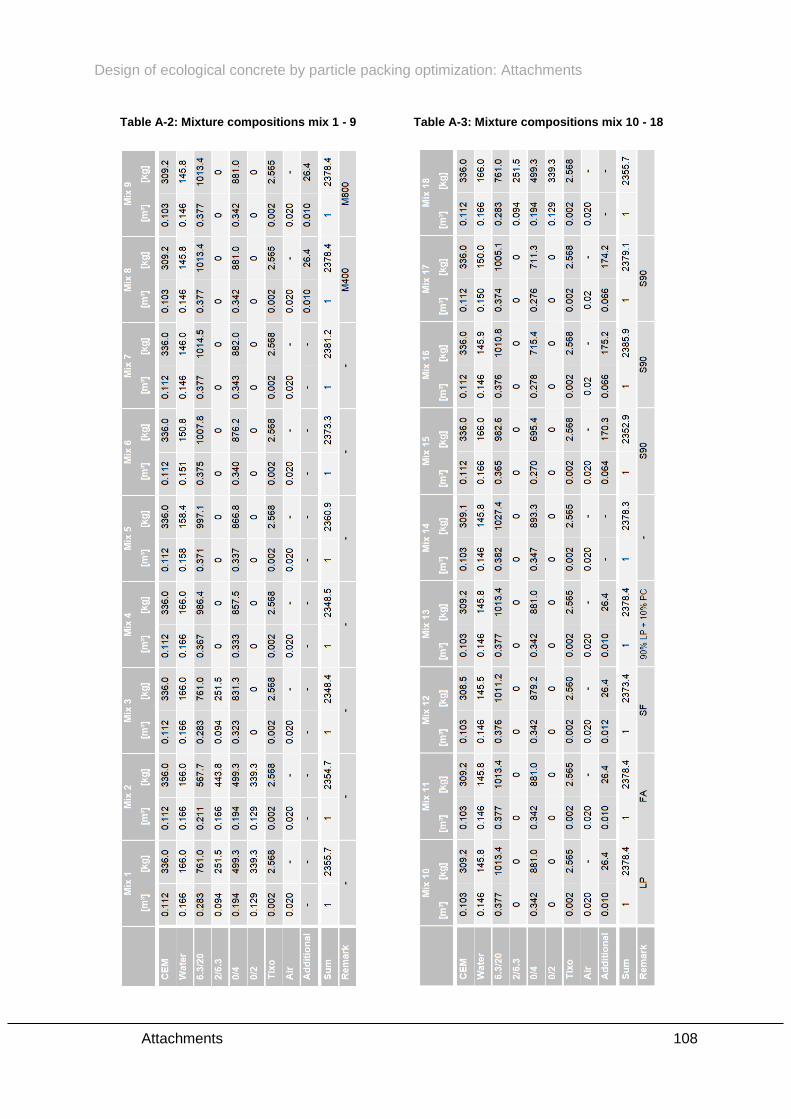
Design of ecological concrete by particle packing optimization: Attachments
Attachments 108
Table A-2: Mixture compositions mix 1 - 9 Table A-3: Mixture compositions mix 10 - 18
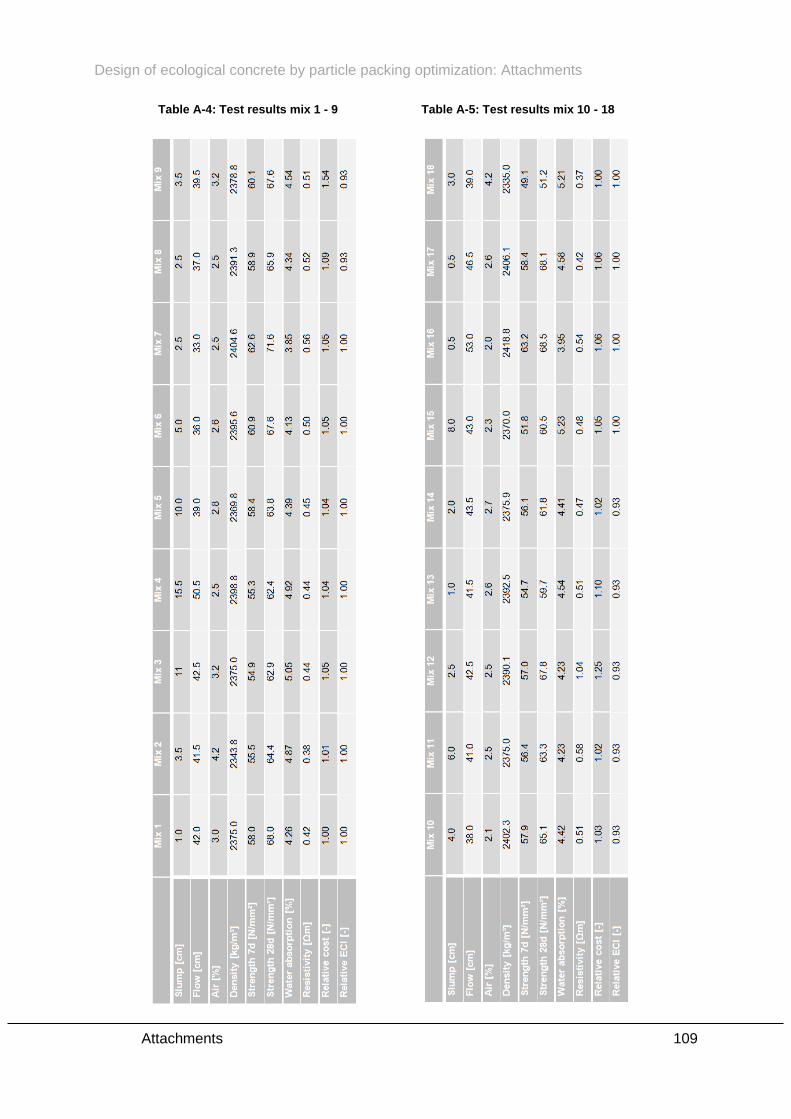
Design of ecological concrete by particle packing optimization: Attachments
Attachments 109
Table A-4: Test results mix 1 - 9 Table A-5: Test results mix 10 - 18

Design of ecological concrete by particle packing optimization: Attachments
Attachments 110
Figure A-1: Comparison strength on 7 and 28 days
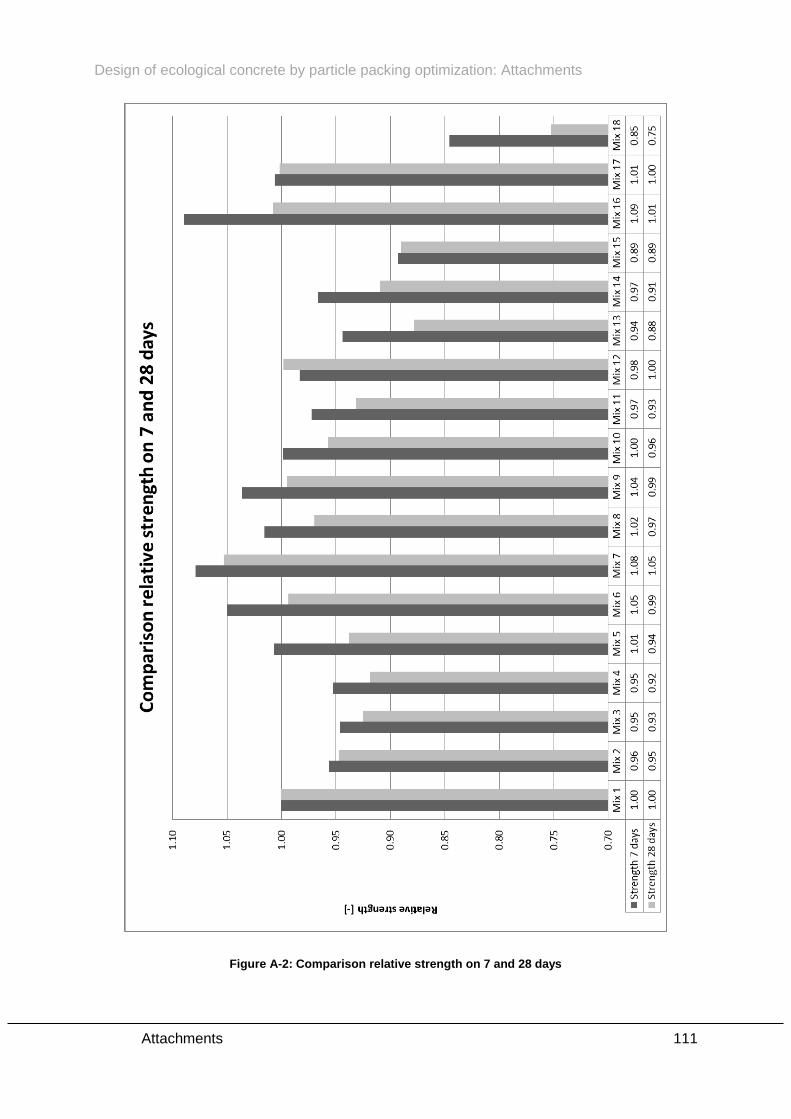
Design of ecological concrete by particle packing optimization: Attachments
Attachments 111
Figure A-2: Comparison relative strength on 7 and 28 days

Design of ecological concrete by particle packing optimization: Attachments
Attachments 112
Figure A-3: Comparison strength increase

Design of ecological concrete by particle packing optimization: Attachments
Attachments 113
Figure A-4: Comparison water absorption

Design of ecological concrete by particle packing optimization: Attachments
Attachments 114
Figure A-5: Relative comparison water absorption
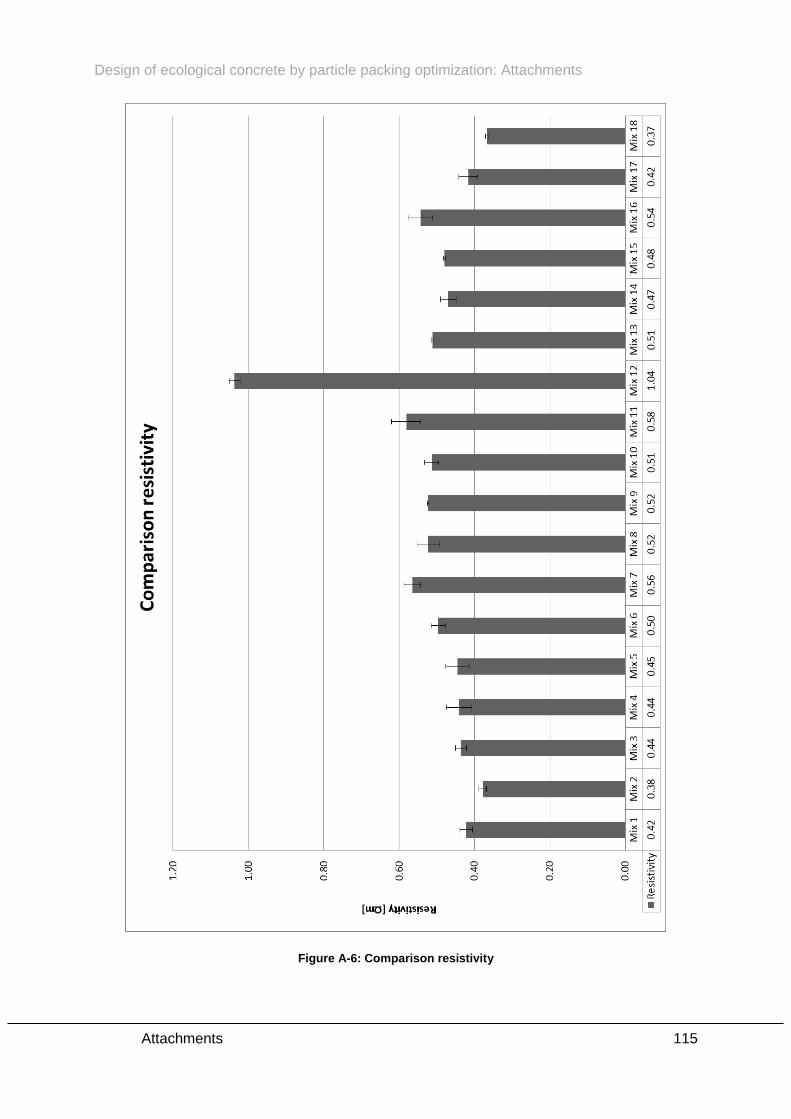
Design of ecological concrete by particle packing optimization: Attachments
Attachments 115
Figure A-6: Comparison resistivity
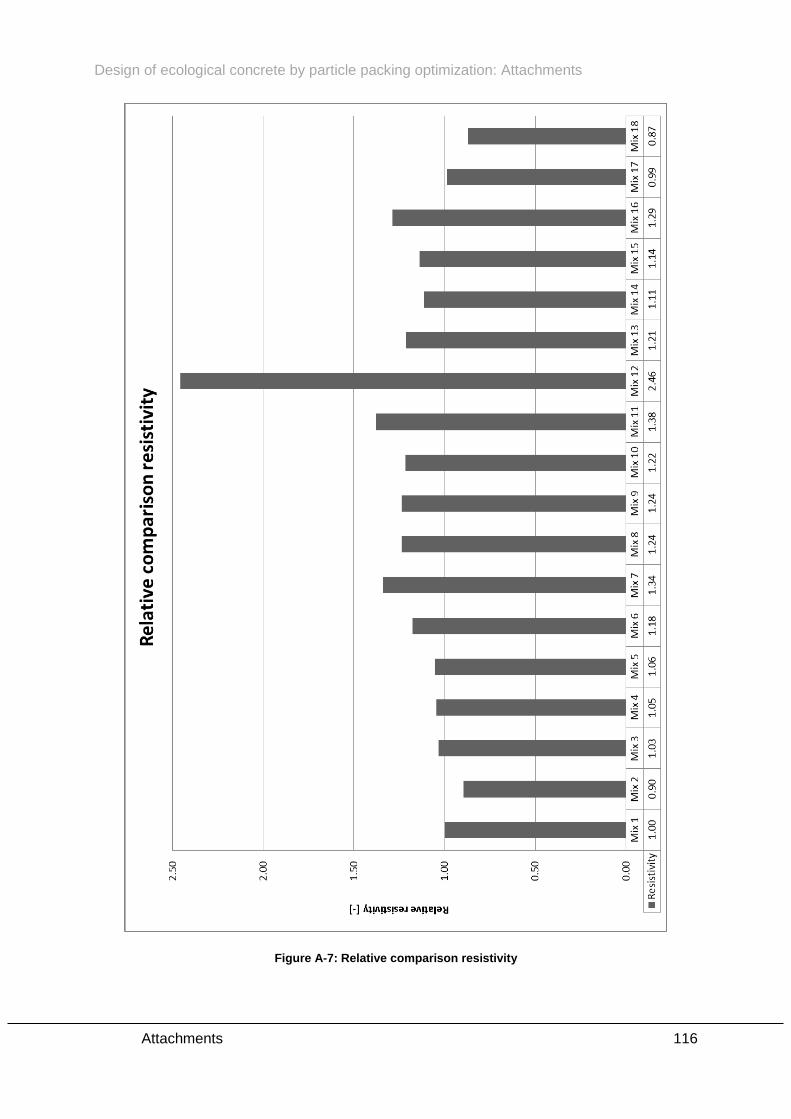
Design of ecological concrete by particle packing optimization: Attachments
Attachments 116
Figure A-7: Relative comparison resistivity
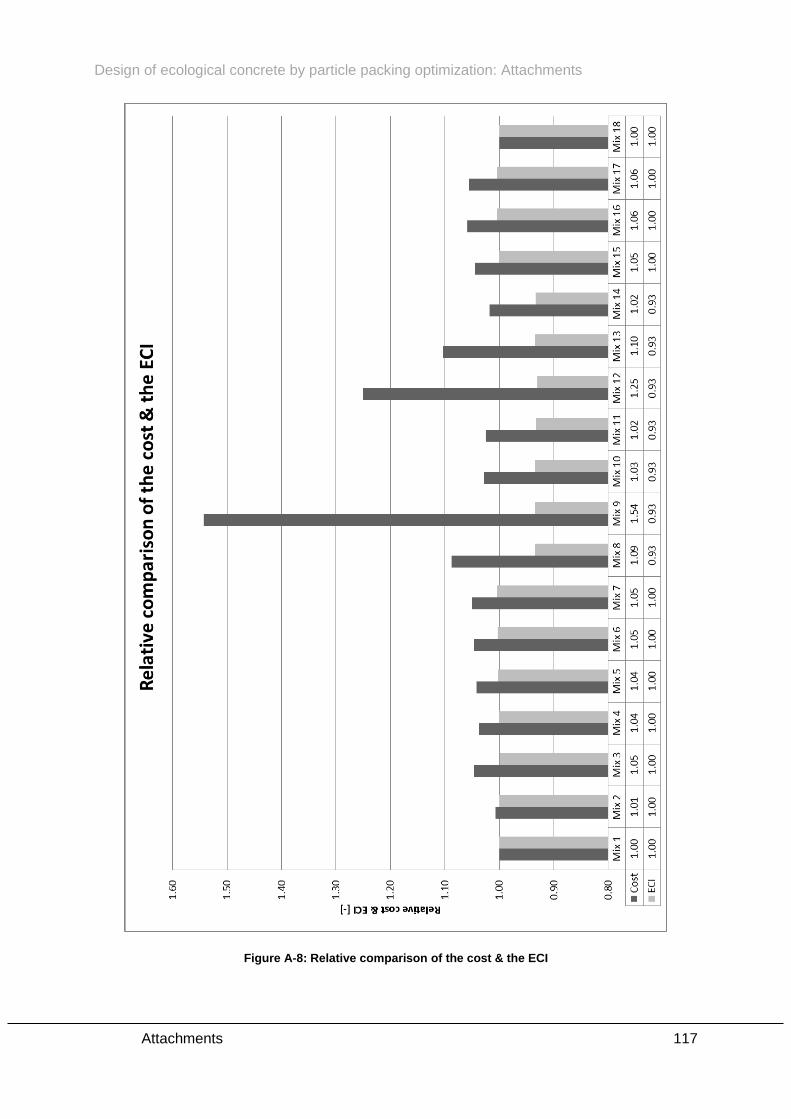
Design of ecological concrete by particle packing optimization: Attachments
Attachments 117
Figure A-8: Relative comparison of the cost & the ECI

Design of ecological concrete by particle packing optimization: Attachments
Attachments 118
Figure A-9: Relative comparison of the sum of the cost and the ECI
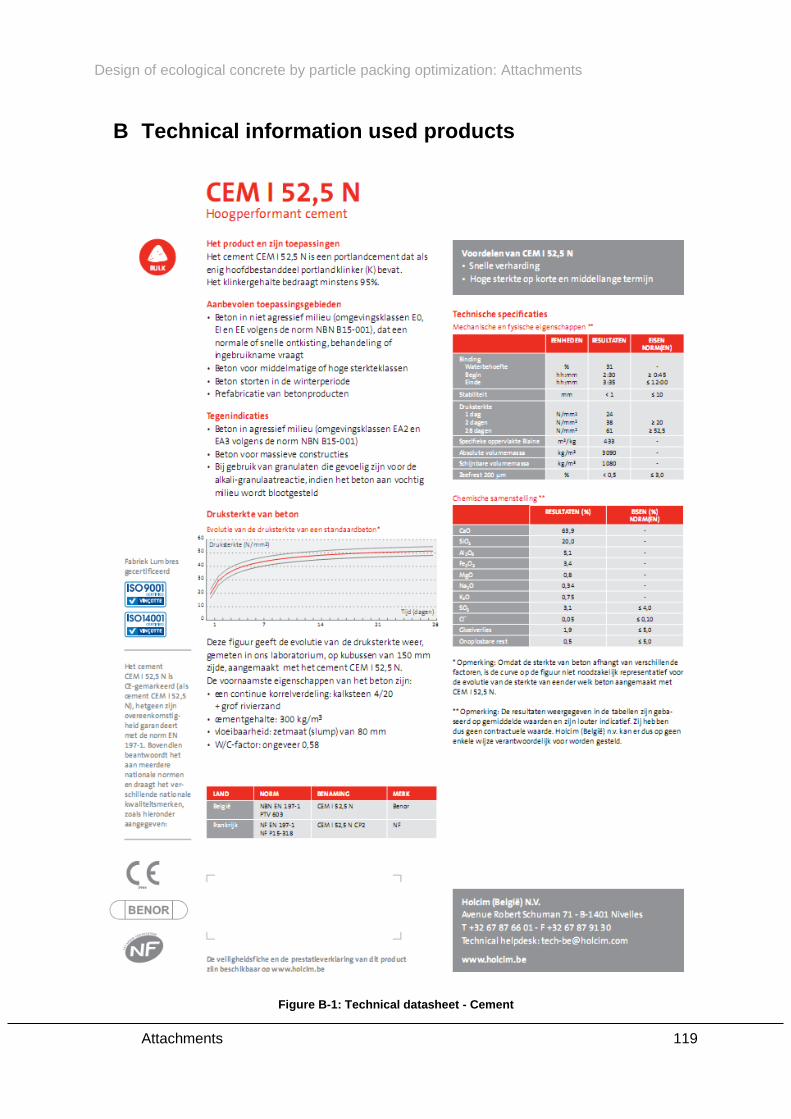
Design of ecological concrete by particle packing optimization: Attachments
Attachments 119
B Technical information used products
Figure B-1: Technical datasheet - Cement
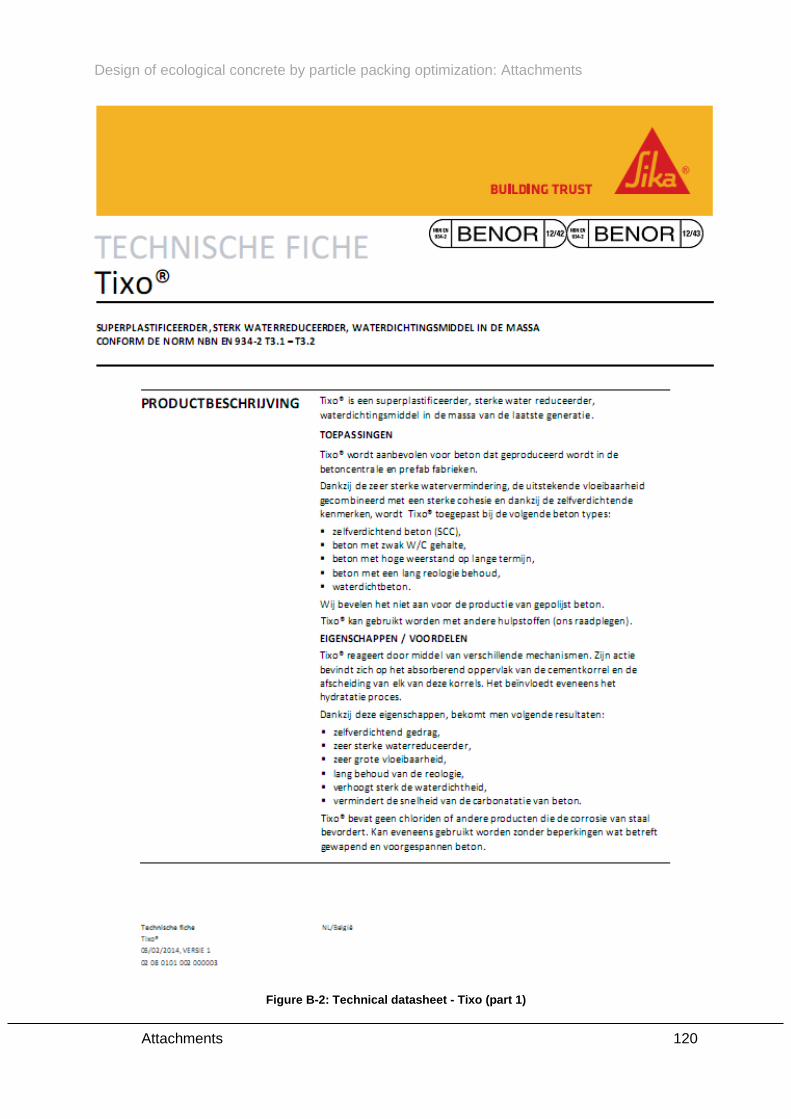
Design of ecological concrete by particle packing optimization: Attachments
Attachments 120
Figure B-2: Technical datasheet - Tixo (part 1)
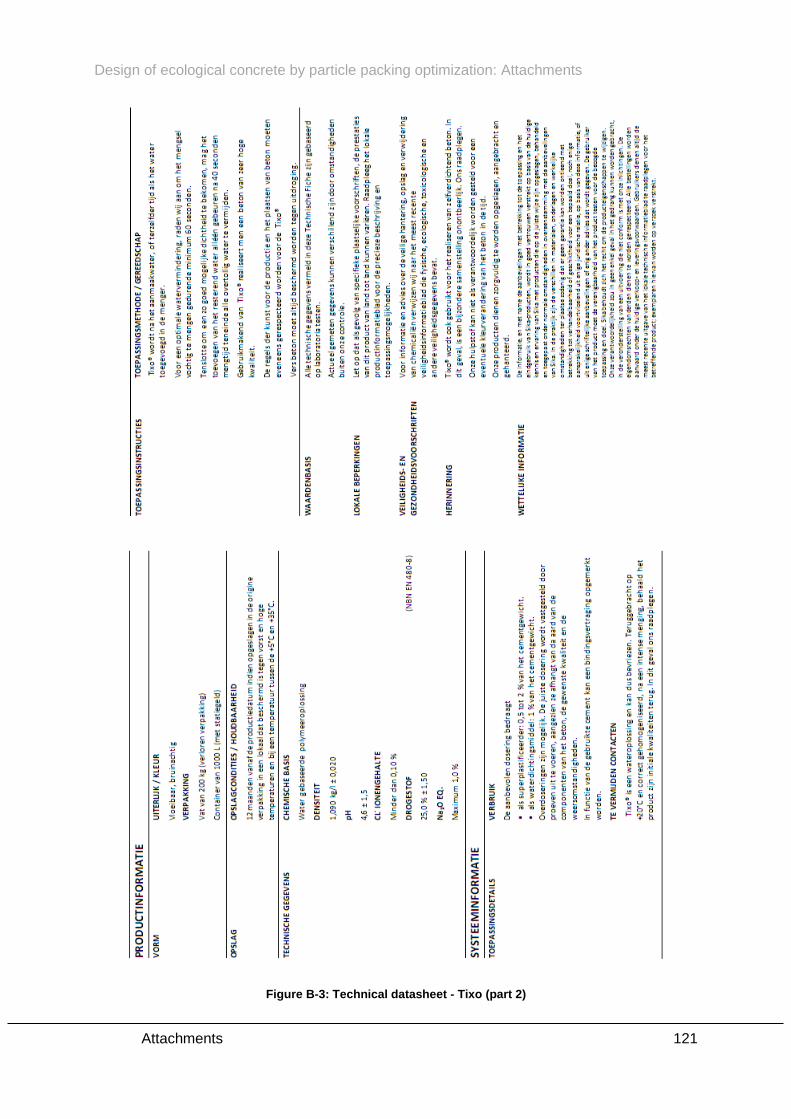
Design of ecological concrete by particle packing optimization: Attachments
Attachments 121
Figure B-3: Technical datasheet - Tixo (part 2)
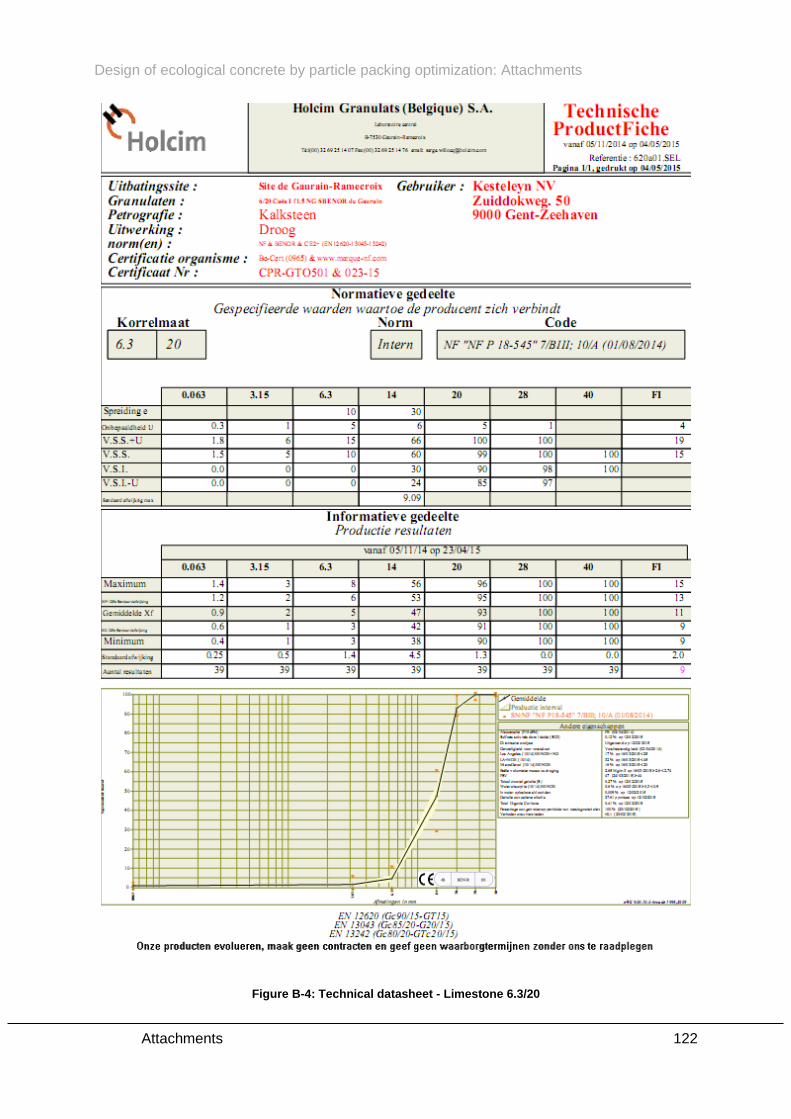
Design of ecological concrete by particle packing optimization: Attachments
Attachments 122
Figure B-4: Technical datasheet - Limestone 6.3/20
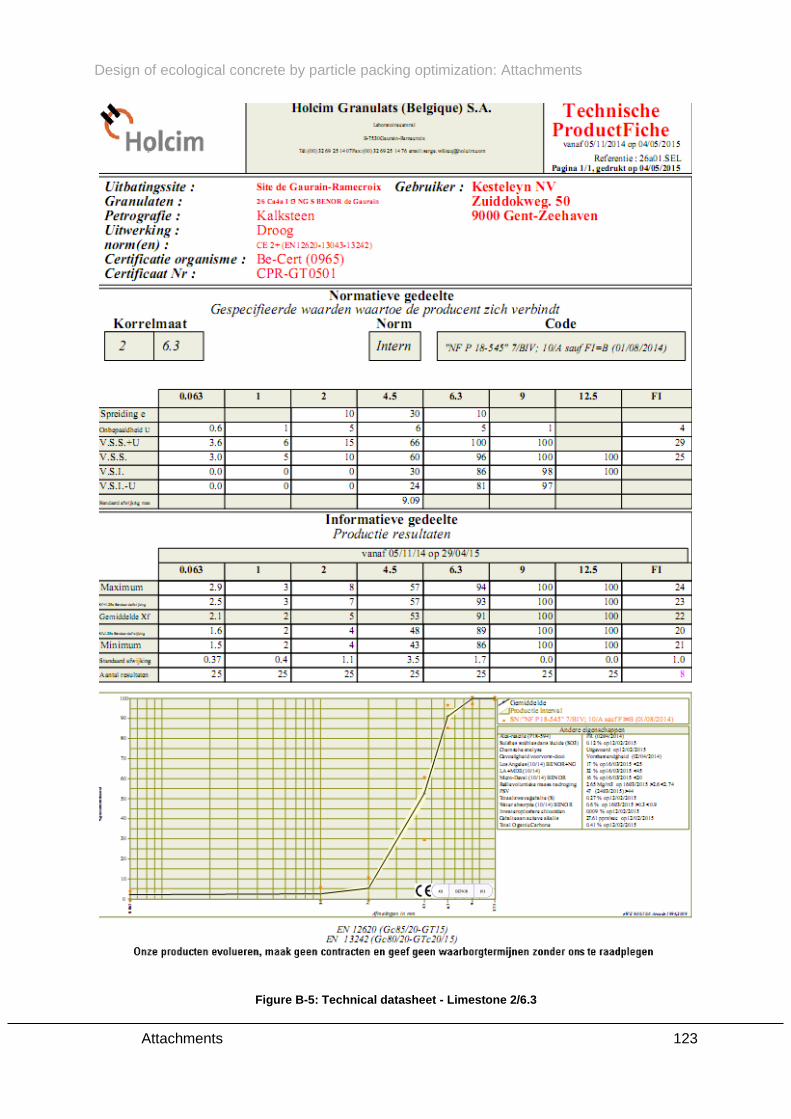
Design of ecological concrete by particle packing optimization: Attachments
Attachments 123
Figure B-5: Technical datasheet - Limestone 2/6.3
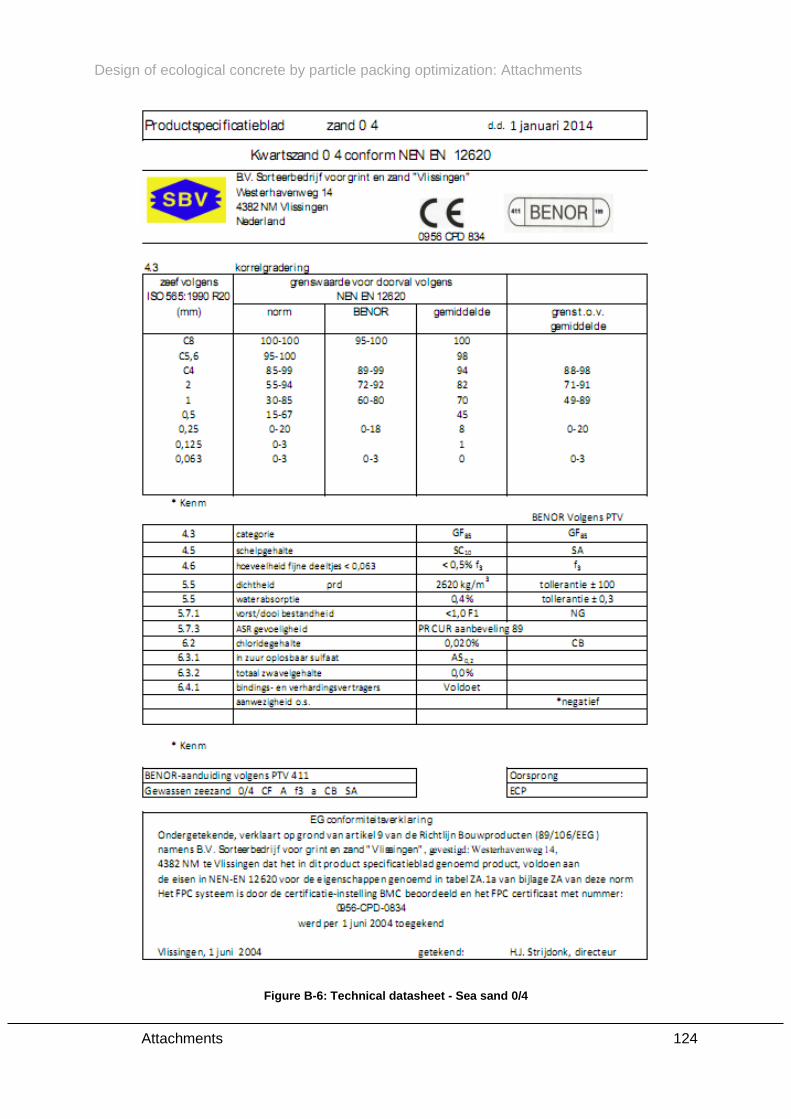
Design of ecological concrete by particle packing optimization: Attachments
Attachments 124
Figure B-6: Technical datasheet - Sea sand 0/4

Design of ecological concrete by particle packing optimization: Attachments
Attachments 125
Figure B-7: Technical datasheet - Sea sand 0/2
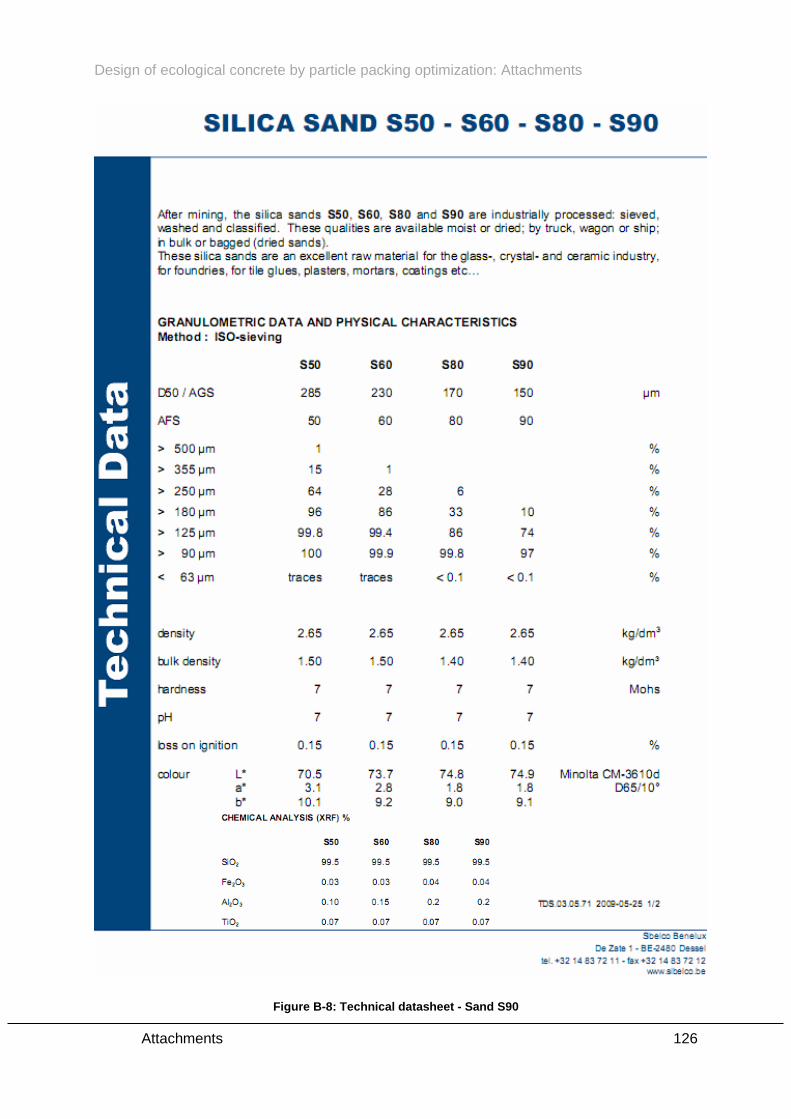
Design of ecological concrete by particle packing optimization: Attachments
Attachments 126
Figure B-8: Technical datasheet - Sand S90
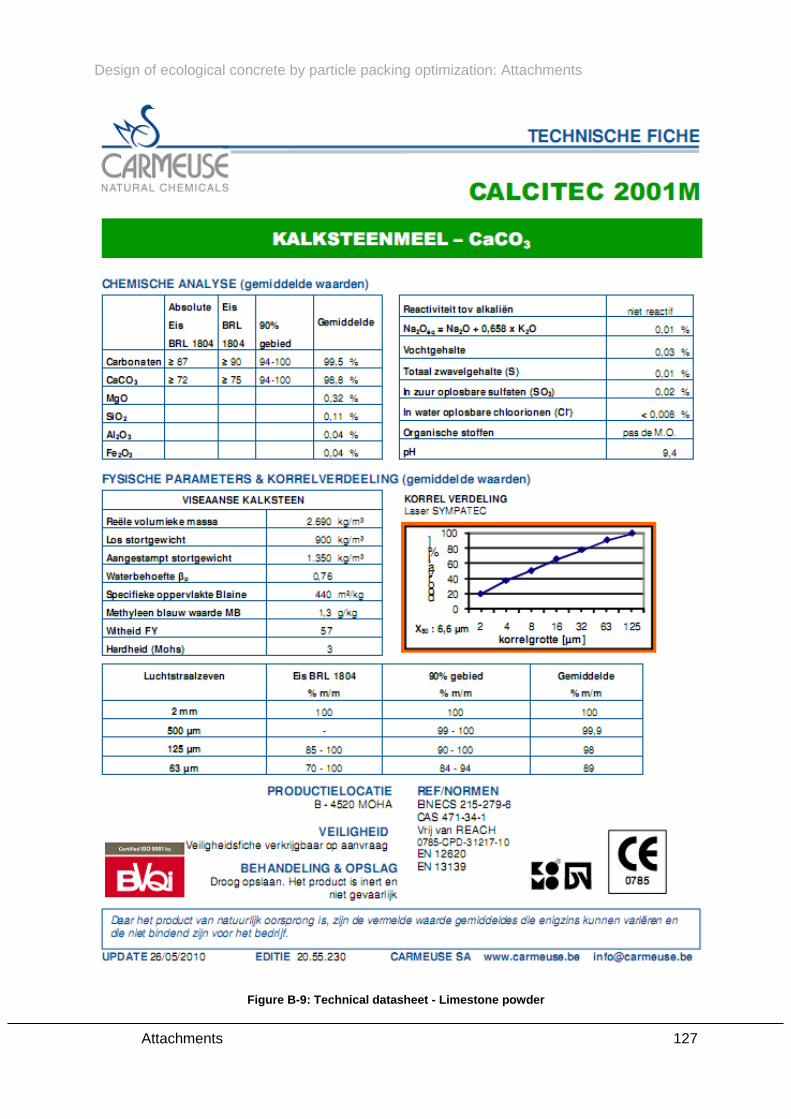
Design of ecological concrete by particle packing optimization: Attachments
Attachments 127
Figure B-9: Technical datasheet - Limestone powder
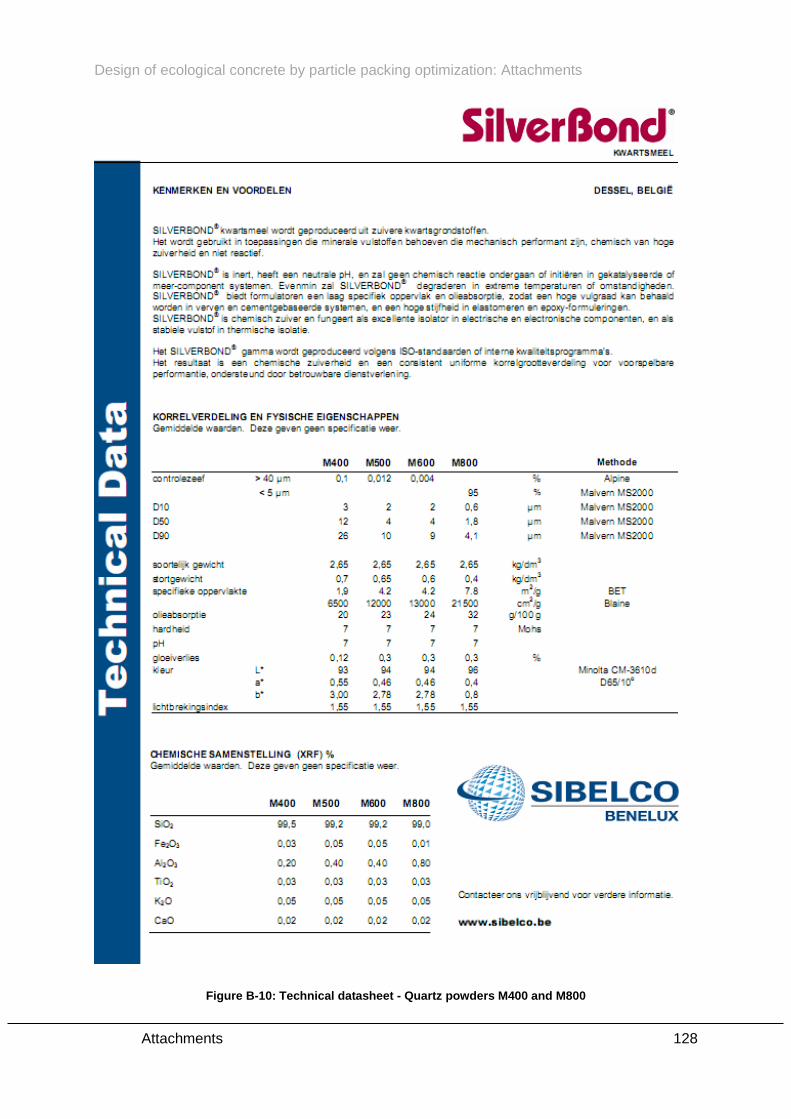
Design of ecological concrete by particle packing optimization: Attachments
Attachments 128
Figure B-10: Technical datasheet - Quartz powders M400 and M800
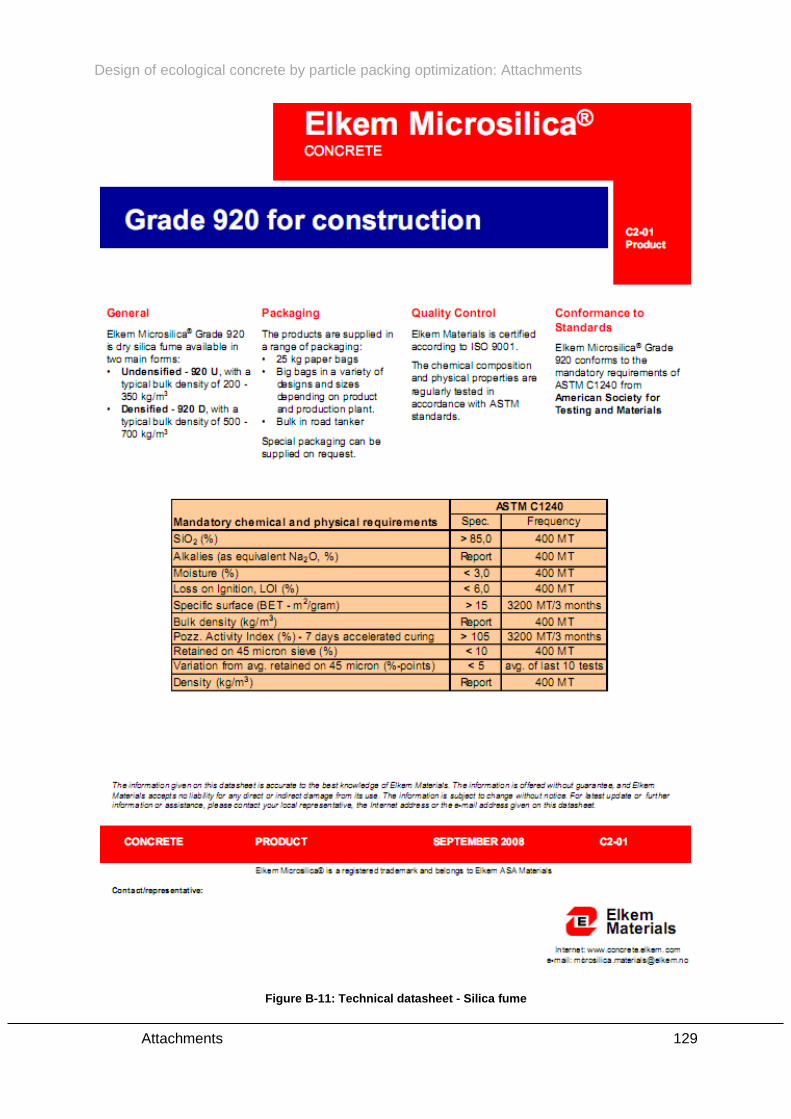
Design of ecological concrete by particle packing optimization: Attachments
Attachments 129
Figure B-11: Technical datasheet - Silica fume
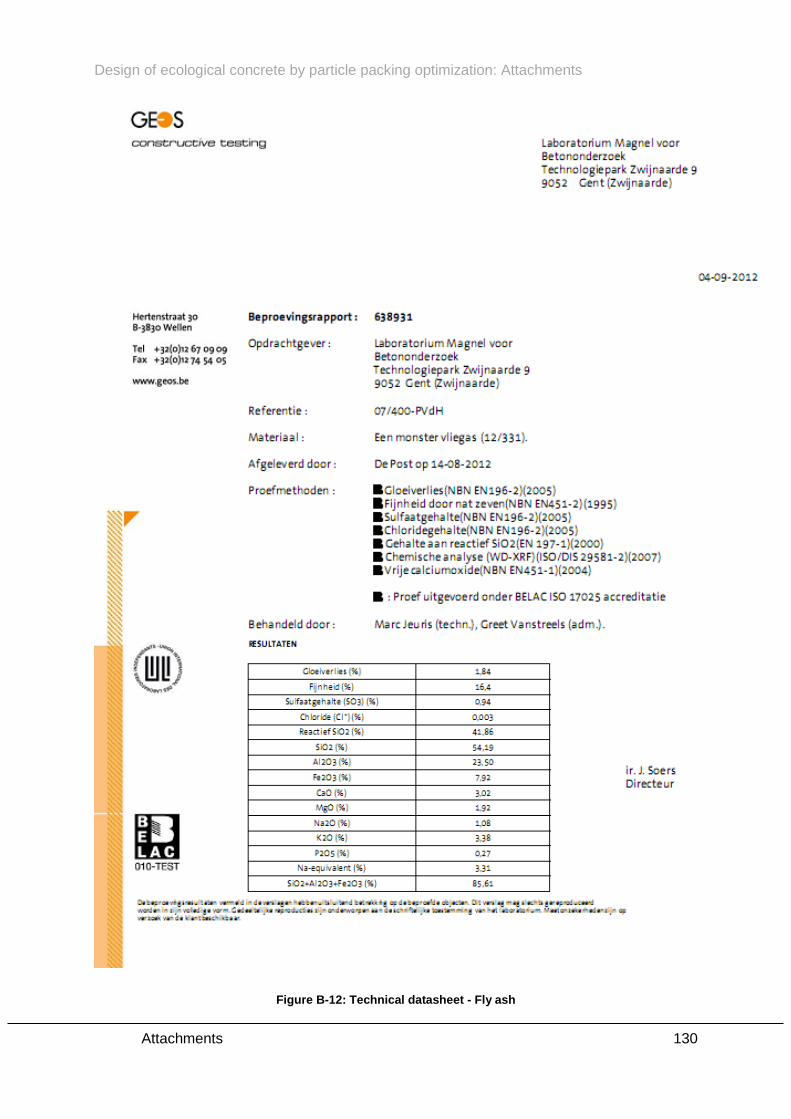
Design of ecological concrete by particle packing optimization: Attachments
Attachments 130
Figure B-12: Technical datasheet - Fly ash
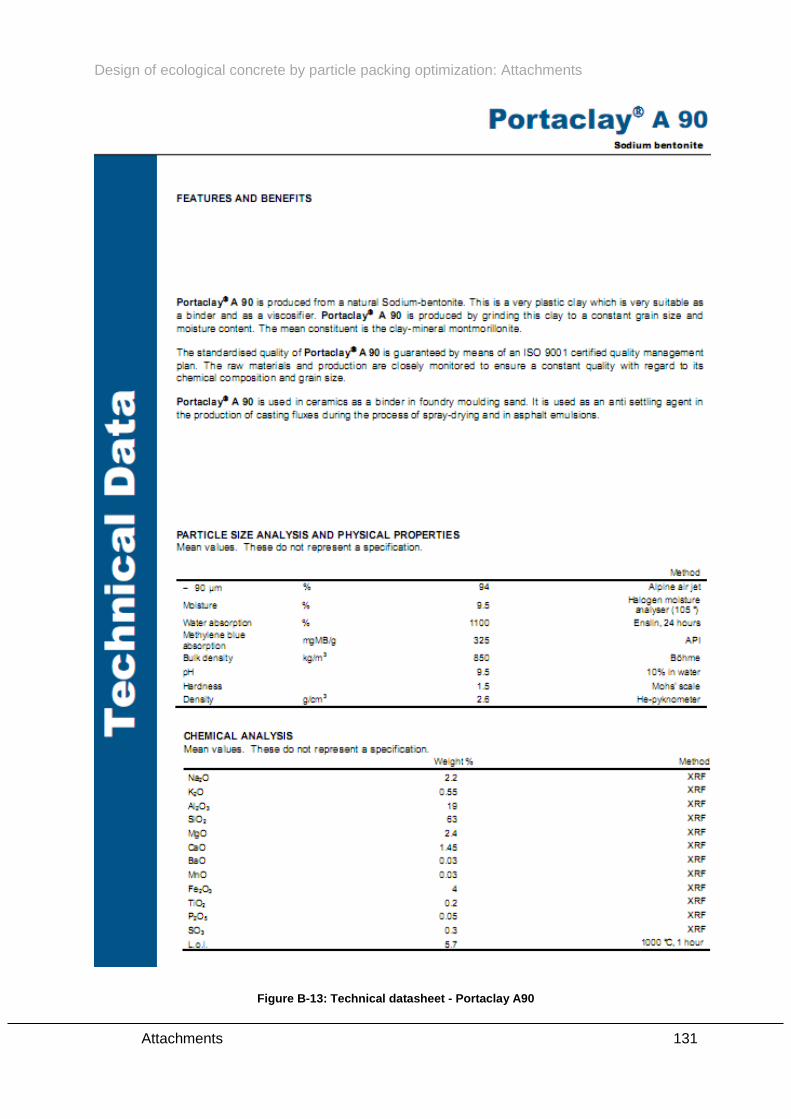
Design of ecological concrete by particle packing optimization: Attachments
Attachments 131
Figure B-13: Technical datasheet - Portaclay A90
