2017 state of e-commerce in distribution · marketing automation. mobile apps. social media....
TRANSCRIPT

Download slides (PDF) at mdm.com/slides or email [email protected]
2017 State of E-Commercein Distribution
Featuring:Jonathan Bein, Real Results Marketing
Karie Daudt, Insite SoftwareJenel Stelton-Holtmeier, Modern Distribution Management
March 23, 2017
Sponsored by:
© 2017 Gale Media, Inc. All Rights Reserved. 1

Download slides (PDF) at mdm.com/slides or email [email protected]
© 2017 Gale Media, Inc. All Rights Reserved. 2
About
For more than 12 years, we have focused our energy on addressing the complexities of B2B manufacturers and distributors. We understand that B2B is complex, and encompasses a many to many relationship between people, products and channels. Our goal is to help unify core business systems, and drive better user experiences. Our solutions solve challenges across the organization, and deliver results.
Companies everywhere are transforming their businesses with Insite.
www.insitesoft.com

Download slides (PDF) at mdm.com/slides or email [email protected]
•Results from the 2017 State of E-Commerce in Distribution survey
•Critical e-commerce issues for distributors•Q&A
Agenda
© 2017 Gale Media, Inc. All Rights Reserved. 3

Download slides (PDF) at mdm.com/slides or email [email protected]
Jonathan BeinManaging Director,Real Results Marketing
Karie DaudtSenior Director of Marketing & Customer Experience,Insite Software
Speakers
Jenel Stelton-HoltmeierEditor,Modern Distribution Management
© 2017 Gale Media, Inc. All Rights Reserved. 4

Download slides (PDF) at mdm.com/slides or email [email protected]
2017 E-Commerce Survey
© 2017 Gale Media, Inc. All Rights Reserved.

Download slides (PDF) at mdm.com/slides or email [email protected]
6
45%
53%
59%56%
52% 50%
44%
20%17%
20% 20%16%
19% 21%
13% 12%
7%11%
14% 16% 15%10%
7% 6% 4%7% 7% 7%
4% 5%2% 3% 4%
2%5%
8%6% 5% 7% 8%
6%7%
0%
10%
20%
30%
40%
50%
60%
2011 2012 2013 2014 2015 2016 2017F
E-Commerce Percent of Total Revenue
Less than 5% 5% to 10% 10% to 20% 20% to 30% 30% to 40% More than 40%
© 2017 Gale Media, Inc. All Rights Reserved.

Download slides (PDF) at mdm.com/slides or email [email protected]
Distributor E-Commerce Performance
7
66%
11%
23%
0% 10% 20% 30% 40% 50% 60% 70%
Under performing
Moderate performing
High performing
High = Moved to 10% - 20% e-commerce revenue within 5 years or that have > 20% e-commerce revenue
Moderate = Stuck in the 10% - 20% for more than 5 years
Under = In nascent (<5%) category for more than 3 years or in the 5% - 10% category for more than 5 years
© 2017 Gale Media, Inc. All Rights Reserved.

Download slides (PDF) at mdm.com/slides or email [email protected]
Differences with Distributors & Manufacturers• Manufacturers lead distributors in e-commerce journey
– 17% drop in <10% category from 2015 to 2016– 15% gain in the 10%-30% category in same period, plus– 3% increase in >40% category
• Distributors shift to more mature stages but at a slower pace– 7% drop in nascent stage w/ 7% corresponding gain in 5%-20%
category
• Distributors face disruptive quandary: Get on board quickly or manufacturers may go around them
8© 2017 Gale Media, Inc. All Rights Reserved.

Download slides (PDF) at mdm.com/slides or email [email protected]
How Manufacturers Use E-Commerce
9
38%
25%
12% 8% 6%0%5%
10%15%20%25%30%35%40%
All throughdistribution
Mostly throughdistribution,
some direct toend-user
Roughly evenlydivided betweendistribution anddirect to end-
user
Mostly direct toend-user, some
throughdistribution
All direct to end-user
© 2017 Gale Media, Inc. All Rights Reserved.

Download slides (PDF) at mdm.com/slides or email [email protected]
10
14%
8%
9%
7%
8%
10%
24%
21%
0% 5% 10% 15% 20% 25%
Expected 2017
2016
2015
2014
2013
2012
2007-2011
Before 2007
Year First Received E-commerce Revenue
65% of companies in the 10% -20% e-commerce range started
2011 or before
© 2017 Gale Media, Inc. All Rights Reserved.
Download slides (PDF) at mdm.com/slides or email [email protected]
11
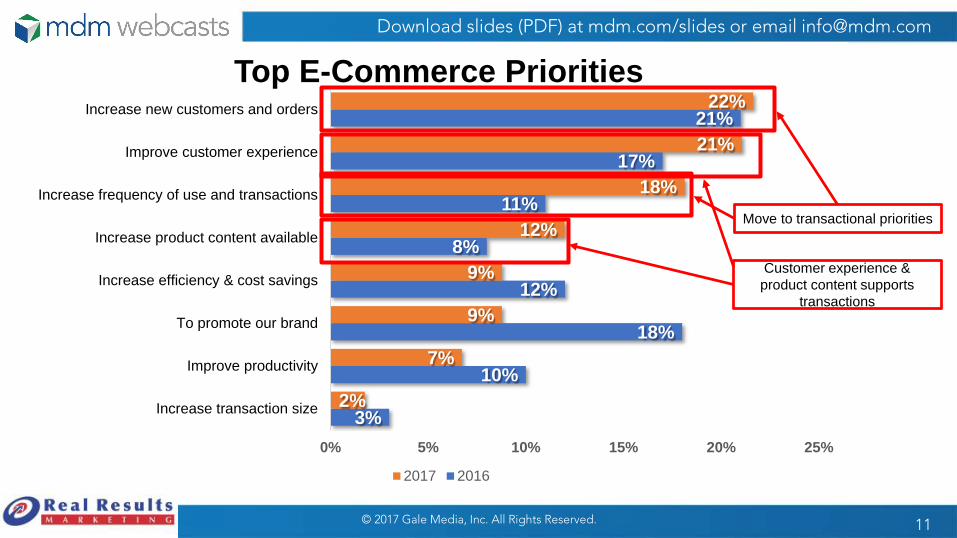
3%
10%
18%
12%
8%
11%
17%
21%
2%
7%
9%
9%
12%
18%
21%
22%
0% 5% 10% 15% 20% 25%
Increase transaction size
Improve productivity
To promote our brand
Increase efficiency & cost savings
Increase product content available
Increase frequency of use and transactions
Improve customer experience
Increase new customers and orders
Top E-Commerce Priorities
2017 2016
Move to transactional priorities
Customer experience & product content supports
transactions
© 2017 Gale Media, Inc. All Rights Reserved.

Download slides (PDF) at mdm.com/slides or email [email protected]
12
3%3%3%3%3%
5%8%
10%12%
14%37%
5%4%3%23%4%
15%5%
22%11%9%
14%
2%3%
3%6%
4%3%
4%6%
12%5%
14%14%
12%10%
3%3%
6%9%
8%4%
5%8%
8%2%
8%16%
8%7%
4%3%
4%9%
6%5%
3%9%
10%5%
8%12%
6%6%
0% 10% 20% 30% 40% 50% 60% 70% 80%
Mass marketingWebinars
VideosPrint catalog
Direct mailMarketing automation
Mobile appsSocial media
Customer service repPay-per-click
Inside sales repEmail marketing
SEO/organic searchField sales rep
Most effective Second Third Fourth Fifth
SEO moved to #2 position, up from #4
in 2016Marketing Automation is underutilized
Effectiveness of Marketing Vehicles to Drive Demand to E-Commerce Channel
© 2017 Gale Media, Inc. All Rights Reserved.

Download slides (PDF) at mdm.com/slides or email [email protected]
13
3%4%
6%6%6%
12%15%
21%22%
27%
5%5%
6%9%8%
13%14%
21%10%
4%15%
6%8%
5%5%
10%9%
12%16%
10%
5%14%
9%5%
4%4%
10%8%
8%10%
8%
4%17%
5%6%
4%7%
8%5%
7%8%
5%
0% 10% 20% 30% 40% 50% 60% 70% 80%
WebinarsSocial media
VideosMobile apps
Marketing automationMass marketing
Direct mailPay-per-click
SEO/organic searchEmail marketing
Print catalog
Spending rank among the following marketing vehicles for driving demand
with your e-commerce channel
Biggest spend Second Third Fourth Fifth
© 2017 Gale Media, Inc. All Rights Reserved.

Download slides (PDF) at mdm.com/slides or email [email protected]
Millennials are Coming Here
14
As of 2015: Millennials > Boomers Millennials > GenX
By 2020:Millennials >> Boomers Millennials + GenZ >> GenX
© 2017 Gale Media, Inc. All Rights Reserved.
Download slides (PDF) at mdm.com/slides or email [email protected]
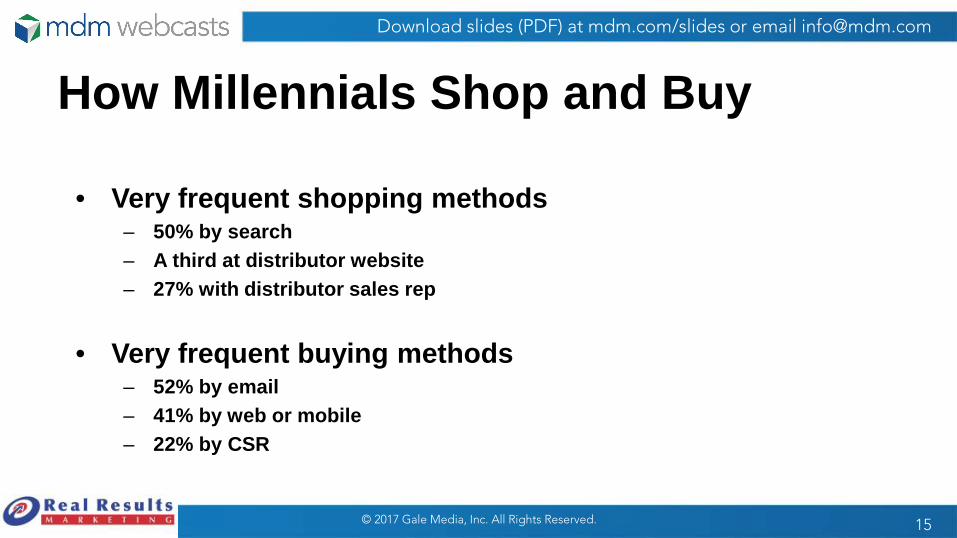
How Millennials Shop and Buy
• Very frequent shopping methods– 50% by search– A third at distributor website– 27% with distributor sales rep
• Very frequent buying methods– 52% by email– 41% by web or mobile– 22% by CSR
15© 2017 Gale Media, Inc. All Rights Reserved.

Download slides (PDF) at mdm.com/slides or email [email protected]
Very relational customer base• Similar emphasis on search, distributor website, CSR and distributor sales rep• Purchasing is done with people over the phone, in person, in store• Significantly decreased emphasis on email and e-commerce

Download slides (PDF) at mdm.com/slides or email [email protected]
Very transactional customer base• Huge emphasis on electronic shopping – search, distributor site• Huge emphasis on electronic buying – email, website• Aversion to in-person interactions with rep or in store

Download slides (PDF) at mdm.com/slides or email [email protected]
Shopping Preferences by Customer Base
18
0% 10% 20% 30% 40% 50% 60%
Search engine
Manufacturer's website
Distributor website
Customer service rep
Distributor's sales rep
© 2017 Gale Media, Inc. All Rights Reserved.

Download slides (PDF) at mdm.com/slides or email [email protected]
Buying Preferences by Customer Base
19
0% 10% 20% 30% 40% 50% 60% 70% 80% 90%
By website with computer
Over the phone supplier rep
© 2017 Gale Media, Inc. All Rights Reserved.

Download slides (PDF) at mdm.com/slides or email [email protected]
Distributor, 60%
Manufacturer, 28%
Other, 12%
Who Took The Survey?
20
Type of Company Customer Base
Company Annual Revenues
532 Respondents
11%
13%
22%
22%
32%
0% 5% 10% 15% 20% 25% 30% 35%
Mostly or exclusively OEM
Other
Mostly trades/contractors
Mostly or exclusively MRO
Roughly even balance betweenMRO and OEM
© 2017 Gale Media, Inc. All Rights Reserved.

Download slides (PDF) at mdm.com/slides or email [email protected]
21
Sectors Represented Company Annual Revenues
11%
25%
15%
24%
6%
11%
0% 5% 10% 15% 20% 25% 30%
Less than $10 million
$10 million to $50 million
$50 million to $100 million
$100 million to $500 million
$500 million to $1 billion
More than $1 billion
6%8%9%
14%14%14%16%17%18%19%19%19%
22%30%
33%63%
0% 10% 20% 30% 40% 50% 60% 70%
Grocery/Foodservice
Pharmaceutical
Pulp and Paper
Chemicals and Plastics
Electronics
Other
Plumbing
JanSan
Power Transmission/Bearing
Building Materials/Construction
Hardware
Oil and Gas Products
HVACR
Electrical
Safety
Industrial
© 2017 Gale Media, Inc. All Rights Reserved.

Download slides (PDF) at mdm.com/slides or email [email protected]
Critical Issues
© 2017 Gale Media, Inc. All Rights Reserved.
Download slides (PDF) at mdm.com/slides or email [email protected]
Critical Issue #1:
Amazon(and other new players)
© 2017 Gale Media, Inc. All Rights Reserved. 23

Download slides (PDF) at mdm.com/slides or email [email protected]
Critical Issue #2:
Changing Roleof Sales Team
© 2017 Gale Media, Inc. All Rights Reserved. 24

Download slides (PDF) at mdm.com/slides or email [email protected]
Critical Issue #3:
Customer Experience in an Omnichannel World
© 2017 Gale Media, Inc. All Rights Reserved. 25

Download slides (PDF) at mdm.com/slides or email [email protected]
© 2017 Gale Media, Inc. All Rights Reserved. 26
Source: McKinsey & Company “Putting customer experience at the heart of next-generation operating models”

Download slides (PDF) at mdm.com/slides or email [email protected]
Questions?
March 23, 2017
Sponsored by:
2017 State of E-Commercein Distribution
© 2017 Gale Media, Inc. All Rights Reserved. 27