2018 annual report - jack henry & associates, inc
TRANSCRIPT

A YEAR IN REVIEWA N N U A L R E P O R T2 0 1 8

T H E E L E M E N T S O F O U R Y E A RIn last year’s annual report, we introduced the Elements of JHA
– an initiative that defines our company’s focus and direction.
The Elements continue to resonate in our organization and offer
guidance about who we are and where we’re headed.
On the following pages, you’ll see the Elements featured where
the events of our year reflected these important areas of focus
for our business.

1JACKHENRY.COM
Financial Highlights
Shareholders’ Letter
Market for Registrant’s Common Equity
Performance Graph
Selected Financial Data
Management’s Discussion and Analysis
Quantitative and Qualitative Disclosures About Market Risk
Financial Statements and Supplementary Data
Quarterly Financial Information
Board of Directors and Executive Officers
2
1 3
1 5
2 7
5 3
3
1 4
1 5
2 8
5 6
T A B L E O F C O N T E N T S

2 2018 ANNUAL REPORT
F I N A N C I A L H I G H L I G H T S ( I n m i l l i o n s e x c e p t p e r s h a r e d ata )
R e v e n u e
D i l u t e d E a r n i n g s p e r S h a r e
S t o c k h o l d e r s ’ E q u i t y
N e t I n c o m e
T o ta l A s s e t s
D i v i d e n d s D e c l a r e d p e r S h a r e
2016
2016
2016
2017
2017
2017
2018
2018
2018
2016
2016
2016
2017
2017
2017
2018
2018
2018
$1,355
$3.12
$996
$1,431
$3.14
$1,032
$1,537
$4.85
$1,267
$249
$1,816
$1.06
$246
$1,909
$1.18
$377
$2,050
$1.36
$1,250 $0$1,350 $100$1,450 $200$1,550 $300 $400
$0 $2 $4 $6 $1,650
$0
$1,750
$0.8
$1,850
$0.4
$1,950
$1.2
$2,050
$1.6$0 $400 $1,200$800

Fiscal year 2018 delivered a strong financial performance with record revenue and earnings for Jack Henry & Associates, Inc.® (JHA). Our Associates remain engaged and dedicated to providing exceptional care, which continues to enhance customer satisfaction ratings and shareholder returns.
We were excited to have been recognized again in May by Forbes magazine as one of America’s Best Employers, and to discover that our ranking rose significantly from our highly celebrated placement last year.
Overall JHA ranked No. 12 in 2018 (up from No. 95 in 2017) and No. 2 in the IT, Internet, Software and Services category (up from No. 7 in the same category last year) – second only to Google™. We are humbled to be acknowledged by such a far-reaching publication as Forbes, and we are pleased that our approximately 6,400 Associates think highly enough of JHA that they continue to place us on this list and numerous other top workplace lists across the country each year.
We believe that a strong contributing factor to our high employee satisfaction levels is our unfailing commitment to put our Associates first. We are dedicated to developing our Associates so they experience ongoing personal and professional growth and job fulfillment. In fiscal year 2018, we further expanded and socialized our talent development program so aspiring leaders within our company will have new opportunities to advance to the next level in their careers.
F E L L O W S H A R E H O L D E R S
We are driven by the most engaged, empowered, and exceptional people in our industry.
Driven
Dv
Google1
Jack Henry & Associates2
SAP3
VMware4
Microsoft5
Facebook6
Salesforce.com7
Intuit8
LinkedIn9
Cisco Systems10
3JACKHENRY.COM
Number 2 in the IT, Internet, Software, and Services Category
Ranked Number 12
Overall

4 2018 ANNUAL REPORT
We introduced a new foundation for leadership development at JHA – our Leadership Framework (pictured at right) – which is composed of eight qualities that outline the characteristics and behaviors that are expected of our Associates, regardless of their role in our organization.
We also built upon our existing internship program, dedicating even more attention to recruiting the next generation of top talent. The importance of attracting new and fresh minds into our employee base cannot be emphasized enough, as we believe this will keep us at the forefront of our industry.
Additionally, we were pleased to introduce a paid parental leave policy, providing parents with paid time off to bond with their newborn or adopted children. After all, happy Associates translate to amazing service for our customers.
Speaking of service, our customer satisfaction ratings continue to convey that we’re doing the right things in the name of customer service at JHA. The random surveys we distributed this fiscal year once again revealed that our service representatives are
exceeding customer expectations.
During fiscal year 2018, we continued to seek out opportunities to both expand our business and run it more efficiently. We completed two acquisitions which strengthened our product suites in the areas of commercial lending and payments. In August of 2017, we acquired Vanguard Software Group, a Florida-based technology company specializing in the underwriting, spreading, and online decisioning of commercial loans. In December, we acquired Ensenta Corporation, a California-based provider of real-time, cloud-based solutions for mobile and online payments and deposits. We’ve successfully blended these two companies into our operations, and we’re energized by the new talent, expertise, and business opportunities we’ve gained as a result.
Our executive management team also changed shape this fiscal year when we promoted Mark Forbis from Vice President and Chief Technology Officer to Executive Vice President and Chief Technology Officer. Mark joined JHA in 1988, and for decades has been instrumental to our technology research, development, and direction.
Additionally, we appointed three divisional presidents and two general managers to new corporate vice president positions: Greg Adelson is now Vice President of Jack Henry & Associates and General Manager of JHA Payment Solutions™; Russ Bernthal was appointed Vice President of Jack Henry & Associates and President of ProfitStars®; Ted Bilke became Vice President of Jack Henry & Associates and President of Symitar®; Ron Moses is now Vice President of Jack Henry & Associates and General Manager of Consumer and Commercial Solutions; and Stacey Zengel is now Vice President of Jack Henry & Associates and President of Jack Henry Banking®. As our leadership team strengthens in experience and tenure, we’re increasingly appreciative of the value they bring to our company.
We define amazing service for our customers.
Service
Sr

5JACKHENRY.COM
OUTLINK IN-HOUSE
B A N K I N G C R E D I T U N I O N
60% 50% 50%40%
We celebrated an impressive 53 new core wins this fiscal year across our banking and credit union businesses. Of those 53 core wins, six were de novo institutions. We remain encouraged by de novo activity in the industry and the opportunities
they provide for our business.
As we have reported in recent years, our customers continue to show increased interest in the outsourced delivery model, which is also referred to as hosted delivery, in-the-cloud, or Software-as-a-Service (SaaS). Of the 53 new core wins this fiscal year, only six of them chose an in-house delivery environment, with the remaining majority selecting the outsourced delivery model. Additionally, 59 of our existing banking and credit union customers decided to migrate from an in-house delivery model to outsourcing during fiscal year 2018. Today, 55% of our total core business processes in a hosted environment. This shift has been a significant contributor to our recurring revenue composition which reached 79% in fiscal year 2018.
We’re excited about our fiscal year 2018 technology accomplishments and the R&D initiatives underway.
Our digital and mobile suite is growing, and our strategy is strong. This year, we rolled out more than 60 new features within the Banno™ platform and more than a dozen integrations. We delivered Banno Online™, an online banking platform for both banks and credit unions which augments Banno’s already solid native mobile platform for Apple® and Android™ systems. Our Banno team continues to uncover new ways to make the digital channel a seamless and personal experience, and we believe Banno will be instrumental to our business and customers well into the future.
We win more competitive core deals than any other provider.
Core
CrWe build, buy, and sell industry-leading solutions.
Solutions
Sl
new core wins this fiscal year across our banking and credit union businesses.53
I n - t o - O u t O p p o r t u n i t y

6 2018 ANNUAL REPORT
Our electronic payments business continues to represent a large part of our total revenue, primarily due to transaction fees and the trend toward electronic payment alternatives. Payments generated approximately $517 million in annual revenue
in fiscal year 2018, or 34% of our total revenue.
As the payments landscape evolves, our customers need a suite of solutions that includes bill pay, credit, debit, ACH, and access to real-time payments. We’re increasingly strengthening our position in the payments space by expanding our offerings and relationships.
In fiscal year 2018, we introduced JHA PayCenter™, a single point of access to Zelle® by Early Warning and RTP® by The Clearing House. Our JHA Card Processing Solutions™ group has shown tremendous promise as we migrated 66 customers and sold more than 50 new deals on our new card processing platform. This platform, announced in fiscal year 2017 in partnership with First Data® and PSCU®, provides debit, credit, and ATM transactions services through a single platform for banks and credit unions. And as mentioned previously, our acquisition of Ensenta has better positioned us in the area of mobile deposits with credit unions and has enabled JHA to be the largest provider of these services in the country.
We make payment processing less complex.
Payments
PtWe embrace “co-opetition”* for the betterment of our industry.
Co-opetition
Co
2018 T E C H N O L O G Y H I G H L I G H T S
The Banno™ suite gained momentum as we continue to place a stronger focus on our digital strategy.
We introduced JHA PayCenter™, a single point of access to Zelle and The Clearing House.
We expanded our Commercial Lending Center Suite™ with tools to better meet the needs of large commercial customers.
We migrated 66 customers and sold more than 50 new deals on our new JHA Card Processing Solutions™ platform.

7JACKHENRY.COM
Financial institutions continue to be challenged to find sufficient deposits to fund ongoing lending opportunities. We introduced several solutions this year including JHA Treasury Management™ and JHA Commercial Cash Management™ to support commercial accounts and an expanded rewards program to attract new consumer accounts.
To assist our customers with expanding their relationships with commercial customers and pursuing loan and deposit growth opportunities, we enhanced our Commercial Lending Center Suite™ with newly integrated, digital tools including loan spreading and decisioning, document archival, and remittance processing features. Our Commercial Lending Center Suite, combined with our JHA Treasury Management and JHA Commercial Cash Management solutions, have significantly expanded our presence and potential in the lending space.
Additionally, we successfully rolled out JHA Enterprise Risk Mitigation Solutions™, our anti-money laundering and fraud identification and analysis offering developed through our partnership with SAS® announced in October 2017. We also delivered new Current Expected Credit Loss (CECL) solutions, and extended our call center services into our credit union customer base.
of our total revenue was generated by our electronic payments business.
34%
We delivered additional Current Expected Credit Loss (CECL) solutions to help our customers prepare for related regulations.
We deepened our jhaCall Center™ services and made them available to our Episys® credit union customers.
We rolled out JHA Enterprise Risk Mitigation Solutions™, made available through our partnership with SAS®, which continues to empower our customers to perform better risk assessments.
We introduced JHA Treasury Management™, a financial management solution designed specifically for mid-sized to large commercial customers.

8 2018 ANNUAL REPORT
JHA has more than 6,400 employees, three distinct brands, and more than 300 products and services. We are committed to offering our more than 9,000 customers a singular and seamless service experience, no matter which department or division serves them.
Regarding our approach to technology, it’s very important to us that we do whatever it takes to make our customers successful. Integration between our solutions and those of third parties is one way we can help, so we’re focused on maximizing integration opportunities wherever
we can so we’re serving our customers and their end users in a way that’s open, flexible, and secure. Open APIs and our jXchange™ and SymXchange™ utilities are just a few of the ways we demonstrate that we’re committed to seamlessly integrating with third-party solutions. We are also actively involved in projects that further explore artificial intelligence (AI), bots, and augmenting the human process. While these technologies may not be on the radar for most mid-sized banks and credit unions today, we believe there is future opportunity there for our business and customers.
We do the right thing and whatever it takes to ensure the success of our customers.
Success
Se
With Jack Henry & Associates, we can have several third-party providers if we so choose, unlike an alternative provider we looked at who really seems to back banks into a corner as far as complementary solutions are concerned. We can also pull third-party data in a way that our end-users never know we’re using a third party. For our end-users to not feel like they’re being bounced around a variety of different systems … that’s key.
Our strong balance sheet and cash flow continue to generate value for our shareholders. In fiscal year 2018, we saw 7% revenue growth, with nearly 84% being organic growth. We returned $154 million to our shareholders as we increased our quarterly dividend by more than 19% and repurchased nearly 448 thousand shares of JHA stock in the market for the treasury.
Total revenue increased to a record $1.5 billion. Net income was $377 million or $4.85 per diluted share, as compared to net income of $246 million or $3.14 per diluted share reported for fiscal year 2017. We generated strong cash flow from operating activities of $412 million, as compared to $357 million in fiscal year 2017. Our return on assets was 19%, and return on equity was 33%. We generated strong profitability with a 26% operating margin.
P a m I h l iSenior Vice President
& Chief Technology OfficerCitizens National Bank
Sevierville, TN
We consistently deliver remarkable shareholder value.
Value
Vl
We strive to be singular in the eyes of the customer.
Singular
Sg

$100
$110
$120
$130
$90
$80
$70
$60
$50
$40
$30
$20
$10
$0
‘92 ‘93 ‘94 ‘95 ‘96 ‘97 ‘98 ‘00 ‘01 ‘02 ‘03 ‘04 ‘05 ‘06 ‘07 ‘08 ‘09 ‘10 ‘11 ‘12 ‘13 ‘14 ‘15 ‘16 ‘17 ‘18‘99‘91‘90
D i v i d e n d s P a i d(in millions except per share amount)
2012 20152013 20162014 2017 2018$0
$10
$40
$70
$20
$50
$80
$30
$60
$90
$100
$110
$0.44 $0.56 $0.84 $0.94 $1.06 $1.18 $1.36
$38.1
$48.2
$71.3
$76.4
$84.1
$91.7
$105.0
F i s c a l Y e a r - E n d S t o c k P r i c ePrice adjusted for stock splits
Ad
j. C
lose
F iscal Year End
9JACKHENRY.COM

10 2018 ANNUAL REPORT
As we reflect on the elements of our year, we are proud of our accomplishments, our exceptional workplace culture, and our time-honored traditions. In 1976, our co-founders, Jack Henry and Jerry Hall, established a philosophy for our business that still
guides us today – “do the right thing, do whatever it takes, and have fun.” Ultimately this means that we work hard to get the job done with the highest quality and integrity standards, but we know that we’ll be most successful if we love what we do and have a good time doing it. This philosophy hasn’t failed us in 42 years, and we certainly hold it in high regard as we celebrate yet another record year at JHA.
We are humbled and honored to work at this company among some of the greatest people in our industry. On behalf of the Board of Directors and our entire leadership team, we would like to express our gratitude to our exceptional Associates, loyal customers, and to you – our shareholders – for your commitment to JHA.
We know how to have fun.
Fun
Fn
Kevin Williams C h i e f F i n a n c i a l O f f i c e r a n d T r e a s u r e r
In fiscal year 2018, Kevin Williams (left) celebrated his 20th year at JHA. Here, David Foss has a little fun presenting Kevin with his 20-year service award at the National Sales and Marketing Meeting in Orlando in July, 2018.
David Foss P r e s i d e n t a n d C h i e f E x e c u t i v e O f f i c e r

11JACKHENRY.COM
F I N A N C I A LS2 0 1 8

12 2018 ANNUAL REPORT
T H I S P A G E L E F T B L A N K
13JACKHENRY.COM
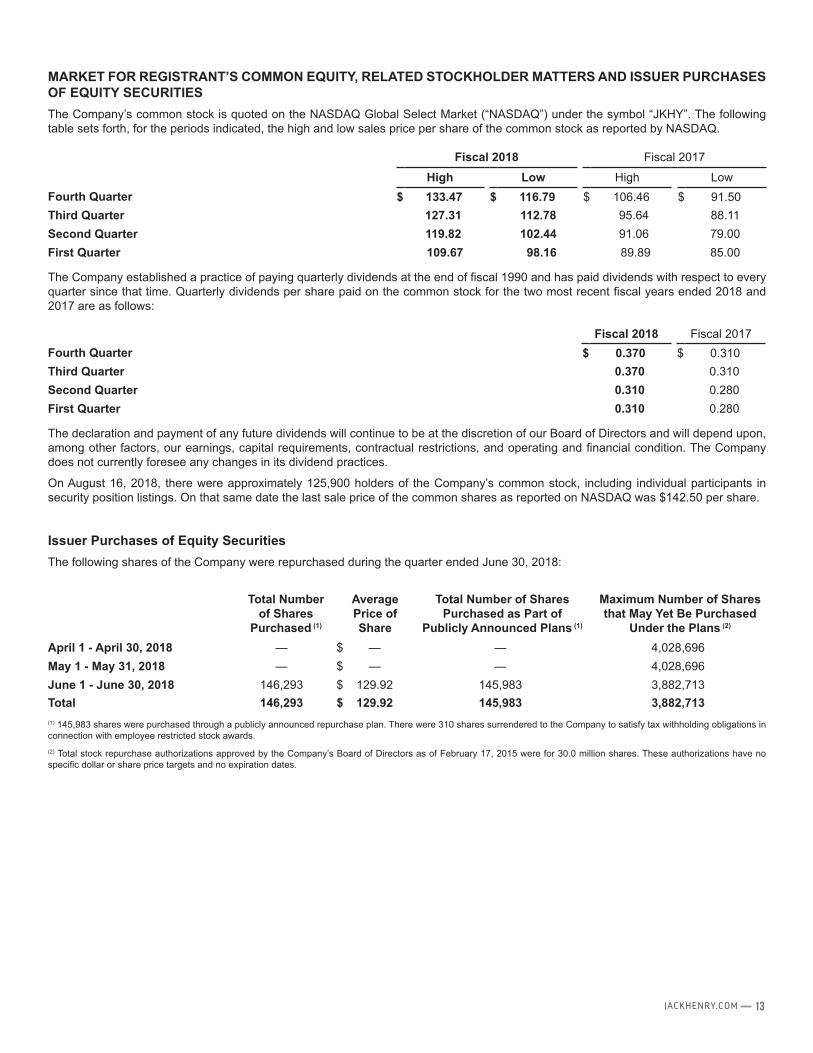
MARKET FOR REGISTRANT’S COMMON EQUITY, RELATED STOCKHOLDER MATTERS AND ISSUER PURCHASES OF EQUITY SECURITIESThe Company’s common stock is quoted on the NASDAQ Global Select Market (“NASDAQ”) under the symbol “JKHY”. The following table sets forth, for the periods indicated, the high and low sales price per share of the common stock as reported by NASDAQ.
Fiscal 2018 Fiscal 2017
High Low High LowFourth Quarter $ 133.47 $ 116.79 $ 106.46 $ 91.50Third Quarter 127.31 112.78 95.64 88.11Second Quarter 119.82 102.44 91.06 79.00First Quarter 109.67 98.16 89.89 85.00
The Company established a practice of paying quarterly dividends at the end of fiscal 1990 and has paid dividends with respect to every quarter since that time. Quarterly dividends per share paid on the common stock for the two most recent fiscal years ended 2018 and 2017 are as follows:
Fiscal 2018 Fiscal 2017Fourth Quarter $ 0.370 $ 0.310Third Quarter 0.370 0.310Second Quarter 0.310 0.280First Quarter 0.310 0.280
The declaration and payment of any future dividends will continue to be at the discretion of our Board of Directors and will depend upon, among other factors, our earnings, capital requirements, contractual restrictions, and operating and financial condition. The Company does not currently foresee any changes in its dividend practices.
On August 16, 2018, there were approximately 125,900 holders of the Company’s common stock, including individual participants in security position listings. On that same date the last sale price of the common shares as reported on NASDAQ was $142.50 per share.
Issuer Purchases of Equity SecuritiesThe following shares of the Company were repurchased during the quarter ended June 30, 2018:
Total Number of Shares
Purchased (1)
Average Price of Share
Total Number of Shares Purchased as Part of
Publicly Announced Plans (1)
Maximum Number of Shares that May Yet Be Purchased
Under the Plans (2)
April 1 - April 30, 2018 — $ — — 4,028,696May 1 - May 31, 2018 — $ — — 4,028,696June 1 - June 30, 2018 146,293 $ 129.92 145,983 3,882,713Total 146,293 $ 129.92 145,983 3,882,713(1) 145,983 shares were purchased through a publicly announced repurchase plan. There were 310 shares surrendered to the Company to satisfy tax withholding obligations in connection with employee restricted stock awards.(2) Total stock repurchase authorizations approved by the Company’s Board of Directors as of February 17, 2015 were for 30.0 million shares. These authorizations have no specific dollar or share price targets and no expiration dates.

14 2018 ANNUAL REPORT
PERFORMANCE GRAPH
The following chart presents a comparison for the five-year period ended June 30, 2018, of the market performance of the Company’s common stock with the S&P 500 Index and an index of peer companies selected by the Company. Historic stock price performance is not necessarily indicative of future stock price performance.
COMPARISON OF 5 YEAR CUMULATIVE TOTAL RETURNAmong Jack Henry & Associates, Inc., the S&P 500 Index, and a Peer Group
The following information depicts a line graph with the following values:
2013 2014 2015 2016 2017 2018JKHY 100.00 128.02 141.48 193.46 233.19 296.19
Peer Group 100.00 137.07 171.80 198.44 231.11 297.44
S&P 500 100.00 124.61 133.86 139.20 164.11 187.70
This comparison assumes $100 was invested on June 30, 2013, and assumes reinvestments of dividends. Total returns are calculated according to market capitalization of peer group members at the beginning of each period. Peer companies selected are in the business of providing specialized computer software, hardware and related services to financial institutions and other businesses.
Companies in the peer group are ACI Worldwide, Inc.; Bottomline Technology, Inc.; Broadridge Financial Solutions; Cardtronics, Inc.; Convergys Corp.; Corelogic, Inc.; Euronet Worldwide, Inc.; Fair Isaac Corp.; Fidelity National Information Services, Inc.; Fiserv, Inc.; Global Payments, Inc.; Moneygram International, Inc.; SS&C Technologies Holdings, Inc.; Total Systems Services, Inc.; Tyler Technologies, Inc.; Verifone Systems, Inc.; and WEX, Inc. DST Systems, Inc., which had previously been part of the peer group, was acquired in 2018 and is no longer a public company. As a result, DST Systems, Inc. has been removed from the peer group and stock performance graph.
The stock performance graph shall not be deemed “filed” for purposes of Section 18 of the Exchange Act, or incorporated by reference into any filing of the Company under the Securities Act of 1933, as amended, or the Exchange Act, except as shall be expressly set forth by specific reference in such filing.

15JACKHENRY.COM
SELECTED FINANCIAL DATA
The following data should be read in conjunction with the consolidated financial statements and accompanying notes included elsewhere in the Annual Report on From 10-K. Fiscal 2018 net income contains adjustments related to the Tax Cuts and Jobs Act of 2017, and acquisitions have affected revenue and net income in fiscal 2018 as well as the historical periods presented.
Selected Financial Data(In Thousands, Except Per Share Data)
YEAR ENDED JUNE 30,
Income Statement Data 2018 2017 2016 2015 2014Revenue(1) $ 1,536,603 $ 1,431,117 $ 1,354,646 $ 1,256,190 $ 1,173,173Net Income $ 376,660 $ 245,793 $ 248,867 $ 211,221 $ 186,715
Basic earnings per share $ 4.88 $ 3.16 $ 3.13 $ 2.60 $ 2.20
Diluted earnings per share $ 4.85 $ 3.14 $ 3.12 $ 2.59 $ 2.19
Dividends declared per share $ 1.36 $ 1.18 $ 1.06 $ 0.94 $ 0.84Balance Sheet DataTotal deferred revenue $ 448,632 $ 511,384 $ 521,054 $ 531,987 $ 492,868Total assets $ 2,050,303 $ 1,908,945 $ 1,815,512 $ 1,836,835 $ 1,680,703Long-term debt $ — $ 50,000 $ — $ 50,102 $ 3,729Stockholders’ equity $ 1,266,828 $ 1,032,051 $ 996,210 $ 991,534 $ 967,387
(1) Revenue includes license sales, support and service revenues, and hardware sales, less returns and allowances.
MANAGEMENT’S DISCUSSION AND ANALYSIS OF FINANCIAL CONDITION AND RESULTS OF OPERATIONS
The following section provides management’s view of the Company’s financial condition and results of operations and should be read in conjunction with the Selected Financial Data, the audited Consolidated Financial Statements, and related notes included elsewhere in this report. All dollar and share amounts, except per share amounts, are in thousands and discussions compare fiscal 2018 to fiscal 2017 and compare fiscal 2017 to fiscal 2016.
OVERVIEW
Jack Henry & Associates, Inc. (JHA) is headquartered in Monett, Missouri, employs approximately 6,400 associates nationwide, and is a leading provider of technology solutions and payment processing services primarily for financial services organizations. Its solutions serve over 9,000 customers and are marketed and supported through three primary brands. Jack Henry Banking® supports banks, ranging from community banks to multi-billion-dollar institutions with assets up to $50 billion, with information and transaction processing solutions. Symitar® is a leading provider of information and transaction processing solutions for credit unions of all sizes. ProfitStars®
provides highly specialized products and services that enable financial institutions of every asset size and charter, and diverse corporate entities outside the financial services industry, to mitigate and control risks, optimize revenue and growth opportunities, and contain costs. JHA’s integrated solutions are available for in-house or outsourced delivery.
Each of our brands share the fundamental commitment to provide high-quality business solutions, service levels that consistently exceed customer expectations, integration of solutions and practical new technologies. The quality of our solutions, our high service standards, and the fundamental way we do business typically foster long-term customer relationships, attract prospective customers, and have enabled us to capture substantial market share.
Through internal product development, disciplined acquisitions, and alliances with companies offering niche solutions that complement our proprietary solutions, we regularly introduce new products and services and generate new cross-sales opportunities across our three primary business brands. We provide compatible computer hardware for our in-house installations and secure processing environments for our outsourced solutions. We perform data conversions, software implementations, initial and ongoing customer training, and ongoing customer support services.
We believe our primary competitive advantage is customer service. Our support infrastructure and strict standards provide service levels we believe to be the highest in the markets we serve and generate high levels of customer satisfaction and retention. We consistently measure customer satisfaction using comprehensive annual surveys and randomly generated daily surveys we receive in our everyday business. Dedicated surveys are also used to grade specific aspects of our customer experience, including product implementation, education, and consulting services.

16 2018 ANNUAL REPORT
During the last five fiscal years, our revenues have grown from $1,173,173 in fiscal 2014 to $1,536,603 in fiscal 2018. Net income has grown from $186,715 in fiscal 2014 to $376,660 in fiscal 2018. The revenue growth has resulted primarily from internal expansion. Net income in fiscal 2018 included a net tax benefit of $118,367 recorded as result of the TCJA.
Our two primary revenue streams are “Services and support” and “Processing”. Services and support includes: “Outsourcing and cloud” fees that predominantly have contract terms of five years or longer at inception; “Product delivery and services” revenue, which includes revenue from the sales of licenses, implementation services, consulting, and hardware; and “In-house support” revenue, which is composed of maintenance fees which primarily contain annual contract terms. Processing revenue includes: “Remittance” revenue from payment processing, remote capture, and automated clearing house (ACH) transactions; “Card” fees, including card transaction processing and monthly fees; and “Transaction and digital” revenue, which includes transaction and mobile processing fees. We continually seek opportunities to increase revenue while at the same time containing costs to expand margins.
We have four reportable segments: Core, Payments, Complementary, and Corporate and Other. The respective segments include all related revenues along with the related cost of sales.
We continue to focus on our objective of providing the best integrated solutions, products and customer service to our clients. We are cautiously optimistic regarding ongoing economic improvement and expect our clients to continue investing in our products and services to improve their operating efficiencies and performance. We anticipate that consolidation within the financial services industry will continue. Regulatory conditions and legislation will continue to impact financial institutions’ discretionary spending.
A detailed discussion of the major components of the results of operations follows.
RESULTS OF OPERATIONSFISCAL 2018 COMPARED TO FISCAL 2017
In fiscal 2018, revenues increased 7% or $105,486 compared to fiscal 2017. Deconversion fees increased $6,021 compared to the prior fiscal year, and we had revenue from fiscal 2018 acquisitions totaling $17,145. Excluding these factors, and excluding $9,341 of revenue from the fiscal 2017 year-to-date period related to divestitures, total revenue still increased 7%, with strong growth in each of our revenue streams as discussed in detail below.
Operating expenses increased 8% year over year. Excluding costs related to deconversion fees from each year, expenses related to fiscal 2018 acquisitions, fiscal 2017 costs related to divestitures, and gains on the disposals of businesses from each year, operating expenses increased 7%.
The TCJA had a large impact on our provision for income taxes and net income, which are discussed below.
We move into fiscal 2019 following a strong performance in fiscal 2018. Significant portions of our business continue to provide recurring revenue and our healthy sales pipeline is also encouraging. Our customers continue to face regulatory and operational challenges which our products and services address, and in these times, they have an even greater need for our solutions that directly address institutional profitability, efficiency, and security. Our strong balance sheet, access to extensive lines of credit, the strength of our existing product line and an unwavering commitment to superior customer service position us well to address current and future opportunities.
A detailed discussion of the major components of the results of operations for the fiscal year ended June 30, 2018 follows.
REVENUE
Services and Support Revenue Year Ended June 30, % Change
2018 2017
Services and Support $ 978,421 $ 917,548 7%Percentage of total revenue 64% 64%
Services and support includes: “Outsourcing and cloud” fees that predominantly have contract terms of five years or greater at inception; “Product delivery & services” revenue, which includes revenue from the sales of licenses, implementation services, consulting, and hardware; and “In-house support” revenue, which is composed of maintenance fees which primarily contain annual contract terms.
In the fiscal year ended June 30, 2018, services and support revenue grew 7% over the prior fiscal year. Excluding deconversion fees, which totaled $45,537 in fiscal 2018 and $39,516 in fiscal 2017; revenue from fiscal 2018 acquisitions totaling $8,851; and fiscal 2017 revenue related to divestitures of $9,188, services and support revenue grew 6%. The increase was primarily driven by an increase in outsourcing and cloud revenue, along with an increase in product delivery and services revenue resulting from completion of revised contractual obligations on several of our bundled arrangements.

17JACKHENRY.COM
Processing Revenue Year Ended June 30, % Change
2018 2017Processing $ 558,182 $ 513,569 9%Percentage of total revenue 36% 36%
Processing revenue includes: “Remittance” revenue from payment processing, remote capture, and automated clearing house (ACH) transactions; “Card” fees, including card transaction processing and monthly fees; and “Transaction and digital” revenue, which includes transaction and mobile processing fees. We continually seek opportunities to increase revenue while at the same time containing costs to expand margins.
Processing revenue increased 9% for the fiscal year ended June 30, 2018 as compared to the fiscal year ended June 30, 2017. Excluding $8,294 of revenue from fiscal 2018 acquisitions, and excluding fiscal 2017 revenue related to divestitures totaling $153, processing revenue increased 7% for the year with significant increases in each of its three components.
OPERATING EXPENSES
Cost of Revenue Year Ended June 30, % Change
2018 2017Cost of Revenue $ 873,642 $ 819,034 7%Percentage of total revenue 57% 57%
Cost of Revenue increased compared to fiscal 2017, but remained consistent as a percentage of total revenue. The increase was primarily due to a 6% expansion in headcount at June 30, 2018 compared to June 30, 2017 driving increased salaries and benefits. Other factors to the increase include higher amortization related to capitalized software, higher direct costs of product and increased spending related to our strategic partnership with First Data and PSCU to expand our credit and debit card platform. We also had other one-time expenses included in cost of revenue which totaled $3,782 included in fiscal 2018 cost of sales. Fiscal 2017 cost of sales included an impairment loss of $3,275. The Company continues to focus on cost management.
Research and Development Year Ended June 30, % Change
2018 2017Research and development $ 90,340 $ 84,753 7%Percentage of total revenue 6% 6%
We devote significant effort and expense to develop new software, service products and continually upgrade and enhance our existing offerings. We believe our research and development efforts are highly efficient because of the extensive experience of our research and development staff and because our product development is highly customer-driven.
Research and development expenses increased primarily due to increased salary and benefit expenses, in part due to a 4% increase in headcount, but were consistent with the prior year as a percentage of total revenue.
Selling, General, and Administrative Year Ended June 30, % Change
2018 2017Selling, General, and Administrative $ 182,146 $ 162,898 12%Percentage of total revenue 12% 11%
Selling, general and administrative costs included all expenses related to sales efforts, commissions, finance, legal, and human resources, plus all administrative costs. These expenses increased primarily due to increased commissions, salaries, and professional service expenses due to contracting with outside experts in preparation for our adoption of the new Accounting Standards Codification (“ASC”) Topic 606 revenue standard.
Gains on Disposal of Businesses
In fiscal 2018, we recognized gains on the disposal of businesses totaling $1,894, due to the sales of our ATM Manager and jhaDirect product lines. In fiscal 2017, we recognized gains on the disposals of businesses totaling $3,270, with $2,136 related to the fiscal 2016 sale of Alogent, and $1,134 related to the sale of our Regulatory Filing products.
18 2018 ANNUAL REPORT
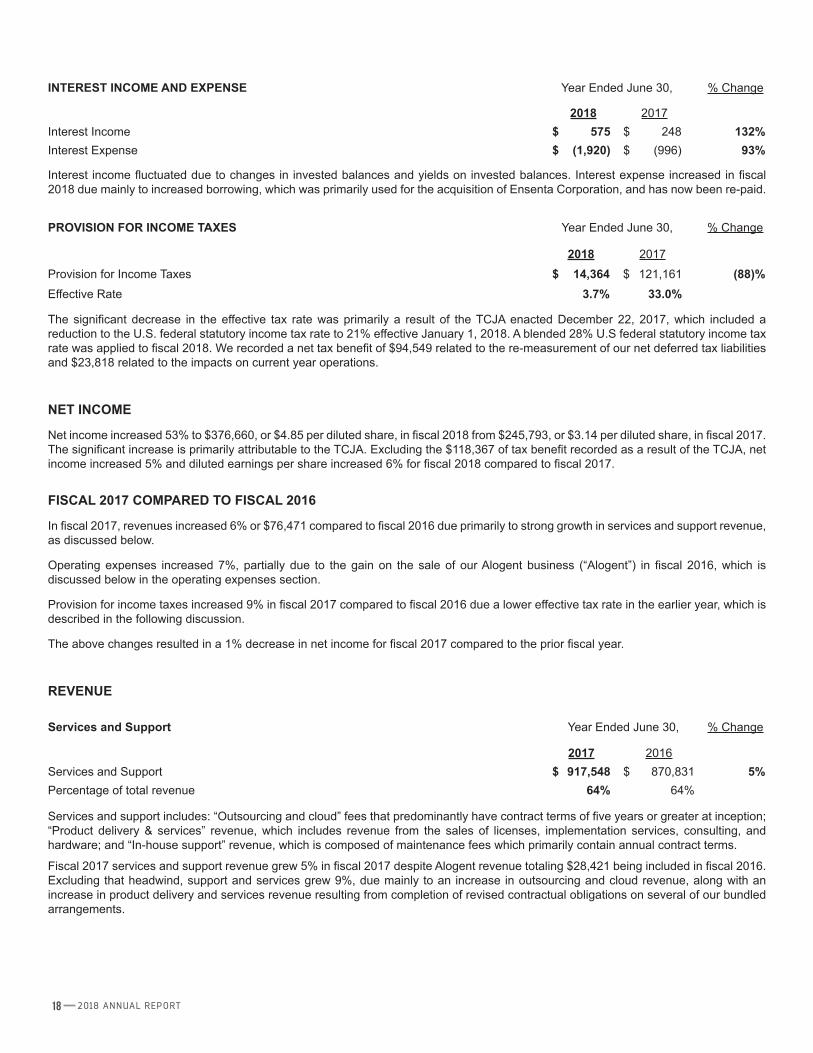
INTEREST INCOME AND EXPENSE Year Ended June 30, % Change
2018 2017Interest Income $ 575 $ 248 132%Interest Expense $ (1,920) $ (996) 93%
Interest income fluctuated due to changes in invested balances and yields on invested balances. Interest expense increased in fiscal 2018 due mainly to increased borrowing, which was primarily used for the acquisition of Ensenta Corporation, and has now been re-paid.
PROVISION FOR INCOME TAXES Year Ended June 30, % Change
2018 2017
Provision for Income Taxes $ 14,364 $ 121,161 (88)%Effective Rate 3.7% 33.0%
The significant decrease in the effective tax rate was primarily a result of the TCJA enacted December 22, 2017, which included a reduction to the U.S. federal statutory income tax rate to 21% effective January 1, 2018. A blended 28% U.S federal statutory income tax rate was applied to fiscal 2018. We recorded a net tax benefit of $94,549 related to the re-measurement of our net deferred tax liabilities and $23,818 related to the impacts on current year operations.
NET INCOME
Net income increased 53% to $376,660, or $4.85 per diluted share, in fiscal 2018 from $245,793, or $3.14 per diluted share, in fiscal 2017. The significant increase is primarily attributable to the TCJA. Excluding the $118,367 of tax benefit recorded as a result of the TCJA, net income increased 5% and diluted earnings per share increased 6% for fiscal 2018 compared to fiscal 2017.
FISCAL 2017 COMPARED TO FISCAL 2016
In fiscal 2017, revenues increased 6% or $76,471 compared to fiscal 2016 due primarily to strong growth in services and support revenue, as discussed below.
Operating expenses increased 7%, partially due to the gain on the sale of our Alogent business (“Alogent”) in fiscal 2016, which is discussed below in the operating expenses section.
Provision for income taxes increased 9% in fiscal 2017 compared to fiscal 2016 due a lower effective tax rate in the earlier year, which is described in the following discussion.
The above changes resulted in a 1% decrease in net income for fiscal 2017 compared to the prior fiscal year.
REVENUE
Services and Support Year Ended June 30, % Change
2017 2016Services and Support $ 917,548 $ 870,831 5%Percentage of total revenue 64% 64%
Services and support includes: “Outsourcing and cloud” fees that predominantly have contract terms of five years or greater at inception; “Product delivery & services” revenue, which includes revenue from the sales of licenses, implementation services, consulting, and hardware; and “In-house support” revenue, which is composed of maintenance fees which primarily contain annual contract terms.
Fiscal 2017 services and support revenue grew 5% in fiscal 2017 despite Alogent revenue totaling $28,421 being included in fiscal 2016. Excluding that headwind, support and services grew 9%, due mainly to an increase in outsourcing and cloud revenue, along with an increase in product delivery and services revenue resulting from completion of revised contractual obligations on several of our bundled arrangements.

19JACKHENRY.COM
Processing Year Ended June 30, % Change
2017 2016Processing $ 513,569 $ 483,815 6%Percentage of total revenue 36% 36%
Processing revenue includes: “Remittance” revenue from payment processing, remote capture, and automated clearing house (ACH) transactions; “Card” fees, including card transaction processing and monthly fees; and “Transaction and digital” revenue, which includes transaction and mobile processing fees.
Processing revenue increased 6% in fiscal 2017, with strong growth in each of its three components.
OPERATING EXPENSES
Cost of Revenue Year Ended June 30, % Change
2017 2016Cost of Revenue $ 819,034 $ 773,651 6%Percentage of total revenue 57% 57%
Cost of revenue for fiscal 2017 increased 6% compared to fiscal 2016, in line with the revenue increase, and remained a consistent percentage of total revenue in each year.
Research and Development Year Ended June 30, % Change
2017 2016Research and Development $ 84,753 $ 81,234 4%Percentage of total revenue 6% 6%
Research and development expenses increased primarily due to a 4% increase in headcount, but were consistent with the prior year as a percentage of total revenue.
Selling, General, and Administrative Year Ended June 30, % Change
2017 2016Selling, General, and Administrative $ 162,898 $ 157,593 3%Percentage of total revenue 11% 12%
Selling, general, and administrative expenses increased in fiscal 2017 primarily due to increased commissions and headcount, but decreased as a percentage of total revenue.
Gain on Disposal of Businesses
In fiscal 2017, we recognized gains on disposal of businesses totaling $3,270. $2,136 was related to the sale of Alogent, and $1,134 related to the sale of our Regulatory Filing products to Fed Reporter on May 1, 2017.
In fiscal 2016, we sold our Alogent business to Antelope Acquisition Co., an affiliate of Battery Ventures, resulting in a gain of $19,491.
INTEREST INCOME AND EXPENSE Year Ended June 30, % Change
2017 2016Interest Income $ 248 $ 307 (19)%Interest Expense $ (996) $ (1,430) (30)%
Interest income fluctuated due to changes in invested balances and yields on invested balances. Interest expense remained low for both the current and prior years, in line with our average debt balances in both years.
20 2018 ANNUAL REPORT
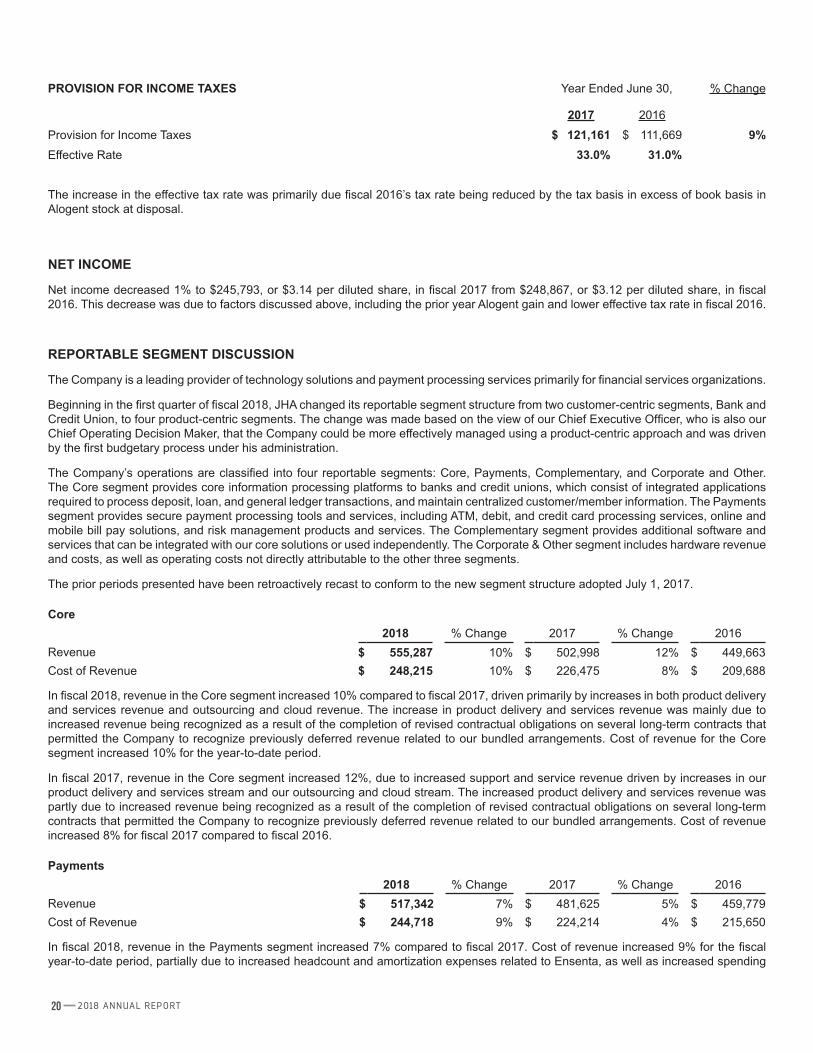
PROVISION FOR INCOME TAXES Year Ended June 30, % Change
2017 2016
Provision for Income Taxes $ 121,161 $ 111,669 9%Effective Rate 33.0% 31.0%
The increase in the effective tax rate was primarily due fiscal 2016’s tax rate being reduced by the tax basis in excess of book basis in Alogent stock at disposal.
NET INCOME
Net income decreased 1% to $245,793, or $3.14 per diluted share, in fiscal 2017 from $248,867, or $3.12 per diluted share, in fiscal 2016. This decrease was due to factors discussed above, including the prior year Alogent gain and lower effective tax rate in fiscal 2016.
REPORTABLE SEGMENT DISCUSSION
The Company is a leading provider of technology solutions and payment processing services primarily for financial services organizations.
Beginning in the first quarter of fiscal 2018, JHA changed its reportable segment structure from two customer-centric segments, Bank and Credit Union, to four product-centric segments. The change was made based on the view of our Chief Executive Officer, who is also our Chief Operating Decision Maker, that the Company could be more effectively managed using a product-centric approach and was driven by the first budgetary process under his administration.
The Company’s operations are classified into four reportable segments: Core, Payments, Complementary, and Corporate and Other. The Core segment provides core information processing platforms to banks and credit unions, which consist of integrated applications required to process deposit, loan, and general ledger transactions, and maintain centralized customer/member information. The Payments segment provides secure payment processing tools and services, including ATM, debit, and credit card processing services, online and mobile bill pay solutions, and risk management products and services. The Complementary segment provides additional software and services that can be integrated with our core solutions or used independently. The Corporate & Other segment includes hardware revenue and costs, as well as operating costs not directly attributable to the other three segments.
The prior periods presented have been retroactively recast to conform to the new segment structure adopted July 1, 2017.
Core2018 % Change 2017 % Change 2016
Revenue $ 555,287 10% $ 502,998 12% $ 449,663Cost of Revenue $ 248,215 10% $ 226,475 8% $ 209,688
In fiscal 2018, revenue in the Core segment increased 10% compared to fiscal 2017, driven primarily by increases in both product delivery and services revenue and outsourcing and cloud revenue. The increase in product delivery and services revenue was mainly due to increased revenue being recognized as a result of the completion of revised contractual obligations on several long-term contracts that permitted the Company to recognize previously deferred revenue related to our bundled arrangements. Cost of revenue for the Core segment increased 10% for the year-to-date period.
In fiscal 2017, revenue in the Core segment increased 12%, due to increased support and service revenue driven by increases in our product delivery and services stream and our outsourcing and cloud stream. The increased product delivery and services revenue was partly due to increased revenue being recognized as a result of the completion of revised contractual obligations on several long-term contracts that permitted the Company to recognize previously deferred revenue related to our bundled arrangements. Cost of revenue increased 8% for fiscal 2017 compared to fiscal 2016.
Payments2018 % Change 2017 % Change 2016
Revenue $ 517,342 7% $ 481,625 5% $ 459,779Cost of Revenue $ 244,718 9% $ 224,214 4% $ 215,650
In fiscal 2018, revenue in the Payments segment increased 7% compared to fiscal 2017. Cost of revenue increased 9% for the fiscal year-to-date period, partially due to increased headcount and amortization expenses related to Ensenta, as well as increased spending

21JACKHENRY.COM
related to our strategic partnership with First Data and PSCU to expand our credit and debit card platform. Excluding deconversion fees from each period and Ensenta revenue from fiscal 2018, along with related costs, revenue increased 5% and costs of revenue also increased 5%.
In fiscal 2017, revenue in the Payments segment increased due primarily to increased card and remittance processing revenue compared to fiscal 2016. Cost of revenue increased 4%.
Complementary2018 % Change 2017 % Change 2016
Revenue $ 412,021 7% $ 385,745 10% $ 349,616Cost of Revenue $ 169,793 6% $ 160,016 7% $ 148,906
Revenue in the Complementary segment increased 7% for the fiscal year ended June 30, 2018 compared to the prior year. The increase was driven by increased outsourcing and cloud services, as well as increased transaction and digital processing. Excluding deconversion fees from each period and Vanguard Software Group revenue from fiscal 2018, revenue increased 6%. Cost of revenue increased 6%, but was a consistent percentage of total revenue in fiscal 2018 and fiscal 2017.
In fiscal 2017, revenue in the Complementary segment increased 10%. The increase was primarily in our support and service revenue, and was driven by increases in our product delivery and services stream and our outsourcing and cloud stream. The increased product delivery and services revenue was due in part to increased revenue being recognized as a result of the completion of revised contractual obligations on several long-term contracts that permitted the Company to recognize previously deferred revenue related to our bundled arrangements. Cost of revenue increased 7% for fiscal 2017 compared to fiscal 2016.
Corporate and Other2018 % Change 2017 % Change 2016
Revenue $ 51,953 (14)% $ 60,749 (36)% $ 95,588Cost of Revenue $ 210,916 1% $ 208,329 4% $ 199,407
Revenue in the Corporate and Other segment for the fiscal year ended June 30, 2018 decreased mainly due to a loss of revenue from our jhaDirect product line, which was disposed near the beginning of fiscal 2018. For fiscal 2017, revenue from jhaDirect totaled $6,536. Revenue classified in the Corporate and Other segment includes revenue from hardware and other products not specifically attributed to any of the other three segments.
The decreased revenue in fiscal 2017 compared to fiscal 2016 in the Corporate and Other segment is largely due to Alogent revenue of $28,422 included in fiscal 2016.
Cost of revenue for the Corporate and Other segment includes operating costs not directly attributable to any of the other three segments.
LIQUIDITY AND CAPITAL RESOURCES
The Company’s cash and cash equivalents decreased to $31,440 at June 30, 2018 from $114,765 at June 30, 2017. The decrease is primarily due to our acquisitions of Vanguard Software Group and Ensenta, the latter of which was partially funded by borrowing on our revolving credit facility, which has now been re-paid.
The following table summarizes net cash from operating activities in the statement of cash flows:Year Ended
June 30,2018 2017
Net income $ 376,660 $ 245,793Non-cash expenses 111,146 186,626Change in receivables (9,219) (22,499)Change in deferred revenue (63,262) (8,800)Change in other assets and liabilities (3,183) (43,798)
Net cash provided by operating activities $ 412,142 $ 357,322
Cash provided by operating activities increased 15% compared to fiscal 2017. Cash from operations is primarily used to repay debt, pay dividends, repurchase stock, and for capital expenditures.

22 2018 ANNUAL REPORT
Cash used in investing activities for fiscal 2018 totaled $291,826 and included: $137,562, net of cash acquired, for the purchases of Ensenta Corporation and Vanguard Software Group; $96,647 for the ongoing enhancements and development of existing and new product and service offerings; capital expenditures on facilities and equipment of $40,135, mainly for the purchase of computer equipment; $13,138 for the purchase and development of internal use software; and $5,000 for the purchase of preferred stock of Automated Bookkeeping, Inc. This was partially offset by $350 of proceeds from the sale of businesses, and $306 of proceeds from asset sales.
Cash used in investing activities for fiscal 2017 totaled $141,586 and included: $89,631 for the development of software; capital expenditures on facilities and equipment of $41,947, mainly for the purchase of computer equipment; and $16,608 for the purchase and development of internal use software. These expenditures were partially offset by $5,632 of proceeds from the sale of businesses and $968 of proceeds from the sale of assets.
Financing activities used cash of $203,641 for fiscal 2018. Cash used was $175,000 for repayment on our revolving credit facility, dividends paid to stockholders of $105,021, and $48,986 for the purchase of treasury shares. These uses were partially offset by borrowings of $125,000 on our revolving credit facility and $366 of net cash inflow from the issuance of stock and tax related to stock-based compensation.
Financing activities used cash in fiscal 2017 of $171,281. Cash used was $130,140 for the purchase of treasury shares, dividends paid to stockholders of $91,707, and repayments of the revolving credit facility and capital leases totaling $30,200. This was partially offset by borrowings of $80,000 and $766 of net cash inflow from the issuance of stock and tax related to stock-based compensation.
At June 30, 2018, the Company had negative working capital of $19,360, however, the largest component of current liabilities was deferred revenue of $355,538, which primarily relates to our annual in-house maintenance agreements and deferred bundled product and service arrangements. The cash outlay necessary to provide the services related to these deferred revenues is significantly less than this recorded balance. In addition, we have not experienced any significant issues with our current collection efforts and we have access to remaining lines of credit in excess of $300,000. We continue to generate substantial cash inflows from operations. Therefore, we do not anticipate any liquidity problems arising from this condition.
Capital Requirements and Resources
The Company generally uses existing resources and funds generated from operations to meet its capital requirements. Capital expenditures totaling $40,135 and $41,947 for the twelve months ending June 30, 2018 and June 30, 2017, respectively, were made primarily for additional equipment and the improvement of existing facilities. These additions were funded from cash generated by operations. At June 30, 2018, the Company had $2,076 of material outstanding purchase commitments related to property and equipment.
The Board of Directors has authorized the Company to repurchase shares of its common stock. Under this authorization, the Company may finance its share repurchases with available cash reserves or short-term borrowings on its existing credit facilities. The share repurchase program does not include specific price targets or timetables and may be suspended at any time. At June 30, 2018, there were 26,108 shares in treasury stock and the Company had the remaining authority to repurchase up to 3,883 additional shares. The total cost of treasury shares at June 30, 2018 is $1,055,260. During fiscal 2018, the Company repurchased 448 treasury shares for $48,986. At June 30, 2017, there were 25,660 shares in treasury stock and the Company had authority to repurchase up to 4,330 additional shares.
Revolving credit facility
The revolving credit facility allows for borrowings of up to $300,000, which may be increased by the Company at any time until maturity to $600,000. The credit facility bears interest at a variable rate equal to (a) a rate based on LIBOR or (b) an alternate base rate (the highest of (i) the Prime Rate for such day, (ii) the sum of the Federal Funds Effective Rate for such day plus 0.50% and (iii) the Eurocurrency Rate for a one-month Interest Period on such day for dollars plus 1.0%), plus an applicable percentage in each case determined by the Company’s leverage ratio. The credit facility is guaranteed by certain subsidiaries of the Company. The credit facility is subject to various financial covenants that require the Company to maintain certain financial ratios as defined in the agreement. As of June 30, 2018, the Company was in compliance with all such covenants. The revolving loan terminates February 20, 2020 and at June 30, 2018 there was no outstanding balance.
Other lines of credit
The Company renewed an unsecured bank credit line on April 24, 2017 which provides for funding of up to $5,000 and bears interest at the prime rate less 1%. The credit line was renewed through April 30, 2019. At June 30, 2018, no amount was outstanding.
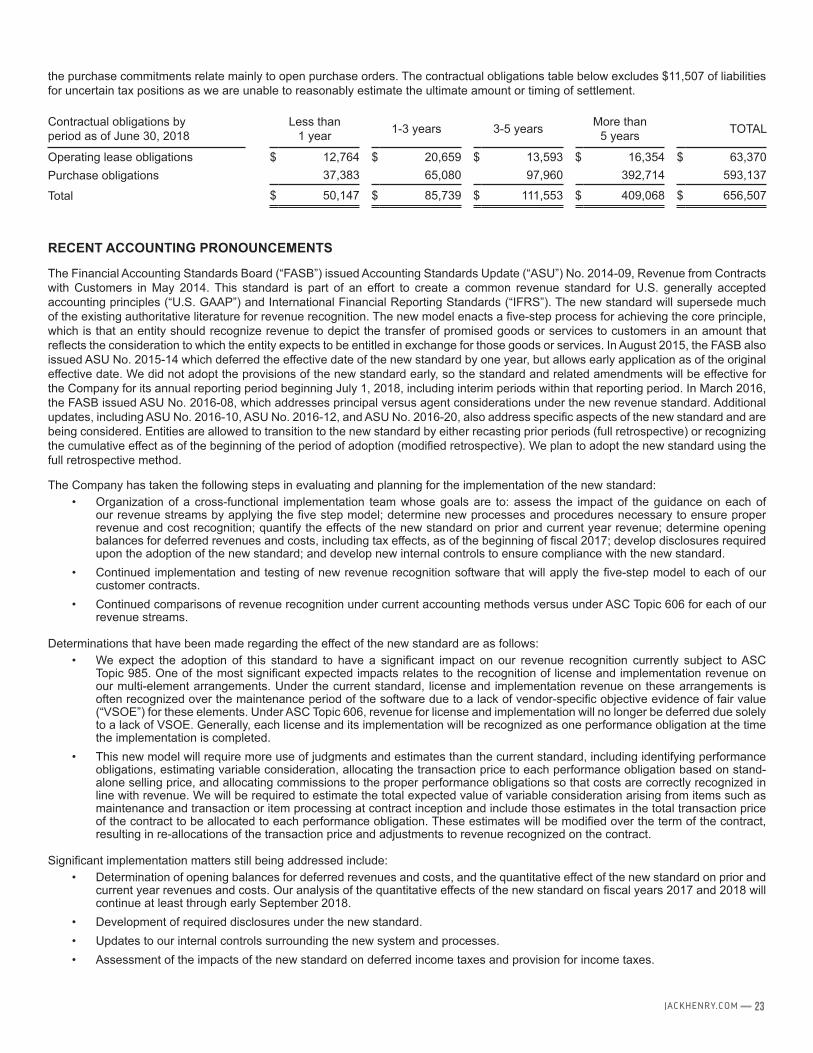
OFF BALANCE SHEET ARRANGEMENTS AND CONTRACTUAL OBLIGATIONS
At June 30, 2018, the Company’s total off balance sheet contractual obligations were $656,507. This balance consists of $63,370 of long-term operating leases for various facilities and equipment which expire from 2019 to 2030 and $593,137 of purchase commitments. JHA entered a strategic services agreement with First Data® and PSCU® to provide full-service debit and credit card processing on a single platform to all existing core bank and credit union customers, as well as expand its card processing platform to financial institutions outside our core customer base. This agreement includes a purchase commitment of $559,354 over the term of the contract. The remainder of
23JACKHENRY.COM
the purchase commitments relate mainly to open purchase orders. The contractual obligations table below excludes $11,507 of liabilities for uncertain tax positions as we are unable to reasonably estimate the ultimate amount or timing of settlement.
Contractual obligations by period as of June 30, 2018
Less than1 year 1-3 years 3-5 years More than
5 years TOTAL
Operating lease obligations $ 12,764 $ 20,659 $ 13,593 $ 16,354 $ 63,370Purchase obligations 37,383 65,080 97,960 392,714 593,137
Total $ 50,147 $ 85,739 $ 111,553 $ 409,068 $ 656,507
RECENT ACCOUNTING PRONOUNCEMENTS
The Financial Accounting Standards Board (“FASB”) issued Accounting Standards Update (“ASU”) No. 2014-09, Revenue from Contracts with Customers in May 2014. This standard is part of an effort to create a common revenue standard for U.S. generally accepted accounting principles (“U.S. GAAP”) and International Financial Reporting Standards (“IFRS”). The new standard will supersede much of the existing authoritative literature for revenue recognition. The new model enacts a five-step process for achieving the core principle, which is that an entity should recognize revenue to depict the transfer of promised goods or services to customers in an amount that reflects the consideration to which the entity expects to be entitled in exchange for those goods or services. In August 2015, the FASB also issued ASU No. 2015-14 which deferred the effective date of the new standard by one year, but allows early application as of the original effective date. We did not adopt the provisions of the new standard early, so the standard and related amendments will be effective for the Company for its annual reporting period beginning July 1, 2018, including interim periods within that reporting period. In March 2016, the FASB issued ASU No. 2016-08, which addresses principal versus agent considerations under the new revenue standard. Additional updates, including ASU No. 2016-10, ASU No. 2016-12, and ASU No. 2016-20, also address specific aspects of the new standard and are being considered. Entities are allowed to transition to the new standard by either recasting prior periods (full retrospective) or recognizing the cumulative effect as of the beginning of the period of adoption (modified retrospective). We plan to adopt the new standard using the full retrospective method.
The Company has taken the following steps in evaluating and planning for the implementation of the new standard:• Organization of a cross-functional implementation team whose goals are to: assess the impact of the guidance on each of
our revenue streams by applying the five step model; determine new processes and procedures necessary to ensure proper revenue and cost recognition; quantify the effects of the new standard on prior and current year revenue; determine opening balances for deferred revenues and costs, including tax effects, as of the beginning of fiscal 2017; develop disclosures required upon the adoption of the new standard; and develop new internal controls to ensure compliance with the new standard.
• Continued implementation and testing of new revenue recognition software that will apply the five-step model to each of our customer contracts.
• Continued comparisons of revenue recognition under current accounting methods versus under ASC Topic 606 for each of our revenue streams.
Determinations that have been made regarding the effect of the new standard are as follows:• We expect the adoption of this standard to have a significant impact on our revenue recognition currently subject to ASC
Topic 985. One of the most significant expected impacts relates to the recognition of license and implementation revenue on our multi-element arrangements. Under the current standard, license and implementation revenue on these arrangements is often recognized over the maintenance period of the software due to a lack of vendor-specific objective evidence of fair value (“VSOE”) for these elements. Under ASC Topic 606, revenue for license and implementation will no longer be deferred due solely to a lack of VSOE. Generally, each license and its implementation will be recognized as one performance obligation at the time the implementation is completed.
• This new model will require more use of judgments and estimates than the current standard, including identifying performance obligations, estimating variable consideration, allocating the transaction price to each performance obligation based on stand-alone selling price, and allocating commissions to the proper performance obligations so that costs are correctly recognized in line with revenue. We will be required to estimate the total expected value of variable consideration arising from items such as maintenance and transaction or item processing at contract inception and include those estimates in the total transaction price of the contract to be allocated to each performance obligation. These estimates will be modified over the term of the contract, resulting in re-allocations of the transaction price and adjustments to revenue recognized on the contract.
Significant implementation matters still being addressed include:• Determination of opening balances for deferred revenues and costs, and the quantitative effect of the new standard on prior and
current year revenues and costs. Our analysis of the quantitative effects of the new standard on fiscal years 2017 and 2018 will continue at least through early September 2018.
• Development of required disclosures under the new standard.• Updates to our internal controls surrounding the new system and processes.• Assessment of the impacts of the new standard on deferred income taxes and provision for income taxes.

24 2018 ANNUAL REPORT
The FASB issued ASU No. 2016-02, Leases, in February 2016. This ASU aims to increase transparency and comparability among organizations by recognizing lease assets and liabilities on the balance sheet and requiring disclosure of key information regarding leasing arrangements. Specifically, the standard requires operating lease commitments to be recorded on the balance sheet as operating lease liabilities and right-of-use assets, and the cost of those operating leases to be amortized on a straight-line basis. ASU No. 2016-02 will be effective for JHA’s annual reporting period beginning July 1, 2019 and early adoption is permitted. At transition, a modified retrospective approach must be utilized to measure leases as of the beginning of the earliest period presented, however, the FASB has provided certain practical expedients, which the Company is currently evaluating. The Company is currently assessing the impact this new standard will have on our consolidated financial statements and when we will adopt it.
The FASB issued ASU No. 2016-09, Improvements to Employee Share-Based Payment Accounting, in March 2016. The new standard is intended to simplify several aspects of the accounting and presentation of share-based payment transactions, including reporting of excess tax benefits and shortfalls, statutory minimum withholding considerations, and classification within the statement of cash flows. The standard allows a one-time accounting policy election to either account for forfeitures as they occur or continue to estimate them. ASU No. 2016-09 was effective for the Company’s annual reporting period beginning July 1, 2017. Management elected to early adopt this standard as of July 1, 2016 and has elected to continue our current practice of estimating forfeitures. The adoption of this standard had the following impacts on our consolidated financial statements.
• Consolidated statements of income- The new standard requires that the tax effects of share-based compensation be recognized in the provision for income taxes. Previously, these amounts were recognized in additional paid-in capital. For fiscal 2018, net tax benefits related to share- based compensation awards of $3,274 were recognized as reductions of income tax expense, reducing our income tax rate by 0.84%, and increasing our basic and diluted earnings per share each by $0.04. For fiscal 2017, net tax benefits related to share-based compensation awards of $2,638 were recognized as reductions of income tax expense. These tax benefits reduced our effective income tax rate by 0.72%, and caused an increase in basic and diluted earnings per share of $0.03 for fiscal 2017. In addition, in calculating potential common shares used to determine diluted earnings per share, U.S. GAAP require us to use the treasury stock method. The new standard requires that assumed proceeds under the treasury stock method be modified to exclude the amount of excess tax benefits that would have been recognized in additional paid-in capital. These changes were applied on a prospective basis.
• Consolidated statements of cash flows- The Company elected to apply the presentation requirements for cash flows related to excess tax benefits retrospectively. The recast for fiscal 2016 resulted in an increase to both net cash provided by operations and net cash used in financing of $1,306. The presentation requirements for cash flows related to employee taxes paid for withheld shares had no impact to any of the periods presented on our consolidated cash flows statements since such cash flows have historically been presented as a financing activity.
ASU 2016-15 issued by the FASB in August 2016 clarifies cash flow classification of eight specific cash flow issues and is effective for our annual reporting period beginning July 1, 2018. We did not adopt the provisions of the new standard early. We do not expect any significant impact to our financial statements as a result of this standard.
CRITICAL ACCOUNTING POLICIES
We prepare our consolidated financial statements in accordance with U.S. GAAP. The significant accounting policies are discussed in Note 1 to the consolidated financial statements. The preparation of consolidated financial statements in accordance with U.S. GAAP requires us to make estimates and judgments that affect the reported amounts of assets, liabilities, revenue and expenses, as well as disclosure of contingent assets and liabilities. We base our estimates and judgments upon historical experience and other factors believed to be reasonable under the circumstances. Changes in estimates or assumptions could result in a material adjustment to the consolidated financial statements.
We have identified several critical accounting estimates. An accounting estimate is considered critical if both: (a) the nature of the estimates or assumptions is material due to the levels of subjectivity and judgment involved, and (b) the impact of changes in the estimates and assumptions would have a material effect on the consolidated financial statements.
Revenue Recognition
We recognize revenue net of any applicable discounts in accordance with U.S. GAAP and with guidance provided within Staff Accounting Bulletins issued by the SEC. The application of these pronouncements requires judgment, including whether a software arrangement includes multiple elements, whether any elements are essential to the functionality of any other elements, and whether “VSOE” of fair value exists for those elements. Customers receive certain elements of our products and services over time. Changes to the elements in a software arrangement or in our ability to identify VSOE for those elements could materially impact the amount of earned and deferred revenue reflected in the financial statements.
License Arrangements: For software license agreements, the Company recognizes revenue when persuasive evidence of an arrangement exists, delivery of the product or service has occurred, the fee is fixed or determinable and collection is probable. For arrangements where the fee is not fixed or determinable, revenue is deferred until payments become due. The Company’s software license agreements generally include multiple products and services or “elements.” Generally, none of these elements are deemed to be essential to the functionality of the other elements.

25JACKHENRY.COM
For multiple element arrangements, which contain software elements and non-software elements, we allocate revenue to the software deliverables as a group and the non-software deliverables as a group based on the relative selling prices of all of the deliverables in the arrangement. For our non-software deliverables, we allocate the arrangement consideration based on the relative selling price of the deliverables using estimated selling price (“ESP”). For our software elements, we use VSOE for this allocation when it can be established and ESP when VSOE cannot be established.
The selling price for each element is based upon the following selling price hierarchy: VSOE if available, third-party evidence (“TPE”) if VSOE is not available, or ESP if neither VSOE nor TPE is available. Generally, we are not able to determine TPE because our go-to-market strategy differs from that of our peers and our offerings contain a significant level of differentiation such that the comparable pricing of products with similar functionality cannot be obtained. ESP is determined after considering both market conditions (such as the sale of similar products in the market place) and entity-specific factors (such as pricing practices and the specifics of each transaction).
For our non-software deliverables, a delivered item is accounted for as a separate unit of accounting if the delivered item has standalone value and if the customer has a general right of return relative to the delivered item, delivery or performance of the undelivered item is probable and substantially within our control.
For our software licenses and related services, including the software elements of multiple-element software and non-software arrangements, U.S. GAAP generally requires revenue earned on software arrangements involving multiple elements to be allocated to each element based on VSOE of fair value. VSOE of fair value is determined for implementation services based on a rate per hour for stand-alone professional services and the estimated hours for the bundled implementation, if the hours can be reasonably estimated. VSOE of fair value is determined for post-contract support (“PCS”) based upon the price charged when sold separately. For a majority of the elements within our software arrangements, we have determined that VSOE cannot be established; therefore, revenue on our software arrangements is generally deferred until the only remaining element is PCS. At that point, the entire arrangement fee is recognized ratably over the remaining PCS period, assuming that all other criteria for revenue recognition have been met. The amounts deferred are included in the balance sheet as deferred revenue and recognized as Bundled Products & Services revenue within Support & Service revenue in the consolidated statements of income.
For arrangements that include specified upgrades, such upgrades are accounted for as a separate element of the arrangement. For those specified upgrades for which VSOE of fair value cannot be determined, revenue related to the software elements within the arrangement is deferred until such specified upgrades have been delivered.
Support and Service Fee Revenue (Non-software): Maintenance support revenue contracted for outside of a license arrangement is recognized pro-rata over the contract period, typically one year.
Outsourced data processing and ATM, debit card, and other transaction processing services revenue is recognized in the month the transactions are processed or the services are rendered.
Hardware Revenue: Hardware revenue is recognized upon delivery to the customer, when title and risk of loss are transferred. The revenue related to these hardware sales is recorded gross, as we are the primary obligor in the contract with the customer. The Company also re-markets maintenance contracts on hardware to our customers. Gross hardware maintenance revenue is recognized ratably over the agreement period.
Revenue-based taxes collected from customers and remitted to governmental authorities are presented on a net basis (i.e., excluded from revenues).
Deferred Costs
Costs for certain software and hardware maintenance contracts with third parties, which are prepaid, are recognized ratably over the life of the maintenance contract, generally one to five years, with the related revenue amortized from deferred revenues.
Direct and incremental fulfillment costs associated with arrangements subject to ASC 985-605 (for which VSOE of fair value cannot be established) are deferred until the only remaining element in the revenue arrangement is PCS at which point the costs are recognized ratably over the remaining PCS period with the related revenue. Deferred direct and incremental costs associated with arrangements not subject to ASC 985-605 consist primarily of certain up-front costs incurred in connection with our software hosting arrangements and are recognized ratably over the contract period which typically ranges from 5-7 years. These costs include commissions, costs of third-party licenses and the direct costs of our implementation services, consisting of payroll and other fringe benefits.
Depreciation and Amortization Expense
The calculation of depreciation and amortization expense is based on the estimated economic lives of the underlying property, plant and equipment and intangible assets, which have been examined for their useful life and determined that no impairment exists. We believe it is unlikely that any significant changes to the useful lives of our tangible and intangible assets will occur in the near term, but rapid changes in technology or changes in market conditions could result in revisions to such estimates that could materially affect the carrying value of these assets and the Company’s future consolidated operating results. We consider whether there is potential for impairment of any long-lived assets, and perform testing for valuation if it is determined that there is a triggering event causing risk of impairment.

26 2018 ANNUAL REPORT
Capitalization of software development costs
We capitalize certain costs incurred to develop commercial software products. For software that is to be sold, significant estimates and assumptions include: establishing when technological feasibility has been met and costs should be capitalized, determining the appropriate period over which to amortize the capitalized costs based on the estimated useful lives, estimating the marketability of the commercial software products and related future revenues, and assessing the unamortized cost balances for impairment. Costs incurred prior to establishing technological feasibility are expensed as incurred. Amortization begins on the date of general release and the appropriate amortization period is based on estimates of future revenues from sales of the products. We consider various factors to project marketability and future revenues, including an assessment of alternative solutions or products, current and historical demand for the product, and anticipated changes in technology that may make the product obsolete.
For internal use software, capitalization begins at the beginning of application development. Costs incurred prior to this are expensed as incurred. Significant estimates and assumptions include determining the appropriate amortization period based on the estimated useful life and assessing the unamortized cost balances for impairment. Amortization begins on the date the software is placed in service and the amortization period is based on estimated useful life.
A significant change in an estimate related to one or more software products could result in a material change to our results of operations.
Estimates used to determine current and deferred income taxes
We make certain estimates and judgments in determining income tax expense for financial statement purposes. These estimates and judgments occur in the calculation of certain tax assets and liabilities, which arise from differences in the timing of recognition of revenue and expense for tax and financial statement purposes. We also must determine the likelihood of recoverability of deferred tax assets, and adjust any valuation allowances accordingly. Considerations include the period of expiration of the tax asset, planned use of the tax asset, and historical and projected taxable income as well as tax liabilities for the tax jurisdiction to which the tax asset relates. Valuation allowances are evaluated periodically and will be subject to change in each future reporting period as a result of changes in one or more of these factors. Also, liabilities for uncertain tax positions require significant judgment in determining what constitutes an individual tax position as well as assessing the outcome of each tax position. Changes in judgment as to recognition or measurement of tax positions can materially affect the estimate of the effective tax rate and consequently, affect our financial results.
Assumptions related to purchase accounting and goodwill
We account for our acquisitions using the purchase method of accounting. This method requires estimates to determine the fair values of assets and liabilities acquired, including judgments to determine any acquired intangible assets such as customer-related intangibles, as well as assessments of the fair value of existing assets such as property and equipment. Liabilities acquired can include balances for litigation and other contingency reserves established prior to or at the time of acquisition, and require judgment in ascertaining a reasonable value. Third-party valuation firms may be used to assist in the appraisal of certain assets and liabilities, but even those determinations would be based on significant estimates provided by us, such as forecast revenues or profits on contract-related intangibles. Numerous factors are typically considered in the purchase accounting assessments, which are conducted by Company professionals from legal, finance, human resources, information systems, program management and other disciplines. Changes in assumptions and estimates of the acquired assets and liabilities would result in changes to the fair values, resulting in an offsetting change to the goodwill balance associated with the business acquired.
As goodwill is not amortized, goodwill balances are regularly assessed for potential impairment. Such assessments require an analysis of future cash flow projections as well as a determination of an appropriate discount rate to calculate present values. Cash flow projections are based on management-approved estimates, which involve the input of numerous Company professionals from finance, operations and program management. Key factors used in estimating future cash flows include assessments of labor and other direct costs on existing contracts, estimates of overhead costs and other indirect costs, and assessments of new business prospects and projected win rates. The Company’s most recent assessment indicates that no reporting units are currently at risk of impairment as the fair value of each reporting unit is significantly in excess of the carrying value. However, significant changes in the estimates and assumptions used in purchase accounting and goodwill impairment testing could have a material effect on the consolidated financial statements.

27JACKHENRY.COM
QUANTITATIVE AND QUALITATIVE DISCLOSURES ABOUT MARKET RISK
Market risk refers to the risk that a change in the level of one or more market prices, interest rates, indices, volatilities, correlations or other market factors such as liquidity, will result in losses for a certain financial instrument or group of financial instruments. We are currently exposed to credit risk on credit extended to customers and interest risk on outstanding debt. We do not currently use any derivative financial instruments. We actively monitor these risks through a variety of controlled procedures involving senior management.
Based on the controls in place and the credit worthiness of the customer base, we believe the credit risk associated with the extension of credit to our customers will not have a material adverse effect on our consolidated financial position, results of operations, or cash flows.
We have no outstanding debt with variable interest rates as of June 30, 2018, and are therefore not currently exposed to interest rate risk.

28 2018 ANNUAL REPORT
FINANCIAL STATEMENTS AND SUPPLEMENTARY DATAIndex to Financial Statements
Report of Independent Registered Public Accounting Firm 29
Management's Annual Report on Internal Control over Financial Reporting 30
Financial Statements
Consolidated Statements of Income,Years Ended June 30, 2018, 2017, and 2016 31
Consolidated Balance Sheets,June 30, 2018 and 2017 32
Consolidated Statements of Changes in Stockholders' Equity,Years Ended June 30, 2018, 2017, and 2016 33
Consolidated Statements of Cash Flows,Years Ended June 30, 2018, 2017, and 2016 34
Notes to Consolidated Financial Statements 35
Financial Statement Schedules
There are no schedules included because they are not applicable or the required information is shown in the consolidated financial statements or notes thereto.

29JACKHENRY.COM
REPORT OF INDEPENDENT REGISTERED PUBLIC ACCOUNTING FIRM
To the Board of Directors and Stockholders of Jack Henry & Associates, Inc.
Opinions on the Financial Statements and Internal Control over Financial ReportingWe have audited the accompanying consolidated balance sheets of Jack Henry & Associates, Inc. and its subsidiaries as of June 30, 2018 and 2017, and the related consolidated statements of income, changes in stockholders’ equity and cash flows for each of the three years in the period ended June 30, 2018, including the related notes (collectively referred to as the “consolidated financial statements”). We also have audited the Company’s internal control over financial reporting as of June 30, 2018, based on criteria established in Internal Control - Integrated Framework (2013) issued by the Committee of Sponsoring Organizations of the Treadway Commission (COSO).
In our opinion, the consolidated financial statements present fairly, in all material respects, the financial position of the Company as of June 30, 2018 and 2017, and the results of their operations and their cash flows for each of the three years in the period ended June 30, 2018 in conformity with accounting principles generally accepted in the United States of America. Also in our opinion, the Company maintained, in all material respects, effective internal control over financial reporting as of June 30, 2018, based on criteria established in Internal Control - Integrated Framework (2013) issued by the COSO.
Basis for OpinionsThe Company’s management is responsible for these consolidated financial statements, for maintaining effective internal control over financial reporting, and for its assessment of the effectiveness of internal control over financial reporting, included in the accompanying Management’s Annual Report on Internal Control over Financial Reporting. Our responsibility is to express opinions on the Company’s consolidated financial statements and on the Company’s internal control over financial reporting based on our audits. We are a public accounting firm registered with the Public Company Accounting Oversight Board (United States) (“PCAOB”) and are required to be independent with respect to the Company in accordance with the U.S. federal securities laws and the applicable rules and regulations of the Securities and Exchange Commission and the PCAOB.
We conducted our audits in accordance with the standards of the PCAOB. Those standards require that we plan and perform the audits to obtain reasonable assurance about whether the consolidated financial statements are free of material misstatement, whether due to error or fraud, and whether effective internal control over financial reporting was maintained in all material respects.
Our audits of the consolidated financial statements included performing procedures to assess the risks of material misstatement of the consolidated financial statements, whether due to error or fraud, and performing procedures that respond to those risks. Such procedures included examining, on a test basis, evidence regarding the amounts and disclosures in the consolidated financial statements. Our audits also included evaluating the accounting principles used and significant estimates made by management, as well as evaluating the overall presentation of the consolidated financial statements. Our audit of internal control over financial reporting included obtaining an understanding of internal control over financial reporting, assessing the risk that a material weakness exists, and testing and evaluating the design and operating effectiveness of internal control based on the assessed risk. Our audits also included performing such other procedures as we considered necessary in the circumstances. We believe that our audits provide a reasonable basis for our opinions.
As described in Management’s Annual Report on Internal Control Over Financial Reporting, management has excluded Ensenta Corporation from its assessment of internal control over financial reporting as of June 30, 2018, because it was acquired by the Company in a purchase business combination during 2018. We have also excluded Ensenta Corporation from our audit of internal control over financial reporting. Ensenta Corporation is a wholly owned subsidiary whose total assets and total revenues excluded from management’s assessment and our audit of internal control over financial reporting represent less than 1% and 1%, respectively, of the related consolidated financial statement amounts as of and for the year ended June 30, 2018.
Definition and Limitations of Internal Control over Financial ReportingA company’s internal control over financial reporting is a process designed to provide reasonable assurance regarding the reliability of financial reporting and the preparation of financial statements for external purposes in accordance with generally accepted accounting principles. A company’s internal control over financial reporting includes those policies and procedures that (i) pertain to the maintenance of records that, in reasonable detail, accurately and fairly reflect the transactions and dispositions of the assets of the company; (ii) provide reasonable assurance that transactions are recorded as necessary to permit preparation of financial statements in accordance with generally accepted accounting principles, and that receipts and expenditures of the company are being made only in accordance with authorizations of management and directors of the company; and (iii) provide reasonable assurance regarding prevention or timely detection of unauthorized acquisition, use, or disposition of the company’s assets that could have a material effect on the financial statements.
Because of its inherent limitations, internal control over financial reporting may not prevent or detect misstatements. Also, projections of any evaluation of effectiveness to future periods are subject to the risk that controls may become inadequate because of changes in conditions, or that the degree of compliance with the policies or procedures may deteriorate.
/s/ PricewaterhouseCoopers LLPKansas City, MissouriAugust 24, 2018
We have served as the Company’s auditor since 2015.

30 2018 ANNUAL REPORT
MANAGEMENT’S ANNUAL REPORT ON INTERNAL CONTROL OVER FINANCIAL REPORTING
The management of Jack Henry & Associates, Inc. is responsible for establishing and maintaining adequate internal control over financial reporting, as such term is defined in Exchange Act Rule 13a-15(f). The Company’s internal control over financial reporting is a process designed to provide reasonable assurance regarding the reliability of financial reporting and the preparation of the Company’s consolidated financial statements for external reporting purposes in accordance with U.S. GAAP.
The Company’s internal control over financial reporting includes policies and procedures pertaining to the maintenance of records that, in reasonable detail, accurately and fairly reflect transactions and dispositions of assets of the Company; provide reasonable assurance transactions are recorded as necessary to permit preparation of consolidated financial statements in accordance with U.S. GAAP, and receipts and expenditures of the Company are being made only in accordance with authorizations of management and the directors of the Company; and provide reasonable assurance regarding prevention or timely detection of unauthorized acquisition, use, or disposition of the Company’s assets that could have a material effect on the Company’s consolidated financial statements. All internal controls, no matter how well designed, have inherent limitations. Therefore, even where internal control over financial reporting is determined to be effective, it can provide only reasonable assurance. Projections of any evaluation of effectiveness to future periods are subject to the risk controls may become inadequate because of changes in conditions, or the degree of compliance with the policies or procedures may deteriorate.
As of June 30, 2018, management conducted an assessment of the effectiveness of the Company’s internal control over financial reporting based on the framework established in Internal Control-Integrated Framework (2013) issued by the Committee of Sponsoring Organizations of the Treadway Commission (COSO). Based on this assessment, management has concluded the Company’s internal control over financial reporting as of June 30, 2018 was effective.
Management’s annual report on internal control over financial reporting excluded Ensenta Corporation, acquired on December 21, 2017. This acquisition is a wholly-owned subsidiary with total assets, excluding goodwill and intangibles, representing less than 1% of consolidated total assets as of June 30, 2018 and revenue representing 1% of consolidated revenue for the fiscal year ended June 30, 2018. If adequately disclosed, companies are permitted to exclude acquisitions made during the fiscal year from their assessment of internal control over financial reporting while integrating the acquired company under guidelines established by the SEC.
The Company’s internal control over financial reporting as of June 30, 2018 has been audited by the Company’s independent registered public accounting firm, as stated in their report appearing in this Item 8.

31JACKHENRY.COM
JACK HENRY & ASSOCIATES, INC. AND SUBSIDIARIESCONSOLIDATED STATEMENTS OF INCOME
(In Thousands, Except Per Share Data)
Year EndedJune 30,
2018 2017 2016
REVENUE $ 1,536,603 $ 1,431,117 $ 1,354,646
EXPENSESCost of Revenue 873,642 819,034 773,651Research and Development 90,340 84,753 81,234Selling, General, and Administrative 182,146 162,898 157,593Gain on Disposal of Businesses (1,894) (3,270) (19,491)
Total Expenses 1,144,234 1,063,415 992,987
OPERATING INCOME 392,369 367,702 361,659
INTEREST INCOME (EXPENSE)Interest income 575 248 307Interest expense (1,920) (996) (1,430)
Total interest income (expense) (1,345) (748) (1,123)
INCOME BEFORE INCOME TAXES 391,024 366,954 360,536
PROVISION FOR INCOME TAXES 14,364 121,161 111,669
NET INCOME $ 376,660 $ 245,793 $ 248,867
Basic earnings per share $ 4.88 $ 3.16 $ 3.13Basic weighted average shares outstanding 77,252 77,856 79,416
Diluted earnings per share $ 4.85 $ 3.14 $ 3.12Diluted weighted average shares outstanding 77,585 78,255 79,734
See notes to consolidated financial statements.

32 2018 ANNUAL REPORT
JACK HENRY & ASSOCIATES, INC. AND SUBSIDIARIESCONSOLIDATED BALANCE SHEETS
(In Thousands, Except Share and Per Share Data)
June 30, 2018
June 30, 2017
ASSETSCURRENT ASSETS:
Cash and cash equivalents $ 31,440 $ 114,765Receivables, net 291,630 276,923Income tax receivable 21,671 20,135Prepaid expenses and other 84,810 66,894Deferred costs 38,985 41,314
Total current assets 468,536 520,031PROPERTY AND EQUIPMENT, net 286,850 282,934
OTHER ASSETS:Non-current deferred costs 95,540 96,847Computer software, net of amortization 288,172 247,317Other non-current assets 107,775 82,525Customer relationships, net of amortization 115,034 90,433Other intangible assets, net of amortization 38,467 36,393Goodwill 649,929 552,465
Total other assets 1,294,917 1,105,980Total assets $ 2,050,303 $ 1,908,945
LIABILITIES AND STOCKHOLDERS' EQUITYCURRENT LIABILITIES:
Accounts payable $ 34,510 $ 6,841Accrued expenses 97,848 81,574Deferred revenues 355,538 382,777
Total current liabilities 487,896 471,192LONG-TERM LIABILITIES:
Non-current deferred revenues 93,094 128,607Deferred income tax liability 189,613 219,541Debt, net of current maturities — 50,000Other long-term liabilities 12,872 7,554
Total long-term liabilities 295,579 405,702
Total liabilities 783,475 876,894STOCKHOLDERS' EQUITY
Preferred stock - $1 par value; 500,000 shares authorized, none issued — —Common stock - $0.01 par value; 250,000,000 shares authorized; 103,278,562 shares issued at June 30, 2018; 103,083,299 shares issued at June 30, 2017 1,033 1,031Additional paid-in capital 464,138 452,016Retained earnings 1,856,917 1,585,278Less treasury stock at cost 26,107,903 shares at June 30, 2018; 25,660,212 shares at June 30, 2017; (1,055,260) (1,006,274)
Total stockholders' equity 1,266,828 1,032,051Total liabilities and equity $ 2,050,303 $ 1,908,945
See notes to consolidated financial statements.

33JACKHENRY.COM
JACK HENRY & ASSOCIATES, INC. AND SUBSIDIARIESCONSOLIDATED STATEMENTS OF CHANGES IN STOCKHOLDERS' EQUITY
(In Thousands, Except Share and Per Share Data)
Year Ended June 30,2018 2017 2016
PREFERRED SHARES: — — —
COMMON SHARES:Shares, beginning of year 103,083,299 102,903,971 102,695,214Shares issued for equity-based payment arrangements 118,865 98,781 121,348Shares issued for Employee Stock Purchase Plan 76,398 80,547 87,409
Shares, end of year 103,278,562 103,083,299 102,903,971
COMMON STOCK - PAR VALUE $0.01 PER SHARE:Balance, beginning of year $ 1,031 $ 1,029 $ 1,027Shares issued for equity-based payment arrangements 1 1 1Shares issued for Employee Stock Purchase Plan 1 1 1
Balance, end of year $ 1,033 $ 1,031 $ 1,029
ADDITIONAL PAID-IN CAPITAL:Balance, beginning of year $ 452,016 $ 440,123 $ 424,536Shares issued for equity-based payment arrangements 174 (1) 696Tax withholding related to share based compensation (7,332) (5,479) (2,590)Shares issued for Employee Stock Purchase Plan 7,522 6,244 5,710Tax benefits from share-based compensation — — 1,051Stock-based compensation expense 11,758 11,129 10,720
Balance, end of year $ 464,138 $ 452,016 $ 440,123
RETAINED EARNINGS:Balance, beginning of year $ 1,585,278 $ 1,431,192 $ 1,266,443Net income 376,660 245,793 248,867Dividends (105,021) (91,707) (84,118)
Balance, end of year $ 1,856,917 $ 1,585,278 $ 1,431,192
TREASURY STOCK:Balance, beginning of year $ (1,006,274) $ (876,134) $ (700,472)Purchase of treasury shares (48,986) (130,140) (175,662)
Balance, end of year $ (1,055,260) $ (1,006,274) $ (876,134)
TOTAL STOCKHOLDERS' EQUITY $ 1,266,828 $ 1,032,051 $ 996,210
Dividends declared per share $ 1.36 $ 1.18 $ 1.06
See notes to consolidated financial statements.

34 2018 ANNUAL REPORT
JACK HENRY & ASSOCIATES, INC. AND SUBSIDIARIESCONSOLIDATED STATEMENTS OF CASH FLOWS
(In Thousands)
Year EndedJune 30,
2018 2017 2016CASH FLOWS FROM OPERATING ACTIVITIES:Net Income $ 376,660 $ 245,793 $ 248,867Adjustments to reconcile net income from operations to net cash from operating activities:
Depreciation 47,975 49,677 50,571Amortization 104,011 90,109 79,077Change in deferred income taxes (51,644) 30,940 37,524Expense for stock-based compensation 11,758 11,129 10,720(Gain)/loss on disposal of assets and businesses (954) 4,771 (16,888)
Changes in operating assets and liabilities:Change in receivables (9,219) (22,499) (13,735)Change in prepaid expenses, deferred costs and other (28,454) (25,088) (29,577)Change in accounts payable 11,072 (7,812) 4,663Change in accrued expenses 9,091 (4,454) 7,460Change in income taxes 5,108 (6,444) (16,624)Change in deferred revenues (63,262) (8,800) 4,364
Net cash from operating activities 412,142 357,322 366,422
CASH FLOWS FROM INVESTING ACTIVITIES:Payment for acquisitions, net of cash acquired (137,562) — (8,275)Capital expenditures (40,135) (41,947) (56,325)Proceeds from the sale of businesses 350 5,632 34,030Proceeds from the sale of assets 306 968 2,844Internal use software (13,138) (16,608) (11,826)Computer software developed (96,647) (89,631) (96,411)Purchase of investments (5,000) — —
Net cash from investing activities (291,826) (141,586) (135,963)
CASH FLOWS FROM FINANCING ACTIVITIES:Borrowings on credit facilities 125,000 80,000 100,000Repayments on credit facilities (175,000) (30,200) (152,500)Purchase of treasury stock (48,986) (130,140) (175,662)Dividends paid (105,021) (91,707) (84,118)Proceeds from issuance of common stock upon exercise of stock options 176 1 697
Minimum tax withholding payments related to share based compensation (7,333) (5,480) (2,590)
Proceeds from sale of common stock 7,523 6,245 5,711Net cash from financing activities (203,641) (171,281) (308,462)
NET CHANGE IN CASH AND CASH EQUIVALENTS $ (83,325) $ 44,455 $ (78,003)
CASH AND CASH EQUIVALENTS, BEGINNING OF PERIOD $ 114,765 $ 70,310 $ 148,313
CASH AND CASH EQUIVALENTS, END OF PERIOD $ 31,440 $ 114,765 $ 70,310
See notes to consolidated financial statements.

35JACKHENRY.COM
JACK HENRY & ASSOCIATES, INC. AND SUBSIDIARIESNOTES TO CONSOLIDATED FINANCIAL STATEMENTS
(In Thousands, Except Per Share Amounts)
NOTE 1. NATURE OF OPERATIONS AND SUMMARY OF SIGNIFICANT ACCOUNTING POLICIES
DESCRIPTION OF THE COMPANYJack Henry & Associates, Inc. and subsidiaries (“JHA” or the “Company”) is a provider of integrated computer systems and services that has developed and acquired a number of banking and credit union software systems. The Company’s revenues are predominately earned by marketing those systems to financial institutions nationwide together with computer equipment (hardware), by providing the conversion and implementation services for financial institutions to utilize JHA systems, and by providing other related services. JHA also provides continuing support and services to customers using in-house or outsourced systems.
CONSOLIDATIONThe consolidated financial statements include the accounts of JHA and all of its subsidiaries, which are wholly-owned, and all intercompany accounts and transactions have been eliminated.
USE OF ESTIMATESThe preparation of financial statements in conformity with accounting principles generally accepted in the United States of America (“U.S. GAAP”) requires management to make estimates and assumptions that affect the reported amounts of assets and liabilities and disclosure of contingent assets and liabilities as of the date of the financial statements and the reported amounts of revenues and expenses during the reporting period. Actual results could differ from those estimates.
PRIOR PERIOD RECLASSIFICATIONDuring the first quarter of fiscal 2018, the Company’s management decided to change the presentation of its income statement, along with a change in the segment structure (see Note 10), in order to more clearly align with the way management manages the Company and evaluates performance. Amounts within the consolidated statements of income for the fiscal years ended June 30, 2017 and June 30, 2016 have been reclassified to improve comparability with the fiscal year ended June 30, 2018. Revenue was previously classified as license, support and service, and hardware, and has been reclassified into one “Revenue” caption. Cost of sales was previously presented under three captions to correspond with our three lines of revenue, and has now been condensed to one caption, “Cost of Revenue”. We have elected to include all operating expenses, including cost of revenue, under one expenses heading. Previously, cost of revenue was presented separately from operating expenses in order to show gross profit. Gross profit has been removed from our current presentation due to management’s focus on operating income. Additionally, within operating expenses, selling and marketing expense and general and administrative expense were previously presented under two captions, but are now condensed under one caption, labeled “Selling, General, and Administrative.”
REVENUE RECOGNITIONThe Company derives revenue from the following sources: license arrangements, support and service fees (non-software) and hardware sales. There are no rights of return or conditions of acceptance in the Company’s sales contracts.
License Arrangements: For software license agreements, the Company recognizes revenue when persuasive evidence of an arrangement exists, delivery of the product or service has occurred, the fee is fixed or determinable and collection is probable. For arrangements where the fee is not fixed or determinable, revenue is deferred until payments become due. The Company’s software license agreements generally include multiple products and services or “elements.” Generally, none of these elements are deemed to be essential to the functionality of the other elements.
For multiple element arrangements, which contain software elements and non-software elements, we allocate revenue to the software deliverables and the non-software deliverables as a group based on the relative selling prices of all of the deliverables in the arrangement. For our non-software deliverables, we allocate the arrangement consideration based on the relative selling price of the deliverables using estimated selling price (“ESP”). For our software elements, we use vendor-specific objective evidence (“VSOE”) for this allocation when it can be established and ESP when VSOE cannot be established.
The selling price for each element is based upon the following selling price hierarchy: VSOE if available, third-party evidence (“TPE”) if VSOE is not available, or ESP if neither VSOE nor TPE is available. Generally, we are not able to determine TPE because our go-to-market strategy differs from that of our peers and our offerings contain a significant level of differentiation such that the comparable pricing of products with similar functionality cannot be obtained. ESP is determined after considering both market conditions (such as the sale of similar products in the market place) and entity-specific factors (such as pricing practices and the specifics of each transaction).
For our non-software deliverables, a delivered item is accounted for as a separate unit of accounting if the delivered item has standalone value and if the customer has a general right of return relative to the delivered item, delivery or performance of the undelivered item is probable and substantially within our control.
36 2018 ANNUAL REPORT
For our software licenses and related services, including the software elements of multiple-element software and non-software arrangements, U.S. GAAP generally require revenue earned on software arrangements involving multiple elements to be allocated to each element based on VSOE of fair value. VSOE of fair value is determined for implementation services based on a rate per hour for stand-alone professional services and the estimated hours for the bundled implementation, if the hours can be reasonably estimated. VSOE of fair value is determined for post-contract support (“PCS”) based upon the price charged when sold separately. For a majority of the elements within our software arrangements, we have determined that VSOE cannot be established; therefore, revenue on our software arrangements is generally deferred until the only remaining element is PCS. At that point, the entire arrangement fee is recognized ratably over the remaining PCS period, assuming that all other criteria for revenue recognition have been met. The amounts deferred are included in the balance sheet as deferred revenue and recognized as Bundled Products & Services revenue within Support & Service revenue in the consolidated statements of income.
For arrangements that include specified upgrades, such upgrades are accounted for as a separate element of the arrangement. For those specified upgrades for which VSOE of fair value cannot be determined, revenue related to the software elements within the arrangement is deferred until such specified upgrades have been delivered.
Total revenue recognized related to our Bundled Products & Services was $131,220, $117,046, and $94,391 for the fiscal years ended June 30, 2018, 2017, and 2016, respectively.
Support and Service Fee Revenue (Non-software): Maintenance support revenue contracted for outside of a license arrangement is recognized pro-rata over the contract period, typically one year.
Outsourced data processing and ATM, debit card, and other transaction processing services revenue is recognized in the month the transactions are processed or the services are rendered.
Hardware Revenue: Hardware revenue is recognized upon delivery to the customer, when title and risk of loss are transferred. In most cases, we do not stock in inventory the hardware products we sell, but arrange for third-party suppliers to drop-ship the products to our customers on our behalf. The revenue related to these hardware sales is recorded gross, as we are the primary obligor in the contract with the customer. The Company also remarkets maintenance contracts on hardware to our customers. Hardware maintenance revenue is recognized ratably over the agreement period.
Revenue-based taxes collected from customers and remitted to governmental authorities are presented on a net basis (i.e., excluded from revenues).
DEFERRED COSTSCosts for certain software and hardware maintenance contracts with third parties, which are prepaid, are recognized ratably over the life of the maintenance contract, generally one to five years, with the related revenue amortized from deferred revenues.
Direct and incremental costs associated with arrangements subject to Accounting Standards Codification (“ASC”) 985-605 (for which VSOE of fair value cannot be established) are deferred until the only remaining element in the revenue arrangement is PCS at which point the costs are recognized ratably over the remaining PCS period with the related revenue. Deferred direct and incremental costs associated with arrangements not subject to ASC 985-605 consist primarily of certain up-front costs incurred in connection with our software hosting arrangements and are recognized ratably over the contract period which typically ranges from 5-7 years. These costs include commissions, costs of third-party licenses and the direct costs of our implementation services, consisting of payroll and other fringe benefits.
DEFERRED REVENUESDeferred revenues consist primarily of prepaid annual software support fees, deferred bundled software arrangements revenue, and prepaid hardware maintenance fees. Deferred bundled software arrangements revenue and hardware maintenance contracts may be recognized over multiple years; therefore, the related deferred revenue and maintenance are classified as current or non-current in accordance with the terms of the contract. Software and hardware deposits received are also reflected as deferred revenues.
The vast majority of our maintenance (PCS) renews annually and runs from July 1 to June 30. Renewal billings are submitted to customers each June and the Company has the right to bill at that date; therefore, we include those billings as gross in deferred revenue and as a receivable on our balance sheet at the end of each fiscal year.
COMPUTER SOFTWARE DEVELOPMENTThe Company capitalizes new product development costs incurred for software to be sold from the point at which technological feasibility has been established through the point at which the product is ready for general availability. Software development costs that are capitalized are evaluated on a product-by-product basis annually and are assigned an estimated economic life based on the type of product, market characteristics, and maturity of the market for that particular product. These costs are amortized based on current and estimated future revenue from the product or on a straight-line basis, whichever yields greater amortization expense. All of this amortization expense is included within Cost of support and service.
The Company capitalizes development costs for internal use software beginning at the start of application development. Amortization begins on the date the software is placed in service and the amortization period is based on estimated useful life.

37JACKHENRY.COM
CASH EQUIVALENTSThe Company considers all highly liquid investments with maturities of three months or less at the time of acquisition to be cash equivalents.
ACCOUNTS RECEIVABLEReceivables are recorded at the time of billing. A reasonable estimate of the realizability of customer receivables is made through the establishment of an allowance for doubtful accounts, which is estimated based on a combination of write-off history, aging analysis, and any specifically known collection issues.
PROPERTY AND EQUIPMENT AND INTANGIBLE ASSETSProperty and equipment is stated at cost and depreciated using the straight-line method over the estimated useful lives of the assets.
Intangible assets consist of goodwill, customer relationships, computer software, and trade names acquired in business acquisitions in addition to internally developed computer software. The amounts are amortized, with the exception of those with an indefinite life (goodwill), over an estimated economic benefit period, generally three to twenty years.
The Company reviews its long-lived assets and identifiable intangible assets with finite lives for impairment whenever events or changes in circumstances have indicated that the carrying amount of its assets might not be recoverable. The Company evaluates goodwill for impairment of value on an annual basis as of January 1 and between annual tests if events or changes in circumstances indicate that the asset might be impaired.
PURCHASE OF INVESTMENTIn the third quarter of fiscal 2018, the Company made an investment totaling $5,000 for the purchase of preferred stock of Automated Bookkeeping, Inc (“Autobooks”), representing a non-controlling share of the voting equity of Autobooks as of that date. This investment was recorded at cost and is included within other non-current assets on our balance sheet. The fair value of this investment has not been estimated, as estimation is not practicable. There have been no events or changes in circumstances that would indicate an impairment. Fair value will not be estimated unless there are identified events or changes in circumstances that may have a significant adverse effect on the fair value of the investment.
COMPREHENSIVE INCOMEComprehensive income for each of the fiscal years ending June 30, 2018, 2017, and 2016 equals the Company’s net income.
REPORTABLE SEGMENT INFORMATIONIn accordance with U.S. GAAP, the Company’s operations are classified as four reportable segments: Core, Payments, Complementary, and Corporate and Other (see Note 13). Substantially all the Company’s revenues are derived from operations and assets located within the United States of America.
COMMON STOCKThe Board of Directors has authorized the Company to repurchase shares of its common stock. Under this authorization, the Company may finance its share repurchases with available cash reserves or short-term borrowings on its existing credit facilities. The share repurchase program does not include specific price targets or timetables and may be suspended at any time. At June 30, 2018, there were 26,108 shares in treasury stock and the Company had the remaining authority to repurchase up to 3,883 additional shares. The total cost of treasury shares at June 30, 2018 is $1,055,260. During fiscal 2018, the Company repurchased 448 treasury shares for $48,986. At June 30, 2017, there were 25,660 shares in treasury stock and the Company had authority to repurchase up to 4,330 additional shares.
EARNINGS PER SHAREPer share information is based on the weighted average number of common shares outstanding during the year. Stock options and restricted stock have been included in the calculation of income per diluted share to the extent they are dilutive. The difference between basic and diluted weighted average shares outstanding is the dilutive effect of outstanding stock options and restricted stock (see Note 10).
INCOME TAXESDeferred tax liabilities and assets are recognized for the tax effects of differences between the financial statement and tax bases of assets and liabilities. A valuation allowance would be established to reduce deferred tax assets if it is more likely than not that a deferred tax asset will not be realized.
The Company recognizes the tax benefit from an uncertain tax position only if it is more likely than not that the tax position will be sustained on examination by the taxing authorities, based upon the technical merits of the position. The tax benefit recognized in the financial statements from such a position is measured based on the largest benefit that has a greater than 50% likelihood of being realized upon ultimate settlement. Also, interest and penalties expense are recognized on the full amount of deferred benefits for uncertain tax positions. Our policy is to include interest and penalties related to unrecognized tax benefits in income tax expense.
RECENT ACCOUNTING PRONOUNCEMENTSThe Financial Accounting Standards Board (“FASB”) issued Accounting Standards Update (“ASU”) No. 2014-09, Revenue from Contracts with Customers in May 2014. This standard is part of an effort to create a common revenue standard for U.S. generally accepted accounting principles (“U.S. GAAP”) and International Financial Reporting Standards (“IFRS”). The new standard will supersede much

38 2018 ANNUAL REPORT
of the existing authoritative literature for revenue recognition. The new model enacts a five-step process for achieving the core principle, which is that an entity should recognize revenue to depict the transfer of promised goods or services to customers in an amount that reflects the consideration to which the entity expects to be entitled in exchange for those goods or services. In August 2015, the FASB also issued ASU No. 2015-14 which deferred the effective date of the new standard by one year, but allows early application as of the original effective date. We did not adopt the provisions of the new standard early, so the standard and related amendments will be effective for the Company for its annual reporting period beginning July 1, 2018, including interim periods within that reporting period. In March 2016, the FASB issued ASU No. 2016-08, which addresses principal versus agent considerations under the new revenue standard. Additional updates, including ASU No. 2016-10, ASU No. 2016-12, and ASU No. 2016-20, also address specific aspects of the new standard and are being considered. Entities are allowed to transition to the new standard by either recasting prior periods (full retrospective) or recognizing the cumulative effect as of the beginning of the period of adoption (modified retrospective). We plan to adopt the new standard using the full retrospective method.
The Company has taken the following steps in evaluating and planning for the implementation of the new standard:• Organization of a cross-functional implementation team whose goals are to: assess the impact of the guidance on each of
our revenue streams by applying the five step model; determine new processes and procedures necessary to ensure proper revenue and cost recognition; quantify the effects of the new standard on prior and current year revenue; determine opening balances for deferred revenues and costs, including tax effects, as of the beginning of fiscal 2017; develop disclosures required upon the adoption of the new standard; and develop new internal controls to ensure compliance with the new standard.
• Continued implementation and testing of new revenue recognition software that will apply the five-step model to each of our customer contracts.
• Continued comparisons of revenue recognition under current accounting methods versus under ASC Topic 606 for each of our revenue streams.
Determinations that have been made regarding the effect of the new standard are as follows:• We expect the adoption of this standard to have a significant impact on our revenue recognition currently subject to ASC Topic
985. One of the most significant expected impacts relates to the recognition of license and implementation revenue on our multi-element arrangements. Under the current standard, license and implementation revenue on these arrangements is often recognized over the maintenance period of the software due to a lack of VSOE for these elements. Under ASC Topic 606, revenue for license and implementation will no longer be deferred due solely to a lack of VSOE. Generally, each license and its implementation will be recognized as one performance obligation at the time the implementation is completed.
• This new model will require more use of judgments and estimates than the current standard, including identifying performance obligations, estimating variable consideration, allocating the transaction price to each performance obligation based on stand-alone selling price, and allocating commissions to the proper performance obligations so that costs are correctly recognized in line with revenue. We will be required to estimate the total expected value of variable consideration, arising from items such as maintenance and transaction or item processing, at contract inception and include those estimates in the total transaction price of the contract to be allocated to each performance obligation. These estimates will be modified over the term of the contract, resulting in re-allocations of the transaction price and adjustments to revenue recognized on the contract.
Significant implementation matters still being addressed include:• Determination of opening balances for deferred revenues and costs, and the quantitative effect of the new standard on prior and
current year revenues and costs. Our analysis of the quantitative effects of the new standard on fiscal years 2017 and 2018 will continue at least through early September 2018.
• Development of required disclosures under the new standard.• Updates to our internal controls surrounding the new system and processes.• Assessment of the impacts of the new standard on deferred income taxes and provision for income taxes.
The FASB issued ASU No. 2016-02, Leases, in February 2016. This ASU aims to increase transparency and comparability among organizations by recognizing lease assets and liabilities on the balance sheet and requiring disclosure of key information regarding leasing arrangements. Specifically, the standard requires operating lease commitments to be recorded on the balance sheet as operating lease liabilities and right-of-use assets, and the cost of those operating leases to be amortized on a straight-line basis. ASU No. 2016-02 will be effective for JHA’s annual reporting period beginning July 1, 2019 and early adoption is permitted. At transition, a modified retrospective approach must be utilized to measure leases as of the beginning of the earliest period presented, however, the FASB has provided certain practical expedients, which the Company is currently evaluating. The Company is currently assessing the impact this new standard will have on our consolidated financial statements and when we will adopt it.
The FASB issued ASU No. 2016-09, Improvements to Employee Share-Based Payment Accounting, in March 2016. The new standard is intended to simplify several aspects of the accounting and presentation of share-based payment transactions, including reporting of excess tax benefits and shortfalls, statutory minimum withholding considerations, and classification within the statement of cash flows. The standard allows a one-time accounting policy election to either account for forfeitures as they occur or continue to estimate them. ASU No. 2016-09 was effective for the Company’s annual reporting period beginning July 1, 2017. Management elected to early adopt this standard as of July 1, 2016 and has elected to continue our current practice of estimating forfeitures. The adoption of this standard had the following impacts on our consolidated financial statements.

39JACKHENRY.COM
• Consolidated statements of income- The new standard requires that the tax effects of share-based compensation be recognized in the provision for income taxes. Previously, these amounts were recognized in additional paid-in capital. For fiscal 2018, net tax benefits related to share- based compensation awards of $3,274 were recognized as reductions of income tax expense, reducing our income tax rate by 0.84%, and increasing our basic and diluted earnings per share each by $0.04. For fiscal 2017, net tax benefits related to share-based compensation awards of $2,638 were recognized as reductions of income tax expense. These tax benefits reduced our effective income tax rate by 0.72%, and caused an increase in basic and diluted earnings per share of $0.03 for fiscal 2017. In addition, in calculating potential common shares used to determine diluted earnings per share, U.S. GAAP require us to use the treasury stock method. The new standard requires that assumed proceeds under the treasury stock method be modified to exclude the amount of excess tax benefits that would have been recognized in additional paid-in capital. These changes were applied on a prospective basis.
• Consolidated statements of cash flows- The Company elected to apply the presentation requirements for cash flows related to excess tax benefits retrospectively. The recast for fiscal 2016 resulted in an increase to both net cash provided by operations and net cash used in financing of $1,306. The presentation requirements for cash flows related to employee taxes paid for withheld shares had no impact to any of the periods presented on our consolidated cash flows statements since such cash flows have historically been presented as a financing activity.
ASU 2016-15 issued by the FASB in August 2016 clarifies cash flow classification of eight specific cash flow issues and is effective for our annual reporting period beginning July 1, 2018. We did not adopt the provisions of the new standard early. We do not expect any significant impact to our financial statements as a result of this standard.
NOTE 2. FAIR VALUE OF FINANCIAL INSTRUMENTS
For cash equivalents, amounts receivable or payable and short-term borrowings, fair values approximate carrying value, based on the short-term nature of the assets and liabilities. The fair value of long-term debt also approximates carrying value as estimated using discounted cash flows based on the Company’s current incremental borrowing rates.
The Company’s estimates of the fair value for financial assets and financial liabilities are based on the framework established in the fair value accounting guidance. The framework is based on the inputs used in valuation, gives the highest priority to quoted prices in active markets, and requires that observable inputs be used in the valuations when available. The three levels of the hierarchy are as follows:
Level 1: inputs to the valuation are quoted prices in an active market for identical assets
Level 2: inputs to the valuation include quoted prices for similar assets in active markets that are observable either directly or indirectly
Level 3: valuation is based on significant inputs that are unobservable in the market and the Company’s own estimates of assumptions that we believe market participants would use in pricing the asset
Fair value of financial assets, included in cash and cash equivalents, and financial liabilities is as follows:Estimated Fair Value Measurements Total Fair
Recurring Fair Value Measurements Level 1 Level 2 Level 3 ValueJune 30, 2018
Financial Assets:Money market funds $ 14,918 $ — $ — $ 14,918
June 30, 2017Financial Assets:
Money market funds $ 68,474 $ — $ — $ 68,474Certificate of Deposit $ — $ 2,001 $ — $ 2,001
Financial Liabilities:Revolving credit facility $ — $ 50,000 $ — $ 50,000
Non-Recurring Fair Value MeasurementsJune 30, 2018
Long-lived assets held for sale (a) $ — $ 1,300 $ — $ 1,300June 30, 2017
Long-lived assets held for sale (a) $ — $ 1,300 $ — $ 1,300
(a) In accordance with ASC Subtopic 360-10, long-lived assets held for sale with a carrying value of $4,575 were written down to their fair value of $1,300, resulting in an impairment totaling $3,275, which was included in earnings for the fiscal year ended June 30, 2017. The Company has entered into an agreement to sell these assets. That sale is expected to be completed during the third quarter of fiscal 2019.

40 2018 ANNUAL REPORT
NOTE 3. PROPERTY AND EQUIPMENT
The classification of property and equipment, together with their estimated useful lives is as follows:June 30,
2018 2017 Estimated Useful LifeLand $ 24,987 $ 24,987Land improvements 25,443 25,362 5 - 20 yearsBuildings 145,016 143,350 20 - 30 yearsLeasehold improvements 48,060 47,291 5 - 30 years (1)
Equipment and furniture 328,864 332,465 3 - 10 yearsAircraft and equipment 38,761 38,522 4 - 10 yearsConstruction in progress 39,872 15,971
651,003 627,948Less accumulated depreciation 364,153 345,014Property and equipment, net $ 286,850 $ 282,934
(1)Lesser of lease term or estimated useful life
Property and equipment included $15,674 and $534 that was in accrued liabilities at June 30, 2018 and 2017, respectively. These amounts were excluded from capital expenditures on the statements of cash flows.
No impairments of property and equipment were recorded in fiscal 2018. In fiscal 2017, we recorded an impairment loss on one of our facilities of $3,275 due to damage caused by water intrusion. The impairment loss is included in the caption “Cost of support and service” in our consolidated statements of income and is included in our Corporate and Other segment.
NOTE 4. OTHER ASSETS
Goodwill
The carrying amount of goodwill for the fiscal years ended June 30, 2018 and 2017, by reportable segments, is as follows:
June 30,Core 2018 2017Beginning balance $ 195,956 $ 195,956Goodwill, acquired during the year — —Goodwill, adjustments related to dispositions — —Ending balance $ 195,956 $ 195,956
PaymentsBeginning balance $ 234,106 $ 234,106Goodwill, acquired during the year 91,098 —Goodwill, adjustments related to dispositions — —Ending balance $ 325,204 $ 234,106
ComplementaryBeginning balance $ 122,403 $ 122,791Goodwill, acquired during the year 6,499 —Goodwill, adjustments related to dispositions (133) (388)Ending balance $ 128,769 $ 122,403
As discussed in Note 13 - Reportable Segment Information, we changed our segment structure at the beginning of fiscal 2018.The prior period above has been recast to reflect the new structure.
Goodwill acquired during fiscal 2018 totaled $97,597, with $91,098 of that resulting from the purchase of Ensenta Corporation, included in the Payments segment. The remaining $6,499 of goodwill acquired during fiscal 2018 resulted from the purchase of Vanguard Software
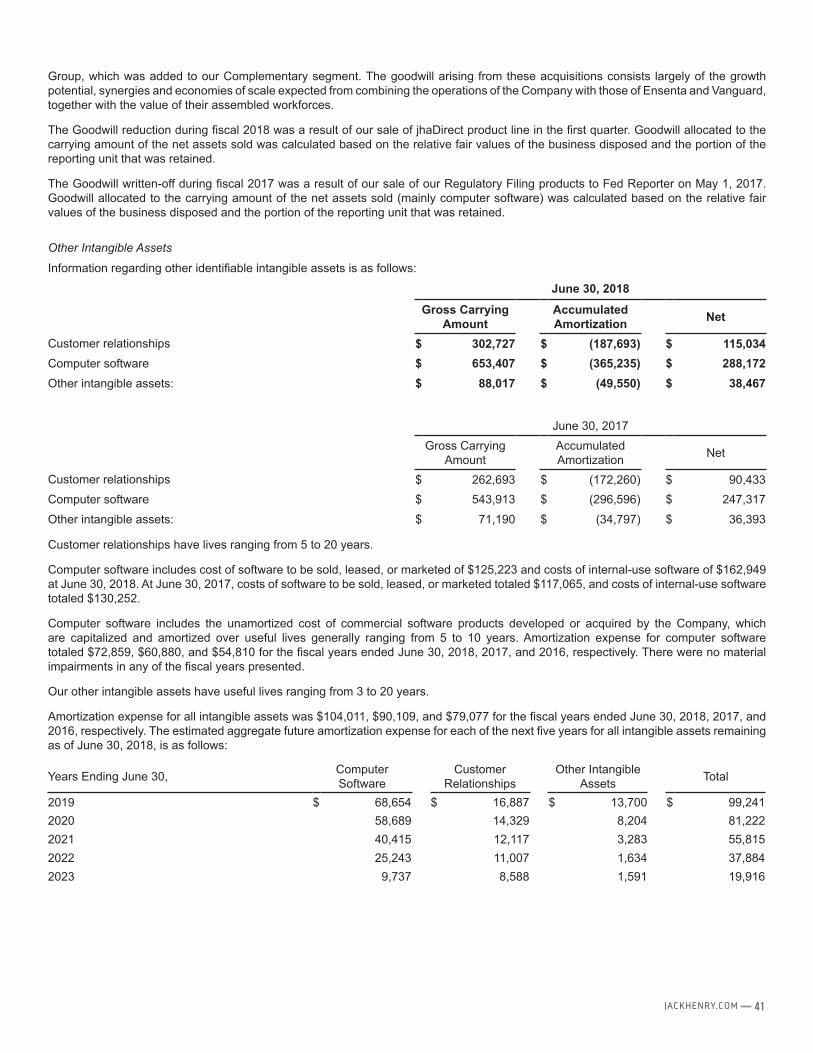
41JACKHENRY.COM
Group, which was added to our Complementary segment. The goodwill arising from these acquisitions consists largely of the growth potential, synergies and economies of scale expected from combining the operations of the Company with those of Ensenta and Vanguard, together with the value of their assembled workforces.
The Goodwill reduction during fiscal 2018 was a result of our sale of jhaDirect product line in the first quarter. Goodwill allocated to the carrying amount of the net assets sold was calculated based on the relative fair values of the business disposed and the portion of the reporting unit that was retained.
The Goodwill written-off during fiscal 2017 was a result of our sale of our Regulatory Filing products to Fed Reporter on May 1, 2017. Goodwill allocated to the carrying amount of the net assets sold (mainly computer software) was calculated based on the relative fair values of the business disposed and the portion of the reporting unit that was retained.
Other Intangible Assets
Information regarding other identifiable intangible assets is as follows:
June 30, 2018
Gross Carrying Amount
Accumulated Amortization Net
Customer relationships $ 302,727 $ (187,693) $ 115,034Computer software $ 653,407 $ (365,235) $ 288,172Other intangible assets: $ 88,017 $ (49,550) $ 38,467
June 30, 2017Gross Carrying
AmountAccumulated Amortization Net
Customer relationships $ 262,693 $ (172,260) $ 90,433Computer software $ 543,913 $ (296,596) $ 247,317
Other intangible assets: $ 71,190 $ (34,797) $ 36,393
Customer relationships have lives ranging from 5 to 20 years.
Computer software includes cost of software to be sold, leased, or marketed of $125,223 and costs of internal-use software of $162,949 at June 30, 2018. At June 30, 2017, costs of software to be sold, leased, or marketed totaled $117,065, and costs of internal-use software totaled $130,252.
Computer software includes the unamortized cost of commercial software products developed or acquired by the Company, which are capitalized and amortized over useful lives generally ranging from 5 to 10 years. Amortization expense for computer software totaled $72,859, $60,880, and $54,810 for the fiscal years ended June 30, 2018, 2017, and 2016, respectively. There were no material impairments in any of the fiscal years presented.
Our other intangible assets have useful lives ranging from 3 to 20 years.
Amortization expense for all intangible assets was $104,011, $90,109, and $79,077 for the fiscal years ended June 30, 2018, 2017, and 2016, respectively. The estimated aggregate future amortization expense for each of the next five years for all intangible assets remaining as of June 30, 2018, is as follows:
Years Ending June 30, Computer Software
CustomerRelationships
Other Intangible Assets Total
2019 $ 68,654 $ 16,887 $ 13,700 $ 99,2412020 58,689 14,329 8,204 81,2222021 40,415 12,117 3,283 55,8152022 25,243 11,007 1,634 37,8842023 9,737 8,588 1,591 19,916

42 2018 ANNUAL REPORT
NOTE 5. DEBT
The Company had no outstanding short-term debt at June 30, 2018 or June 30, 2017. Long-term debt is as follows:June 30, June 30,
2018 2017LONG-TERM DEBTRevolving credit facility $ — $ 50,000
Revolving credit facility
The revolving credit facility provides for borrowings of up to $300,000, which may be increased by the Company at any time until maturity to $600,000. The credit facility bears interest at a variable rate equal to (a) a rate based on LIBOR or (b) an alternate base rate (the highest of (i) the Prime Rate for such day, (ii) the sum of the Federal Funds Effective Rate for such day plus 0.50% and (iii) the Eurocurrency Rate for a one-month Interest Period on such day for dollars plus 1.0%), plus an applicable percentage in each case determined by the Company’s leverage ratio. The credit facility is guaranteed by certain subsidiaries of the Company. The credit facility is subject to various financial covenants that require the Company to maintain certain financial ratios as defined in the agreement. As of June 30, 2018, the Company was in compliance with all such covenants. The revolving loan terminates February 20, 2020 and at June 30, 2018 there was no outstanding balance.
Other lines of credit
The Company renewed an unsecured bank credit line on April 24, 2017 which provides for funding of up to $5,000 and bears interest at the prime rate less 1.0%. The credit line was renewed through April 30, 2019. At June 30, 2018, no amount was outstanding.
Interest
The Company paid interest of $1,747, $767, and $1,320 during the fiscal years ended June 30, 2018, 2017, and 2016, respectively.
NOTE 6. COMMITMENTS AND CONTINGENCIES Property and Equipment
The Company had $2,076 material commitments at June 30, 2018 to purchase property and equipment. There were no material commitments at June 30, 2017.
Leases
The Company leases certain property under operating leases which expire over the next twelve years, but certain of the leases contain options to extend the lease term. All lease payments are based on the lapse of time but include, in some cases, payments for operating expenses and property taxes. There are no purchase options on real estate leases at this time. Certain leases on real estate are subject to annual escalations for increases in operating expenses and property taxes.
As of June 30, 2018, net future minimum lease payments are as follows:
Years Ending June 30, Lease Payments
2019 $ 12,7642020 11,5892021 9,0702022 7,3652023 6,228Thereafter 16,354Total $ 63,370
Rent expense was $10,835, $10,195, and $10,167 in fiscal 2018, 2017, and 2016 respectively.

43JACKHENRY.COM
NOTE 7. INCOME TAXES
The provision for income taxes consists of the following:
Year Ended June 30,
2018 2017 2016Current:
Federal $ 56,060 $ 80,752 $ 66,574State 9,948 9,469 7,571
Deferred:Federal (58,943) 25,756 34,355State 7,299 5,184 3,169
$ 14,364 $ 121,161 $ 111,669
The tax effects of temporary differences related to deferred taxes shown on the balance sheets were:
June 30,
2018 2017Deferred tax assets:
Contract and service revenues $ 18,606 $ 54,908Expense reserves (bad debts, insurance, franchise tax and vacation) 11,164 14,648Net operating loss and tax credit carryforwards 2,759 3,547Other, net 2,711 2,119Total gross deferred tax assets 35,240 75,222Valuation allowance (515) (357)Net deferred tax assets 34,725 74,865
Deferred tax liabilities:Accelerated tax depreciation (32,026) (36,994)Accelerated tax amortization (141,274) (178,999)Contract and service costs (51,038) (78,413)Total gross deferred liabilities (224,338) (294,406)
Net deferred tax liability $ (189,613) $ (219,541)
The following analysis reconciles the statutory federal income tax rate to the effective income tax rates reflected above:
Year Ended June 30,
2018 2017 2016
Computed "expected" tax expense 28.1% 35.0% 35.0%Increase (reduction) in taxes resulting from:
State income taxes, net of federal income tax benefits 2.9% 2.6% 1.9%Research and development credit (1.8)% (2.0)% (2.5)%Domestic production activities deduction (1.2)% (2.1)% (1.9)%Tax over book basis in subsidiary stock —% —% (1.7)%TCJA deferred tax rate re-measurement (24.2)% —% —%Tax effects of share-based payments (0.8)% (0.7)% —%Other (net) 0.7% 0.2% 0.2%
3.7% 33.0% 31.0%
On December 22, 2017, the Tax Cuts and Jobs Act of 2017 (“TCJA”) was enacted into law, which includes numerous provisions that impact the Company, including reducing the U.S. federal tax rate, eliminating the Domestic Production Activities Deduction in future tax

44 2018 ANNUAL REPORT
years, and providing expanded asset expensing. The TCJA reduced the U.S. federal statutory corporate income tax rate from 35% to 21%, effective January 1, 2018. For fiscal 2018, a blended U.S. federal statutory tax rate of approximately 28% applied to the Company. The Company recorded a net tax benefit of $118,367 as a result of TCJA.
The staff of the U.S. Securities and Exchange Commission (“SEC”) has recognized the complexity of reflecting the impacts of the TCJA and on December 22, 2017 issued Staff Accounting Bulletin No. 118 (“SAB 118”) providing a measurement period for determining the final financial statement impacts from the TCJA. SAB 118 clarifies accounting for income taxes under ASC 740 if information is not available or complete and provides for up to a one-year period in which to complete the required analyses and accounting. SAB 118 describes three scenarios (or “buckets”) associated with a company’s status of accounting for income tax reform: (1) a company is complete with its accounting for certain effects of tax reform, (2) a company is able to determine a reasonable estimate for certain effects of tax reform and records that estimate as a provisional amount, or (3) a company is not able to determine a reasonable estimate and therefore continues to apply ASC 740, based on the provisions of the tax laws that were in effect immediately prior to the TCJA being enacted.
For the fiscal year ended June 30, 2018, the Company has not completed its accounting for the tax effects of the enactment of the TCJA. The Company has made a reasonable estimate of the effects on its existing current and deferred tax balances in accordance with SAB 118. The Company recognized a provisional net tax benefit of $118,367 for the items on which the Company was able to determine a reasonable estimate, as described below. The provisional tax benefit is included as a component of income tax expense from continuing operations. As a fiscal year taxpayer, the Company utilized certain estimates and forecasts of operations to estimate both the reversal of deferred tax assets and liabilities that existed on the enactment date, as well as the generation of additional deferred tax assets and liabilities over the remainder of the fiscal year ending June 30, 2018. The Company analyzed its deferred tax balances to estimate which of those balances are expected to reverse in fiscal 2018 (at a blended U.S. federal income tax rate of approximately 28%), or thereafter (at a 21% U.S. federal income tax rate) and recognized the income tax impacts of remeasuring the deferred taxes accordingly. The income tax impact of the re-measurement of the net deferred tax liabilities resulted in a reduction to the effective tax rate of 24.2% for the fiscal year ended June 30, 2018. Included in this reduction, is a reduction of the effective tax rate of 1.7% as a result of adjustments made to the re-measurement of the net deferred tax liabilities during the measurement period in accordance with SAB 118.
As of June 30, 2018, we have $4,338 of gross federal net operating loss (“NOL”) carryforwards pertaining to the acquisition of Goldleaf Financial Solutions, Inc., which are expected to be utilized after the application of IRC Section 382. Separately, as of June 30, 2018, we have state NOL carryforwards with a tax-effected value of $1,042. The federal and state losses have varying expiration dates, ranging from fiscal 2018 to 2037. Based on state tax rules which restrict our utilization of these losses, we believe it is more likely than not that $515 of these losses will expire unutilized. Accordingly, a valuation allowance of $515 and $357 has been recorded against these assets as of June 30, 2018 and 2017, respectively.
The Company paid income taxes, net of refunds, of $60,382, $96,074, and $90,307 in fiscal 2018, 2017, and 2016, respectively.
At June 30, 2018, the Company had $10,227 of gross unrecognized tax benefits, $9,366 of which, if recognized, would affect our effective tax rate. At June 30, 2017, the Company had $5,449 of unrecognized tax benefits, $3,990 of which, if recognized, would affect our effective tax rate. We had accrued interest and penalties of $1,279 and $995 related to uncertain tax positions at June 30, 2018 and 2017, respectively. The income tax provision included interest expense and penalties (or benefits) on unrecognized tax benefits of $165, $(105), and $47 in the fiscal years ending June 30, 2018, 2017, and 2016, respectively.
A reconciliation of the unrecognized tax benefits for the fiscal years ended June 30, 2018 and 2017 follows:
Unrecognized Tax Benefits
Balance at July 1, 2016 $ 7,421Additions for current year tax positions 1,457Reductions for current year tax positions —Additions for prior year tax positions 23Reductions for prior year tax positions (766)Settlements (1,040)Reductions related to expirations of statute of limitations (1,646)Balance at June 30, 2017 5,449Additions for current year tax positions 2,157Reductions for current year tax positions —Additions for prior year tax positions 3,130Reductions for prior year tax positions (55)Additions related to business combinations 510Settlements (161)Reductions related to expirations of statute of limitations (803)Balance at June 30, 2018 $ 10,227

45JACKHENRY.COM
The U.S. federal and state income tax returns for fiscal 2015 and all subsequent years remain subject to examination as of June 30, 2018 under statute of limitations rules. We anticipate that potential changes due to lapsing statutes of limitations and examination closures could reduce the unrecognized tax benefits balance by $500 - $1,500 within twelve months of June 30, 2018.
NOTE 8. INDUSTRY AND SUPPLIER CONCENTRATIONS
The Company sells its products to banks, credit unions, and financial institutions throughout the United States and generally does not require collateral. All billings to customers are due 30 days from date of billing. Reserves (which are insignificant at June 30, 2018 and 2017) are maintained for potential credit losses.
In addition, some of the Company’s key solutions are dependent on technology manufactured by IBM Corporation and Microsoft. Termination of the Company’s relationship with either IBM or Microsoft could have a negative impact on the operations of the Company.
NOTE 9. STOCK-BASED COMPENSATION
Our pre-tax operating income for the fiscal years ended June 30, 2018, 2017, and 2016 includes $11,758, $11,129, and $10,720 of equity-based compensation costs, respectively, of which $10,256, $9,861, and $9,712 relates to the restricted stock plans, respectively. Costs is recorded net of estimated forfeitures. The income tax benefits from stock option exercises and restricted stock vests totaled $3,274, $2,638, and $1,051 for the fiscal years ended June 30, 2018, 2017, and 2016, respectively.
2015 Equity Incentive Plan and 2005 Non-Qualified Stock Option Plan
On November 10, 2015, the Company adopted the 2015 Equity Incentive Plan (“2015 EIP”) for its employees and non-employee directors. The plan allows for grants of stock options, stock appreciation rights, restricted stock shares or units, and performance shares or units. The maximum number of shares authorized for issuance under the plan is 3,000. For stock options, terms and vesting periods of the options were determined by the Compensation Committee of the Board of Directors when granted. The option period must expire not more than ten years from the options grant date. The options granted under this plan are exercisable beginning three years after grant at an exercise price equal to 100% of the fair market value of the stock at the grant date. The options terminate upon surrender of the option, ninety days after termination of employment, upon the expiration of one year following notification of a deceased optionee, or 10 years after grant.
The Company previously issued options to outside directors under the 2005 Non-Qualified Stock Option Plan (“2005 NSOP”). No additional stock options may be issued under this plan.
The 2005 NSOP was adopted by the Company on September 23, 2005, for its outside directors. Generally, options were exercisable beginning 6 months after grant at an exercise price equal to the fair market value of the stock at the grant date. For individuals who have served less than four continuous years, 25% of all options will vest after one year of service, 50% shall vest after two years, and 75% shall vest after three years of service on the Board. The options terminate upon surrender of the option, upon the expiration of one year following notification of a deceased optionee, or 10 years after grant. 700 shares of common stock were reserved for issuance under this plan with a maximum of 100 for each director.
A summary of option plan activity under the plans is as follows:Number
of SharesWeighted Average
Exercise PriceAggregate
Intrinsic ValueOutstanding July 1, 2015 100 $ 23.07Granted — —Forfeited — —Exercised (50) 23.99Outstanding July 1, 2016 50 22.14Granted 32 87.27Forfeited — —Exercised (10) 28.52Outstanding July 1, 2017 72 50.04Granted — —Forfeited — —Exercised (20) 17.45Outstanding June 30, 2018 52 $ 62.65 $ 3,500Vested and Expected to Vest June 30, 2018 52 $ 62.65 $ 3,500Exercisable June 30, 2018 20 $ 23.65 $ 2,134

46 2018 ANNUAL REPORT
There were no options granted in fiscal 2018, 32 options granted during fiscal 2017, and no grants during fiscal 2016. The weighted-average fair value at the grant date of options granted during fiscal 2017 was $15.78.
The Company utilized a Black-Scholes option pricing model to estimate fair value of the stock option grants at the grant date. All 32 options granted during fiscal 2017 were granted on July 1, 2016. Assumptions such as expected life, volatility, risk-free interest rate, and dividend yield impact the fair value estimate. These assumptions are subjective and generally require significant analysis and judgment to develop. The risk-free interest rate used in our estimate was determined from external data, while volatility, expected life, and dividend yield assumptions were derived from our historical experience with share-based payment arrangements. The appropriate weight to place on historical experience is a matter of judgment, based on relevant facts and circumstances. The assumptions used in estimating fair value and resulting compensation expenses at the grant dates are as follows:
Expected Life (years) 6.50
Volatility 19.60%
Risk-free interest rate 1.24%
Dividend yield 1.28%
At June 30, 2018, there was $167 of compensation cost yet to be recognized related to outstanding options. The weighted average remaining contractual term on options currently exercisable as of June 30, 2018 was 1.00 year.
The total intrinsic value of options exercised was $2,165, $747, and $3,011 for the fiscal years ended June 30, 2018, 2017, and 2016, respectively.
Restricted Stock Plan and 2015 Equity Incentive Plan
The Restricted Stock Plan was adopted by the Company on November 1, 2005, for its employees. The plan expired on November 1, 2015. Up to 3,000 shares of common stock were available for issuance under the plan. The 2015 EIP was adopted by the Company on November 10, 2015 for its employees. Up to 3,000 shares of common stock are available for issuance under the 2015 Equity Incentive Plan. Upon issuance, shares of restricted stock are subject to forfeiture and to restrictions which limit the sale or transfer of the shares during the restriction period. The restrictions are lifted over periods ranging from 3 years to 5 years from grant date.
The following table summarizes non-vested share awards activity:
Share awardsShares
Weighted Average Grant Date Fair Value
Outstanding July 1, 2015 72 $ 34.28Granted 22 66.31Vested (24) 43.45Forfeited (12) 23.82Outstanding July 1, 2016 58 44.95Granted 17 87.27Vested (38) 37.00Forfeited (1) 65.52Outstanding July 1, 2017 36 73.66Granted — —Vested (12) 58.61Forfeited (1) 64.60Outstanding June 30, 2018 23 $ 81.33
The non-vested share awards granted prior to July 1, 2016 do not participate in dividends during the restriction period. As a result, the weighted-average fair value of the non-vested share awards was based on the fair market value of the Company’s equity shares on the grant date, less the present value of the expected future dividends to be declared during the restriction period, consistent with the methodology for calculating compensation expense on such awards. The non-vested share awards granted during the fiscal years ending June 30, 2018 and 2017 do participate in dividends during the restriction period. The weighted-average fair value of such participating awards was based on the fair market value on the grant date.
At June 30, 2018, there was $201 of compensation expense that has yet to be recognized related to non-vested restricted stock share awards, which will be recognized over a weighted-average period of 0.59 years.
An amendment to the Restricted Stock Plan was adopted by the Company on August 20, 2010. Unit awards were made to employees

47JACKHENRY.COM
remaining in continuous employment throughout the performance period and vary based on the Company’s percentile ranking in Total Shareholder Return (“TSR”) over the performance period compared to a peer group of companies. TSR is defined as the change in the stock price through the performance period plus dividends per share paid during the performance period, all divided by the stock price at the beginning of the performance period. It is the intention of the Company to settle the unit awards in shares of the Company’s stock. Certain Restricted Stock Unit awards are not tied to performance goals, and for such awards, vesting occurs over a period of 1 to 3 years.
The following table summarizes non-vested unit awards as of June 30, 2018, as well as activity for the fiscal year then ended:
Unit awardsShares
Weighted AverageGrant Date Fair Value
Aggregate Intrinsic
Value Outstanding July 1, 2015 499 $ 48.13Granted 130 75.99Vested (99) 44.09Forfeited (101) 45.89Outstanding July 1, 2016 429 58.06Granted 130 77.75Vested (136) 50.12Forfeited (37) 54.30Outstanding July 1, 2017 386 67.84Granted 125 98.41Vested (156) 57.00Forfeited (4) 81.83Outstanding June 30, 2018 351 $83.37 $45,806 The Company utilized a Monte Carlo pricing model customized to the specific provisions of the Company’s plan design to value unit awards subject to performance targets on the grant dates. The weighted average assumptions used in this model to estimate fair value at the grant dates are as follows:
Year Ended June 30,2018 2017 2016
Volatility 15.6% 16.0% 15.6%Risk free interest rate 1.55% 0.93% 1.06%Dividend yield 1.2% 1.3% 1.5%Stock Beta 0.687 0.684 0.741
For the fiscal year ended June 30, 2018, 81 unit awards were granted and measured using the above assumptions. The remaining 44 unit awards granted are not subject to performance targets, and therefore the estimated fair value at measurement date is valued in the same manner as restricted stock award grants.
At June 30, 2018, there was $11,708 of compensation expense that has yet to be recognized related to non-vested restricted stock unit awards, which will be recognized over a weighted-average period of 1.15 years.
The fair value of restricted shares and units at vest date totaled $17,951, $15,085, and $8,677 for the fiscal years ended June 30, 2018, 2017, and 2016, respectively.

48 2018 ANNUAL REPORT
NOTE 10. EARNINGS PER SHARE
The following table reflects the reconciliation between basic and diluted earnings per share.
Year Ended June 30,2018 2017 2016
Net Income $ 376,660 $ 245,793 $ 248,867
Common share information:
Weighted average shares outstanding for basic earnings per share 77,252 77,856 79,416
Dilutive effect of stock options and restricted stock 333 399 318
Weighted average shares outstanding for diluted earnings per share 77,585 78,255 79,734
Basic earnings per share $ 4.88 $ 3.16 $ 3.13Diluted earnings per share $ 4.85 $ 3.14 $ 3.12
Per share information is based on the weighted average number of common shares outstanding for each of the fiscal years. Stock options and restricted stock have been included in the calculation of earnings per share to the extent they are dilutive. The two-class method for computing EPS has not been applied because no outstanding awards contain non-forfeitable rights to participate in dividends. There were 41 anti-dilutive stock options and restricted stock excluded for fiscal 2018, 32 shares excluded for fiscal 2017, and no shares excluded for fiscal 2016.
NOTE 11. EMPLOYEE BENEFIT PLANS
The Company established an employee stock purchase plan in 2006. The plan allows the majority of employees the opportunity to directly purchase shares of the Company at 85% of the closing price of the Company’s stock on or around the fifteenth day of each month. During the fiscal years ended June 30, 2018, 2017 and 2016, employees purchased 76, 81, and 87 shares under this plan at average prices of $98.46, $77.52, and $65.33, respectively. As of June 30, 2018, approximately 1,381 shares remained available for future issuance under the plan. The plan does not meet the criteria as a non-compensatory plan. As a result, the Company records the total dollar value of the stock discount given to employees under the plan as expense.
The Company has a defined contribution plan for its employees: the 401(k) Retirement Savings Plan (the “Plan”). The Plan is subject to the Employee Retirement Income Security Act of 1975 (“ERISA”) as amended. Under the Plan, the Company matches 100% of full time employee contributions up to 5% of eligible compensation subject to a maximum of $5 per year. In order to receive matching contributions, employees must be 18 years of age and be employed for at least six months. The Company has the option of making a discretionary contribution; however, none has been made for any of the three most recent fiscal years. The total matching contributions for the Plan were $18,821, $17,550, and $16,794 for fiscal 2018, 2017 and 2016, respectively.
NOTE 12. BUSINESS ACQUISITION
Ensenta Corporation
On December 21, 2017, the Company acquired all of the equity interest of EST Holdings, Inc. and its wholly-owned subsidiary, EST Interco, Inc., for $134,381 paid in cash. EST Holdings, Inc. and EST Interco, Inc. jointly own all of the outstanding equity of Ensenta Corporation (“Ensenta”), a California-based provider of real-time, cloud-based solutions for mobile and online payments and deposits. This acquisition was partially funded by a draw on the Company’s revolving credit facility, with the remaining amount funded by existing operating cash. The addition of Ensenta Corporation to the JHA Payment Solutions Group expands the Company’s ability to conduct real-time transactions with third-party platforms, extending its presence in the credit union market through shared branching technology.
Management has completed a preliminary purchase price allocation of Ensenta and its assessment of the fair value of acquired assets and liabilities assumed. The recognized amounts of identifiable assets acquired and liabilities assumed, based upon their preliminary fair values as of December 21, 2017 are set forth below:
Current assets $ 14,057Long-term assets 586Identifiable intangible assets 58,806Deferred income tax liability (21,716)Total other liabilities assumed (8,450)Total identifiable net assets 43,283Goodwill 91,098Net assets acquired $ 134,381

49JACKHENRY.COM
The amounts shown above include measurement period adjustments made during the third and fourth quarters of fiscal 2018 related to income tax adjustments and a fair value assessment. The amounts shown above may change as management continues to evaluate the income tax implications of this business combination.
The goodwill of $91,098 arising from this acquisition consists largely of the growth potential, synergies and economies of scale expected from combining the operations of the Company with those of Ensenta, together with the value of Ensenta’s assembled workforce. The goodwill from this acquisition has been allocated to our Payments segment and is not expected to be deductible for income tax purposes.
Identifiable intangible assets from this acquisition consist of customer relationships of $37,800, computer software of $16,505, and other intangible assets of $4,501. The weighted average amortization period for acquired customer relationships, computer software, and other intangible assets is 15 years, 10 years, and 10 years, respectively.
Current assets were inclusive of cash acquired of $7,274. The fair value of current assets acquired included accounts receivable of $4,668, none of which were expected to be uncollectible.
Costs incurred related to the acquisition of Ensenta in fiscal 2018 totaled $339 for legal, valuation, and other fees, and were expensed as incurred within selling, general, and administrative expense.
For the fiscal year ended June 30, 2018, the Company’s consolidated statements of income included revenue of $15,776 and after-tax net income of $8,197. The after-tax net income included a large tax benefit recorded as a result of the TCJA. Excluding the effects of the TCJA, the Company’s after-tax net income resulting from Ensenta’s operations totaled $536.
The accompanying consolidated statements of income for the fiscal year ended June 30, 2018 do not include any revenues and expenses related to this acquisition prior to the acquisition date. The following unaudited pro forma consolidated financial information is presented as if this acquisition had occurred at the beginning of the prior period presented. In addition, this unaudited pro forma financial information is provided for illustrative purposes only and should not be relied upon as necessarily being indicative of the historical results that would have been obtained if the acquisition had actually occurred during this period, or the results that may be obtained in the future as a result of the acquisition.
Year EndedJune 30,
2018 2017Proforma Proforma
Revenue $ 1,549,721 $ 1,454,700Net Income 380,327 247,928Basic Earnings Per Share $ 4.92 $ 3.18Diluted Earnings Per Share $ 4.90 $ 3.17
Vanguard Software Group
On August 31, 2017, the Company acquired all of the equity interest of Vanguard Software Group, a Florida-based company specializing in the underwriting, spreading, and online decisioning of commercial loans, for $10,744 paid in cash. This acquisition was funded using existing operating cash. The addition of Vanguard Software Group to the Company’s ProfitStars® Lending Solutions Group expands functionality offered to clients, allowing for near-real-time communication with JHA’s core processing and ancillary solutions, and also enhances cross-sell opportunities.
Management has completed a purchase price allocation of Vanguard Software Group and its assessment of the fair value of acquired assets and liabilities assumed. The recognized amounts of identifiable assets acquired and liabilities assumed, based upon their fair values as of August 31, 2017 are set forth below:
Current assets $ 1,153Long-term assets 9Identifiable intangible assets 4,200Total liabilities assumed (1,117)Total identifiable net assets 4,245Goodwill 6,499Net assets acquired $ 10,744
The goodwill of $6,499 arising from this acquisition consists largely of the growth potential, synergies and economies of scale expected from combining the operations of the Company with those of Vanguard Software Group, together with the value of Vanguard Software Group’s assembled workforce. The goodwill from this acquisition has been allocated to our Complementary segment and is expected to be deductible for income tax purposes.

50 2018 ANNUAL REPORT
Identifiable intangible assets from this acquisition consist of customer relationships of $2,234, computer software of $1,426, and other intangible assets of $540. The weighted average amortization periods for acquired customer relationships, computer software, and other intangible assets are 15 years, 10 years, and 10 years, respectively.
Current assets were inclusive of cash acquired of $289. The fair value of current assets acquired included accounts receivable of $847, none of which were expected to be uncollectible.
Costs incurred related to the acquisition of Vanguard Software Group were immaterial for the periods presented.
For the fiscal year ended June 30, 2018, the Company’s consolidated statements of income included revenue of $1,369 and after-tax net loss of $940.
The accompanying consolidated statements of income for the fiscal year ended June 30, 2018 do not include any revenues and expenses related to this acquisition prior to the acquisition date. The impact of this acquisition was considered immaterial to both the current and prior periods of our consolidated financial statements and pro forma financial information has not been provided.
Bayside Business Solutions, Inc.
Effective July 1, 2015, the Company acquired all of the equity interests of Bayside Business Solutions, an Alabama-based company that provides technology solutions and payment processing services primarily for the financial services industry, for $10,000 paid in cash. This acquisition was funded using existing operating cash. The acquisition of Bayside Business Solutions expanded the Company’s presence in commercial lending within the industry.
During fiscal 2016, the Company incurred $55 in costs related to the acquisition of Bayside Business Solutions. These costs included fees for legal, valuation and other fees. These costs were included within general and administrative expenses.
The results of Bayside Business Solutions’ operations included in the Company’s consolidated statement of income for the twelve months ended June 30, 2018 included revenue of $7,670 and after-tax net income of $1,620. For fiscal 2017, Bayside Business Solutions contributed $6,536 to revenue, and $1,307 to after-tax net income. For fiscal 2016, Bayside Business Solutions contributed $4,273 to revenue, and $303 after tax to net income.
The accompanying consolidated statements of income do not include any revenues and expenses related to this acquisition prior to the acquisition date. The impact of this acquisition was considered immaterial to both the current and prior periods of our consolidated financial statements and pro forma financial information has not been provided.
NOTE 13. REPORTABLE SEGMENT INFORMATION
The Company is a leading provider of technology solutions and payment processing services primarily for financial services organizations.
Beginning in the first quarter of fiscal 2018, JHA changed its reportable segment structure from two customer-centric segments, Bank and Credit Union, to four product-centric segments. The change was made based on the view of our Chief Executive Officer, who is also our Chief Operating Decision Maker, that the Company could be more effectively managed using a product-centric approach and was driven by the first budgetary process under his administration.
The Company’s operations are classified into four reportable segments: Core, Payments, Complementary, and Corporate and Other. The Core segment provides core information processing platforms to banks and credit unions, which consist of integrated applications required to process deposit, loan, and general ledger transactions, and maintain centralized customer/member information. The Payments segment provides secure payment processing tools and services, including ATM, debit, and credit card processing services, online and mobile bill pay solutions, and risk management products and services. The Complementary segment provides additional software and services that can be integrated with our core solutions or used independently. The Corporate & Other segment includes hardware revenue and costs, as well as operating costs not directly attributable to the other three segments.
The Company evaluates the performance of its segments and allocates resources to them based on various factors, including performance against trend, budget, and forecast. Only revenue and costs of revenue are considered in the evaluation for each segment.
The prior period presented has been retroactively recast to conform to the new segment structure adopted July 1, 2017.

51JACKHENRY.COM
Year Ended June 30, 2018
Core Payments Complementary Corporate & Other Total
REVENUEServices and Support $ 527,722 $ 48,407 $ 350,495 $ 51,797 $ 978,421Processing 27,565 468,935 61,526 156 558,182
Total Revenue 555,287 517,342 412,021 51,953 1,536,603
Cost of Revenue 248,215 244,718 169,793 210,916 873,642Research and Development 90,340Selling, General, and Administrative 182,146Gain on Disposal of Businesses (1,894)
Total Expenses 1,144,234
SEGMENT INCOME $ 307,072 $ 272,624 $ 242,228 $ (158,963)
OPERATING INCOME 392,369
INTEREST INCOME (EXPENSE) (1,345)
INCOME BEFORE INCOME TAXES $ 391,024
Year Ended June 30, 2017
Core Payments Complementary Corporate & Other Total
REVENUEServices and Support $ 477,985 $ 45,980 $ 332,958 $ 60,625 $ 917,548
Processing 25,013 435,645 52,787 124 513,569
Total Revenue 502,998 481,625 385,745 60,749 1,431,117
Cost of Revenue 226,475 224,214 160,016 208,329 819,034Research and Development 84,753Selling, General, and Administrative 162,898Gain on Disposal of Businesses (3,270)
Total Expenses 1,063,415
SEGMENT INCOME $ 276,523 $ 257,411 $ 225,729 $ (147,580)
OPERATING INCOME 367,702
INTEREST INCOME (EXPENSE) (748)
INCOME BEFORE INCOME TAXES $ 366,954

52 2018 ANNUAL REPORT
Year Ended June 30, 2016
Core Payments Complementary Corporate & Other Total
REVENUEServices and Support $ 427,882 $ 45,270 $ 302,258 $ 95,421 $ 870,831
Processing 21,781 414,509 47,358 167 483,815
Total Revenue 449,663 459,779 349,616 95,588 1,354,646
Cost of Revenue 209,688 215,650 148,906 199,407 773,651
Research and Development 81,234
Selling, General, and Administrative 157,593
Gain on Disposal of Businesses (19,491)
Total Expenses 992,987
SEGMENT INCOME $ 239,975 $ 244,129 $ 200,710 $ (103,819)
OPERATING INCOME 361,659
INTEREST INCOME (EXPENSE) (1,123)
INCOME BEFORE INCOME TAXES $ 360,536
The Company has not disclosed any additional asset information by segment, as the information is not produced internally and its preparation is impracticable.
NOTE 14: SUBSEQUENT EVENTS
Dividends
On August 24, 2018, the Company’s Board of Directors declared a cash dividend of $0.37 per share on its common stock, payable on October 2, 2018 to shareholders of record on September 11, 2018.

53JACKHENRY.COM
QUARTERLY FINANCIAL INFORMATION(unaudited)
For the Year Ended June 30, 2018Quarter 1 Quarter 2 Quarter 3 Quarter 4 Total
REVENUE $ 359,934 $ 374,756 $ 384,684 $ 417,229 $ 1,536,603
EXPENSESCost of Revenue 204,715 211,653 221,592 235,682 873,642Research & Development 20,929 22,414 22,591 24,406 90,340Selling, General, & Administrative 43,733 45,613 44,185 48,615 182,146Gain on disposal of businesses (1,705) (189) — — (1,894)
Total Expenses 267,672 279,491 288,368 308,703 1,144,234
OPERATING INCOME 92,262 95,265 96,316 108,526 392,369
INTEREST INCOME (EXPENSE)Interest income 147 146 130 152 575Interest expense (189) (250) (734) (747) (1,920)
Total interest income (expense) (42) (104) (604) (595) (1,345)
INCOME BEFORE INCOME TAXES 92,220 95,161 95,712 107,931 391,024
PROVISION FOR INCOME TAXES 28,809 (60,413) 23,317 22,651 14,364
NET INCOME $ 63,411 $ 155,574 $ 72,395 $ 85,280 $ 376,660
Basic earnings per share $ 0.82 $ 2.01 $ 0.94 $ 1.10 $ 4.88
Basic weighted average shares outstanding 77,283 77,218 77,247 77,261 77,252
Diluted earnings per share $ 0.82 $ 2.01 $ 0.93 $ 1.10 $ 4.85
Diluted weighted average shares outstanding 77,646 77,565 77,546 77,585 77,585

54 2018 ANNUAL REPORT
For the Year Ended June 30, 2017Quarter 1 Quarter 2 Quarter 3 Quarter 4 Total
REVENUE $ 345,028 $ 348,553 $ 353,767 $ 383,769 $ 1,431,117
EXPENSESCost of Revenue 194,763 198,146 206,727 219,398 819,034Research & Development 19,739 20,873 20,801 23,340 84,753Selling, General, & Administrative* 39,109 40,892 39,794 43,103 162,898Gain on disposal of businesses* — 36 (2,286) (1,020) (3,270)
Total Expenses 253,611 259,947 265,036 284,821 1,063,415
OPERATING INCOME 91,417 88,606 88,731 98,948 367,702
INTEREST INCOME (EXPENSE)Interest income 108 60 42 38 248Interest expense (142) (184) (278) (392) (996)
Total interest income (expense) (34) (124) (236) (354) (748)
INCOME BEFORE INCOME TAXES 91,383 88,482 88,495 98,594 366,954
PROVISION FOR INCOME TAXES 29,139 29,668 28,451 33,903 121,161
NET INCOME $ 62,244 $ 58,814 $ 60,044 $ 64,691 $ 245,793
Basic net income per share $ 0.79 $ 0.76 $ 0.77 $ 0.83 $ 3.16
Basic weighted average shares outstanding 78,413 77,814 77,597 77,602 77,856
Diluted net income per share $ 0.79 $ 0.75 $ 0.77 $ 0.83 $ 3.14Diluted weighted average shares outstanding 78,844 78,180 77,932 78,064 78,255
*Gain on disposal of businesses was included in general and administrative expenses within the financial statements previously filed in the Company’s Quarterly Reports on Form 10-Q for the first three quarters of fiscal 2017.

55JACKHENRY.COM
T H I S P A G E L E F T B L A N K

56 2018 ANNUAL REPORT
B O A R D O F D I R E C T O R S
John F. “Jack” PrimCHAIRMAN OF THE BOARD Former Chief Executive Officer, Jack Henry & Associates, Inc.Monett, Missouri
David B. FossPRESIDENT AND CHIEF EXECUTIVE OFFICER Jack Henry & Associates, Inc. Monett, Missouri
Matthew C. Flanigan VICE CHAIRMAN AND LEAD DIRECTOR, JACK HENRY & ASSOCIATES, INC.EXECUTIVE VICE PRESIDENT AND CHIEF FINANCIAL OFFICERLeggett & Platt, IncorporatedCarthage, Missouri
Tom H. Wilson, Jr.MANAGING PARTNERDecisionPoint Advisors, LLCCharlotte, North Carolina
Jacqueline R. FiegelCHAIRMAN/CENTRAL OKLAHOMA AREA Prosperity BankOklahoma City, Oklahoma
Thomas A. WimsettCHAIRMAN AND MANAGING PARTNERWimsett & Company, LLCLouisville, Kentucky
Laura G. Kelly MANAGING DIRECTORCoreLogicIrvine, California
Shruti S. MiyashiroPRESIDENT AND CHIEF EXECUTIVE OFFICEROrange County’s Credit UnionSanta Ana, California
Wesley A. BrownPRESIDENTBent St. Vrain & Company, LLCDenver, Colorado

E X E C U T I V E O F F I C E R S
A N N U A L M E E T I N G
David B. FossPRESIDENT AND CHIEF EXECUTIVE OFFICER
Kevin D. WilliamsCHIEF FINANCIAL OFFICER AND TREASURER
Mark S. ForbisEXECUTIVE VICE PRESIDENT AND CHIEF TECHNOLOGY OFFICER
Craig K. MorganGENERAL COUNSEL AND SECRETARY
Greg R. Adelson VICE PRESIDENT OF JACK HENRY & ASSOCIATES AND GENERAL MANAGER OF JHA PAYMENT SOLUTIONS
Russ L. Bernthal VICE PRESIDENT OF JACK HENRY & ASSOCIATES AND PRESIDENT OF PROFITSTARS
Ted I. Bilke VICE PRESIDENT OF JACK HENRY & ASSOCIATES AND PRESIDENT OF SYMITAR
Ron L. Moses VICE PRESIDENT OF JACK HENRY & ASSOCIATES AND GENERAL MANAGER OF CONSUMER AND COMMERCIAL SOLUTIONS
Stacey E. Zengel VICE PRESIDENT OF JACK HENRY & ASSOCIATES AND PRESIDENT OF JACK HENRY BANKING
The annual meeting of shareholders will be held on Thursday, November 15 at 11 a.m. CT at City of Monett South Park Casino Building, 101 South Lincoln Ave., Monett, Missouri.
F o r m 1 0 - KA copy of the company’s Form 10-K is available upon request to the Chief Financial Officer at the corporate headquarters address or from our website at www.jackhenry.com/financialinformation.
T r a n s f e r A g e n t a n d R e g i s t r a rComputershare Trust Company, N.A.P.O. Box 30170College Station, TX 77842-3170

663 Highway 60P.O. Box 807Monett, MO 65708
M a i l
417-235-6652P h o n e
417-235-4281F a x
jackhenry.como n l i n e