2018 annual report - .net framework
TRANSCRIPT

1

ii
2018 Annual Report BLOWOUT PREVENTION SYSTEM SAFETY EVENTS

iii
ACKNOWLEDGEMENTS
Bureau of Transportation Statistics
Patricia Hu Director Rolf Schmitt Deputy Director Produced under the direction of:
Demetra Collia Director, Office of Safety Data and Analysis
Recommended citation:
Bureau of Transportation Statistics. Blowout Prevention System Safety Events - 2018 Annual Report.
Washington, D.C.: United States Department of Transportation.
https://doi.org/10.21949/1504097

iv
QUALITY ASSURANCE STATEMENT
The Bureau of Transportation Statistics (BTS) provides high-quality information to serve government,
industry, and the public in a manner that promotes public understanding. Standards and policies are used
to ensure and maximize the quality, objectivity, utility, and integrity of its information. BTS reviews
quality issues on a regular basis and adjusts its programs and processes to ensure continuous quality
improvement.
Notice
This document is disseminated under an interagency agreement between the Bureau of Safety and
Environmental Enforcement (BSEE) of the U.S. Department of the Interior (DOI) and BTS of the U.S.
Department of Transportation (DOT) in the interest of information exchange. The U.S. Government
assumes no liability for the report’s content or use. The interagency agreement adheres to the Economy
Act of 1932 as amended (31 USC 1535) and to the Federal Acquisition Regulation 6.002. To the best of
DOI and DOT’s knowledge, the work performed under the agreement does not place BTS in direct
competition with the private sector.

v
TABLE OF CONTENTS
Executive Summary ....................................................................................................................................... 1
Introduction .................................................................................................................................................... 3
Chapter 1: Numbers at a Glance .................................................................................................................. 8
Chapter 2: Events on Subsea BOP Systems ................................................................................................ 9
Reporting Operators ................................................................................................................................................................. 11
Detection Methods ..................................................................................................................................................................... 11
Observed Failures ....................................................................................................................................................................... 13
Events by Subunit ........................................................................................................................................................................ 15
Not-In-Operation Events .......................................................................................................................................................... 17
In-Operation Events ................................................................................................................................................................... 21
Investigation and Failure Analysis (I&A) ................................................................................................................................. 27
Lessons Learned .......................................................................................................................................................................... 32
Chapter 3: Events on Surface BOP Systems ............................................................................................. 36
Reporting Operators ................................................................................................................................................................. 38
Detection Methods ..................................................................................................................................................................... 39
Observed Failures ....................................................................................................................................................................... 40
Not-In-Operation Events .......................................................................................................................................................... 41
In-Operation Events ................................................................................................................................................................... 42
Investigation and Failure Analysis (I&A) ................................................................................................................................. 47
Lessons Learned .......................................................................................................................................................................... 50
Chapter 4: Conclusion and Next Steps ...................................................................................................... 52
Next Steps: Opportunities for Improving Data Quality and Access ............................................................................... 52
Appendix A: The BSEE Well Control Rule ............................................................................................... 54
Appendix B: Confidential Information Protection and Statistical Efficiency Act of 2002 (CIPSEA) . 55
vi
Appendix C: Glossary .................................................................................................................................. 56
Appendix D: Acronym List .......................................................................................................................... 61
Appendix E: Relevant Standards ................................................................................................................ 63
Appendix F: Schematics of BOP System Boundaries .............................................................................. 64

vii
LIST OF FIGURES
Figure 1: Subsea System Events by Year and Operational Status .......................................................................... 9
Figure 2: Subsea System Events and Rig Activity by Operator ............................................................................. 11
Figure 3: Distribution of Subsea System Components and Events by Subunit, 2016-2018 ........................... 16
Figure 4: Events on Rigs with Subsea BOP Systems ................................................................................................ 19
Figure 5: Subsea System Not-In-Operation Events Relative to Rig Activity, 2017 & 2018............................ 21
Figure 6: Components Involved in In-Operation Events Leading to a Stack Pull, by Rig, 2016-2018 ......................... 26
Figure 7: How Root Causes Were Determined, 2016-2018 ................................................................................ 29
Figure 8: Surface System Events by Year and Operational Status ....................................................................... 36
Figure 9: Surface System Events and Rig Activity by Operator ............................................................................ 38
Figure 10: Events on Rigs with Surface BOP Systems ............................................................................................. 42
Figure 11: Surface System In-Operation Events Relative to Rig Activity, 2017 & 2018 ................................. 44
Figure 12: Components Involved in In-Operation Events Leading to a Stack Pull, by Rig, 2016-2018 ....................... 47
Figure 13: Example Choke and Kill Manifold for Subsea Systems ........................................................................ 64
Figure 14: Example Subsea BOP Stack with Optional Locations for Choke and Kill Lines ........................... 64
Figure 15: Example Subsea Ram BOP Space-Out .................................................................................................... 64
Figure 16: Example Surface BOP Ram Space-Out ................................................................................................... 64
LIST OF TABLES
Table 1: GOM Numbers at a Glance ............................................................................................................................ 8
Table 3: Subsea System Exposure Measures ............................................................................................................. 10
Table 2: Subsea System Event Statistics ......................................................................................................................... 10
Table 4: How Subsea System Events Were Detected ............................................................................................ 12
Table 5: How Subsea System Events Were Detected, by Operational Status ................................................. 13
Table 6: Observed Failures on Subsea Systems ....................................................................................................... 14
Table 7: Methods Used to Detect Each Observed Failure Type, 2016-2018 ................................................... 15
Table 8: Subsea System Events Found During the Last Two Phases of Testing ............................................... 18
Table 9: Subsea Stack Pull Rates and Observed Failures ....................................................................................... 23
Table 10: Component Combinations Associated with Reported Subsea Stack Pulls ..................................... 24

viii
Table 11: Component Combinations Associated with Reported Subsea Stack Pulls, 2016-2018 ...................... 25
Table 12: Investigation and Analysis of Subsea System Events ............................................................................. 27
Table 13: Subsea System Event Root Causes ........................................................................................................... 28
Table 14: Root Causes of Subsea Stack Pulls ............................................................................................................ 30
Table 15: Root Causes of Subsea Stack Pulls, 2016-2018 ...................................................................................... 31
Table 16: Follow-Up Actions on Subsea System Events ........................................................................................ 33
Table 17: Surface System Event Statistics ....................................................................................................................... 37
Table 18: Surface System Exposure Measures .......................................................................................................... 37
Table 19: How Surface System Events Were Detected......................................................................................... 39
Table 20: How Surface System Events Were Detected, by Operational Status .............................................. 40
Table 21: Observed Failures on Surface Systems .................................................................................................... 40
Table 22: Methods Used to Detect Each Observed Failure Type, 2016-2018 ................................................. 41
Table 23: Surface Stack Pull Rates and Observed Failures .................................................................................... 45
Table 24: Component Combinations Associated with Reported Surface Stack Pulls .................................... 45
Table 25: Component Combinations Associated with Reported Surface Stack Pulls, 2016-2018 ..................... 46
Table 26: Investigation and Analysis of Surface System Events............................................................................. 48
Table 27: Surface System Event Root Causes ........................................................................................................... 48
Table 28: Root Causes of Surface Stack Pulls ........................................................................................................... 49
Table 29: Root Causes of Surface Stack Pulls, 2016-2018 ..................................................................................... 50
Table 30: Follow-Up Actions on Surface System Events ........................................................................................ 51

ix
PAGE INTENTIONALLY LEFT BLANK

1
EXECUTIVE SUMMARY
The 2018 Annual Report: Blowout Prevention System Safety summarizes blowout prevention (BOP)
equipment failures that occurred during drilling and non-drilling rig operations in the Gulf of Mexico
(GOM) Outer Continental Shelf (OCS). It includes analyses of the types of equipment component
failures reported and key information about them, such as root causes and follow-up actions. The report
also discusses opportunities to improve data quality and accessibility.
This report is based on data from 1,196 failure notifications submitted to SafeOCS in 2018, the second
full year of well control equipment component failure reporting, as well as aggregated data collected
since the program’s start in July 2016. Overall, the amount of rig activity in the GOM increased, while
reporting activity decreased from 2017 to 2018. The number of wells spud, total wells with activity,
number of active operators, and number of BOP days1 increased. However, the number of operators
reporting failure events, the number of rigs involved in those events, and the number of reported events
decreased.
In 2018, 14 of 32 operators associated with rig operations in the GOM reported equipment component
failure events. Reporting operators accounted for 82.1 percent of wells spudded and 85.3 percent of
drilling activity. The reported events occurred on 40 of the 59 rigs operating in the GOM during this
period. Nearly 95 percent of reported events (1,127 of 1,196) pertained to subsea BOP systems, as
opposed to surface BOP systems.
Other observations and findings include the following:
• There were no reported loss of containment (LOC) events in 2018.
• The four operators that reported the most failures represented 89.0 percent of component
events and 47.3 percent of rig activity (measured in BOP days) in the GOM in 2018.
• Leaks remained the most frequently reported observed failure, and wear and tear remained the
most frequently reported root cause of failure events in 2018.
• While the rate of stack pulls has fluctuated from year to year for both subsea and surface
systems, completion of root cause failure analyses (RCFAs) for stack pulls has remained under
50.0 percent, despite the requirement of an RCFA for every stack pull.
1 See Appendix C for definition.

2
• Overall, the percent of events with additional information submitted on causal factors via an
investigation and failure analysis has decreased each year.
• For events on subsea BOP systems, the percent of reported not-in-operation events has steadily
increased each year since 2016.
• For events on surface BOP systems, the percent of reported not-in-operation events has
remained approximately 50.0 percent across the reporting period.
Collecting more detailed, accurate, relevant, and timely equipment failure data can support more in-
depth statistical analyses to inform industry safety improvement efforts. SafeOCS continues to focus on
improvement efforts for data collection, processing, harmonization, and accessibility.

3
INTRODUCTION
The 2018 Annual Report: Blowout Prevention System Safety provides information on well control
equipment component failures reported to SafeOCS during the calendar year. These failures occurred
during drilling and non-drilling rig operations in the Gulf of Mexico (GOM) Outer Continental Shelf
(OCS). Per 30 CFR 250.730(c), operators must report any equipment failures experienced during these
activities to SafeOCS. The annual report includes an overview of the types of failures reported, analysis
of root causes, and a summary of reported lessons learned from failure event investigations. It also
discusses opportunities to improve data quality and accessibility.
About SafeOCS
The Department of Transportation’s Bureau of Transportation Statistics (BTS), a principal federal
statistical agency, entered an interagency agreement with the Department of the Interior’s Bureau of
Safety and Environmental Enforcement (BSEE) to develop, implement, and operate the SafeOCS
program. SafeOCS is a confidential reporting program that collects and analyzes data to advance safety
in oil and gas operations on the OCS. The objective of SafeOCS is to capture and share essential
information across the industry about accident precursors and potential hazards associated with
offshore operations. The Confidential Information Protection and Statistical Efficiency Act of 2002
(CIPSEA) protects the confidentiality of all data submitted directly to SafeOCS.2
Collaboration
This report is the product of wide-ranging collaboration between key stakeholders in the oil and gas
industry and government.
• The Joint Industry Project (JIP) on BOP Reliability Data: In early 2016, the International
Association of Drilling Contractors (IADC) and the International Association of Oil and Gas
Producers (IOGP) created a joint industry project (JIP) to develop a blowout preventer (BOP)
reliability database, building on prior industry efforts. BTS collaborated extensively with the JIP in the
deployment of SafeOCS in 2016, specifically in the design of the data collection system and
supporting documentation. The SafeOCS program continues to receive input from the JIP.
• Internal SME Review Team: SafeOCS retained subject matter experts (SMEs) in drilling
operations; production operations; subsea engineering; equipment testing; and well control
2 For more information on CIPSEA, refer to Appendix B.

4
equipment design and manufacturing, including BOPs, root cause failure analysis, quality assurance,
quality control, and process design. The SMEs reviewed notifications to assess accuracy and
consistency. They helped to validate and clarify BTS and BSEE data and provided input to this report.
• BSEE: BSEE provided BTS with well activity reports, population and exposure data on production
levels, rig activity, and ranges and types of facilities and structures. BSEE-provided data was used for
data validation, benchmarking, and development of exposure measures, described below.
On Estimating Exposure Measures for Equipment and Activity Levels
Exposure measures are sometimes referred to as denominator data or normalizing data because they
represent the population on which statistical values are based. SafeOCS uses exposure measures to
estimate the population of equipment subject to failure and its characteristics. These measures aid in
evaluating aggregated equipment failure information and are used in SafeOCS publications, including this
annual report. Each year, the exposure measure methodologies are further refined.
Exposure Measures from BSEE Well Activity Reports (WARs)
Well activity reporting in the GOM, Pacific, and Alaska OCS regions is required daily or weekly (depending
on the region), per 30 CFR 250.743. Well activity includes drilling and non-drilling operations such as pre-
spud operations,3 drilling, workover operations, well completions, tie-back operations, recompletions,
zone change, modified perforations, well sidetracking, well suspension, temporary abandonment, and
permanent abandonment. Operators must submit WARs for well operations performed by all drilling rigs,
snubbing units, wireline units, coil tubing units, hydraulic workover units, non-rig plug and abandonment
operations, and lift boats.
SafeOCS staff and SMEs review WAR data to provide context for the equipment component failures
reported to SafeOCS. As in previous reports, only WARs for rigs are analyzed regardless of the well
operation performed.4 Measures currently analyzed from WARs include:
• Wells with Activity: The number of wells worked on by rigs.
• Rigs with Activity: The number of rigs with operations.
• Active Operators: The number of operators conducting rig operations.
3 The period preceding the start of drilling activities (Appendix C).
4 Failure reports involving non-rigs are excluded from this annual report, therefore non-rig WARs were also excluded.

5
• Rig hours/days: The hours/days rigs were active. This measure approximates the amount of
time during which an equipment component failure could have occurred within a given period.
• BOP hours/days: The hours/days a BOP and related well control equipment was exposed to
the opportunity for an equipment failure within a given period. For rigs with one BOP, this is
equivalent to their calculated number of rig hours/days. For rigs with two BOPs, their calculated
rig hours/days is multiplied by 1.45, based on the determination that having two BOPs is
approximately equivalent to having 1.45 times the number of components as having one BOP.5
o In-operation BOP hours/days: The hours/days a BOP and related well control
equipment had the opportunity for an in-operation equipment failure or stack pull
within a given period. This number is a subset of BOP hours/days.
• BOP stack runs: The number of times a subsea BOP stack was run from the rig floor (or
other areas at the base of the rig such as the “moonpool”) to the wellhead during a given
period. This number also includes when the stack was being moved from one location to
another while staying submerged. This measure applies to subsea stacks only, as surface stacks
are not "run" or "deployed" to the wellhead.
• BOP stack starts: The number of times a surface BOP stack was assembled on the wellhead
and went into operation. This is referred to in the industry as “rigging up” the BOP. This
measure applies to surface stacks only.
• BOP latches and unlatches: The number of times a BOP stack was latched or unlatched
from a wellhead during a given period.
Exposure Measure from BSEE Boreholes Data
Wells spud data from the BSEE boreholes table provides information on the number of newly “spudded”
wells within a given time frame, providing context for the scope of rig operations in the GOM OCS in
2018. SafeOCS analyzes this data to provide context on the scope of new activity (new wells spudded) in
a given year.
Report Structure
The first section of the 2018 Annual Report, Numbers at a Glance, contains summary statistics and
exposure measures about the reported equipment component failures. The 2018 report presents data
by BOP system type – subsea and surface offshore – facilitating a more in-depth analysis of each BOP
5 For purposes of this report, a one-BOP subsea system is estimated to have ≅ 5,000 components, whereas a two-BOP subsea stack system has ≅ 7,200 components. Counts are general estimates for typical subsea systems; exact counts vary by operator, rig, and individual BOP stack configurations.

6
system’s unique characteristics and the effect on equipment component events. Four significant factors
support organizing the report by BOP system type:
1. COMPLEXITY: Subsea BOP systems have a higher number of components than surface BOP
systems.
2. ACCESSIBILITY OF EQUIPMENT: Most subsea equipment is located 5,000 or more feet below
sea-level and requires a remotely operated vehicle (ROV) to view and access; whereas, almost
all surface system equipment is on deck, visible, and accessible at all times.6
3. ENVIRONMENTAL IMPACT: Water-based fluid almost always powers subsea BOP control
systems; hydraulic oil typically powers surface BOP control systems. Therefore, the potential
consequences of a leak from a surface BOP control system are more significant than from a
subsea BOP control system.7
4. MANAGEMENT OF EQUIPMENT: Rigs with subsea BOPs have a full-time crew of subsea
engineers that operate and maintain equipment. Rigs with surface offshore BOPs generally have
a crew of drillers and mechanics that split oversight duties and responsibility for operating and
maintaining the equipment.
These factors lead to different operational practices for subsea systems compared to surface systems,
such as more time spent during inspections, maintenance, and testing, which result in varied reporting
requirements and outcomes. They also result in diverse methods for conducting investigations and
failure analyses. Within Chapter 2: Events on Subsea BOP Systems and Chapter 3: Events on Surface
BOP Systems, event data are presented by when the event occurred (while not in operation or in
operation) and the percentage of events that led to stack pulls. Investigation and failure analysis results
are also presented separately by type of system.
Appendix C contains a glossary with detailed definitions of technical terms. Within the text of this
report, glossary terms and terms used in the data collection form may be italicized on first use or for
clarity.
6 As an example, more time is spent inspecting, maintaining, and testing specific equipment (such as ram and annular packers) before deployment for subsea stacks, since a failed component might require retrieval of the subsea stack to repair the component. The same equipment on a surface stack would not need as much time to replace, since the stack does not need to be retrieved. 7 Note, however, that wellbore fluid leaks from either subsea or surface systems pose potential environmental impacts.
7
Analysis Information and Data Adjustments
Due to rounding, numbers in tables and figures may not add up to totals. References to the term subsea
and the term surface are related to the type of BOP system on which an event occurred, not the event’s
location in relation to the waterline. BTS received a significant number of 2017 well control equipment
component failure notifications after the publication of the 2017 Annual Report. All reported results and
references to 2017 data in this report encompass updated numbers unless otherwise stated.

8
CHAPTER 1: NUMBERS AT A GLANCE
For 2018, SafeOCS received
equipment failure notifications from
one region, the GOM OCS, which
accounts for over 99 percent of annual
oil and gas production on the OCS.
There were 389 active wells in the
GOM OCS in 2018: 190 wells were
newly spudded, and 199 were active
since the previous year. There were
32 operators actively involved in
drilling and non-drilling activities on
those wells, and of those, 14 operators
submitted equipment failure
notifications. The reported events
occurred on 40 of the 59 rigs
operating in the GOM OCS during the
reporting period.
Table 1 presents the overall exposure
measure statistics for rigs operating in
the GOM OCS in 2016, 2017, and
2018. From 2017 to 2018, the amount
of drilling and non-drilling activity
increased, as evidenced by the higher
number of wells with activity, the higher
number of wells spudded, the increase
in the number of active operators, and
the increase in total BOP days. Though
activity increased overall, the number
of operators reporting failure events, as well as the number of rigs involved in those events, decreased,
pointing to potential underreporting of equipment component failure events. Eighteen (18) stack pull
events were reported in 2018, and no loss of containment events were reported.
Table 1: GOM Numbers at a Glance
Measure 2016 2017 2018
Total Activity Level*
Wells with Activity D.N.A.ᵝ 325 389
Wells Spudded 46 153 190
Active Operators 20 25 32
Rigs Operating 46 60 59
BOP Days 5,607 15,892 16,906
Reporting Operators 14 18 14
Rigs with Events 39 47 40
Total Events Reported** 827 1,421 1,196
Not-in-operation 643 1,176 1,024
In-operation 184 245 172
Stack Pulls† 13 20 18
LOC Events† 0 1 0
Top four operators' contribution‡
Events 81.4% 81.9% 89.0%
Wells with Activity D.N.A. D.N.A. 36.0%
Wells Spudded D.N.A. 32.7% 43.7%
BOP Days 59.2% 52.4% 47.3%
NOTE: Reporting period for 2016 is from July 28 to December 31.
* For the definitions of these measures, see Appendix C.
ᵝ D.N.A. (data not available).
** Total events reported includes those on rigs with subsea or surface
BOP systems, and excludes non-rig events.
† Stack pulls are a subset of in-operation events, and LOC (loss of
containment) events are a subset of stack pulls. For the definition of
stack pull and loss of containment, see Appendix C.
‡ Top four operators’ contribution is by number of notifications
submitted in the listed year. For contribution of BOP days, there may
be a slight underestimation due to limited data.
SOURCE: U.S. Department of Transportation, Bureau of Transportation
Statistics, SafeOCS program.

9
CHAPTER 2: EVENTS ON SUBSEA BOP SYSTEMS
There were 1,127 equipment component failure events on subsea BOP systems (94.2 percent of all
events) reported to SafeOCS in 2018, approximately the same percentage as reported in previous years.
Figure 1 depicts the share of all years’ reported events that were not-in-operation, in-operation, and stack
pulls. Progressively, the percentage of not-in-operation events has increased over the years. This
increase could be a result of more proactive maintenance and testing procedures leading to more
failures being found before going into operation. The percent of in-operation events resulting in stack
pulls increased slightly in 2018 (5.8 percent) from 2017 (5.3 percent).
Figure 1: Subsea System Events by Year and Operational Status
SOURCE: U.S. Department of Transportation, Bureau of Transportation Statistics, SafeOCS program.

10
Key Statistics: Events on Subsea BOP Systems
• No loss of containment (LOC) event was reported in 2018.
• Most reported well control equipment component failure events (94.2 percent) pertained to subsea
BOP systems rather than surface BOP systems.
• Most reported events (87.8 percent) occurred while the subsea system was not in operation, i.e.,
during planned periods of inspection, maintenance, and testing.
• Eight stack pulls were reported in 2018 as compared to 10 in 2017.
• Wear and tear was the most frequently listed root cause, reported for 52.4 percent of events.
Table 2: Subsea System Event Statistics
Measure 2016 2017 2018
Active Operators
Reporting Operators
Rigs with Events
Events Reported
Not-in-operation
In-operation
Stack Pulls
LOC Events
D.N.A.
10
28
760
612
148
11
0
D.N.A.
11
29
1,307
1,119
188
10
1
16
10
24
1,127
990
137
8
0
Top four operators*
Events
Wells with Activity
Wells Spudded
BOP Days
84.1%
D.N.A.
D.N.A.
68.8%
84.4%
D.N.A.
D.N.A.
64.7%
90.8%
61.0%
D.N.A.
66.0%
NOTE: *Top four operators’ contribution.
SOURCE: U.S. Department of Transportation,
Bureau of Transportation Statistics, SafeOCS program.
Table 3: Subsea System Exposure Measures
Measure 2016 2017 2018
Wells with Activity*
Number of Wells with Activity D.N.A. 165 172
Percent of Wells with Failures D.N.A. 52.1% 33.1%
Avg, Failures per Well with Activity D.N.A. 7.9 6.6
Rigs Operating*
Number of Rigs Operating 30 32 31
Rigs with one BOP 12 10 9
Rigs with two BOPs 18 22 22
BOP Days*
Number of BOP Days 5,155.0 10,719.7 9,962.7
Event Rate* 147.4 121.9 113.1
Not-in-operation BOP Days D.N.A. 4,396.0 4,285.7
Not-in-operation Event Rate* D.N.A. 254.5 231.0
In-operation BOP Days D.N.A. 6,323.7 5,677.0
In-operation Event Rate* D.N.A. 29.7 24.1
Stack Pulls 11 10 8
Stack Pull Event Rate* D.N.A. 1.6 1.4
BOP Stack Runs*
Total Stack Runs D.N.A. 200 178
Successful Stack Runs D.N.A. 167 152
In-oper. Failures per Succ. Stack Run D.N.A. 1.1 0.9
KEY: avg—average; in-oper—in operation; succ—successful.
NOTE: *See Appendix C for definition.
SOURCE: U.S. Department of Transportation, Bureau of
Transportation Statistics, SafeOCS program.
11
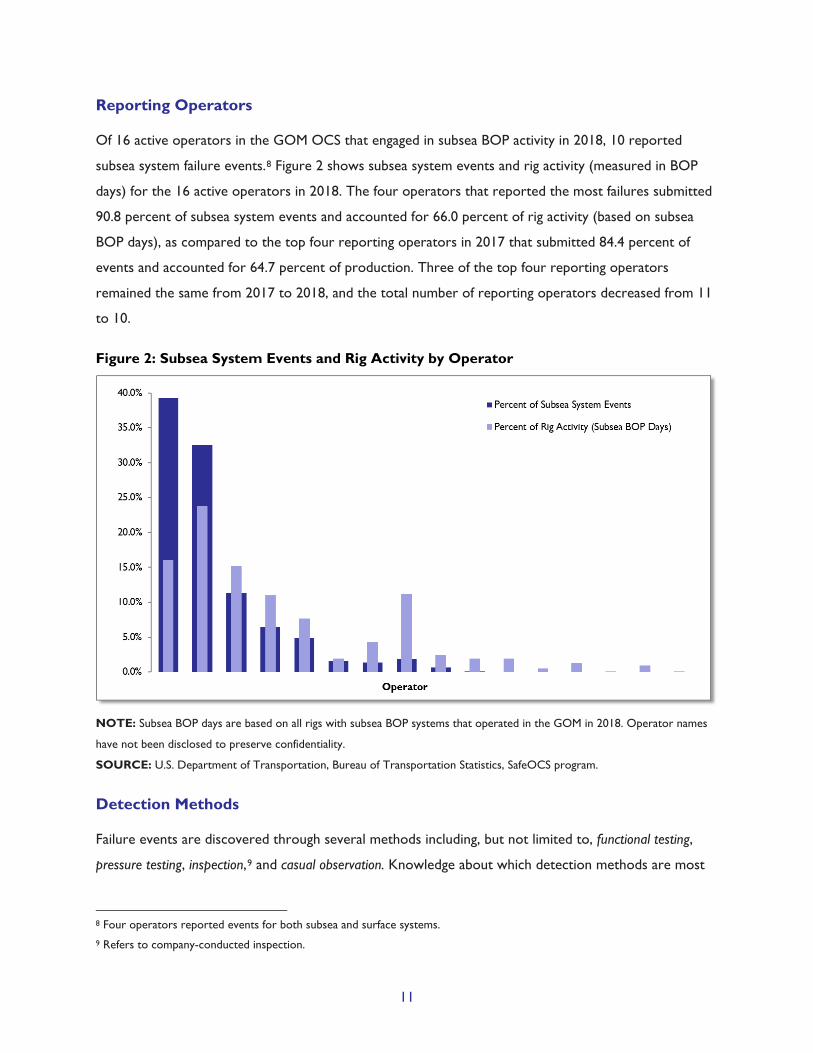
Reporting Operators
Of 16 active operators in the GOM OCS that engaged in subsea BOP activity in 2018, 10 reported
subsea system failure events.8 Figure 2 shows subsea system events and rig activity (measured in BOP
days) for the 16 active operators in 2018. The four operators that reported the most failures submitted
90.8 percent of subsea system events and accounted for 66.0 percent of rig activity (based on subsea
BOP days), as compared to the top four reporting operators in 2017 that submitted 84.4 percent of
events and accounted for 64.7 percent of production. Three of the top four reporting operators
remained the same from 2017 to 2018, and the total number of reporting operators decreased from 11
to 10.
Figure 2: Subsea System Events and Rig Activity by Operator
NOTE: Subsea BOP days are based on all rigs with subsea BOP systems that operated in the GOM in 2018. Operator names
have not been disclosed to preserve confidentiality.
SOURCE: U.S. Department of Transportation, Bureau of Transportation Statistics, SafeOCS program.
Detection Methods
Failure events are discovered through several methods including, but not limited to, functional testing,
pressure testing, inspection,9 and casual observation. Knowledge about which detection methods are most
8 Four operators reported events for both subsea and surface systems. 9 Refers to company-conducted inspection.

12
likely to identify failures can lead to operational practices that increase early detection or failure
prevention. Table 4 shows that on rigs with subsea BOP systems, events have been most frequently
detected via functional testing, pressure testing, and inspection. This is potentially due to current testing
and inspection requirements, as well as more proactive approaches to finding equipment issues before
going into operation. It is worth noting that the percentage of failures identified during inspection has
steadily increased from 2016 to 2018.
Table 4: How Subsea System Events Were Detected
Detection Method 2016 2017 2018
Count Percent Count Percent Count Percent
Functional Testing 229 30.1% 544 41.6% 414 36.7%
Pressure Testing 170 22.4% 216 16.5% 176 15.6%
Inspection 66 8.7% 219 16.8% 253 22.4%
Casual Observation 139 18.3% 131 10.0% 91 8.1%
Continuous Condition Monitoring 83 10.9% 101 7.7% 62 5.5%
Periodic Maintenance 32 4.2% 39 3.0% 68 6.0%
Periodic Condition Monitoring 25 3.3% 29 2.2% 26 2.3%
Corrective Maintenance 11 1.4% 19 1.5% 30 2.7%
On Demand 5 0.7% 9 0.7% 7 0.6%
Total 760 100.0% 1,307 100.0% 1,127 100.0%
NOTE: Detection methods are sorted by the highest number of events reported across all years.
SOURCE: U.S. Department of Transportation, Bureau of Transportation Statistics, SafeOCS program.
Table 5 below explores the relationship between the number of not-in-operation and in-operation
failures found through each detection method. For nearly all detection methods across years, most
events were detected while not-in-operation. The percent of events detected while not-in-operation has
steadily increased for two of the top three detection methods (functional testing and inspection).

13
Table 5: How Subsea System Events Were Detected, by Operational Status
Detection Method 2016 2017 2018
Not-in-operation
In-operation
Not-in-operation
In-operation
Not-in-operation
In-operation
Functional Testing 88.1% 11.9% 93.8% 6.3% 96.6% 3.4%
Pressure Testing 72.4% 27.6% 79.6% 20.4% 78.4% 21.6%
Inspection 81.8% 18.2% 85.8% 14.2% 89.7% 10.3%
Casual Observation 82.0% 18.0% 78.6% 21.4% 80.2% 19.8%
Continuous Condition Monitoring 71.1% 28.9% 65.3% 34.7% 61.3% 38.7%
Periodic Maintenance 96.9% 3.1% 100.0% 0.0% 95.6% 4.4%
Periodic Condition Monitoring 60.0% 40.0% 55.2% 44.8% 47.6% 52.4%
Corrective Maintenance 100.0% 0.0% 100.0% 0.0% 96.7% 3.3%
On Demand 80.0% 20.0% 66.7% 33.3% 71.4% 28.6%
NOTE: Detection methods are sorted by the highest number of events reported across all years.
SOURCE: U.S. Department of Transportation, Bureau of Transportation Statistics, SafeOCS program.
Observed Failures
For each failure notification, operators select an observed failure from a component-specific list.
Examining trends and understanding changes in these observed failures may enable operators to
recognize physical, mechanical, and structural issues within various components and systems. As shown
in Table 6, external leaks, internal leaks, and mechanical damage were the top three observed failures in
2018 for subsea system events, which is consistent with 2016 and 2017 results. While it is not
unexpected that external leaks continue to be the most frequently reported failure (since the majority
of components control and contain fluids present during operations), seeing this trend allows operators
to focus on and target external leak failures for possible improvement. Table 6 shows that the
percentage of in-operation external leaks has decreased steadily from year to year. Proactive measures
to detect external leaks before going into operation may explain the observed decrease. For all
reporting years, external leaks mostly involved control fluids, rather than drilling fluids or wellbore fluids,
which could contain hydrocarbons.

14
Table 6: Observed Failures on Subsea Systems
Observed Failure 2016 2017 2018
Count Percent Count Percent Count Percent
External leak In-operation 58 7.6% 75 5.7% 55 4.9%
External leak Not-in-operation 291 38.3% 584 44.7% 470 41.7%
Internal leak 153 20.1% 314 24.0% 230 20.4%
Mechanical damage 71 9.3% 94 7.2% 143 12.7%
Inaccurate indication 28 3.7% 28 2.1% 33 2.9%
Fail to seal 16 2.1% 25 1.9% 27 2.4%
Fail to provide fluid 6 0.8% 2 0.2% 28 2.5%
Other observed failures* 137 18.0% 185 14.2% 141 12.5%
Total 760 100.0% 1,307 100.0% 1,127 100.0%
NOTE: *Other observed failures consist of those failures with 35 or fewer total events across years. Observed failures are sorted by
the highest total across years.
SOURCE: U.S. Department of Transportation, Bureau of Transportation Statistics, SafeOCS program.
Investigating the relationship between detection method and type of observed failure may provide
insight into which detection methods are most helpful in targeting which types of failures. Table 7 shows
a predominant detection method was associated with certain observed failure types, such as functional
testing with external leaks, and inspection with mechanical damage. The data also shows that each failure
type was often detected in various ways. For example, though most mechanical damage events (178)
were found during inspection, the remaining 130 were found during functional testing, pressure testing,
periodic maintenance, and casual observation, which suggests that the latter methods may be just as
useful for detecting failures. For external leaks, 656 were found via functional testing, and 877 were
found during pressure testing, inspection, and casual observation, which suggests that using a variety of
detection methods may represent a potential best practice.

15
Table 7: Methods Used to Detect Each Observed Failure Type, 2016-2018
Detection Method
Observed Failure
External leak
Internal leak
Mechanical damage
Inaccurate indication
Fail to seal
Functional Testing 656 294 46 37 6
Pressure Testing 255 206 9 4 42
Inspection 217 57 178 9 8
Casual Observation 214 41 22 13 6
Continuous Condition Monitoring 88 37 6 15 3
Periodic Maintenance 49 33 25 3 1
Periodic Condition Monitoring 31 11 1 7 0
Corrective Maintenance 18 16 14 1 2
On Demand 5 2 7 0 0
Total 1,533 697 308 89 68
NOTE: Both detection method and observed failure are sorted by frequency of reporting across all years.
SOURCE: U.S. Department of Transportation, Bureau of Transportation Statistics, SafeOCS program.
Events by Subunit
Each well control equipment subunit10 has unique characteristics that may provide insight into reported
equipment component failure events. Some subunits (such as the BOP stack) vary in the number of
subsystems and components that serve as redundancies, depending on operator equipment
specifications. For the subunits with potential variability in redundancy, an operator may add
redundancies so that the BOP may not need to be retrieved for operations to continue in the event of a
component failure. In contrast, redundancy is not applicable to some other subunits (such as the riser
system) due to physical space limitations. For example, the wellhead connector, located below the BOP
and closer to the well, is the most critical component and does not have the physical capability for
redundancy. Two other items that are not protected by redundancy are the riser connector and the riser
adaptor.
Among the subunits, the BOP controls subunit has yielded the highest proportion of events each year.11
More interestingly, the BOP controls subunit shows the greatest difference between share of failures
10 Reference Appendix C for the definition of subunit. 11 Component counts per subunit are based on subject matter expert estimates of component counts for a “baseline” subsea BOP system.

16
(61.5 percent) and share of total components (44.6 percent) compared to other subunits, as shown in
Figure 3 below. This finding may be due to the fact that the majority of components within the control
systems are hydraulic or electronic control components which are relatively fragile compared to
equipment on other subunits. Also, electronic components in the field are often upgraded more
frequently than the hardware components they operate, and parts which are not as compatible as
previous versions may fail at higher rates.
Figure 3: Distribution of Subsea System Components and Events by Subunit, 2016-2018
SOURCE: U.S. Department of Transportation, Bureau of Transportation Statistics, SafeOCS program.
Similar detection methods, observed failures, and root causes of reported events were found across
subunits, apart from the following observations. For all subunits except the riser system, the most
frequently reported detection method is not-in-operation testing.12 For the choke manifold system,
nearly as many failures were found during in-operation pressure testing (66) as during not-in-operation
pressure testing (68), suggesting that pressure testing is an important failure detection method for the
choke manifold system and that more not-in-operation pressure testing has the potential to catch issues
12 This includes both pressure and functional testing.

17
prior to going into operation. For the riser system, most of the 73 total reported events (65.8 percent)
were found during a single inspection on one rig, showing the importance of proactive inspection.
Not-In-Operation Events
By definition, subsea system not-in-operation events occur when one of the following is true:
1. the BOP is not on the wellhead,
2. the lower marine riser package (LMRP) is not on the BOP, or
3. the BOP and LMRP are both on the wellhead, but initial subsea testing has not been completed.
Events discovered while not in operation are essential for identifying potential equipment issues before
going into operation. Not-in-operation events are found via testing, inspection, routine maintenance, and
other types of monitoring.
Phases of Testing and Initial Latch-Up Events
There are four distinct phases in which not-in-operation failures are found. The first, between-well
maintenance, is the planned period of inspection and scheduled maintenance for all equipment. In
subsequent phases, testing is conducted to prepare equipment for going into operation and check for
any issues not detected during between-well maintenance.
1. BETWEEN-WELL MAINTENANCE: This is the pre-planned time for inspection and maintenance to
find and resolve any equipment issues.
2. PRE-DEPLOYMENT TESTING: Also known as on-deck or stump testing, this is when the BOP stack
equipment is tested on the rig before the stack is lowered into the water. This phase is used to
ensure that the equipment is ready for deployment and to find any issues that were not
discovered during between-well-maintenance.
3. DEPLOYMENT TESTING: This phase is after pre-deployment testing while the BOP is being
lowered, or deployed, to the wellhead. System monitoring and testing are conducted
throughout this process.
4. INITIAL LATCH-UP TESTING: This is the final phase and is similar to deployment testing, but with
the added element of hydrostatic pressure due to operational depth. The BOP must pass all
initial latch-up testing before going into operation.

18
Though most not-in-operation events are found during between-well-maintenance or pre-deployment
testing, some are also found during deployment testing or initial latch-up testing. Depending on the
specific component, system/component redundancy, and other circumstances, if a component event is
found during deployment testing or initial latch-up testing, the operator may be able to repair the failed
component using an ROV or continue operations without repair. Without repair or redundancy, the
BOP stack must be retrieved to repair the component, causing operational delays.
As shown in Table 8, 48 events were found during deployment testing or initial latch-up testing in 2018.
Twenty-five of these events contributed to 19 BOP stack retrievals; in some cases, multiple failures
contributed to a single retrieval. By definition, retrievals are not considered stack pulls, as the BOP is
not yet in operation. However, nine of these retrievals occurred due to component events found during
initial latch-up testing, the final phase of testing before going into operation. These retrievals potentially
caused significant cost and operational delays and could have resulted in stack pulls had the events not
been discovered during the final testing phase. The costs associated with a stack retrieval are similar to a
stack pull. However, since the BOP has not yet gone into operation, the well is not open and therefore
does not need to be made safe before retrieving the BOP stack.
Table 8: Subsea System Events Found During the Last Two Phases of Testing
Measure
Events Found During
Deployment Testing*
Events Found During Initial
Latch-up Testing Total
Total Events 29 19 48
Operations continued without repair 0 2 2
Component repaired 16 5 21
Events contributing to stack retrieval 13 12 25
Stack retrievals 10 9 19
NOTE: *Deployment testing includes any failures found during well hopping and pulling/retrieving. The 19 stack retrievals
were a result of 25 events (multiple failures occurred before resulting in a single retrieval).
SOURCE: U.S. Department of Transportation, Bureau of Transportation Statistics, SafeOCS program.
While all 48 events included in Table 8 involved systems or components that can be thoroughly tested
prior to the last two testing phases, some systems and components can be only partially tested prior to
the last two phases as they are not physically connected to the system or exposed to the full effects of
hydrostatic pressure until the BOP has reached its operational depth. The latter include the riser
system, telescopic joint, stack mounted electrical equipment, and wellhead connector. In 2018, 69

19
subsea system events involved systems or components which can be only partially tested before the
initial latch-up phase. For 65 of these, the event occurred during either between-well maintenance or
pre-deployment testing. The remaining four occurred after the BOP had passed all testing and was in
operation. In other words, the vast majority (94.2 percent) of these events were found prior to
operations and prior to the last two phases of testing.
Not-In-Operation Events and Rig Activity
Figure 4 compares not-in-operation, in-operation, and stack pull events for rigs with subsea BOP
systems in 2018. With a few exceptions, the number of not-in-operation events has an inversely
proportional relationship to in-operation events. This finding indicates that rigs with a higher incidence
of not-in-operation failures tend to have fewer in-operation events.
Figure 4: Events on Rigs with Subsea BOP Systems
NOTE: Rigs are sorted by highest number of not-in-operation events.
SOURCE: U.S. Department of Transportation, Bureau of Transportation Statistics, SafeOCS program.

20
Rigs with higher not-in-operation rig activity (measured in stack runs13) have a higher likelihood of
experiencing not-in-operation events. To compare rates of reported not-in-operation events between
rigs, a reporting ratio was calculated for each rig and adjusted using stack runs as a surrogate measure of
rig activity:
Adjusted reporting ratio for Rig "A" = Rig A's proportion of not-in-operation events14
Rig A's proportion of stack runs15
Figure 5 shows the ratio for each rig, calculated using 2017 and 2018 data. The line intersecting the
graph at the value of 1.0 represents the baseline reporting ratio where a rig’s not-in-operation event
reporting is proportional to its level of activity relative to other rigs with reported events. A ratio
greater than 1.0 indicates potentially disproportionately higher reporting of not-in-operation events, and
similarly a ratio less than 1.0 indicates potentially disproportionately lower reporting of not-in-operation
events. As shown in Figure 5, 14 rigs are above the baseline (shown in green) and 17 rigs are below it
(shown in yellow).
Figure 5 also shows which rigs experienced stack pulls (shown as an overlaid, outlined shape). Of the 14
rigs with higher relative reporting of not-in-operation events, three experienced at least one stack pull
(21.4 percent). Of the 17 rigs with lower relative reporting of not-in-operation events, seven
experienced at least one stack pull (41.2 percent). Considering all stack pulls, the number that occurred
on rigs below the baseline (11) was almost double the number that occurred on rigs above the baseline
(6). This analysis provides further support for an inversely proportional relationship between not-in-
operation events and the occurrence of a stack pull (i.e., more not-in-operation failures found might lead
to fewer stack pulls).
13 Also called a stack deployment, a stack run is the activity of deploying, or “running” a subsea BOP stack from the rig floor to the subsea wellhead. For the full definition, see Appendix C. 14 Rig A’s not-in-operation events divided by the total not-in-operation events for all rigs. 15 Rig A’s stack runs divided by the total stack runs for all rigs with reported events.

21
Figure 5: Subsea System Not-In-Operation Events Relative to Rig Activity, 2017 & 2018
NOTE: Chart includes rigs that reported, via WAR, at least one day of activity in either 2017 or 2018.
SOURCE: U.S. Department of Transportation, Bureau of Transportation Statistics, SafeOCS program.
In-Operation Events
In-operation events occur after the subsea BOP stack is latched on the wellhead and initial latch-up tests
are successfully completed. In-operation events are considered more critical than not-in-operation
events because of the potential for a well control incident. In 2018, 12.2 percent of subsea system
failures occurred while in operation, compared to 14.4 percent in 2017 (see Table 2).
In-operation events can sometimes be corrected, isolated, or bypassed safely until the subsea BOP stack
can be pulled to the surface to repair or replace the failed component. Also, some events do not disable
the component in its entirety, and the system can still perform its necessary safety function. For
example, a hydraulic valve can have a slight leak when it is commanded to open but still can close when
needed. When a failure completely inhibits a barrier (such as an annular preventer or pipe ram preventer)
from performing its safety function (i.e., to close and seal a well), it is deemed more severe and must be

22
addressed before operations can continue. If the failure cannot be addressed while the BOP remains
attached to the wellhead, preparations are made to ensure well safety before a stack pull is initiated.
In 2018, six subsea system in-operation failures disabled a barrier, and four of those resulted in stack
pulls, resulting in a 66.7 percent stack pull rate for those events where a barrier was disabled. However,
due to low numbers and the unique circumstances of each event, the rate can only serve as a starting
point for further analysis. A larger data set is needed for more meaningful, multi-year analysis.
Subsea Stack Pulls
In a subsea stack pull, either the BOP is removed from the wellhead or the LMRP is removed from the
BOP stack to repair or replace a failed component. A stack pull is required when a component failure
occurs in operation that prevents the system from performing a necessary safety function; it cannot be
corrected, isolated, or bypassed; and redundancy does not allow operations to continue under an MOC
process.
A stack pull by definition is an unplanned event; when planned, such as after end-of-well activities or
before anticipated severe weather conditions (e.g., a hurricane), it is typically referred to as a stack
retrieval. A stack retrieval can also be unplanned if it occurs before the stack is in operation, i.e., at any
point after deployment but before passing the initial latch-up tests.
The rate of in-operation events leading to stack pulls was compared for all reporting years, as shown in
Table 9. Across years, the stack pull rate ranges from 5.3 to 7.4 percent. The table also lists the
observed failure for each subsea stack pull, and the total number of stack pulls in each year associated
with that observed failure. Across the reporting years, external leaks and mechanical damage were the
two most common observed failures associated with stack pulls.

23
Table 9: Subsea Stack Pull Rates and Observed Failures
Measure 2016 2017 2018 All Years
In-operation events 148 188 137 473
Events leading to stack pulls 11 10 8 29
Stack pull rate 7.4% 5.3% 5.8% 6.1%
Observed failures associated with stack pulls:
External leak 5 5 3 13
Mechanical damage 3 1 1 5
Internal leak 2 1 0 3
Fail to seal 0 0 2 2
Loss of power 1 0 0 1
Fail to close 0 1 0 1
Failure to transmit signal 0 1 0 1
Leakage 0 1 0 1
Blockage 0 0 1 1
Incorrect timing 0 0 1 1
NOTE: Stack pull rate is the number of stack pulls as a percentage of in-operation events.
SOURCE: U.S. Department of Transportation, Bureau of Transportation Statistics, SafeOCS program.
The reported stack pulls occur across a variety of subunit, item (i.e., subsystem), and component
combinations. The component failures affected barriers (e.g., blind shear ram preventer, pipe ram
preventer), control systems (e.g., BOP control pod), and safety systems (e.g., autoshear deadman EHBS).
Table 10 shows the subsystems, components, and observed failures for events leading to stack pulls in
2018. Importantly, not all failures are of equal potential consequence or have the same likelihood of
occurring. For example, external leaks can lead to different outcomes depending on the subsystem,
component, and observed failure involved. As shown in Table 10, of the 14 external leaks of
piping/tubing on the autoshear deadman EHBS, one was in operation, and it resulted in a stack pull
(100.0 percent). In comparison, of the 24 external leaks on SPM valves on the BOP control pod, five
were in operation, but only one resulted in a stack pull (20.0 percent). These differences can be partially
attributed to the fact that piping/tubing does not have redundancy and SPM valves do, as well as low
numbers of events for these combinations.

24
Table 10: Component Combinations Associated with Reported Subsea Stack Pulls
Associated Subsystem
Failed Component
Observed Failure
Total Events
In-operation
Events
Stack Pulls
Autoshear Deadman EHBS
Piping Tubing External leak 14 1 1
Timing Circuit Incorrect timing 1 1 1
BOP Control Pod Piping Tubing External leak 17 1 1
SPM Valve External leak 24 5 1
Pipe Ram Preventer Ram Block Seal Fail to seal 16 2 1
Riser Choke and Kill Line Blockage 1 1 1
Shear Ram Preventer
Ram Block Hardware Mechanical damage 8 1 1
Ram Block Seal Fail to seal 4 1 1
Total 85 13 8
SOURCE: U.S. Department of Transportation, Bureau of Transportation Statistics, SafeOCS program.
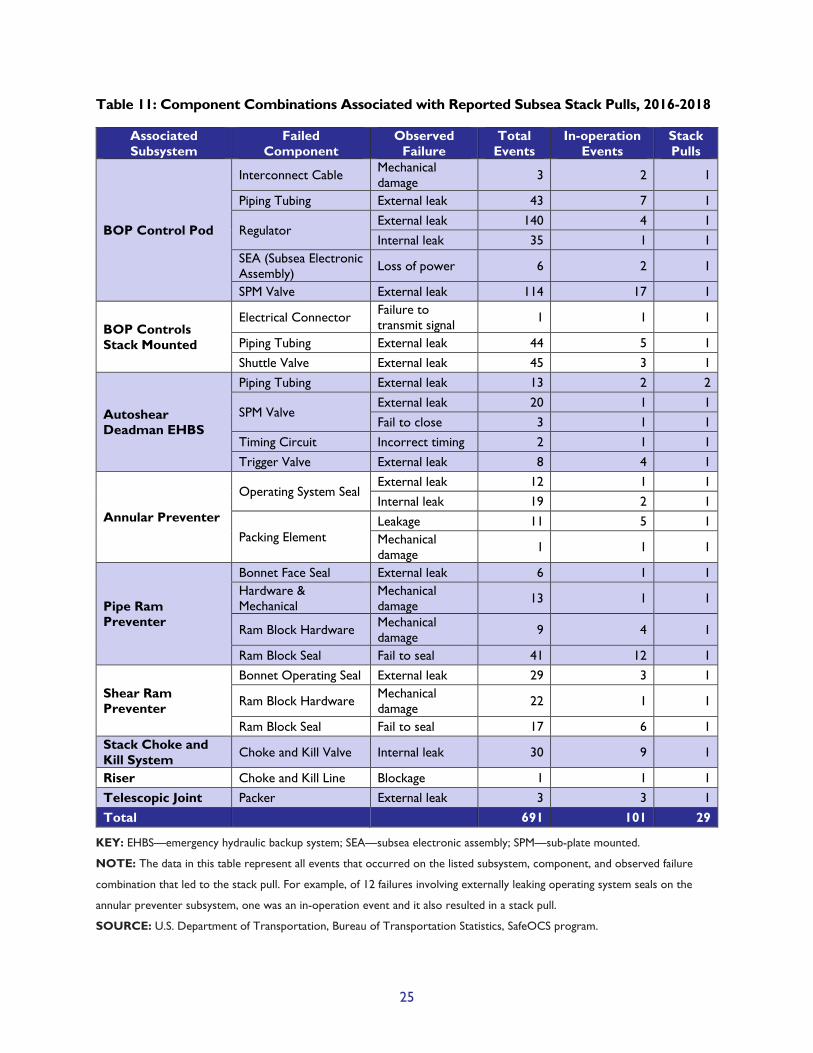
Table 11 shows the subsystems, components, and observed failures for events leading to stack pulls
across all reporting years. For the listed component combinations, 28.7 percent of reported in-
operation events led to a stack pull; however, high variability exists between component combinations.
For example, of 11 instances of leakage on the packing element on the annular preventer, only one led
to a stack pull. In contrast, the sole reported instance of mechanical damage on the same subsystem and
component led to a stack pull. Whether due to redundancy, specific testing and maintenance
procedures, age, or accessibility, some component combinations may be more likely to lead to a stack
pull if they experience an in-operation event. Component combinations with higher relative stack pull
rates may warrant increased attention in efforts to reduce in-operation events.
25
Table 11: Component Combinations Associated with Reported Subsea Stack Pulls, 2016-2018
Associated Subsystem
Failed Component
Observed Failure
Total Events
In-operation Events
Stack Pulls
BOP Control Pod
Interconnect Cable Mechanical damage 3 2 1
Piping Tubing External leak 43 7 1
Regulator External leak 140 4 1 Internal leak 35 1 1
SEA (Subsea Electronic Assembly) Loss of power 6 2 1
SPM Valve External leak 114 17 1
BOP Controls Stack Mounted
Electrical Connector Failure to transmit signal 1 1 1
Piping Tubing External leak 44 5 1 Shuttle Valve External leak 45 3 1
Autoshear Deadman EHBS
Piping Tubing External leak 13 2 2
SPM Valve External leak 20 1 1 Fail to close 3 1 1
Timing Circuit Incorrect timing 2 1 1 Trigger Valve External leak 8 4 1
Annular Preventer
Operating System Seal External leak 12 1 1 Internal leak 19 2 1
Packing Element Leakage 11 5 1 Mechanical damage 1 1 1
Pipe Ram Preventer
Bonnet Face Seal External leak 6 1 1 Hardware & Mechanical
Mechanical damage 13 1 1
Ram Block Hardware Mechanical damage 9 4 1
Ram Block Seal Fail to seal 41 12 1
Shear Ram Preventer
Bonnet Operating Seal External leak 29 3 1
Ram Block Hardware Mechanical damage 22 1 1
Ram Block Seal Fail to seal 17 6 1 Stack Choke and Kill System Choke and Kill Valve Internal leak 30 9 1
Riser Choke and Kill Line Blockage 1 1 1 Telescopic Joint Packer External leak 3 3 1 Total 691 101 29
KEY: EHBS—emergency hydraulic backup system; SEA—subsea electronic assembly; SPM—sub-plate mounted.
NOTE: The data in this table represent all events that occurred on the listed subsystem, component, and observed failure
combination that led to the stack pull. For example, of 12 failures involving externally leaking operating system seals on the
annular preventer subsystem, one was an in-operation event and it also resulted in a stack pull.
SOURCE: U.S. Department of Transportation, Bureau of Transportation Statistics, SafeOCS program.

26
Figure 6 offers a visual representation of the distribution of components involved in in-operation events
leading to at least one stack pull between 2016 and 2018, by rig. The shading of each grid square shows
whether the listed rig (i.e., column) experienced a failure event for the listed component (i.e., row). Blue
shading represents the percentage of in-operation events relative to total reported events for that
component, with darker blue representing higher rates of in-operation events. Yellow dots represent
stack pull events. Unshaded (gray) grid squares indicate the rig experienced no reported failure events
for the listed component.
As the figure shows, squares with a stack pull generally have a darker shade (higher in-operation ratio),
and squares without a stack pull generally have a lighter shade (lower in-operation ratio). More
precisely, for component combination events associated with a stack pull (i.e., all squares showing a
stack pull) 58.2 percent were in-operation events, while only 8.0 percent of events with no stack pull
occurred in operation. This points toward a potentially increased likelihood for a stack pull on rigs with
a higher percentage of in-operation events.
Figure 6: Components Involved in In-Operation Events Leading to a Stack Pull, by Rig, 2016-2018
KEY: EHBS—emergency hydraulic backup system; SEA—subsea electronic assembly; SPM—sub-plate mounted.
NOTE: Rigs shown experienced at least one reported event involving the listed component combination.
SOURCE: U.S. Department of Transportation, Bureau of Transportation Statistics, SafeOCS program.
27
In addition to the subsea stack pull rate, which is measured as a percentage of in-operation events,
subsea stack pulls were examined as a percentage of successful subsea stack runs. A stack run is
considered successful if the equipment passes all initial latch-up testing and goes into operation; if a test
is not passed or the BOP stack must be unlatched before going into operation, the stack run is
considered unsuccessful. Since a single well operation may cross calendar years, the total number of
stack pulls and successful stack runs for both 2017 and 2018 was considered.16 During 2017 and 2018,
there were 18 stack pulls and 319 successful stack runs (see Table 3), meaning 5.6 percent of successful
stack runs eventually led to a stack pull.
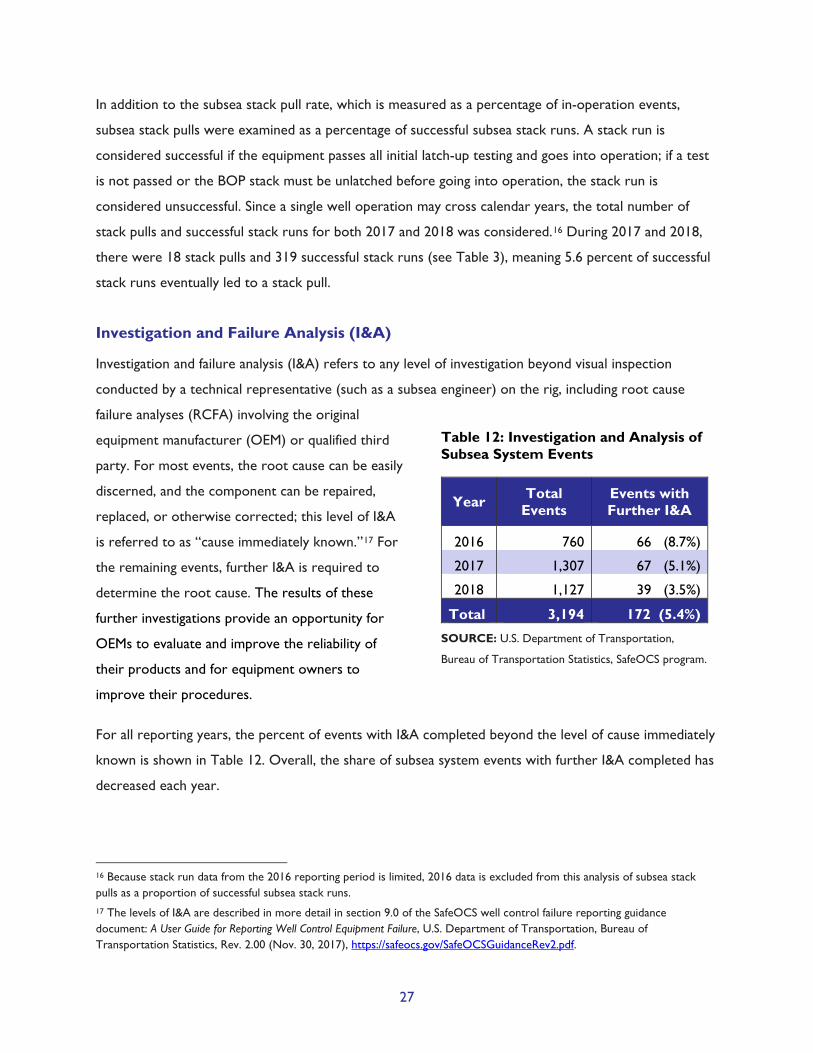
Investigation and Failure Analysis (I&A)
Investigation and failure analysis (I&A) refers to any level of investigation beyond visual inspection
conducted by a technical representative (such as a subsea engineer) on the rig, including root cause
failure analyses (RCFA) involving the original
equipment manufacturer (OEM) or qualified third
party. For most events, the root cause can be easily
discerned, and the component can be repaired,
replaced, or otherwise corrected; this level of I&A
is referred to as “cause immediately known.”17 For
the remaining events, further I&A is required to
determine the root cause. The results of these
further investigations provide an opportunity for
OEMs to evaluate and improve the reliability of
their products and for equipment owners to
improve their procedures.
For all reporting years, the percent of events with I&A completed beyond the level of cause immediately
known is shown in Table 12. Overall, the share of subsea system events with further I&A completed has
decreased each year.
Table 12: Investigation and Analysis of Subsea System Events
Year Total Events
Events with Further I&A
2016 760 66 (8.7%)
2017 1,307 67 (5.1%)
2018 1,127 39 (3.5%)
Total 3,194 172 (5.4%)
SOURCE: U.S. Department of Transportation,
Bureau of Transportation Statistics, SafeOCS program.
16 Because stack run data from the 2016 reporting period is limited, 2016 data is excluded from this analysis of subsea stack pulls as a proportion of successful subsea stack runs. 17 The levels of I&A are described in more detail in section 9.0 of the SafeOCS well control failure reporting guidance document: A User Guide for Reporting Well Control Equipment Failure, U.S. Department of Transportation, Bureau of Transportation Statistics, Rev. 2.00 (Nov. 30, 2017), https://safeocs.gov/SafeOCSGuidanceRev2.pdf.

28
Root Causes of Subsea System Events
Understanding the root cause of an event is key to preventing reoccurrence and addressing any existing
issues with equipment design, maintenance practices, and operating procedures. Table 13 shows the
distribution of root causes across all reported events for each year and the percent of each root cause
determined through further I&A. As shown in the table, both design issue and QA/QC manufacturing have
been increasingly listed as the root cause of component failures from 2016 to 2018. The relative
increase in reporting of these root causes does not necessarily indicate an actual increase in QA/QC
manufacturing or design issues in the industry, but rather that these issues have been increasingly listed
as the reason for failures. This shift may indicate that issues requiring only one or two parties to correct
(such as maintenance errors and procedural errors) are being resolved more quickly, while those issues
requiring more parties to remedy (design issues and QA/QC manufacturing) are taking longer to
resolve.
Table 13: Subsea System Event Root Causes
Root Cause Percent of All Events Determined through
Further I&A
2016 2017 2018 2016 2017 2018
Wear and Tear 33.2% 57.7% 52.4% 3.2% 2.8% 1.0%
Maintenance Error 17.1% 13.5% 9.5% 14.6% 4.0% 0.9%
Design Issue 5.3% 8.3% 14.3% 32.5% 19.3% 5.6%
QA/QC Manufacturing 3.4% 5.9% 12.0% 23.1% 5.2% 5.9%
Procedural Error 2.9% 2.0% 3.1% 36.4% 15.4% 17.1%
Documentation Error 0.4% 0.6% 0.5% 33.3% 12.5% 0.0%
Other* 37.8% 12.0% 8.3% 3.8% 5.7% 9.7%
NOTE: *The selection of other by the submitter allows for entry of a root cause that may not precisely fit the other selections.
Most submitted root causes under other have been RCFA required.
SOURCE: U.S. Department of Transportation, Bureau of Transportation Statistics, SafeOCS program.
As shown in Table 13, from 2016 to 2018, fewer determinations of design issue as the root cause have
been made through further I&A. This decrease could indicate that design issues have been increasingly
easier to identify and confirm (i.e., failures have not required further I&A). Except for procedural error
and other, this trend is true for all root causes, suggesting that they are increasingly determined through
an immediate evaluation. Possible reasons for the trend include an increase in practices, tools,
resources, training, or knowledge available to on-site personnel determining the root cause of an event,
or potentially a relative increase in events with known root causes recognizable from similar previous

29
events. Alternatively, investigation efforts may have been focused only on a subset of the most significant
failures, or available resources to perform further investigations may have decreased.
When further I&A is conducted, findings can reveal greater detail about the factors that led to a
component event and, in some cases, uncover a different root cause than was suspected during the
initial evaluation. Figure 7 shows the distribution of root cause determinations made through immediate
evaluations versus through further I&A. The figure shows that immediate evaluation tends to favor wear
and tear, whereas further I&A results in more determinations of design issue, QA/QC manufacturing,
and procedural error relative to immediate evaluation.
Figure 7: How Root Causes Were Determined, 2016-2018
SOURCE: U.S. Department of Transportation, Bureau of Transportation Statistics, SafeOCS program.

30
Root Causes of Subsea Stack Pulls
RCFAs by the OEM or a third party are expected to be carried out for events resulting in stack pulls
and reoccurring failures.18 RCFA documentation was sent to SafeOCS for three of the eight subsea
stack pulls reported in 2018, as shown in Table 14. The root causes of the three events with submitted
RCFA documentation were wear and tear (1) or procedural error (2). For the remaining five, the listed
root cause was design issue (3) or RCFA required (2), meaning the RCFA is still pending. Without
submission of additional RCFA documentation, the suspected root cause of the latter five events cannot
be confirmed.
Table 14: Root Causes of Subsea Stack Pulls
Associated Subsystem Failed Component Root Cause RCFA Status Stack
Pulls
Autoshear Deadman EHBS
Piping Tubing Wear and Tear Completed 1
Timing Circuit RCFA Required Not sent to SafeOCS 1
BOP Control Pod Piping Tubing Procedural Error Completed 1
SPM Valve Design Issue Not sent to SafeOCS 1
Pipe Ram Preventer Ram Block Seal RCFA Required Not sent to SafeOCS 1
Riser Choke and Kill Line Procedural Error Completed 1
Shear Ram Preventer
Ram Block Hardware Design Issue Not sent to SafeOCS 1
Ram Block Seal Design Issue Not sent to SafeOCS 1
Total 8
KEY: EHBS—emergency hydraulic backup system; SPM—sub-plate mounted.
NOTE: RCFA Required means the operator listed the root cause as RCFA required, and no further documentation has since been
received.
SOURCE: U.S. Department of Transportation, Bureau of Transportation Statistics, SafeOCS program.
Table 15 summarizes the subsystem, component, and root cause for all subsea stack pull events during
2016 to 2018. RCFA documentation was sent to SafeOCS for 13 of the 29 total events.
18 See section 9.0 of the SafeOCS well control failure reporting guidance document: A User Guide for Reporting Well Control Equipment Failure, U.S. Department of Transportation, Bureau of Transportation Statistics, Rev. 2.00 (Nov. 30, 2017), https://safeocs.gov/SafeOCSGuidanceRev2.pdf.

31
Table 15: Root Causes of Subsea Stack Pulls, 2016-2018
Associated Subsystem
Failed Component Root Cause RCFA Status Stack
Pulls
Annular Preventer Operating System Seal Design Issue Completed 1
Packing Element Design Issue Completed 1
Autoshear Deadman EHBS
Piping Tubing Wear and Tear Completed 1
SPM Valve Documentation Error Completed 1 Maintenance Error Completed 1
BOP Control Pod Interconnect Cable Procedural Error Completed 1 Piping Tubing Procedural Error Completed 1
Pipe Ram Preventer
Bonnet Face Seal Design Issue Completed 1 Hardware & Mechanical Other Completed 1
Ram Block Hardware Maintenance Error Completed 1
Riser Choke and Kill Line Procedural Error Completed 1 Shear Ram Preventer
Bonnet Operating Seal Maintenance Error Completed 1
Stack Choke and Kill System
Choke and Kill Valve Design Issue Completed 1
Multiple Multiple Multiple Not sent to SafeOCS 16 Total 29
SOURCE: U.S. Department of Transportation, Bureau of Transportation Statistics, SafeOCS program.
Wear and tear is a less expected root cause of subsea stack pull events because for subsea stacks, much
of the equipment is located underwater and therefore inaccessible in operation, putting increased
emphasis on the quality of maintenance, inspection, and testing carried out before running the stack.
Between-well maintenance prepares the stack for the next well by conducting periodic maintenance on
all well control equipment and replacing components if there is any doubt of their capability to last the
expected duration of the coming well operation.
Wear and tear was determined to be the root cause for one stack pull event in 2018. In the RCFA
information submitted to SafeOCS, the operator noted that wear and tear was chosen because the
alternate choices for root cause on the data collection form were not applicable, and that shocks and
vibrations from operations contributed to the component’s connection failure. Since the age of the
component was listed as 45 months, but the last visual check was 5.7 months prior, there may be
reasonable doubt as to whether wear and tear was the true root cause in this case.

32
Without documentation of a comprehensive RCFA for a stack pull event, the ability to develop safety
learnings is more limited. For all subsea stack pull events from 2016 to 2018, wear and tear was listed as
the root cause for four events. RCFA documentation was sent to SafeOCS for only one of these,
summarized above. For three of the events, the time since last maintenance was less than one year; it
was not reported for the remaining event. For two of the events, the component age was not listed.
Based on component ages and time since last maintenance, wear and tear is likely not a reasonable root
cause.
Lessons Learned
Of 39 subsea system events with further I&A in 2018, 24 contained documentation listing follow-up
actions addressing each root cause, summarized in Table 16. Some of the I&As contained findings
applicable to other similar reported events, bringing the total number of events with listed follow-up
actions to 32. Developing and implementing follow-up actions involves important communication paths
between OEMs, equipment owners, and operators regarding causes of equipment failures,
improvements, and preventive measures across the industry, and they can have the potential for
industry-wide impact. For example, an identified design issue could lead to a design change for which an
engineering bulletin or safety alert is issued that affects multiple operators and equipment owners.
The identified follow-up actions within documentation submitted to SafeOCS included equipment design
changes; mitigation steps to improve training, documentation, or equipment source accuracy; and long-
term corrective actions for the OEM, operator, or equipment owner. The listed actions serve as
examples of how RCFAs can lead to improvements not only for an individual entity but also for the
entire industry. For example, through an RCFA, an OEM may discover the need for an updated design of
a component, which can be implemented across the industry to prevent a reoccurring failure, reducing
risk and improving operations. In 2018, nine RCFAs mentioned previously published notices about a
design, maintenance, or procedural change. Notices about these types of changes are critical to
addressing issues as they arise.

33
Table 16: Follow-Up Actions on Subsea System Events
Component Root Cause Root Cause Details Recommended Follow-up Action
1 Accumulator QA/QC Manufacturing
OEM substitute material was incorrect for the seal band, creating an interference fit with the pod accumulator shell/piston interface, preventing the free movement for correct operation.
OEM to accept back all faulty components under warranty for repair and revise applicable drawings.
2,3 Bonnet Operating Seal
Design Issue
Protruding o-ring did not have perforations per current design, which changed during the three years the o-ring was in service.
During repairs, rig owner should follow OEM documentation for new o-ring design to ensure it is bonded and has perforations.
Wear and Tear
Shaft seal leaked after 58 months.
Rig owner implemented a preventive maintenance plan to replace ram shaft seal assembly at 30 months or sooner.
4
Choke and Kill Connector Receptacle Female
Design Issue Nickel overlay damaged by foreign object.
OEM will change the design to improve the overlay material to resist expected foreign contaminants.
5 Choke and Kill Line
Procedural Error
U-tubing through choke line allowed cuttings to fall out of the base oil/mud interface creating a plug in the line.
Operator to modify procedures to avoid u-tubing through choke/kill line in a high cuttings environment.
6 Choke and Kill Operator Hardware
Design Issue
Design had allowed for excessive corrosion of cap screws, causing nose ring distortion and connector failure.
OEM will modify cap screw design for enhanced corrosion resistance.
7 Cylinder Design Issue
Hard seal scuffing when stretching seal over shaft, causing excessive fluid flow leading to sealing lip folding over.
OEM updated design to prevent hard seal scuffing when stretching seal over shaft; new design was in testing at the time of this event.
8 Depth Compensated Accumulator
Procedural Error
Failure to precisely measure depth compensated bottle temperatures and hydraulically pack the system before conducting EHBS tests led to low accumulator volume and false failure indications.
Rig owner to update procedures to improve requirements for ensuring systems reach maximum hydraulic volume.
9 Filter Design Issue Design issue led to filter screen being rolled back on one side.
OEM to redesign the filter element.
10 Flowline Seal Procedural Error
Over-pressurization caused a cut in seal.
Rig owner to make a procedural change based on previously published OEM documentation indicating proper pressure range for seal operation.

34
Component Root Cause Root Cause Details Recommended Follow-up Action
11 Hydraulic Tool Design Issue Design issue allowed hydraulic tool stem to loosen.
OEM to modify assembly/design to increase torque.
12 Inclinometer Wear and Tear
Obsolete inclinometer failed after 14 months of use.
OEM to supply newest revision of component.
13 Locking Device Design Issue Design issue allowed for operating piston seal to be compromised.
Lessons learned were recorded in the OEM report, but not provided to SafeOCS.
14 Operating System Seal Design Issue
O-ring cord spacing and contraction issues over time caused leakage.
OEM recommends equipment owner to change to a bonded seal design (PA 30846) to ensure gap over allowable limit does not occur.
15 Packing Element Design Issue
Design caused element cracking and failure to close after 66 cycles.
OEM to redesign element and improve QA/QC fatigue testing.
16,17 Piping Tubing
QA/QC Manufacturing
Tube fitting was loosened during either manufacturing, shipping, or installation. Defined processes are not in place to sufficiently test equipment after the manufacturing process.
OEM QA/QC procedures and equipment owner procedures to be updated and implemented.
Other Vibration and water-hammer shocks loosened tubular pipe fitting.
Rig owner to formalize the existing maintenance plan to ensure proper torque of tubular pipe fittings before deploying the stack.
18 Pressure Temperature Sensor
QA/QC Manufacturing
Intermittent insulation resistance failure in the primary sensor/cable connector.
OEM to modify pressure/temperature sensor (i.e., resistance temperature detector or RTD) mounting and QC process. OEM also planning to redesign product to improve water resistance.
19 Ram Block Seal Design Issue
Seal experienced inadequate bonding of metal/elastomer due to fluid exposure at high temperatures and corrosion migration.
OEM to redesign seal to be fully encased in rubber and update operating procedure to provide equipment ratings.
20 Regulator Maintenance Error
Regulator seal plate was forcibly installed; Demineralized water leached nickel from tungsten carbide, reducing lubricity and causing cracked seal ring to score plates.
Equipment owner should carefully follow assembly procedures and water hardness standards.

35
Component Root Cause Root Cause Details Recommended Follow-up Action
21 Ring Gasket Other
RCFA inconclusive, but pressure loss and resulting leak determined to have happened due to a loss of preload in the flange-joint connection.
OEM updated torque values in maintenance plan procedure. Rig owner implemented the updated OEM procedures on checking proper torque and purchased a new tool for checking torque.
22 Riser Control Box (RCB)
QA/QC Manufacturing
OEM QA/QC testing did not include the internal connector, allowing a defective part to be shipped.
OEM to update procedure to ensure RCB is tested prior to shipment.
23 Slide Shear Seal Valve Design Issue
At low pressure, elastic deflection caused piston impingement on seal ring causing leakage.
OEM to redesign valve to prevent impingement and leakage.
24 Studs and Nuts QA/QC Manufacturing
Surface flaw led to heat treat crack on 20E API BSL-1 nut. API 20E BSL-1 bolting has no quality inspection requirements beyond what is designated by applicable ASTM specifications, so surface nondestructive evaluation was not an order requirement.
OEM applied additional QA/QC magnetic particle inspection process to lower grade of bolting.
SOURCE: U.S. Department of Transportation, Bureau of Transportation Statistics, SafeOCS program.
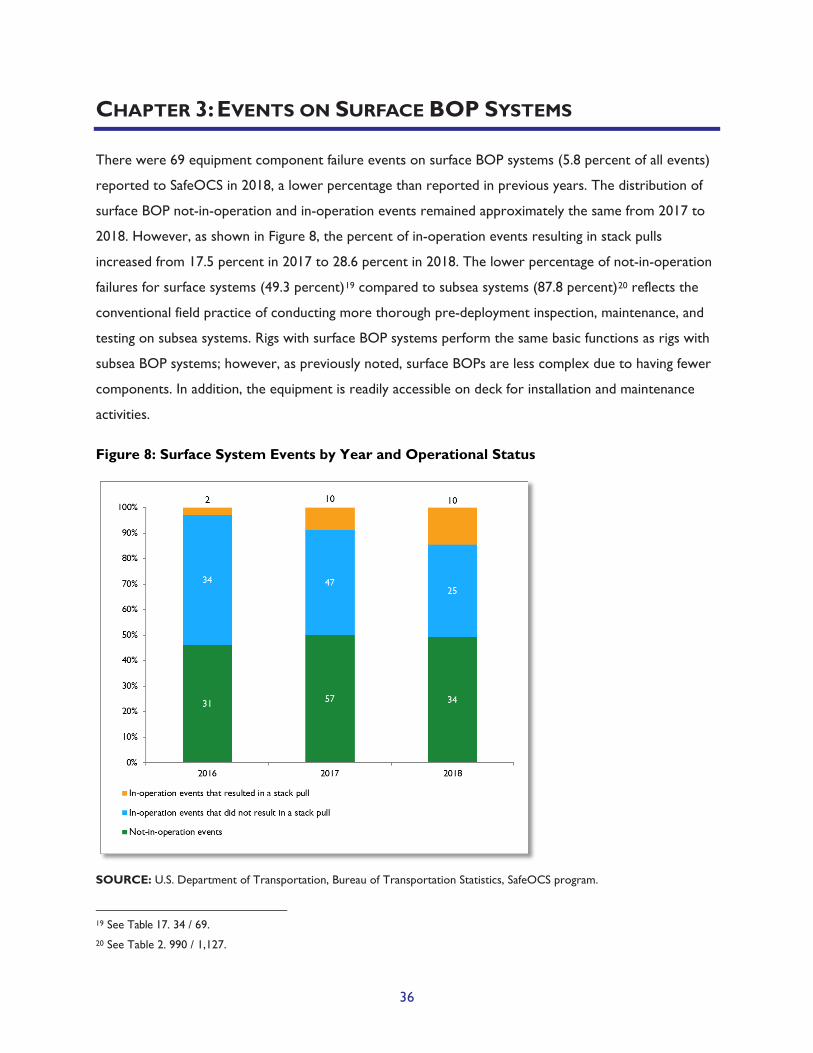
36
CHAPTER 3: EVENTS ON SURFACE BOP SYSTEMS
There were 69 equipment component failure events on surface BOP systems (5.8 percent of all events)
reported to SafeOCS in 2018, a lower percentage than reported in previous years. The distribution of
surface BOP not-in-operation and in-operation events remained approximately the same from 2017 to
2018. However, as shown in Figure 8, the percent of in-operation events resulting in stack pulls
increased from 17.5 percent in 2017 to 28.6 percent in 2018. The lower percentage of not-in-operation
failures for surface systems (49.3 percent)19 compared to subsea systems (87.8 percent)20 reflects the
conventional field practice of conducting more thorough pre-deployment inspection, maintenance, and
testing on subsea systems. Rigs with surface BOP systems perform the same basic functions as rigs with
subsea BOP systems; however, as previously noted, surface BOPs are less complex due to having fewer
components. In addition, the equipment is readily accessible on deck for installation and maintenance
activities.
Figure 8: Surface System Events by Year and Operational Status
SOURCE: U.S. Department of Transportation, Bureau of Transportation Statistics, SafeOCS program.
19 See Table 17. 34 / 69. 20 See Table 2. 990 / 1,127.

37
Key Statistics: Events on Surface BOP Systems
• No loss of loss of containment (LOC) event was reported in 2018.
• Only 69 surface BOP system events were reported to SafeOCS, representing 5.8 percent of all
reported events.
• About half of reported events (49.3 percent) occurred while the surface system was not in
operation, i.e., during planned periods of inspection, maintenance, and testing.
• While the percent of in-operation events resulting in stack pulls increased in 2018 (28.6 percent)
from 2017 (17.5 percent), reported events are too few to generalize this trend to the industry.
• Wear and tear and other were the most frequently listed root causes, reported for 56.5 percent and
23.2 percent of events, respectively.
Table 17: Surface System Event Statistics
Measure 2016 2017 2018
Active Operators D.N.A. D.N.A. 24
Reporting Operators 6 10 8
Rigs with Events 11 18 16
Events Reported 67 114 69
Not-in-operation 31 57 34
In-operation 36 57 35
Stack Pulls 2 10 10
LOC Events 0 0 0
Top four operators*
Events 79.1% 72.9% 81.4%
Wells with Activity D.N.A. D.N.A. 38.2%
Wells Spudded D.N.A. D.N.A. D.N.A.
BOP Days 64.5% 52.8% 43.7%
NOTE: *Top four operators’ contribution.
SOURCE: U.S. Department of Transportation,
Bureau of Transportation Statistics, SafeOCS program.
Table 18: Surface System Exposure Measures
Measure 2016 2017 2018
Wells with Activity*
Number of Wells with Activity D.N.A. 160 217
Percent of Wells with Failures D.N.A. 22.5% 12.0%
Average Failures per Well with Activity D.N.A. 0.70 0.30
Rigs Operating*
Number of Rigs Operating 16 28 28
BOP Days*
Number of BOP Days 1,556.0 5,172.0 6,943.0
Event Rate* 43.1 22.0 9.9
Not-in-operation BOP Days D.N.A. 1,530.8 1,899.9
Not-in-operation Event Rate* D.N.A. 37.2 17.9
In-operation BOP Days D.N.A. 3,641.2 5,043.1
In-operation Event Rate* D.N.A. 15.7 6.9
Stack Pulls 2 10 10
Stack Pull Event Rate* D.N.A. 2.7 2.0
BOP Stack Starts**
Total Stack Starts D.N.A. 186 224
Successful Stack Starts D.N.A. 170 217
In-oper. Failures per Succ. Stack Start D.N.A. 0.34 0.16
KEY: avg—average; in-oper—in operation; succ—successful.
NOTE: *See Appendix C for definition. **In this report, BOP stack
start means when a surface BOP stack is assembled on the wellhead.
SOURCE: U.S. Department of Transportation, Bureau of
Transportation Statistics, SafeOCS program.

38
Reporting Operators
Of 24 active operators in the GOM OCS that engaged in surface BOP activity in 2018, eight reported
surface system failure events.21 Figure 9 shows surface system events and rig activity (measured in BOP
days) for the 24 active operators in 2018. The four operators that reported the most failures submitted
81.4 percent of surface system notifications, and accounted for 43.7 percent of rig activity (based on
surface BOP days), as compared to the top four reporting operators in 2017 that submitted 72.9
percent of notifications and accounted for 52.8 percent of rig activity. The top four reporting operators
remained the same from 2017 to 2018, and the total number of reporting operators decreased from 10
to eight.
Figure 9: Surface System Events and Rig Activity by Operator
NOTE: Surface BOP days are based on all rigs with surface BOP systems that operated in the GOM in 2018. Operator names
have not been disclosed to preserve confidentiality.
SOURCE: U.S. Department of Transportation, Bureau of Transportation Statistics, SafeOCS program.
21 Four operators reported events for both subsea and surface systems.

39
Detection Methods
Detection method options for subsea and surface BOP systems are the same; however, since surface
equipment is more readily accessible throughout operations, the use of those detection methods varies
from subsea BOP systems. Table 19 shows that on rigs with surface BOP systems, events have been
most frequently detected via pressure testing across reporting years. Most events not detected through
pressure testing were found through functional testing or casual observation. Testing as a whole is by far
the most common detection method for finding surface BOP system events. Except for inspection, all
other detection methods have decreased from year to year relative to testing.
Table 19: How Surface System Events Were Detected
Detection Method 2016 2017 2018
Count Percent Count Percent Count Percent
Pressure Testing 37 55.2% 61 53.5% 44 63.8%
Functional Testing 9 13.4% 15 13.2% 11 15.9%
Casual Observation 10 14.9% 16 14.0% 5 7.2%
Continuous Condition Monitoring 6 9.0% 13 11.4% 4 5.8%
Inspection 2 3.0% 5 4.4% 5 7.2%
Periodic Condition Monitoring 1 1.5% 2 1.8% 0 0.0%
Corrective Maintenance 2 3.0% 0 0.0% 0 0.0%
On Demand 0 0.0% 2 1.8% 0 0.0%
Total 67 100.0% 114 100.0% 69 100.0%
NOTE: Detection methods are sorted by highest number of events reported across all years.
SOURCE: U.S. Department of Transportation, Bureau of Transportation Statistics, SafeOCS program.
Table 20 below explores the relationship between the number of not-in-operation or in-operation
failures found for each detection method. For the two most frequently reported detection methods
(pressure testing and functional testing), the share of not-in-operation and in-operation events has
remained relatively stable and evenly distributed between the two operational statuses.

40
Table 20: How Surface System Events Were Detected, by Operational Status
Detection Method 2016 2017 2018
Not-in-operation
In-operation
Not-in-operation
In-operation
Not-in-operation
In-operation
Pressure Testing 48.6% 51.4% 55.7% 44.3% 52.3% 47.7%
Functional Testing 77.8% 22.2% 66.7% 33.3% 72.7% 27.3%
Casual Observation 20.0% 80.0% 31.3% 68.8% 40.0% 60.0%
Continuous Condition Monitoring 33.3% 66.7% 38.5% 61.5% 100.0% 0.0%
Inspection 50.0% 50.0% 60.0% 40.0% 20.0% 80.0%
Periodic Condition Monitoring 0.0% 100.0% 0.0% 100.0% 0.0% 0.0%
Corrective Maintenance 50.0% 50.0% 0.0% 0.0% 0.0% 0.0%
On Demand 0.0% 0.0% 0.0% 100.0% 0.0% 0.0%
NOTE: Detection methods are sorted by highest number of events reported across all years.
SOURCE: U.S. Department of Transportation, Bureau of Transportation Statistics, SafeOCS program.
Observed Failures
As shown in Table 21, leaks remain the top observed failures for surface BOP system events, with
internal leaks having the highest total across the entire reporting period. As with subsea systems, it is
not unexpected that leaks are the most frequently observed failure, since most well control equipment
consists of components controlling or containing the fluids present during operations. None of the
reported leak events posed significant environmental risks.
Table 21: Observed Failures on Surface Systems
Observed Failure 2016 2017 2018
Count Percent Count Percent Count Percent
Internal leak 31 46.3% 41 36.0% 15 21.7%
External leak 22 32.8% 31 27.2% 24 34.8%
Leakage 4 6.0% 7 6.1% 12 17.4%
Mechanical damage 2 3.0% 17 14.9% 3 4.3%
Fail to seal 6 9.0% 10 8.8% 5 7.2%
Other observed failures* 2 3.0% 8 7.0% 10 14.5%
Total 67 100.0% 114 100.0% 69 100.0%
NOTE: *Other observed failures consist of those failures with 20 or fewer total events across years. For events reported as leakage, the
reporter did not specify whether the leak was internal or external. Observed failures are sorted by the highest total across years.
SOURCE: U.S. Department of Transportation, Bureau of Transportation Statistics, SafeOCS program.

41
Table 22 shows that the most commonly observed failures (leaks) were found most often via pressure
or functional testing, the most common detection methods. The data also shows that a relatively high
number of internal and external leaks were found via various other detection methods (61 events)
compared to the number found via pressure testing (79 events). Similarly, a relatively high number of
external leaks were found via casual observation (20 events) as were found via pressure testing (30
events). These observations may be partially attributed to the fact that surface equipment is readily
accessible on deck, allowing the crew to detect issues visually.
Table 22: Methods Used to Detect Each Observed Failure Type, 2016-2018
Detection Method Observed Failure
Internal Leak
External Leak Leakage Mechanical
Damage Fail to Seal
Pressure Testing 49 30 19 14 21
Functional Testing 12 13 2 3 0
Casual Observation 9 20 0 2 0
Continuous Condition Monitoring 9 7 0 2 0
Inspection 6 5 0 0 0
Periodic Condition Monitoring 1 2 0 0 0
Corrective Maintenance 1 0 1 0 0
On Demand 0 0 1 1 0
Total 87 77 23 22 21
NOTE: Both detection method and observed failure are sorted by frequency of reporting across all years.
SOURCE: U.S. Department of Transportation, Bureau of Transportation Statistics, SafeOCS program.
Not-In-Operation Events
Surface system not-in-operation events occur when the BOP is on either the deck or the wellhead, but
initial latch-up tests have not yet been completed. Surface equipment undergoes inspections, testing, and
other monitoring in relatively less detail while not in operation compared to subsea systems. In 2018,
not-in-operation failures made up 49.3 percent of all surface system failures, consistent with the share
reported in 2016 (46.3 percent) and 2017 (50.0 percent). The relatively even distribution of failures
found in operation and not in operation may be partially explained by equipment remaining on deck
during both not-in-operation and in-operation activities, facilitating the identification of issues during
operations.

42
Not-In-Operation Events and Rig Activity
Figure 10 compares not-in-operation, in-operation, and stack pull events for rigs with surface BOP
systems in 2018. With a few exceptions, the data shows that rigs that experienced more not-in-
operation failures experienced fewer stack pulls. However, due to the limited number of reported
failures for surface systems, generalizing this observed pattern to the industry is premature. BTS will
conduct additional analysis as more data becomes available.
Figure 10: Events on Rigs with Surface BOP Systems
SOURCE: U.S. Department of Transportation, Bureau of Transportation Statistics, SafeOCS program.
In-Operation Events
Similar to subsea BOP systems, in-operation events for surface BOP systems occur after the BOP stack
is attached to the wellhead and has completed a successful test of the connection to the wellbore per
the approved well plan. In 2018, 50.7 percent of surface system failures occurred while in operation,
approximately the same proportion as in prior reporting years.
Rigs with higher in-operation rig activity have a higher likelihood of experiencing in-operation events. To
compare rates of reported in-operation events between rigs, a reporting ratio was calculated for each
rig and adjusted using BOP days in-operation as a surrogate measure of rig activity:

43
Adjusted reporting ratio for Rig "A" = Rig A's proportion of in-operation events22
Rig A's proportion of in-operation BOP days23
Figure 11 shows the ratio for each rig, calculated using 2017 and 2018 data. The line intersecting the
graph at the value of 1.0 represents the baseline reporting ratio where a rig’s in-operation event
reporting is proportional to its level of activity relative to other rigs with reported events. A ratio
greater than 1.0 indicates potentially disproportionately higher reporting of in-operation events, and
similarly a ratio less than 1.0 indicates potentially disproportionately lower reporting of in-operation
events. As shown in Figure 11, 12 rigs are above the baseline (shown in yellow) and 19 rigs are below it
(shown in green).
Figure 11 also shows which rigs experienced stack pulls (shown as an overlaid, outlined shape). Of the
12 rigs with higher relative reporting of in-operation events, seven experienced stack pulls (58.3
percent). Of the 19 rigs with lower relative reporting of in-operation events, five experienced a stack
pull (26.3 percent). Considering all stack pulls, the number that occurred on rigs above the baseline (15)
was three times the number that occurred on rigs below the baseline (5). This analysis provides support
for a proportional relationship between in-operation events and the occurrence of a stack pull (i.e.,
more in-operation failures found might lead to more stack pulls). However, due to the limited sample
size, generalizing this observed pattern to the industry is premature. BTS will conduct additional analysis
as more data becomes available.
22 Rig A’s in-operation events divided by the total in-operation events for all rigs. 23 Rig A’s in-operation BOP days divided by the total in-operation BOP days for all rigs with reported events.

44
Figure 11: Surface System In-Operation Events Relative to Rig Activity, 2017 & 2018
NOTE: Chart includes rigs that reported, via WAR, at least one day of activity in either 2017 or 2018.
SOURCE: U.S. Department of Transportation, Bureau of Transportation Statistics, SafeOCS program.
Surface Stack Pulls
As with subsea systems, a surface BOP stack pull is by definition an unplanned event. By definition, a
surface stack pull occurs when a BOP component fails while in operation and requires well conditioning
and a mechanical barrier placement to make necessary repairs. The rate of in-operation events leading
to stack pulls was compared for all reporting years, as shown in Table 23. Across years, the stack pull
rate ranges from 5.6 to 28.6 percent. The table also lists the observed failure for each surface stack pull
and the total number of stack pulls in each year associated with that observed failure. Across the
reporting years, leaks have been the most common observed failure associated with surface stack pulls.
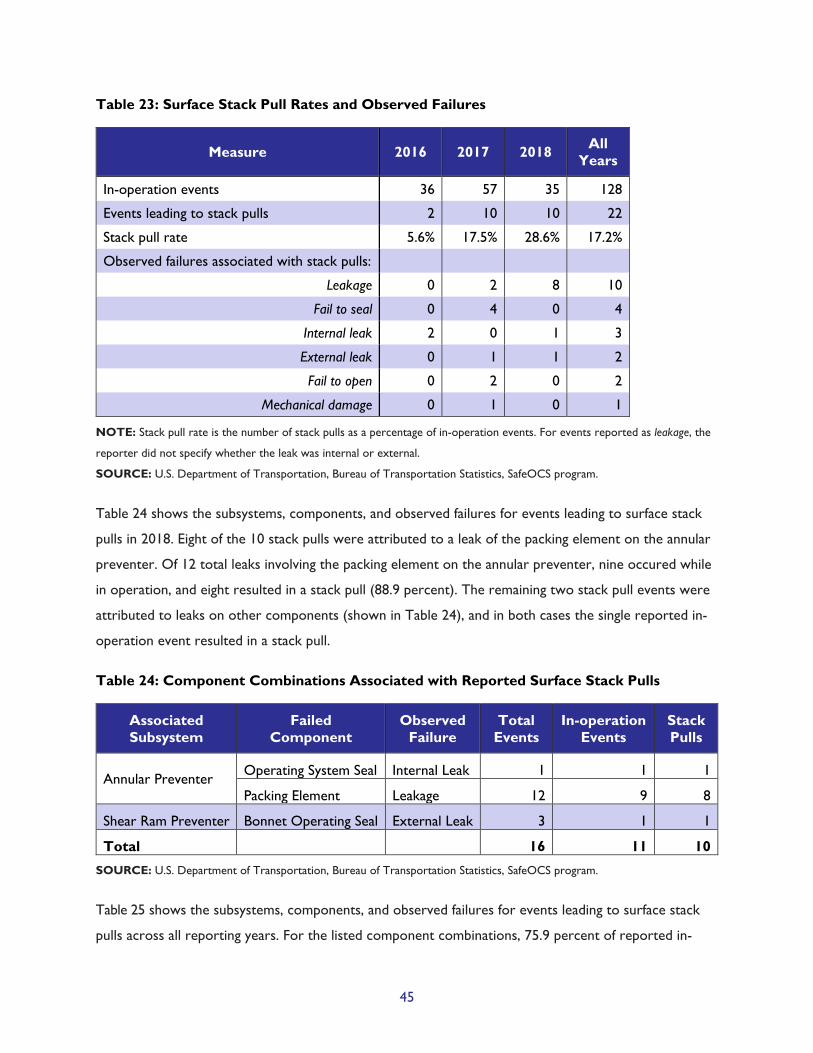
45
Table 23: Surface Stack Pull Rates and Observed Failures
Measure 2016 2017 2018 All Years
In-operation events 36 57 35 128
Events leading to stack pulls 2 10 10 22
Stack pull rate 5.6% 17.5% 28.6% 17.2%
Observed failures associated with stack pulls:
Leakage 0 2 8 10
Fail to seal 0 4 0 4
Internal leak 2 0 1 3
External leak 0 1 1 2
Fail to open 0 2 0 2
Mechanical damage 0 1 0 1
NOTE: Stack pull rate is the number of stack pulls as a percentage of in-operation events. For events reported as leakage, the
reporter did not specify whether the leak was internal or external.
SOURCE: U.S. Department of Transportation, Bureau of Transportation Statistics, SafeOCS program.
Table 24 shows the subsystems, components, and observed failures for events leading to surface stack
pulls in 2018. Eight of the 10 stack pulls were attributed to a leak of the packing element on the annular
preventer. Of 12 total leaks involving the packing element on the annular preventer, nine occured while
in operation, and eight resulted in a stack pull (88.9 percent). The remaining two stack pull events were
attributed to leaks on other components (shown in Table 24), and in both cases the single reported in-
operation event resulted in a stack pull.
Table 24: Component Combinations Associated with Reported Surface Stack Pulls
Associated Subsystem
Failed Component
Observed Failure
Total Events
In-operation Events
Stack Pulls
Annular Preventer Operating System Seal Internal Leak 1 1 1
Packing Element Leakage 12 9 8
Shear Ram Preventer Bonnet Operating Seal External Leak 3 1 1
Total 16 11 10
SOURCE: U.S. Department of Transportation, Bureau of Transportation Statistics, SafeOCS program.
Table 25 shows the subsystems, components, and observed failures for events leading to surface stack
pulls across all reporting years. For the listed component combinations, 75.9 percent of reported in-

46
operation events led to a stack pull. This finding can be partially attributed to the fact that surface stack
equipment is readily available on the rig floor at all times, and that stopping operations to address a
component failure typically has low operational and time impacts.
Table 25: Component Combinations Associated with Reported Surface Stack Pulls, 2016-2018
Associated Subsystem
Failed Component
Observed Failure
Total Events
In-operation
Events Stack Pulls
BOP Control Panel Instrumentation Mechanical damage 1 1 1
Annular Preventer
Hardware & Mechanical External leak 3 1 1
Operating System Seal Internal leak 3 1 1
Packing Element Fail to open 2 2 2
Leakage 23 15 10
Pipe Ram Preventer Ram Block Seal Fail to seal 11 3 1
Shear Ram Preventer
Bonnet Operating Seal External leak 6 1 1
Internal leak 1 1 1
Hardware & Mechanical Internal leak 2 1 1
Ram Block Seal Fail to seal 10 3 3
Total 62 29 22
NOTE: The data in this table represent all events that occurred on the identical subsystem, component, and observed failure
combination that led to the stack pull. For example, of 23 failures involving leakage on the packing element on the Annular
Preventer, 15 were in-operation events and 10 resulted in a stack pull. SOURCE: U.S. Department of Transportation, Bureau of Transportation Statistics, SafeOCS program.
Figure 12 offers a visual representation of the distribution of components involved in in-operation events
leading to at least one stack pull between 2016 and 2018, by rig. The shading of each grid square shows
whether the listed rig (i.e., column) experienced a failure event for the listed component (i.e., row). Blue
shading represents the proportion of in-operation events relative to total reported events for that
component, with darker blue representing higher rates of in-operation events. Dots represent stack pull
events. Unshaded (gray) grid squares indicate the rig experienced no reported failure events for the
listed component.
As the figure shows, squares with a stack pull generally have a darker shade (higher in-operation ratio),
and squares without a stack pull generally have a lighter shade (lower in-operation ratio). More
precisely, for component combination events associated with a stack pull (i.e., all squares showing a

47
stack pull) 66.7 percent were in-operation events, while only 10.7 percent of events with no stack pull
occurred in operation. This points toward an increased likelihood for a stack pull on rigs with a higher
proportion of in-operation events.
Figure 12: Components Involved in In-Operation Events Leading to a Stack Pull, by Rig, 2016-2018
NOTE: Rigs shown experienced at least one reported event involving the listed component combination.
SOURCE: U.S. Department of Transportation, Bureau of Transportation Statistics, SafeOCS program.
In addition to the surface stack pull rate, which is measured as a percentage of in-operation events,
surface stack pulls were examined as a percentage of successful stack “starts,” i.e., the total number of
times a surface stack was assembled on the wellhead and went into operation. This is referred to in the
industry as “rigging up” the BOP. In 2018, there were 10 surface stack pulls and 217 successful stack
starts (see Table 18), meaning 4.6 percent of successful stack starts eventually led to a stack pull.
Investigation and Failure Analysis (I&A)
As for subsea system events, the root cause for most surface system events can be easily discerned, and
the component can be repaired, replaced, or otherwise corrected; the level of I&A required for such
events is referred to as “cause immediately known.”24 For the remaining events, further I&A is required
to determine the root cause. For all reporting years, the percentage of events with I&A completed
24 See section 9.0 of the SafeOCS well control failure reporting guidance document: A User Guide for Reporting Well Control Equipment Failure, U.S. Department of Transportation, Bureau of Transportation Statistics, Rev. 2.00 (Nov. 30, 2017), https://safeocs.gov/SafeOCSGuidanceRev2.pdf.

48
beyond the level of cause immediately known is
shown in Table 26. Overall, the share of surface
system events with further I&A has decreased each
year, though only slightly from 2018 to 2017.
Root Causes of Surface System Events
Table 27 compares the distribution of root causes
across all reported events for each year and the
percent of each root cause determined through
further I&A. As shown in the table, wear and tear
and other have consistently been determined as the
top two root causes, with the share of events
attributed to wear and tear increasing each year and the share attributed to other decreasing each year.
Overall, the percentage of root causes determined through further I&A decreased from 2016 to 2018
for all root causes except design issue. The limited number of surface system events reported so far
prevents generalization of these observations. BTS will conduct additional analysis as more data
becomes available.
Table 27: Surface System Event Root Causes
Table 26: Investigation and Analysis of Surface System Events
Year Total Events
Events with Further I&A
2016 760 66 (8.7%)
2017 1,307 67 (5.1%)
2018 1,127 39 (3.5%)
Total 3,194 172 (5.4%)
SOURCE: U.S. Department of Transportation,
Bureau of Transportation Statistics, SafeOCS program.
Root Cause Percent of All Events Determined through
Further I&A
2016 2017 2018 2016 2017 2018
Wear and Tear 19.4% 46.5% 56.5% 61.5% 7.5% 10.3%
Maintenance Error 10.4% 2.6% 7.2% 57.1% 66.7% 0.0%
Design Issue 3.0% 2.6% 7.2% 0.0% 0.0% 80.0%
QA/QC Manufacturing 3.0% 3.5% 4.3% 50.0% 25.0% 0.0%
Procedural Error 1.5% 6.1% 1.4% 100.0% 85.7% 0.0%
Documentation Error 1.5% 0.0% 0.0% 0.0% 0.0% 0.0%
Other* 61.2% 38.6% 23.2% 9.8% 4.5% 6.3%
NOTE: *The selection of other by the submitter allows for entry of a root cause that may not precisely fit the other selections.
Most submitted root causes under other have been RCFA required.
SOURCE: U.S. Department of Transportation, Bureau of Transportation Statistics, SafeOCS program.

49
Root Causes of Surface Stack Pulls
As for subsea system events, RCFAs by the OEM or third party are expected to be carried out for
surface system events resulting in stack pulls and reoccurring failures.25 RCFA documentation was sent
to SafeOCS for one of the ten surface stack pulls reported in 2018, as shown in Table 28. The root
cause of the event with submitted RCFA documentation was wear and tear. For the remaining nine, the
listed root cause was wear and tear (6), QA/QC manufacturing (1), or not determined (2). Without
submission of additional RCFA documentation, the suspected root cause of the latter nine events
cannot be confirmed.
Table 28: Root Causes of Surface Stack Pulls
Associated Subsystem Failed Component Root Cause RCFA Status Stack
Pulls
Annular Preventer
Operating System Seal Wear and Tear Not sent to SafeOCS 1
Packing Element
Not Determined Not sent to SafeOCS 1
QA/QC Manufacturing Not sent to SafeOCS 1
Wear and Tear Not sent to SafeOCS 5
Completed 1 Shear Ram Preventer Bonnet Operating Seal Not Determined Not sent to SafeOCS 1
Total 10
SOURCE: U.S. Department of Transportation, Bureau of Transportation Statistics, SafeOCS program.
Table 29 summarizes the subsystem, component, and root cause for all surface stack pull events during
2016 to 2018. RCFA documentation was sent to SafeOCS for five of the 22 total events.
25 See section 9.0 of the SafeOCS well control failure reporting guidance document: A User Guide for Reporting Well Control Equipment Failure, U.S. Department of Transportation, Bureau of Transportation Statistics, Rev. 2.00 (Nov. 30, 2017), https://safeocs.gov/SafeOCSGuidanceRev2.pdf.
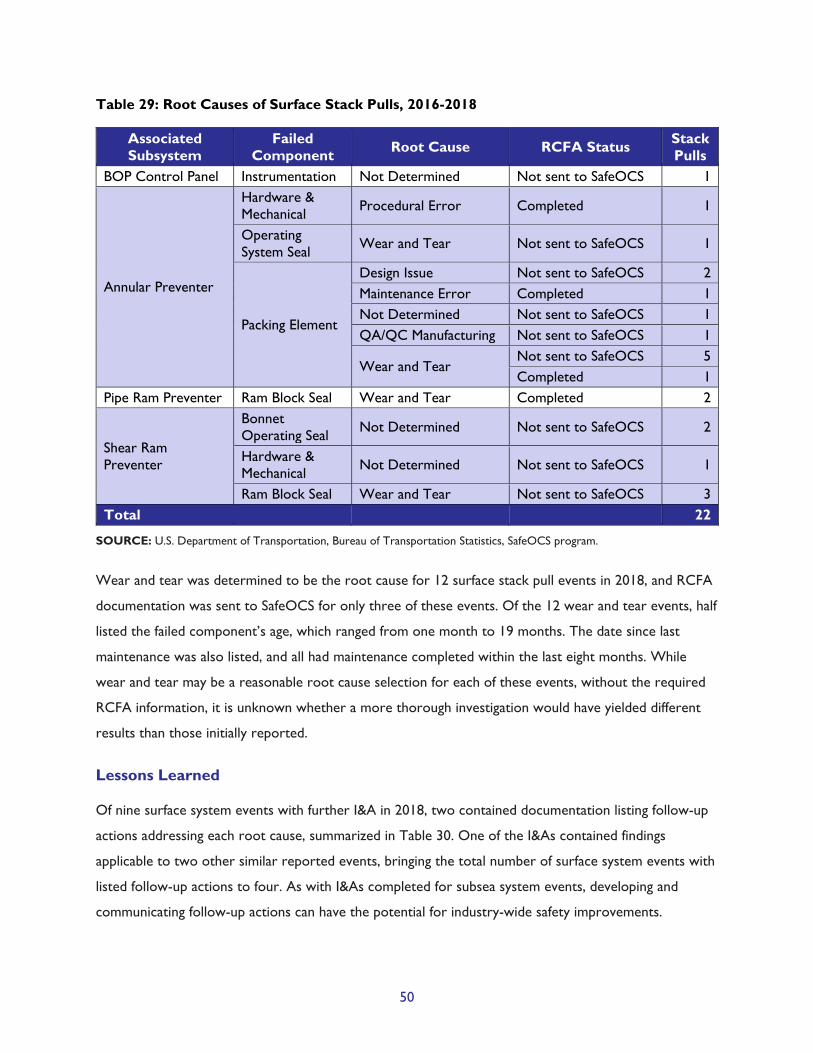
50
Table 29: Root Causes of Surface Stack Pulls, 2016-2018
Associated Subsystem
Failed Component Root Cause RCFA Status Stack
Pulls BOP Control Panel Instrumentation Not Determined Not sent to SafeOCS 1
Annular Preventer
Hardware & Mechanical Procedural Error Completed 1
Operating System Seal Wear and Tear Not sent to SafeOCS 1
Packing Element
Design Issue Not sent to SafeOCS 2 Maintenance Error Completed 1 Not Determined Not sent to SafeOCS 1 QA/QC Manufacturing Not sent to SafeOCS 1
Wear and Tear Not sent to SafeOCS 5 Completed 1
Pipe Ram Preventer Ram Block Seal Wear and Tear Completed 2
Shear Ram Preventer
Bonnet Operating Seal Not Determined Not sent to SafeOCS 2
Hardware & Mechanical Not Determined Not sent to SafeOCS 1
Ram Block Seal Wear and Tear Not sent to SafeOCS 3 Total 22
SOURCE: U.S. Department of Transportation, Bureau of Transportation Statistics, SafeOCS program.
Wear and tear was determined to be the root cause for 12 surface stack pull events in 2018, and RCFA
documentation was sent to SafeOCS for only three of these events. Of the 12 wear and tear events, half
listed the failed component’s age, which ranged from one month to 19 months. The date since last
maintenance was also listed, and all had maintenance completed within the last eight months. While
wear and tear may be a reasonable root cause selection for each of these events, without the required
RCFA information, it is unknown whether a more thorough investigation would have yielded different
results than those initially reported.
Lessons Learned
Of nine surface system events with further I&A in 2018, two contained documentation listing follow-up
actions addressing each root cause, summarized in Table 30. One of the I&As contained findings
applicable to two other similar reported events, bringing the total number of surface system events with
listed follow-up actions to four. As with I&As completed for subsea system events, developing and
communicating follow-up actions can have the potential for industry-wide safety improvements.
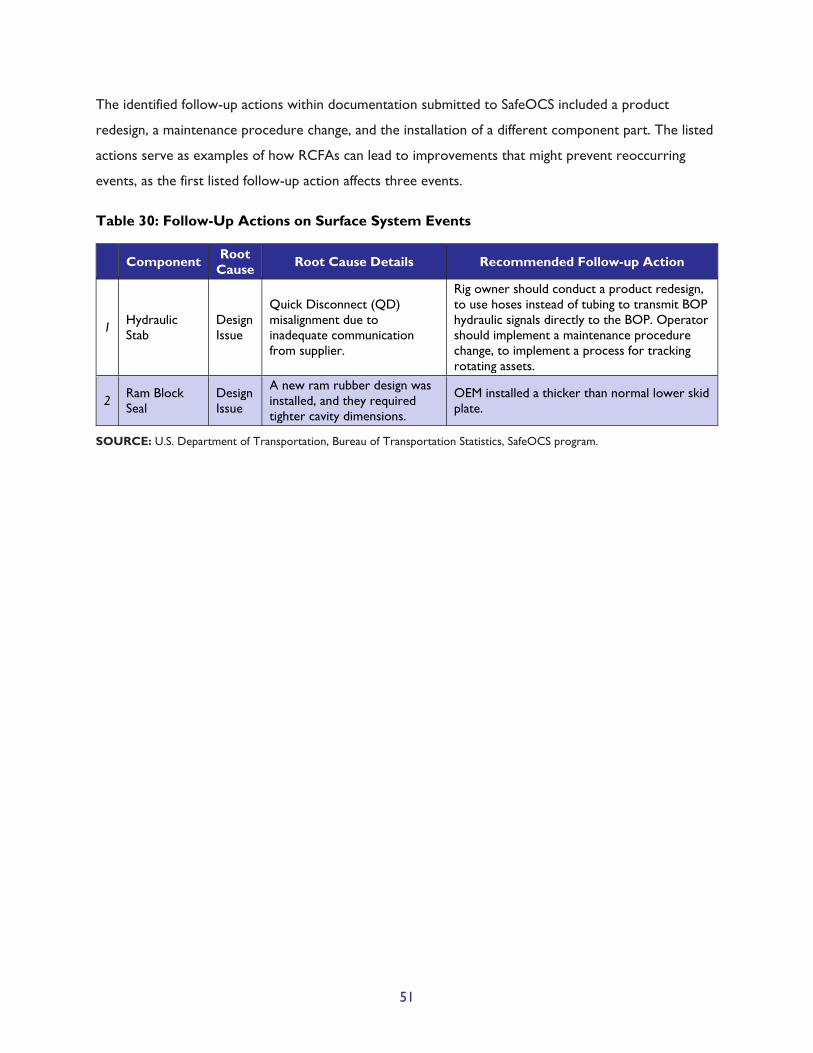
51
The identified follow-up actions within documentation submitted to SafeOCS included a product
redesign, a maintenance procedure change, and the installation of a different component part. The listed
actions serve as examples of how RCFAs can lead to improvements that might prevent reoccurring
events, as the first listed follow-up action affects three events.
Table 30: Follow-Up Actions on Surface System Events
Component Root Cause Root Cause Details Recommended Follow-up Action
1 Hydraulic Stab
Design Issue
Quick Disconnect (QD) misalignment due to inadequate communication from supplier.
Rig owner should conduct a product redesign, to use hoses instead of tubing to transmit BOP hydraulic signals directly to the BOP. Operator should implement a maintenance procedure change, to implement a process for tracking rotating assets.
2 Ram Block Seal
Design Issue
A new ram rubber design was installed, and they required tighter cavity dimensions.
OEM installed a thicker than normal lower skid plate.
SOURCE: U.S. Department of Transportation, Bureau of Transportation Statistics, SafeOCS program.

52
CHAPTER 4: CONCLUSION AND NEXT STEPS
Aggregated analysis of well control equipment component failure data can be used to develop a more
robust and comprehensive understanding of the nature of failures, their root causes and contributing
factors, and event trends across the industry. This information can be used to make changes to current
practices and improve safety and equipment reliability.
Key findings from this report include the following:
• The amount of rig activity in the GOM increased from 2017 to 2018, while the number of failure
events reported to SafeOCS decreased.
• From 2016 to 2018, the rate of event reporting adjusted for rig activity has decreased each year,
due to fewer reported events and more rig activity (as measured in BOP days).
• Leaks have remained the most frequently reported observed failure, and wear and tear has
remained the most frequently reported root cause of failure events, from 2016 to 2018.
• While the rate of stack pulls has fluctuated from year to year for both subsea and surface
systems, completion of RCFAs for stack pulls has remained under 50.0 percent, despite the
requirement of an RCFA for every stack pull.
• Overall, the percent of events with additional information submitted on causal factors via an
investigation and failure analysis has decreased each year.
Next Steps: Opportunities for Improving Data Quality and Access
Collecting more detailed, accurate, relevant, and timely equipment failure data can support more in-
depth statistical analyses to inform industry safety improvement efforts. SafeOCS continues to focus on
improvement efforts in the following areas:
Data collection: With continued input from the IADC/IOGP BOP Reliability JIP, SafeOCS is continuing
to refine the data collection form to capture more detailed and accurate information. Objectives of this
work include updated definitions, improved drop-down choices in data fields, and an updated form,
containing more fields targeting root cause and follow-up information.
SafeOCS will continue to seek more timely and complete information on RCFAs as required under 30
C.F.R. 250.730(c)(2). Improved RCFA information will improve the quality of SafeOCS data and, in turn,
the quality of the analysis the SafeOCS program can perform. More thorough investigations, particularly

53
on events leading to stack pulls, may provide information that can allow operators and equipment
owners to prepare better maintenance and testing plans to suit the anticipated operational conditions to
which the BOP stack will be subjected. Better information will also be captured by ensuring operators
can adequately explain the root cause determination when it falls under other, and BTS will evaluate how
this element of the data collection could be improved.
Data processing: Currently, operators still submit event notifications in several formats, including PDF
documents, Excel summaries, and SafeOCS website forms, the latter being the preferred method. With
a continued emphasis on electronic formats, more event notifications have been submitted via Excel
summaries and the SafeOCS online form, improving the processing of multiple event notifications and
reducing data entry errors.
Data harmonization: Evaluation of well operations data within the BSEE WAR database indicated
inconsistencies in some cases between the information in event notifications and the daily summaries
within WARs. These inconsistencies can lead to inaccurate categorizations of data, potentially leading to
inaccurately estimating the number of failures when the BOP is in operation. SafeOCS is exploring more
data sources to inform exposure measure statistics that will allow for cross-comparison with the goal of
accurate denominator information and the definitional precision of data submitted to the SafeOCS
database.
Data access: In addition to annual reports and highlight publications, SafeOCS has also developed an
online interface where operators and the public can view a data dashboard containing various
aggregated, anonymized statistics. Once there is sufficient data available, SafeOCS plans to expand the
dashboard allowing for more user interaction with the data. This tool allows for continuous access to
essential analysis of the most recently available data, including total submissions, on-time reporting, types
of failures reported, and root causes.

54
APPENDIX A: THE BSEE WELL CONTROL RULE
BSEE’s Well Control Rule (WCR) went into effect on July 28, 2016 and BTS began collecting
notifications of blowout prevention equipment component failures shortly thereafter. The WCR defines
an equipment failure as “any condition that prevents the equipment from meeting the functional specification”
and requires reporting of such failures.26 More specifically, pursuant to 30 CFR 250.730(c), operators
must do the following:
(1) Provide a written notice of equipment failure to the Chief, Office of Offshore Regulatory Programs,
and the manufacturer of such equipment within 30 days after the discovery and identification of
the failure.
(2) Ensure that an investigation and a failure analysis are performed within 120 days of the failure to
determine the cause of the failure. Any results and corrective action must be documented. If the
investigation and analysis are performed by an entity other than the manufacturer, the Chief,
Office of Offshore Regulatory Programs and the manufacturer receive a copy of the analysis report.
(3) If the equipment manufacturer sends notification of any changes in design of the equipment that
failed or the operator changes in operating or repair procedures as a result of a failure, a report of
the design change or modified procedures must be submitted in writing to the Chief, Office of
Offshore Regulatory Programs within 30 days.
(4) You must send the reports required in this paragraph to: Chief, Office of Offshore Regulatory Programs;
Bureau of Safety and Environmental Enforcement; 45600 Woodland Road, Sterling, VA 20166.
Per the agreement between BSEE and BTS, all notifications related to equipment failure should be
submitted to BTS.
Note: In 2019, BSEE revised various provisions of the Well Control Rule requirement including revisions
to 250.730(c) to clarify that failure notifications must be sent to BTS as BSEE’s designated third party. 84
Fed. Reg. 21,908 (May 15, 2019).
26 30 CFR 250.730(c)(1).
55
APPENDIX B: CONFIDENTIAL INFORMATION PROTECTION AND
STATISTICAL EFFICIENCY ACT OF 2002 (CIPSEA)
The confidentiality of all data submitted to SafeOCS is protected by the Confidential Information
Protection and Statistical Efficiency Act of 2002 (CIPSEA). However, data submitted directly to BSEE are
not protected by CIPSEA. Data protected under CIPSEA may only be used for statistical purposes. This
requires the following: a) only summary statistics and data analysis results will be made available; b)
microdata on events collected by BTS may not be used for regulatory purposes; and c) information
submitted under this statute is also protected from release to other government agencies including
BSEE, as well as protection from Freedom of Information Act (FOIA) requests and subpoenas.

56
APPENDIX C: GLOSSARY
Active Operators: Operators which conducted drilling or non-drilling rig activity in the GOM OCS
during the listed time period.
Annular Preventer: A device that can seal around any object in the wellbore or upon itself.
Blind Shear Ram (also, Shear Ram): A closing and sealing component in a ram blowout preventer
that first shears certain tubulars in the wellbore and then seals off the bore or acts as a blind ram if
there is no tubular in the wellbore.
Blowout Preventer (BOP): A device installed at the wellhead, or at the top of the casing, to contain
wellbore pressure either in the annular space between the casing and the tubulars or in an open hole
during drilling, completion, testing, or workover.
BOP Control Pod: An assembly of subsea valves and regulators hydraulically or electrically operated
which will direct hydraulic fluid through special porting to operate BOP equipment.
BOP Control System (BOP Controls): The system of pumps, valves, accumulators, fluid storage
and mixing equipment, manifold, piping, hoses, control panels, and other items necessary to hydraulically
operate the BOP equipment.
BOP Days: A measure which offers an approximation of rig activity, or the time period (in days) when
an equipment component failure could have occurred. To measure rig activity, SafeOCS analyzes WAR
data to calculate the number of days rigs are active during a given time period. Some rigs have more
than one BOP stack, and the days of activity on a rig is adjusted to account for the number of BOP
stacks, resulting in the final measure, BOP days.
BOP Stack: The assembly of well control equipment including preventers, spools, valves, and nipples
connected to the top of the wellhead, or top of the casing, that allows the well to be sealed to confine
well fluids. A BOP stack could be a subsea stack (attached to the wellhead at the sea floor), or a surface
stack (on the rig or non-rig above the water).
BOP Stack Pull (Subsea): When either the BOP is removed from the wellhead or the LMRP is
removed from the lower stack to repair a failed component. The BOP stack cannot be classified as a
stack pull until after it has been in operation as defined above.

57
BOP Stack Pull (Surface): When a BOP component fails in operation and requires well conditioning
and a mechanical barrier placement to make necessary repairs.
BOP Stack Pull Event Rate: See Event Rate.
BOP Stack Retrieval: The recovery of the LMRP and or the subsea BOP stack before it has been
classified as in operation. If the LMRP and/or BOP stack is recovered to the rig floor any time after
deployment has begun and before initial latch-up tests are passed, it is considered a stack retrieval.
BOP Stack Run (or Deployment): The activity of deploying, or “running” a subsea BOP stack from
the rig (or non-rig) floor to the subsea wellhead. A stack run can take approximately 8 to 48 hours,
depending on water depth. The term stack run and stack deployment are equivalent and
interchangeable. In this report, the term “successful BOP stack run” means the BOP passed its initial
latch-up testing and went into operation.
BOP Stack Start (or Rig Up): In this report, BOP stack start means when a surface BOP stack is
assembled on the wellhead. This is referred to in the industry as “rigging up” the BOP. In this report, the
term “successful BOP stack start” means the BOP passed its initial testing and went into operation.
Control Fluid: Hydraulic oil, water-based fluid, or gas which, under pressure, pilots the operation of
control valves or directly operates functions.
Disabled Barrier: When a barrier is not able to perform its intended function (for example, a failure
that causes an annular preventer to fail to seal or fail to open or close).
Drilling Fluid: The fluid added to the wellbore to facilitate the drilling process and control the well.
Various mixtures of water, mineral oil, barite, and other compounds may be used to improve the fluid
characteristics (mud weight, lubricity, etc.). This is commonly called drilling mud, and it may contain
drilling cuttings.
Drilling Operations: Rigs primarily perform drilling and completion operations but can also perform
operations typically performed by less expensive non-rigs such as well intervention, workover,
temporary abandonment, and permanent abandonment. These activities are considered non-drilling
operations and are typically performed by non-rig units such as coil tubing units, hydraulic workovers,
wireline units, plug and abandon (P&A) units, snubbing units, and lift boats.

58
Event Rate: The event rate reflects the number of reported events per 1,000 BOP days. The event
rate is calculated as: (events / BOP days) * 1,000.
In-Operation Event Rate: The in-operation event rate reflects the number of in-operation
events per 1,000 in-operation BOP days. The in-operation event rate is calculated as:
(in-operation events / in-operation BOP days) * 1,000.
Not-in-Operation Event Rate: The not-in-operation event rate reflects the number of not-
in-operation events per 1,000 not-in-operation BOP days. The not-in-operation event rate is
calculated as: (not-in-operation events / not-in-operation BOP days) * 1,000.
Stack Pull Event Rate (or Stack Pull Rate): Two measures are used for stack pull event
rate, defined below. In this report, the term typically refers to measure (b), except in Table 3:
Subsea System Exposure Measures and Table 18: Surface System Exposure Measures, where the
term refers to measure (a).
a. The number of stack pulls per 1,000 in-operation BOP days, i.e., (stack pulls / in-
operation BOP days) * 1,000.
b. The number of stack pulls as a percentage of in-operation events, i.e., (stack pulls /
in-operation events) * 100.
In-Operation (Subsea): A subsea BOP stack is in-operation after it has completed a successful
pressure test of the wellhead connection to the well-bore per approved well plan.
In-Operation (Surface): A surface BOP stack is in-operation after it has completed a successful
pressure test of the wellhead connection to the well-bore per approved well plan.
In-Operation Event Rate: See Event Rate.
Loss of Containment (LOC): An external leak of wellbore fluids outside of the “pressure containing”
equipment boundary.
Non-Drilling Operations: Operations that are considered “non-drilling” include intervention,
workover, temporary abandonment, and permanent abandonment. These activities are typically
performed by specialist equipment that is installed on either a rig or non-rig.

59
Not-in-Operation (Subsea): A subsea BOP stack changes from in-operation to not-in-operation
when either the BOP is removed from the wellhead or the LMRP is removed from the lower stack.
When the BOP stack is on deck or is being run or pulled (retrieving), it is considered not-in-operation.
Not-in-Operation (Surface): A surface BOP changes from in-operation to not-in-operation when the
well is conditioned and a mechanical barrier (i.e., packer/plug) is set in the wellbore.
Not-in-Operation Event Rate: See Event Rate.
Pipe Ram Preventer: A device that can seal around the outside diameter of a pipe or tubular in the
wellbore. These can be sized for a range of pipe sizes (variable pipe ram) or a specific pipe size.
Pre-Spud Operations: The time period preceding the start of drilling activities.
Rig Days: A measure which offers an approximation of rig activity, or the time period (in days) when an
equipment component failure could have occurred. To measure rig activity, SafeOCS analyzes WAR
data to calculate the number of days rigs are active during a given time period.
Rigs Operating: This includes any rigs in the given time period and location which had an active
contract to perform drilling and non-drilling activities.
Stack Pull Event Rate: See Event Rate.
Subunit: See Well Control Equipment Subunits.
Wellbore Fluid: The fluids (oil, gas, and water) from the reservoir that would typically be found in a
production well, commonly referred to as hydrocarbons. During drilling, completion, or workover
operations, drilling fluids may also be referred to as wellbore fluids.
Well Control Equipment Subunits: The well control equipment components are categorized
according to the following subunits: auxiliary equipment, BOP control systems (primary, secondary, and
emergency), BOP stack system, choke manifold system, diverter system, and riser system.
Wells Spud: The number of wells that were first started, or “spudded”, in the given time period,
beginning January 1st and ending December 31st. Wells spudded are a subset of total wells with activity in
a given time period.

60
Wells with Activity: This includes any well which had a rig or non-rig performing drilling or non-
drilling activities in the given time period beginning January 1st and ending December 31st.

61
APPENDIX D: ACRONYM LIST
ANSI: American National Standards Institute
API: American Petroleum Institute
BOP: Blowout preventer
BSEE: Bureau of Safety and Environmental Enforcement
BTS: Bureau of Transportation Statistics
CIPSEA: Confidential Information Protection and Statistical Efficiency Act
DOI: Department of the Interior
DOT: Department of Transportation
EHBS: Emergency hydraulic backup system
GOM: Gulf of Mexico
I&A: Investigation and failure analysis
IADC: International Association of Drilling Contractors
IOGP: International Association of Oil and Gas Producers
JIP: Joint industry project
LMRP: Lower marine riser package
LOC: Loss of containment
MOC: Management of change
OCS: Outer Continental Shelf
OEM: Original equipment manufacturer
QA/QC: Quality assurance / quality control
62
RCFA: Root cause failure analysis
ROV: Remotely operated vehicle
SME: Subject matter expert
SPM: Sub-plate mounted
WAR: Well activity report
WCR: Well Control Rule

63
APPENDIX E: RELEVANT STANDARDS
Industry standards with relevant sections incorporated by reference in 30 CFR 250.198:
• API RP 17H, Remotely Operated Tools and Interfaces on Subsea Production Systems, Second
Edition
• ANSI/API Spec. 6A, Specification for Wellhead and Christmas Tree Equipment, Twentieth Edition
• ANSI/API Spec. 16A, Specification for Drill-through Equipment, Third Edition
• ANSI/API Spec. 16C, Specification for Choke and Kill Systems, First Edition
• API Spec. 16D, Specification for Control Systems for Drilling Well Control Equipment and Control
Systems for Diverter Equipment, Second Edition
• ANSI/API Spec. 17D, Design and Operation of Subsea Production Systems—Subsea Wellhead and
Tree Equipment, Second Edition
• ANSI/API Spec. Q1, Specification for Quality Management System Requirements for Manufacturing
Organizations for the Petroleum and Natural Gas Industry, Ninth Edition
• API Standard 53, Blowout Prevention Equipment Systems for Drilling Wells, Fourth Edition

64
APPENDIX F: SCHEMATICS OF BOP SYSTEM BOUNDARIES
Figure 13: Example Choke and Kill Manifold for Subsea Systems
See Appendix C, Figure 18 in 2016 SafeOCS Annual Report.
Figure 14: Example Subsea BOP Stack with Optional Locations for Choke and Kill Lines
See Appendix C, Figure 19 in 2016 SafeOCS Annual Report.
Figure 15: Example Subsea Ram BOP Space-Out
See Appendix C, Figure 20 in 2016 SafeOCS Annual Report.
Figure 16: Example Surface BOP Ram Space-Out
See Appendix C, Figure 21 in 2016 SafeOCS Annual Report.