2018 annual report...sandeep kumar, phd senior vice president of worldwide operations alessandro...
TRANSCRIPT

Silic
on
La
bs 2
018 An
nu
al R
ep
ort
sila
bs.c
om
2018 Annual ReportThe leader in silicon, software and solutions for a smarter, more connected world.
silabs.com
The leader in silicon, software and solutions for a smarter, more connected world.

Silicon Labs is a leading provider of silicon, software and solutions for a smarter, more connected world.Founded in 1996 and headquartered in Austin, Texas, Silicon Labs has more than 1,700 patents issued or pending. The company’s common stock is traded on the NASDAQ exchange under the ticker symbol “SLAB.”
Board of Directors
Nav SoochFounder and Chairman
Bill WoodLead Independent Director
Bill BockIndependent Director
Jack LazarIndependent Director
Gregg LowePresident and Chief Executive Offi cer, Cree
Nina RichardsonIndependent Director
Sumit SadanaExecutive Vice President andChief Business Offi cer, Micron Technology
Tyson TuttlePresident and Chief Executive Offi cer, Silicon Labs
Christy WyattChief Executive Offi cer,Absolute Software Corporation
Executive Offi cers
Tyson Tuttle President and Chief Executive Offi cer
John HollisterSenior Vice President and Chief Financial Offi cer
Brandon TolanySenior Vice President of Worldwide Sales and Marketing
Sandeep Kumar, PhDSenior Vice President of Worldwide Operations
Alessandro Piovaccari, PhDSenior Vice President and Chief Technical Offi cer
Corporate Information
Stock Listing Common stock traded on NASDAQ, symbol SLAB
OptionsThe Company’s options are traded on the Chicago Board Option Exchange and the American Stock Exchange.
Legal CounselDLA Piper US LLP401 Congress Avenue, Suite 2500Austin, Texas, 78701 USA
Independent Registered Public Accounting FirmErnst & Young LLP401 Congress Avenue, Suite 1800Austin, Texas, 78701 USA
Transfer Agent and RegistrarAmerican Stock Transfer & Trust Company59 Maiden LanePlaza Level New York, New York, 10038 USA+1 800-937-5449
Stock Data As of 1/21/2019, there were 67 holders of record, holding a total of 43,088,623 shares. The table below shows the high and low per-share sales prices of our common stock for the periods indicated, as reported by NASDAQ.
High Low
Q1 $101.20 $84.48
Q2 $110.70 $85.96
Q3 $108.15 $90.50
Q4 $93.73 $73.13
Annual MeetingThe Silicon Laboratories Inc. annual meeting will be held on Thursday, April 18, 2019 at 9:00a.m. Central Time at the Lady Bird Johnson Wildfl ower Center, 4801 La Crosse Avenue, Austin, Texas, 78739 USA.
Investor RelationsFor more information about Silicon Labs, please visit our website at www.silabs.com, or contact:
Investor Relations Silicon Labs400 West Cesar Chavez StreetAustin, Texas, 78701 USA+1 [email protected]
Designed by Make It So Design, Austin, Texas
To Our Shareholders
We are proud of our performance in 2018, which was a strong year for Silicon Labs in many dimensions. We grew revenue by $100 million to a record $868 million, completed the successful acquisition of Z-Wave, and strengthened our team with the addition of critical talent in software, sales, applications, customer support and leadership. We continue to focus our strategy and investments on long-term, high-quality growth vectors where the insatiable demand for data, the electrifi cation of the world and the value in connecting “things” will only accelerate into the future.
We made signifi cant progress during the year with our IoT and Infrastructure products, which now represent more than 75 percent of total revenue. We saw growth in all geographies and key end market segments, led by Industrial, which increased over 20 percent year-on-year to more than 50 percent of revenue. Our opportunity pipeline grew more than 40 percent year-on-year to $11 billion in lifetime revenue with design wins increasing approximately 30 percent, providing a strong tailwind for future growth potential.
Conservative fi nancial management and operational excellence have been the foundation of our success. In 2018, we delivered GAAP gross margins of 60 percent and non-GAAP gross margins of 61 percent, above the high end of our target operating model range and refl ecting the quality of our products and served markets, as well as a stronger Infrastructure product mix. GAAP operating margin was 10 percent of revenue in 2018. We posted a notable improvement in non-GAAP profi tability, with operating margin up 70 basis points over 2017 to 21 percent. GAAP diluted earnings per share increased 74 percent year-on-year to $1.90. Non-GAAP diluted earnings per share increased 14 percent year-on-year to a record $3.71. Strong operating cash fl ow of $174 million enabled Silicon Labs to repurchase $39 million of its shares. We ended the year with $620 million in cash, cash equivalents and investments, and $160 million remaining in our share repurchase authorization through fi scal 2019. We are well-positioned to execute on our capital deployment strategy focusing on M&A and share repurchases.
Our IoT products are gaining signifi cant traction in the smart home, industrial, metering, commercial, consumer and lighting markets. Revenue for the year grew 17 percent, representing more than 50 percent of total revenue, falling short of expectations due to headwinds from delayed product ramps in lighting and metering markets as well as macro weakness as we exited the year. Design wins increased nearly 30 percent year-on-year signaling strong market traction and future growth. We are focusing our R&D investments to deliver higher levels of integration and security, and new multiprotocol capabilities to extend our leadership and differentiation in target markets for low-power wireless end nodes.
Infrastructure delivered more than 30 percent year-on-year revenue growth, and design win lifetime revenue increased approximately 50 percent. We continue to expand and diversify our timing revenue beyond core optical networking into industrial, data center and wireless infrastructure mar-kets. The explosion of data is driving data center upgrades from 10G to 100G, wireless carrier upgrades from 4G to 5G and service provider upgrades from 100G to 400G. These faster speeds drive demand for higher performance timing products, which plays to our strength and leadership in clocks and oscillators. We have also established ourselves as the leading provider of digital isolation technology for the cloud, telecom and electric vehicle markets. We are encouraged by the longer-term demand for electric vehicles, which presents a large opportunity for Silicon Labs with the number of EVs on the road expected to grow to 125 million by 2030.
We believe we are well-positioned and remain confi dent in our longer-term ability to outperform the market. We are focused on executing on our product roadmaps and converting a large pipeline of opportunities into additional wins and share gains. The technologies we are developing are enabling our customers to transform industries and improve lives, and together we are creating a smarter, more connected world.
We appreciate your investment in Silicon Labs.
Tyson Tuttle President and
Chief Executive Officer
Nav SoochFounder and
Chairman

$621 $645$698
$769
$868
FY14 FY15 FY16 FY17 FY18
AccessBroadcast
InfrastructureIoT
Silicon Labs 2018 Annual Report
GAAP Financials*In thousands, except per share data
Q1 2018 Q2 2018 Q3 2018 Q4 2018 FY2018
Revenue $205,384 $217,106 $230,243 $215,534 $868,267
% YOY Growth 14.7% 14.2% 15.9% 7.2% 12.9%
Gross Margin $124,237 $131,292 $135,627 $130,243 $521,399
% of Revenue 60.5% 60.5% 58.9% 60.4% 60.1%
R&D $54,828 $59,495 $61,091 $62,933 $238,347
% of Revenue 26.7% 27.4% 26.5% 29.2% 27.5%
SG&A $45,694 $53,796 $49,406 $48,948 $197,844
% of Revenue 22.3% 24.8% 21.5% 22.7% 22.8%
Operating Expenses $100,522 $113,291 $110,497 $111,881 $436,191
% of Revenue 49.0% 52.2% 48.0% 51.9% 50.3%
Operating Income $23,715 $18,001 $25,130 $18,362 $85,208
% of Revenue 11.5% 8.3% 10.9% 8.5% 9.8%
Net Income $26,405 $14,280 $27,761 $15,145 $83,591
% of Revenue 12.9% 6.6% 12.1% 7.0% 9.6%
Diluted Earnings Per Share $0.60 $0.32 $0.63 $0.35 $1.90
% YoY Growth 66.7% -15.8% 37.0% NM1 74.3%
*Please see the supplemental tables provided in this report for a reconciliation of GAAP to non-GAAP results in Appendix I. Past performance does not guarantee future results. This Annual Report to Shareholders contains forward-looking statements, and actual results could differ materially. Risk factors that could cause actual results to differ are set forth in the “Risk Factors” section and throughout our 2018 Form 10-K, which is included in this Annual Report. 1Not a Meaningful Figure
RevenueIn millions

(This page has been left blank intentionally.)

UNITED STATESSECURITIES AND EXCHANGE COMMISSION
Washington, D.C. 20549
FORM 10-K(Mark One)
� ANNUAL REPORT PURSUANT TO SECTION 13 OR 15(d) OF THESECURITIES EXCHANGE ACT OF 1934
For the fiscal year ended December 29, 2018
or
� TRANSITION REPORT PURSUANT TO SECTION 13 OR 15(d) OF THESECURITIES EXCHANGE ACT OF 1934
For the transition period from to
Commission file number: 000-29823
SILICON LABORATORIES INC.(Exact name of registrant as specified in its charter)
Delaware 74-2793174(State or other jurisdiction of (I.R.S. Employerincorporation or organization) Identification No.)
400 West Cesar Chavez, Austin, Texas 78701(Address of principal executive offices) (Zip Code)
(512) 416-8500(Registrant’s telephone number, including area code)
Securities registered pursuant to Section 12(b) of the Act:
Title of each class Name of exchange on which registered
Common Stock, $0.0001 par value The NASDAQ Stock Market LLC
Securities registered pursuant to Section 12(g) of the Act: None
Indicate by check mark if the registrant is a well-known seasoned issuer, as defined in Rule 405 of the SecuritiesAct. � Yes � No
Indicate by check mark if the registrant is not required to file reports pursuant to Section 13 or Section 15(d) of theAct. � Yes � No
Indicate by check mark whether the registrant (1) has filed all reports required to be filed by Sections 13 or 15(d) of theSecurities Exchange Act of 1934 during the preceding 12 months (or for such shorter period that the registrant was required tofile such reports), and (2) has been subject to such filing requirements for the past 90 days. � Yes � No
Indicate by check mark whether the registrant has submitted electronically every Interactive Data File required to besubmitted pursuant to Rule 405 of Regulation S-T (§232.405 of this chapter) during the preceding 12 months (or for suchshorter period that the registrant was required to submit such files). � Yes � No
Indicate by check mark if disclosure of delinquent filers pursuant to Item 405 of Regulation S-K (§229.405 of this chapter)is not contained herein, and will not be contained, to the best of the registrant’s knowledge, in definitive proxy or informationstatements incorporated by reference in Part III of this Form 10-K or any amendment to this Form 10-K. �
Indicate by check mark whether the registrant is a large accelerated filer, an accelerated filer, a non-accelerated filer, asmaller reporting company, or an emerging growth company. See the definitions of ‘‘large accelerated filer,’’ ‘‘accelerated filer,’’‘‘smaller reporting company’’ and ‘‘emerging growth company’’ in Rule 12b-2 of the Exchange Act.
Large accelerated filer � Accelerated filer � Non-accelerated filer � Smaller reporting company �Emerging growth company �
If an emerging growth company, indicate by check mark if the registrant has elected not to use the extended transitionperiod for complying with any new or revised financial accounting standards provided pursuant to Section 13(a) of the ExchangeAct. �
Indicate by check mark whether the registrant is a shell company (as defined in Rule 12b-2 of the Exchange Act).� Yes � No
The aggregate market value of the voting and non-voting common equity held by non-affiliates computed by reference tothe price at which the common equity was last sold as of the last business day of the registrant’s most recently completedsecond fiscal quarter (June 29, 2018) was approximately $4.2 billion (assuming, for this purpose, that only directors and officersare deemed affiliates).
There were 43,088,623 shares of the registrant’s common stock issued and outstanding as of January 21, 2019.
DOCUMENTS INCORPORATED BY REFERENCE
Portions of the Proxy Statement for the registrant’s 2018 Annual Meeting of Stockholders are incorporated by referenceinto Part III of this Form 10-K.

(This page has been left blank intentionally.)

Table of Contents
PageNumber
Part IItem 1. Business . . . . . . . . . . . . . . . . . . . . . . . . . . . . . . . . . . . . . . . . . . . . . . . 2Item 1A. Risk Factors . . . . . . . . . . . . . . . . . . . . . . . . . . . . . . . . . . . . . . . . . . . . 13Item 1B. Unresolved Staff Comments . . . . . . . . . . . . . . . . . . . . . . . . . . . . . . . . . 28Item 2. Properties . . . . . . . . . . . . . . . . . . . . . . . . . . . . . . . . . . . . . . . . . . . . . . 28Item 3. Legal Proceedings . . . . . . . . . . . . . . . . . . . . . . . . . . . . . . . . . . . . . . . . 29Item 4. Mine Safety Disclosures . . . . . . . . . . . . . . . . . . . . . . . . . . . . . . . . . . . . 29
Part IIItem 5. Market for Registrant’s Common Equity, Related Stockholder Matters
and Issuer Purchases of Equity Securities . . . . . . . . . . . . . . . . . . . . . 30Item 6. Selected Financial Data . . . . . . . . . . . . . . . . . . . . . . . . . . . . . . . . . . . . 32Item 7. Management’s Discussion and Analysis of Financial Condition and
Results of Operations . . . . . . . . . . . . . . . . . . . . . . . . . . . . . . . . . . . . 33Item 7A. Quantitative and Qualitative Disclosures about Market Risk . . . . . . . . . 45Item 8. Financial Statements and Supplementary Data . . . . . . . . . . . . . . . . . . . 46Item 9. Changes in and Disagreements with Accountants on Accounting and
Financial Disclosure . . . . . . . . . . . . . . . . . . . . . . . . . . . . . . . . . . . . . 46Item 9A. Controls and Procedures . . . . . . . . . . . . . . . . . . . . . . . . . . . . . . . . . . . 46Item 9B. Other Information . . . . . . . . . . . . . . . . . . . . . . . . . . . . . . . . . . . . . . . . 47
Part IIIItem 10. Directors, Executive Officers and Corporate Governance . . . . . . . . . . . . 48Item 11. Executive Compensation . . . . . . . . . . . . . . . . . . . . . . . . . . . . . . . . . . . 48Item 12. Security Ownership of Certain Beneficial Owners and Management and
Related Stockholder Matters . . . . . . . . . . . . . . . . . . . . . . . . . . . . . . . 48Item 13. Certain Relationships and Related Transactions, and Director
Independence . . . . . . . . . . . . . . . . . . . . . . . . . . . . . . . . . . . . . . . . . 48Item 14. Principal Accounting Fees and Services . . . . . . . . . . . . . . . . . . . . . . . . . 48
Part IVItem 15. Exhibits and Financial Statement Schedules . . . . . . . . . . . . . . . . . . . . . 49Item 16. Form 10-K Summary . . . . . . . . . . . . . . . . . . . . . . . . . . . . . . . . . . . . . . 51
Cautionary Statement
Except for the historical financial information contained herein, the matters discussed in this report onForm 10-K (as well as documents incorporated herein by reference) may be considered ‘‘forward-looking’’statements within the meaning of Section 27A of the Securities Act of 1933, as amended, and Section 21Eof the Securities Exchange Act of 1934, as amended. Such forward-looking statements include declarationsregarding the intent, belief or current expectations of Silicon Laboratories Inc. and its management and maybe signified by the words ‘‘believe,’’ ‘‘estimate,’’ ‘‘expect,’’ ‘‘intend,’’ ‘‘anticipate,’’ ‘‘plan,’’ ‘‘project,’’ ‘‘will’’ orsimilar language. You are cautioned that any such forward-looking statements are not guarantees of futureperformance and involve a number of risks and uncertainties. Actual results could differ materially fromthose indicated by such forward-looking statements. Factors that could cause or contribute to suchdifferences include those discussed under ‘‘Risk Factors’’ and elsewhere in this report. Silicon Laboratoriesdisclaims any intention or obligation to update or revise any forward-looking statements, whether as a resultof new information, future events or otherwise.
1

Part I
Item 1. Business
General
Silicon Laboratories Inc. is a leading provider of silicon, software and solutions for a smarter, moreconnected world. Our award-winning technologies are shaping the future of the Internet of Things(IoT), Internet infrastructure, industrial automation, consumer and automotive markets. Our world-class engineering team creates products focused on performance, energy savings, connectivity andsimplicity.
Our primary semiconductor products are mixed-signal integrated circuits (ICs), which areelectronic components that convert real-world analog signals, such as sound and radio waves, intodigital signals that electronic products can process. Our mixed-signal ICs leverage standardcomplementary metal oxide semiconductor (CMOS), a low cost, widely available process technology.Use of CMOS technology enables smaller, more cost-effective and energy-efficient solutions. Ourexpertise in analog-intensive, mixed-signal IC design in CMOS allows us to develop new and innovativeproducts that are highly integrated, simplifying our customers’ designs and improving theirtime-to-market.
Industry Background
The pervasiveness of connectivity and mobile devices is driving semiconductor consumption.Intelligence is being added to electronic systems to enable Internet connectivity, power efficiency andan improved user experience. This in turn is increasing the demand for bandwidth, requiring moreinfrastructure to support higher performance networks. The nearly ubiquitous availability of Internetaccess and the increasing intelligence of electronic devices and mobility are enabling what is called theInternet of Things, a term that describes the exponential increase in IP-enabled devices connected tothe Internet.
These trends require more and more interaction between the analog world we live in and thedigital world of computing, which is driving the need for analog-intensive, mixed-signal circuits in awide range of electronic products. Traditional mixed-signal designs relied upon solutions built withnumerous, complex discrete analog and digital components. While these traditional designs provide therequired functionality, they are often inefficient and inadequate for use in markets where size, cost,power consumption and performance are increasingly important product differentiators. To improvetheir competitive position, electronics manufacturers must reduce the cost and complexity of theirsystems and enable new features or functionality to differentiate themselves from their competitors.
Simultaneously, these manufacturers face accelerating time-to-market demands and must rapidlyadapt to evolving industry standards and new technologies. Because analog-intensive, mixed-signaldesign expertise is difficult to find, these manufacturers increasingly are turning to third parties, like us,to provide advanced mixed-signal solutions. Mixed-signal design requires specific expertise and relies oncreative, experienced engineers to deliver solutions that optimize speed, power and performance,despite the noisy digital environment, and within the constraints of standard manufacturing processes.The development of this design expertise typically requires years of practical analog design experienceunder the guidance of a senior engineer, and engineers with the required level of skill and expertise arein short supply.
Many IC solution providers lack sufficient analog expertise to develop compelling mixed-signalproducts. As a result, manufacturers of electronic devices value providers that can supply them withmixed-signal solutions offering greater functionality, smaller size and lower power requirements at areduced cost and shorter time-to-market.
2

Products
We provide analog-intensive, mixed-signal solutions for use in a variety of electronic products in abroad range of applications for the IoT including connected home and security, industrial, smartenergy, consumer, automotive and lighting applications. We are a supplier of wireless connectivitysolutions for the IoT based on Zigbee�, sub-GHz proprietary technologies, Bluetooth�, Z-Wave�,Thread, and Wi-Fi�.
We provide a wide range of timing and isolation products for infrastructure applications includinghigh-performance clocks and oscillators for networking equipment, data centers and wireless basestations, as well as digital isolators and current sensors for industrial power supplies, motor control,solar inverters and hybrid-electric vehicles. We also provide broadcast products, such as TV tuners anddemodulators and automotive radio tuners, and access products including subscriber line interfacecircuits for voice over IP (VoIP), embedded modems, and Power over Ethernet (PoE) power sourceequipment and powered device ICs.
Our products integrate complex mixed-signal functions that are frequently performed by numerousdiscrete components in competing products into a single chip or chipset. By doing so, we createproducts that, when compared to many competing products, offer the following benefits:
• Require less printed circuit board (PCB) space;
• Reduce the use of external components lowering the system cost and simplifying design;
• Offer superior performance improving our customers’ end products;
• Provide increased reliability and manufacturability, improving customer yields; and/or
• Reduce system power requirements enabling smaller form factors and/or longer battery life.
We group our products into the following categories:
• Internet of Things products, which include our microcontroller (MCU), wireless and sensorproducts;
• Broadcast products, which include our broadcast consumer and automotive products;
• Infrastructure products, which include our timing products (clocks and oscillators), and isolationdevices; and
• Access products, which include our Voice over IP (VoIP) products, embedded modems andPower over Ethernet (PoE) devices.
3
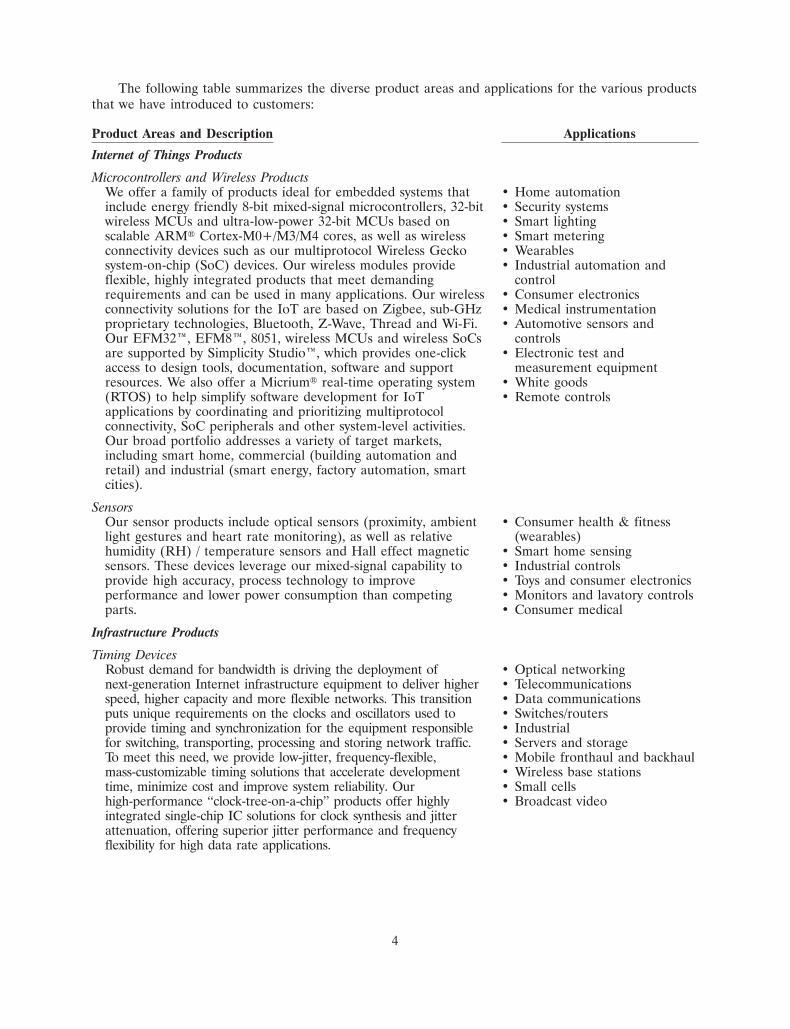
The following table summarizes the diverse product areas and applications for the various productsthat we have introduced to customers:
Product Areas and Description Applications
Internet of Things Products
Microcontrollers and Wireless ProductsWe offer a family of products ideal for embedded systems that • Home automationinclude energy friendly 8-bit mixed-signal microcontrollers, 32-bit • Security systemswireless MCUs and ultra-low-power 32-bit MCUs based on • Smart lightingscalable ARM� Cortex-M0+/M3/M4 cores, as well as wireless • Smart meteringconnectivity devices such as our multiprotocol Wireless Gecko • Wearablessystem-on-chip (SoC) devices. Our wireless modules provide • Industrial automation andflexible, highly integrated products that meet demanding controlrequirements and can be used in many applications. Our wireless • Consumer electronicsconnectivity solutions for the IoT are based on Zigbee, sub-GHz • Medical instrumentationproprietary technologies, Bluetooth, Z-Wave, Thread and Wi-Fi. • Automotive sensors andOur EFM32�, EFM8�, 8051, wireless MCUs and wireless SoCs controlsare supported by Simplicity Studio�, which provides one-click • Electronic test andaccess to design tools, documentation, software and support measurement equipmentresources. We also offer a Micrium� real-time operating system • White goods(RTOS) to help simplify software development for IoT • Remote controlsapplications by coordinating and prioritizing multiprotocolconnectivity, SoC peripherals and other system-level activities.Our broad portfolio addresses a variety of target markets,including smart home, commercial (building automation andretail) and industrial (smart energy, factory automation, smartcities).
SensorsOur sensor products include optical sensors (proximity, ambient • Consumer health & fitnesslight gestures and heart rate monitoring), as well as relative (wearables)humidity (RH) / temperature sensors and Hall effect magnetic • Smart home sensingsensors. These devices leverage our mixed-signal capability to • Industrial controlsprovide high accuracy, process technology to improve • Toys and consumer electronicsperformance and lower power consumption than competing • Monitors and lavatory controlsparts. • Consumer medical
Infrastructure Products
Timing DevicesRobust demand for bandwidth is driving the deployment of • Optical networkingnext-generation Internet infrastructure equipment to deliver higher • Telecommunicationsspeed, higher capacity and more flexible networks. This transition • Data communicationsputs unique requirements on the clocks and oscillators used to • Switches/routersprovide timing and synchronization for the equipment responsible • Industrialfor switching, transporting, processing and storing network traffic. • Servers and storageTo meet this need, we provide low-jitter, frequency-flexible, • Mobile fronthaul and backhaulmass-customizable timing solutions that accelerate development • Wireless base stationstime, minimize cost and improve system reliability. Our • Small cellshigh-performance ‘‘clock-tree-on-a-chip’’ products offer highly • Broadcast videointegrated single-chip IC solutions for clock synthesis and jitterattenuation, offering superior jitter performance and frequencyflexibility for high data rate applications.
4
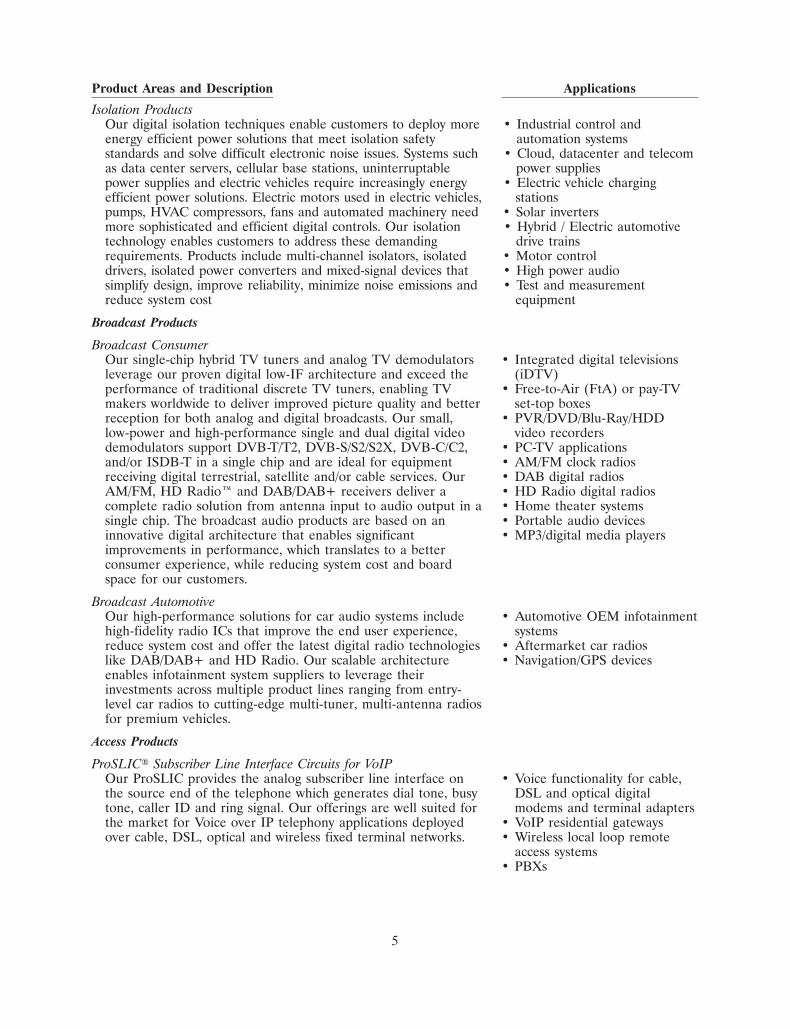
Product Areas and Description Applications
Isolation ProductsOur digital isolation techniques enable customers to deploy more • Industrial control andenergy efficient power solutions that meet isolation safety automation systemsstandards and solve difficult electronic noise issues. Systems such • Cloud, datacenter and telecomas data center servers, cellular base stations, uninterruptable power suppliespower supplies and electric vehicles require increasingly energy • Electric vehicle chargingefficient power solutions. Electric motors used in electric vehicles, stationspumps, HVAC compressors, fans and automated machinery need • Solar invertersmore sophisticated and efficient digital controls. Our isolation • Hybrid / Electric automotivetechnology enables customers to address these demanding drive trainsrequirements. Products include multi-channel isolators, isolated • Motor controldrivers, isolated power converters and mixed-signal devices that • High power audiosimplify design, improve reliability, minimize noise emissions and • Test and measurementreduce system cost equipment
Broadcast Products
Broadcast ConsumerOur single-chip hybrid TV tuners and analog TV demodulators • Integrated digital televisionsleverage our proven digital low-IF architecture and exceed the (iDTV)performance of traditional discrete TV tuners, enabling TV • Free-to-Air (FtA) or pay-TVmakers worldwide to deliver improved picture quality and better set-top boxesreception for both analog and digital broadcasts. Our small, • PVR/DVD/Blu-Ray/HDDlow-power and high-performance single and dual digital video video recordersdemodulators support DVB-T/T2, DVB-S/S2/S2X, DVB-C/C2, • PC-TV applicationsand/or ISDB-T in a single chip and are ideal for equipment • AM/FM clock radiosreceiving digital terrestrial, satellite and/or cable services. Our • DAB digital radiosAM/FM, HD Radio� and DAB/DAB+ receivers deliver a • HD Radio digital radioscomplete radio solution from antenna input to audio output in a • Home theater systemssingle chip. The broadcast audio products are based on an • Portable audio devicesinnovative digital architecture that enables significant • MP3/digital media playersimprovements in performance, which translates to a betterconsumer experience, while reducing system cost and boardspace for our customers.
Broadcast AutomotiveOur high-performance solutions for car audio systems include • Automotive OEM infotainmenthigh-fidelity radio ICs that improve the end user experience, systemsreduce system cost and offer the latest digital radio technologies • Aftermarket car radioslike DAB/DAB+ and HD Radio. Our scalable architecture • Navigation/GPS devicesenables infotainment system suppliers to leverage theirinvestments across multiple product lines ranging from entry-level car radios to cutting-edge multi-tuner, multi-antenna radiosfor premium vehicles.
Access Products
ProSLIC� Subscriber Line Interface Circuits for VoIPOur ProSLIC provides the analog subscriber line interface on • Voice functionality for cable,the source end of the telephone which generates dial tone, busy DSL and optical digitaltone, caller ID and ring signal. Our offerings are well suited for modems and terminal adaptersthe market for Voice over IP telephony applications deployed • VoIP residential gatewaysover cable, DSL, optical and wireless fixed terminal networks. • Wireless local loop remote
access systems• PBXs
5

Product Areas and Description Applications
ISOmodem� Embedded ModemsOur ISOmodem embedded modems leverage innovative silicon • Fax machines and multi-direct access arrangement (DAA) technology and a digital signal function printersprocessor (DSP) to deliver a globally compliant, compact analog • Point of sale (POS) terminalsmodem for embedded applications. • Security systems
• Industrial monitoring• Remote medical monitoring
Power over EthernetOur PoE power source equipment and powered device ICs offer • Enterprise networking routershighly differentiated solutions with a reduced total bill of and switchesmaterials (BOM) and improved performance and reliability. Our • Wireless access points (WAP)solutions offer a higher level of integration not available with • VoIP phonescompeting solutions. • POS terminals
• Security cameras
Revenues during fiscal 2018, 2017 and 2016 were generated predominately by sales of our mixed-signal products. The following summarizes our revenue by product category (in thousands):
Fiscal Year
2018 2017 2016
Internet of Things . . . . . . . . . . . . . . . . . . . . . . . . $463,838 $395,012 $314,614Infrastructure . . . . . . . . . . . . . . . . . . . . . . . . . . . . 199,478 152,158 147,677Broadcast . . . . . . . . . . . . . . . . . . . . . . . . . . . . . . . 141,412 152,980 157,746Access . . . . . . . . . . . . . . . . . . . . . . . . . . . . . . . . . 63,539 68,717 77,589
Revenues . . . . . . . . . . . . . . . . . . . . . . . . . . . . . . . $868,267 $768,867 $697,626
Customers, Sales and Marketing
We market our products through our direct sales force and through a network of independentsales representatives and distributors. Direct and distributor customers buy on an individual purchaseorder basis, rather than pursuant to long-term agreements.
We consider our customer to be the end customer purchasing either directly from a distributor, acontract manufacturer or us. During fiscal 2018, our ten largest end customers accounted for 20% ofour revenues. We had no customer that represented more than 10% of our revenues during this period.An end customer purchasing through a contract manufacturer typically instructs such contractmanufacturer to obtain our products and incorporate such products with other components for sale bysuch contract manufacturer to the end customer. Although we sell the products to, and are paid bydistributors and contract manufacturers, we refer to such end customer as our customer. Two of ourdistributors who sell directly to our customers, Arrow Electronics and Edom Technology, eachrepresented 21% and 17% of our revenues during fiscal 2018, respectively. There were no contractmanufacturers that accounted for 10% or more of revenues for fiscal 2018. During fiscal 2018, weconsolidated our distribution relationships to a single global distributor, Arrow Electronics. We aremaintaining our extensive network of regional distributor partners and etailers to complement oursingle global distributor partner.
We maintain numerous sales offices in Asia, the Americas and Europe. Revenue is attributed to ageographic area based on the shipped-to location. The percentage of our revenues derived from outsideof the United States was 83% in fiscal 2018. For further information regarding our revenues andlong-lived assets by geographic area, see Note 18, Segment Information, to the Consolidated FinancialStatements.
6

Our direct sales force is comprised of many sales professionals who possess varied levels ofresponsibility and experience, including directors, country managers, regional sales managers, districtsales managers, strategic account managers, field sales engineers and sales representatives. We alsoutilize independent sales representatives and distributors to generate sales of our products. We haverelationships with many independent sales representatives and distributors worldwide whom we haveselected based on their understanding of the mixed-signal marketplace and their ability to provideeffective field sales applications support for our products.
Our marketing efforts are targeted at both identified industry leaders and emerging marketparticipants. Direct marketing activities are supplemented by a focused marketing communicationseffort that seeks to raise awareness of our company and products. Our public relations efforts arefocused on leading trade and business publications. Our external website is used to deliver corporateand product information. We also pursue targeted advertising in key trade publications and we have acooperative marketing program that allows our distributors and representatives to promote ourproducts to their local markets in conjunction with their own advertising activities. Finally, we maintaina presence at strategic trade shows and industry events. These activities, in combination with directsales activities, help drive demand for our products.
Due to the complex and innovative nature of our products, we employ experienced applicationsengineers who work closely with customers and distributors to support the design-win process, and cansignificantly accelerate the customer’s time to market. A design win occurs when a customer hasdesigned our ICs into its product architecture and ordered product from us. A considerable amount ofeffort to help a customer incorporate our ICs into its products is typically required prior to any sale. Inmany cases, our innovative ICs require significantly different implementations than existing approachesand, therefore, successful implementations may require extensive communication with potentialcustomers. The amount of time required to achieve a design win can vary substantially depending on acustomer’s development cycle, which can be relatively short (such as three months) or very long (suchas two years) based on a wide variety of customer factors. Not all design wins ultimately result inrevenue, or may result in less revenue than expected. However, once a completed design architecturehas been implemented and produced in high volumes, our customers are reluctant to significantly altertheir designs due to this extensive design-win process. We believe this process, coupled with ourintellectual property protection, promotes relatively longer product life cycles for our products and highbarriers to entry for competitive products, even if such competing products are offered at lower prices.Our close collaboration with our customers provides us with knowledge of derivative product ideas orcompletely new product line offerings that may not otherwise arise in other new product discussions.
Research and Development
Through our research and development efforts, we leverage experienced analog and mixed-signalengineering talent and expertise to create new ICs that integrate functions typically performed lessefficiently by multiple discrete components. This integration generally results in lower costs, smaller diesizes, lower power demands and enhanced price/performance characteristics. We attempt to reusesuccessful techniques for integration in new applications where similar benefits can be realized. Webelieve that we have attracted many of the best engineers in our industry. We believe that reliable andprecise analog and mixed-signal ICs can only be developed by teams of engineers who have significantanalog experience and are familiar with the intricacies of designing these ICs for commercial volumeproduction. The development of test methodologies is just one example of a critical activity requiringexperience and know-how to enable the rapid release of a new product for commercial success. Wehave accumulated a vast set of trade secrets that allow us to pursue innovative approaches to mixed-signal problems that are difficult for competitors to duplicate. We highly value our engineering talentand strive to maintain a very high bar when bringing new recruits to the company.
7

Research and development expenses were $238.3 million, $209.5 million and $199.7 million infiscal 2018, 2017 and 2016, respectively.
Technology
Our product development process facilitates the design of highly-innovative, analog-intensive,mixed-signal ICs. Our engineers’ deep knowledge of existing and emerging standards and performancerequirements helps us to assess the technical feasibility of a particular IC. We target areas where wecan provide compelling product improvements. Once we have solved the primary challenges, our fieldapplication engineers continue to work closely with our customers’ design teams to maintain anddevelop an understanding of our customers’ needs, allowing us to formulate derivative products andrefined features.
In providing mixed-signal ICs for our customers, we believe our key competitive advantages are:
• Analog and RF design expertise in CMOS;
• Mixed-signal, firmware and system design expertise;
• Microcontroller and system on a chip design expertise;
• Software expertise, including multiprotocol connectivity and real-time operating systems for theIoT;
• Module integration and wireless design expertise; and
• Our broad understanding of systems technology and trends.
To fully capitalize on these advantages, we have assembled a world-class development team withexceptional analog and mixed-signal design expertise led by accomplished senior engineers.
Analog and RF Design Expertise in CMOS
We believe that our most significant core competency is world-class analog and RF designcapability. Additionally, we strive to design substantially all our ICs in standard CMOS processes. Mostof our product designs now incorporate some type of RF in CMOS technology. While it is oftensignificantly more difficult to design analog ICs in CMOS, CMOS provides multiple benefits versusexisting alternatives, including significantly reduced cost, reduced technology risk and greater worldwidefoundry capacity. CMOS is the most commonly used process technology for manufacturing digital ICsand as a result is most likely to be used for the manufacturing of ICs with finer line geometries. Thesefiner line geometries can enable smaller and faster ICs. By designing our ICs in CMOS, we enable ourproducts to benefit from this trend towards finer line geometries, which allows us to integrate moredigital functionality into our mixed-signal ICs.
Designing analog and mixed-signal ICs is significantly more complicated than designing standalonedigital ICs. While advanced software tools exist to help automate digital IC design, there are far fewertools for advanced analog and mixed-signal IC design. In many cases, our analog circuit design effortsbegin at the fundamental transistor level. We believe that we have a demonstrated ability to design themost difficult analog and RF circuits using standard CMOS technologies.
Mixed-Signal, Firmware and System Design Expertise
We consider the partitioning of a circuit to be a proprietary and creative design technique. Deepsystems knowledge allows us to use our mixed-signal and RF in CMOS design expertise to maximizethe price/performance characteristics of both the analog and digital functions and allow our ICs to workin an optimized manner to accomplish particular tasks. Generally, we attempt to move analog functionsinto the digital domain as quickly as possible, creating system efficiencies without compromising
8

performance. These patented approaches require our advanced signal processing and systems expertise.We then leverage our firmware know-how to change the ‘personality’ of our devices, optimizingfeatures and functions needed by various markets we serve. For example, our wireless SoC devices forIoT applications integrate both digital and analog domains in a single chip. The SoCs combine ARMCortex-M processor cores, a variety of digital and analog peripherals, hardware cryptographyaccelerators, and analog-intensive multiprotocol radio transceivers. This system integration at the chiplevel leverages our deep expertise in mixed-signal and RF design, and low-power wireless MCUarchitectures pioneered for more than a decade.
Microcontroller and System on a Chip Design Expertise
We have the talent and circuit integration methodologies required to combine precision analog,high-speed digital, flash memory and in-system programmability into a single, monolithic CMOSintegrated circuit. Our microcontroller products are designed to capture an external analog signal,convert it to a digital signal, compute digital functions on the stream of data and then communicate theresults through a standard digital interface. The ability to develop standard products with the broadestpossible customer application base while being cost efficient with the silicon area of the monolithicCMOS integrated circuit requires a keen sense of customer value and engineering capabilities.Additionally, to manage the wide variety of signals on a monolithic piece of silicon including electricalnoise, harmonics and other electronic distortions requires a fundamental knowledge of device physicsand accumulated design expertise.
Software Expertise
Our software expertise allows us to develop products for markets where intelligent data capture,high-performance processing and communication are increasingly important product differentiators. Thesoftware we have developed to address these markets enables machine-to-machine communications,providing intelligence to electronic systems. Our products integrate high-performance, low-powerwireless and microcontroller ICs with reliable and scalable software into a flexible and robustnetworking platform.
The demand for low-power, small-footprint wireless technology is accelerating as more and moreIP-enabled end points are being connected to the IoT. Our software enables a broad range of power-sensitive applications for the IoT, including smart energy, home automation, security and otherconnected products. We believe that the combination of our software and IC design expertisedifferentiates us from many of our competitors.
As the IoT continues to mature, a new class of embedded applications is emerging, presentingfeature-rich and task-intensive use cases. This growing complexity is driving the need for real-timeoperating systems to help simplify software development for IoT applications by coordinating andprioritizing multiprotocol connectivity, SoC peripherals and other system-level activities. In addition tobeing able to manage numerous application tasks, an RTOS enhances scalability, and makes complexapplications predictable and reliable. To address these application needs, we acquired Micrium, anembedded RTOS provider. Micrium has established itself as a reliable, high performance and trustedRTOS software platform, with an installed base that has grown to millions of devices.
Module Integration and Wireless Design Expertise
The market for wireless modules has grown as customers search for solutions that provide turnkeywireless connectivity to their products. The development of modules is difficult due to stringentrequirements, including high levels of integration, programmability, performance, reliability, securityand power efficiency. In addition, designs must meet numerous wireless standards deployed in variousenvironments and serving diverse requirements.
9

Our combined expertise in IC design and software development allows us to engineer modules thatprovide robust, high-performance connections in challenging wireless environments. We have developedwireless modules based on numerous wireless standards, including Z-Wave, Bluetooth, Zigbee, Thread,Wi-Fi and sub-GHz. We believe our demonstrated proficiency in the design of modules provides ourcustomers with significant advantages such as fast time to market, reduced development cost, globalwireless certifications and software reuse.
Understanding of Systems Technology and Trends
Our focused expertise in mixed-signal ICs is the result of the breadth of engineering talent wehave assembled with experience working in analog-intensive CMOS design for a wide variety ofapplications. This expertise, which we consider a competitive advantage, is the foundation of ourin-depth understanding of the technology and trends that impact electronic systems and markets. Ourexpertise includes:
• Isolation, which is critical for existing and emerging industrial applications and telecomnetworks;
• Frequency synthesis, which is core technology for wireless and clocking applications;
• Integration, which enables the elimination of discrete components in a system; and
• Signal processing and precision analog, which forms the heart of consumer, industrial, medicaland automotive electronics applications.
Our understanding of the role of analog/digital interfaces within electronic systems, standardsevolution, and end market drivers enables us to identify product development opportunities andcapitalize on market trends.
Manufacturing
As a fabless semiconductor company, we conduct IC design and development in our facilities andelectronically transfer our proprietary IC designs to third-party semiconductor fabricators who processsilicon wafers to produce the ICs that we design. Our IC designs typically use industry-standard CMOSmanufacturing process technology to achieve a level of performance normally associated with moreexpensive special-purpose IC fabrication technology. We believe the use of CMOS technology facilitatesthe rapid production of our ICs within a lower cost framework. Our IC production employs submicronprocess geometries which are readily available from leading foundry suppliers worldwide, thusincreasing the likelihood that manufacturing capacity will be available throughout our products’ lifecycles. We currently partner with Taiwan Semiconductor Manufacturing Co. (TSMC) andSemiconductor Manufacturing International Corporation (SMIC) to manufacture the majority of oursemiconductor wafers. We believe that our fabless manufacturing model significantly reduces our capitalrequirements and allows us to focus our resources on design, development and marketing of our ICs.
Once the silicon wafers have been produced, they are shipped directly to our third-party assemblysubcontractors. The assembled ICs are then moved to the final testing stage. This operation can beperformed by the same contractor that assembled the IC, other third-party test subcontractors or withinour internal facilities prior to shipping to our customers. During fiscal 2018, most of our units shippedwere tested by offshore third-party test subcontractors. We expect that our utilization of offshore third-party test subcontractors will remain substantial during fiscal 2019.
Backlog
We include in backlog accepted product purchase orders from customers and worldwide distributorstocking orders. Product orders in our backlog are subject to changes in delivery schedules or
10

cancellation at the option of the purchaser typically without penalty. Our backlog may fluctuatesignificantly depending upon customer order patterns which may, in turn, vary considerably based onrapidly changing business circumstances. Accordingly, we do not believe that our backlog at any time isnecessarily representative of actual sales for any succeeding period.
Competition
The markets for semiconductors generally, and for analog and mixed-signal ICs in particular, areintensely competitive. We anticipate that the market for our products will continually evolve and will besubject to rapid technological change. We believe the principal competitive factors in our industry are:
• Product size; • Power requirement;• Level of integration; • Customer support;• Product capabilities; • Reputation;• Reliability; • Ability to rapidly introduce new products to market;• Price; • Intellectual property; and• Performance; • Software.
We believe that we are competitive with respect to these factors, particularly because our ICstypically are smaller in size, are highly integrated, achieve high performance specifications at lowerprice points than competitive products and are manufactured in standard CMOS which generallyenables us to supply them on a relatively rapid basis to customers to meet their product introductionschedules. However, disadvantages we face include our relatively short operating history in certain ofour markets and the need for customers to redesign their products and modify their software toimplement our ICs in their products.
Due to our diversified product portfolio and the numerous markets and applications we serve, wetarget a relatively large number of competitors. We compete with Analog Devices, Broadcom, Cypress,IDT, Infineon, Maxim Integrated Products, MaxLinear, Microchip, Nordic Semiconductor,NXP Semiconductors, Qualcomm, Renesas, STMicroelectronics, Synaptics, Texas Instruments andothers. We expect to face competition in the future from our current competitors, other manufacturersand designers of semiconductors and start-up semiconductor design companies. Our competitors mayalso offer bundled solutions offering a more complete product, which may negatively impact ourcompetitive position despite the technical merits or advantages of our products. In addition, ourcustomers could develop products or technologies internally that would replace their need for ourproducts and would become a source of competition. We could also face competition from modulemakers or other systems suppliers that may include mixed-signal components in their products thatcould eliminate the need for our ICs.
Many of our competitors and potential competitors have longer operating histories, greater namerecognition, access to larger customer bases, complementary product offerings, and significantly greaterfinancial, sales and marketing, manufacturing, distribution, technical and other resources than us.Current and potential competitors have established or may establish financial and strategic relationshipsbetween themselves or with our existing or potential customers, resellers or other third parties.Accordingly, it is possible that new competitors or alliances among competitors could emerge andrapidly acquire significant market share.
Intellectual Property
Our future success depends in part upon our proprietary technology. We seek to protect ourtechnology through a combination of patents, copyrights, trade secrets, trademarks and confidentialityprocedures. As of December 29, 2018, we had approximately 1,730 issued or pending United States andforeign patents. There can be no assurance that patents will ever be issued with respect to our patentapplications. Furthermore, it is possible that any patents held by us may be invalidated, circumvented,
11
challenged or licensed to others. In addition, there can be no assurance that such patents will provideus with competitive advantages or adequately safeguard our proprietary rights. While we continue tofile new patent applications with respect to our recent developments, existing patents are granted forprescribed time periods and will expire at various times in the future.
We claim copyright protection for proprietary documentation for our products. We have filed forregistration, or are in the process of filing for registration, the visual images of certain ICs with theU.S. Copyright Office. We have registered the ‘‘Silicon Labs’’ logo and a variety of other product andproduct family names as trademarks in the United States and selected foreign jurisdictions. All othertrademarks, service marks or trade names appearing in this report are the property of their respectiveowners. We also attempt to protect our trade secrets and other proprietary information throughagreements with our customers, suppliers, employees and consultants, and through other customarysecurity measures. We intend to protect our rights vigorously, but there can be no assurance that ourefforts will be successful. In addition, the laws of other countries in which our products are sold maynot protect our products and intellectual property rights to the same extent as the laws of the UnitedStates.
While our ability to effectively compete depends in large part on our ability to protect ourintellectual property, we believe that our technical expertise and ability to introduce new products in atimely manner will be an important factor in maintaining our competitive position.
Many participants in the semiconductor and electronics industries have a significant number ofpatents and have frequently demonstrated a readiness to commence litigation based on allegations ofpatent and other intellectual property infringement. From time to time, third parties may assertinfringement claims against us. We may not prevail in any such litigation or may not be able to licenseany valid and infringed patents from third parties on commercially reasonable terms, if at all.Litigation, regardless of the outcome, is likely to result in substantial cost and diversion of ourresources, including our management’s time. Any such litigation could materially adversely affect us.
Our licenses include industry standard licenses with our vendors, such as wafer fabrication toollibraries, third-party core libraries, computer-aided design applications and business softwareapplications.
Employees
As of December 29, 2018, we employed 1,505 people. Our success depends on the continuedservice of our key technical and senior management personnel and on our ability to continue to attract,retain and motivate highly skilled analog and mixed-signal engineers. The competition for suchpersonnel is intense. We have never had a work stoppage and none of our U.S. employees arerepresented by a labor organization. We consider our employee relations to be good.
Environmental Regulation
Federal, state and local regulations impose various environmental controls on the storage, use,discharge and disposal of certain chemicals and gases used in the semiconductor industry. Ourcompliance with these laws and regulations has not had a material impact on our financial position orresults of operations.
Available Information
Our website address is www.silabs.com. Our annual report on Form 10-K, quarterly reports onForm 10-Q, current reports on Form 8-K and amendments to those reports filed or furnished pursuantto Section 13(a) or 15(d) of the Securities Exchange Act of 1934 are available through the investorrelations page of our website free of charge as soon as reasonably practicable after we electronically filesuch material with, or furnish it to, the Securities and Exchange Commission (SEC). Our website andthe information contained therein or connected thereto are not intended to be incorporated into thisAnnual Report on Form 10-K.
12

Item 1A. Risk Factors
Risks Related to our Business
We may not be able to maintain our historical growth and may experience significant period-to-periodfluctuations in our revenues and operating results, which may result in volatility in our stock price
Although we have generally experienced revenue growth in our history, we may not be able tosustain this growth. We may also experience significant period-to-period fluctuations in our revenuesand operating results in the future due to a number of factors, and any such variations may cause ourstock price to fluctuate. In some future period our revenues or operating results may be below theexpectations of public market analysts or investors. If this occurs, our stock price may drop, perhapssignificantly.
A number of factors, in addition to those cited in other risk factors applicable to our business, maycontribute to fluctuations in our revenues and operating results, including:
• The timing and volume of orders received from our customers;
• The timeliness of our new product introductions and the rate at which our new products maycannibalize our older products;
• The rate of acceptance of our products by our customers, including the acceptance of newproducts we may develop for integration in the products manufactured by such customers, whichwe refer to as ‘‘design wins’’;
• The time lag and realization rate between ‘‘design wins’’ and production orders;
• The demand for, and life cycles of, the products incorporating our mixed-signal solutions;
• The rate of adoption of mixed-signal products in the markets we target;
• Deferrals or reductions of customer orders in anticipation of new products or productenhancements from us or our competitors or other providers of mixed-signal ICs;
• Changes in product mix;
• The average selling prices for our products could drop suddenly due to competitive offerings orcompetitive predatory pricing;
• The average selling prices for our products generally decline over time;
• Changes in market standards;
• Impairment charges related to inventory, equipment or other long-lived assets;
• The software used in our products, including software provided by third parties, may not meetthe needs of our customers;
• Our customers may not be able to obtain other components such as capacitors (which arecurrently in short supply) that they need to incorporate in conjunction with our products, leadingto potential downturn in the demand for our products;
• Significant legal costs to defend our intellectual property rights or respond to claims against us;and
• The rate at which new markets emerge for products we are currently developing or for whichour design expertise can be utilized to develop products for these new markets.
The markets for consumer electronics, for example, are characterized by rapid fluctuations indemand and seasonality that result in corresponding fluctuations in the demand for our products that
13
are incorporated in such devices. Additionally, the rate of technology acceptance by our customersresults in fluctuating demand for our products as customers are reluctant to incorporate a new IC intotheir products until the new IC has achieved market acceptance. Once a new IC achieves marketacceptance, demand for the new IC can quickly accelerate to a point and then level off such that rapidhistorical growth in sales of a product should not be viewed as indicative of continued future growth. Inaddition, demand can quickly decline for a product when a new IC product is introduced and receivesmarket acceptance. Due to the various factors mentioned above, the results of any prior quarterly orannual periods should not be relied upon as an indication of our future operating performance.
If we are unable to develop or acquire new and enhanced products that achieve market acceptance in a timelymanner, our operating results and competitive position could be harmed
Our future success will depend on our ability to develop or acquire new products and productenhancements that achieve market acceptance in a timely and cost-effective manner. The developmentof mixed-signal ICs is highly complex, and we have at times experienced delays in completing thedevelopment and introduction of new products and product enhancements. Successful productdevelopment and market acceptance of our products depend on a number of factors, including:
• Requirements of customers;
• Accurate prediction of market and technical requirements;
• Timely completion and introduction of new designs;
• Timely qualification and certification of our products for use in our customers’ products;
• Commercial acceptance and volume production of the products into which our ICs will beincorporated;
• Availability of foundry, assembly and test capacity;
• Achievement of high manufacturing yields;
• Quality, price, performance, power use and size of our products;
• Availability, quality, price and performance of competing products and technologies;
• Our customer service, application support capabilities and responsiveness;
• Successful development of our relationships with existing and potential customers;
• Technology, industry standards or end-user preferences; and
• Cooperation of third-party software providers and our semiconductor vendors to support ourchips within a system.
We cannot provide any assurance that products which we recently have developed or may developin the future will achieve market acceptance. We have introduced to market or are in development ofmany products. If our products fail to achieve market acceptance, or if we fail to develop new productson a timely basis that achieve market acceptance, our growth prospects, operating results andcompetitive position could be adversely affected. The growth of the IoT market is dependent on theadoption of industry standards to permit devices to connect and communicate with each other. If theindustry cannot agree on a common set of standards, then the growth of the IoT market may be slowerthan expected.
14

Our research and development efforts are focused on a limited number of new technologies and products, andany delay in the development, or abandonment, of these technologies or products by industry participants, ortheir failure to achieve market acceptance, could compromise our competitive position
Our products serve as components and solutions in electronic devices in various markets. As aresult, we have devoted and expect to continue to devote a large amount of resources to developproducts based on new and emerging technologies and standards that will be commercially introducedin the future. Research and development expense during fiscal 2018 was $238.3 million, or 27.5% ofrevenues. A number of companies are actively involved in the development of these new technologiesand standards. Should any of these companies delay or abandon their efforts to develop commerciallyavailable products based on new technologies and standards, our research and development efforts withrespect to these technologies and standards likely would have no appreciable value. In addition, if wedo not correctly anticipate new technologies and standards, or if the products that we develop based onthese new technologies and standards fail to achieve market acceptance, our competitors may be betterable to address market demand than we would. Furthermore, if markets for these new technologies andstandards develop later than we anticipate, or do not develop at all, demand for our products that arecurrently in development would suffer, resulting in lower sales of these products than we currentlyanticipate.
Significant litigation over intellectual property in our industry may cause us to become involved in costly andlengthy litigation which could adversely affect our business
The semiconductor and software industries have experienced significant litigation involving patentsand other intellectual property rights. From time to time, third parties, including non-practicing entities,allege intellectual property infringement by our products, our customers’ products, or products usingtechnologies or communications standards used in our industry. We also receive communications fromcustomers or suppliers requesting indemnification for allegations brought against them by third parties.Some of these allegations have resulted, and may result in the future, in our involvement in litigation.We have certain contractual obligations to defend and indemnify our customers from certaininfringement claims. We also have been involved in litigation to protect our intellectual property rightsin the past and may become involved in such litigation again in the future.
Given the unpredictable nature of litigation and the complexity of the technology, we may notprevail in any such litigation. Legal proceedings could subject us to significant liability, invalidate ourproprietary rights, or harm our businesses and our ability to compete. Legal proceedings initiated by usto protect our intellectual property rights could also result in counterclaims or countersuits against us.Any litigation, regardless of its outcome or merit, could be time-consuming and expensive to resolveand could divert our management’s time and attention. Intellectual property litigation also could forceus to take specific actions, including:
• Cease using, selling or manufacturing certain products, services or processes;
• Attempt to obtain a license, which license may require the payment of substantial royalties ormay not be available on reasonable terms or at all;
• Incur significant costs, time delays and lost business opportunities to develop alternativetechnologies or redesign products; or
• Pursue legal remedies with third parties to enforce our indemnification rights, which may notadequately protect our interests.
Any acquisitions we make could disrupt our business and harm our financial condition
As part of our growth and product diversification strategy, we continue to evaluate opportunitiesto acquire other businesses, intellectual property or technologies that would complement our current
15
offerings, expand the breadth of our markets or enhance our technical capabilities. On April 18, 2018,we acquired the Z-Wave business from Sigma Designs. This acquisition and other acquisitions that wehave made and may make in the future entail a number of risks that could materially and adverselyaffect our business and operating results, including:
• Problems integrating the acquired operations, technologies or products with our existing businessand products;
• Diversion of management’s time and attention from our core business;
• Need for financial resources above our planned investment levels;
• Difficulties in retaining business relationships with suppliers and customers of the acquiredcompany;
• Risks associated with entering markets in which we lack prior experience;
• Risks associated with the transfer of licenses of intellectual property;
• Increased operating costs due to acquired overhead;
• Tax issues associated with acquisitions;
• Acquisition-related disputes, including disputes over earn-outs and escrows;
• Potential loss of key employees of the acquired company; and
• Potential impairment of related goodwill and intangible assets.
Future acquisitions also could cause us to incur debt or contingent liabilities or cause us to issueequity securities that could negatively impact the ownership percentages of existing shareholders.
We may be unable to protect our intellectual property, which would negatively affect our ability to compete
Our products rely on our proprietary technology, and we expect that future technological advancesmade by us will be critical to sustain market acceptance of our products. Therefore, we believe that theprotection of our intellectual property rights is and will continue to be important to the success of ourbusiness. We rely on a combination of patent, copyright, trademark and trade secret laws andrestrictions on disclosure to protect our intellectual property rights. We also enter into confidentiality orlicense agreements with our employees, consultants, intellectual property providers and businesspartners, and control access to and distribution of our documentation and other proprietaryinformation. Despite these efforts, unauthorized parties may attempt to copy or otherwise obtain anduse our proprietary technology. Monitoring unauthorized use of our technology is difficult, and wecannot be certain that the steps we have taken will prevent unauthorized use of our technology,particularly in foreign countries where the laws may not protect our proprietary rights as fully as in theUnited States. We cannot be certain that patents will be issued as a result of our pending applicationsnor can we be certain that any issued patents would protect or benefit us or give us adequateprotection from competing products. For example, issued patents may be circumvented or challengedand declared invalid or unenforceable. We also cannot be certain that others will not develop effectivecompeting technologies on their own.
Failure to manage our distribution channel relationships could impede our future growth
The future growth of our business will depend in large part on our ability to manage ourrelationships with current and future distributors and sales representatives, develop additional channelsfor the distribution and sale of our products and manage these relationships. During fiscal 2018, 71%of our revenue was derived from distributors. As we execute our indirect sales strategy, we mustmanage the potential conflicts that may arise with our direct sales efforts. For example, conflicts with
16

a distributor may arise when a customer begins purchasing directly from us rather than through thedistributor. The inability to successfully execute or manage a multi-channel sales strategy could impedeour future growth. In addition, relationships with our distributors often involve the use of priceprotection and inventory return rights. This often requires a significant amount of sales management’stime and system resources to manage properly. Because we consolidated our distribution relationshipsto a single global distributor, Arrow Electronics, in fiscal 2018, termination of the relationship withArrow Electronics, either by us or by Arrow Electronics, could result in a temporary or permanent lossof revenue. If Arrow Electronics fails to effectively market and sell our products in full compliance withapplicable laws, or if we are unable to maintain our existing relationship with Arrow Electronics, wemay not be able to find a distributor with the scale and resources of Arrow Electronics, maintainexisting levels of international revenue or realize expected long-term international revenue growth. Wemay not be successful in finding suitable alternative global distributors on satisfactory terms, or at all,and this could adversely affect our ability to effectively sell our solutions in certain geographicallocations or to certain end customers.
We depend on a limited number of customers for a significant portion of our revenues, and the loss of, or asignificant reduction in orders from, any key customer could significantly reduce our revenues
The loss of any of our key customers, or a significant reduction in sales to any one of them, wouldsignificantly reduce our revenues and adversely affect our business. During fiscal 2018, our ten largestcustomers accounted for 20% of our revenues. Some of the markets for our products are dominated bya small number of potential customers. Therefore, our operating results in the foreseeable future willcontinue to depend on our ability to sell to these dominant customers, as well as the ability of thesecustomers to sell products that incorporate our IC products. In the future, these customers may decidenot to purchase our products at all, purchase fewer products than they did in the past or alter theirpurchasing patterns, particularly because:
• We do not have material long-term purchase contracts with our customers;
• Substantially all of our sales to date have been made on a purchase order basis, which permitsour customers to cancel, change or delay product purchase commitments with little or no noticeto us and without penalty;
• Some of our customers may have efforts underway to actively diversify their vendor base whichcould reduce purchases of our products; and
• Some of our customers have developed or acquired products that compete directly with productsthese customers purchase from us, which could affect our customers’ purchasing decisions in thefuture.
Our customers regularly evaluate alternative sources of supply in order to diversify their supplierbase, which increases their negotiating leverage with us and protects their ability to secure thesecomponents. We believe that any expansion of our customers’ supplier bases could have an adverseeffect on the prices we are able to charge and volume of product that we are able to sell to ourcustomers, which would negatively affect our revenues and operating results.
We are subject to increased inventory risks and costs because we build our products based on forecastsprovided by customers before receiving purchase orders for the products
In order to ensure availability of our products for some of our largest customers, we start themanufacturing of our products in advance of receiving purchase orders based on forecasts provided bythese customers. However, these forecasts do not represent binding purchase commitments and we donot recognize sales for these products until they are shipped to the customer. As a result, we incurinventory and manufacturing costs in advance of anticipated sales. Because demand for our
17
products may not materialize, manufacturing based on forecasts subjects us to increased risks of highinventory carrying costs, increased obsolescence and increased operating costs. These inventory risks areexacerbated when our customers purchase indirectly through contract manufacturers or holdcomponent inventory levels greater than their consumption rate because this causes us to have lessvisibility regarding the accumulated levels of inventory for such customers. A resulting write-off ofunusable or excess inventories would adversely affect our operating results.
Our products are complex and may contain errors which could lead to liability, an increase in our costsand/or a reduction in our revenues
Our products are complex and may contain errors, particularly when first introduced and/or whennew versions are released. Our products are increasingly designed in more complex processes, includinghigher levels of software and hardware integration in modules and system-level solutions and/or includeelements provided by third parties which further increase the risk of errors. We rely primarily on ourin-house testing personnel to design test operations and procedures to detect any errors orvulnerabilities prior to delivery of our products to our customers.
Should problems occur in the operation or performance of our products, we may experience delaysin meeting key introduction dates or scheduled delivery dates to our customers. These errors could alsocause significant re-engineering costs, the diversion of our engineering personnel’s attention from ourproduct development efforts and cause significant customer relations and business reputation problems.Any defects could result in refunds, product replacement, product recall or other liability. Any of theforegoing could impose substantial costs and harm our business.
Product liability, data breach or cyber liability claims may be asserted with respect to our products.Many of our products focus on wireless connectivity and the IoT market and such connectivity maymake these products particularly susceptible to cyber-attacks. Our products are typically sold at pricesthat are significantly lower than the cost of the end-products into which they are incorporated. Adefect, failure or vulnerability in our product could cause failure in our customer’s end-product, so wecould face claims for damages that are disproportionately higher than the revenues and profits wereceive from the products involved. Furthermore, product liability risks are particularly significant withrespect to medical and automotive applications because of the risk of serious harm to users of theseend-products. There can be no assurance that any insurance we maintain will sufficiently protect usfrom such claims.
We rely on third parties to manufacture, assemble and test our products and the failure to successfully manageour relationships with our manufacturers and subcontractors would negatively impact our ability to sell ourproducts
We do not have our own wafer fab manufacturing facilities. Therefore, we rely on third-partyvendors to manufacture the products we design. We also currently rely on Asian third-party assemblysubcontractors to assemble and package the silicon chips provided by the wafers for use in finalproducts. Additionally, we rely on these offshore subcontractors for a substantial portion of the testingrequirements of our products prior to shipping. We expect utilization of third-party subcontractors tocontinue in the future.
The cyclical nature of the semiconductor industry drives wide fluctuations in available capacity atthird-party vendors. On occasion, we have been unable to adequately respond to unexpected increasesin customer demand due to capacity constraints and, therefore, were unable to benefit from thisincremental demand. We may be unable to obtain adequate foundry, assembly or test capacity from ourthird-party subcontractors to meet our customers’ delivery requirements even if we adequately forecastcustomer demand.
18

There are significant risks associated with relying on these third-party foundries andsubcontractors, including:
• Failure by us, our customers or their end customers to qualify a selected supplier;
• Potential insolvency of the third-party subcontractors;
• Reduced control over delivery schedules and quality;
• Limited warranties on wafers or products supplied to us;
• Potential increases in prices or payments in advance for capacity;
• Increased need for international-based supply, logistics and financial management;
• Their inability to supply or support new or changing packaging technologies; and
• Low test yields.
We typically do not have long-term supply contracts with our third-party vendors which obligatethe vendor to perform services and supply products to us for a specific period, in specific quantities,and at specific prices. Our third-party foundry, assembly and test subcontractors typically do notguarantee that adequate capacity will be available to us within the time required to meet demand forour products. In the event that these vendors fail to meet our demand for whatever reason, we expectthat it would take up to 12 months to transition performance of these services to new providers. Such atransition may also require qualification of the new providers by our customers or their end customers.
Most of the silicon wafers for the products that we have sold were manufactured either by TSMCor SMIC. Our customers typically complete their own qualification process. If we fail to properlybalance customer demand across the existing semiconductor fabrication facilities that we utilize or arerequired by our foundry partners to increase, or otherwise change the number of fab lines that weutilize for our production, we might not be able to fulfill demand for our products and may need todivert our engineering resources away from new product development initiatives to support the fab linetransition, which would adversely affect our operating results.
Our customers require our products to undergo a lengthy and expensive qualification process without anyassurance of product sales
Prior to purchasing our products, our customers require that our products undergo an extensivequalification process, which involves testing of the products in the customer’s system as well as rigorousreliability testing. This qualification process may continue for six months or longer. However,qualification of a product by a customer does not ensure any sales of the product to that customer.Even after successful qualification and sales of a product to a customer, a subsequent revision to theproduct or software, changes in the IC’s manufacturing process or the selection of a new supplier by usmay require a new qualification process, which may result in delays and in us holding excess orobsolete inventory. After our products are qualified, it can take an additional six months or morebefore the customer commences volume production of components or devices that incorporate ourproducts. Despite these uncertainties, we devote substantial resources, including design, engineering,sales, marketing and management efforts, toward qualifying our products with customers in anticipationof sales. If we are unsuccessful or delayed in qualifying any of our products with a customer, suchfailure or delay would preclude or delay sales of such product to the customer, which may impede ourgrowth and cause our business to suffer.
19

We are a global company, which subjects us to additional business risks including logistical and financialcomplexity, political instability and currency fluctuations
We have established international subsidiaries and have opened offices in international markets tosupport our activities in Asia, the Americas and Europe. This has included the establishment of aheadquarters in Singapore for non-U.S. operations. The percentage of our revenues derived fromoutside of the United States was 83% during fiscal 2018. We may not be able to maintain or increaseglobal market demand for our products. Our international operations are subject to a number of risks,including:
• Complexity and costs of managing international operations and related tax obligations, includingour headquarters for non-U.S. operations in Singapore;
• Protectionist laws and business practices, including trade restrictions, tariffs, quotas and othertrade barriers, particularly with respect to China-U.S. trade policies;
• Difficulties related to the protection of our intellectual property rights in some countries;
• Multiple, conflicting and changing tax and other laws and regulations that may impact both ourinternational and domestic tax and other liabilities and result in increased complexity and costs,including the impact of the Tax Cuts and Jobs Act;
• Longer sales cycles;
• Greater difficulty in accounts receivable collection and longer collection periods;
• High levels of distributor inventory subject to price protection and rights of return to us;
• Political and economic instability;
• Greater difficulty in hiring and retaining qualified personnel; and
• The need to have business and operations systems that can meet the needs of our internationalbusiness and operating structure.
To date, substantially all of our sales to international customers and purchases of components frominternational suppliers have been denominated in U.S. dollars. As a result, an increase in the value ofthe U.S. dollar relative to foreign currencies could make our products more expensive for ourinternational customers to purchase, thus rendering our products less competitive. Similarly, a decreasein the value of the U.S. dollar could reduce our buying power with respect to international suppliers.
Our inability to manage growth could materially and adversely affect our business
Our past growth has placed, and any future growth of our operations will continue to place, asignificant strain on our management personnel, systems and resources. We anticipate that we will needto implement a variety of new and upgraded sales, operational and financial enterprise-wide systems,information technology infrastructure, procedures and controls, including the improvement of ouraccounting and other internal management systems to manage this growth and maintain compliancewith regulatory guidelines, including Sarbanes-Oxley Act requirements. To the extent our businessgrows, our internal management systems and processes will need to improve to ensure that we remainin compliance. We also expect that we will need to continue to expand, train, manage and motivate ourworkforce. All of these endeavors will require substantial management effort, and we anticipate that wewill require additional management personnel and internal processes to manage these efforts and toplan for the succession from time to time of certain persons who have been key management andtechnical personnel. If we are unable to effectively manage our expanding global operations, includingour international headquarters in Singapore, our business could be materially and adversely affected.
20

Our products incorporate technology licensed from third parties
We incorporate technology (including software) licensed from third parties in our products. Wecould be subjected to claims of infringement regardless of our lack of involvement in the developmentof the licensed technology. Although a third-party licensor is typically obligated to indemnify us if thelicensed technology infringes on another party’s intellectual property rights, such indemnification istypically limited in amount and may be worthless if the licensor becomes insolvent. See Significantlitigation over intellectual property in our industry may cause us to become involved in costly and lengthylitigation which could seriously harm our business. Furthermore, any failure of third-party technology toperform properly would adversely affect sales of our products incorporating such technology.
We are subject to risks relating to product concentration
We derive a substantial portion of our revenues from a limited number of products, and we expectthese products to continue to account for a large percentage of our revenues in the near term.Continued market acceptance of these products, is therefore, critical to our future success. In addition,substantially all of our products that we have sold include technology related to one or more of ourissued U.S. patents. If these patents are found to be invalid or unenforceable, our competitors couldintroduce competitive products that could reduce both the volume and price per unit of our products.Our business, operating results, financial condition and cash flows could therefore be adversely affectedby:
• A decline in demand for any of our more significant products;
• Failure of our products to achieve continued market acceptance;
• Competitive products;
• New technological standards or changes to existing standards that we are unable to address withour products;
• A failure to release new products or enhanced versions of our existing products on a timelybasis; and
• The failure of our new products to achieve market acceptance.
We are subject to credit risks related to our accounts receivable
We do not generally obtain letters of credit or other security for payment from customers,distributors or contract manufacturers. Accordingly, we are not protected against accounts receivabledefault or bankruptcy by these entities. Our ten largest customers or distributors represent a substantialmajority of our accounts receivable. If any such customer or distributor, or a material portion of oursmaller customers or distributors, were to become insolvent or otherwise not satisfy their obligations tous, we could be materially harmed.
We depend on our key personnel to manage our business effectively in a rapidly changing market, and if weare unable to retain our current personnel and hire additional personnel, our ability to develop andsuccessfully market our products could be harmed
We believe our future success will depend in large part upon our ability to attract and retain highlyskilled managerial, engineering, sales and marketing personnel. We believe that our future success willbe dependent on retaining the services of our key personnel, developing their successors and certaininternal processes to reduce our reliance on specific individuals, and on properly managing thetransition of key roles when they occur. There is currently a shortage of qualified personnel withsignificant experience in the design, development, manufacturing, marketing and sales of analog andmixed-signal products. In particular, there is a shortage of engineers who are familiar with the
21

intricacies of the design and manufacturability of analog elements, and competition for such personnelis intense. Our key technical personnel represent a significant asset and serve as the primary source forour technological and product innovations. We may not be successful in attracting and retainingsufficient numbers of technical personnel to support our anticipated growth. The loss of any of our keyemployees or the inability to attract or retain qualified personnel both in the United States andinternationally, including engineers, sales, applications and marketing personnel, could delay thedevelopment and introduction of, and negatively impact our ability to sell, our products.
Any dispositions could harm our financial condition
Any disposition of a product line would entail a number of risks that could materially andadversely affect our business and operating results, including:
• Diversion of management’s time and attention from our core business;
• Difficulties separating the divested business;
• Risks to relations with customers who previously purchased products from our disposed productline;
• Reduced leverage with suppliers due to reduced aggregate volume;
• Risks related to employee relations;
• Risks associated with the transfer and licensing of intellectual property;
• Security risks and other liabilities related to the transition services provided in connection withthe disposition;
• Tax issues associated with dispositions; and
• Disposition-related disputes, including disputes over earn-outs and escrows.
Our stock price may be volatile
The market price of our common stock has been volatile in the past and may be volatile in thefuture. The market price of our common stock may be significantly affected by the following factors:
• Actual or anticipated fluctuations in our operating results;
• Changes in financial estimates by securities analysts or our failure to perform in line with suchestimates;
• Changes in market valuations of other technology companies, particularly semiconductorcompanies;
• Announcements by us or our competitors of significant technical innovations, acquisitions,strategic partnerships, joint ventures or capital commitments;
• Introduction of technologies or product enhancements that reduce the need for our products;
• The loss of, or decrease in sales to, one or more key customers;
• A large sale of stock by a significant shareholder;
• Dilution from the issuance of our stock in connection with acquisitions;
• The addition or removal of our stock to or from a stock index fund;
• Departures of key personnel;
• The required expensing of stock awards; and
22

• The required changes in our reported revenue and revenue recognition accounting policy underASC Topic 606, Revenue from Contracts with Customers.
The stock market has experienced extreme volatility that often has been unrelated to theperformance of particular companies. These market fluctuations may cause our stock price to fallregardless of our performance.
Most of our current manufacturers, assemblers, test service providers, distributors and customers areconcentrated in the same geographic region, which increases the risk that a natural disaster, epidemic, laborstrike, war or political unrest could disrupt our operations or sales
Most of our foundries and several of our assembly and test subcontractors’ sites are located inTaiwan and most of our other foundry, assembly and test subcontractors are located in the Pacific Rimregion. In addition, many of our customers are located in the Pacific Rim region. The risk ofearthquakes in Taiwan and the Pacific Rim region is significant due to the proximity of majorearthquake fault lines in the area. Earthquakes, tsunamis, fire, flooding, lack of water or other naturaldisasters, an epidemic, political unrest, war, labor strikes or work stoppages in countries where oursemiconductor manufacturers, assemblers and test subcontractors are located, likely would result in thedisruption of our foundry, assembly or test capacity. There can be no assurance that alternate capacitycould be obtained on favorable terms, if at all.
A natural disaster, epidemic, labor strike, war or political unrest where our customers’ facilities arelocated would likely reduce our sales to such customers. North Korea’s recent geopoliticalmaneuverings, including nuclear weapons and long-range missile testing, have created unrest. Suchunrest could create economic uncertainty or instability, could escalate to war or otherwise adverselyaffect South Korea and our South Korean customers and reduce our sales to such customers, whichwould materially and adversely affect our operating results. In addition, a significant portion of theassembly and testing of our products occurs in South Korea. Any disruption resulting from these eventscould also cause significant delays in shipments of our products until we are able to shift ourmanufacturing, assembling or testing from the affected subcontractor to another third-party vendor.
The semiconductor manufacturing process is highly complex and, from time to time, manufacturing yieldsmay fall below our expectations, which could result in our inability to satisfy demand for our products in atimely manner and may decrease our gross margins due to higher unit costs
The manufacturing of our products is a highly complex and technologically demanding process.Although we work closely with our foundries and assemblers to minimize the likelihood of reducedmanufacturing yields, we have from time to time experienced lower than anticipated manufacturingyields. Changes in manufacturing processes or the inadvertent use of defective or contaminatedmaterials could result in lower than anticipated manufacturing yields or unacceptable performancedeficiencies, which could lower our gross margins. If our foundries fail to deliver fabricated siliconwafers of satisfactory quality in a timely manner, we will be unable to meet our customers’ demand forour products in a timely manner, which would adversely affect our operating results and damage ourcustomer relationships.
We depend on our customers to support our products, and some of our customers offer competing products
We rely on our customers to provide hardware, software, intellectual property indemnification andother technical support for the products supplied by our customers. If our customers do not providethe required functionality or if our customers do not provide satisfactory support for their products, thedemand for these devices that incorporate our products may diminish or we may otherwise bematerially adversely affected. Any reduction in the demand for these devices would significantly reduceour revenues.
23

In certain products, some of our customers offer their own competitive products. These customersmay find it advantageous to support their own offerings in the marketplace in lieu of promoting ourproducts.
Our convertible senior notes could adversely affect our operating results and financial condition
Upon conversion, our convertible senior notes may be settled in cash, shares of our common stockor a combination of cash and shares, at our election. We intend to settle the principal amount of thenotes in cash. If we do not have adequate cash available, we may not be able to settle the principalamount in cash. In such case, we will be required to settle the principal amount in stock, which wouldresult in immediate, and likely material, dilution to the ownership interests of our existing stockholders.Any sales in the public market of our common stock issuable upon such conversion could adverselyaffect prevailing market prices of our common stock.
Following any conclusion that we no longer have the ability to settle the convertible senior notes incash, we will be required on a going forward basis to change our accounting policy for earnings pershare from the treasury stock method to the if-converted method. Earnings per share may be lowerunder the if-converted method as compared to the treasury stock method.
The principal balance of the convertible senior notes was separated into liability and equitycomponents, which were recorded initially at fair value. The excess of the principal amount of theliability component over its carrying amount represents the debt discount, which is accreted to interestexpense over the term of the notes using the effective interest method. Accordingly, we will reporthigher interest expense because of the recognition of both the debt discount amortization and thenotes’ coupon interest.
Our debt could adversely affect our operations and financial condition
We believe we have the ability to service our debt, but our ability to make the required paymentsthereunder when due depends upon our future performance, which will be subject to general economicconditions, industry cycles and other factors affecting our operations, including risk factors describedherein, many of which are beyond our control. Our credit facility also contains covenants, includingfinancial covenants. If we breach any of the covenants under our credit facility and do not obtainappropriate waivers, then, subject to any applicable cure periods, our outstanding indebtednessthereunder could be declared immediately due and payable.
We could seek to raise additional debt or equity capital in the future, but additional capital may not beavailable on terms acceptable to us, or at all
We believe that our existing cash, cash equivalents, investments and credit under our credit facilitywill be sufficient to meet our working capital needs, capital expenditures, investment requirements andcommitments for at least the next 12 months. However, our ability to borrow further under the creditfacility is dependent upon our ability to satisfy various conditions, covenants and representations. It ispossible that we may need to raise additional funds to finance our activities or to facilitate acquisitionsof other businesses, products, intellectual property or technologies. We believe we could raise thesefunds, if needed, by selling equity or debt securities to the public or to selected investors. In addition,even though we may not need additional funds, we may still elect to sell additional equity or debtsecurities or obtain credit facilities for other reasons. However, we may not be able to obtain additionalfunds on favorable terms, or at all. If we decide to raise additional funds by issuing equity orconvertible debt securities, the ownership percentages of existing shareholders would be reduced.
24

We have limited resources compared to some of our current and potential competitors and we may not be ableto compete effectively and increase market share
Some of our current and potential competitors have longer operating histories, significantly greaterresources and name recognition and a larger base of customers than we have. As a result, thesecompetitors may have greater credibility with our existing and potential customers. They also may beable to adopt more aggressive pricing policies and devote greater resources to the development,promotion and sale of their products than we can to ours. In addition, some of our current andpotential competitors have already established supplier or joint development relationships with thedecision makers at our current or potential customers. These competitors may be able to leverage theirexisting relationships to discourage their customers from purchasing products from us or persuade themto replace our products with their products. Our competitors may also offer bundled solutions offeringa more complete product despite the technical merits or advantages of our products. These competitorsmay elect not to support our products which could complicate our sales efforts. These and othercompetitive pressures may prevent us from competing successfully against current or futurecompetitors, and may materially harm our business. Competition could decrease our prices, reduce oursales, lower our gross margins and/or decrease our market share.
Provisions in our charter documents and Delaware law could prevent, delay or impede a change in control ofus and may reduce the market price of our common stock
Provisions of our certificate of incorporation and bylaws could have the effect of discouraging,delaying or preventing a merger or acquisition that a stockholder may consider favorable. For example,our certificate of incorporation and bylaws provide for:
• The division of our Board of Directors into three classes to be elected on a staggered basis, oneclass each year;
• The ability of our Board of Directors to issue shares of our preferred stock in one or moreseries without further authorization of our stockholders;
• A prohibition on stockholder action by written consent;
• Elimination of the right of stockholders to call a special meeting of stockholders;
• A requirement that stockholders provide advance notice of any stockholder nominations ofdirectors or any proposal of new business to be considered at any meeting of stockholders; and
• A requirement that a supermajority vote be obtained to amend or repeal certain provisions ofour certificate of incorporation.
We also are subject to the anti-takeover laws of Delaware which may discourage, delay or preventsomeone from acquiring or merging with us, which may adversely affect the market price of ourcommon stock.
Risks related to our industry
We are subject to the cyclical nature of the semiconductor industry, which has been subject to significantfluctuations
The semiconductor industry is highly cyclical and is characterized by constant and rapidtechnological change, rapid product obsolescence and price erosion, evolving standards, short productlife cycles and wide fluctuations in product supply and demand. The industry has experiencedsignificant fluctuations, often connected with, or in anticipation of, maturing product cycles and newproduct introductions of both semiconductor companies’ and their customers’ products and fluctuationsin general economic conditions. Deteriorating general worldwide economic conditions, including
25

reduced economic activity, concerns about credit and inflation, increased energy costs, decreasedconsumer confidence, reduced corporate profits, decreased spending and similar adverse businessconditions, would make it very difficult for our customers, our vendors, and us to accurately forecastand plan future business activities and could cause U.S. and foreign businesses to slow spending on ourproducts. We cannot predict the timing, strength, or duration of any economic slowdown or economicrecovery. If the economy or markets in which we operate deteriorate, our business, financial condition,and results of operations would likely be materially and adversely affected.
Downturns have been characterized by diminished product demand, production overcapacity, highinventory levels and accelerated erosion of average selling prices. We believe the semiconductorindustry is currently suffering a downturn due in large part to adverse macroeconomic conditions,characterized by a slowdown in overall GDP performance and factory activity in certain regions,particularly in China , higher levels of customer inventory, the impact of tariffs on trade relations, andgreater overall uncertainty regarding the economy. This downturn has had, and may continue to have, amaterial adverse effect on our business and operating results.
Upturns have been characterized by increased product demand and production capacity constraintscreated by increased competition for access to third-party foundry, assembly and test capacity. We aredependent on the availability of such capacity to manufacture, assemble and test our products. None ofour third-party foundry, assembly or test subcontractors have provided assurances that adequatecapacity will be available to us.
The average selling prices of our products could decrease rapidly which may negatively impact our revenuesand gross margins
We may experience substantial period-to-period fluctuations in future operating results due to theerosion of our average selling prices. We have reduced the average unit price of our products inanticipation of or in response to competitive pricing pressures, new product introductions by us or ourcompetitors and other factors. If we are unable to offset any such reductions in our average sellingprices by increasing our sales volumes, increasing our sales content per application or reducingproduction costs, our gross margins and revenues will suffer. To maintain our gross margin percentage,we will need to develop and introduce new products and product enhancements on a timely basis andcontinually reduce our costs. Our failure to do so could cause our revenues and gross marginpercentage to decline.
Competition within the numerous markets we target may reduce sales of our products and reduce our marketshare
The markets for semiconductors in general, and for mixed-signal products in particular, areintensely competitive. We expect that the market for our products will continually evolve and will besubject to rapid technological change. In addition, as we target and supply products to numerousmarkets and applications, we face competition from a relatively large number of competitors. Wecompete with Analog Devices, Broadcom, Cypress, IDT, Infineon, Maxim Integrated Products,MaxLinear, Microchip, Nordic Semiconductor, NXP Semiconductors, Qualcomm, Renesas,STMicroelectronics, Synaptics, Texas Instruments and others. We expect to face competition in thefuture from our current competitors, other manufacturers and designers of semiconductors, andstart-up semiconductor design companies. As the markets for communications products grow, we alsomay face competition from traditional communications device companies. These companies may enterthe mixed-signal semiconductor market by introducing their own products or by entering into strategicrelationships with or acquiring other existing providers of semiconductor products. In addition, largecompanies may restructure their operations to create separate companies or may acquire newbusinesses that are focused on providing the types of products we produce or acquire our customers.
26

We may be the victim of business disruptions and security breaches, including cyber-attacks, which could leadto liability or could damage our reputation and financial results
Information technology system and/or network disruptions, regardless of the cause, but includingacts of sabotage, error, or other actions, could harm the company’s operations. Failure to effectivelyprevent, detect, and recover from security breaches, including cyber-attacks, could result in the misuseof company assets, disruption to the company, diversion of management resources, regulatory inquiries,legal claims or proceedings, reputational damage, loss of sales and other costs to the company. Weroutinely face attacks that attempt to breach our security protocols, gain access to or disrupt ourcomputerized systems or steal proprietary company, customer, partner or employee information. Theseattacks are sometimes successful. These attacks may be due to security breaches, employee error, theft,malfeasance, phishing schemes, ransomware, faulty password or data security management, or otherirregularities. The theft, loss, destruction, unavailability or misuse of personal or business datacollected, used, stored or transferred by us to run our business could result in increased security costsor costs related to defending legal claims. Industrial espionage, theft or loss of our intellectual propertydata could lead to counterfeit products or harm the competitive position of our products and services.Costs to implement, test and maintain measures to promote compliance with applicable privacy anddata security laws as well as to protect the overall security of our system could be significant.Attempted or successful attacks against our products and services could damage our reputation withcustomers or users and reduce demand for our products and services.
Changes in the Privacy and Data Security/Protection Laws Could Have an Adverse Effect on our Operations
Federal, state and international privacy-related or data protection laws and regulations could havean adverse effect on our operations. Complying with these laws and the possibility of proceedingsagainst us by governmental entities or others in relation to these laws could increase operational costs.In May 2018, the European Union’s General Data Protection Regulation (‘‘GDPR’’) went into effect,replacing the EU’s 1995 Data Protection Directive. The costs of compliance with the GDPR and thepotential for fines and penalties in the event of a breach of the GDPR may have an adverse effect onour operations.
We may be subject to information technology failures that could damage our reputation, business operationsand financial condition
We rely on information technology for the effective operation of our business. Our systems aresubject to damage or interruption from a number of potential sources, including natural disasters,accidents, power disruptions, telecommunications failures, acts of terrorism or war, computer viruses,theft, physical or electronic break-ins, cyber-attacks, sabotage, vandalism, or similar events ordisruptions. Our security measures may not detect or prevent such security breaches. Any suchcompromise of our information security could result in the theft or unauthorized publication or use ofour confidential business or proprietary information, result in the unauthorized release of customer,supplier or employee data, result in a violation of privacy or other laws, expose us to a risk of litigationor damage our reputation. In addition, our inability to use or access information systems at criticalpoints in time could unfavorably impact the timely and efficient operation of our business, which couldnegatively affect our business and operating results.
Third parties with which we conduct business, such as foundries, assembly and test contractors,distributors and customers, have access to certain portions of our sensitive data. In the event that thesethird parties do not properly safeguard our data that they hold, security breaches could result andnegatively impact our reputation, business operations and financial results.
27
Our products must conform to industry standards and technology in order to be accepted by end users in ourmarkets
Generally, our products comprise only a part of a device. All components of such devices mustuniformly comply with industry standards in order to operate efficiently together. We depend oncompanies that provide other components of the devices to support prevailing industry standards. Manyof these companies are significantly larger and more influential in affecting industry standards than weare. Some industry standards may not be widely adopted or implemented uniformly, and competingstandards may emerge that may be preferred by our customers or end users. If larger companies do notsupport the same industry standards that we do, or if competing standards emerge, market acceptanceof our products could be adversely affected which would harm our business.
Products for certain applications are based on industry standards that are continually evolving. Ourability to compete in the future will depend on our ability to identify and ensure compliance with theseevolving industry standards. The emergence of new industry standards could render our productsincompatible with products developed by other suppliers. As a result, we could be required to investsignificant time and effort and to incur significant expense to redesign our products to ensurecompliance with relevant standards. If our products are not in compliance with prevailing industrystandards for a significant period of time, we could miss opportunities to achieve crucial design wins.
Our pursuit of necessary technological advances may require substantial time and expense. We maynot be successful in developing or using new technologies or in developing new products or productenhancements that achieve market acceptance. If our products fail to achieve market acceptance, ourgrowth prospects, operating results and competitive position could be adversely affected.
Customer demands and new regulations related to conflict-free minerals may adversely affect us
The Dodd-Frank Wall Street Reform and Consumer Protection Act imposes new disclosurerequirements regarding the use of ‘‘conflict’’ minerals mined from the Democratic Republic of Congoand adjoining countries in products, whether or not these products are manufactured by third parties.These new requirements could affect the pricing, sourcing and availability of minerals used in themanufacture of semiconductor devices (including our products). There will be additional costsassociated with complying with the disclosure requirements, such as costs related to determining thesource of any conflict minerals used in our products. Our supply chain is complex and we may beunable to verify the origins for all metals used in our products. We may also encounter challenges withour customers and stockholders if we are unable to certify that our products are conflict free.
Item 1B. Unresolved Staff Comments
None.
Item 2. Properties
Our corporate headquarters, housing engineering, sales and marketing, administration and testoperations, is located in Austin, Texas. Our headquarters facilities consist of two buildings, which weown, that are located on land which we have leased through 2099. The buildings contain approximately441,000 square feet of floor space, of which approximately 129,000 square feet were leased to othertenants. In addition to these properties, we lease smaller facilities in various locations in the UnitedStates, Australia, Canada, China, Denmark, Finland, France, Germany, Hungary, India, Italy, Japan,Norway, Singapore, South Korea, Taiwan and the United Kingdom for engineering, sales andmarketing, administrative and manufacturing support activities. We believe that these facilities aresuitable and adequate to meet our current operating needs.
28

Item 3. Legal Proceedings
Information regarding legal proceedings is provided in Note 11, Commitments and Contingencies, tothe Consolidated Financial Statements. Such information is incorporated by reference herein.
Item 4. Mine Safety Disclosures
Not applicable.
29

Part II
Item 5. Market for Registrant’s Common Equity, Related Stockholder Matters and Issuer Purchasesof Equity Securities
Market Information and Holders
Our registration statement (Registration No. 333-94853) under the Securities Act of 1933, asamended, relating to our initial public offering of our common stock became effective on March 23,2000. Our common stock is quoted on the NASDAQ National Market (NASDAQ) under the symbol‘‘SLAB’’. The table below shows the high and low per-share sales prices of our common stock for theperiods indicated, as reported by NASDAQ. As of January 21, 2019, there were 67 holders of record ofour common stock.
High Low
Fiscal Year 2017First Quarter . . . . . . . . . . . . . . . . . . . . . . . . . . . . . . . . . . . . . $ 75.60 $63.15Second Quarter . . . . . . . . . . . . . . . . . . . . . . . . . . . . . . . . . . . 78.45 66.85Third Quarter . . . . . . . . . . . . . . . . . . . . . . . . . . . . . . . . . . . . 81.95 66.35Fourth Quarter . . . . . . . . . . . . . . . . . . . . . . . . . . . . . . . . . . . . 96.93 80.17
Fiscal Year 2018First Quarter . . . . . . . . . . . . . . . . . . . . . . . . . . . . . . . . . . . . . $101.20 $84.48Second Quarter . . . . . . . . . . . . . . . . . . . . . . . . . . . . . . . . . . . 110.70 85.96Third Quarter . . . . . . . . . . . . . . . . . . . . . . . . . . . . . . . . . . . . 108.15 90.50Fourth Quarter . . . . . . . . . . . . . . . . . . . . . . . . . . . . . . . . . . . . 93.73 73.13
Dividend Policy
We have never declared or paid any cash dividends on our common stock and we currently do notintend to pay cash dividends. We currently expect to retain any future earnings to fund the operationand expansion of our business.
30

25JAN201921264603
Stock Performance Graph
The graph depicted below shows a comparison of cumulative total stockholder returns for aninvestment in Silicon Laboratories Inc. common stock, the NASDAQ Composite Index and the PHLXSemiconductor Index.
0
50
100
150
200
300
250
01/02/16 12/29/1812/30/1712/31/1612/28/13 01/03/15
DOLLARS
Silicon Laboratories Inc. NASDAQ CompositePHLX Semiconductor Sector Total Return Index
Company / Index 12/28/13 01/03/15 01/02/16 12/31/16 12/30/17 12/29/18
Silicon Laboratories Inc. . . . . . . . . . . . . . $100.00 $112.18 $114.62 $153.48 $208.50 $185.36NASDAQ Composite . . . . . . . . . . . . . . . . $100.00 $115.10 $123.34 $134.27 $174.07 $167.82PHLX Semiconductor Sector Total Return
Index . . . . . . . . . . . . . . . . . . . . . . . . . . $100.00 $131.84 $129.76 $180.79 $254.08 $237.11
(1) The graph assumes that $100 was invested in our common stock and in each index at the marketclose on December 28, 2013, and that all dividends were reinvested. No cash dividends have beendeclared on our common stock.
(2) Stockholder returns over the indicated period should not be considered indicative of futurestockholder returns.
31

Issuer Purchases of Equity Securities
The following table summarizes repurchases of our common stock during the three months endedDecember 29, 2018 (in thousands, except per share amounts):
ApproximateTotal Number of Dollar Value of
Shares Purchased Shares that MayTotal Number Average Price as Part of Publicly Yet Be Purchased
of Shares Paid per Announced Plans Under the PlansPeriod Purchased Share or Programs or Programs
September 30, 2018 - October 27, 2018 . . — $ — — $175,733
October 28, 2018 - November 24, 2018 . . 177 $84.78 177 $160,733
November 25, 2018 - December 29, 2018 . — $ — — $160,733Total . . . . . . . . . . . . . . . . . . . . . . . . . . . 177 $84.78 177
In October 2018, the Board of Directors increased the share repurchase amount for the October2017 program from $100 million to $200 million and extended the termination date from December2018 to December 2019. The program allows for repurchases to be made in the open market or inprivate transactions, including structured or accelerated transactions, subject to applicable legalrequirements and market conditions.
Item 6. Selected Financial Data
Please read this selected consolidated financial data in conjunction with ‘‘Management’s Discussionand Analysis of Financial Condition and Results of Operations,’’ our Consolidated Financial Statementsand the notes to those statements included in this Form 10-K.
Fiscal Year
2018 (1) 2017 2016 2015 2014
(in thousands, except per share data)
Consolidated Statements of IncomeData
Revenues . . . . . . . . . . . . . . . . . . . . . $ 868,267 $ 768,867 $ 697,626 $ 644,826 $ 620,704Operating income . . . . . . . . . . . . . . . $ 85,208 $ 84,974 $ 66,277 $ 32,234 $ 51,421Net income . . . . . . . . . . . . . . . . . . . . $ 83,591 $ 47,092 $ 61,494 $ 29,586 $ 38,021
Earnings per share:
Basic . . . . . . . . . . . . . . . . . . . . . . . $ 1.94 $ 1.11 $ 1.47 $ 0.70 $ 0.88Diluted . . . . . . . . . . . . . . . . . . . . . $ 1.90 $ 1.09 $ 1.45 $ 0.69 $ 0.87
Consolidated Balance Sheet Data
Cash, cash equivalents andinvestments . . . . . . . . . . . . . . . . . . $ 619,581 $ 769,704 $ 300,263 $ 250,112 $ 342,614
Working capital . . . . . . . . . . . . . . . . . 681,793 785,317 351,156 280,819 365,223Total assets . . . . . . . . . . . . . . . . . . . . 1,624,354 1,535,082 1,081,844 1,011,463 1,042,561Long-term obligations . . . . . . . . . . . . 412,219 419,741 115,191 108,028 121,191Total stockholders’ equity . . . . . . . . . . 1,067,290 953,016 826,958 761,114 758,056
(1) In fiscal 2018, we adopted Accounting Standards Codification (ASC) Topic 606, Revenue fromContracts with Customers. We elected the modified retrospective method of adoption. Prior periodshave not been adjusted. See Note 2, Significant Accounting Policies, to the Consolidated FinancialStatements for additional information.
32

Item 7. Management’s Discussion and Analysis of Financial Condition and Results of Operations
The following discussion and analysis of financial condition and results of operations should beread in conjunction with the Consolidated Financial Statements and related notes thereto includedelsewhere in this report. This discussion contains forward-looking statements. Please see the‘‘Cautionary Statement’’ and ‘‘Risk Factors’’ above for discussions of the uncertainties, risks andassumptions associated with these statements. Our fiscal year-end financial reporting periods are a52- or 53-week fiscal year that ends on the Saturday closest to December 31. Fiscal 2018, 2017 and2016 were 52-week years and ended on December 29, 2018, December 30, 2017 and December 31,2016, respectively.
Overview
We are a leading provider of silicon, software and solutions for a smarter, more connected world.Our award-winning technologies are shaping the future of the Internet of Things (IoT), Internetinfrastructure, industrial automation, consumer and automotive markets. Our world-class engineeringteam creates products focused on performance, energy savings, connectivity and simplicity. Our primarysemiconductor products are mixed-signal integrated circuits (ICs), which are electronic components thatconvert real-world analog signals, such as sound and radio waves, into digital signals that electronicproducts can process.
As a fabless semiconductor company, we rely on third-party semiconductor fabricators in Asia, andto a lesser extent the United States and Europe, to manufacture the silicon wafers that reflect our ICdesigns. Each wafer contains numerous die, which are cut from the wafer to create a chip for an IC.We rely on third parties in Asia to assemble, package, and, in most cases, test these devices and shipthese units to our customers. Testing performed by such third parties facilitates faster delivery ofproducts to our customers (particularly those located in Asia), shorter production cycle times, lowerinventory requirements, lower costs and increased flexibility of test capacity.
Our expertise in analog-intensive, high-performance, mixed-signal ICs and software enables us todevelop highly differentiated solutions that address multiple markets. We group our products into thefollowing categories:
• Internet of Things products, which include our microcontroller (MCU), wireless and sensorproducts;
• Broadcast products, which include our broadcast consumer and automotive products;
• Infrastructure products, which include our timing products (clocks and oscillators), and isolationdevices; and
• Access products, which include our Voice over IP (VoIP) products, embedded modems andPower over Ethernet (PoE) devices.
The sales cycle for our ICs can be as long as 12 months or more. An additional three to sixmonths or more are usually required before a customer ships a significant volume of devices thatincorporate our ICs. Due to this lengthy sales cycle, we typically experience a significant delay betweenincurring research and development and selling, general and administrative expenses, and thecorresponding sales. Consequently, if sales in any quarter do not occur when expected, expenses andinventory levels could be disproportionately high, and our operating results for that quarter and,potentially, future quarters would be adversely affected. Moreover, the amount of time between initialresearch and development and commercialization of a product, if ever, can be substantially longer thanthe sales cycle for the product. Accordingly, if we incur substantial research and development costswithout developing a commercially successful product, our operating results, as well as our growthprospects, could be adversely affected.
33

Because many of our ICs are designed for use in consumer products such as televisions, set-topboxes, radios and wearables, we expect that the demand for our products will be typically subject tosome degree of seasonal demand. However, rapid changes in our markets and across our product areasmake it difficult for us to accurately estimate the impact of seasonal factors on our business.
Current Period Highlights
Revenues increased $99.4 million in fiscal 2018 compared to fiscal 2017, primarily due to increasedrevenues from our IoT and Infrastructure products offset by decreased revenues from our Access andBroadcast products. Gross margin increased $67.2 million during the same period due primarily toincreased product sales. Gross margin as a percent of revenues increased to 60.1% in fiscal 2018compared to 59.1% in fiscal 2017 primarily due to variations in product mix. Operating expensesincreased $67.0 million in fiscal 2018 compared to fiscal 2017 due primarily to increased personnel-related expenses, amortization of intangible assets and acquisition-related costs. Operating income infiscal 2018 was $85.2 million compared to $85.0 million in fiscal 2017.
We ended fiscal 2018 with $613.8 million in cash, cash equivalents and short-term investments.Net cash provided by operating activities was $173.5 million during fiscal 2018. Accounts receivable was$73.2 million at December 29, 2018, representing 31 days sales outstanding (DSO). Inventory was$75.0 million at December 29, 2018, representing 79 days of inventory (DOI). In fiscal 2018, werepurchased 0.4 million shares of our common stock for $39.3 million.
Through acquisitions and internal development efforts, we have continued to diversify our productportfolio and introduce new products and solutions with added functionality and further integration. OnApril 18, 2018, we acquired the Z-Wave business of Sigma Designs, Inc. Z-Wave is an IoT technologyfor smart home solutions. See Note 8, Acquisitions, to the Consolidated Financial Statements foradditional information.
In fiscal 2018, we introduced the next-generation Z-Wave� 700 on the Wireless Gecko platform, acomprehensive hardware and software connectivity solution for the smart home; a jointly developedLTE-M expansion kit featuring the Digi International Digi XBee3� pre-certified cellular modem and aSilicon Labs Gecko microcontroller; Wireless Xpress modules that deliver Bluetooth and Wi-Ficonnectivity with no software development necessary; new any-frequency clocks combining the clock ICand a quartz crystal reference inside the same package; timing solutions to meet the high-performancerequirements of 56G/112G SerDes clocking applications; new multiprotocol software for our WirelessGecko portfolio, enabling Bluetooth Low Energy (LE) connectivity with sub-GHz IoT devices; a provenreference design for ITU-T G.8262-compliant Synchronous Ethernet (SyncE) applications; amultiprotocol mesh networking solution for the IoT jointly created with Wirepas; low-power PCIExpress� (PCIe�) Gen 4 clock buffers for 1.5 V and 1.8 V applications; two new Power over Ethernet(PoE) Powered Device (PD) families for a wide range of IoT applications; new Tiny Gecko MCUs thatextend battery life for IoT connected devices; and a new Wi-Fi portfolio to simplify the design ofpower-sensitive, battery-operated Wi-Fi products. We plan to continue to introduce products thatincrease the content we provide for existing applications, thereby enabling us to serve markets we donot currently address and expand our total available market opportunity.
During fiscal 2018, 2017 and 2016, we had no customer that represented more than 10% of ourrevenues. In addition to direct sales to customers, some of our end customers purchase productsindirectly from us through distributors and contract manufacturers. An end customer purchasingthrough a contract manufacturer typically instructs such contract manufacturer to obtain our productsand incorporate such products with other components for sale by such contract manufacturer to theend customer. Although we actually sell the products to, and are paid by, the distributors and contractmanufacturers, we refer to such end customer as our customer. Two of our distributors who sell to ourcustomers, Arrow Electronics and Edom Technology, each represented 21% and 17% of our revenues
34
during fiscal 2018. Edom, Avnet and Arrow, each represented 19%, 14% and 12% of our revenuesduring fiscal 2017, and 17%, 13% and 11% of our revenues during fiscal 2016, respectively. There wereno contract manufacturers that accounted for more than 10% of our revenues in fiscal 2018, 2017 or2016. During fiscal 2018, we consolidated our distribution relationships to a single global distributor,Arrow Electronics. We are maintaining our extensive network of regional distributor partners andetailers to complement our single global distributor partner.
The percentage of our revenues derived from outside of the United States was 83% in fiscal 2018,85% in fiscal 2017 and 86% in fiscal 2016. All of our revenues to date have been denominated in U.S.dollars. We believe that a majority of our revenues will continue to be derived from customers outsideof the United States.
Results of Operations
The following describes the line items set forth in our Consolidated Statements of Income:
Revenues. Revenues are generated predominately by sales of our products. Our revenues aresubject to variation from period to period due to the volume of shipments made within a period, themix of products we sell and the prices we charge for our products.
Cost of Revenues. Cost of revenues includes the cost of purchasing finished silicon wafersprocessed by independent foundries; costs associated with assembly, test and shipping of thoseproducts; costs of personnel and equipment associated with manufacturing support, logistics and qualityassurance; costs of software royalties, other intellectual property license costs and certain acquiredintangible assets; and an allocated portion of our occupancy costs. Our gross margin as a percentage ofrevenue fluctuates depending on product mix, manufacturing yields, inventory valuation adjustments,average selling prices and other factors.
Research and Development. Research and development expense consists primarily of personnel-related expenses, including stock-based compensation, as well as new product masks, external consultingand services costs, equipment tooling, equipment depreciation, amortization of intangible assets, and anallocated portion of our occupancy costs. Research and development activities include the design ofnew products, refinement of existing products and design of test methodologies to ensure compliancewith required specifications.
Selling, General and Administrative. Selling, general and administrative expense consistsprimarily of personnel-related expenses, including stock-based compensation, as well as an allocatedportion of our occupancy costs, sales commissions to independent sales representatives, applicationsengineering support, professional fees, legal fees and promotional and marketing expenses.
Interest Income and Other, Net. Interest income and other, net reflects interest earned on ourcash, cash equivalents and investment balances, foreign currency remeasurement adjustments and othernon-operating income and expenses.
Interest Expense. Interest expense consists of interest on our short and long-term obligations,including our convertible senior notes and credit facility. Interest expense on our convertible seniornotes includes contractual interest, amortization of the debt discount and amortization of debt issuancecosts.
Provision (Benefit) for Income Taxes. Provision (benefit) for income taxes includes both domesticand foreign income taxes at the applicable tax rates adjusted for non-deductible expenses, research anddevelopment tax credits and other permanent differences.
35

The following table sets forth our Consolidated Statements of Income data as a percentage ofrevenues for the periods indicated:
Fiscal Year
2018 2017 2016
Revenues . . . . . . . . . . . . . . . . . . . . . . . . . . . . . . . . . . 100.0% 100.0% 100.0%Cost of revenues . . . . . . . . . . . . . . . . . . . . . . . . . . . . . 39.9 40.9 39.6
Gross margin . . . . . . . . . . . . . . . . . . . . . . . . . . . . . . . 60.1 59.1 60.4Operating expenses:
Research and development . . . . . . . . . . . . . . . . . . . . 27.5 27.2 28.6Selling, general and administrative . . . . . . . . . . . . . . 22.8 20.8 22.3
Operating expenses . . . . . . . . . . . . . . . . . . . . . . . . . . . 50.3 48.0 50.9
Operating income . . . . . . . . . . . . . . . . . . . . . . . . . . . . 9.8 11.1 9.5Other income (expense):
Interest income and other, net . . . . . . . . . . . . . . . . . 0.8 0.8 0.1Interest expense . . . . . . . . . . . . . . . . . . . . . . . . . . . . (2.3) (1.9) (0.4)
Income before income taxes . . . . . . . . . . . . . . . . . . . . . 8.3 10.0 9.2Provision (benefit) for income taxes . . . . . . . . . . . . . . . (1.3) 3.9 0.4
Net income . . . . . . . . . . . . . . . . . . . . . . . . . . . . . . . . . 9.6% 6.1% 8.8%
Comparison of Fiscal 2018 to Fiscal 2017
Revenues
Fiscal Year %(in millions) 2018 2017 Change Change
Internet of Things . . . . . . . . . . . . . . . . . . . . . . . . . . . . . . . . . . . . . $463.8 $395.0 $ 68.8 17.4%Infrastructure . . . . . . . . . . . . . . . . . . . . . . . . . . . . . . . . . . . . . . . . 199.5 152.2 47.3 31.1%Broadcast . . . . . . . . . . . . . . . . . . . . . . . . . . . . . . . . . . . . . . . . . . . 141.4 153.0 (11.6) (7.6)%Access . . . . . . . . . . . . . . . . . . . . . . . . . . . . . . . . . . . . . . . . . . . . . 63.6 68.7 (5.1) (7.5)%
Total . . . . . . . . . . . . . . . . . . . . . . . . . . . . . . . . . . . . . . . . . . . . . . $868.3 $768.9 $ 99.4 12.9%
The change in revenues in fiscal 2018 was due primarily to:
• Increased revenues of $68.8 million for our IoT products, due primarily to increased demand forour wireless products and the addition of revenues from an acquisition.
• Increased revenues of $47.3 million for our Infrastructure products, due primarily to increaseddemand for our isolation and timing products.
• Decreased revenues of $11.6 million for Broadcast products, due primarily to decreases in themarket for our consumer products.
• Decreased revenues of $5.1 million for our Access products, due primarily to decreased demandfor our VoIP products and decreases in the market for such products.
Unit volumes of our products increased by 11.5% and average selling prices increased by 1.1%compared to fiscal 2017. The average selling prices of our products may fluctuate significantly fromperiod to period due to changes in product mix and other factors. In general, as our products becomemore mature, we expect to experience decreases in average selling prices. We anticipate that newlyannounced, higher priced, next generation products and product derivatives will offset some of thesedecreases.
36

Gross Margin
Fiscal Year
(in millions) 2018 2017 Change
Gross margin . . . . . . . . . . . . . . . . . . . . . . . . . . . . . . . . . . . . . . . . . . . . . . $521.4 $454.2 $67.2Percent of revenue . . . . . . . . . . . . . . . . . . . . . . . . . . . . . . . . . . . . . . . . . . . 60.1% 59.1% 1.0%
The increased dollar amount of gross margin in fiscal 2018 was due to increases in gross margin of$42.8 million for our Internet of Things products and $34.6 million for our Infrastructure products,offset by decreases in gross margin of $8.5 million for our Broadcast products and $1.7 million for ourAccess products. Gross margin increased in fiscal 2018 due primarily to increased product sales. Grossmargin in fiscal 2018 included $6.1 million in acquisition-related charges for the fair value write-upassociated with acquired inventory. Gross margin as a percent of revenues increased in fiscal 2018primarily due to a higher mix of Infrastructure products sold.
We may experience declines in the average selling prices of certain of our products. This createsdownward pressure on gross margin as a percentage of revenues and may be offset to the extent we areable to introduce higher margin new products and gain market share with our products; reduce costs ofexisting products through improved design; achieve lower production costs from our wafer suppliersand third-party assembly and test subcontractors; achieve lower production costs per unit as a result ofimproved yields throughout the manufacturing process; or reduce logistics costs.
Research and Development
Fiscal Year %(in millions) 2018 2017 Change Change
Research and development . . . . . . . . . . . . . . . . . . . . . . . . . . . . . . $238.3 $209.5 $28.8 13.8%Percent of revenue . . . . . . . . . . . . . . . . . . . . . . . . . . . . . . . . . . . . 27.5% 27.2%
The increase in research and development expense in fiscal 2018 was primarily due to increases of$16.5 million for personnel-related expenses, including costs associated with increased headcount andan acquisition, and $7.2 million for the amortization of intangible assets. We expect that research anddevelopment expense will increase in absolute dollars in the first quarter of 2019 compared to thefourth quarter of 2018.
Selling, General and Administrative
Fiscal Year %(in millions) 2018 2017 Change Change
Selling, general and administrative . . . . . . . . . . . . . . . . . . . . . . . . . $197.8 $159.7 $38.1 23.9%Percent of revenue . . . . . . . . . . . . . . . . . . . . . . . . . . . . . . . . . . . . 22.8% 20.8%
The increase in selling, general and administrative expense in fiscal 2018 was primarily due toincreases of $23.6 million for personnel-related expenses, including costs associated with increasedheadcount and an acquisition, $3.6 million for the amortization of intangible assets and $3.4 million foracquisition-related costs. We expect that selling, general and administrative expense will increase inabsolute dollars in the first quarter of 2019 compared to the fourth quarter of 2018.
Interest Income and Other, Net
Interest income and other, net in fiscal 2018 was $6.6 million compared to $6.1 million in fiscal2017. The increase in interest income and other, net in fiscal 2018 was primarily due to increased
37

interest income earned as a result of higher market interest rates and higher investment balances, offsetby a net loss of $1.8 million recorded in connection with fair value adjustments to an equity investment.
Interest Expense
Interest expense in fiscal 2018 was $19.7 million compared to $14.1 million in fiscal 2017. Theincrease in interest expense in fiscal 2018 was primarily due to increased interest expense of$3.8 million on our convertible debt, including amortization of the debt discount and debt issuancecosts, as a result of recording a full year of interest expense in fiscal 2018 versus a partial year in fiscal2017. In addition, interest expense in fiscal 2017 was lower than fiscal 2018 due to a $2.0 million gainrecorded in fiscal 2017 in connection with the termination of our interest rate swap agreement.
Provision (Benefit) for Income Taxes
Fiscal Year
(in millions) 2018 2017 Change
Provision (benefit) for income taxes . . . . . . . . . . . . . . . . . . . . . . . . . . . . . . $(11.4) $29.8 $(41.2)Effective tax rate . . . . . . . . . . . . . . . . . . . . . . . . . . . . . . . . . . . . . . . . . . . . (15.8)% 38.8%
The effective tax rate for fiscal 2018 decreased from fiscal 2017 primarily due to a reduction in theU.S. federal statutory rate as well as the inclusion of one-time tax impacts recorded in 2017 from theenactment of the Tax Cuts and Jobs Act. The effective tax rate in 2018 further decreased from fiscal2017 primarily as a result two discrete 2018 items: the SAB 118 (defined below) discrete benefit relatedto the transition tax calculation as well as the impact of a change of U.S. method of tax accounting forrecognizing revenue. This overall decrease in the effective tax rate was offset by a decrease in theCompany’s foreign tax rate benefit.
The effective tax rates for each of the periods presented differ from the U.S. federal statutory taxrates of 21% and 35%, respectively, due to the amount of income earned in foreign jurisdictions wherethe tax rate may be higher or lower than the federal statutory tax rate, as well as other permanentitems including research and development tax credits, and the tax effects of stock-based compensation.
Comparison of Fiscal 2017 to Fiscal 2016
Revenues
Fiscal Year %(in millions) 2017 2016 Change Change
Internet of Things . . . . . . . . . . . . . . . . . . . . . . . . . . . . . . . . . . . . . $395.0 $314.6 $80.4 25.6%Broadcast . . . . . . . . . . . . . . . . . . . . . . . . . . . . . . . . . . . . . . . . . . . 153.0 157.7 (4.7) (3.0)%Infrastructure . . . . . . . . . . . . . . . . . . . . . . . . . . . . . . . . . . . . . . . . 152.2 147.7 4.5 3.0%Access . . . . . . . . . . . . . . . . . . . . . . . . . . . . . . . . . . . . . . . . . . . . . 68.7 77.6 (8.9) (11.4)%
Total . . . . . . . . . . . . . . . . . . . . . . . . . . . . . . . . . . . . . . . . . . . . . . $768.9 $697.6 $71.3 10.2%
The change in revenues in fiscal 2017 was due primarily to:
• Increased revenues of $80.4 million for our IoT products, due primarily to increased demand forour wireless products.
• Decreased revenues of $4.7 million for Broadcast products, due primarily to decreases in themarket for our consumer products offset by increased demand for our automotive products.
38

• Increased revenues of $4.5 million for our Infrastructure products, due primarily to increaseddemand for our isolation products offset by decreased demand for our timing products anddecreased patent sale revenue of $5.0 million in fiscal 2016 with no patents sales in fiscal 2017.
• Decreased revenues of $8.9 million for our Access products, due primarily to decreased demandfor our VoIP products and decreases in the market for such products.
Unit volumes of our products increased by 21.0% and average selling prices decreased by 8.5%compared to fiscal 2016.
Gross Margin
Fiscal Year
(in millions) 2017 2016 Change
Gross margin . . . . . . . . . . . . . . . . . . . . . . . . . . . . . . . . . . . . . . . . . . . . . . $454.2 $421.5 $32.7Percent of revenue . . . . . . . . . . . . . . . . . . . . . . . . . . . . . . . . . . . . . . . . . . . 59.1% 60.4% (1.3)%
The increased dollar amount of gross margin in fiscal 2017 was due to increases in gross margin of$45.0 million for our IoT products and $1.4 million for our Infrastructure products, offset by decreasesin gross margin of $7.0 million for our Broadcast products and $6.7 million for our Access products.Gross margin increased in fiscal 2017 due primarily to increased product sales. Gross margin as apercent of revenues decreased in fiscal 2017 primarily due to variations in product mix. Gross margin infiscal 2016 included $5.0 million from the sale of patents, which had no associated cost of revenues.
Research and Development
Fiscal Year %(in millions) 2017 2016 Change Change
Research and development . . . . . . . . . . . . . . . . . . . . . . . . . . . . . . $209.5 $199.7 $9.8 4.9%Percent of revenue . . . . . . . . . . . . . . . . . . . . . . . . . . . . . . . . . . . . 27.2% 28.6%
The increase in research and development expense in fiscal 2017 was primarily due to increases of$12.6 million for personnel-related expenses, including costs associated with increased headcount andacquisitions. The increase in research and development expense in fiscal 2017 was offset in part by adecrease of $2.3 million for new product introduction costs. The decrease in research and developmentexpense as a percent of revenues in fiscal 2017 was due to our increased revenues.
Selling, General and Administrative
Fiscal Year %(in millions) 2017 2016 Change Change
Selling, general and administrative . . . . . . . . . . . . . . . . . . . . . . . . . $159.7 $155.5 $4.2 2.7%Percent of revenue . . . . . . . . . . . . . . . . . . . . . . . . . . . . . . . . . . . . 20.8% 22.3%
The increase in selling, general and administrative expense in fiscal 2017 was primarily due to anincrease of $6.1 million for personnel-related expenses, including costs associated with increasedheadcount and acquisitions. The increase in selling, general and administrative in fiscal 2017 was offsetin part by a decrease of $1.4 million for legal fees, primarily related to litigation. The decrease inselling, general and administrative expense as a percent of revenues in fiscal 2017 was due to ourincreased revenues.
39

Interest Income and Other, Net
Interest income and other, net in fiscal 2017 was $6.1 million compared to $0.8 million in fiscal2016. The increase in interest income and other, net in fiscal 2017 was primarily due to increasedinterest income earned as a result of higher market interest rates and higher cash, cash equivalents andshort-term investments balances.
Interest Expense
Interest expense in fiscal 2017 was $14.1 million compared to $2.6 million in fiscal 2016. Theincrease in interest expense in fiscal 2017 was primarily due to increased interest expense of$14.6 million on our convertible debt, including amortization of the debt discount and debt issuancecosts. The increase in interest expense was offset in part by a $2.0 million gain recorded in connectionwith the termination of our interest rate swap agreement.
Provision (Benefit) for Income Taxes
Fiscal Year
(in millions) 2017 2016 Change
Provision (benefit) for income taxes . . . . . . . . . . . . . . . . . . . . . . . . . . . . . . . . . $29.8 $3.0 $26.8Effective tax rate . . . . . . . . . . . . . . . . . . . . . . . . . . . . . . . . . . . . . . . . . . . . . . 38.8% 4.7%
On December 22, 2017, the U.S. government enacted comprehensive tax legislation commonlyreferred to as the Tax Cuts and Jobs Act (the ‘‘Tax Act’’). The effective tax rate for fiscal 2017increased from fiscal 2016 primarily due to the impacts from the Tax Act including a one-timetransition tax of $54.4 million on unrepatriated earnings of foreign subsidiaries as well as tax expense of$21.8 million related to the revaluation of our deferred tax assets and liabilities due to the reduction ofthe U.S. corporate tax rate from 35% to 21% under the Tax Act. These increases in tax expense werepartially offset by the release of a deferred tax liability related to future foreign earnings expectedunder our intercompany cost-sharing arrangement of $39.4 million, as well as a decrease in thevaluation allowance established on federal research and development tax credits of $10.5 million.
The effective tax rates for each of the periods presented differ from the U.S. federal statutory taxrate of 35% due to the amount of income earned in foreign jurisdictions where the tax rate may belower than the federal statutory rate, and other permanent items including research and developmenttax credits and nondeductible compensation expenses. In addition, the effective tax rate for fiscal 2017was also impacted by certain one-time effects as a result of the enactment of U.S. tax reform.
Business Outlook
The following represents our business outlook for the first quarter of fiscal 2019.
Income Statement Item Estimate
Revenues . . . . . . . . . . . . . . . . . . . . . . . . . . . . . . . . . $183 million to $193 million
Gross margin . . . . . . . . . . . . . . . . . . . . . . . . . . . . . . 60.0%
Operating expenses . . . . . . . . . . . . . . . . . . . . . . . . . . $114.0 million
Effective tax rate . . . . . . . . . . . . . . . . . . . . . . . . . . . . 10.0%
Diluted loss per share . . . . . . . . . . . . . . . . . . . . . . . . $(0.11) to $(0.01)
40
Liquidity and Capital Resources
Our principal sources of liquidity as of December 29, 2018 consisted of $613.8 million in cash, cashequivalents and short-term investments, of which approximately $487.0 million was held by our U.S.entities. The remaining balance was held by our foreign subsidiaries. Our cash equivalents andshort-term investments consisted of government debt securities, which include agency bonds, municipalbonds, U.S. government securities and variable-rate demand notes; corporate debt securities, whichinclude asset-backed securities, corporate bonds and commercial paper; and money market funds. Ourlong-term investments consisted of auction-rate securities.
Operating Activities
Net cash provided by operating activities was $173.5 million during fiscal 2018, compared to netcash provided of $189.5 million during fiscal 2017. Operating cash flows during fiscal 2018 reflect ournet income of $83.6 million, adjustments of $114.7 million for depreciation, amortization, stock-basedcompensation and deferred income taxes, and a net cash outflow of $24.8 million due to changes in ouroperating assets and liabilities.
Net cash provided by operating activities was $189.5 million during fiscal 2017, compared to netcash provided of $128.9 million during fiscal 2016. Operating cash flows during fiscal 2017 reflect ournet income of $47.1 million, adjustments of $70.4 million for depreciation, amortization, stock-basedcompensation and deferred income taxes, and a net cash inflow of $72.0 million due to changes in ouroperating assets and liabilities.
Accounts receivable increased to $73.2 million at December 29, 2018 from $71.4 million atDecember 30, 2017. The increase in accounts receivable resulted primarily from normal variations inthe timing of collections and billings. Our average DSO was 31 days at December 29, 2018 and 32 daysat December 30, 2017.
Inventory increased to $75.0 million at December 29, 2018 from $73.1 million at December 30,2017. A portion of the increase was due to inventory acquired from the Z-Wave business acquisition.Our inventory level is primarily impacted by our need to make purchase commitments to supportforecasted demand and variations between forecasted and actual demand. Our DOI was 79 days atDecember 29, 2018 and 81 days at December 30, 2017.
Investing Activities
Net cash used in investing activities was $197.0 million during fiscal 2018, compared to net cashused of $374.3 million during fiscal 2017. The decrease in cash outflows was principally due to anincrease of $420.1 million in net sales and maturities of marketable securities, offset by an increase of$224.6 million in net payments for the acquisition of businesses. See Note 8, Acquisitions, to theConsolidated Financial Statements for additional information.
Net cash used in investing activities was $374.3 million during fiscal 2017, compared to net cashused of $49.6 million during fiscal 2016. The increase in cash outflows was principally due to anincrease of $318.6 million in net purchases of marketable securities and an increase of $8.6 million innet payments for the acquisition of businesses.
We anticipate capital expenditures of approximately $22 to $24 million for fiscal 2019. Additionally,as part of our growth strategy, we expect to evaluate opportunities to invest in or acquire otherbusinesses, intellectual property or technologies that would complement or expand our currentofferings, expand the breadth of our markets or enhance our technical capabilities.
41

Financing Activities
Net cash used in financing activities was $48.8 million during fiscal 2018, compared to net cashprovided of $313.0 million during fiscal 2017. The decrease in cash inflows was principally due to$389.5 million in net proceeds from the issuance of long-term debt during fiscal 2017 and an increaseof $39.3 million for repurchases of our common stock during fiscal 2018, offset by a decrease of$72.5 million in payments on debt. In October 2018, the Board of Directors increased the sharerepurchase amount for the October 2017 program from $100 million to $200 million and extended thetermination date from December 2018 to December 2019.
Net cash provided by financing activities was $313.0 million during fiscal 2017, compared to netcash used of $52.3 million during fiscal 2016. The increase in cash inflows was principally due to$389.5 million in net proceeds from the issuance of long-term debt and a decrease of $40.5 million forrepurchases of our common stock, offset by an increase of $67.5 million in payments on debt.
Our debt facilities include $400 million principal amount convertible senior notes (the ‘‘Notes’’)and a $300 million revolving credit facility. On March 6, 2017, we completed a private offering of theNotes. The Notes bear interest semi-annually at a rate of 1.375% per year and will mature on March 1,2022, unless repurchased, redeemed or converted at an earlier date. In connection with our offering ofthe Notes, we entered into an amendment to our credit agreement and paid off the then remainingbalance of $72.5 million. We have an option to increase the size of the borrowing capacity of therevolving credit facility by up to an aggregate of $200 million in additional commitments, subject tocertain conditions. See Note 10, Debt, to the Consolidated Financial Statements for additionalinformation.
Our future capital requirements will depend on many factors, including the rate of sales growth,market acceptance of our products, the timing and extent of research and development projects,potential acquisitions of companies or technologies and the expansion of our sales and marketingactivities. We believe our existing cash, cash equivalents, investments and credit under our CreditFacility are sufficient to meet our capital requirements through at least the next 12 months, althoughwe could be required, or could elect, to seek additional funding prior to that time. We may enter intoacquisitions or strategic arrangements in the future which also could require us to seek additionalequity or debt financing.
Contractual Obligations
The following table summarizes our contractual obligations as of December 29, 2018 (inthousands):
Payments due by period
Total 2019 2020 2021 2022 2023 Thereafter
Long-term debt obligations (1) . . $400,000 $ — $ — $ — $400,000 $ — $ —Interest on long-term debt
obligations (2) . . . . . . . . . . . . $ 20,427 $ 6,250 $5,927 $5,500 $ 2,750 $ — $ —Operating lease obligations (3) . . $ 24,221 $ 5,287 $4,746 $4,051 $ 3,485 $2,810 $ 3,842Purchase obligations (4) . . . . . . $ 49,326 $49,256 $ 70 $ — $ — $ — $ —Other long-term obligations (5) . $ 26,755 $ — $4,679 $ — $ 2,884 $4,789 $14,403
(1) Long-term debt obligations represent the principal portion of our convertible senior notes (the‘‘Notes’’). The Notes mature on March 1, 2022, unless repurchased, redeemed or converted at anearlier date.
42

(2) Interest on our long-term debt obligations primarily represents contractual interest on the Notes,which bear interest semi-annually at a rate of 1.375% per year. Interest excludes non-cashamortization of the debt discount and debt issuance costs.
(3) Operating lease obligations include amounts for leased facilities.
(4) Purchase obligations include contractual arrangements in the form of purchase orders withsuppliers where there is a fixed non-cancelable payment schedule or minimum payments due witha reduced delivery schedule.
(5) Other long-term obligations primarily represent non-current income taxes and software licenseobligations.
We are unable to make a reasonably reliable estimate as to when or if cash settlement with taxingauthorities will occur for our unrecognized tax benefits. Therefore, our liability of $2.1 million forunrecognized tax benefits is not included in the table above. See Note 17, Income Taxes, to theConsolidated Financial Statements for additional information.
Off-Balance Sheet Arrangements
As of December 29, 2018, we had no significant off-balance sheet arrangements.
Critical Accounting Policies and Estimates
The preparation of financial statements and accompanying notes in conformity with U.S. generallyaccepted accounting principles requires that we make estimates and assumptions that affect theamounts reported. Changes in facts and circumstances could have a significant impact on the resultingestimated amounts included in the financial statements. We believe the following critical accountingpolicies affect our more complex judgments and estimates.
Inventory valuation—We assess the recoverability of inventories through the application of a set ofmethods, assumptions and estimates. In determining net realizable value, we write down inventory thatmay be slow moving or have some form of obsolescence, including inventory that has aged more than12 months. We also adjust the valuation of inventory when its manufacturing cost exceeds the estimatedselling price less costs of completion, disposal and transportation. We assess the potential for anyunusual customer returns based on known quality or business issues and write-off inventory losses forscrap or non-saleable material. Inventory not otherwise identified to be written down is compared to anassessment of our 12-month forecasted demand. The result of this methodology is compared against theproduct life cycle and competitive situations in the marketplace to determine the appropriateness of theresulting inventory levels. Demand for our products may fluctuate significantly over time, and actualdemand and market conditions may be more or less favorable than those that we project. In the eventthat actual demand is lower or market conditions are worse than originally projected, additionalinventory write-downs may be required.
Impairment of goodwill and other long-lived assets—We review long-lived assets which are held andused, including fixed assets and purchased intangible assets, for impairment whenever changes incircumstances indicate that the carrying amount of the assets may not be recoverable. Such evaluationscompare the carrying amount of an asset to future undiscounted net cash flows expected to begenerated by the asset over its expected useful life and are significantly impacted by estimates of futureprices and volumes for our products, capital needs, economic trends and other factors which areinherently difficult to forecast. If the asset is considered to be impaired, we record an impairmentcharge equal to the amount by which the carrying value of the asset exceeds its fair value determinedby either a quoted market price, if any, or a value determined by utilizing a discounted cash flowtechnique.
43

We test our goodwill for impairment annually as of the first day of our fourth fiscal quarter and ininterim periods if certain events occur indicating that the carrying value of goodwill may be impaired.The goodwill impairment test is a two-step process. The first step of the impairment analysis comparesour fair value to our net book value. In determining fair value, the accounting guidance allows for theuse of several valuation methodologies, although it states quoted market prices are the best evidence offair value. If the fair value is less than the net book value, the second step of the analysis compares theimplied fair value of our goodwill to its carrying amount. If the carrying amount of goodwill exceeds itsimplied fair value, we recognize an impairment loss equal to that excess amount.
Acquired intangible assets—When we acquire a business, a portion of the purchase price is typicallyallocated to identifiable intangible assets, such as acquired technology and customer relationships. Fairvalue of these assets is determined primarily using the income approach, which requires us to projectfuture cash flows and apply an appropriate discount rate. We amortize intangible assets with finite livesover their expected useful lives. Our estimates are based upon assumptions believed to be reasonablebut which are inherently uncertain and unpredictable. Assumptions may be incomplete or inaccurate,and unanticipated events and circumstances may occur. Incorrect estimates could result in futureimpairment charges, and those charges could be material to our results of operations.
Revenue recognition—We recognize revenue when control of the promised goods or services istransferred to customers, in an amount that reflects the consideration we expect to be entitled to inexchange for those goods or services. In order to achieve this core principle, we apply a five-stepprocess. As part of this process, we analyze the performance obligations in a customer contract andestimate the consideration we expect to receive. The evaluation of performance obligations requiresthat we identify the promised goods and services in the contract. For contracts that contain more thanone promised good and service, we then must determine whether the promises are capable of beingdistinct and if they are separately identifiable from other promises in the contract. Additionally, for oursales to distributors, we must estimate the impact that price adjustments and rights of return will haveon consideration. We make these estimates based on available information, including recent salesactivity and pricing data. If our evaluation of performance obligations is incorrect, we may recognizerevenue sooner or later than is appropriate. If our estimates of consideration are inaccurate, we mayrecognize too much or too little revenue in a period.
Stock-based compensation—We recognize the fair-value of stock-based compensation transactions inthe Consolidated Statements of Income. The fair value of our full-value stock awards (with theexception of market-based performance awards) equals the fair market value of our stock on the dateof grant. The fair value of our market-based performance awards is estimated at the date of grant usinga Monte-Carlo simulation. The fair value of our stock option and employee stock purchase plan grantsis estimated at the date of grant using the Black-Scholes option pricing model. In addition, we arerequired to estimate the expected forfeiture rate of our stock grants and only recognize the expense forthose shares expected to vest. If our actual experience differs significantly from the assumptions used tocompute our stock-based compensation cost, or if different assumptions had been used, we may haverecorded too much or too little stock-based compensation cost. See Note 14, Stock-BasedCompensation, to the Consolidated Financial Statements for additional information.
Income taxes—We are required to calculate income taxes in each of the jurisdictions in which weoperate. This process involves calculating the actual current tax liability together with assessingtemporary differences in recognition of income (loss) for tax and accounting purposes. Thesedifferences result in deferred tax assets and liabilities, which are included in our Consolidated BalanceSheet. We record a valuation allowance when it is more likely than not that some portion or all of thedeferred tax assets will not be realized. In assessing the need for a valuation allowance, we are requiredto estimate the amount of expected future taxable income. Judgment is inherent in this process anddifferences between the estimated and actual taxable income could result in a material impact on ourConsolidated Financial Statements.
44

We recognize liabilities for uncertain tax positions based on a two-step process. The first steprequires us to determine whether the weight of available evidence indicates that the tax position hasmet the threshold for recognition. Therefore, we must evaluate whether it is more likely than not thatthe position will be sustained on audit, including resolution of any related appeals or litigationprocesses. The second step requires us to measure the tax benefit of the tax position taken, or expectedto be taken, in an income tax return as the largest amount that is more than 50% likely of beingrealized upon ultimate settlement. This measurement step is inherently complex and requires subjectiveestimations of such amounts to determine the probability of various possible outcomes. We re-evaluatethe uncertain tax positions each quarter based on factors including, but not limited to, changes in factsor circumstances, changes in tax law, expirations of statutes of limitation, effectively settled issues underaudit, and new audit activity. Such a change in recognition or measurement would result in therecognition of a tax benefit or an additional charge to the tax provision in the period.
Although we believe the measurement of our liabilities for uncertain tax positions is reasonable, noassurance can be given that the final outcome of these matters will not be different than what isreflected in the historical income tax provisions and accruals. If additional taxes are assessed as a resultof an audit or litigation, they could have a material effect on our income tax provision and net incomein the period or periods for which that determination is made. We operate within multiple taxingjurisdictions and are subject to audit in these jurisdictions. These audits can involve complex issueswhich may require an extended period of time to resolve and could result in additional assessments ofincome tax. We believe adequate provisions for income taxes have been made for all periods.
Recent Accounting Pronouncements
Recent accounting pronouncements which we believe may materially impact the judgments anduncertainties in the application of our accounting policies are described below. See Note 2, SignificantAccounting Policies, to the Consolidated Financial Statements for additional information.
In February 2016, the Financial Accounting Standards Board (FASB) issued Accounting StandardsUpdate (ASU) No. 2016-02, Leases, which was subsequently amended in 2018 by ASU 2018-10,ASU 2018-11 and ASU 2018-20 (collectively, Topic 842). The core principle of Topic 842 is that alessee should recognize the assets and liabilities that arise from leases. For operating leases, a lessee isrequired to recognize a right-of-use asset and a lease liability, initially measured at the present value ofthe lease payments, in the statement of financial position. Topic 842 is effective for fiscal yearsbeginning after December 15, 2018, including interim periods within those fiscal years. We will elect anoptional transition method to account for the impact of the adoption with a cumulative-effectadjustment in the period of adoption and will not restate prior periods. We expect to elect certainpractical expedients permitted under the transition guidance. We are substantially complete with ourevaluation of the effect that the adoption of this ASU will have on our financial statements. We believethat most of our operating lease commitments will be subject to the new standard. In connection withthe adoption of ASC 842, we expect to recognize additional right-of-use assets and operating leaseliabilities of $20.8 million on December 30, 2018.
Item 7A. Quantitative and Qualitative Disclosures about Market Risk
Interest Income
Our investment portfolio includes cash, cash equivalents, short-term investments and long-terminvestments. Our main investment objectives are the preservation of investment capital and themaximization of after-tax returns on our investment portfolio. Our interest income is sensitive tochanges in the general level of U.S. interest rates. A 100 basis point decline in yield on our investmentportfolio holdings as of December 29, 2018 and December 30, 2017 would decrease our future annualinterest income by approximately $5.6 million and $7.1 million, respectively. We believe that our
45

investment policy, which defines the duration, concentration, and minimum credit quality of theallowable investments, meets our investment objectives.
Interest Expense
We are exposed to interest rate fluctuations in the normal course of our business, includingthrough our Credit Facility. The interest rate on the Credit Facility consists of a variable-rate of interestand an applicable margin. While we have drawn from the Credit Facility in the past, we have noborrowings as of December 29, 2018. If we borrow from the Credit Facility in the future, we will againbe exposed to interest rate fluctuations.
Foreign currency exchange rate risk
We are exposed to foreign currency exchange rate risk primarily through assets, liabilities andoperating expenses of our subsidiaries denominated in currencies other than the U.S. dollar. Ourforeign subsidiaries are considered to be extensions of the U.S. parent. The functional currency of theforeign subsidiaries is the U.S. dollar. Accordingly, gains and losses resulting from remeasuringtransactions denominated in currencies other than U.S. dollars are recorded in the ConsolidatedStatements of Income. We use foreign currency forward contracts to manage exposure to foreignexchange risk. Gains and losses on foreign currency forward contracts are recognized in earnings in thesame period during which the hedged transaction is recognized.
Investments in Auction-rate Securities
As of December 29, 2018, we held $6.0 million par value auction-rate securities, all of which haveexperienced failed auctions because sell orders exceeded buy orders. We are unable to predict if thesefunds will become available before their maturity dates. Additionally, if we determine that another-than-temporary decline in the fair value of any of our available-for-sale auction-rate securities hasoccurred, we may be required to adjust the carrying value of the investments through an impairmentcharge.
Item 8. Financial Statements and Supplementary Data
The Financial Statements and supplementary data required by this item are included in Part IV,Item 15 of this Form 10-K and are presented beginning on page F-1.
Item 9. Changes in and Disagreements with Accountants on Accounting and Financial Disclosure
None.
Item 9A. Controls and Procedures
We have performed an evaluation under the supervision and with the participation of ourmanagement, including our Chief Executive Officer (CEO) and Chief Financial Officer (CFO), of theeffectiveness of our disclosure controls and procedures, as defined in Rule 13a-15(e) under theSecurities Exchange Act of 1934 (the Exchange Act). Based on that evaluation, our management,including our CEO and CFO, concluded that our disclosure controls and procedures were effective asof December 29, 2018 to provide reasonable assurance that information required to be disclosed by usin the reports filed or submitted by us under the Exchange Act is recorded, processed, summarized andreported within the time periods specified in the SEC’s rules and forms. Such disclosure controls andprocedures include controls and procedures designed to ensure that information required to bedisclosed is accumulated and communicated to our management, including our CEO and CFO, toallow timely decisions regarding required disclosures. There was no change in our internal controls
46
during the fiscal quarter ended December 29, 2018 that materially affected, or is reasonably likely tomaterially affect, our internal controls over financial reporting.
Management’s Report on Internal Control over Financial Reporting
Our management is responsible for establishing and maintaining adequate internal control overfinancial reporting. Our internal control system was designed to provide reasonable assurance to ourmanagement and Board of Directors regarding the preparation and fair presentation of publishedfinancial statements.
Our management assessed the effectiveness of our internal control over financial reporting as ofDecember 29, 2018. In making this assessment, it used the criteria set forth by the Committee ofSponsoring Organizations of the Treadway Commission (COSO) in Internal Control—IntegratedFramework (2013 framework). Based on our assessment we concluded that, as of December 29, 2018,our internal control over financial reporting is effective based on those criteria.
Our independent registered public accounting firm, Ernst & Young LLP, issued an attestationreport on our internal control over financial reporting. This report appears on page F-1.
Item 9B. Other Information
None.
47
Part III
Certain information required by Part III is omitted from this report because we intend to file adefinitive Proxy Statement pursuant to Regulation 14A (the ‘‘Proxy Statement’’) no later than 120 daysafter the end of the fiscal year covered by this report, and certain information to be included therein isincorporated herein by reference.
Item 10. Directors, Executive Officers and Corporate Governance
The information required by this Item is incorporated by reference to the Proxy Statement underthe sections captioned ‘‘Proposal One: Election of Directors,’’ ‘‘Executive Compensation,’’‘‘Section 16(a) Beneficial Ownership Reporting Compliance’’ and ‘‘Code of Ethics.’’
Item 11. Executive Compensation
The information under the caption ‘‘Executive Compensation’’ and ‘‘Proposal One: Election ofDirectors’’ appearing in the Proxy Statement, is incorporated herein by reference.
Item 12. Security Ownership of Certain Beneficial Owners and Management and Related StockholderMatters
The information under the caption ‘‘Ownership of Securities’’ and ‘‘Equity Compensation PlanInformation’’ appearing in the Proxy Statement is incorporated herein by reference.
Item 13. Certain Relationships and Related Transactions, and Director Independence
The information under the caption ‘‘Certain Relationships and Related Transactions, and DirectorIndependence’’ appearing in the Proxy Statement is incorporated herein by reference.
Item 14. Principal Accounting Fees and Services
The information under the caption ‘‘Proposal Two: Ratification of Appointment of IndependentRegistered Public Accounting Firm’’ appearing in the Proxy Statement is incorporated herein byreference.
48

Part IV
Item 15. Exhibits and Financial Statement Schedules
(a) 1. Financial Statements
Index
Page
Report of independent registered public accounting firm . . . . . . . . . . . . . . . . . . . . . . . . . . . . . . F-1
Report of independent registered public accounting firm . . . . . . . . . . . . . . . . . . . . . . . . . . . . . . F-2
Consolidated Balance Sheets at December 29, 2018 and December 30, 2017 . . . . . . . . . . . . . . . . F-3
Consolidated Statements of Income for the fiscal years ended December 29, 2018, December 30,2017 and December 31, 2016 . . . . . . . . . . . . . . . . . . . . . . . . . . . . . . . . . . . . . . . . . . . . . . . . F-4
Consolidated Statements of Comprehensive Income for the fiscal years ended December 29,2018, December 30, 2017 and December 31, 2016 . . . . . . . . . . . . . . . . . . . . . . . . . . . . . . . . . F-5
Consolidated Statements of Changes in Stockholders’ Equity for the fiscal years endedDecember 29, 2018, December 30, 2017 and December 31, 2016 . . . . . . . . . . . . . . . . . . . . . . . F-6
Consolidated Statements of Cash Flows for the fiscal years ended December 29, 2018,December 30, 2017 and December 31, 2016 . . . . . . . . . . . . . . . . . . . . . . . . . . . . . . . . . . . . . . F-7
Notes to Consolidated Financial Statements . . . . . . . . . . . . . . . . . . . . . . . . . . . . . . . . . . . . . . . F-8
2. Schedules
Schedule II—Valuation and Qualifying Accounts
All other schedules have been omitted since the information required by the schedule is notapplicable, or is not present in amounts sufficient to require submission of the schedule, orbecause the information required is included in the Consolidated Financial Statements and notesthereto.
3. Exhibits
The exhibits listed on the accompanying index to exhibits immediately following theConsolidated Financial Statements are filed as part of, or hereby incorporated by reference into,this Form 10-K.
49

(b) Exhibits
ExhibitNumber
2.1* Agreement and Plan of Merger, dated December 7, 2017, by and among SiliconLaboratories Inc., Seguin Merger Subsidiary, Inc. and Sigma Designs, Inc. (filed asExhibit 2.1 to the Form 8-K filed on December 8, 2017).
3.1* Form of Fourth Amended and Restated Certificate of Incorporation of SiliconLaboratories Inc. (filed as Exhibit 3.1 to the Registration Statement on Form S-1(Securities and Exchange Commission File No. 333-94853) (the ‘‘IPO RegistrationStatement’’)).
3.2* Fourth Amended and Restated Bylaws of Silicon Laboratories Inc. (filed as Exhibit 3.2 tothe Form 8-K filed on January 27, 2017).
4.1* Specimen certificate for shares of common stock (filed as Exhibit 4.1 to the IPORegistration Statement).
4.2* Indenture between Silicon Laboratories Inc. and Wilmington Trust, National Association,as trustee, dated March 6, 2017 (filed as Exhibit 4.1 to the Form 8-K filed on March 6,2017).
4.3* Form of 1.375% Convertible Senior Note due 2022 (filed as Exhibit 4.2 to the Form 8-Kfiled on March 6, 2017).
10.1*+ Form of Indemnification Agreement between Silicon Laboratories Inc. and each of itsdirectors and executive officers (filed as Exhibit 10.1 to the IPO Registration Statement).
10.2* Credit Agreement, dated July 31, 2012, by and among Silicon Laboratories Inc., thesubsidiaries of the borrower identified therein, Bank of America, N.A., Wells Fargo Bank,National Association, and Regions Bank (filed as Exhibit 10.1 to the Form 8-K filedAugust 1, 2012).
10.3* First Amendment to Credit Agreement, dated July 24, 2015, by and among SiliconLaboratories Inc., the subsidiaries of the borrower identified therein, Wells Fargo Bank,National Association, Citibank, N.A., Regions Bank, Bank of America, N.A. and thelenders party thereto (filed as Exhibit 10.1 to the Form 8-K filed on July 29, 2015).
10.4* Second Amendment to Credit Agreement, dated February 27, 2017, by and among SiliconLaboratories Inc., the subsidiaries of the borrower identified therein, Wells Fargo Bank,National Association and the lenders party thereto (filed as Exhibit 10.1 to the Form 8-Kfiled on February 27, 2017).
10.5* Security and Pledge Agreement, dated July 31, 2012, by and among SiliconLaboratories Inc., with the other parties identified as ‘‘Obligors’’ (as defined therein) andsuch other parties that may become Obligors thereunder after the date thereof, and Bankof America, N.A (filed as Exhibit 10.2 to the Form 8-K filed August 1, 2012).
10.6*+ Silicon Laboratories Inc. 2009 Stock Incentive Plan, as amended and restated on April 20,2017 (filed as Exhibit 10.1 to the Form 10-Q filed on July 26, 2017).
10.7*+ Silicon Laboratories Inc. 2009 Employee Stock Purchase Plan, as amended and restated onApril 20, 2017 (filed as Exhibit 10.2 to the Form 10-Q filed on July 26, 2017).
10.8*+ Form of Restricted Stock Units Grant Notice and Global Restricted Stock Units AwardAgreement under Registrant’s 2009 Stock Incentive Plan, as amended and restated (filedas Exhibit 10.7 to the Form 10-K filed on February 1, 2017).
50

ExhibitNumber
10.9*+ Form of Market Stock Units Grant Notice and Global Market Stock Units AwardAgreement under Registrant’s 2009 Stock Incentive Plan, as amended and restated (filedas Exhibit 10.8 to the Form 10-K filed on February 1, 2017).
10.10*+ Form of Stock Option Grant Notice and Global Stock Option Award Agreement underRegistrant’s 2009 Stock Incentive Plan, as amended and restated (filed as Exhibit 10.9 tothe Form 10-K filed on February 1, 2017).
10.11*+ Form of Performance Stock Units Grant Notice and Global PSU Award Agreement underRegistrant’s 2009 Stock Incentive Plan, as amended and restated (filed as Exhibit 10.10 tothe Form 10-K filed on February 1, 2017).
10.12* Purchase Agreement between Silicon Laboratories Inc. and Goldman, Sachs & Co. andWells Fargo Securities, LLC, as representatives of the several initial purchasers namedtherein, dated February 28, 2017 (filed as Exhibit 10.1 to the Form 8-K filed on March 6,2017).
10.13*+ CEO Change in Control Agreement dated October 23, 2018 between SiliconLaboratories Inc. and G. Tyson Tuttle (filed as Exhibit 10.1 to the Form 8-K filed onOctober 24, 2018).
10.14*+ Silicon Laboratories Inc. Form of Change in Control Agreement (filed as Exhibit 10.2 tothe Form 8-K filed on October 24, 2018).
10.15*+ Silicon Laboratories Inc. 2019 Bonus Plan (filed as Exhibit 10.1 to the Form 8-K filed onJanuary 28, 2019).
21 Subsidiaries of the Registrant.
23.1 Consent of Independent Registered Public Accounting Firm.
24 Power of Attorney (included on signature page to this Form 10-K).
31.1 Certification of the Principal Executive Officer, as required by Section 302 of the Sarbanes-Oxley Act of 2002.
31.2 Certification of the Principal Financial Officer, as required by Section 302 of the Sarbanes-Oxley Act of 2002.
32.1 Certification as required by Section 906 of the Sarbanes-Oxley Act of 2002.
101.INS XBRL Instance Document
101.SCH XBRL Taxonomy Extension Schema Document
101.CAL XBRL Taxonomy Extension Calculation Linkbase Document
101.LAB XBRL Taxonomy Extension Label Linkbase Document
101.PRE XBRL Taxonomy Extension Presentation Linkbase Document
101.DEF XBRL Taxonomy Extension Definition Linkbase Document
* Incorporated herein by reference to the indicated filing.
+ Management contract or compensatory plan or arrangement
Item 16. Form 10-K Summary
None.
51

SCHEDULE II
SILICON LABORATORIES INC.VALUATION AND QUALIFYING ACCOUNTS
AdditionsBalance at Additions Charged to
Valuation Allowance for Beginning of Charged to Other Balance atDeferred Tax Assets Period Expenses Accounts Deductions End of Period
(in thousands)
Year ended December 29, 2018 . . . . . . . . $ 6,518 $ 435 $ — $(1,978) $ 4,975Year ended December 30, 2017 . . . . . . . . $12,361 $2,110 $1,732 $(9,685) $ 6,518Year ended December 31, 2016 . . . . . . . . $10,264 $2,715 $ — $ (618) $12,361
52

SIGNATURES
Pursuant to the requirements of Section 13 or 15(d) of the Securities Exchange Act of 1934, theregistrant has duly caused this report to be signed on its behalf by the undersigned, thereunto dulyauthorized, in Austin, Texas, on January 30, 2019.
SILICON LABORATORIES INC.
By: /s/ G. TYSON TUTTLE
G. Tyson TuttlePresident and Chief Executive Officer
POWER OF ATTORNEY
KNOW ALL PERSONS BY THESE PRESENTS, that each person whose signature appearsbelow constitutes and appoints G. Tyson Tuttle and John C. Hollister and each of them, actingindividually, as his or her attorney-in-fact, each with full power of substitution and resubstitution, forhim or her and in his or her name, place and stead, in any and all capacities, to sign any and allamendments to this annual report on Form 10-K and other documents in connection herewith andtherewith, and to file the same, with all exhibits thereto, with the Securities and Exchange Commission,granting unto said attorneys-in-fact and agents, and each of them, full power and authority to do andperform each and every act and thing requisite and necessary to be done in connection herewith andtherewith and about the premises, as fully to all intents and purposes as he or she might or could do inperson, hereby ratifying and confirming all that said attorneys-in-fact and agents, or any of them, ortheir or his substitute or substitutes, may lawfully do or cause to be done by virtue hereof.
Pursuant to the requirements of the Securities Exchange Act of 1934, this report has been signedbelow by the following persons on behalf of the registrant and in the capacities and on the datesindicated:
Name Title Date
/s/ NAVDEEP S. SOOCHChairman of the Board January 30, 2019
Navdeep S. Sooch
/s/ G. TYSON TUTTLE President, Chief Executive Officer and January 30, 2019Director (Principal Executive Officer)G. Tyson Tuttle
Senior Vice President and Chief/s/ JOHN C. HOLLISTER Financial Officer (Principal Financial January 30, 2019Officer and Principal AccountingJohn C. Hollister
Officer)
/s/ WILLIAM G. BOCKDirector January 30, 2019
William G. Bock
53

Name Title Date
/s/ JACK R. LAZARDirector January 30, 2019
Jack R. Lazar
/s/ GREGG LOWEDirector January 30, 2019
Gregg Lowe
/s/ NINA RICHARDSONDirector January 30, 2019
Nina Richardson
/s/ SUMIT SADANADirector January 30, 2019
Sumit Sadana
/s/ WILLIAM P. WOODDirector January 30, 2019
William P. Wood
/s/ CHRISTY WYATTDirector January 30, 2019
Christy Wyatt
54

Report of Independent Registered Public Accounting FirmThe Board of Directors and Stockholders of Silicon Laboratories Inc.Opinion on Internal Control over Financial Reporting
We have audited Silicon Laboratories Inc.’s internal control over financial reporting as ofDecember 29, 2018, based on criteria established in Internal Control—Integrated Framework issued bythe Committee of Sponsoring Organizations of the Treadway Commission (2013 framework) (theCOSO criteria). In our opinion, Silicon Laboratories Inc. (the Company) maintained, in all materialrespects, effective internal control over financial reporting as of December 29, 2018, based on theCOSO criteria.
We also have audited, in accordance with the standards of the Public Company AccountingOversight Board (United States) (PCAOB), the consolidated balance sheets of Silicon Laboratories Inc.as of December 29, 2018 and December 30, 2017, and the related consolidated statements of income,comprehensive income, stockholders’ equity and cash flows for each of the three years in the periodended December 29, 2018, and the related notes and financial statement schedule listed in the Index atItem 15(a) and our report dated January 30, 2019 expressed an unqualified opinion thereon.
Basis for OpinionThe Company’s management is responsible for maintaining effective internal control over financial
reporting and for its assessment of the effectiveness of internal control over financial reporting includedin the accompanying Management’s Report on Internal Control over Financial Reporting. Ourresponsibility is to express an opinion on the Company’s internal control over financial reporting basedon our audit. We are a public accounting firm registered with the PCAOB and are required to beindependent with respect to the Company in accordance with the U.S. federal securities laws and theapplicable rules and regulations of the Securities and Exchange Commission and the PCAOB.
We conducted our audit in accordance with the standards of the PCAOB. Those standards requirethat we plan and perform the audit to obtain reasonable assurance about whether effective internalcontrol over financial reporting was maintained in all material respects.
Our audit included obtaining an understanding of internal control over financial reporting,assessing the risk that a material weakness exists, testing and evaluating the design and operatingeffectiveness of internal control based on the assessed risk, and performing such other procedures aswe considered necessary in the circumstances. We believe that our audit provides a reasonable basis forour opinion.
Definition and Limitations of Internal Control Over Financial ReportingA company’s internal control over financial reporting is a process designed to provide reasonable
assurance regarding the reliability of financial reporting and the preparation of financial statements forexternal purposes in accordance with generally accepted accounting principles. A company’s internalcontrol over financial reporting includes those policies and procedures that (1) pertain to themaintenance of records that, in reasonable detail, accurately and fairly reflect the transactions anddispositions of the assets of the company; (2) provide reasonable assurance that transactions arerecorded as necessary to permit preparation of financial statements in accordance with generallyaccepted accounting principles, and that receipts and expenditures of the company are being made onlyin accordance with authorizations of management and directors of the company; and (3) providereasonable assurance regarding prevention or timely detection of unauthorized acquisition, use, ordisposition of the company’s assets that could have a material effect on the financial statements.
Because of its inherent limitations, internal control over financial reporting may not prevent ordetect misstatements. Also, projections of any evaluation of effectiveness to future periods are subjectto the risk that controls may become inadequate because of changes in conditions, or that the degreeof compliance with the policies or procedures may deteriorate.
/s/ Ernst & Young LLPAustin, TexasJanuary 30, 2019
F-1

Report of Independent Registered Public Accounting Firm
The Board of Directors and Stockholders of Silicon Laboratories Inc.
Opinion on the Financial Statements
We have audited the accompanying consolidated balance sheets of Silicon Laboratories Inc. (theCompany) as of December 29, 2018 and December 30, 2017, the related consolidated statements ofincome, comprehensive income, stockholders’ equity and cash flows for each of the three years in theperiod ended December 29, 2018, and the related notes and financial statement schedule listed in theIndex at Item 15(a) (collectively referred to as the ‘‘consolidated financial statements’’). In our opinion,the consolidated financial statements present fairly, in all material respects, the financial position of theCompany at December 29, 2018 and December 30, 2017, and the results of its operations and its cashflows for each of the three years in the period ended December 29, 2018, in conformity with U.S.generally accepted accounting principles.
We also have audited, in accordance with the standards of the Public Company AccountingOversight Board (United States) (PCAOB), the Company’s internal control over financial reporting asof December 29, 2018, based on criteria established in Internal Control-Integrated Framework issuedby the Committee of Sponsoring Organizations of the Treadway Commission (2013 framework) and ourreport dated January 30, 2019 expressed an unqualified opinion thereon.
Adoption of ASU No. 2014-09
As discussed in Note 2 to the consolidated financial statements, the Company changed its methodof accounting for revenue from sales to distributors in 2018 due to the adoption of ASU No. 2014-09,Revenue from Contracts with Customers (Topic 606).
Basis for Opinion
These financial statements are the responsibility of the Company’s management. Our responsibilityis to express an opinion on the Company’s financial statements based on our audits. We are a publicaccounting firm registered with the PCAOB and are required to be independent with respect to theCompany in accordance with the U.S. federal securities laws and the applicable rules and regulations ofthe Securities and Exchange Commission and the PCAOB.
We conducted our audits in accordance with the standards of the PCAOB. Those standards requirethat we plan and perform the audit to obtain reasonable assurance about whether the financialstatements are free of material misstatement, whether due to error or fraud. Our audits includedperforming procedures to assess the risks of material misstatement of the financial statements, whetherdue to error or fraud, and performing procedures that respond to those risks. Such procedures includedexamining, on a test basis, evidence regarding the amounts and disclosures in the financial statements.Our audits also included evaluating the accounting principles used and significant estimates made bymanagement, as well as evaluating the overall presentation of the financial statements. We believe thatour audits provide a reasonable basis for our opinion.
/s/ Ernst & Young LLP
We have served as the Company’s auditor since 1996.Austin, TexasJanuary 30, 2019
F-2
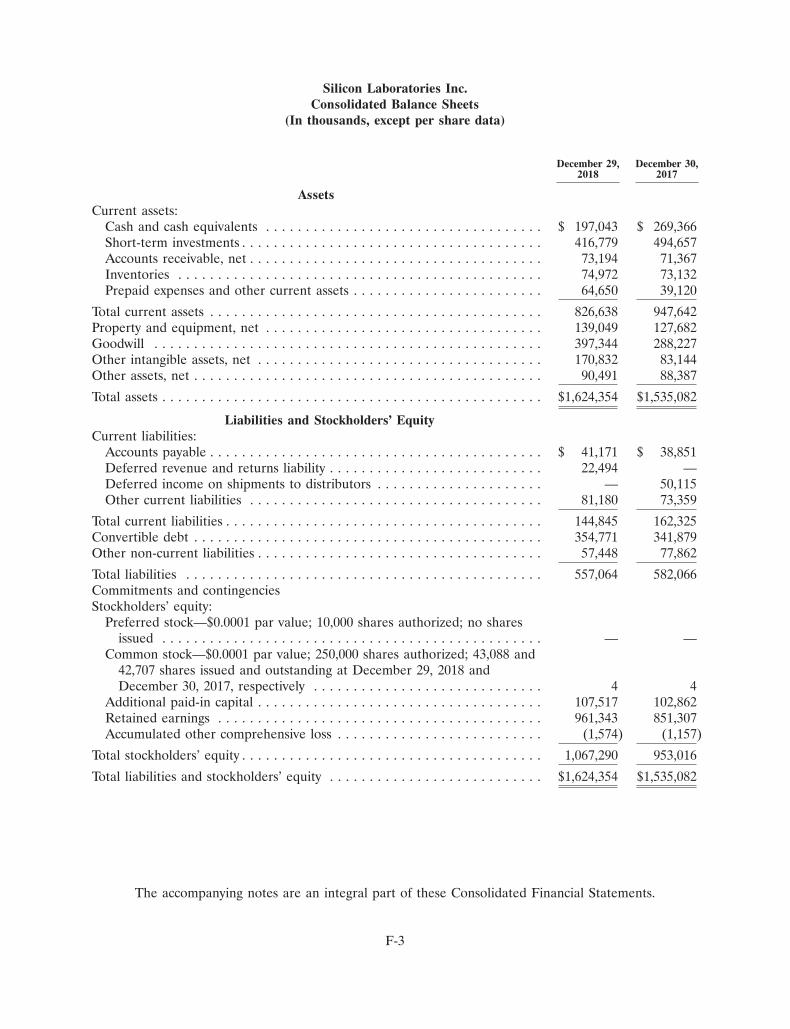
Silicon Laboratories Inc.Consolidated Balance Sheets
(In thousands, except per share data)
December 29, December 30,2018 2017
AssetsCurrent assets:
Cash and cash equivalents . . . . . . . . . . . . . . . . . . . . . . . . . . . . . . . . . . . $ 197,043 $ 269,366Short-term investments . . . . . . . . . . . . . . . . . . . . . . . . . . . . . . . . . . . . . . 416,779 494,657Accounts receivable, net . . . . . . . . . . . . . . . . . . . . . . . . . . . . . . . . . . . . . 73,194 71,367Inventories . . . . . . . . . . . . . . . . . . . . . . . . . . . . . . . . . . . . . . . . . . . . . . 74,972 73,132Prepaid expenses and other current assets . . . . . . . . . . . . . . . . . . . . . . . . 64,650 39,120
Total current assets . . . . . . . . . . . . . . . . . . . . . . . . . . . . . . . . . . . . . . . . . . 826,638 947,642Property and equipment, net . . . . . . . . . . . . . . . . . . . . . . . . . . . . . . . . . . . 139,049 127,682Goodwill . . . . . . . . . . . . . . . . . . . . . . . . . . . . . . . . . . . . . . . . . . . . . . . . . 397,344 288,227Other intangible assets, net . . . . . . . . . . . . . . . . . . . . . . . . . . . . . . . . . . . . 170,832 83,144Other assets, net . . . . . . . . . . . . . . . . . . . . . . . . . . . . . . . . . . . . . . . . . . . . 90,491 88,387
Total assets . . . . . . . . . . . . . . . . . . . . . . . . . . . . . . . . . . . . . . . . . . . . . . . . $1,624,354 $1,535,082
Liabilities and Stockholders’ EquityCurrent liabilities:
Accounts payable . . . . . . . . . . . . . . . . . . . . . . . . . . . . . . . . . . . . . . . . . . $ 41,171 $ 38,851Deferred revenue and returns liability . . . . . . . . . . . . . . . . . . . . . . . . . . . 22,494 —Deferred income on shipments to distributors . . . . . . . . . . . . . . . . . . . . . — 50,115Other current liabilities . . . . . . . . . . . . . . . . . . . . . . . . . . . . . . . . . . . . . 81,180 73,359
Total current liabilities . . . . . . . . . . . . . . . . . . . . . . . . . . . . . . . . . . . . . . . . 144,845 162,325Convertible debt . . . . . . . . . . . . . . . . . . . . . . . . . . . . . . . . . . . . . . . . . . . . 354,771 341,879Other non-current liabilities . . . . . . . . . . . . . . . . . . . . . . . . . . . . . . . . . . . . 57,448 77,862
Total liabilities . . . . . . . . . . . . . . . . . . . . . . . . . . . . . . . . . . . . . . . . . . . . . 557,064 582,066Commitments and contingenciesStockholders’ equity:
Preferred stock—$0.0001 par value; 10,000 shares authorized; no sharesissued . . . . . . . . . . . . . . . . . . . . . . . . . . . . . . . . . . . . . . . . . . . . . . . . — —
Common stock—$0.0001 par value; 250,000 shares authorized; 43,088 and42,707 shares issued and outstanding at December 29, 2018 andDecember 30, 2017, respectively . . . . . . . . . . . . . . . . . . . . . . . . . . . . . 4 4
Additional paid-in capital . . . . . . . . . . . . . . . . . . . . . . . . . . . . . . . . . . . . 107,517 102,862Retained earnings . . . . . . . . . . . . . . . . . . . . . . . . . . . . . . . . . . . . . . . . . 961,343 851,307Accumulated other comprehensive loss . . . . . . . . . . . . . . . . . . . . . . . . . . (1,574) (1,157)
Total stockholders’ equity . . . . . . . . . . . . . . . . . . . . . . . . . . . . . . . . . . . . . . 1,067,290 953,016
Total liabilities and stockholders’ equity . . . . . . . . . . . . . . . . . . . . . . . . . . . $1,624,354 $1,535,082
The accompanying notes are an integral part of these Consolidated Financial Statements.
F-3

Silicon Laboratories Inc.Consolidated Statements of Income
(In thousands, except per share data)
Year Ended
December 29, December 30, December 31,2018 2017 2016
Revenues . . . . . . . . . . . . . . . . . . . . . . . . . . . . . . . . . . . . . . . $868,267 $768,867 $697,626Cost of revenues . . . . . . . . . . . . . . . . . . . . . . . . . . . . . . . . . . 346,868 314,676 276,122
Gross margin . . . . . . . . . . . . . . . . . . . . . . . . . . . . . . . . . . . . 521,399 454,191 421,504Operating expenses:
Research and development . . . . . . . . . . . . . . . . . . . . . . . . . 238,347 209,491 199,744Selling, general and administrative . . . . . . . . . . . . . . . . . . . 197,844 159,726 155,483
Operating expenses . . . . . . . . . . . . . . . . . . . . . . . . . . . . . . . . 436,191 369,217 355,227
Operating income . . . . . . . . . . . . . . . . . . . . . . . . . . . . . . . . . 85,208 84,974 66,277Other income (expense):
Interest income and other, net . . . . . . . . . . . . . . . . . . . . . . 6,647 6,057 806Interest expense . . . . . . . . . . . . . . . . . . . . . . . . . . . . . . . . . (19,694) (14,128) (2,587)
Income before income taxes . . . . . . . . . . . . . . . . . . . . . . . . . . 72,161 76,903 64,496Provision (benefit) for income taxes . . . . . . . . . . . . . . . . . . . . (11,430) 29,811 3,002
Net income . . . . . . . . . . . . . . . . . . . . . . . . . . . . . . . . . . . . . . $ 83,591 $ 47,092 $ 61,494
Earnings per share:Basic . . . . . . . . . . . . . . . . . . . . . . . . . . . . . . . . . . . . . . . . . $ 1.94 $ 1.11 $ 1.47Diluted . . . . . . . . . . . . . . . . . . . . . . . . . . . . . . . . . . . . . . . $ 1.90 $ 1.09 $ 1.45
Weighted-average common shares outstanding:Basic . . . . . . . . . . . . . . . . . . . . . . . . . . . . . . . . . . . . . . . . . 43,159 42,446 41,713Diluted . . . . . . . . . . . . . . . . . . . . . . . . . . . . . . . . . . . . . . . 44,044 43,332 42,376
The accompanying notes are an integral part of these Consolidated Financial Statements.
F-4

Silicon Laboratories Inc.Consolidated Statements of Comprehensive Income
(In thousands)
Year Ended
December 29, December 30, December 31,2018 2017 2016
Net income . . . . . . . . . . . . . . . . . . . . . . . . . . . . . . . . . . . . . . $83,591 $47,092 $61,494
Other comprehensive income (loss), before tax:Net changes to available-for-sale securities:
Unrealized gains (losses) arising during the period . . . . . . 376 (729) (179)Reclassification for losses included in net income . . . . . . . 49 — —
Net changes to cash flow hedges:Unrealized gains (losses) arising during the period . . . . . . (953) — 1,466Reclassification for (gains) losses included in net income . . 316 (1,808) 249
Other comprehensive income (loss), before tax . . . . . . . . . . . . (212) (2,537) 1,536
Provision (benefit) for income taxes . . . . . . . . . . . . . . . . . . . . (45) (888) 537
Other comprehensive income (loss) . . . . . . . . . . . . . . . . . . . . (167) (1,649) 999
Comprehensive income . . . . . . . . . . . . . . . . . . . . . . . . . . . . . $83,424 $45,443 $62,493
The accompanying notes are an integral part of these Consolidated Financial Statements.
F-5

Silicon Laboratories Inc.Consolidated Statements of Changes in Stockholders’ Equity
(In thousands)
Common Stock AccumulatedAdditional Other Total
Number Par Paid-In Retained Comprehensive Stockholders’of Shares Value Capital Earnings Income (Loss) Equity
Balance as of January 2, 2016 . . . . 41,727 $ 4 $ 13,868 $747,749 $ (507) $ 761,114
Net income . . . . . . . . . . . . . . . . — — — 61,494 — 61,494Other comprehensive income
(loss) . . . . . . . . . . . . . . . . . . . — — — — 999 999Stock issuances, net of shares
withheld for taxes . . . . . . . . . . 1,055 — 6,346 — — 6,346Income tax benefit (shortfall)
from stock-based awards . . . . . — — (2,061) — — (2,061)Repurchases of common stock . . (893) — (33,299) (7,244) — (40,543)Stock-based compensation . . . . . — — 39,609 — — 39,609
Balance as of December 31, 2016 . . 41,889 4 24,463 801,999 492 826,958
Cumulative effect of adoption ofaccounting standard . . . . . . . . — — — 2,216 — 2,216
Net income . . . . . . . . . . . . . . . . — — — 47,092 — 47,092Other comprehensive income
(loss) . . . . . . . . . . . . . . . . . . . — — — — (1,649) (1,649)Stock issuances, net of shares
withheld for taxes . . . . . . . . . . 818 — (3,938) — — (3,938)Stock-based compensation . . . . . — — 44,809 — — 44,809Convertible debt issuance . . . . . . — — 37,528 — — 37,528
Balance as of December 30, 2017 . . 42,707 4 102,862 851,307 (1,157) 953,016
Cumulative effect of adoption ofaccounting standard . . . . . . . . — — — 26,445 (250) 26,195
Net income . . . . . . . . . . . . . . . . — — — 83,591 — 83,591Other comprehensive income
(loss) . . . . . . . . . . . . . . . . . . . — — — — (167) (167)Stock issuances, net of shares
withheld for taxes . . . . . . . . . . 815 — (6,180) — — (6,180)Repurchases of common stock . . (434) — (39,276) — — (39,276)Stock-based compensation . . . . . — — 50,111 — — 50,111
Balance as of December 29, 2018 . . 43,088 $ 4 $107,517 $961,343 $(1,574) $1,067,290
The accompanying notes are an integral part of these Consolidated Financial Statements.
F-6

Silicon Laboratories Inc.Consolidated Statements of Cash Flows
(In thousands)
Year Ended
December 29, December 30, December 31,2018 2017 2016
Operating ActivitiesNet income . . . . . . . . . . . . . . . . . . . . . . . . . . . . . . . . . . . . . . . . . . $ 83,591 $ 47,092 $ 61,494Adjustments to reconcile net income to cash provided by operating
activities:Depreciation of property and equipment . . . . . . . . . . . . . . . . . . . . . 15,912 14,766 13,216Amortization of other intangible assets and other assets . . . . . . . . . . . 44,102 27,246 27,715Amortization of debt discount and debt issuance costs . . . . . . . . . . . . 12,892 10,146 —Stock-based compensation expense . . . . . . . . . . . . . . . . . . . . . . . . . 50,077 44,752 39,628Income tax shortfall from stock-based awards . . . . . . . . . . . . . . . . . . — — (1,671)Deferred income taxes . . . . . . . . . . . . . . . . . . . . . . . . . . . . . . . . . (8,210) (26,452) (4,087)Changes in operating assets and liabilities:
Accounts receivable . . . . . . . . . . . . . . . . . . . . . . . . . . . . . . . . . 3,931 3,234 46Inventories . . . . . . . . . . . . . . . . . . . . . . . . . . . . . . . . . . . . . . . 7,660 (13,416) (6,093)Prepaid expenses and other assets . . . . . . . . . . . . . . . . . . . . . . . . (4,960) 25,266 (3,568)Accounts payable . . . . . . . . . . . . . . . . . . . . . . . . . . . . . . . . . . . 5,952 (468) 263Other current liabilities and income taxes . . . . . . . . . . . . . . . . . . . (21,828) 61,924 2,879Deferred income, deferred revenue and returns liability . . . . . . . . . . (6,202) 4,453 9,713Other non-current liabilities . . . . . . . . . . . . . . . . . . . . . . . . . . . . (9,375) (9,022) (10,625)
Net cash provided by operating activities . . . . . . . . . . . . . . . . . . . . . . 173,542 189,521 128,910
Investing ActivitiesPurchases of available-for-sale investments . . . . . . . . . . . . . . . . . . . . . (395,904) (636,363) (185,231)Sales and maturities of available-for-sale investments . . . . . . . . . . . . . . 474,129 294,452 161,921Purchases of property and equipment . . . . . . . . . . . . . . . . . . . . . . . . (24,462) (12,252) (10,927)Purchases of other assets . . . . . . . . . . . . . . . . . . . . . . . . . . . . . . . . . (11,063) (4,960) (8,801)Acquisitions of businesses, net of cash acquired . . . . . . . . . . . . . . . . . . (239,729) (15,168) (6,546)
Net cash used in investing activities . . . . . . . . . . . . . . . . . . . . . . . . . . (197,029) (374,291) (49,584)
Financing ActivitiesProceeds from issuance of long-term debt, net . . . . . . . . . . . . . . . . . . . — 389,468 —Payments on debt . . . . . . . . . . . . . . . . . . . . . . . . . . . . . . . . . . . . . . — (72,500) (5,000)Repurchases of common stock . . . . . . . . . . . . . . . . . . . . . . . . . . . . . (39,276) — (40,543)Payment of taxes withheld for vested stock awards . . . . . . . . . . . . . . . . (19,483) (15,753) (10,561)Proceeds from the issuance of common stock . . . . . . . . . . . . . . . . . . . 13,303 11,815 13,299Payment of acquisition-related contingent consideration . . . . . . . . . . . . . (3,380) — (9,500)
Net cash provided by (used in) financing activities . . . . . . . . . . . . . . . . (48,836) 313,030 (52,305)
Increase (decrease) in cash and cash equivalents . . . . . . . . . . . . . . . . . (72,323) 128,260 27,021Cash and cash equivalents at beginning of period . . . . . . . . . . . . . . . . . 269,366 141,106 114,085
Cash and cash equivalents at end of period . . . . . . . . . . . . . . . . . . . . . $ 197,043 $ 269,366 $ 141,106
Supplemental Disclosure of Cash Flow Information:Interest paid . . . . . . . . . . . . . . . . . . . . . . . . . . . . . . . . . . . . . . . . . $ 6,227 $ 3,859 $ 2,222
Income taxes paid . . . . . . . . . . . . . . . . . . . . . . . . . . . . . . . . . . . . . $ 20,599 $ 8,929 $ 11,185
Supplemental Disclosure of Non-Cash Activity:Stock issued in business combination . . . . . . . . . . . . . . . . . . . . . . . . . $ — $ — $ 4,181
The accompanying notes are an integral part of these Consolidated Financial Statements.
F-7

Silicon Laboratories Inc.Notes to Consolidated Financial Statements
December 29, 2018
1. Description of Business
Silicon Laboratories Inc. (the ‘‘Company’’), a Delaware corporation, is a leading provider ofsilicon, software and solutions for a smarter, more connected world. Our award-winning technologiesare shaping the future of the Internet of Things (IoT), Internet infrastructure, industrial automation,consumer and automotive markets. Within the semiconductor industry, the Company is known as a‘‘fabless’’ company meaning that the integrated circuits (ICs) incorporated in its products aremanufactured by third-party foundry semiconductor companies.
2. Significant Accounting Policies
Basis of Presentation and Principles of Consolidation
The Company prepares financial statements on a 52- or 53-week fiscal year that ends on theSaturday closest to December 31. Fiscal 2018, 2017 and 2016 had 52 weeks and ended onDecember 29, 2018, December 30, 2017 and December 31, 2016, respectively. The accompanyingConsolidated Financial Statements include the accounts of the Company and its wholly ownedsubsidiaries. All significant intercompany balances and transactions have been eliminated inconsolidation.
Foreign Currency Transactions
The Company’s foreign subsidiaries are considered to be extensions of the U.S. Company. Thefunctional currency of the foreign subsidiaries is the U.S. dollar. Accordingly, gains and losses resultingfrom remeasuring transactions denominated in currencies other than U.S. dollars are included ininterest income and other, net in the Consolidated Statements of Income.
Use of Estimates
The preparation of financial statements in conformity with accounting principles generally acceptedin the United States requires management to make estimates and assumptions that affect the amountsreported in the financial statements and accompanying notes. Among the significant estimates affectingthe financial statements are those related to inventories, goodwill, acquired intangible assets, otherlong-lived assets, revenue recognition, stock-based compensation and income taxes. Actual results coulddiffer from those estimates, and such differences could be material to the financial statements.
Adoption of New Revenue Accounting Standard
The Company adopted Accounting Standards Codification (ASC) Topic 606, Revenue fromContracts with Customers, on December 31, 2017, the first day of its fiscal year ended December 29,2018. The Company elected the modified retrospective method of adoption which only applies to thosecontracts which were not completed as of December 31, 2017. Prior periods have not been adjusted. Inconnection with its adoption of ASC 606, the Company recorded a cumulative-effect adjustment to
F-8

Silicon Laboratories Inc.Notes to Consolidated Financial Statements
December 29, 2018 (Continued)
2. Significant Accounting Policies (Continued)
retained earnings of $26.2 million on December 31, 2017. The following reflects the material changesrecorded in connection with the cumulative-effect adjustment (in thousands):
IncreaseFinancial Statement Line Item (Decrease)
Accounts receivable, net . . . . . . . . . . . . . . . . . . . . . . . . . . . . . . . . . . . . . $ 230Prepaid expenses and other current assets . . . . . . . . . . . . . . . . . . . . . . . . $ 7,579Other assets, net . . . . . . . . . . . . . . . . . . . . . . . . . . . . . . . . . . . . . . . . . . $ (2,282)Deferred revenue and returns liability . . . . . . . . . . . . . . . . . . . . . . . . . . . $ 27,806Deferred income on shipments to distributors . . . . . . . . . . . . . . . . . . . . . $(50,115)Other current liabilities . . . . . . . . . . . . . . . . . . . . . . . . . . . . . . . . . . . . . $ 1,641Retained earnings . . . . . . . . . . . . . . . . . . . . . . . . . . . . . . . . . . . . . . . . . $ 26,195
The following presents the amounts by which financial statement line items were affected in thecurrent period due to the adoption of ASC 606 (in thousands):
IncreaseFinancial Statement Line Item* (Decrease)
Year EndedDecember 29,
Consolidated Statements of Income 2018
Revenues . . . . . . . . . . . . . . . . . . . . . . . . . . . . . . . . . . . . . . . . . . . . . . $ 12,943Cost of revenues . . . . . . . . . . . . . . . . . . . . . . . . . . . . . . . . . . . . . . . . $ 4,234Net income . . . . . . . . . . . . . . . . . . . . . . . . . . . . . . . . . . . . . . . . . . . . $ 6,610Earnings per share:
Basic . . . . . . . . . . . . . . . . . . . . . . . . . . . . . . . . . . . . . . . . . . . . . . . $ 0.15Diluted . . . . . . . . . . . . . . . . . . . . . . . . . . . . . . . . . . . . . . . . . . . . . $ 0.15
December 29,Consolidated Balance Sheet** 2018
Prepaid expenses and other current assets . . . . . . . . . . . . . . . . . . . . . . $ 5,953Goodwill . . . . . . . . . . . . . . . . . . . . . . . . . . . . . . . . . . . . . . . . . . . . . . $ (2,842)Other assets, net . . . . . . . . . . . . . . . . . . . . . . . . . . . . . . . . . . . . . . . . $ (4,464)Deferred revenue and returns liability . . . . . . . . . . . . . . . . . . . . . . . . . $ 22,494Deferred income on shipments to distributors . . . . . . . . . . . . . . . . . . . $(60,789)Other current liabilities . . . . . . . . . . . . . . . . . . . . . . . . . . . . . . . . . . . . $ 4,282Retained earnings . . . . . . . . . . . . . . . . . . . . . . . . . . . . . . . . . . . . . . . $ 32,805
* Excludes line items that were not materially affected by the Company’s adoption ofASC 606. The adoption had no impact to cash provided by or used in net operating,investing or financing activities in the Consolidated Statements of Cash Flows.
** Balance sheet line item amounts include the cumulative-effect adjustment recorded onDecember 31, 2017.
The primary impact of the Company’s adoption of ASC 606 resulted from the acceleration of thetiming of revenue recognition on sales to distributors. The Company previously deferred revenue and
F-9
Silicon Laboratories Inc.Notes to Consolidated Financial Statements
December 29, 2018 (Continued)
2. Significant Accounting Policies (Continued)
cost of revenue on such sales until the distributors sold the product to the end customers. TheCompany now recognizes revenue at the time of sale to the distributor provided all other revenuerecognition criteria have been met. The Company records a right of return asset and a returns liabilityin place of the deferred income on shipments to distributors previously recorded under ASC 605.
Fair Value of Financial Instruments
The fair values of the Company’s financial instruments are recorded using a hierarchical disclosureframework based upon the level of subjectivity of the inputs used in measuring assets and liabilities.The three levels are described below:
Level 1—Inputs are unadjusted, quoted prices in active markets for identical assets or liabilities atthe measurement date.
Level 2—Inputs are inputs other than quoted prices included within Level 1 that are observablefor the asset or liability, either directly or indirectly.
Level 3—Inputs are unobservable for the asset or liability and are developed based on the bestinformation available in the circumstances, which might include the Company’s own data.
Cash and Cash Equivalents
Cash and cash equivalents consist of cash deposits, certificates of deposit, money market funds andinvestments in debt securities with original maturities of ninety days or less when purchased.
Investments
The Company’s investments typically have original maturities greater than ninety days as of thedate of purchase and are classified as either available-for-sale or trading securities. Investments inavailable-for-sale securities are reported at fair value, with unrealized gains and losses, net of tax,recorded as a component of accumulated other comprehensive loss in the Consolidated Balance Sheet.Investments in trading securities are reported at fair value, with both realized and unrealized gains andlosses recorded in interest income and other, net in the Consolidated Statement of Income.Investments in which the Company has the ability and intent, if necessary, to liquidate in order tosupport its current operations (including those with contractual maturities greater than one year fromthe date of purchase) are classified as short-term.
The Company reviews its available-for-sale investments as of the end of each reporting period forother-than-temporary declines in fair value based on the specific identification method. The Companyconsiders various factors in determining whether an impairment is other-than-temporary, including theseverity and duration of the impairment, changes in underlying credit ratings, forecasted recovery, itsintent to sell or the likelihood that it would be required to sell the investment before its anticipatedrecovery in market value and the probability that the scheduled cash payments will continue to bemade. When the Company concludes that an other-than-temporary impairment has occurred, theCompany assesses whether it intends to sell the security or if it is more likely than not that it will berequired to sell the security before recovery. If either of these two conditions is met, the Companyrecognizes a charge in earnings equal to the entire difference between the security’s amortized costbasis and its fair value. If the Company does not intend to sell a security and it is not more likely than
F-10

Silicon Laboratories Inc.Notes to Consolidated Financial Statements
December 29, 2018 (Continued)
2. Significant Accounting Policies (Continued)
not that it will be required to sell the security before recovery, the unrealized loss is separated into anamount representing the credit loss, which is recognized in earnings, and the amount related to allother factors, which is recorded in accumulated other comprehensive loss.
In addition, the Company has made equity investments in non-publicly traded companies. Equityinvestments in which the Company does not have control, but has the ability to exercise significantinfluence over operating and financial policies, are accounted for using the equity method. TheCompany’s proportionate share of income or loss is recorded in interest income and other, net in theConsolidated Statement of Income. All other non-marketable equity investments are recorded at costminus impairment, if any, plus or minus changes resulting from qualifying observable price changes.Prior to fiscal 2018, all other non-marketable equity investments were accounted for using the costmethod. The Company periodically reviews its equity investments for other-than-temporary declines infair value based on the specific identification method and writes down investments to their fair valueswhen it determines that an other-than-temporary decline has occurred.
Derivative Financial Instruments
The Company uses derivative financial instruments to manage certain exposures to the variabilityof foreign currency exchange rates and interest rates. The Company’s objective is to offset increasesand decreases in expenses resulting from these exposures with gains and losses on the derivativecontracts, thereby reducing volatility of earnings. The Company does not use derivative contracts forspeculative or trading purposes. The Company recognizes derivatives, on a gross basis, in theConsolidated Balance Sheet at fair value. Cash flows from derivatives are classified according to thenature of the cash receipt or payment in the Consolidated Statement of Cash Flows.
Cash flow hedges used by the Company include foreign currency forward contracts and interestrate swap agreements. Foreign currency forward contracts are used to reduce the earnings impact thatexchange rate fluctuations have on operating expenses denominated in currencies other than the U.S.dollar. Interest rate swap agreements are used to manage exposure to interest rate risks.
The Company also uses foreign currency forward contracts to reduce the earnings impact thatexchange rate fluctuations have on non-U.S. dollar balance sheet exposures. The Company does notapply hedge accounting to these foreign currency forward contracts.
Inventories
Inventories are stated at the lower of cost, determined using the first-in, first-out method, or netrealizable value. The Company writes down the carrying value of inventory to net realizable value forestimated obsolescence or unmarketable inventory based upon assumptions about the age of inventory,future demand and market conditions. Inventory impairment charges establish a new cost basis forinventory and charges are not subsequently reversed to income even if circumstances later suggest thatincreased carrying amounts are recoverable.
Property and Equipment
Property and equipment are stated at cost, net of accumulated depreciation. Depreciation iscomputed using the straight-line method over the useful lives of the assets ranging from three to ten
F-11

Silicon Laboratories Inc.Notes to Consolidated Financial Statements
December 29, 2018 (Continued)
2. Significant Accounting Policies (Continued)
years. Leasehold improvements are depreciated over the lease term or their useful life, whichever isshorter.
The Company owns the facilities it had previously leased for its headquarters in Austin, Texas. Thebuildings are located on land which is leased through 2099 from a third party. The rents for theseground leases were prepaid for the term of the leases by the previous lessee. The buildings andleasehold interest in ground leases are being depreciated on a straight-line basis over their estimateduseful lives of 40 years and 86 years, respectively.
Business Combinations
The Company records business combinations using the acquisition method of accounting and,accordingly, allocates the fair value of purchase consideration to the assets acquired and liabilitiesassumed based on their fair values at the acquisition date. The excess of the fair value of purchaseconsideration over the fair value of the assets acquired and liabilities assumed is recorded as goodwill.The results of operations of the businesses acquired are included in the Company’s consolidated resultsof operations beginning on the date of the acquisition.
Long-Lived Assets
Purchased intangible assets are stated at cost, net of accumulated amortization, and are amortizedusing the straight-line method over their estimated useful lives, ranging from three to twelve years. Fairvalues are determined primarily using the income approach, in which the Company projects futureexpected cash flows and applies an appropriate discount rate.
Long-lived assets ‘‘held and used’’ by the Company are reviewed for impairment whenever eventsor changes in circumstances indicate that their net book value may not be recoverable. When suchfactors and circumstances exist, the Company compares the projected undiscounted future cash flowsassociated with the related asset or group of assets over their estimated useful lives against theirrespective carrying amounts. Impairment, if any, is based on the excess of the carrying amount over thefair value of those assets and is recorded in the period in which the determination was made.
The carrying value of goodwill is reviewed at least annually by the Company for possibleimpairment. The goodwill impairment test is a two-step process. The first step of the impairmentanalysis compares the fair value of the reporting unit to the net book value of the reporting unit. Indetermining fair value, several valuation methodologies are allowed, although quoted market prices arethe best evidence of fair value. If the results of the first step demonstrate that the net book value isgreater than the fair value, the Company must proceed to step two of the analysis. Step two of theanalysis compares the implied fair value of goodwill to its carrying amount. If the carrying amount ofgoodwill exceeds its implied fair value, an impairment loss is recognized equal to that excess. TheCompany tests goodwill for impairment annually as of the first day of its fourth fiscal quarter and ininterim periods if events occur that would indicate that the carrying value of goodwill may be impaired.
F-12

Silicon Laboratories Inc.Notes to Consolidated Financial Statements
December 29, 2018 (Continued)
2. Significant Accounting Policies (Continued)
Revenue Recognition
Revenue is recognized when control of the promised goods or services is transferred to customers,in an amount that reflects the consideration the Company expects to be entitled to in exchange forthose goods or services.
Performance Obligations
Substantially all of the Company’s contracts with customers contain a single performanceobligation, the sale of mixed-signal integrated circuit (IC) products. Such sales represent a singleperformance obligation because the sale is one type of good (e.g., an IC) or includes multiple goodsthat are neither capable of being distinct nor separable from the other promises in the contract(e.g., an IC embedded with software). This performance obligation is satisfied when control of theproduct is transferred to the customer, which typically occurs upon delivery. Unsatisfied performanceobligations primarily represent contracts for products with future delivery dates and with an originalexpected duration of one year or less. As allowed under ASC 606, the Company has opted to notdisclose the amount of unsatisfied performance obligations as these contracts have original expecteddurations of less than one year.
The Company’s products carry a one-year replacement warranty. The replacement warrantypromises customers that delivered products are as specified in the contract (an ‘‘assurance-typewarranty’’). Therefore, the Company accounts for such warranties under ASC 460, Guarantees, and notas a separate performance obligation.
Transaction Price
The transaction price reflects the Company’s expectations about the consideration it will beentitled to receive from the customer and may include fixed or variable amounts. Fixed considerationprimarily includes sales to direct customers and sales to distributors in which both the sale to thedistributor and the sale to the end customer occur within the same reporting period. Variableconsideration includes sales in which the amount of consideration that the Company will receive isunknown as of the end of a reporting period. Such consideration primarily includes sales made todistributors under agreements allowing certain rights of return, referred to as stock rotation, and creditsissued to the distributor due to price protection. Stock rotation allows distributors limited levels ofreturns and is based on the distributor’s prior purchases. Price protection represents price discountsgranted to certain distributors and is based on negotiations on sales to end customers.
The Company estimates variable consideration at the most likely amount to which it expects to beentitled. Included in the transaction price estimate are amounts in which it is probable that a significantreversal of cumulative revenue recognized will not occur when the uncertainty associated with thevariable consideration is subsequently resolved. The estimate is based on information available to theCompany, including recent sales activity and pricing data. The Company applies a constraint to itsvariable consideration estimate which considers both the likelihood of a return and the amount of apotential price concession.
Variable consideration that does not meet revenue recognition criteria is deferred. The Companyrecords a right of return asset in prepaid expenses and other current assets for the costs of distributor
F-13

Silicon Laboratories Inc.Notes to Consolidated Financial Statements
December 29, 2018 (Continued)
2. Significant Accounting Policies (Continued)
inventory not meeting revenue recognition criteria. A corresponding deferred revenue and returnsliability amount is recorded for unrecognized revenue associated with such costs.
Contract Balances
Accounts receivable represents the Company’s unconditional right to receive consideration from itscustomer. Payments are typically due within 30 days of invoicing and do not include a significantfinancing component. To date, there have been no material impairment losses on accounts receivable.There were no material contract assets or contract liabilities recorded on the Consolidated BalanceSheet in any of the periods presented.
Shipping and Handling
Shipping and handling costs are classified as a component of cost of revenues in the ConsolidatedStatements of Income.
Stock-Based Compensation
The Company has stock-based compensation plans, which are more fully described in Note 14,Stock-Based Compensation. The Company accounts for those plans using a fair-value method andrecognizes the expense in its Consolidated Statement of Income.
Research and Development
Research and development costs are expensed as incurred. Research and development expenseconsists primarily of personnel-related expenses, including stock-based compensation, as well as newproduct masks, external consulting and services costs, equipment tooling, equipment depreciation,amortization of intangible assets, and an allocated portion of our occupancy costs. Assets purchased tosupport the Company’s ongoing research and development activities are capitalized when related toproducts which have achieved technological feasibility or have an alternative future use, and areamortized over their estimated useful lives.
Advertising
Advertising costs are expensed as incurred. Advertising expenses were $1.9 million, $1.4 millionand $1.6 million in fiscal 2018, 2017 and 2016, respectively.
Income Taxes
The Company accounts for income taxes using the asset and liability method whereby deferred taxasset and liability account balances are determined based on differences between the financial reportingand the tax bases of assets and liabilities and are measured using the enacted tax laws and related ratesthat will be in effect when the differences are expected to reverse. These differences result in deferredtax assets and liabilities, which are included in the Company’s Consolidated Balance Sheet. TheCompany then assesses the likelihood that the deferred tax assets will be realized. A valuationallowance is established against deferred tax assets to the extent the Company believes that it is morelikely than not that the deferred tax assets will not be realized, taking into consideration the level of
F-14

Silicon Laboratories Inc.Notes to Consolidated Financial Statements
December 29, 2018 (Continued)
2. Significant Accounting Policies (Continued)
historical taxable income and projections for future taxable income over the periods in which thetemporary differences are deductible.
Uncertain tax positions must meet a more-likely-than-not threshold to be recognized in thefinancial statements and the tax benefits recognized are measured based on the largest benefit that hasa greater than 50% likelihood of being realized upon final settlement. See Note 17, Income Taxes, foradditional information.
Recent Accounting Pronouncements
In February 2018, the Financial Accounting Standards Board (FASB) issued Accounting StandardsUpdate (ASU) No. 2018-02, Income Statement—Reporting Comprehensive Income (Topic 220):Reclassification of Certain Tax Effects from Accumulated Other Comprehensive Income. This ASU allowsa reclassification from accumulated other comprehensive income to retained earnings for stranded taxeffects resulting from the Tax Cuts and Jobs Act. The Company early adopted this ASU onDecember 31, 2017. The adoption did not have a material impact on its financial statements.
In August 2017, the FASB issued ASU No. 2017-12, Derivatives and Hedging (Topic 815): TargetedImprovements to Accounting for Hedging Activities. The objectives of this ASU are to improve thefinancial reporting of hedging relationships to better portray the economic results of an entity’s riskmanagement activities in its financial statements and to make certain targeted improvements to simplifythe application of the hedge accounting guidance in current GAAP. This ASU is effective for fiscalyears beginning after December 15, 2018 and interim periods within those fiscal years. The Companyearly adopted this ASU on December 31, 2017. The adoption did not have a material impact on itsfinancial statements.
In January 2017, the FASB issued ASU No. 2017-04, Intangibles—Goodwill and Other (Topic 350):Simplifying the Test for Goodwill Impairment. This ASU eliminates Step 2 from the goodwill impairmenttest, which previously measured an impairment loss by comparing the implied fair value of goodwillwith its carrying amount. Instead, an entity should recognize an impairment charge for the amount bywhich the carrying value exceeds the reporting unit’s fair value, not to exceed the total amount ofgoodwill allocated to that reporting unit. This ASU is effective for annual or any interim goodwillimpairment tests in fiscal years beginning after December 15, 2019. The Company is currentlyevaluating the effect of the adoption of this ASU, but anticipates that the adoption will not have amaterial impact on its financial statements.
In June 2016, the FASB issued ASU No. 2016-13, Financial Instruments—Credit Losses (Topic 326):Measurement of Credit Losses on Financial Instruments. This ASU requires instruments measured atamortized cost to be presented at the net amount expected to be collected. Entities are also required torecord allowances for available-for-sale debt securities rather than reduce the carrying amount. ThisASU is effective for fiscal years beginning after December 15, 2019, including interim periods withinthose fiscal years. The Company expects that the adoption will not have a material impact on itsfinancial statements.
In February 2016, the FASB issued ASU No. 2016-02, Leases, which was subsequently amended in2018 by ASU 2018-10, ASU 2018-11 and ASU 2018-20 (collectively, Topic 842). The core principle ofTopic 842 is that a lessee should recognize the assets and liabilities that arise from leases. For operating
F-15

Silicon Laboratories Inc.Notes to Consolidated Financial Statements
December 29, 2018 (Continued)
2. Significant Accounting Policies (Continued)
leases, a lessee is required to recognize a right-of-use asset and a lease liability, initially measured atthe present value of the lease payments, in the statement of financial position. Topic 842 is effective forfiscal years beginning after December 15, 2018, including interim periods within those fiscal years. TheCompany will elect an optional transition method to account for the impact of the adoption with acumulative-effect adjustment in the period of adoption and will not restate prior periods. The Companyexpects to elect certain practical expedients permitted under the transition guidance. The Company issubstantially complete with its evaluation of the effect that the adoption of this ASU will have on itsfinancial statements. The Company believes that most of its operating lease commitments will besubject to the new standard. In connection with the adoption of ASC 842, the Company expects torecognize additional right-of-use assets and operating lease liabilities of $20.8 million on December 30,2018.
3. Earnings Per Share
The following table sets forth the computation of basic and diluted earnings per share (inthousands, except per share data):
Year Ended
December 29, December 30, December 31,2018 2017 2016
Net income . . . . . . . . . . . . . . . . . . . . . . . . . . . . . . . . . . . . . . $83,591 $47,092 $61,494
Shares used in computing basic earnings per share . . . . . . . . . 43,159 42,446 41,713
Effect of dilutive securities:Stock-based awards . . . . . . . . . . . . . . . . . . . . . . . . . . . . . . 885 886 663
Shares used in computing diluted earnings per share . . . . . . . . 44,044 43,332 42,376
Earnings per share:Basic . . . . . . . . . . . . . . . . . . . . . . . . . . . . . . . . . . . . . . . . . $ 1.94 $ 1.11 $ 1.47Diluted . . . . . . . . . . . . . . . . . . . . . . . . . . . . . . . . . . . . . . . $ 1.90 $ 1.09 $ 1.45
The Company intends to settle the principal amount of its convertible senior notes in cash and anyexcess value in shares in the event of a conversion. Accordingly, shares issuable upon conversion of theprincipal amount have been excluded from the calculation of diluted earnings per share. If the marketvalue of the notes under certain prescribed conditions exceeds the conversion amount, the excess isincluded in the denominator for the computation of diluted earnings per share using the treasury stockmethod. For fiscal 2018, approximately 0.1 million shares were included in the denominator for thecalculation of diluted earnings per share. For fiscal 2017, no such shares were included in thedenominator for the calculation of diluted earnings per share. See Note 10, Debt, to the ConsolidatedFinancial Statements for additional information.
F-16

Silicon Laboratories Inc.Notes to Consolidated Financial Statements
December 29, 2018 (Continued)
4. Fair Value of Financial Instruments
The following summarizes the valuation of the Company’s financial instruments (in thousands).The tables do not include either cash on hand or assets and liabilities that are measured at historicalcost or any basis other than fair value.
Fair Value Measurementsat December 29, 2018 Using
Quoted Prices in Significant Other SignificantActive Markets for Observable Unobservable
Identical Assets Inputs InputsDescription (Level 1) (Level 2) (Level 3) Total
Assets:Cash equivalents:
Money market funds . . . . . . . . . . . . . . . . $ 74,990 $ — $ — $ 74,990Corporate debt securities . . . . . . . . . . . . . — 18,820 — 18,820Government debt securities . . . . . . . . . . . 9,338 — — 9,338
Total cash equivalents . . . . . . . . . . . . . . . . . $ 84,328 $ 18,820 $ — $103,148
Short-term investments:Government debt securities . . . . . . . . . . . $ 48,141 $ 99,211 $ — $147,352Corporate debt securities . . . . . . . . . . . . . — 269,427 — 269,427
Total short-term investments . . . . . . . . . . . . $ 48,141 $368,638 $ — $416,779
Other assets, net:Auction rate securities . . . . . . . . . . . . . . . $ — $ — $5,759 $ 5,759
Total . . . . . . . . . . . . . . . . . . . . . . . . . . . . . $ — $ — $5,759 $ 5,759
Total . . . . . . . . . . . . . . . . . . . . . . . . . . . . . $132,469 $387,458 $5,759 $525,686
F-17

Silicon Laboratories Inc.Notes to Consolidated Financial Statements
December 29, 2018 (Continued)
4. Fair Value of Financial Instruments (Continued)
Fair Value Measurementsat December 30, 2017 Using
Quoted Prices in Significant Other SignificantActive Markets for Observable Unobservable
Identical Assets Inputs InputsDescription (Level 1) (Level 2) (Level 3) Total
Assets:Cash equivalents:
Money market funds . . . . . . . . . . . . . . . . $106,047 $ — $ — $106,047Corporate debt securities . . . . . . . . . . . . . — 11,231 — 11,231Government debt securities . . . . . . . . . . . 53,615 1,453 — 55,068
Total cash equivalents . . . . . . . . . . . . . . . . . $159,662 $ 12,684 $ — $172,346
Short-term investments:Government debt securities . . . . . . . . . . . $ 94,575 $228,247 $ — $322,822Corporate debt securities . . . . . . . . . . . . . — 171,835 — 171,835
Total short-term investments . . . . . . . . . . . . $ 94,575 $400,082 $ — $494,657
Other assets, net:Auction rate securities . . . . . . . . . . . . . . . $ — $ — $5,681 $ 5,681
Total . . . . . . . . . . . . . . . . . . . . . . . . . . . . . $ — $ — $5,681 $ 5,681
Total . . . . . . . . . . . . . . . . . . . . . . . . . . . . . $254,237 $412,766 $5,681 $672,684
Valuation methodology
The Company’s cash equivalents and short-term investments that are classified as Level 2 arevalued using non-binding market consensus prices that are corroborated with observable market data;quoted market prices for similar instruments in active markets; or pricing models, such as a discountedcash flow model, with all significant inputs derived from or corroborated with observable market data.Investments classified as Level 3 are valued using a discounted cash flow model. The assumptions usedin preparing the discounted cash flow model include estimates for interest rates, amount of cash flows,expected holding periods of the securities and a discount to reflect the Company’s inability to liquidatethe securities. The Company’s derivative instruments are valued using discounted cash flow models. Theassumptions used in preparing the valuation models include foreign exchange rates, forward and spotprices for currencies, and market observable data of similar instruments.
Available-for-sale investments
The Company’s investments are reported at fair value, with unrealized gains and losses, net of tax,recorded as a component of accumulated other comprehensive loss in the Consolidated Balance Sheet.
F-18
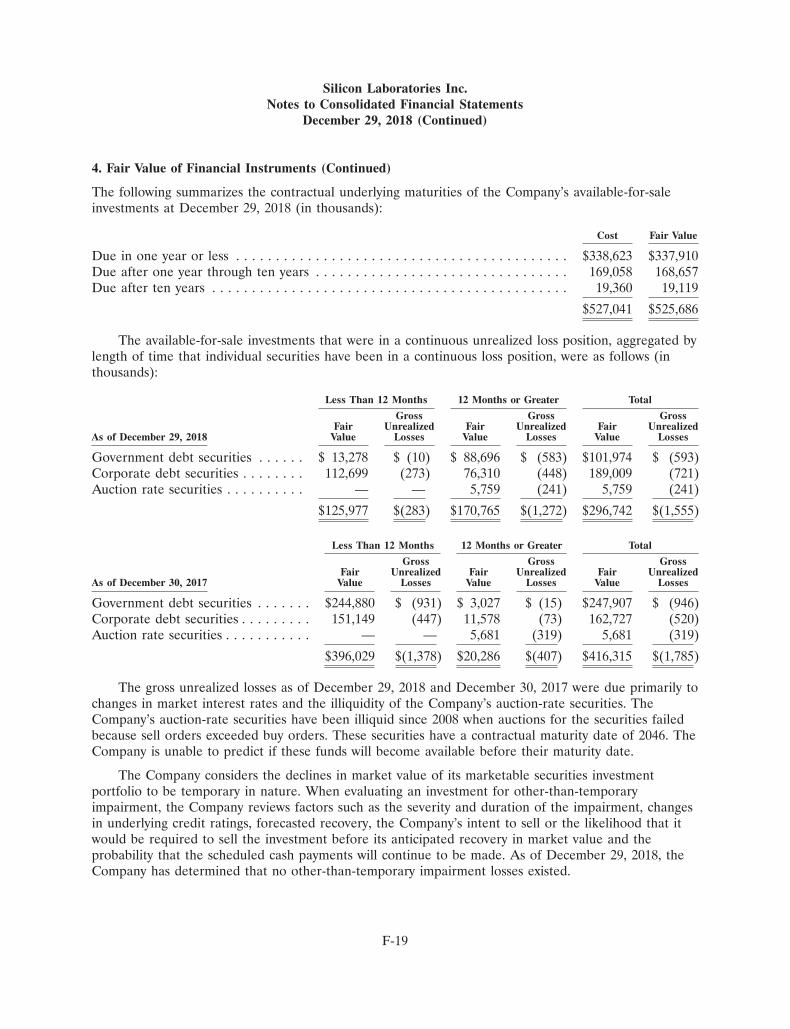
Silicon Laboratories Inc.Notes to Consolidated Financial Statements
December 29, 2018 (Continued)
4. Fair Value of Financial Instruments (Continued)
The following summarizes the contractual underlying maturities of the Company’s available-for-saleinvestments at December 29, 2018 (in thousands):
Cost Fair Value
Due in one year or less . . . . . . . . . . . . . . . . . . . . . . . . . . . . . . . . . . . . . . . . . . $338,623 $337,910Due after one year through ten years . . . . . . . . . . . . . . . . . . . . . . . . . . . . . . . . 169,058 168,657Due after ten years . . . . . . . . . . . . . . . . . . . . . . . . . . . . . . . . . . . . . . . . . . . . . 19,360 19,119
$527,041 $525,686
The available-for-sale investments that were in a continuous unrealized loss position, aggregated bylength of time that individual securities have been in a continuous loss position, were as follows (inthousands):
Less Than 12 Months 12 Months or Greater Total
Gross Gross GrossFair Unrealized Fair Unrealized Fair Unrealized
As of December 29, 2018 Value Losses Value Losses Value Losses
Government debt securities . . . . . . $ 13,278 $ (10) $ 88,696 $ (583) $101,974 $ (593)Corporate debt securities . . . . . . . . 112,699 (273) 76,310 (448) 189,009 (721)Auction rate securities . . . . . . . . . . — — 5,759 (241) 5,759 (241)
$125,977 $(283) $170,765 $(1,272) $296,742 $(1,555)
Less Than 12 Months 12 Months or Greater Total
Gross Gross GrossFair Unrealized Fair Unrealized Fair Unrealized
As of December 30, 2017 Value Losses Value Losses Value Losses
Government debt securities . . . . . . . $244,880 $ (931) $ 3,027 $ (15) $247,907 $ (946)Corporate debt securities . . . . . . . . . 151,149 (447) 11,578 (73) 162,727 (520)Auction rate securities . . . . . . . . . . . — — 5,681 (319) 5,681 (319)
$396,029 $(1,378) $20,286 $(407) $416,315 $(1,785)
The gross unrealized losses as of December 29, 2018 and December 30, 2017 were due primarily tochanges in market interest rates and the illiquidity of the Company’s auction-rate securities. TheCompany’s auction-rate securities have been illiquid since 2008 when auctions for the securities failedbecause sell orders exceeded buy orders. These securities have a contractual maturity date of 2046. TheCompany is unable to predict if these funds will become available before their maturity date.
The Company considers the declines in market value of its marketable securities investmentportfolio to be temporary in nature. When evaluating an investment for other-than-temporaryimpairment, the Company reviews factors such as the severity and duration of the impairment, changesin underlying credit ratings, forecasted recovery, the Company’s intent to sell or the likelihood that itwould be required to sell the investment before its anticipated recovery in market value and theprobability that the scheduled cash payments will continue to be made. As of December 29, 2018, theCompany has determined that no other-than-temporary impairment losses existed.
F-19

Silicon Laboratories Inc.Notes to Consolidated Financial Statements
December 29, 2018 (Continued)
4. Fair Value of Financial Instruments (Continued)
At December 29, 2018 and December 30, 2017, there were no material unrealized gains associatedwith the Company’s available-for-sale investments.
Level 3 fair value measurements
The following summarizes quantitative information about Level 3 fair value measurements.
Auction rate securities
Fair Value atDecember 29, 2018 Weighted
(000s) Valuation Technique Unobservable Input Average
$5,759 Discounted cash flow Estimated yield 3.23%
Expected holding period 10 years
Estimated discount rate 3.76%
The Company has followed an established internal control procedure used in valuing auction ratesecurities. The procedure involves the analysis of valuation techniques and evaluation of unobservableinputs commonly used by market participants to price similar instruments, and which have beendemonstrated to provide reasonable estimates of prices obtained in actual market transactions. Outputsfrom the valuation process are assessed against various market sources when they are available,including marketplace quotes, recent trades of similar illiquid securities, benchmark indices andindependent pricing services. The technique and unobservable input parameters may be recalibratedperiodically to achieve an appropriate estimation of the fair value of the securities.
Significant changes in any of the unobservable inputs used in the fair value measurement ofauction rate securities in isolation could result in a significantly lower or higher fair value measurement.An increase in expected yield would result in a higher fair value measurement, whereas an increase inexpected holding period or estimated discount rate would result in a lower fair value measurement.Generally, a change in the assumptions used for expected holding period is accompanied by adirectionally similar change in the assumptions used for estimated yield and discount rate.
The following summarizes the activity in Level 3 financial instruments for the years endedDecember 29, 2018 and December 30, 2017 (in thousands):
Assets
Year Ended
December 29, December 30,Auction Rate Securities 2018 2017
Beginning balance . . . . . . . . . . . . . . . . . . . . . . . . . . . . . . . . . . . . . . . . . . . $5,681 $5,196Gain included in other comprehensive income (loss) . . . . . . . . . . . . . . . . . . 78 485
Ending balance . . . . . . . . . . . . . . . . . . . . . . . . . . . . . . . . . . . . . . . . . . . . . $5,759 $5,681
F-20

Silicon Laboratories Inc.Notes to Consolidated Financial Statements
December 29, 2018 (Continued)
4. Fair Value of Financial Instruments (Continued)
Liabilities
Year Ended
December 30,Contingent Consideration (1) 2017
Beginning balance . . . . . . . . . . . . . . . . . . . . . . . . . . . . . . . . . . . . . . . . . . . . . . . . . . . . . $ —Issues . . . . . . . . . . . . . . . . . . . . . . . . . . . . . . . . . . . . . . . . . . . . . . . . . . . . . . . . . . . . . . 3,829Reclassification to acquisition-related liabilities . . . . . . . . . . . . . . . . . . . . . . . . . . . . . . . . (3,380)Gain recognized in selling, general and administrative expenses . . . . . . . . . . . . . . . . . . . . (449)
Ending balance . . . . . . . . . . . . . . . . . . . . . . . . . . . . . . . . . . . . . . . . . . . . . . . . . . . . . . . $ —
(1) In connection with the acquisition of Zentri, the Company recorded contingent considerationbased on fiscal 2017 revenue from certain Zentri products.
Fair values of other financial instruments
The Company’s debt is recorded at cost, but is measured at fair value for disclosure purposes. Thefair value of the Company’s convertible senior notes is determined using observable market prices. Thenotes are traded in less active markets and are therefore classified as a Level 2 fair value measurement.As of December 29, 2018 and December 30, 2017, the fair value of the convertible senior notes was$419.0 million and $466.2 million, respectively.
The Company’s other financial instruments, including cash, accounts receivable and accountspayable, are recorded at amounts that approximate their fair values due to their short maturities.
5. Derivative Financial Instruments
The Company uses derivative financial instruments to manage certain exposures to the variabilityof foreign currency exchange rates and interest rates. The Company’s objective is to offset increasesand decreases in expenses resulting from these exposures with gains and losses on the derivativecontracts, thereby reducing volatility of earnings.
Cash Flow Hedges
Foreign Currency Forward Contracts
The Company uses foreign currency forward contracts to reduce the earnings impact that exchangerate fluctuations have on operating expenses denominated in currencies other than the U.S. dollar.Changes in the fair value of the contracts are recorded in accumulated other comprehensive loss in theConsolidated Balance Sheet and subsequently reclassified into earnings in the period during which thehedged transaction is recognized. The reclassified amount is reported in the same financial statementline item as the hedged item. If the foreign currency forward contracts are terminated or can no longerqualify as hedging instruments prior to maturity, the fair value of the contracts recorded inaccumulated other comprehensive loss may be recognized in the Consolidated Statement of Incomebased on an assessment of the contracts at the time of termination.
F-21

Silicon Laboratories Inc.Notes to Consolidated Financial Statements
December 29, 2018 (Continued)
5. Derivative Financial Instruments (Continued)
The Company entered into foreign currency forward contracts in March 2018 for a portion of itsforecasted operating expenses denominated in the Norwegian Krone. As of December 29, 2018, thecontracts had maturities of one to twelve months and an aggregate notional value of $8.8 million.Losses expected to be reclassified into earnings in the next 12 months were not material. The fair valueof the contracts, contract losses recognized in other comprehensive income and amounts reclassifiedfrom accumulated other comprehensive loss into earnings were not material for any of the periodspresented.
Interest Rate Swaps
The Company entered into an interest rate swap agreement with an original notional value of$72.5 million in connection with its Credit Facility in July 2016. The Company terminated the swapagreement on March 6, 2017, which resulted in the reclassification of $1.8 million of unrealized gainsthat were previously recorded in accumulated other comprehensive loss into earnings during fiscal 2017.
Non-designated Hedges
Foreign Currency Forward Contracts
The Company uses foreign currency forward contracts to reduce the earnings impact that exchangerate fluctuations have on non-U.S. dollar balance sheet exposures. The Company recognizes gains andlosses on the foreign currency forward contracts in interest income and other, net in the ConsolidatedStatement of Income in the same period as the remeasurement loss and gain of the related foreigncurrency denominated asset or liability. The Company does not apply hedge accounting to these foreigncurrency forward contracts.
As of December 30, 2017, the Company held one foreign currency forward contract denominatedin the Norwegian Krone with a notional value of $2.4 million. The fair value of the contract was notmaterial as of December 30, 2017.
The before-tax effect of derivative instruments not designated as hedging instruments was asfollows (in thousands):
Year Ended
December 29, December 30, December 31,Gain (Loss) Recognized in Income 2018 2017 2016 Location
Foreign currency forwardcontracts . . . . . . . . . . . . . . $105 $(207) $(92) Interest income and other, net
F-22

Silicon Laboratories Inc.Notes to Consolidated Financial Statements
December 29, 2018 (Continued)
6. Balance Sheet Details
The following tables show the details of selected Consolidated Balance Sheet items (in thousands):
Accounts Receivable, Net
December 29, December 30,2018 2017
Accounts receivable . . . . . . . . . . . . . . . . . . . . . . . . . . . . $73,832 $72,005Allowance for doubtful accounts . . . . . . . . . . . . . . . . . . . (638) (638)
$73,194 $71,367
Inventories
December 29, December 30,2018 2017
Work in progress . . . . . . . . . . . . . . . . . . . . . . . . . . . . . . $50,983 $46,698Finished goods . . . . . . . . . . . . . . . . . . . . . . . . . . . . . . . . 23,989 26,434
$74,972 $73,132
Property and Equipment
December 29, December 30,2018 2017
Buildings and improvements . . . . . . . . . . . . . . . . . . . . . . $ 109,025 $ 96,196Equipment . . . . . . . . . . . . . . . . . . . . . . . . . . . . . . . . . . . 62,895 59,836Computers and purchased software . . . . . . . . . . . . . . . . . 42,487 37,598Leasehold interest in ground leases . . . . . . . . . . . . . . . . . 23,840 23,840Leasehold improvements . . . . . . . . . . . . . . . . . . . . . . . . . 12,006 10,483Furniture and fixtures . . . . . . . . . . . . . . . . . . . . . . . . . . . 7,794 5,691
258,047 233,644Accumulated depreciation . . . . . . . . . . . . . . . . . . . . . . . . (118,998) (105,962)
$ 139,049 $ 127,682
Other Current Liabilities
December 29, December 30,2018 2017
Accrued compensation and benefits . . . . . . . . . . . . . . . . . $37,113 $33,631Accrued price protection credits . . . . . . . . . . . . . . . . . . . 12,033 8,239Other . . . . . . . . . . . . . . . . . . . . . . . . . . . . . . . . . . . . . . 32,034 31,489
$81,180 $73,359
F-23
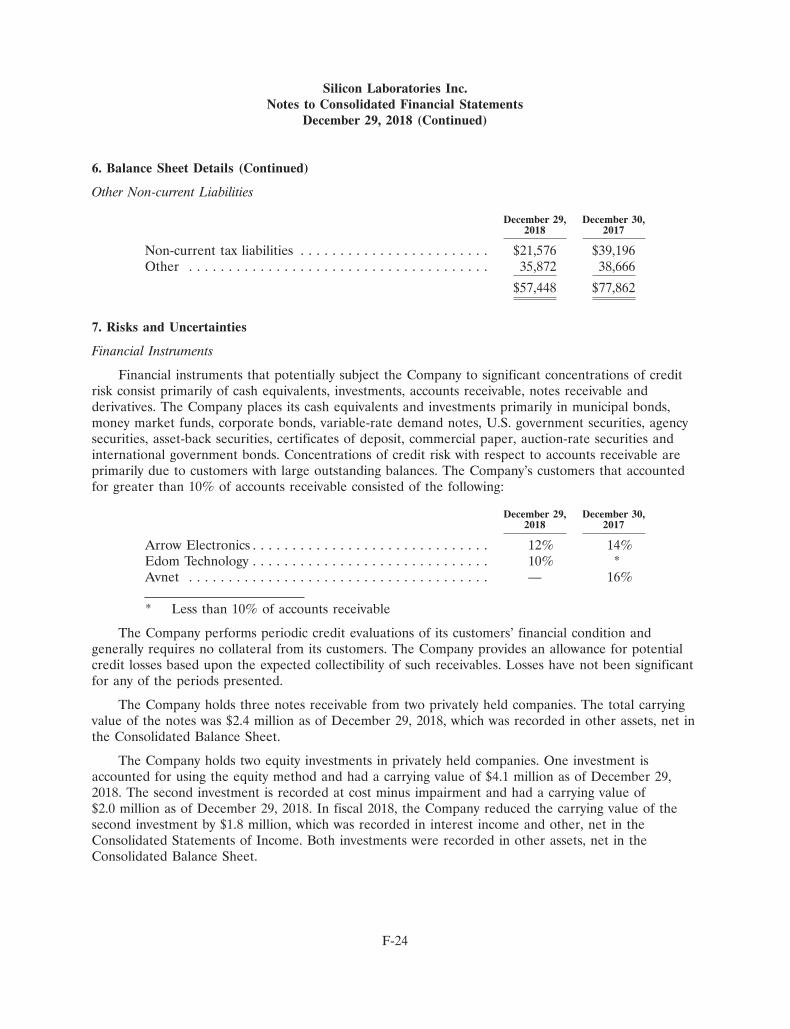
Silicon Laboratories Inc.Notes to Consolidated Financial Statements
December 29, 2018 (Continued)
6. Balance Sheet Details (Continued)
Other Non-current Liabilities
December 29, December 30,2018 2017
Non-current tax liabilities . . . . . . . . . . . . . . . . . . . . . . . . $21,576 $39,196Other . . . . . . . . . . . . . . . . . . . . . . . . . . . . . . . . . . . . . . 35,872 38,666
$57,448 $77,862
7. Risks and Uncertainties
Financial Instruments
Financial instruments that potentially subject the Company to significant concentrations of creditrisk consist primarily of cash equivalents, investments, accounts receivable, notes receivable andderivatives. The Company places its cash equivalents and investments primarily in municipal bonds,money market funds, corporate bonds, variable-rate demand notes, U.S. government securities, agencysecurities, asset-back securities, certificates of deposit, commercial paper, auction-rate securities andinternational government bonds. Concentrations of credit risk with respect to accounts receivable areprimarily due to customers with large outstanding balances. The Company’s customers that accountedfor greater than 10% of accounts receivable consisted of the following:
December 29, December 30,2018 2017
Arrow Electronics . . . . . . . . . . . . . . . . . . . . . . . . . . . . . . 12% 14%Edom Technology . . . . . . . . . . . . . . . . . . . . . . . . . . . . . . 10% *Avnet . . . . . . . . . . . . . . . . . . . . . . . . . . . . . . . . . . . . . . — 16%
* Less than 10% of accounts receivable
The Company performs periodic credit evaluations of its customers’ financial condition andgenerally requires no collateral from its customers. The Company provides an allowance for potentialcredit losses based upon the expected collectibility of such receivables. Losses have not been significantfor any of the periods presented.
The Company holds three notes receivable from two privately held companies. The total carryingvalue of the notes was $2.4 million as of December 29, 2018, which was recorded in other assets, net inthe Consolidated Balance Sheet.
The Company holds two equity investments in privately held companies. One investment isaccounted for using the equity method and had a carrying value of $4.1 million as of December 29,2018. The second investment is recorded at cost minus impairment and had a carrying value of$2.0 million as of December 29, 2018. In fiscal 2018, the Company reduced the carrying value of thesecond investment by $1.8 million, which was recorded in interest income and other, net in theConsolidated Statements of Income. Both investments were recorded in other assets, net in theConsolidated Balance Sheet.
F-24

Silicon Laboratories Inc.Notes to Consolidated Financial Statements
December 29, 2018 (Continued)
7. Risks and Uncertainties (Continued)
As a result of its use of derivative instruments, the Company is exposed to the risk that itscounterparties will fail to meet their contractual obligations. To mitigate this counterparty credit risk,the Company has a policy to enter into contracts with only selected major financial institutions. TheCompany periodically reviews and re-assesses the creditworthiness of such counterparties based on avariety of factors.
Distributor Advances
On sales to distributors, the Company’s payment terms often require the distributor to initially payamounts owed to the Company for an amount in excess of their ultimate cost. The Company’s salesprice to its distributors may be higher than the amount that the distributors will ultimately owe theCompany because distributors often negotiate price reductions after purchasing the product from theCompany and such reductions are often significant. These negotiated price discounts are not granteduntil the distributor sells the product to the end customer, which may occur after the distributor haspaid the original invoice amount to the Company. Payment of invoices prior to receiving an associateddiscount can have an adverse impact on the working capital of the Company’s distributors. Accordingly,the Company has entered into agreements with certain distributors whereby it advances cash to thedistributors to reduce the distributor’s working capital requirements. The advance amounts are basedon the distributor’s inventory balance, and are adjusted quarterly. Such amounts are recorded inprepaid expenses and other current assets in the Consolidated Balance Sheet. The terms of theseadvances are set forth in binding legal agreements and are unsecured, bear no interest on unsettledbalances and are due upon demand. The agreements governing these advances can be cancelled by theCompany at any time.
Suppliers
A significant portion of the Company’s products are fabricated by Taiwan SemiconductorManufacturing Co. (TSMC) or Semiconductor Manufacturing International Corporation (SMIC). Theinability of TSMC or SMIC to deliver wafers to the Company on a timely basis could impact theproduction of the Company’s products for a substantial period of time, which could have a materialadverse effect on the Company’s business, financial condition, results of operations and cash flows.
Customers
The Company sells directly to end customers, distributors and contract manufacturers. Althoughthe Company actually sells the products to, and is paid by, distributors and contract manufacturers, theCompany refers to the end customer as its customer. None of the Company’s end customers or
F-25

Silicon Laboratories Inc.Notes to Consolidated Financial Statements
December 29, 2018 (Continued)
7. Risks and Uncertainties (Continued)
contract manufacturers accounted for greater than 10% of revenue during fiscal 2018, 2017 or 2016.The Company’s distributors that accounted for greater than 10% of revenue consisted of the following:
Year Ended
December 29, December 30, December 31,2018 2017 2016
Arrow Electronics . . . . . . . . . . . . . . . . . . . . . . . . . . . . . . . . . 21% 12% 11%Edom Technology . . . . . . . . . . . . . . . . . . . . . . . . . . . . . . . . . 17% 19% 17%Avnet . . . . . . . . . . . . . . . . . . . . . . . . . . . . . . . . . . . . . . . . . . * 14% 13%
* Less than 10% of revenue
8. Acquisitions
Z-Wave
On April 18, 2018, the Company completed the acquisition of the Z-Wave business from SigmaDesigns, Inc. for $243 million in cash. Z-Wave is an Internet of Things (IoT) technology for smarthome solutions.
This strategic acquisition expands the Company’s IoT connectivity portfolio in the connected homemarket, while further scaling the Company’s engineering team. These factors contributed to a purchaseprice that was in excess of the fair value of the net assets acquired and, as a result, the Companyrecorded goodwill. A portion of the goodwill is deductible for tax purposes. The purchase price wasallocated as follows (in thousands):
Weighted-AverageAmortization Period
Amount (Years)
Intangible assets:In-process research and development . . . . . . . . . . . . $ 20,900 Not amortizedDeveloped technology . . . . . . . . . . . . . . . . . . . . . . . 69,875 7Customer relationships . . . . . . . . . . . . . . . . . . . . . . 25,000 4Trademarks . . . . . . . . . . . . . . . . . . . . . . . . . . . . . . 9,900 7
125,675Cash and cash equivalents . . . . . . . . . . . . . . . . . . . . . 2,841Accounts receivable . . . . . . . . . . . . . . . . . . . . . . . . . . 5,311Inventory . . . . . . . . . . . . . . . . . . . . . . . . . . . . . . . . . . 15,581Other current assets . . . . . . . . . . . . . . . . . . . . . . . . . . 329Goodwill . . . . . . . . . . . . . . . . . . . . . . . . . . . . . . . . . . 109,117Other non-current assets . . . . . . . . . . . . . . . . . . . . . . 2,587Accounts payable . . . . . . . . . . . . . . . . . . . . . . . . . . . . (3,306)Other current liabilities . . . . . . . . . . . . . . . . . . . . . . . (8,918)Other non-current liabilities . . . . . . . . . . . . . . . . . . . . (6,648)
Total purchase price . . . . . . . . . . . . . . . . . . . . . . . . . . $242,569
F-26

Silicon Laboratories Inc.Notes to Consolidated Financial Statements
December 29, 2018 (Continued)
8. Acquisitions (Continued)
In-process research and development (IPR&D) represents acquired smart home technology thathad not been completed as of the acquisition date. The fair value of IPR&D was determined using theincome approach. The discount rate applied to the projected cash flows was 15.0%, which reflects theengineering and technical risks related to the projects. The allocation of the purchase price ispreliminary and subject to change, based on the finalization of income tax matters.
Revenues attributable to the Z-Wave business from the date of acquisition to December 29, 2018were $37.0 million. The Company recorded approximately $4.9 million of acquisition-related costs inselling, general and administrative expenses during fiscal 2018.
The following unaudited pro forma financial information presents combined results of operationsfor each of the periods presented, giving effect to the acquisition as if it had been completed onJanuary 1, 2017. The pro forma financial information includes charges for the fair value write-upassociated with acquired inventory, adjustments for amortization expense of acquired intangible assetsand tax-related expenses. The pro forma results of operations are presented for informational purposesonly and are not necessarily indicative of the results of operations that would have been achieved if theacquisition had taken place on January 1, 2017 or of results that may occur in the future (in thousands,except per share data):
Year Ended
December 29, December 30,2018 2017
(Unaudited)
Revenues . . . . . . . . . . . . . . . . . . . . . . . . . . . . . . . . . . . . $882,109 $824,009Net income . . . . . . . . . . . . . . . . . . . . . . . . . . . . . . . . . . $ 87,874 $ 27,958
Earnings per share:Basic . . . . . . . . . . . . . . . . . . . . . . . . . . . . . . . . . . . . . $ 2.04 $ 0.66Diluted . . . . . . . . . . . . . . . . . . . . . . . . . . . . . . . . . . . . $ 2.00 $ 0.65
Zentri
On January 20, 2017, the Company acquired Zentri, Inc., a private company. Zentri is aninnovator in low-power, cloud-connected Wi-Fi technologies for the IoT. The Company acquired Zentrifor approximately $18.1 million, including initial cash consideration of approximately $14.3 million, andpotential additional consideration with an estimated fair value of approximately $3.8 million at the dateof acquisition.
The purchase price was allocated as follows: intangible assets—$6.7 million; goodwill—$12.1 million; and other net liabilities—$0.7 million. The goodwill is not deductible for tax purposes.Pro forma information related to this acquisition has not been presented because it would not bematerially different from amounts reported.
Micrium
On October 3, 2016, the Company acquired Micrium, a private company. Micrium is a supplier ofreal-time operating system (RTOS) software for the IoT. The Company acquired Micrium forapproximately $12.4 million, consisting of approximately $8.2 million in cash and $4.2 million in stockconsideration. An additional approximately $1.0 million in stock consideration was accounted for as atransaction separate from the business combination based on its economic substance and will berecorded as post-combination compensation expense over four years.
F-27

Silicon Laboratories Inc.Notes to Consolidated Financial Statements
December 29, 2018 (Continued)
8. Acquisitions (Continued)
The purchase price was allocated as follows: intangible assets—$9.5 million; goodwill—$3.4 million;and other net liabilities—$0.5 million. A portion of the goodwill is deductible for tax purposes. Proforma information related to this acquisition has not been presented because it would not be materiallydifferent from amounts reported.
Energy Micro
On July 1, 2013, the Company acquired Energy Micro. In fiscal 2016, the Company entered intoan agreement which settled the amount of the earn-out to be paid for fiscal 2015 through 2018. Thetotal settlement amount was approximately $16.0 million (in lieu of potential payments of up to$26.7 million) and was paid on May 11, 2016.
9. Goodwill and Other Intangible Assets
Goodwill
The following summarizes the activity in goodwill for the years ended December 29, 2018 andDecember 30, 2017 (in thousands):
Year Ended
December 29, December 30,2018 2017
Beginning balance . . . . . . . . . . . . . . . . . . . . . . . . . . . . . $288,227 $276,130Additions due to business combinations . . . . . . . . . . . . . . 109,117 12,097
Ending balance . . . . . . . . . . . . . . . . . . . . . . . . . . . . . . . . $397,344 $288,227
Other Intangible Assets
The gross carrying amount and accumulated amortization of other intangible assets are as follows(in thousands):
Weighted-Average December 29, 2018 December 30, 2017AmortizationPeriod Gross Accumulated Gross Accumulated(Years) Amount Amortization Amount Amortization
Core and developed technology . . . . . 8 $237,265 $(102,116) $161,700 $ (89,442)Customer relationships . . . . . . . . . . . 5 46,890 (21,075) 25,470 (16,180)Patents . . . . . . . . . . . . . . . . . . . . . . . — — — 3,000 (2,750)Trademarks . . . . . . . . . . . . . . . . . . . 7 12,310 (2,442) 3,690 (2,344)
Total . . . . . . . . . . . . . . . . . . . . . . . . 8 $296,465 $(125,633) $193,860 $(110,716)
Gross intangible assets increased $125.7 million in fiscal 2018 for assets added due to theacquisition of Z-Wave business. This increase was offset by $23.1 million due to the removal of fullyamortized assets.
Amortization expense related to intangible assets for fiscal 2018, 2017 and 2016 was $38.0 million,$27.1 million and $27.3 million, respectively. The estimated aggregate amortization expense for
F-28

Silicon Laboratories Inc.Notes to Consolidated Financial Statements
December 29, 2018 (Continued)
9. Goodwill and Other Intangible Assets (Continued)
intangible assets subject to amortization for each of the five succeeding fiscal years is as follows (inthousands):
Fiscal Year
2019 . . . . . . . . . . . . . . . . . . . . . . . . . . . . . . . . . . . . . . . . . . . . . . . . . . . . $39,2222020 . . . . . . . . . . . . . . . . . . . . . . . . . . . . . . . . . . . . . . . . . . . . . . . . . . . . 36,7272021 . . . . . . . . . . . . . . . . . . . . . . . . . . . . . . . . . . . . . . . . . . . . . . . . . . . . 32,3372022 . . . . . . . . . . . . . . . . . . . . . . . . . . . . . . . . . . . . . . . . . . . . . . . . . . . . 24,2062023 . . . . . . . . . . . . . . . . . . . . . . . . . . . . . . . . . . . . . . . . . . . . . . . . . . . . 18,286
10. Debt
1.375% Convertible Senior Notes
On March 6, 2017, the Company completed a private offering of $400 million principal amountconvertible senior notes (the ‘‘Notes’’). The Notes bear interest semi-annually at a rate of 1.375% peryear and will mature on March 1, 2022, unless repurchased, redeemed or converted at an earlier date.The Company used $72.5 million of the proceeds to pay off the then remaining balance under its creditagreement.
The Notes are convertible at an initial conversion rate of 10.7744 shares of common stock per$1,000 principal amount of the Notes, or approximately 4.3 million shares of common stock, which isequivalent to a conversion price of approximately $92.81 per share. The conversion rate is subject toadjustment under certain circumstances. Holders may convert the Notes under the followingcircumstances: during any calendar quarter after the calendar quarter ended on June 30, 2017 if theclosing price of the Company’s common stock for at least 20 trading days in the 30 consecutive tradingdays ending on the last trading day of the preceding calendar quarter is greater than or equal to 130%of the conversion price of the Notes; during the five business day period after any ten consecutivetrading day period (the ‘‘measurement period’’) in which the trading price per $1,000 principal amountof notes for each trading day of the measurement period was less than 98% of the product of theclosing sale price of our common stock and the conversion rate on each such trading day; if specifieddistributions or corporate events occur; if the Notes are called for redemption; or at any time afterDecember 1, 2021. The Company may redeem all or any portion of the Notes, at its option, on or afterMarch 6, 2020, if the last reported sale price of the Company’s common stock has been at least 130%of the conversion price then in effect for at least 20 trading days during any 30 consecutive trading dayperiod. Upon conversion, the Notes may be settled in cash, shares of the Company’s common stock ora combination of cash and shares, at the Company’s election.
The principal balance of the Notes was separated into liability and equity components, and wasrecorded initially at fair value. The excess of the principal amount of the liability component over itscarrying amount represents the debt discount, which is amortized to interest expense over the term ofthe Notes using the effective interest method. The carrying amount of the liability component wasestimated by discounting the contractual cash flows of similar non-convertible debt at an appropriatemarket rate at the date of issuance.
The Company incurred debt issuance costs of approximately $10.6 million, which was allocated tothe liability and equity components in proportion to the allocation of the proceeds. The costs allocated
F-29

Silicon Laboratories Inc.Notes to Consolidated Financial Statements
December 29, 2018 (Continued)
10. Debt (Continued)
to the liability component are being amortized as interest expense over the term of the Notes using theeffective interest method.
The carrying amount of the Notes consisted of the following (in thousands):
December 29, December 30,2018 2017
Liability componentPrincipal . . . . . . . . . . . . . . . . . . . . . . . . . . . . . . . . . . . $400,000 $400,000Unamortized debt discount . . . . . . . . . . . . . . . . . . . . . (39,298) (50,499)Unamortized debt issuance costs . . . . . . . . . . . . . . . . . (5,931) (7,622)
Net carrying amount . . . . . . . . . . . . . . . . . . . . . . . . . . $354,771 $341,879
Equity componentNet carrying amount . . . . . . . . . . . . . . . . . . . . . . . . . . $ 57,735 $ 57,735
The liability component of the Notes is recorded in convertible debt on the Consolidated BalanceSheet. The equity component of the Notes is recorded in additional paid-in capital. The effectiveinterest rate for the liability component was 4.75%. As of December 29, 2018, the remaining periodover which the debt discount and debt issuance costs will be amortized was 3.2 years.
Interest expense related to the Notes was comprised of the following (in thousands):
Year Ended
December 29, December 30,2018 2017
Contractual interest expense . . . . . . . . . . . . . . . . . . . . . . $ 5,500 $ 4,492Amortization of debt discount . . . . . . . . . . . . . . . . . . . . . 11,202 8,816Amortization of debt issuance costs . . . . . . . . . . . . . . . . . 1,690 1,330
$18,392 $14,638
Credit Facility
In connection with the Company’s offering of the Notes, it and certain of its domestic subsidiaries(the ‘‘Guarantors’’) amended its existing credit agreement and paid off the then remaining balance of$72.5 million. The amended agreement (the ‘‘Credit Facility’’) consists of a $300 million revolving creditfacility with a maturity date of July 24, 2020. The Credit Facility includes a $25 million letter of creditsublimit and a $10 million swingline loan sublimit. The Company also has an option to increase the sizeof the borrowing capacity by up to an aggregate of $200 million in additional commitments, subject tocertain conditions.
The revolving credit facility, other than swingline loans, will bear interest at the Eurodollar rateplus an applicable margin or, at the option of the Company, a base rate (defined as the highest of theWells Fargo prime rate, the Federal Funds rate plus 0.50% and the Eurodollar Base Rate plus 1.00%)plus an applicable margin. Swingline loans accrue interest at the base rate plus the applicable marginfor base rate loans. The applicable margins for the Eurodollar rate loans range from 1.25% to 2.00%
F-30

Silicon Laboratories Inc.Notes to Consolidated Financial Statements
December 29, 2018 (Continued)
10. Debt (Continued)
and for base rate loans range from 0.25% to 1.00%, depending in each case, on the leverage ratio asdefined in the Credit Facility.
The Credit Facility contains various conditions, covenants and representations with which theCompany must be in compliance in order to borrow funds and to avoid an event of default, includingfinancial covenants that the Company must maintain a leverage ratio (funded debt/EBITDA) of nomore than 3.00 to 1 and a minimum fixed charge coverage ratio (EBITDA/interest payments, incometaxes and capital expenditures) of no less than 1.25 to 1. As of December 29, 2018, the Company wasin compliance with all covenants of the Credit Facility. The Company’s obligations under the CreditFacility are guaranteed by the Guarantors and are secured by a security interest in substantially allassets of the Company and the Guarantors.
11. Commitments and Contingencies
Operating Leases
The Company leases certain facilities under operating lease agreements that expire at various datesthrough 2027. Some of these arrangements contain renewal options and require the Company to paytaxes, insurance and maintenance costs.
Rent expense under operating leases was $6.0 million, $5.5 million and $4.7 million for fiscal 2018,2017 and 2016, respectively. The minimum annual future rentals under the terms of these leases as ofDecember 29, 2018 are as follows (in thousands):
Fiscal Year
2019 . . . . . . . . . . . . . . . . . . . . . . . . . . . . . . . . . . . . . . . . . . . . . . . . . . . . $ 5,2872020 . . . . . . . . . . . . . . . . . . . . . . . . . . . . . . . . . . . . . . . . . . . . . . . . . . . . 4,7462021 . . . . . . . . . . . . . . . . . . . . . . . . . . . . . . . . . . . . . . . . . . . . . . . . . . . . 4,0512022 . . . . . . . . . . . . . . . . . . . . . . . . . . . . . . . . . . . . . . . . . . . . . . . . . . . . 3,4852023 . . . . . . . . . . . . . . . . . . . . . . . . . . . . . . . . . . . . . . . . . . . . . . . . . . . . 2,810Thereafter . . . . . . . . . . . . . . . . . . . . . . . . . . . . . . . . . . . . . . . . . . . . . . . 3,842
Total minimum lease payments . . . . . . . . . . . . . . . . . . . . . . . . . . . . . . . . . $24,221
Investment Commitment
The Company has committed to invest up to $10.0 million in a limited partnership, of whichapproximately $4.3 million was funded through December 29, 2018.
Patent Litigation—Cresta Technology
On January 28, 2014, Cresta Technology Corporation (‘‘Cresta Technology’’), a Delawarecorporation, filed a lawsuit against the Company in the United States District Court in the District ofDelaware, alleging infringement of three United States Patents (the ‘‘Cresta Patents’’). On July 16,2014, the Company filed a lawsuit against Cresta Technology in the United States District Court in theNorthern District of California alleging infringement of six United States Patents.
F-31

Silicon Laboratories Inc.Notes to Consolidated Financial Statements
December 29, 2018 (Continued)
11. Commitments and Contingencies (Continued)
Cresta Technology declared bankruptcy in 2016 and the Cresta patents and the Delaware lawsuitwere acquired by Crespe LLC.
On September 17, 2018, the Company and Crespe LLC settled all matters. The Company receiveda non-material payment from Crespe LLC. There was no payment from the Company and theCompany received a full license to the Cresta Patents and dismissal of all claims.
Patent Litigation—Bandspeed
On June 21, 2018, Bandspeed, LLC (‘‘Bandspeed’’), a Texas limited liability company, filed alawsuit against the Company in the United States District Court of the Western District of Texas,Austin Division, alleging infringement of eight United States Patents. On November 9, 2018, theCompany and Bandspeed settled all matters, and the Court ordered a dismissal on November 19, 2018.The Company made a non-material payment to Bandspeed and received a full license to the allegedpatents and dismissal of all claims.
Other
The Company is involved in various other legal proceedings that have arisen in the normal courseof business. While the ultimate results cannot be predicted with certainty, the Company does not expectthem to have a material adverse effect on its Consolidated Financial Statements.
12. Stockholders’ Equity
Common Stock
The Company issued 0.8 million shares of common stock during fiscal 2018.
Share Repurchase Programs
The Board of Directors authorized the following share repurchase programs (in thousands):
ProgramTermination Program
Program Authorization Date Date Amount
October 2017 . . . . . . . . . . . . . . . . . . . . . . . . . . . . . . . December 2019 $200,000*January 2017 . . . . . . . . . . . . . . . . . . . . . . . . . . . . . . . December 2017 $100,000August 2015 . . . . . . . . . . . . . . . . . . . . . . . . . . . . . . . . December 2016 $100,000
* In October 2018, the Board of Directors increased the share repurchase amount for theOctober 2017 program from $100 million to $200 million and extended the terminationdate from December 2018 to December 2019.
These programs allow for repurchases to be made in the open market or in private transactions,including structured or accelerated transactions, subject to applicable legal requirements and marketconditions. The Company repurchased 0.4 million shares of its common stock for $39.3 million duringfiscal 2018. The Company did not repurchase any shares of its common stock during fiscal 2017. The
F-32

Silicon Laboratories Inc.Notes to Consolidated Financial Statements
December 29, 2018 (Continued)
12. Stockholders’ Equity (Continued)
Company repurchased 0.9 million shares of its common stock for $40.5 million during fiscal 2016.These shares were retired upon repurchase.
Reclassifications From Accumulated Other Comprehensive Loss
The following table summarizes the effect on net income from reclassifications out of accumulatedother comprehensive loss (in thousands):
Year ended
December 29, December 30, December 31,Reclassification 2018 2017 2016
Losses on available-for-sales securities to:Interest income and other, net . . . . . . . . . . . . . . . . . . . . . . $ (49) $ — $ —
Gains (losses) on cash flow hedges to:Interest income and other, net . . . . . . . . . . . . . . . . . . . . . . (316) — —Interest expense . . . . . . . . . . . . . . . . . . . . . . . . . . . . . . . . . — 1,808 (249)
(365) 1,808 (249)
Income tax (expense) benefit . . . . . . . . . . . . . . . . . . . . . . . 77 (633) 87
Total gains (losses) reclassified . . . . . . . . . . . . . . . . . . . . . . . . $(288) $1,175 $(162)
Income Tax Allocated to the Components of Other Comprehensive Income (Loss)
The income tax effects of the components of other comprehensive income (loss) were as follows(in thousands):
Year ended
December 29, December 30, December 31,Income tax (expense) benefit on: 2018 2017 2016
Net changes to available-for-sale securities:Unrealized gains (losses) arising during the period . . . . . . . . $ (79) $255 $ 63Reclassification for losses included in net income . . . . . . . . . (10) — —
Net changes to cash flow hedges:Unrealized gains (losses) arising during the period . . . . . . . . 200 — (513)Reclassification for gains (losses) included in net income . . . (66) 633 (87)
$ 45 $888 $(537)
F-33
Silicon Laboratories Inc.Notes to Consolidated Financial Statements
December 29, 2018 (Continued)
13. Revenues
The Company groups its revenues into four categories, based on the markets and applications inwhich its products may be used. The following disaggregates the Company’s revenue by productcategory (in thousands):
Year Ended
December 29, December 30, December 31,2018 2017 (1) 2016 (1)
Internet of Things . . . . . . . . . . . . . . . . . . . . $463,838 $395,012 $314,614Infrastructure . . . . . . . . . . . . . . . . . . . . . . . 199,478 152,158 147,677Broadcast . . . . . . . . . . . . . . . . . . . . . . . . . . 141,412 152,980 157,746Access . . . . . . . . . . . . . . . . . . . . . . . . . . . . 63,539 68,717 77,589
$868,267 $768,867 $697,626
(1) Under the modified retrospective method, prior period amounts have not been adjusted.
A portion of the Company’s sales are made to distributors under agreements allowing certainrights of return and/or price protection related to the final selling price to the end customers. Thesefactors impact the timing and uncertainty of revenues and cash flows. The Company recognizedrevenue of $24.3 million during fiscal 2018 from performance obligations that were satisfied in previousreporting periods. The following disaggregates the Company’s revenue by sales channel (in thousands):
Year Ended
December 29, December 30, December 31,2018 2017 (1) 2016 (1)
Distributors . . . . . . . . . . . . . . . . . . . . . . . . $618,989 $547,419 $471,622Direct customers . . . . . . . . . . . . . . . . . . . . . 249,278 221,448 226,004
$868,267 $768,867 $697,626
(1) Under the modified retrospective method, prior period amounts have not been adjusted.
14. Stock-Based Compensation
In fiscal 2009, the stockholders of the Company approved the 2009 Stock Incentive Plan (the ‘‘2009Plan’’) and the 2009 Employee Stock Purchase Plan (the ‘‘2009 Purchase Plan’’). In fiscal 2017, thestockholders of the Company approved amendments to both the 2009 Plan and the 2009 Purchase Plan.These amendments authorized additional shares of common stock for issuance, to comply with changesin applicable law, improve the Company’s corporate governance and to implement other best practices.
2009 Stock Incentive Plan
Under the 2009 Plan, the following may be granted: stock options, stock appreciation rights,performance shares, performance stock units, restricted stock units (RSUs), restricted stock awards(RSAs), performance-based awards and other awards (collectively, all such grants are referred to as‘‘awards’’). The fiscal 2017 amendments to the 2009 Plan created a single share pool. All awards nowdeduct one share from the 2009 Plan shares available for issuance for each share granted. Awards
F-34
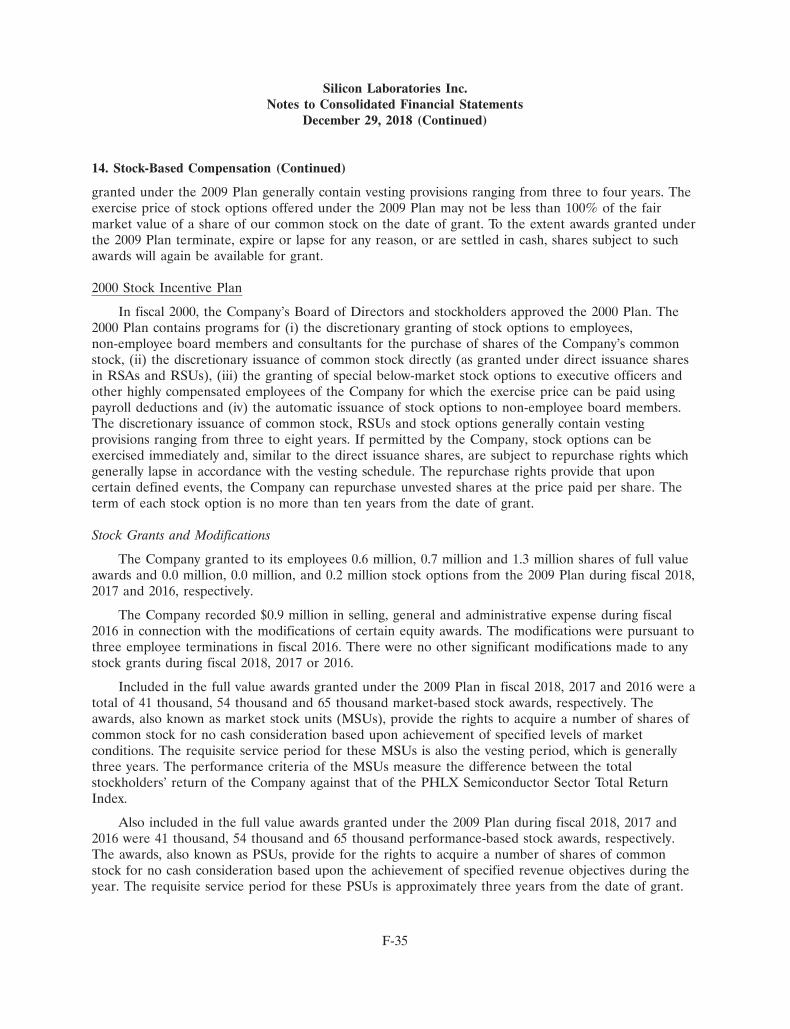
Silicon Laboratories Inc.Notes to Consolidated Financial Statements
December 29, 2018 (Continued)
14. Stock-Based Compensation (Continued)
granted under the 2009 Plan generally contain vesting provisions ranging from three to four years. Theexercise price of stock options offered under the 2009 Plan may not be less than 100% of the fairmarket value of a share of our common stock on the date of grant. To the extent awards granted underthe 2009 Plan terminate, expire or lapse for any reason, or are settled in cash, shares subject to suchawards will again be available for grant.
2000 Stock Incentive Plan
In fiscal 2000, the Company’s Board of Directors and stockholders approved the 2000 Plan. The2000 Plan contains programs for (i) the discretionary granting of stock options to employees,non-employee board members and consultants for the purchase of shares of the Company’s commonstock, (ii) the discretionary issuance of common stock directly (as granted under direct issuance sharesin RSAs and RSUs), (iii) the granting of special below-market stock options to executive officers andother highly compensated employees of the Company for which the exercise price can be paid usingpayroll deductions and (iv) the automatic issuance of stock options to non-employee board members.The discretionary issuance of common stock, RSUs and stock options generally contain vestingprovisions ranging from three to eight years. If permitted by the Company, stock options can beexercised immediately and, similar to the direct issuance shares, are subject to repurchase rights whichgenerally lapse in accordance with the vesting schedule. The repurchase rights provide that uponcertain defined events, the Company can repurchase unvested shares at the price paid per share. Theterm of each stock option is no more than ten years from the date of grant.
Stock Grants and Modifications
The Company granted to its employees 0.6 million, 0.7 million and 1.3 million shares of full valueawards and 0.0 million, 0.0 million, and 0.2 million stock options from the 2009 Plan during fiscal 2018,2017 and 2016, respectively.
The Company recorded $0.9 million in selling, general and administrative expense during fiscal2016 in connection with the modifications of certain equity awards. The modifications were pursuant tothree employee terminations in fiscal 2016. There were no other significant modifications made to anystock grants during fiscal 2018, 2017 or 2016.
Included in the full value awards granted under the 2009 Plan in fiscal 2018, 2017 and 2016 were atotal of 41 thousand, 54 thousand and 65 thousand market-based stock awards, respectively. Theawards, also known as market stock units (MSUs), provide the rights to acquire a number of shares ofcommon stock for no cash consideration based upon achievement of specified levels of marketconditions. The requisite service period for these MSUs is also the vesting period, which is generallythree years. The performance criteria of the MSUs measure the difference between the totalstockholders’ return of the Company against that of the PHLX Semiconductor Sector Total ReturnIndex.
Also included in the full value awards granted under the 2009 Plan during fiscal 2018, 2017 and2016 were 41 thousand, 54 thousand and 65 thousand performance-based stock awards, respectively.The awards, also known as PSUs, provide for the rights to acquire a number of shares of commonstock for no cash consideration based upon the achievement of specified revenue objectives during theyear. The requisite service period for these PSUs is approximately three years from the date of grant.
F-35

Silicon Laboratories Inc.Notes to Consolidated Financial Statements
December 29, 2018 (Continued)
14. Stock-Based Compensation (Continued)
2009 Employee Stock Purchase Plan
The rights to purchase common stock granted under the 2009 Purchase Plan are intended to betreated as either (i) purchase rights granted under an ‘‘employee stock purchase plan,’’ as that term isdefined in Section 423(b) of the Internal Revenue Code (the ‘‘423(b) Plan’’), or (ii) purchase rightsgranted under an employee stock purchase plan that is not subject to the terms and conditions ofSection 423(b) of the Internal Revenue Code (the ‘‘Non-423(b) Plan’’). The Company will retain thediscretion to grant purchase rights under either the 423(b) Plan or the Non-423(b) Plan. Eligibleemployees may purchase a limited number of shares of the Company’s common stock at no less than85% of the fair market value of a share of common stock at prescribed purchase intervals during anoffering period. Each offering period will be comprised of a series of one or more successive and/oroverlapping purchase intervals and has a maximum term of 24 months. During fiscal 2018, 2017 and2016, the Company issued 223 thousand, 239 thousand and 224 thousand shares, respectively, under the2009 Purchase Plan to its employees. The weighted-average fair value for purchase rights granted infiscal 2018 under the 2009 Purchase Plan was $22.59 per share.
Accounting for Stock-Based Compensation
Stock-based compensation costs are based on the fair values on the date of grant for stock awardsand stock options and on the date of enrollment for the employee stock purchase plans. The fair valuesof stock awards (such as RSUs, PSUs and RSAs) are estimated based on their intrinsic values. The fairvalues of MSUs are estimated using a Monte Carlo simulation. The fair values of stock options andemployee stock purchase plans are estimated using the Black-Scholes option-pricing model.
The Black-Scholes valuation calculation requires the Company to estimate key assumptions such asfuture stock price volatility, expected terms, risk-free rates and dividend yield. Expected stock pricevolatility is based upon a combination of both historical volatility and implied volatility derived fromtraded options on the Company’s stock in the marketplace. Expected term is derived from an analysisof historical exercises and remaining contractual life of options. The risk-free rate is based on the U.S.Treasury yield curve in effect at the time of grant. The Company has never paid cash dividends anddoes not currently intend to pay cash dividends, thus it has assumed a 0% dividend yield.
The Monte Carlo simulation used to calculate the fair value of the MSUs simulates the presentvalue of the potential outcomes of future stock prices of the Company and the PhiladelphiaSemiconductor Sector Total Return Index over the requisite service period. The projection of stockprices are based on the risk-free rate of return, the volatilities of the stock price of the Company andthe Index, and the correlation of the stock price of the Company with the Index.
The Company estimates potential forfeitures of stock grants and adjusts compensation costrecorded accordingly. The estimate of forfeitures will be adjusted over the requisite service period tothe extent that actual forfeitures differ, or are expected to differ, from such estimates. Changes inestimated forfeitures are recognized through a cumulative catch-up adjustment in the period of changeand will also impact the amount of stock-based compensation expense to be recognized in futureperiods.
The fair values of stock options and RSUs are amortized as compensation expense on astraight-line basis over the vesting period of the grants. The fair values of RSAs are fully expensed in
F-36
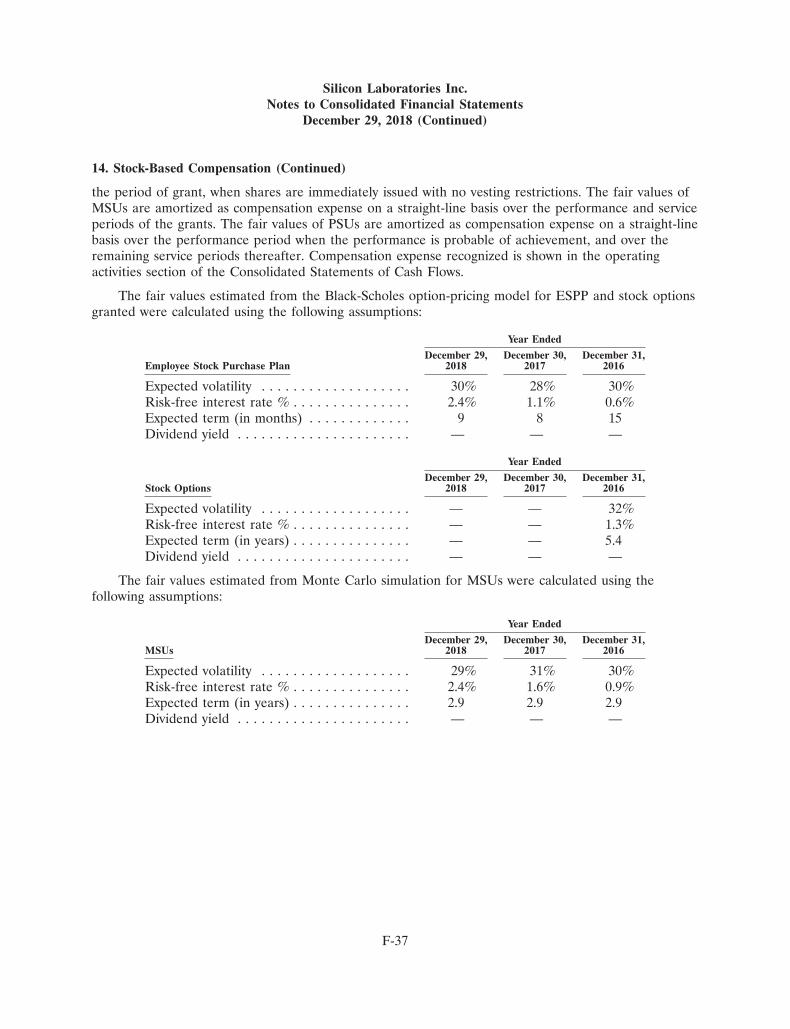
Silicon Laboratories Inc.Notes to Consolidated Financial Statements
December 29, 2018 (Continued)
14. Stock-Based Compensation (Continued)
the period of grant, when shares are immediately issued with no vesting restrictions. The fair values ofMSUs are amortized as compensation expense on a straight-line basis over the performance and serviceperiods of the grants. The fair values of PSUs are amortized as compensation expense on a straight-linebasis over the performance period when the performance is probable of achievement, and over theremaining service periods thereafter. Compensation expense recognized is shown in the operatingactivities section of the Consolidated Statements of Cash Flows.
The fair values estimated from the Black-Scholes option-pricing model for ESPP and stock optionsgranted were calculated using the following assumptions:
Year Ended
December 29, December 30, December 31,Employee Stock Purchase Plan 2018 2017 2016
Expected volatility . . . . . . . . . . . . . . . . . . . 30% 28% 30%Risk-free interest rate % . . . . . . . . . . . . . . . 2.4% 1.1% 0.6%Expected term (in months) . . . . . . . . . . . . . 9 8 15Dividend yield . . . . . . . . . . . . . . . . . . . . . . — — —
Year Ended
December 29, December 30, December 31,Stock Options 2018 2017 2016
Expected volatility . . . . . . . . . . . . . . . . . . . — — 32%Risk-free interest rate % . . . . . . . . . . . . . . . — — 1.3%Expected term (in years) . . . . . . . . . . . . . . . — — 5.4Dividend yield . . . . . . . . . . . . . . . . . . . . . . — — —
The fair values estimated from Monte Carlo simulation for MSUs were calculated using thefollowing assumptions:
Year Ended
December 29, December 30, December 31,MSUs 2018 2017 2016
Expected volatility . . . . . . . . . . . . . . . . . . . 29% 31% 30%Risk-free interest rate % . . . . . . . . . . . . . . . 2.4% 1.6% 0.9%Expected term (in years) . . . . . . . . . . . . . . . 2.9 2.9 2.9Dividend yield . . . . . . . . . . . . . . . . . . . . . . — — —
F-37

Silicon Laboratories Inc.Notes to Consolidated Financial Statements
December 29, 2018 (Continued)
14. Stock-Based Compensation (Continued)
A summary of stock-based compensation activity with respect to fiscal 2018 follows:
Weighted-AverageWeighted- Remaining AggregateAverage Contractual Intrinsic
Shares Exercise Term ValueStock Options (000s) Price (In Years) (000s)
Outstanding at December 30, 2017 . . . . . . . . . . . . . . . . . 170 $38.88Exercised . . . . . . . . . . . . . . . . . . . . . . . . . . . . . . . . . . . (33) $36.45
Outstanding at December 29, 2018 . . . . . . . . . . . . . . . . . 137 $39.47 7.1 $5,327
Vested at December 29, 2018 and expected to vest . . . . . 83 $40.39 7.1 $3,154
Exercisable at December 29, 2018 . . . . . . . . . . . . . . . . . 50 $37.88 7.1 $2,031
Weighted- Weighted-Average AggregateAverage Remaining Intrinsic
Shares Purchase Vesting Term ValueRSAs and RSUs (000s) Price (In Years) (000s)
Outstanding at December 30, 2017 . . . . . . . . . . . . . . . . . 1,523 $—Granted . . . . . . . . . . . . . . . . . . . . . . . . . . . . . . . . . . . . 522 $—Vested or issued . . . . . . . . . . . . . . . . . . . . . . . . . . . . . . (730) $—Cancelled or forfeited . . . . . . . . . . . . . . . . . . . . . . . . . . (97) $—
Outstanding at December 29, 2018 . . . . . . . . . . . . . . . . . 1,218 $— 0.86 $95,620
Outstanding at December 29, 2018 and expected to vest . 1,147 $— 0.86 $90,008
Weighted- Weighted-Average AggregateAverage Remaining Intrinsic
Shares Purchase Vesting Term ValuePSUs and MSUs (000s) Price (In Years) (000s)
Outstanding at December 30, 2017 . . . . . . . . . . . . . . . . . 259 $—Granted . . . . . . . . . . . . . . . . . . . . . . . . . . . . . . . . . . . . 81 $—Earned or issued . . . . . . . . . . . . . . . . . . . . . . . . . . . . . . (37) $—Cancelled or forfeited . . . . . . . . . . . . . . . . . . . . . . . . . . (21) $—
Outstanding at December 29, 2018 . . . . . . . . . . . . . . . . . 282 $— 1.1 $22,164
Outstanding at December 29, 2018 and expected to vest . 249 $— 1.1 $19,615
The following summarizes the Company’s weighted average fair value at the date of grant:
Year Ended
December 29, December 30, December 31,2018 2017 2016
Per grant of RSAs and RSUs . . . . . . . . . . . $93.75 $72.85 $40.55Per grant of PSUs and MSUs . . . . . . . . . . . $97.53 $78.40 $32.23Per grant of stock options . . . . . . . . . . . . . . $ — $ — $40.38
F-38

Silicon Laboratories Inc.Notes to Consolidated Financial Statements
December 29, 2018 (Continued)
14. Stock-Based Compensation (Continued)
The following summarizes the Company’s stock-based payment and stock option values (inthousands):
Year Ended
December 29, December 30, December 31,2018 2017 2016
Intrinsic value of stock options exercised . . . $ 1,952 $ 2,174 $ 2,560Intrinsic value of RSUs that vested . . . . . . . $68,012 $53,093 $36,502Grant date fair value of RSUs that vested . . $37,720 $32,449 $39,853Intrinsic value of MSUs that vested . . . . . . . $ 3,562 $ 687 $ —Grant date fair value of MSUs that vested . . $ 1,788 $ 633 $ —
The Company received cash of $13.3 million for the issuance of common stock, and paid$19.5 million for shares withheld for taxes, during fiscal 2018. The Company issues shares from theshares reserved under its stock plans upon the exercise of stock options, vesting of RSUs, PSUs andMSUs, and purchases through employee stock purchase plans. The Company does not currently expectto repurchase shares from any source to satisfy such obligation.
The following table presents details of stock-based compensation costs recognized in theConsolidated Statements of Income (in thousands):
Year Ended
December 29, December 30, December 31,2018 2017 2016
Cost of revenues . . . . . . . . . . . . . . . . . . . . . $ 1,238 $ 1,090 $ 1,070Research and development . . . . . . . . . . . . . 23,867 21,771 19,573Selling, general and administrative . . . . . . . . 24,972 21,891 18,985
50,077 44,752 39,628Income tax benefit . . . . . . . . . . . . . . . . . . . 8,890 11,073 8,496
$41,187 $33,679 $31,132
The decrease in income tax benefit in fiscal 2018 was due to the reduced current and futuredeductibility of executive stock compensation as a result of the Tax Cuts and Jobs Act. The increase inincome tax benefit in fiscal 2017 was primarily due to the recognition of excess tax benefits inconnection with the Company’s adoption of ASU 2016-09, offset in part by an adjustment in thedeferred tax asset due to the recent tax reform. The Company had approximately $65.4 million of totalunrecognized compensation costs related to granted stock options and awards as of December 29, 2018that are expected to be recognized over a weighted-average period of approximately 1.9 years. Therewere no significant stock-based compensation costs capitalized into assets in any of the periodspresented.
F-39

Silicon Laboratories Inc.Notes to Consolidated Financial Statements
December 29, 2018 (Continued)
14. Stock-Based Compensation (Continued)
As of December 29, 2018, the Company had reserved shares of common stock for future issuanceas follows (in thousands):
2009 Stock Incentive Plan . . . . . . . . . . . . . . . . . . . . . . . . . . . . . . . . . . . . . . 2,3432009 Employee Stock Purchase Plan . . . . . . . . . . . . . . . . . . . . . . . . . . . . . . 985
Total shares reserved . . . . . . . . . . . . . . . . . . . . . . . . . . . . . . . . . . . . . . . . . 3,328
15. Employee Benefit Plan
The Company maintains a defined contribution or 401(k) Plan for its qualified U.S. employees.Participants may contribute a percentage of their compensation on a pre-tax basis, subject to amaximum annual contribution imposed by the Internal Revenue Code. The Company may makediscretionary matching contributions as well as discretionary profit-sharing contributions to the401(k) Plan. The Company contributed $3.7 million, $3.5 million and $3.4 million to the 401(k) Planduring fiscal 2018, 2017 and 2016, respectively.
16. Related Party Transactions
On July 1, 2013, Geir Førre joined the Company as senior vice president. Mr. Førre was chiefexecutive officer of Energy Micro, until it was acquired by the Company. Mr. Førre was the beneficialowner of approximately 30% of the Energy Micro equity. In fiscal 2016, the Company entered into anagreement which settled the amount of the earn-out to be paid for fiscal 2015 through 2018. Under thisagreement, Mr. Førre received approximately $4.8 million.
Alf-Egil Bogen served on the Company’s board of directors from October 17, 2013 to April 21,2016. Mr. Bogen was chief marketing officer of Energy Micro, until it was acquired by the Company.Mr. Bogen was the beneficial owner of approximately 2% of the Energy Micro equity. Under thesettlement agreement, Mr. Bogen received approximately $0.3 million that was paid for fiscal 2015through 2018 earn-out.
17. Income Taxes
The Tax Cuts and Jobs Act (the Act) was enacted in the U.S. on December 22, 2017. The Actreduced the U.S. federal corporate income tax rate to 21% from 35%, required companies to pay aone-time Transition Tax on earnings of certain foreign subsidiaries that were previously tax deferredand created new taxes on certain foreign-sourced earnings. In 2017 and the first nine months of 2018,the Company recorded provisional amounts for certain enactment-date effects of the Act by applyingthe guidance in Staff Accounting Bulletin No. 118 or ‘‘SAB 118’’ because it had not yet completed theenactment-date accounting for these effects. In 2017, the Company recorded tax expense related to theenactment-date effects of the Act that included recording the one-time Transition Tax liability related toundistributed earnings of certain foreign subsidiaries that were not previously taxed, the revaluation ofdeferred tax assets and liabilities and other deferred tax impacts. In 2018, certain discrete adjustmentsto provisional amounts were recorded. The changes to the 2017 enactment-date provisional amountsdecreased the effective tax rate in 2018 by (6.2)%.
F-40

Silicon Laboratories Inc.Notes to Consolidated Financial Statements
December 29, 2018 (Continued)
17. Income Taxes (Continued)
SAB 118 measurement period
The Company applied the guidance in SAB 118 when accounting for the enactment-date effects ofthe Act in 2017 and throughout 2018. At December 30, 2017, the Company had not completed itsaccounting for the enactment-date income tax effects of the Act under ASC 740, Income Taxes,specifically for the following aspects: remeasurement of deferred tax assets and liabilities, one-timeTransition Tax, its indefinite reinvestment assertion and its accounting policy for global intangiblelow-taxed income. As of December 29, 2018, the Company has now completed its accounting for all ofthe enactment-date income tax effects of the Act. As further discussed below, during 2018, theCompany recognized a benefit of $4.5 million to the provisional amounts recorded at December 30,2017 and included these adjustments as a component of income tax expense from continuingoperations.
One-time Transition Tax
The one-time Transition Tax is based on the Company’s total post-1986 earnings and profits(E&P), which were previously deferred from U.S. income tax under U.S. tax law. The Companyrecorded a provisional amount for its one-time Transition Tax liability for each of its foreignsubsidiaries, resulting in a Transition Tax cost of $54.4 million, which after offset by tax attributesresulted in a total provisional Transition Tax liability of $42.6 million at December 30, 2017.
Upon further analysis of the Act, Notices and Regulations issued and proposed by the U.S.Department of the Treasury and the Internal Revenue Service, the Company finalized its calculations ofthe Transition Tax liability during 2018. The Company decreased its December 30, 2017 provisionalamount by $6.1 million, which is included as a component of income tax expense from continuingoperations. The Company elected to pay the Transition Tax over the eight-year period provided in theAct. As of December 29, 2018, the unpaid balance of its Transition Tax obligation is $21.6 million,which is payable between April 2022 and April 2025.
Deferred tax assets and liabilities
As of December 30, 2017, the Company remeasured certain deferred tax assets and liabilitiesbased on the tax rates at which they were expected to reverse in the future (which was generally 21%),by recording a net provisional benefit of $28.1 million. This included the release of a deferred taxliability for future foreign earnings generated by one of the Company’s foreign subsidiaries uponresolution of the Altera case of $39.4 million as well as the release of approximately $10.5 million ofvaluation allowances with corresponding deferred tax benefits. These benefits were offset by therevaluation of the Company’s net deferred tax asset and a corresponding increase to deferred taxexpense of $21.8 million. Upon further analysis of certain aspects of the Act and refinement of itscalculations during the 12 months ended December 29, 2018, the Company reduced its provisionalbenefit by $1.0 million, which is included as a component of income tax expense from continuingoperations.
Global intangible low-taxed income (GILTI)
The Act subjects a U.S. shareholder to tax on GILTI earned by certain foreign subsidiaries. TheFASB Staff Q&A, Topic 740, No. 5, Accounting for Global Intangible Low-Taxed Income, states that an
F-41
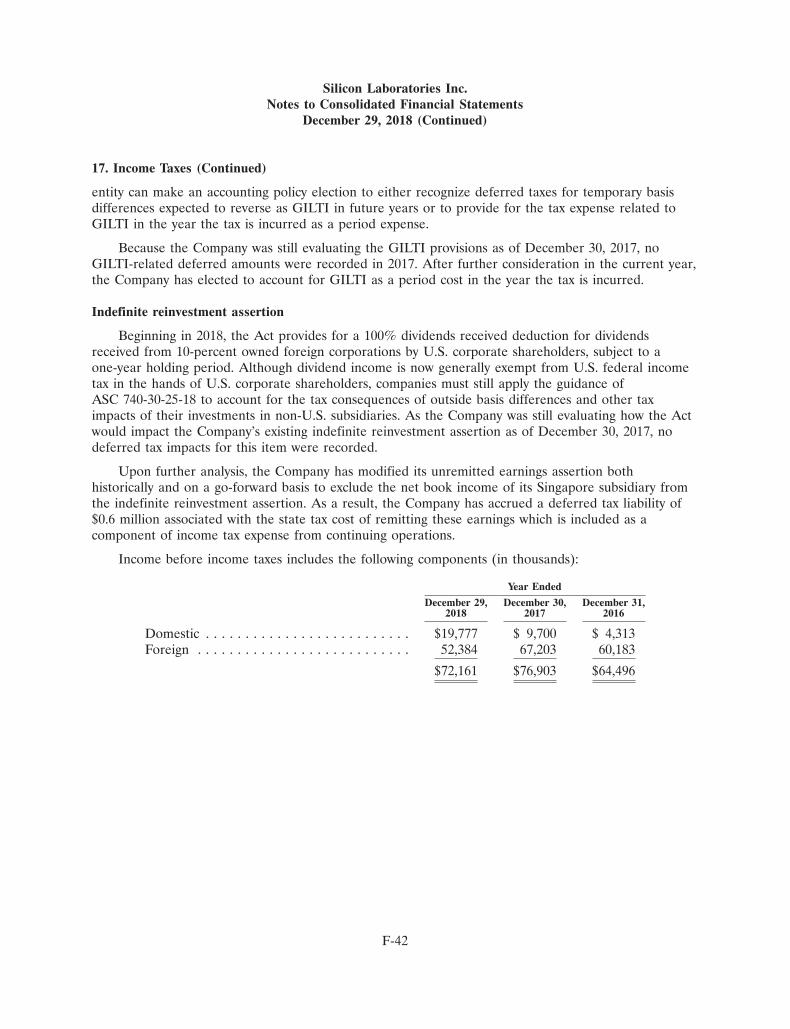
Silicon Laboratories Inc.Notes to Consolidated Financial Statements
December 29, 2018 (Continued)
17. Income Taxes (Continued)
entity can make an accounting policy election to either recognize deferred taxes for temporary basisdifferences expected to reverse as GILTI in future years or to provide for the tax expense related toGILTI in the year the tax is incurred as a period expense.
Because the Company was still evaluating the GILTI provisions as of December 30, 2017, noGILTI-related deferred amounts were recorded in 2017. After further consideration in the current year,the Company has elected to account for GILTI as a period cost in the year the tax is incurred.
Indefinite reinvestment assertion
Beginning in 2018, the Act provides for a 100% dividends received deduction for dividendsreceived from 10-percent owned foreign corporations by U.S. corporate shareholders, subject to aone-year holding period. Although dividend income is now generally exempt from U.S. federal incometax in the hands of U.S. corporate shareholders, companies must still apply the guidance ofASC 740-30-25-18 to account for the tax consequences of outside basis differences and other taximpacts of their investments in non-U.S. subsidiaries. As the Company was still evaluating how the Actwould impact the Company’s existing indefinite reinvestment assertion as of December 30, 2017, nodeferred tax impacts for this item were recorded.
Upon further analysis, the Company has modified its unremitted earnings assertion bothhistorically and on a go-forward basis to exclude the net book income of its Singapore subsidiary fromthe indefinite reinvestment assertion. As a result, the Company has accrued a deferred tax liability of$0.6 million associated with the state tax cost of remitting these earnings which is included as acomponent of income tax expense from continuing operations.
Income before income taxes includes the following components (in thousands):
Year Ended
December 29, December 30, December 31,2018 2017 2016
Domestic . . . . . . . . . . . . . . . . . . . . . . . . . . $19,777 $ 9,700 $ 4,313Foreign . . . . . . . . . . . . . . . . . . . . . . . . . . . 52,384 67,203 60,183
$72,161 $76,903 $64,496
F-42

Silicon Laboratories Inc.Notes to Consolidated Financial Statements
December 29, 2018 (Continued)
17. Income Taxes (Continued)
The provision (benefit) for income taxes consists of the following (in thousands):
Year Ended
December 29, December 30, December 31,2018 2017 2016
Current:Domestic . . . . . . . . . . . . . . . . . . . . . . . . $ (8,843) $ 48,947 $ 2,639Foreign . . . . . . . . . . . . . . . . . . . . . . . . . . 5,888 7,077 4,421
Total Current . . . . . . . . . . . . . . . . . . . . . (2,955) 56,024 7,060
Deferred:Domestic . . . . . . . . . . . . . . . . . . . . . . . . (8,978) (25,760) (2,430)Foreign . . . . . . . . . . . . . . . . . . . . . . . . . . 503 (453) (1,628)
Total Deferred . . . . . . . . . . . . . . . . . . . . (8,475) (26,213) (4,058)
Provision (benefit) for income taxes . . . . . . . $(11,430) $ 29,811 $ 3,002
The reconciliation of the federal statutory tax rate to the Company’s effective tax rate is as follows:
Year Ended
December 29, December 30, December 31,2018 2017 2016
Federal statutory rate . . . . . . . . . . . . . . . . . 21.0% 35.0% 35.0%Foreign tax rate benefit . . . . . . . . . . . . . . . . (12.9) (25.4) (22.6)Research and development tax credits . . . . . (9.8) (4.5) (4.1)GILTI and Subpart F income . . . . . . . . . . . 4.3 1.4 1.4Nondeductible (nontaxable) foreign expenses 3.9 1.1 (4.0)State tax expense . . . . . . . . . . . . . . . . . . . . 1.5 0.9 0.6Release of prior year unrecognized tax
benefits . . . . . . . . . . . . . . . . . . . . . . . . . . (2.7) (0.6) (1.7)Excess officer compensation . . . . . . . . . . . . 2.4 1.5 1.4Other tax effects of equity compensation . . . (0.4) (2.2) (1.5)Change in cost-sharing treatment of stock-
based compensation . . . . . . . . . . . . . . . . . (2.2) 5.2 (0.5)Excess tax benefit of stock-based
compensation . . . . . . . . . . . . . . . . . . . . . (5.9) (5.6) —Change in prior period valuation allowance . (2.5) (1.3) (0.6)Transition tax on unremitted foreign
earnings . . . . . . . . . . . . . . . . . . . . . . . . . (8.4) 70.8 —Revaluation of deferred tax balances . . . . . . 0.3 28.2 —Other deferred tax impacts of tax reform . . . (3.1) (64.8) —Other . . . . . . . . . . . . . . . . . . . . . . . . . . . . . (1.3) (0.9) 1.3
Effective Tax Rate . . . . . . . . . . . . . . . . . . . (15.8)% 38.8% 4.7%
F-43

Silicon Laboratories Inc.Notes to Consolidated Financial Statements
December 29, 2018 (Continued)
17. Income Taxes (Continued)
The effective tax rate for fiscal 2018 decreased from fiscal 2017 primarily due to the reduction inthe U.S. federal statutory rate as well as the inclusion of one-time tax impacts recorded in 2017 fromthe enactment of the Act. This decrease in the effective tax rate was offset by a decrease in theCompany’s foreign tax rate benefit.
The effective tax rate for fiscal 2017 increased from fiscal 2016 primarily due to the one-timeTransition Tax on unrepatriated earnings of certain foreign subsidiaries as a result of the enactment ofthe Act. Additional tax expense was also recognized for the revaluation of the Company’s deferred taxassets and liabilities due to the change in the federal tax rate from 35% to 21%. These increases in taxexpense were partially offset by the release of a deferred tax liability related to future foreign earningsexpected under the Company’s intercompany cost-sharing arrangement, as well as a decrease in thevaluation allowance established on federal research and development tax credits.
On July 27, 2015, the U.S. Tax Court issued an opinion in Altera Corp. v. Commissioner whichconcluded that related parties in an intercompany cost-sharing arrangement are not required to shareexpenses related to stock-based compensation. In February 2016, the U.S. Internal Revenue Serviceappealed the decision to the U.S Court of Appeals for the Ninth Circuit (the ‘‘Ninth Circuit’’). OnJuly 24, 2018, the Ninth Circuit reversed the 2015 decision of the U.S. Tax Court; however, onAugust 7, 2018, the Ninth Circuit withdrew its July 2018 decision to allow time for a reconstitutedpanel to confer on the appeal. On October 16, 2018, a rehearing was held, however, no decision hasbeen made by the Ninth Circuit. Although the U.S. Treasury has not withdrawn the requirement toinclude stock-based compensation from its regulations, based on the facts and circumstances of the TaxCourt Case, the Company continues to reflect a tax benefit in its financial statements based on theexpectation that the Tax Court decision will be upheld on appeal. As of the end of fiscal 2018, theCompany’s financial statements reflect a net deferred tax asset of $27.2 million for this position. TheCompany will continue to monitor ongoing developments and potential impacts to its ConsolidatedFinancial Statements.
The Company’s operations in Singapore are subject to reduced tax rates through June 30, 2024, aslong as certain conditions are met. Without the impact of the one-time Transition Tax, the income taxbenefit from the reduced Singapore tax rate reflected in earnings was approximately $5.4 million(representing $0.12 per diluted share) in fiscal 2018, approximately $11.0 million (representing $0.25per diluted share) in fiscal 2017 and approximately $7.7 million (representing $0.18 per diluted share)in fiscal 2016.
Deferred Income Taxes
Deferred tax assets and liabilities are recorded for the estimated tax impact of temporarydifferences between the tax basis and book basis of assets and liabilities. Significant components of the
F-44

Silicon Laboratories Inc.Notes to Consolidated Financial Statements
December 29, 2018 (Continued)
17. Income Taxes (Continued)
Company’s deferred taxes as of December 29, 2018 and December 30, 2017 are as follows(in thousands):
December 29, December 30,2018 2017
Deferred tax assets:Net operating loss carryforwards . . . . . . . . . . . . . . . . . $ 9,973 $12,925Research and development tax credit carryforwards . . . . 12,500 12,322Stock-based compensation . . . . . . . . . . . . . . . . . . . . . . 4,360 5,256Depreciation and amortization . . . . . . . . . . . . . . . . . . . 7,799 —Capitalized research and development . . . . . . . . . . . . . 2,521 3,468Deferred income on shipments to distributors . . . . . . . . 5,824 7,070Expected future cost-sharing adjustment . . . . . . . . . . . . 25,257 21,582Accrued liabilities and other . . . . . . . . . . . . . . . . . . . . 7,737 6,999
75,971 69,622Less: Valuation allowance . . . . . . . . . . . . . . . . . . . . . . (4,975) (6,518)
70,996 63,104
Deferred tax liabilities:Acquired intangible assets . . . . . . . . . . . . . . . . . . . . . . 20,656 13,884Depreciation and amortization . . . . . . . . . . . . . . . . . . . 4,604 1,274Convertible debt . . . . . . . . . . . . . . . . . . . . . . . . . . . . . 8,080 10,351Prepaid expenses and other . . . . . . . . . . . . . . . . . . . . . 2,142 1,421
35,482 26,930
Net deferred tax assets . . . . . . . . . . . . . . . . . . . . . . . . $35,514 $36,174
As of December 29, 2018, the Company had federal net operating loss and research anddevelopment tax credit carryforwards of approximately $32.7 million and $1.9 million, respectively, as aresult of the Silicon Clocks, Spectra Linear and Ember acquisitions. These carryforwards expire in fiscalyears 2020 through 2031. Recognition of these loss and credit carryforwards is subject to an annuallimit, which may cause them to expire before they are used.
As of December 29, 2018, the Company had foreign net operating loss carryforwards ofapproximately $1.9 million as a result of the Energy Micro acquisition. These loss carryforwards do notexpire and recognition is not subject to an annual limit.
The Company also had state loss, state tentative minimum tax credit, and state research anddevelopment tax credit carryforwards of approximately $43.8 million, $0.1 million, and $13.5 million,respectively. A portion of these loss and credit carryforwards was generated by the Company and aportion was acquired through the Integration Associates, Silicon Clocks, Spectra Linear, Ember andZentri acquisitions. Certain of these carryforwards expire in fiscal years 2019 through 2036, and othersdo not expire. Recognition of some of these loss and credit carryforwards is subject to an annual limit,which may cause them to expire before they are used.
F-45

Silicon Laboratories Inc.Notes to Consolidated Financial Statements
December 29, 2018 (Continued)
17. Income Taxes (Continued)
A valuation allowance is established against a deferred tax asset when it is more likely than notthat the deferred tax asset will not be realized. As of December 29, 2018, the Company maintains avaluation allowance with respect to certain deferred tax assets relating to state research anddevelopment tax credit and state net operating loss carryforwards.
At the end of fiscal 2018, undistributed earnings of certain of the Company’s foreign subsidiariesof approximately $105 million are intended to be permanently reinvested outside the U.S. Accordingly,no provision for foreign withholding tax and state income taxes associated with a distribution of theseearnings has been made. Determination of the amount of the unrecognized deferred tax liability onthese unremitted earnings is not practicable.
Uncertain Tax Positions
The following table summarizes the activity related to gross unrecognized tax benefits(in thousands):
Year Ended
December 29, December 30, December 31,2018 2017 2016
Beginning balance . . . . . . . . . . . . . . . . . . . . $ 3,187 $3,054 $ 3,610Additions based on tax positions related to
current year . . . . . . . . . . . . . . . . . . . . . . 630 456 439Additions based on tax positions related to
prior years . . . . . . . . . . . . . . . . . . . . . . . 115 114 99Reductions for tax positions as a result of a
lapse of the applicable statute oflimitations . . . . . . . . . . . . . . . . . . . . . . . . (1,896) (437) (1,094)
Ending balance . . . . . . . . . . . . . . . . . . . . . . $ 2,036 $3,187 $ 3,054
As of December 29, 2018, December 30, 2017 and December 31, 2016, the Company had grossunrecognized tax benefits, inclusive of interest, of $2.1 million, $3.2 million and $3.0 million,respectively, of which $2.1 million, $3.2 million and $2.2 million, respectively, would affect the effectivetax rate if recognized.
The Company recognizes interest and penalties related to unrecognized tax benefits in theprovision for income taxes. These amounts were not material for fiscal years 2018, 2017 and 2016.
The Norwegian Tax Administration (‘‘NTA’’) has completed its examination of the Company’sNorwegian subsidiary for income tax matters relating to fiscal years 2013, 2014, 2015 and 2016. TheCompany received a final assessment from the NTA in December 2017 concerning an adjustment to its2013 taxable income related to the pricing of an intercompany transaction. The Company is currentlyappealing the assessment. Since the original assessment was issued, the NTA has reduced itsassessment. The revised adjustment to the pricing of the intercompany transaction results inapproximately $16.2 million additional Norwegian income tax. The Company disagrees with the NTA’sassessment and believes the Company’s position on this matter is more likely than not to be sustained.The Company plans to exhaust all available administrative remedies, and if unable to resolve this
F-46

Silicon Laboratories Inc.Notes to Consolidated Financial Statements
December 29, 2018 (Continued)
17. Income Taxes (Continued)
matter through administrative remedies with the NTA, the Company plans to pursue judicial remedies.The NTA may request an advance payment of approximately $9 million during the appeal process.
The Company believes that it has accrued adequate reserves related to all matters contained in taxperiods open to examination. Should the Company experience an unfavorable outcome in the NTAmatter, however, such an outcome could have a material impact on its financial statements.
Tax years 2014 through 2018 remain open to examination by the major taxing jurisdictions in whichthe Company operates. The Company is not currently under audit in any major taxing jurisdiction.
The Company believes it is reasonably possible that the gross unrecognized tax benefits will notdecrease in the next 12 months.
18. Segment Information
The Company has one operating segment, mixed-signal analog intensive products, consisting ofnumerous product areas. The Company’s chief operating decision maker is considered to be its ChiefExecutive Officer. The chief operating decision maker allocates resources and assesses performance ofthe business and other activities at the operating segment level.
The Company groups its products into four categories, based on the markets and applications inwhich the products may be used. See Note 13, Revenues, for a summary of the Company’s revenue byproduct category.
Revenue is attributed to a geographic area based on the shipped-to location. The followingsummarizes the Company’s revenue by geographic area (in thousands):
Year Ended
December 29, December 30, December 31,2018 2017 2016
United States . . . . . . . . . . . . . . . . . . . . . . . $149,385 $112,574 $ 94,583China . . . . . . . . . . . . . . . . . . . . . . . . . . . . . 344,255 307,748 291,974Rest of world . . . . . . . . . . . . . . . . . . . . . . . 374,627 348,545 311,069
Total . . . . . . . . . . . . . . . . . . . . . . . . . . . . . $868,267 $768,867 $697,626
The following summarizes the Company’s property and equipment, net by geographic area(in thousands):
December 29, December 30,2018 2017
United States . . . . . . . . . . . . . . . . . . . . . . . . . . . . . . . . . $128,622 $119,746Rest of world . . . . . . . . . . . . . . . . . . . . . . . . . . . . . . . . . 10,427 7,936
Total . . . . . . . . . . . . . . . . . . . . . . . . . . . . . . . . . . . . . . . $139,049 $127,682
F-47

Supplementary Financial Information (Unaudited)
Quarterly financial information for fiscal 2018 and 2017 is as follows. All quarterly periodsreported here had 13 weeks (in thousands, except per share amounts):
Fiscal 2018
Fourth Third Second FirstQuarter Quarter Quarter Quarter
Revenues . . . . . . . . . . . . . . . . . . . . . . . . . . . . . . . . . . . . $215,534 $230,243 $217,106 $205,384Gross margin . . . . . . . . . . . . . . . . . . . . . . . . . . . . . . . . . 130,243 135,627 131,292 124,237Operating income . . . . . . . . . . . . . . . . . . . . . . . . . . . . . . 18,362 25,130 18,001 23,715Net income . . . . . . . . . . . . . . . . . . . . . . . . . . . . . . . . . . $ 15,145 $ 27,761 $ 14,280 $ 26,405
Earnings per share:Basic . . . . . . . . . . . . . . . . . . . . . . . . . . . . . . . . . . . . . $ 0.35 $ 0.64 $ 0.33 $ 0.61Diluted . . . . . . . . . . . . . . . . . . . . . . . . . . . . . . . . . . . . $ 0.35 $ 0.63 $ 0.32 $ 0.60
Fiscal 2017
Fourth Third Second FirstQuarter Quarter Quarter Quarter
Revenues . . . . . . . . . . . . . . . . . . . . . . . . . . . . . . . . . . . . $201,018 $198,723 $190,098 $179,028Gross margin . . . . . . . . . . . . . . . . . . . . . . . . . . . . . . . . . 119,264 116,574 113,192 105,161Operating income . . . . . . . . . . . . . . . . . . . . . . . . . . . . . . 26,390 24,968 20,934 12,682Net income (loss) . . . . . . . . . . . . . . . . . . . . . . . . . . . . . . $ (4,852) $ 19,949 $ 16,569 $ 15,426
Earnings (loss) per share:Basic . . . . . . . . . . . . . . . . . . . . . . . . . . . . . . . . . . . . . $ (0.11) $ 0.47 $ 0.39 $ 0.37Diluted . . . . . . . . . . . . . . . . . . . . . . . . . . . . . . . . . . . . $ (0.11) $ 0.46 $ 0.38 $ 0.36
Supplementary Financial Informationto the Annual Report
Appendix I. Reconciliation of GAAPto Non-GAAP Financial Measures

(This page has been left blank intentionally.)

Appendix I: Supplemental Financial Information (Unaudited)
The non-GAAP financial measurements provided below do not replace the presentation of SiliconLaboratories’ GAAP financial results. These measurements merely provide supplemental information toassist investors in analyzing Silicon Laboratories’ financial position and results of operations; however, thesemeasures are not in accordance with, or an alternative to, GAAP and may be different from non-GAAPmeasures used by other companies. We are providing this information because it may enable investors toperform meaningful comparisons of operating results, and more clearly highlight the results of core ongoingoperations.
Unaudited Reconciliation of GAAP to Non-GAAP Financial Measures(In thousands, except per share data)
Year EndedDecember 29, 2018
TerminationGAAP Stock Intangible Acquisition Costs and Non-cash Income Non-GAAP
Non-GAAP Income GAAP Percent of Compensation Asset Related Fair Value Interest Tax Non-GAAP Percent ofStatement Items Measure Revenue Expense* Amortization* Items* Adjustments* Expense* Adjustments Measure Revenue
Revenues . . . . . . . $868,267
Gross margin . . . . . 521,399 60.1% $ 1,238 $ — $ 6,114 $ — $ — $ — $528,751 60.9%
Research anddevelopment . . . . 238,347 27.5% 23,867 27,297 — — — — 187,183 21.6%
Selling, general andadministrative . . . 197,844 22.8% 24,972 10,440 4,863 256 — — 157,313 18.1%
Operating expenses . 436,191 50.3% 48,839 37,737 4,863 256 — — 344,496 39.7%
Operating income . . 85,208 9.8% 50,077 37,737 10,977 256 — — 184,255 21.2%
Net income . . . . . . 83,591 9.6% 50,077 37,737 10,977 2,056 11,202 (32,081) 163,559 18.8%
Diluted sharesoutstanding . . . . 44,044 — — — — — — 44,044
Diluted earnings pershare . . . . . . . . $ 1.90 $ 3.71
* Represents pre-tax amounts
Three Months EndedDecember 29, 2018
TerminationGAAP Stock Intangible Acquisition Costs and Non-cash Income Non-GAAP
Non-GAAP Income GAAP Percent of Compensation Asset Related Fair Value Interest Tax Non-GAAP Percent ofStatement Items Measure Revenue Expense* Amortization* Items* Adjustments* Expense* Adjustments Measure Revenue
Revenues . . . . . . . $215,534
Gross margin . . . . . 130,243 60.4% $ 323 $ — $— $ — $ — $ — $130,566 60.6%
Research anddevelopment . . . . 62,933 29.2% 6,413 7,760 — — — — 48,760 22.6%
Selling, general andadministrative . . . 48,948 22.7% 6,447 3,020 — — — — 39,481 18.4%
Operating expenses . 111,881 51.9% 12,860 10,780 — — — — 88,241 41.0%
Operating income . . 18,362 8.5% 13,183 10,780 — — — — 42,325 19.6%
Net income . . . . . . 15,145 7.0% 13,183 10,780 — 2,785 2,880 (4,777) 39,996 18.6%
Diluted sharesoutstanding . . . . 43,774 — — — — — — 43,774
Diluted earnings pershare . . . . . . . . $ 0.35 $ 0.91
* Represents pre-tax amounts

Unaudited Reconciliation of GAAP to Non-GAAP Financial Measures(In thousands, except per share data)(Continued)
Three Months EndedSeptember 29, 2018
TerminationGAAP Stock Intangible Acquisition Costs and Non-cash Income Non-GAAP
Non-GAAP Income GAAP Percent of Compensation Asset Related Fair Value Interest Tax Non-GAAP Percent ofStatement Items Measure Revenue Expense* Amortization* Items* Adjustments* Expense* Adjustments Measure Revenue
Revenues . . . . . . . $230,243
Gross margin . . . . . 135,627 58.9% $ 324 $ — $3,967 $ — $ — $ — $139,918 60.8%
Research anddevelopment . . . . 61,091 26.5% 6,016 7,810 — — — — 47,265 20.5%
Selling, general andadministrative . . . 49,406 21.5% 6,242 3,179 — 256 — — 39,729 17.3%
Operating expenses . 110,497 48.0% 12,258 10,989 — 256 — — 86,994 37.8%
Operating income . . 25,130 10.9% 12,582 10,989 3,967 256 — — 52,924 23.0%
Net income . . . . . . 27,761 12.1% 12,582 10,989 3,967 256 2,801 (13,700) 44,656 19.4%
Diluted sharesoutstanding . . . . 44,194 — — — — — — 44,194
Diluted earnings pershare . . . . . . . . $ 0.63 $ 1.01
* Represents pre-tax amounts
Three Months EndedJune 30, 2018
TerminationGAAP Stock Intangible Acquisition Costs and Non-cash Income Non-GAAP
Non-GAAP Income GAAP Percent of Compensation Asset Related Fair Value Interest Tax Non-GAAP Percent ofStatement Items Measure Revenue Expense* Amortization* Items* Adjustments* Expense* Adjustments Measure Revenue
Revenues . . . . . . . $217,106
Gross margin . . . . . 131,292 60.5% $ 294 $ — $2,148 $— $ — $ — $133,734 61.6%
Research anddevelopment . . . . 59,495 27.4% 5,669 6,940 — — — — 46,886 21.6%
Selling, general andadministrative . . . 53,796 24.8% 6,156 2,726 4,163 — — — 40,751 18.8%
Operating expenses . 113,291 52.2% 11,825 9,666 4,163 — — — 87,637 40.4%
Operating income . . 18,001 8.3% 12,119 9,666 6,311 — — — 46,097 21.2%
Net income . . . . . . 14,280 6.6% 12,119 9,666 6,311 — 2,767 (4,559) 40,584 18.7%
Diluted sharesoutstanding . . . . 44,294 — — — — — — 44,294
Diluted earnings pershare . . . . . . . . $ 0.32 $ 0.92
* Represents pre-tax amounts

Unaudited Reconciliation of GAAP to Non-GAAP Financial Measures(In thousands, except per share data)(Continued)
Three Months EndedMarch 31, 2018
TerminationGAAP Stock Intangible Acquisition Costs and Non-cash Income Non-GAAP
Non-GAAP Income GAAP Percent of Compensation Asset Related Fair Value Interest Tax Non-GAAP Percent ofStatement Items Measure Revenue Expense* Amortization* Items* Adjustments* Expense* Adjustments Measure Revenue
Revenues . . . . . . . $205,384
Gross margin . . . . . 124,237 60.5% $ 296 $ — $ — $ — $ — $ — $124,533 60.6%
Research anddevelopment . . . . 54,828 26.7% 5,769 4,787 — — — — 44,272 21.6%
Selling, general andadministrative . . . 45,694 22.3% 6,127 1,515 700 — — — 37,352 18.1%
Operating expenses . 100,522 49.0% 11,896 6,302 700 — — — 81,624 39.7%
Operating income . . 23,715 11.5% 12,192 6,302 700 — — — 42,909 20.9%
Net income . . . . . . 26,405 12.9% 12,192 6,302 700 (985) 2,754 (9,045) 38,323 18.7%
Diluted sharesoutstanding . . . . 43,918 — — — — — — 43,918
Diluted earnings pershare . . . . . . . . $ 0.60 $ 0.87
* Represents pre-tax amounts
Year EndedDecember 30, 2017
GAAP Stock Intangible Acquisition Non-cash Income Non-GAAPNon-GAAP Income GAAP Percent of Compensation Asset Related Interest Tax Non-GAAP Percent ofStatement Items Measure Revenue Expense* Amortization* Items* Expense* Adjustments Measure Revenue
Revenues . . . . . . . . . . $768,867
Gross margin . . . . . . . . 454,191 59.1% $ 1,090 $ — $ 124 $ — $ — $455,405 59.2%
Research anddevelopment . . . . . . . 209,491 27.2% 21,771 20,075 356 — — 167,289 21.8%
Selling, general andadministrative . . . . . . 159,726 20.8% 21,891 6,546 1,101 — — 130,188 16.9%
Operating expenses . . . . 369,217 48.0% 43,662 26,621 1,457 — — 297,477 38.7%
Operating income . . . . . 84,974 11.1% 44,752 26,621 1,581 — — 157,928 20.5%
Net income . . . . . . . . . 47,092 6.1% 44,752 26,621 1,581 6,834 14,304 141,184 18.4%
Diluted sharesoutstanding . . . . . . . 43,332 — — — — — 43,332
Diluted earnings pershare . . . . . . . . . . . $ 1.09 $ 3.26
* Represents pre-tax amounts
Unaudited Reconciliation of GAAP to Non-GAAP Financial Measures(In thousands, except per share data)(Continued)
Three Months EndedDecember 30, 2017
GAAP Stock Intangible Acquisition Non-cash Income Non-GAAPNon-GAAP Income GAAP Percent of Compensation Asset Related Interest Tax Non-GAAP Percent ofStatement Items Measure Revenue Expense* Amortization* Items* Expense* Adjustments Measure Revenue
Revenues . . . . . . . . $201,018
Gross margin . . . . . . 119,264 59.3% $ 287 $ — $ — $ — $ — $119,551 59.5%
Research anddevelopment . . . . . 52,735 26.2% 5,611 4,943 — — — 42,181 21.0%
Selling, general andadministrative . . . . 40,139 20.0% 5,847 1,647 (110) — — 32,755 16.3%
Operating expenses . . 92,874 46.2% 11,458 6,590 (110) — — 74,936 37.3%
Operating income . . . 26,390 13.1% 11,745 6,590 (110) — — 44,615 22.2%
Net income (loss) . . . (4,852) (2.4)% 11,745 6,590 (110) 2,748 24,631 40,752 20.3%
GAAP Non-GAAPMeasure Dilutive Securities Excluded From GAAP Measure Due to Net Loss Measure
Diluted sharesoutstanding . . . . . . 42,656 1,088 43,744
Diluted earningsper share . . . . . . . $ (0.11) $ 0.93
* Represents pre-tax amounts
Three Months EndedSeptember 30, 2017
GAAP Stock Intangible Acquisition Non-cash Income Non-GAAPNon-GAAP Income GAAP Percent of Compensation Asset Related Interest Tax Non-GAAP Percent ofStatement Items Measure Revenue Expense* Amortization* Items* Expense* Adjustments Measure Revenue
Revenues . . . . . . . . $198,723
Gross margin . . . . . . 116,574 58.7% $ 281 $ — $ — $ — $ — $116,855 58.8%
Research anddevelopment . . . . . 52,000 26.2% 5,411 5,187 — — — 41,402 20.8%
Selling, general andadministrative . . . . 39,606 19.9% 5,663 1,647 161 — — 32,135 16.2%
Operating expenses . . 91,606 46.1% 11,074 6,834 161 — — 73,537 37.0%
Operating income . . . 24,968 12.6% 11,355 6,834 161 — — 43,318 21.8%
Net income . . . . . . . 19,949 10.0% 11,355 6,834 161 2,674 (1,796) 39,177 19.7%
Diluted sharesoutstanding . . . . . . 43,374 — — — — — 43,374
Diluted earnings pershare . . . . . . . . . . $ 0.46 $ 0.90
* Represents pre-tax amounts

Unaudited Reconciliation of GAAP to Non-GAAP Financial Measures(In thousands, except per share data)(Continued)
Three Months EndedJuly 1, 2017
GAAP Stock Intangible Acquisition Non-cash Income Non-GAAPNon-GAAP Income GAAP Percent of Compensation Asset Related Interest Tax Non-GAAP Percent ofStatement Items Measure Revenue Expense* Amortization* Items* Expense* Adjustments Measure Revenue
Revenues . . . . . . . . $190,098
Gross margin . . . . . . 113,192 59.5% $ 264 $ — $ — $ — $ — $113,456 59.7%
Research anddevelopment . . . . . 52,432 27.6% 5,503 5,048 — — — 41,881 22.1%
Selling, general andadministrative . . . . 39,826 20.9% 5,399 1,647 234 — — 32,546 17.1%
Operating expenses . . 92,258 48.5% 10,902 6,695 234 — — 74,427 39.2%
Operating income . . . 20,934 11.0% 11,166 6,695 234 — — 39,029 20.5%
Net income . . . . . . . 16,569 8.7% 11,166 6,695 234 2,640 (3,319) 33,985 17.9%
Diluted sharesoutstanding . . . . . . 43,178 — — — — — 43,178
Diluted earnings pershare . . . . . . . . . . $ 0.38 $ 0.79
* Represents pre-tax amounts
Three Months EndedApril 1, 2017
GAAP Stock Intangible Acquisition Non-cash Income Non-GAAPNon-GAAP Income GAAP Percent of Compensation Asset Related Interest Tax Non-GAAP Percent ofStatement Items Measure Revenue Expense* Amortization* Items* Expense* Adjustments Measure Revenue
Revenues . . . . . . . . $179,028
Gross margin . . . . . . 105,161 58.7% $ 258 $ — $ 124 $ — $ — $105,543 59.0%
Research anddevelopment . . . . . 52,324 29.2% 5,246 4,897 356 — — 41,825 23.4%
Selling, general andadministrative . . . . 40,155 22.4% 4,982 1,605 816 — — 32,752 18.3%
Operating expenses . . 92,479 51.6% 10,228 6,502 1,172 — — 74,577 41.7%
Operating income . . . 12,682 7.1% 10,486 6,502 1,296 — — 30,966 17.3%
Net income . . . . . . . 15,426 8.6% 10,486 6,502 1,296 (1,228) (5,212) 27,270 15.2%
Diluted sharesoutstanding . . . . . . 43,030 — — — — — 43,030
Diluted earnings pershare . . . . . . . . . . $ 0.36 $ 0.63
* Represents pre-tax amounts

(This page has been left blank intentionally.)

Silicon Labs is a leading provider of silicon, software and solutions for a smarter, more connected world.Founded in 1996 and headquartered in Austin, Texas, Silicon Labs has more than 1,700 patents issued or pending. The company’s common stock is traded on the NASDAQ exchange under the ticker symbol “SLAB.”
Board of Directors
Nav SoochFounder and Chairman
Bill WoodLead Independent Director
Bill BockIndependent Director
Jack LazarIndependent Director
Gregg LowePresident and Chief Executive Offi cer, Cree
Nina RichardsonIndependent Director
Sumit SadanaExecutive Vice President andChief Business Offi cer, Micron Technology
Tyson TuttlePresident and Chief Executive Offi cer, Silicon Labs
Christy WyattChief Executive Offi cer,Absolute Software Corporation
Executive Offi cers
Tyson Tuttle President and Chief Executive Offi cer
John HollisterSenior Vice President and Chief Financial Offi cer
Brandon TolanySenior Vice President of Worldwide Sales and Marketing
Sandeep Kumar, PhDSenior Vice President of Worldwide Operations
Alessandro Piovaccari, PhDSenior Vice President and Chief Technical Offi cer
Corporate Information
Stock Listing Common stock traded on NASDAQ, symbol SLAB
OptionsThe Company’s options are traded on the Chicago Board Option Exchange and the American Stock Exchange.
Legal CounselDLA Piper US LLP401 Congress Avenue, Suite 2500Austin, Texas, 78701 USA
Independent Registered Public Accounting FirmErnst & Young LLP401 Congress Avenue, Suite 1800Austin, Texas, 78701 USA
Transfer Agent and RegistrarAmerican Stock Transfer & Trust Company59 Maiden LanePlaza Level New York, New York, 10038 USA+1 800-937-5449
Stock Data As of 1/21/2019, there were 67 holders of record, holding a total of 43,088,623 shares. The table below shows the high and low per-share sales prices of our common stock for the periods indicated, as reported by NASDAQ.
High Low
Q1 $101.20 $84.48
Q2 $110.70 $85.96
Q3 $108.15 $90.50
Q4 $93.73 $73.13
Annual MeetingThe Silicon Laboratories Inc. annual meeting will be held on Thursday, April 18, 2019 at 9:00a.m. Central Time at the Lady Bird Johnson Wildfl ower Center, 4801 La Crosse Avenue, Austin, Texas, 78739 USA.
Investor RelationsFor more information about Silicon Labs, please visit our website at www.silabs.com, or contact:
Investor Relations Silicon Labs400 West Cesar Chavez StreetAustin, Texas, 78701 USA+1 [email protected]
Designed by Make It So Design, Austin, Texas
To Our Shareholders
We are proud of our performance in 2018, which was a strong year for Silicon Labs in many dimensions. We grew revenue by $100 million to a record $868 million, completed the successful acquisition of Z-Wave, and strengthened our team with the addition of critical talent in software, sales, applications, customer support and leadership. We continue to focus our strategy and investments on long-term, high-quality growth vectors where the insatiable demand for data, the electrifi cation of the world and the value in connecting “things” will only accelerate into the future.
We made signifi cant progress during the year with our IoT and Infrastructure products, which now represent more than 75 percent of total revenue. We saw growth in all geographies and key end market segments, led by Industrial, which increased over 20 percent year-on-year to more than 50 percent of revenue. Our opportunity pipeline grew more than 40 percent year-on-year to $11 billion in lifetime revenue with design wins increasing approximately 30 percent, providing a strong tailwind for future growth potential.
Conservative fi nancial management and operational excellence have been the foundation of our success. In 2018, we delivered GAAP gross margins of 60 percent and non-GAAP gross margins of 61 percent, above the high end of our target operating model range and refl ecting the quality of our products and served markets, as well as a stronger Infrastructure product mix. GAAP operating margin was 10 percent of revenue in 2018. We posted a notable improvement in non-GAAP profi tability, with operating margin up 70 basis points over 2017 to 21 percent. GAAP diluted earnings per share increased 74 percent year-on-year to $1.90. Non-GAAP diluted earnings per share increased 14 percent year-on-year to a record $3.71. Strong operating cash fl ow of $174 million enabled Silicon Labs to repurchase $39 million of its shares. We ended the year with $620 million in cash, cash equivalents and investments, and $160 million remaining in our share repurchase authorization through fi scal 2019. We are well-positioned to execute on our capital deployment strategy focusing on M&A and share repurchases.
Our IoT products are gaining signifi cant traction in the smart home, industrial, metering, commercial, consumer and lighting markets. Revenue for the year grew 17 percent, representing more than 50 percent of total revenue, falling short of expectations due to headwinds from delayed product ramps in lighting and metering markets as well as macro weakness as we exited the year. Design wins increased nearly 30 percent year-on-year signaling strong market traction and future growth. We are focusing our R&D investments to deliver higher levels of integration and security, and new multiprotocol capabilities to extend our leadership and differentiation in target markets for low-power wireless end nodes.
Infrastructure delivered more than 30 percent year-on-year revenue growth, and design win lifetime revenue increased approximately 50 percent. We continue to expand and diversify our timing revenue beyond core optical networking into industrial, data center and wireless infrastructure mar-kets. The explosion of data is driving data center upgrades from 10G to 100G, wireless carrier upgrades from 4G to 5G and service provider upgrades from 100G to 400G. These faster speeds drive demand for higher performance timing products, which plays to our strength and leadership in clocks and oscillators. We have also established ourselves as the leading provider of digital isolation technology for the cloud, telecom and electric vehicle markets. We are encouraged by the longer-term demand for electric vehicles, which presents a large opportunity for Silicon Labs with the number of EVs on the road expected to grow to 125 million by 2030.
We believe we are well-positioned and remain confi dent in our longer-term ability to outperform the market. We are focused on executing on our product roadmaps and converting a large pipeline of opportunities into additional wins and share gains. The technologies we are developing are enabling our customers to transform industries and improve lives, and together we are creating a smarter, more connected world.
We appreciate your investment in Silicon Labs.
Tyson Tuttle President and
Chief Executive Officer
Nav SoochFounder and
Chairman

Silic
on
La
bs 2
018 An
nu
al R
ep
ort
sila
bs.c
om
2018 Annual ReportThe leader in silicon, software and solutions for a smarter, more connected world.
silabs.com
The leader in silicon, software and solutions for a smarter, more connected world.