2018 - wfb - wfb · 2018-12-06 · market for logistics property 2018 ** take-up | commercial...
TRANSCRIPT

2 0 18BREMEN PROPERTY MARKET REPORTOFFICES | LOGISTICS | RETAIL HOUSING | INVESTMENT

City Gate, Bahnhofsvorstadt

Bremen remains an extremely attractive property loca-tion. This is demonstrated by the very good developments in all segments of the property market. Thus, floor-space turnover on the office property market just missed the threshold of 100,000 m² rental space in the previous year – at vacancy rates of only 3 %. Admittedly, 2018 began in a somewhat more reserved manner, but the planned new-builds will drive sales up further in the coming quarter at the latest – including the new Sparkasse headquarters in the heavily in-demand Bremen Technology Park.
New development and construction projects also allow extremely lively growth to be expected on the market for logistics property. Even now, the total property portfo-lio amounts to over 2.8 million m². Of this, 60 % is due on areas that are particularly interesting to investors – four times as much as the average for Germany. This under-lines the enormous capital assets of Bremen as an inter-face in international goods transport. Accordingly, sales also rose strongly again in the first half of 2018.
Likewise, a markedly high dynamism is emerging in Bre-men’s retail. Numerous property projects are in planning inside and outside the A1 locations, which will noticea-bly raise the shopping and living quality in the city cen-tre. Among those that can be named are the planned or already in implementation conversions of the Parkhaus Mitte site, the Lloydhof, the Bremer Carree and the Johann-Jacobs-Haus.
In 2017, there was a completion record on the Bremen residential market – related to the last five years. Addi-tional large construction projects are continuing this trend. Nevertheless, construction activities are insuf-ficient to meet the increasing demand and to cool price rises. The high assets pressure is not least leading to a rise in purchase prices for new apartments of up to 12 % at the peak. The Bremen investment market is also prof-
iting from asset pressure on the capital markets. More than half a billion Euro were turned over in the previous year. Admittedly, volumes fell back slightly in the first half of 2018, but Bremen remains clearly in the focus of investors.
You too can use the potential on the Bremen property market. This report will provide you with the facts and fig-ures to do so. We look forward to meeting you in person.
Andreas HeyerCEOWFB Wirtschaftsförderung Bremen GmbH(Bremeninvest)
Pho
to: B
jörn
Beh
rens
| 32Foreword

Johann-Jacobs-Haus, city centre
Visu
alis
atio
n: H
PE
Han
seat
isch
e P
roje
kten
twic
klun
g G
mbH

Schuppen 3, Überseestadt Housing BRIK, Oberneuland Dachser Freight, GVZ
Visu
alis
atio
n: E
urop
aQua
rtie
r B
rem
en G
rund
besi
tz G
mbH
Sources: *bulwiengesa AG; ** LSA Logistik Service Agentur GmbH
MARKET FOR OFFICE PROPERTY 2018 *
TAKE-UP | CONSTRUCTION ACTIVITY | PRICE LEVELS 6 – 11
MARKET FOR LOGISTICS PROPERTY 2018 **
TAKE-UP | COMMERCIAL ESTATES | PRICE LEVELS 12 – 17
BREMEN AS RETAIL LOCATION 2018 *
STRUCTURE | LOCATIONS | PRICE LEVELS 18 – 23
HOUSING MARKET 2018 *
DEMOGRAPHICS | PRICE LEVELS | FORECASTS 24 – 25
INVESTMENT MARKET REPORT 2018 *
TRANSACTIONS | YIELDS | PRICE LEVELS 26 – 27
| 54Contents

24’7 twentyfourseven, Technology Park
MARKET FOR OFFICE PROPERTY 2018TAKE-UP CONSTRUCTION ACTIVITY PRICE LEVELS

VACANCY RATE OF
3.0 %REMAINS AT THE LOWEST LEVEL

OFFICE FLOOR SPACE TURNOVER FELL SLIGHTLY TO
87,500 m²
Office Center Überseestadt

In 2017, office space sales of 99,500 m² in total were posted – equally distributed over both halves of the year. Despite a slight decline in comparison with the previous year, the result was almost 10,000 m² above the average of the last 5 years (89,700 m²). The largest transaction completed related to the new corporate headquarters of Kühne + Nagel, which is currently being built on 9,500 m² in Bremen city centre. However, owner occupations such as this only made up a good 10 % of total sales in 2017.
At about 38,500 m², floor-space turnover in the first half of 2018 was at a lower level than in the first halves of 2017 and 2016. To date, there have not been any sales of space of more 5,000 m², for which experience suggests mostly owner occupiers come into question. The largest transaction so far was carried out by the co-working provider Spaces, which rented 3,200 m² in the Ansgarihaus. However, the Sparkasse Bremen is planning to build a new headquarters in the Technology Park in the fourth quarter of 2018. With this large owner-occupied property, floor space turnover could be around 90,000 m² at the end of the year.
Smaller sales characterise the marketAlmost 60 % of sales was due on space of up to 1,000 m² in 2017. Only a few large transactions completed with more than 5,000 m² were registered. In addition to the Kühne + Nagel owner occupation already mentioned, these included large lettings to the municipality of Bre-men and Mondelēz. The latter added up to total turnover of about 21,300 m² – barely less than medium-sized let-tings of between 1,000 and 5,000 m².
Market activities in 2018 were characterised by sales in the small and medium-sized segment in the first half of the year. About 17,500 m² has involved spaces of up to 500 m² to date. A total of 15.900 m² involved spaces of between 1,000 and 5,000 m². Thus, both segments each made up more than 40 % of registered sales. In contrast, the result for spaces of between 500 and 1,000 m², with sales of approxi-mately 5,100 m², were lower than in the same period in pre-vious years (for current large transactions see above).
Technology Park and Airport-Stadt still popular In 2017, the Überseestadt was the location with the highest office floor space turnover for the second year in a row. The result even slightly exceeded with 31,500 m² the volume of the previous year. Überseestadt was closely followed by the
Bremen city centre with nearly 28,500 m². With less than 5,500 m², the city outskirts represented the lowest office floor space turnover in 2017. Market development in 2018 has been determined by sales in the city centre so far. At
STABLE SALES AT A HIGH LEVEL
* All details for office space in m² = m² rental space
ESSEN
HANOVER
STUTTGART
Lettings in city comparison 2018 in m² *
112,600
121,600
295,800* Forecast average of the last five years
* Forecast
Office lettings in Bremen 2014 to 2018 in m²
* Forecast
Development of construction activity 2014 to 2018 in m²
Total
Of which no longer available
2018*64,750
Büroimmobilien
LEIPZIG103,600
BREMEN87,500
Of which available (vacant)
2014
2015
2016
2017
69,100
83,200
101,800
99,500
2018*87,500
2014
2015
2016
2017
55,521
65,791
18,124
34,988
Sector structure of office lettings 2018 in m² *
ASSOCIATIONS, MUNICIPALITY, UNIVERSITY8,500
FORWARDING; PRODUCTION, TRADE17,500
BUSINESS-RELATED SERVICES5,700
COMMUNICATION AND INFORMATION TECHNOLOGY7,800
BANKS, FINANCIAL SERVICES 15,200
OTHER SECTORS 32,800
* Forecast Office Center Überseestadt
ESSEN
HANOVER
STUTTGART
Lettings in city comparison 2018 in m² *
112,600
121,600
295,800* Forecast average of the last five years
* Forecast
Office lettings in Bremen 2014 to 2018 in m²
* Forecast
Development of construction activity 2014 to 2018 in m²
Total
Of which no longer available
2018*64,750
Büroimmobilien
LEIPZIG103,600
BREMEN87,500
Of which available (vacant)
2014
2015
2016
2017
69,100
83,200
101,800
99,500
2018*87,500
2014
2015
2016
2017
55,521
65,791
18,124
34,988
Sector structure of office lettings 2018 in m² *
ASSOCIATIONS, MUNICIPALITY, UNIVERSITY8,500
FORWARDING; PRODUCTION, TRADE17,500
BUSINESS-RELATED SERVICES5,700
COMMUNICATION AND INFORMATION TECHNOLOGY7,800
BANKS, FINANCIAL SERVICES 15,200
OTHER SECTORS 32,800
* Forecast
| 98Market for office property 2018

over 16,000 m² more than 40 % of registered floor space turnover was located here. Behind the city centre came the Technology Park. Despite comparatively weak sales in the previous year, a medium-term scarcity of space emerges here. Not least the recently planned Sparkasse newbuild, underlines the great attractiveness of the location.
Several completions were also posted in the office loca-tion Airport-Stadt / Airport in the past few months – pri-marily in the medium-sized segment. Companies from the surrounding area in particular are using the range of space in order to relocate to the Bremen urban area. In contrast, sales activities in the Überseestadt proved to be very reserved. Volumes to date are well below the lev-els of the two previous years. However, a significant rise can be assumed: Newbuild areas will be completed here in the short-, medium- and long-term which are enjoying huge demand, particularly in the Überseestadt.
Equally high demand from all sectorsSales in the first half of 2018 were distributed relatively evenly across the sectors under consideration. None of them accounted for a share of more than 20 %. The high-est sales were generated by companies from the collective category “Other services”. “Forwarding, Production and Trade” – which in 2017 was still responsible for more than one third of total sales – only made second place this time. Furthermore, “Communication and Information” and the “public sector”, made up more than 10,000 m² together. In the further course of the year the “Banks / Financial Ser-vices” sector could suddenly gain importance – if the new Sparkasse building is still started this year as planned.
Completions grow further in 2018In 2017, very little new office space was completed: 9,600 m² in newbuilds and 8,500 m² in renovated prop-erties. The largest property, the Lofthaus 1 in the Über-seestadt, opened with over 4,900 m² of office space. The first half of 2018 clearly exceeded the previous year’s result. The Office Center Überseestadt with 10,500 m² and the 24’7 twentyfourseven in the Technology Park with 8.800 m² were completed. If all newbuild projects whose completion is planned for 2018 open on time, the new space will amount to about 35,000 m² in total. The stock of office space would thus rise to nearly 3.65 million m². The completion of additional projects has already been announced for the upcoming 2019 – with volumes of more than 50,000 m² in total.
ESSEN
HANOVER
STUTTGART
Lettings in city comparison 2018 in m² *
112,600
121,600
295,800* Forecast average of the last five years
* Forecast
Office lettings in Bremen 2014 to 2018 in m²
* Forecast
Development of construction activity 2014 to 2018 in m²
Total
Of which no longer available
2018*64,750
Büroimmobilien
LEIPZIG103,600
BREMEN87,500
Of which available (vacant)
2014
2015
2016
2017
69,100
83,200
101,800
99,500
2018*87,500
2014
2015
2016
2017
55,521
65,791
18,124
34,988
Sector structure of office lettings 2018 in m² *
ASSOCIATIONS, MUNICIPALITY, UNIVERSITY8,500
FORWARDING; PRODUCTION, TRADE17,500
BUSINESS-RELATED SERVICES5,700
COMMUNICATION AND INFORMATION TECHNOLOGY7,800
BANKS, FINANCIAL SERVICES 15,200
OTHER SECTORS 32,800
* Forecast
Kühne + Nagel, city centreEcoMaT construction site, Airport-StadtSparkasse Bremen, Technology Park
Europahafenkopf, Überseestadt
Visu
alis
atio
n: K
ühne
+ N
agel
Visu
alis
atio
n: D
elug
an M
eiss
l A
ssoc
iate
d A
rchi
tect
sVi
sual
isat
ion:
Zec
h G
roup
/ C
OB
E A
rchi
tect
s
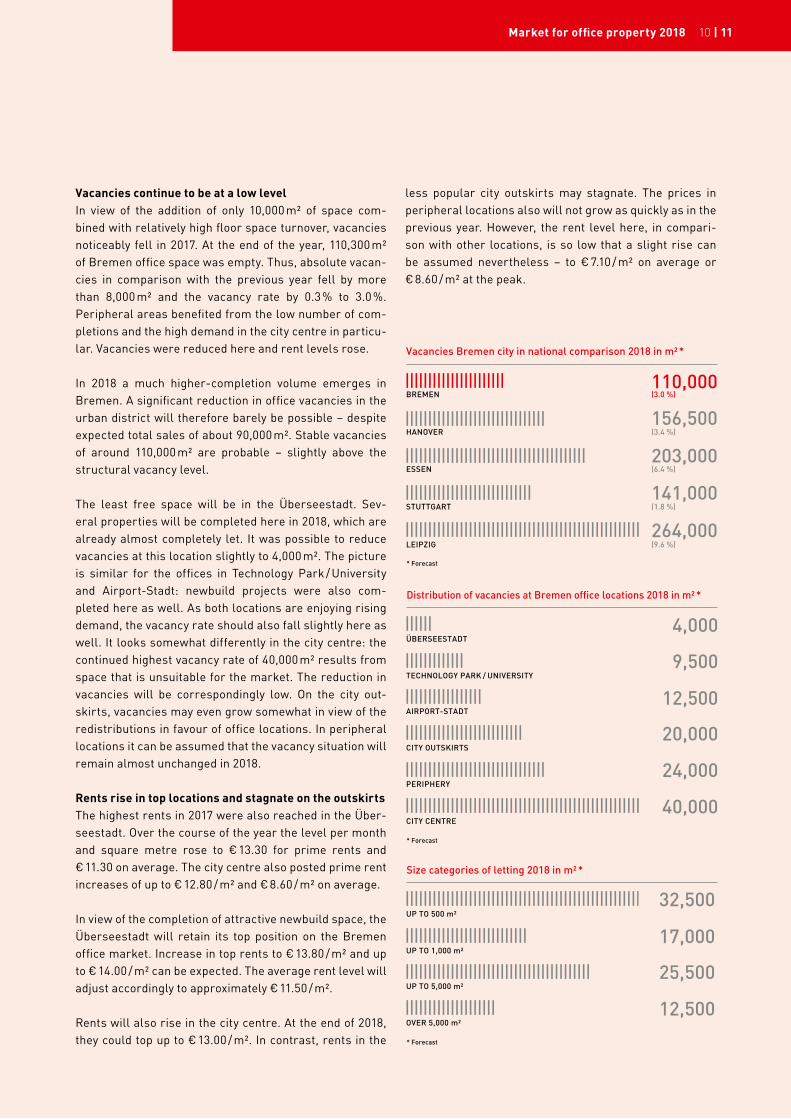
Vacancies continue to be at a low levelIn view of the addition of only 10,000 m² of space com-bined with relatively high floor space turnover, vacancies noticeably fell in 2017. At the end of the year, 110,300 m² of Bremen office space was empty. Thus, absolute vacan-cies in comparison with the previous year fell by more than 8,000 m² and the vacancy rate by 0.3 % to 3.0 %. Peripheral areas benefited from the low number of com-pletions and the high demand in the city centre in particu-lar. Vacancies were reduced here and rent levels rose.
In 2018 a much higher-completion volume emerges in Bremen. A significant reduction in office vacancies in the urban district will therefore barely be possible – despite expected total sales of about 90,000 m². Stable vacancies of around 110,000 m² are probable – slightly above the structural vacancy level.
The least free space will be in the Überseestadt. Sev-eral properties will be completed here in 2018, which are already almost completely let. It was possible to reduce vacancies at this location slightly to 4,000 m². The picture is similar for the offices in Technology Park / University and Airport-Stadt: newbuild projects were also com-pleted here as well. As both locations are enjoying rising demand, the vacancy rate should also fall slightly here as well. It looks somewhat differently in the city centre: the continued highest vacancy rate of 40,000 m² results from space that is unsuitable for the market. The reduction in vacancies will be correspondingly low. On the city out-skirts, vacancies may even grow somewhat in view of the redistributions in favour of office locations. In peripheral locations it can be assumed that the vacancy situation will remain almost unchanged in 2018.
Rents rise in top locations and stagnate on the outskirts The highest rents in 2017 were also reached in the Über-seestadt. Over the course of the year the level per month and square metre rose to € 13.30 for prime rents and € 11.30 on average. The city centre also posted prime rent increases of up to € 12.80 / m² and € 8.60 / m² on average.
In view of the completion of attractive newbuild space, the Überseestadt will retain its top position on the Bremen office market. Increase in top rents to € 13.80 / m² and up to € 14.00 / m² can be expected. The average rent level will adjust accordingly to approximately € 11.50 / m².
Rents will also rise in the city centre. At the end of 2018, they could top up to € 13.00 / m². In contrast, rents in the
less popular city outskirts may stagnate. The prices in peripheral locations also will not grow as quickly as in the previous year. However, the rent level here, in compari-son with other locations, is so low that a slight rise can be assumed nevertheless – to € 7.10 / m² on average or € 8.60 / m² at the peak.
Vacancies Bremen city in national comparison 2018 in m² *
Distribution of vacancies at Bremen office locations 2018 in m² *
ÜBERSEESTADT4,000
TECHNOLOGY PARK / UNIVERSITY9,500
AIRPORT-STADT12,500
CITY OUTSKIRTS20,000
PERIPHERY24,000
CITY CENTRE40,000
Size categories of letting 2018 in m² *
UP TO 500 m²32,500
UP TO 1,000 m²17,000
UP TO 5,000 m²25,500
OVER 5,000 m²12,500
LEIPZIG264,000(9.6 %)
BREMEN110,000 (3.0 %)
ESSEN203,000(6.4 %)
HANOVER156,500(3.4 %)
STUTTGART141,000(1.8 %)
* Forecast
* Forecast
* Forecast
| 1110Market for office property 2018

DHL, GVZ (Cargo Distribution Center)
MARKET FOR LOGISTICS PROPERTY 2018TAKE-UP COMMERCIAL ESTATESPRICE LEVELS

IN 2018 THE FLOOR SPACE TURNOVER ROSE TO APPROX.
187,000 m²

Prologis Park, GVZ (Cargo Distribution Center)
FLOOR SPACE TURNOVER DUE TO CHANGE OF USER DOUBLED IN 2018 TO APPROX.
160,000 m²

With about 3 million employees, logistics in Germany is one of the largest economic sectors, right behind the automotive sector and retail. Due to its location on the Weser and in the centre of Europe, Bremen has a key position. Huge quantities of goods arrive at the high-per-formance container terminals in Bremerhaven, which are largely picked and / or refined in Bremen. Goods that land in Hamburg and Wilhelmshaven reach their destinations via Bremen ever more frequently. This creates important competitive advantages for internationally active compa-nies. Because at the centre of the three large ports Bre-men offers optimal conditions for highly efficient logis-tics: infrastructures and services at a constantly high level and continuous improvements and innovations that make it possible to keep up with the growing challenges of globalisation.
Current portfolio: over 2.8 million m² of warehouse spaceThe economic effects on the region are huge. With about 115,000 employees in total, the logistics sector is one of the most important branches of the economy in the met-ropolitan region of Bremen-Oldenburg. The service pro-viders involved benefit from the broad know-how and highly qualified staff in the area. Planned logistics relo-cations also meet with very high acceptance among the Bremen population – in contrast to many other locations.
In the period currently under consideration, the portfo-lio of logistics warehouse space in Bremen rose to 2.827 million m². 228 properties were recorded in the city alone. In contrast, for example, to the so-called “Big 5 conurba-tions”, the figures do not include space in the surrounding regions. Furthermore, it is remarkable that about 50 % of all logistics property in the North West is concentrated in the Hanseatic city. This shows the substance of the Bre-men logistics property market – for example, in compar-ison with a region such as Hamburg with a portfolio of space of approximately 4.5 million m².
The portfolio interesting to investors in Bremen amounts to more than 1.8 million m². These properties are at least 8,000 m² in size, have a height clearance of at least 6.5 m and were built after 1985. It is estimated that such coveted space makes up only 15 % of the portfolio in Germany; in Bremen, however, approximately 60 %. This proves the great attractiveness of the location to investors.
Much higher floor space turnover and contract closingsThe floor space turnover in the period under considera-tion of 2018 has risen to a pleasing 186,890 m² (previous year 153,000 m²). New user agreements were concluded for 25 properties (previous year 18), 7 of which with an area of 10,000 m² and more (previous year also 7).
The five Bremen logistics centres (GVZ – Cargo Distribu-tion Center, Hansalinie Industrial Estate, Bremer Kreuz business park, Überseehafen and Industriehafen) form the logistics interfaces between the regions Muenster / Osna-brück, Hanover and Hamburg. Thus, for example, trading companies can supply the entire North West from one industrial estate. Production businesses can also produce their merchandise close to their customers. This makes the Federal State of Bremen one of the world’s most effi-cient port and logistics locations.
Vacancy rate rises to German average for the first time136,500 m² in total are available immediately for logistics activities (previous year 20,000 m²). Thus, in comparison with the previous year the vacancy rate has risen signif-icantly – from 0.71 % to 4.83 %. This is primarily attribut-able to a logistics facility with approximately 70,000 m² becoming vacant. This report has recorded older proper-ties of more than 10,000 m² that are for sale or to let. The
LIVELY HOTSPOT IN EUROPE
Logistikimmobilien
REGION BERLIN
4.40
3.50
REGION MUNICH2.00
REGION FRANKFURT/MAIN
100,000OTHER LOCATIONS (19,000 m²)
ÜBERSEESTADT (0 m²)
BREMER KREUZ (6,100 m²)
HANSALINIE / PORT OF HEMELINGEN (20,000 m²)
159,800
179,750
406,200
Distribution of warehouse space 2018 in m² *
Space let Vacant
INDUSTRIEHAFEN (11,700 m²)482,000
GVZ (79,700 m²)1,499,400
Floor space turnover at the Bremen location 2017/2018 in m²
2017 2018 (Forecast)
REGION HAMBURG4.50
BREMEN-CITY (INCL. FREIGHT VILLAGE)2.82
GVZ (ALONE)1.50
REGION DUSSELDORF1.60
NEW-BUILD / REVITALISATION TURNOVER72,500
27,500
CHANGE OF USER TURNOVER
80,300
159,390
TOTAL TURNOVER
152,800
186,890
Warehouse space in national comparison 2018 in million m² *
* Forecast
RUHR REGION4.60
* Forecast
14 | 15Market for logistics property 2018

range makes clear not least the potential for brownfield developments in Bremen.
Unchanged price levelAt € 3.24 / m², the average rental price level has remained constant. High-quality properties reach monthly net rents of € 4.00 / m² and more. At about 60 % of existing properties, these are between € 2.00 and € 3.50 / m². By comparison, the increasing scarcity of space has become noticeable in the monthly rents in other conurbations: for example, while Hamburg demands between € 4.50 and € 5.60 / m², up to € 9.50 / m² is paid in Munich.
The purchase price ranges for developed logistics land diverge just as much: while these are between € 20 and € 60 / m in the Erfurt region, they reach between € 350 and € 450 / m² in Munich. Prices have risen almost nation-wide in the past five years, most strongly in the regions Berlin, Stuttgart and Munich. In Bremen, plots of land cost € 45 / m² on average – and thus 40 – 50 % less than in Hamburg, for example.
GVZ (Cargo Distribution Center): Role model for logis-tics in Germany and Europe as before, the GVZ Bremen is one of the most important logistics interfaces in Europe. Its reliable traffic infrastructure with a junction on the motorway A281, links to the European rail transport net-
work, the inland waterways and ocean-going shipping lanes and to air freight, ensure the perfect interaction of all modes of transport. The local logistics companies are the main motors driving the development of the logistics centre. Visible signs of development work for additional logistics areas and plots of land verify the planned growth and future prospects.
In the first half of 2018, nearly 40 % of logistics floor space turnover was generated in the GVZ. The vacancy rate is currently 5.2 %. About 40 % of the warehouse space is designed as standard properties – according to the requirements of previous project developers and inves-tors. Approximately 20 % of the warehouse space has the potential to be revitalised – and this without having to fear the classic risks for brownfield developments. On the basis of current developments in the GVZ, the property portfolio will break the 1.5 million m² barrier at the end of the year.
Port of Hemelingen, Hansalinie and Bremer Kreuz: central to the automotive industryThe Bremen Mercedes-Benz plant provides impetus for a variety of logistics processes and thus for numerous suc-cessful corporate relocations on the Hansalinie commer-cial estate. Another argument has recently been added: the 6-lane expansion of the A1 motorway towards Ham-
The Bremen Hansalinie Industrial Estate growing further in second construction phase
Pho
to: W
FB

burg, the central transport artery of Northern Germany. This makes the Hansalinie the fulcrum of the further development of Bremen as an automotive location – sup-plemented by logistics properties in the Port of Hemelin-gen and at Bremer Kreuz Business Park.
26 % of the floor space turnover in total was carried out in production logistics in the first half of 2018. The current vacancy rate is 4.83 %. All warehouse space is tailored to the individual requirements of the project developers and investors.
Outlook for 2019: dynamic market constantly changingThe current vacancies, and also the many new develop-ment and construction projects, allow lively growth in the market to be expected – in the entire logistics sector and in all associated merchandise and services sectors. The latter will primarily have positive influences on invest-ment and location decisions.
The first companies in procurement and productions logistics have already started activities in the new Hansa-linie construction phase. Additional construction activities have begun. The same applies to the GVZ Bremen. One of the largest German logistics service providers is heavily investing there in consumer goods distribution – and thus in higher supply quality in the end customer business.
Logistikimmobilien
REGION BERLIN
4.40
3.50
REGION MUNICH2.00
REGION FRANKFURT/MAIN
100,000OTHER LOCATIONS (19,000 m²)
ÜBERSEESTADT (0 m²)
BREMER KREUZ (6,100 m²)
HANSALINIE / PORT OF HEMELINGEN (20,000 m²)
159,800
179,750
406,200
Distribution of warehouse space 2018 in m² *
Space let Vacant
INDUSTRIEHAFEN (11,700 m²)482,000
GVZ (79,700 m²)1,499,400
Floor space turnover at the Bremen location 2017/2018 in m²
2017 2018 (Forecast)
REGION HAMBURG4.50
BREMEN-CITY (INCL. FREIGHT VILLAGE)2.82
GVZ (ALONE)1.50
REGION DUSSELDORF1.60
NEW-BUILD / REVITALISATION TURNOVER72,500
27,500
CHANGE OF USER TURNOVER
80,300
159,390
TOTAL TURNOVER
152,800
186,890
Warehouse space in national comparison 2018 in million m² *
* Forecast
RUHR REGION4.60
* Forecast
Loftex GmbH, Bremen Industrial Park
16 | 17Market for logistics property 2018

Atlantic Grand Hotel, city centre
BREMEN AS RETAIL LOCATION 2018STRUCTURELOCATIONSPRICE LEVELS

RETAIL-RELEVANT PURCHASING POWER CONTINUES TO RISE
€ 3,846 MIO

WHO’S PERFECT furniture, Überseestadt
RETAIL SALES ARE OVER
€ 4,012 MIOFOR THE FIRST TIME

Bremen is one of the most popular shopping cities in Germany – favoured by its good transport connections, attractive city centre and numerous tourist attractions. There are more than 1 million people in its catchment area and a growing number of tourists from Germany and abroad.
What is on offer is correspondingly varied. With more than 700 stores, 200 catering establishments and 50 cul-tural facilities the historic city centre reveals an urban flair. The covered shopping passages also offer a really unique selling proposition: visitors can shop in complete comfort whatever the weather.
In the picturesque side areas, such as the Schnoor quar-ter or the Böttcherstraße, small shops with select ranges invite shoppers to stroll. Outside in the urban districts generously-sized shopping centres and specialist store centres impress with their huge ranges.
Strong A1 locationsThe main axes of the city centre are made up of the Söge-straße and the Obern- and Hutfilterstraße. The latter has the highest pedestrian frequency in Bremen. The tram tracks on both streets ensure optimal accessibil-ity from all districts of the city. Numerous large clothes stores have located here, including Peek & Cloppenburg, Anson’s, H&M and Zara.
In contrast, the retailer structure in the Sögestraße is more small-scale due to the historic buildings. The shops are interspersed by restaurants.
The special atmosphere is reflected in the range which make spending some time here highly attractive: Val-uable brands, such as COS (H&M’s premium line), the
menswear provider Wormland and the jeweller Wempe are at home in the Sögestraße.
Right next door the covered all-weather passages win friends with a wide range. For example, there are impor-tant anchor companies, such as Saturn, Galeria Kaufhof and Karstadt in the 250 m LLOYD PASSAGE. The Kathari-nen and also Domshof-Passage are, in contrast, distin-guished by smaller, but just as reputable stores, including Lacoste, van Laack and Wolford.
Dynamic retailThe vacancy rate in the city centre is at the usual level. In the A1 locations vacancies are extremely rare and due to construction measures, and thus only temporarily. In 2017 alone, there was a lot of movement with about 35 new openings, both in A-locations and also increasingly in good B-locations. A sign of the attractiveness of the city centre.
SHOPPING METROPOLIS WITH A FUTURE
Retail KPIs for Bremen 2018
Purchasing power index (retail-relevant) 97.5
Turnover ratio 115.0
Centrality rating 118.1
Retail-relevant purchasing power (in Mio. Euro)
3,846
Turnover (in Mio. Euro) 4,012
3
5
4
6
7
8
9
10
1|2
LLOYD PASSAGE
Major stores in Bremen city centre
Galeria Kaufhof / Saturn
C&A
H&M
Anson’s
Zara
Thalia
Peek & Cloppenburg
Karstadt
Karstadt Sports
1|2
3
4
5
6
7
8
9
10
Retail locations in Bremen city centre prime locations secondary locations city centre
20Bremen as retail location 2018 | 21

Noteworthy new lets in the Sögestraße in the past few years include the H&M premium line COS and the online optician Mister Spex. On the Obernstraße, Nanu-Nana has rented a branch on two floors, while the chemist’s chain dm has been able to expand its store on the Hutfilter-straße after Butlers moved out. The menswear provider William found a successor from the premium segment for its store on the Knochenhauerstraße: BTQUE Omen. Lloyd also opened a concept store in the Katharinen- Passage in 2017.
New impulses for the city centreCurrently, the are several prospective projects that could noticeably and positively change the city centre and the Bremen retail landscape.
→ On the “Areal Parkhaus Mitte” between Obern- and Sögestraße Kurt Zech (owner of the Bremen Karstadt property) is planning a shopping passage. In this con-nection, it is intended to restructure and modernise Karstadt as well.
→ West of the site and adjacent the Lloydhof will be sub-ject to a comprehensive refurbishment. The project developer denkmalneu is planning a conversion into a mixed-use property with retail, apartments, hotel and offices. The role model is the concept “DAS LEB-ENDIGE HAUS” (The Living House), which has already been realised in Dresden and Leipzig.
→ Also the recently sold Bremer Carree is going to be comprehensively modernised. The women’s fashion provider Appelrath Cüpper has already been set as the new anchor tenant, and will commence its busi-ness on about 2,400 m² of sales space in 2019.
→ Additional new space for retail and restaurants is emerging due to the newbuild of Johann-Jacobs-Haus and the development of Stadtwaage and Kontorhaus. These and other properties, which are summarised under the project name BALGEQUARTIER, are upgrad-ing the city centre and creating new pedestrian zones up to the Schlachte and Weser.
Holtorf’s Heimathaven, city centre Marc Cain, city centreCOS, city centre
Thursday (overcast, sun) Saturday (overcast/sun)
10 h 11 h 12 h 13 h 14 h 15 h 16 h 17 h 18 h 19 h 20 h
5,000
4,000
3,000
2,000
1,000
0
Pedestrian frequency Bremen city centre Obernstraße
10 h 11 h 12 h 13 h 14 h 15 h 16 h 17 h 18 h 19 h 20 h
5,000
4,000
3,000
2,000
1,000
0
Pedestrian frequency Bremen city centre Sögestraße
8,617HANSEATENHOF
SÖGESTRASSE
UNTERE SÖGESTRASSE
HUTFILTERSTRASSE
21,524
17,822
24,122
Pedestrian frequency (Saturday 9 June 2018)
9–10 h
10–11 h
11–12 h
12–13 h
13–14h
14–15 h
15–16 h
16–17 h
17–18 h
18–19 h
19–20 h
OBERNSTRASSE30,412
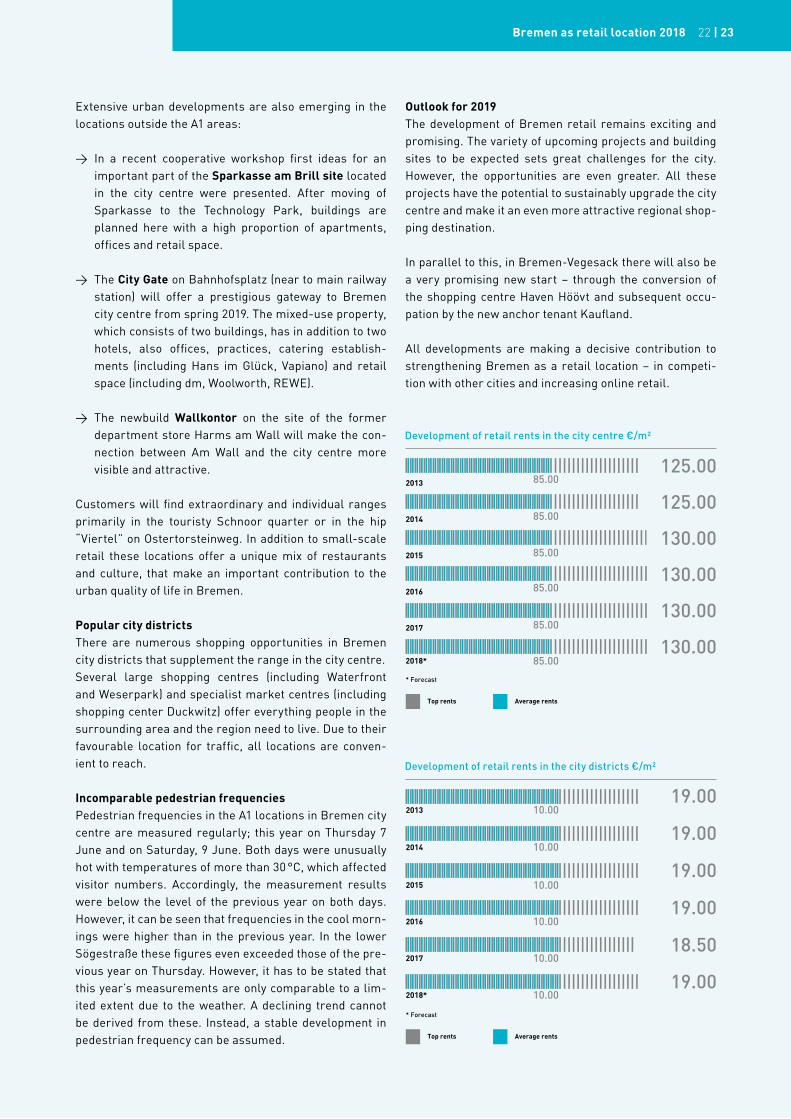
Outlook for 2019The development of Bremen retail remains exciting and promising. The variety of upcoming projects and building sites to be expected sets great challenges for the city. However, the opportunities are even greater. All these projects have the potential to sustainably upgrade the city centre and make it an even more attractive regional shop-ping destination.
In parallel to this, in Bremen-Vegesack there will also be a very promising new start – through the conversion of the shopping centre Haven Höövt and subsequent occu-pation by the new anchor tenant Kaufland.
All developments are making a decisive contribution to strengthening Bremen as a retail location – in competi-tion with other cities and increasing online retail.
Extensive urban developments are also emerging in the locations outside the A1 areas:
→ In a recent cooperative workshop first ideas for an important part of the Sparkasse am Brill site located in the city centre were presented. After moving of Sparkasse to the Technology Park, buildings are planned here with a high proportion of apartments, offices and retail space.
→ The City Gate on Bahnhofsplatz (near to main railway station) will offer a prestigious gateway to Bremen city centre from spring 2019. The mixed-use property, which consists of two buildings, has in addition to two hotels, also offices, practices, catering establish-ments (including Hans im Glück, Vapiano) and retail space (including dm, Woolworth, REWE).
→ The newbuild Wallkontor on the site of the former department store Harms am Wall will make the con-nection between Am Wall and the city centre more visible and attractive.
Customers will find extraordinary and individual ranges primarily in the touristy Schnoor quarter or in the hip “Viertel” on Ostertorsteinweg. In addition to small-scale retail these locations offer a unique mix of restaurants and culture, that make an important contribution to the urban quality of life in Bremen.
Popular city districtsThere are numerous shopping opportunities in Bremen city districts that supplement the range in the city centre.Several large shopping centres (including Waterfront and Weserpark) and specialist market centres (including shopping center Duckwitz) offer everything people in the surrounding area and the region need to live. Due to their favourable location for traffic, all locations are conven-ient to reach.
Incomparable pedestrian frequenciesPedestrian frequencies in the A1 locations in Bremen city centre are measured regularly; this year on Thursday 7 June and on Saturday, 9 June. Both days were unusually hot with temperatures of more than 30 °C, which affected visitor numbers. Accordingly, the measurement results were below the level of the previous year on both days. However, it can be seen that frequencies in the cool morn-ings were higher than in the previous year. In the lower Sögestraße these figures even exceeded those of the pre-vious year on Thursday. However, it has to be stated that this year’s measurements are only comparable to a lim-ited extent due to the weather. A declining trend cannot be derived from these. Instead, a stable development in pedestrian frequency can be assumed.
Einzelhandelsstandort
Development of retail rents in the city centre €/m²
Development of retail rents in the city districts €/m²
Top rents Average rents
125.002014 85.00
130.002015 85.00
130.002016 85.00
130.002017 85.00
130.002018* 85.00
2013
125.0085.00
201319.00
10.00
19.002014 10.00
19.002015 10.00
19.002016 10.00
18.502017 10.00
19.002018* 10.00
* Forecast
Top rents Average rents
* Forecast
22 | 23Bremen as retail location 2018

Stephanitor, city centre
HOUSING MARKET 2018DEMOGRAPHICSPRICE LEVELSFORECASTS
THE AVERAGE RENT FOR NEW-BUILD APARTMENTS IS
€ 11.30 / m²

HOUSING MARKET STILL UNDER PRESSURE
Re-urbanisation tendencies are continuing, associated with a migration balance that is leading to further pop-ulation growth. At the same time, the low interest rates are ensuring that pressure on assets does not ease. This combination is also generating uninterrupted high demand on the Bremen housing market.
The construction industry is reacting. Since 2011, the number of approvals for newbuilds have risen contin-uously. 2017 significantly exceeded the previous peak of 2015 – with a focal point on multi-storey residential con-struction. 2017 also saw the most completions registered in the last 5 years.
New large projects are planned in the new city location on the water, in the Überseestadt, in the Old Town and on the Stadtwerder as well as in integrated locations. These include the garden city Werdersee (approx. 600 units), the Hulsberg Quarter (approx. 1,200 units) and the for-mer Brinkmann building in Woltmershausen (approx. 1,200 units).
Purchase prices are risingCompared to 2017, purchase prices per newbuild m² have risen again by nearly 6 % on average, at the top end by as much as approx. 12 %. Thus, in 2018 these are over € 3,700 / m² or € 5,500 / m². The highest prices over € 6,000€ / m² have been posted in the Old Town project ”Stephanitor” and the Marcusallee in Bremen-Horn.
The development seen in previous years has continued on the rental market. Prices have also gone up in 2018, but less dynamically. The increase here has been restricted to 3 % on average and 5 % at the top end. In the top seg-ment € 15.00 / m² was reached, in some cases even more. The average rents in newbuilds have risen to approx. € 11.30 / m² and thus somewhat less than in 2017.
Decoupling purchase and rental pricesIt remains the case that purchase prices have risen faster than rents once again. Over the past 5 years, average rents have gone up by 16.5 %, purchase prices by 28 %. Due to this increasing price decoupling, net yields have come under further pressure. This has had effects in the trans-action market. At the top end the multiple for apartment building now factors 24, on average 19.5. This is equivalent to a renewed rise compared to the previous year.
Wohnimmobilien Investmentmarkt
Development of top rental prices (new build) in Bremen in €/m²
Development of top purchase prices (new build) in Bremen in €/m²
* Forecast
Transaction volumes per type of property* in million €
Transaction volumes per location in 2018* in million €
* Forecast
Net starting yields for office properties in nat. comparison 2018* in %
* Forecast
* Forecast
* Forecast
12.50
13.00
13.50
13.80
14.30
15.002018* ( 11.30)
2017 ( 11.00)
2016 ( 10.70)
2015 ( 10.00)
2014 ( 9.70)
2013 ( 9.50)
OFFICES, OFFICE / BUSINESS BUILDINGS197.5
LOGISTICS PROPERTIES84.0
OTHER TYPES OF PROPERTY154.0
3,900
4,000
4,200
4,450
5,000
5,5002018* ( 3,725)
2017 ( 3,500)
2016 ( 3,400)
2015 ( 3,100)
2014 ( 2,900)
2013 ( 2,700)
CITY145.0
OFFICE LOCATIONS175.0
CITY OUTSKIRTS41.0
PERIPHERY84.0
LEIPZIG4.4
BREMEN4.6
HANOVER4.5
STUTTGART3.5
RETAIL PROPERTY9.5
ESSEN4.5
Student residence, Technology Park
Wohnimmobilien Investmentmarkt
Development of top rental prices (new build) in Bremen in €/m²
Development of top purchase prices (new build) in Bremen in €/m²
* Forecast
Transaction volumes per type of property* in million €
Transaction volumes per location in 2018* in million €
* Forecast
Net starting yields for office properties in nat. comparison 2018* in %
* Forecast
* Forecast
* Forecast
12.50
13.00
13.50
13.80
14.30
15.002018* ( 11.30)
2017 ( 11.00)
2016 ( 10.70)
2015 ( 10.00)
2014 ( 9.70)
2013 ( 9.50)
OFFICES, OFFICE / BUSINESS BUILDINGS197.5
LOGISTICS PROPERTIES84.0
OTHER TYPES OF PROPERTY154.0
3,900
4,000
4,200
4,450
5,000
5,5002018* ( 3,725)
2017 ( 3,500)
2016 ( 3,400)
2015 ( 3,100)
2014 ( 2,900)
2013 ( 2,700)
CITY145.0
OFFICE LOCATIONS175.0
CITY OUTSKIRTS41.0
PERIPHERY84.0
LEIPZIG4.4
BREMEN4.6
HANOVER4.5
STUTTGART3.5
RETAIL PROPERTY9.5
ESSEN4.5
24Housing market 2018 25|
Bremen city centre
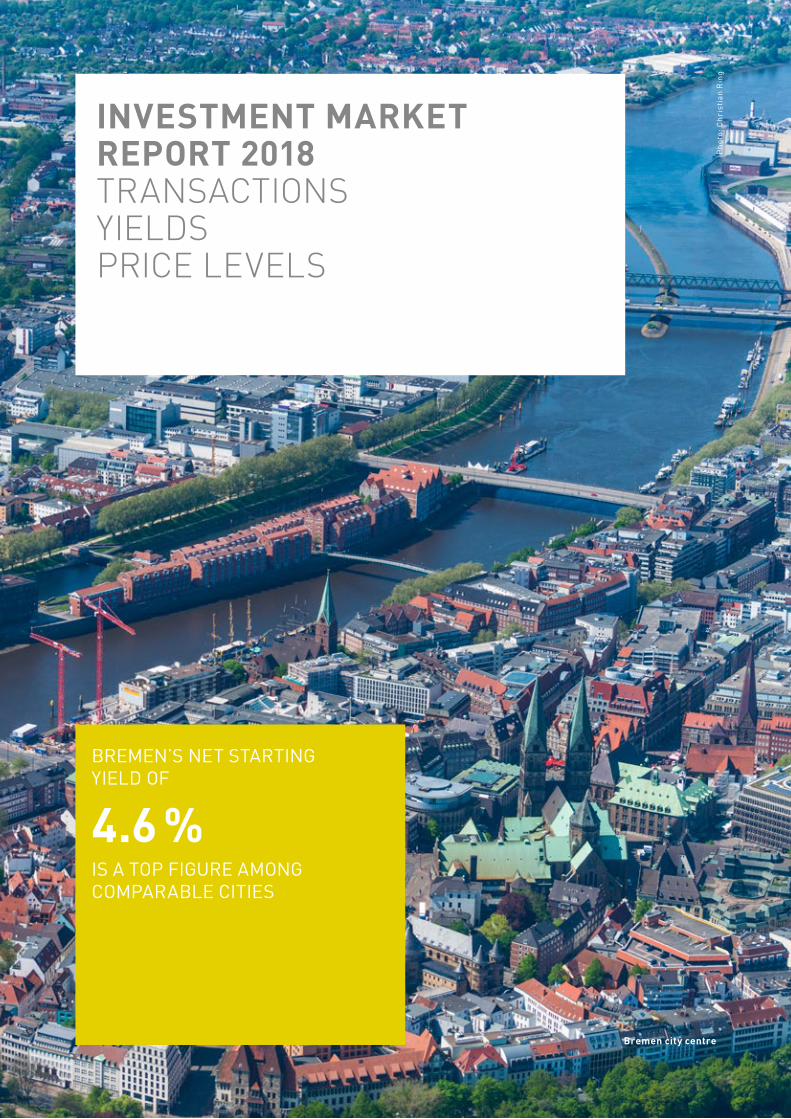
INVESTMENT MARKET REPORT 2018TRANSACTIONSYIELDSPRICE LEVELS
BREMEN’S NET STARTING YIELD OF
4.6 %IS A TOP FIGURE AMONG COMPARABLE CITIES
Pho
to: C
hris
tian
Rin
g

The increased investment activity has continued: With transaction volumes of 575 million Euro, 2017 exceeded the very good result of the previous year by more than 20 %. Especially the first half of the year demonstrated the great investment interest in Bremen – with invest-ments of over 320 million Euro. This is the highest half-year and annual turnover since the beginning of the mar-ket observation.
Many small and medium-sized transactionsNearly 60 % of the total annual volumes was due on pur-chases with a value of less than 25 million Euro. Once again, there were only a few large transactions for more than 50 million Euro. For example, a logistics / industrial property for nearly 80 million Euro and the Sparkasse headquarters am Brill sold for about 50 million Euro.
Peripheral locations gaining importanceThe stronger investments in logistics and industrial prop-erties made up a volume of 155 million Euro in 2017. This was only exceeded by investments in offices and business premises, which added up to approximately 236 million Euro. In contrast, the investment market for retail prop-erties continued to remain stable at a low level. What was important here was the sale of the shopping centre Haven Höövt in Bremen-Vegesack.
With the interest in logistics / industrial properties, the importance of peripheral locations also rose in 2017. In total, over 200 million Euro was invested in these loca-tions – just a little less than in the city and much more than in the popular office locations.
2018 no large transactions (so far)The first half of the year was not able to build on the pre-vious year. Registered investments of nearly 190 million Euro are not, however, a bad result, but more average. There have been no transactions for more than 25 million Euro to date. Nevertheless, Bremen is more in demand among investors than ever. Concluded transactions have already been recorded or announced for the second half of the year. It is also possible that some investments from the first half of the year will only become known later. Against this background, it seems a total result of nearly 450 million Euro on the Bremen investment market is very much.
BREMEN CONTINUES TO BE A TARGET FOR INVESTORS
Wohnimmobilien Investmentmarkt
Development of top rental prices (new build) in Bremen in €/m²
Development of top purchase prices (new build) in Bremen in €/m²
* Forecast
Transaction volumes per type of property* in million €
Transaction volumes per location in 2018* in million €
* Forecast
Net starting yields for office properties in nat. comparison 2018* in %
* Forecast
* Forecast
* Forecast
12.50
13.00
13.50
13.80
14.30
15.002018* ( 11.30)
2017 ( 11.00)
2016 ( 10.70)
2015 ( 10.00)
2014 ( 9.70)
2013 ( 9.50)
OFFICES, OFFICE / BUSINESS BUILDINGS197.5
LOGISTICS PROPERTIES84.0
OTHER TYPES OF PROPERTY154.0
3,900
4,000
4,200
4,450
5,000
5,5002018* ( 3,725)
2017 ( 3,500)
2016 ( 3,400)
2015 ( 3,100)
2014 ( 2,900)
2013 ( 2,700)
CITY145.0
OFFICE LOCATIONS175.0
CITY OUTSKIRTS41.0
PERIPHERY84.0
LEIPZIG4.4
BREMEN4.6
HANOVER4.5
STUTTGART3.5
RETAIL PROPERTY9.5
ESSEN4.5
Development of former Brinkmann site
Pho
to: J
ustu
s G
ross
e P
roje
kten
twic
klun
g G
mbH
26Investment market report 2018 27|

2 0 18
WFB Wirtschaftsförderung Bremen GmbH (Bremeninvest)Kontorhaus am MarktLangenstraße 2 – 4 (Entrance Stintbrücke 1)28195 BremenPhone: + 49 (0) 421 96 00 - 10Fax: + 49 (0) 421 96 00 - 810www.wfb-bremen.de
Dat
e 09
/ 20
18 ·
Des
ign:
Bür
o 7
visu
elle
Kom
mun
ikat
ion,
Bre
men
· P
hoto
s: J
onas
Gin
ter
· Tex
t: G
uido
Str
otkö
tter
· Tr
ansl
atio
n: K
ER
N A
G ·
Pri
nt: G
irzi
g +
Got
tsch
alk