2019 consumer ott report -...
TRANSCRIPT
A deep dive into how streaming services are capturing consumer attention and how advertisers can capitalize
2019 CONSUMER OTT REPORT
1
OTT has grown to make up an increasingly large percentage of all consumer time spent with media and advertisers and content creators alike are now navigating uncertain and unchartered waters to better understand the sea change underway in how video content is consumed.
Against the backdrop of rapidly increasing time spent in OTT environments OpenX teamed with the global consumer polling firm The Harris Poll to undertake the most comprehensive assessment of the OTT consumer completed to date. The 2019 OTT Consumer Report found that more than half of all Americans now use an OTT service. With streaming now mainstream, “appointment TV” will never be the same as consumers increasingly turn to video content that they have curated for themselves, that is accessible across all of their devices, and is available at a date and time that is convenient to them.
For advertisers, this presents a massive untapped opportunity. In 2018, US advertisers spent approximately $70 billion on TV ads, yet just $2 billion was spent on targeted, addressable TV ads. With OTT capturing a significant percentage of total consumer video time, yet less than 5% of total spend, an enormous shift in how marketers diversify their advertising strategy is on the horizon.
The OTT era has arrived and with it comes a new and disruptive opportunity to elevate the power and efficacy of television brand marketing.
2019 Consumer OTT Report
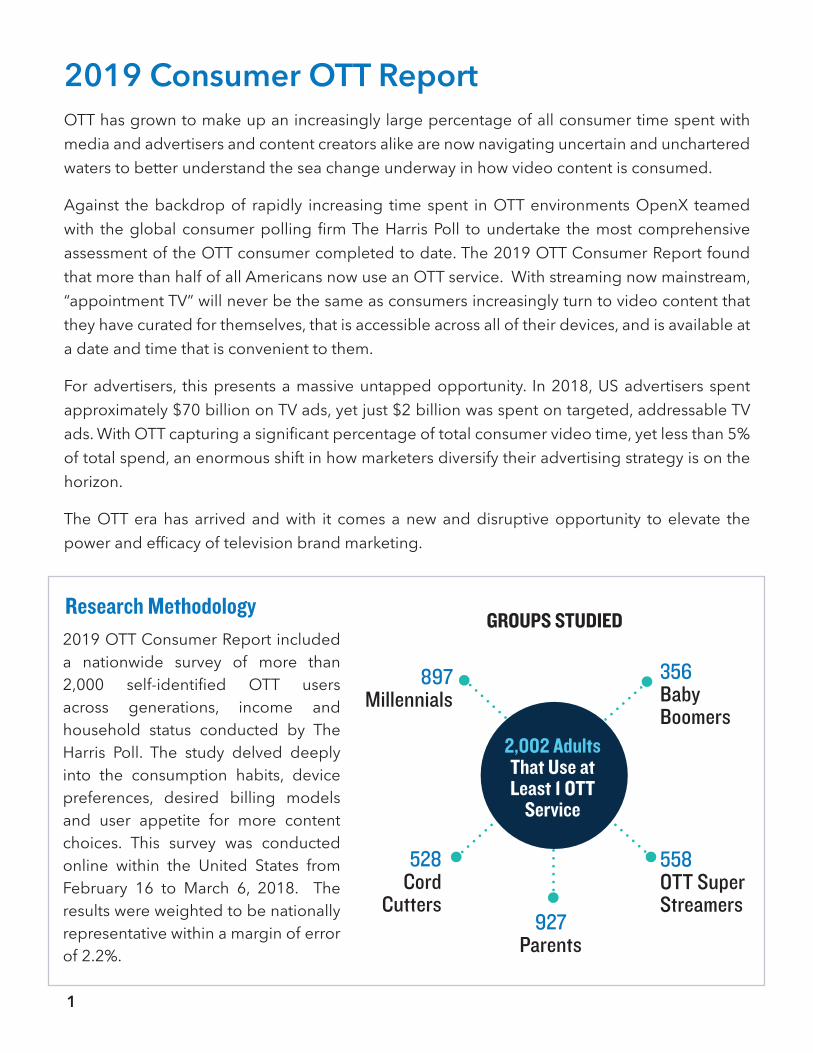
Research MethodologyGROUPS STUDIED
2,002 Adults That Use at Least 1 OTT
Service
897Millennials
356 Baby Boomers
528Cord
Cutters
558 OTT Super Streamers
927 Parents
2019 OTT Consumer Report included a nationwide survey of more than 2,000 self-identified OTT users across generations, income and household status conducted by The Harris Poll. The study delved deeply into the consumption habits, device preferences, desired billing models and user appetite for more content choices. This survey was conducted online within the United States from February 16 to March 6, 2018. The results were weighted to be nationally representative within a margin of error of 2.2%.
2
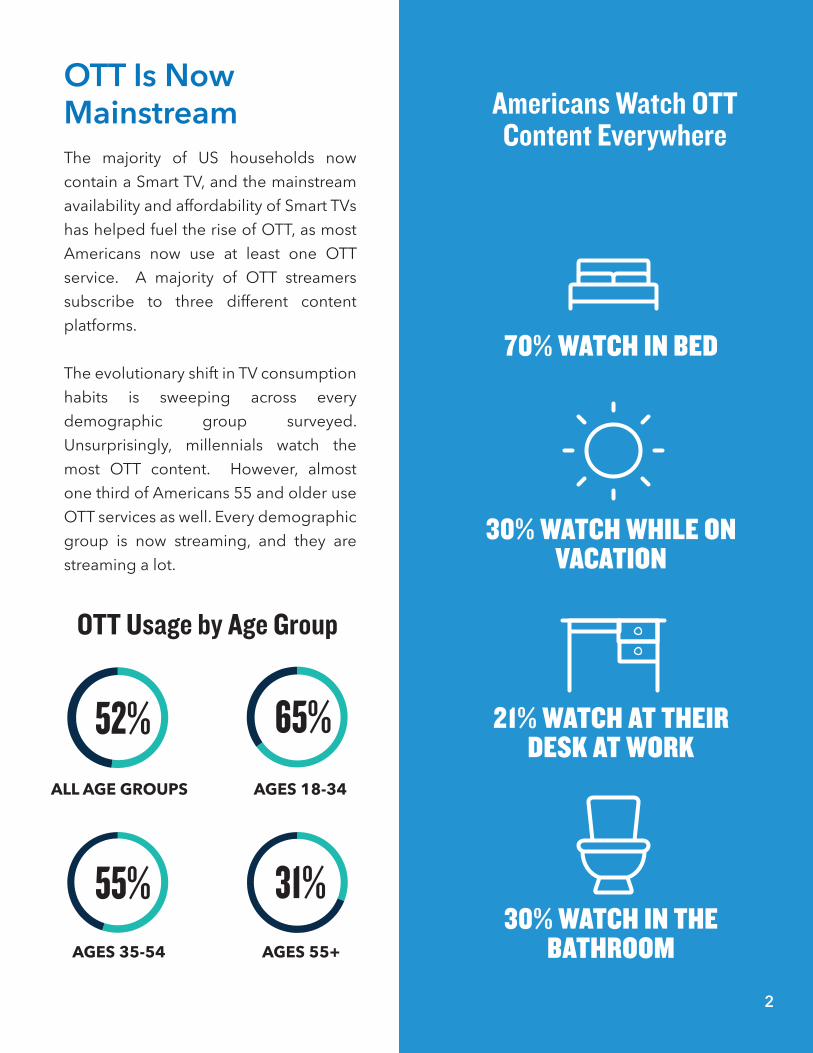
70% WATCH IN BED
30% WATCH WHILE ON VACATION
30% WATCH IN THE BATHROOM
21% WATCH AT THEIR DESK AT WORK
OTT Is Now Mainstream
OTT Usage by Age Group
The majority of US households now contain a Smart TV, and the mainstream availability and affordability of Smart TVs has helped fuel the rise of OTT, as most Americans now use at least one OTT service. A majority of OTT streamers subscribe to three different content platforms.
The evolutionary shift in TV consumption habits is sweeping across every demographic group surveyed. Unsurprisingly, millennials watch the most OTT content. However, almost one third of Americans 55 and older use OTT services as well. Every demographic group is now streaming, and they are streaming a lot.
52+4855+45 31+69
65+35ALL AGE GROUPS AGES 18-34
AGES 35-54 AGES 55+
52%
55%
65%
31%
Americans Watch OTT Content Everywhere
2
558 OTT Super Streamers
3
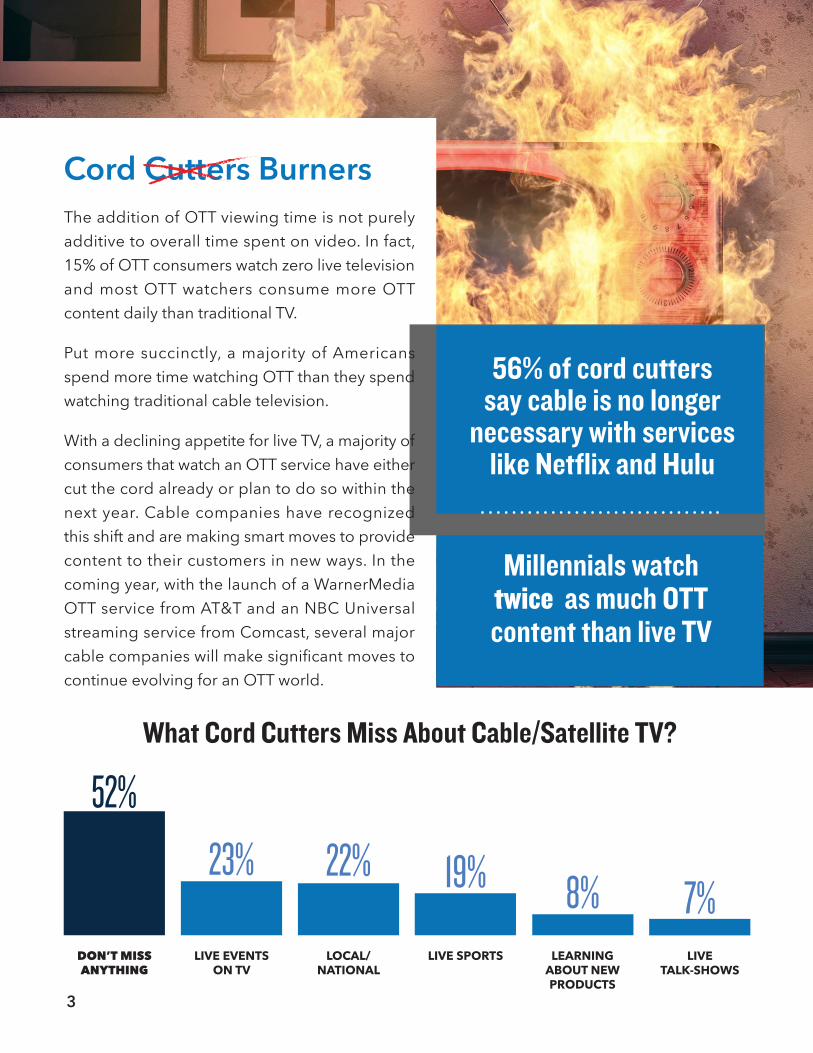
What Cord Cutters Miss About Cable/Satellite TV?
Cord Cutters BurnersThe addition of OTT viewing time is not purely additive to overall time spent on video. In fact, 15% of OTT consumers watch zero live television and most OTT watchers consume more OTT content daily than traditional TV.
Put more succinctly, a majority of Americans spend more time watching OTT than they spend watching traditional cable television.
With a declining appetite for live TV, a majority of consumers that watch an OTT service have either cut the cord already or plan to do so within the next year. Cable companies have recognized this shift and are making smart moves to provide content to their customers in new ways. In the coming year, with the launch of a WarnerMedia OTT service from AT&T and an NBC Universal streaming service from Comcast, several major cable companies will make significant moves to continue evolving for an OTT world.
56% of cord cutters say cable is no longer
necessary with services like Netflix and Hulu
19%23% 22%7%8%
52%
DON’T MISSANYTHING
LIVE EVENTSON TV
LOCAL/NATIONAL
LIVETALK-SHOWS
LIVE SPORTS LEARNING ABOUT NEW PRODUCTS
Millennials watch twice as much OTT content than live TV
4
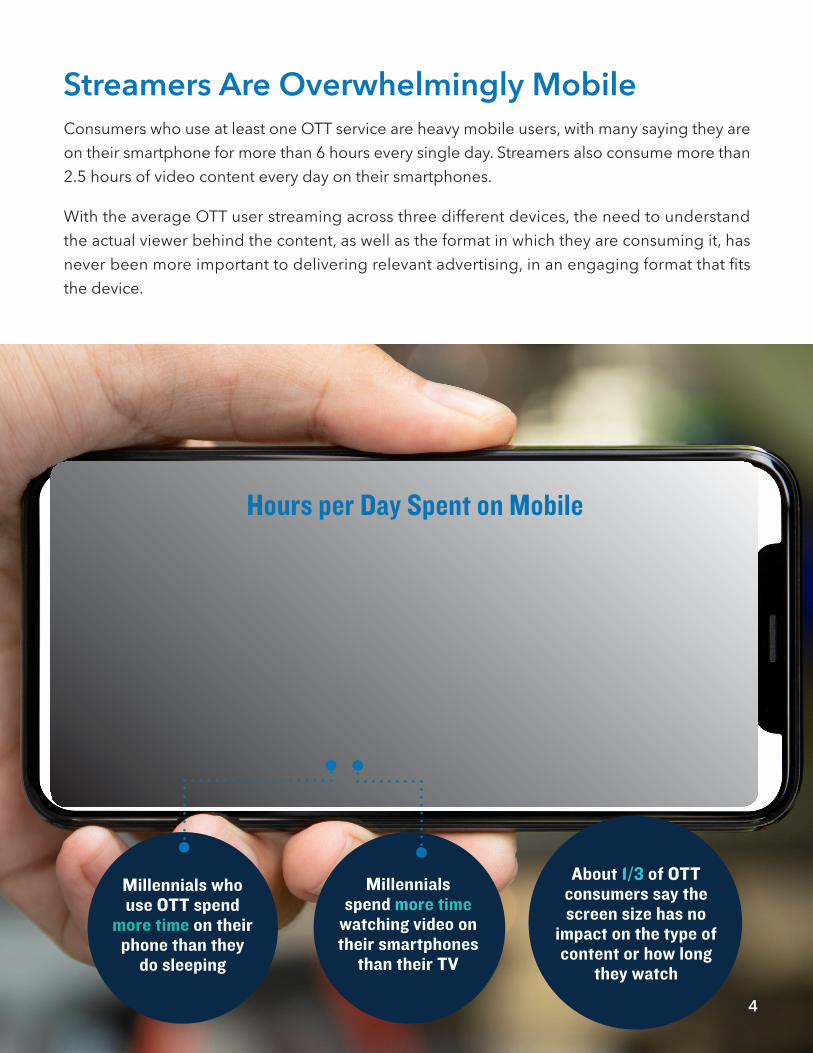
Streamers Are Overwhelmingly MobileConsumers who use at least one OTT service are heavy mobile users, with many saying they are on their smartphone for more than 6 hours every single day. Streamers also consume more than 2.5 hours of video content every day on their smartphones.
With the average OTT user streaming across three different devices, the need to understand the actual viewer behind the content, as well as the format in which they are consuming it, has never been more important to delivering relevant advertising, in an engaging format that fits the device.
6.2 7.2 6.0 4.2
US TOTAL MILLENNIALS GEN XBABY
BOOMERS
Hours per Day Spent on Mobile
Millennials who use OTT spend
more time on their phone than they
do sleeping
Millennials spend more time
watching video on their smartphones
than their TV
About 1/3 of OTT consumers say the screen size has no
impact on the type of content or how long
they watch
4
5
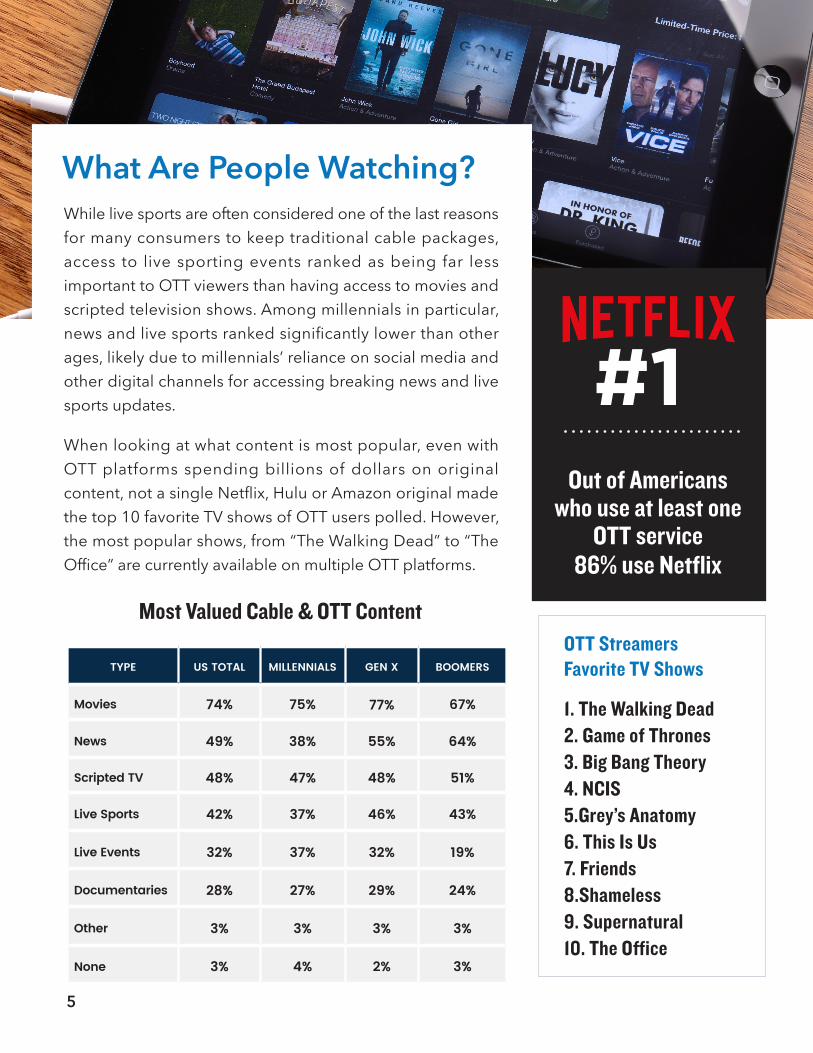
Most Valued Cable & OTT Content
While live sports are often considered one of the last reasons for many consumers to keep traditional cable packages, access to live sporting events ranked as being far less important to OTT viewers than having access to movies and scripted television shows. Among millennials in particular, news and live sports ranked significantly lower than other ages, likely due to millennials’ reliance on social media and other digital channels for accessing breaking news and live sports updates.
When looking at what content is most popular, even with OTT platforms spending billions of dollars on original content, not a single Netflix, Hulu or Amazon original made the top 10 favorite TV shows of OTT users polled. However, the most popular shows, from “The Walking Dead” to “The Office” are currently available on multiple OTT platforms.
What Are People Watching?
OTT StreamersFavorite TV Shows
1. The Walking Dead2. Game of Thrones3. Big Bang Theory4. NCIS5.Grey’s Anatomy6. This Is Us7. Friends8.Shameless9. Supernatural10. The Office
Out of Americans who use at least one
OTT service86% use Netflix
#1
TYPE US TOTAL MILLENNIALS GEN X BOOMERS
Movies 74% 75% 77% 67%
News 49% 38% 55% 64%
Scripted TV 48% 47% 48% 51%
Live Sports 42% 37% 46% 43%
Live Events 32% 37% 32% 19%
Documentaries 28% 27% 29% 24%
Other 3% 3% 3% 3%
None 3% 4% 2% 3%
6
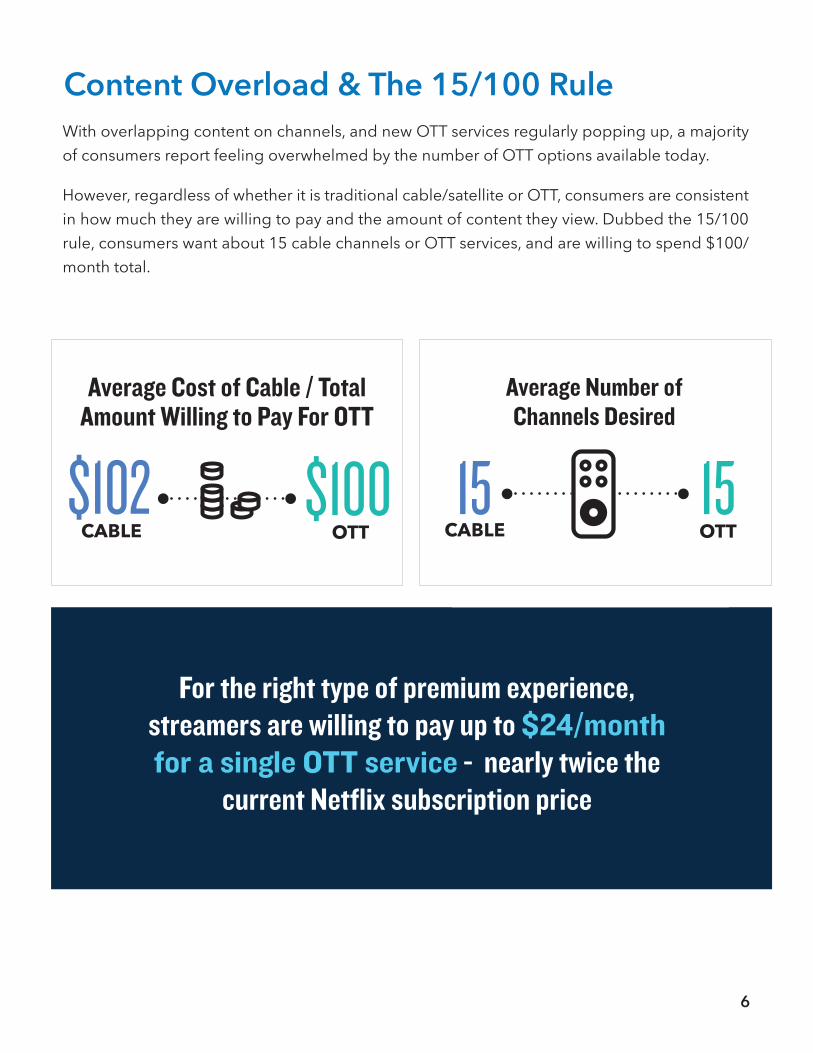
With overlapping content on channels, and new OTT services regularly popping up, a majority of consumers report feeling overwhelmed by the number of OTT options available today.
However, regardless of whether it is traditional cable/satellite or OTT, consumers are consistent in how much they are willing to pay and the amount of content they view. Dubbed the 15/100 rule, consumers want about 15 cable channels or OTT services, and are willing to spend $100/month total.
Content Overload & The 15/100 Rule
15CABLE OTT
Average Number of Channels Desired
15
For the right type of premium experience, streamers are willing to pay up to $24/month for a single OTT service - nearly twice the
current Netflix subscription price
$100CABLE OTT
Average Cost of Cable / Total Amount Willing to Pay For OTT
$102
7
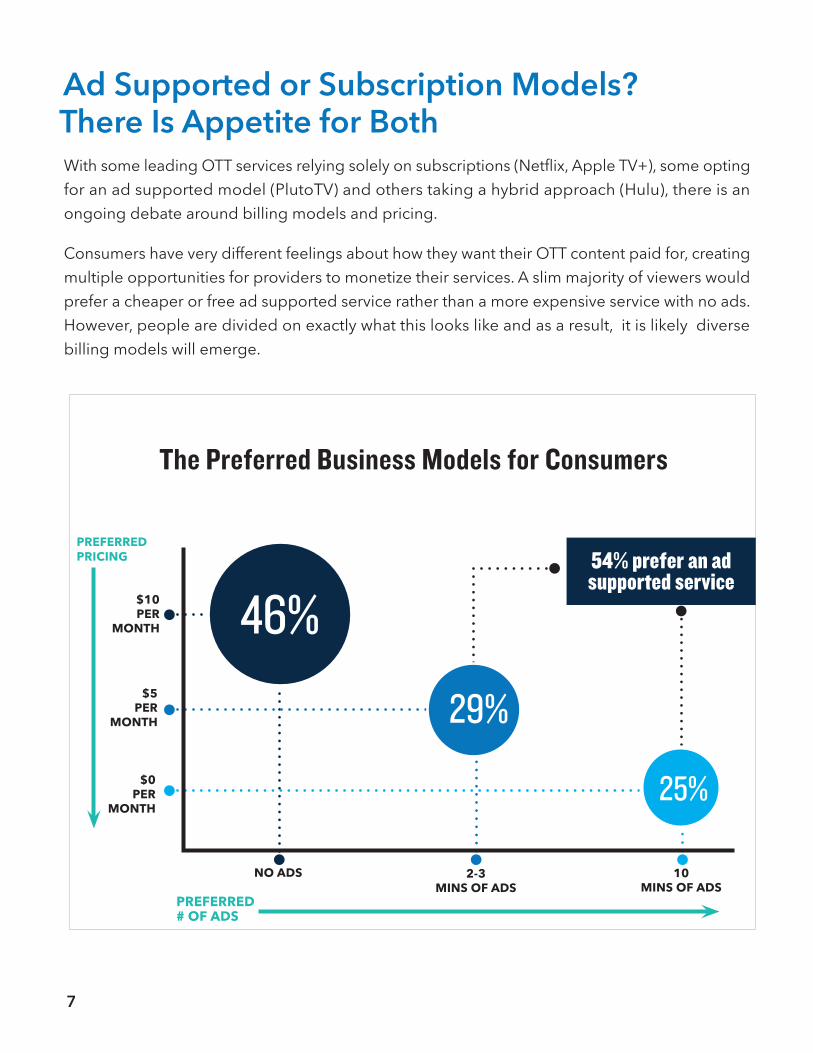
With some leading OTT services relying solely on subscriptions (Netflix, Apple TV+), some opting for an ad supported model (PlutoTV) and others taking a hybrid approach (Hulu), there is an ongoing debate around billing models and pricing.
Consumers have very different feelings about how they want their OTT content paid for, creating multiple opportunities for providers to monetize their services. A slim majority of viewers would prefer a cheaper or free ad supported service rather than a more expensive service with no ads. However, people are divided on exactly what this looks like and as a result, it is likely diverse billing models will emerge.
Ad Supported or Subscription Models? There Is Appetite for Both
10MINS OF ADS
2-3MINS OF ADS
NO ADS
$0PER
MONTH
$5PER
MONTH
$10PER
MONTH
PREFERRED PRICING
PREFERRED# OF ADS
The Preferred Business Models for Consumers
25%
29%
46%54% prefer an ad supported service

8
72%of OTT users
can recall seeing an ad
US advertisers spent nearly $70 billion on TV ads in 2018, yet less than 5% went to targeted, addressable TV ads.
OTT ads, while nascent, have proven effective, with 72% of OTT consumers having recalled seeing an ad and a surprising 40% of those who have seen an ad having “paused to purchase”, where they paused content to buy or learn more about a product.
The opportunity for brand marketers is to reinvent how they approach OTT advertising to deliver the TV-like creative experience consumers enjoy, in the newly relevant and highly targeted way OTT enables.
The Opportunity with OTT Advertising
Of all US consumers that watch live television, more than 50% do not watch any ads
40%of OTT users have
paused their content to purchase or learn
more online
66%of OTT users have
learned about a new product or company
from an OTT ad
9
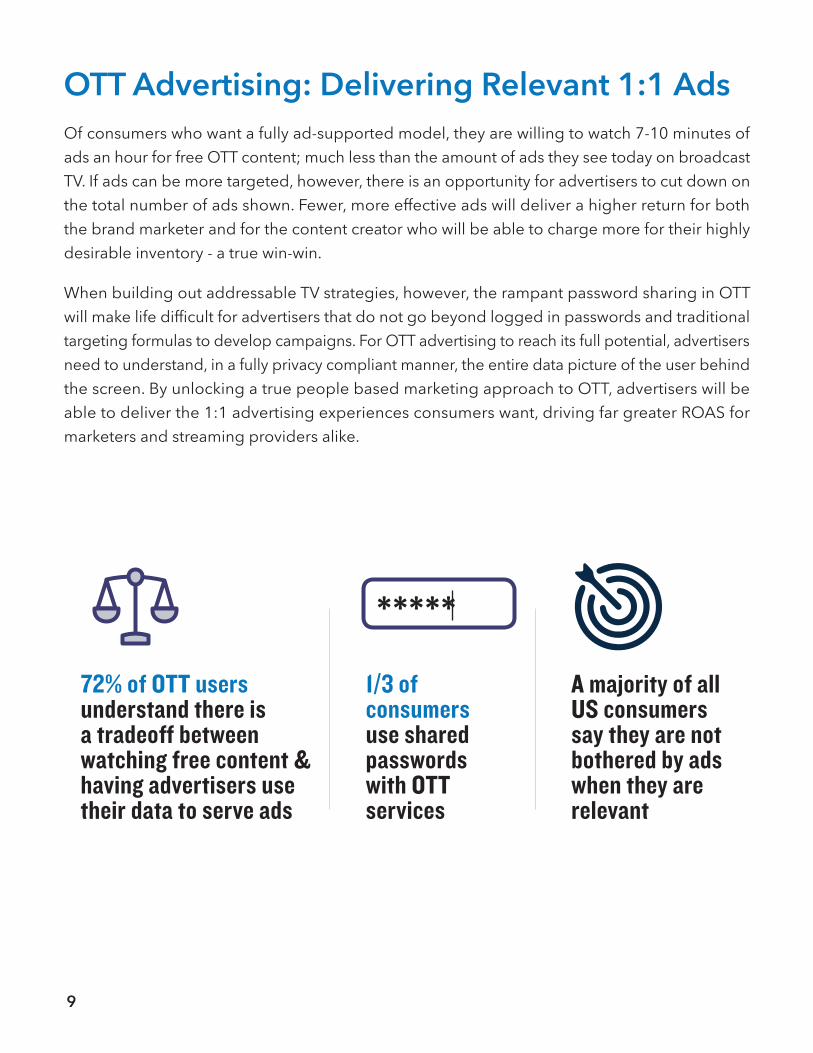
72% of OTT users understand there is a tradeoff between watching free content & having advertisers use their data to serve ads
1/3 of consumers use shared passwords with OTT services
A majority of all US consumers say they are not bothered by ads when they are relevant
Of consumers who want a fully ad-supported model, they are willing to watch 7-10 minutes of ads an hour for free OTT content; much less than the amount of ads they see today on broadcast TV. If ads can be more targeted, however, there is an opportunity for advertisers to cut down on the total number of ads shown. Fewer, more effective ads will deliver a higher return for both the brand marketer and for the content creator who will be able to charge more for their highly desirable inventory - a true win-win.
When building out addressable TV strategies, however, the rampant password sharing in OTT will make life difficult for advertisers that do not go beyond logged in passwords and traditional targeting formulas to develop campaigns. For OTT advertising to reach its full potential, advertisers need to understand, in a fully privacy compliant manner, the entire data picture of the user behind the screen. By unlocking a true people based marketing approach to OTT, advertisers will be able to deliver the 1:1 advertising experiences consumers want, driving far greater ROAS for marketers and streaming providers alike.
OTT Advertising: Delivering Relevant 1:1 Ads
*****
10
Start testing. While OTT ad inventory is available today, and over 70% of OTT consumers can recall ads they have seen, it is early in the maturation cycle. Advertisers can use the inventory available today to test, see what works for their brand, and when the floodgates of OTT fully open, they will be ready to capitalize.
Build video creative for both big screens (CTV) and small (smartphone). OTT users watch hours of video content a day on lean-forward, mobile devices, which provides a different experience than the traditional lean-back experience of TV. Have creative that works for both.
Ensure media buying teams understand traditional and digital. OTT is blending together mediums and eliminating the traditional divide between digital and TV. For optimal efficiency, media planning and buying teams need expertise in both worlds.
Use more than a login to understand the user behind the screen. With a third of consumers sharing passwords, advertisers need to think beyond logins and create more holistic people based marketing approaches that unify multiple data points to target the actual user behind the screen.
OTT ads offer the ability to target lower funnel activity. 40% of OTT consumers have paused the content they are watching to learn more about a product or make a purchase. Marketers have the ability to go beyond pure brand awareness, and run creative that will inspire immediate action.
Key Takeaways for Marketers
10
11
Users are open to ads. A majority of streamers are open to an ad supported model. OTT is not a one size fits all ecosystem, however, and there is a split amongst streamers about the exact number of ads they want to see, with some preferring fully ad supported and some preferring a hybrid approach with both ads and a discounted subscription.
Evaluate and consider 1st party data to enable more personalized ads. OTT streamers generally want fewer ads per hour than they see with traditional TV, so think about how to best leverage data to let advertisers show more personalized ads, so CPMs can increase and offset a decrease in ad load.
OTT was originally millennial-driven, but today everyone is watching. Millennials, the demographic with the most people and spending power today, are leading the charge on OTT, but consumers of all ages are migrating in large numbers to OTT content. Make sure all demos are considered when building content strategies.
Key Takeaways for Publishers
11
OpenX powers highly relevant advertising at global scale, delivering quality and value to brands, publishers and consumers across every type of connected screen and ad format. The company’s leading technology aggregates, curates and values consumer interest in real time on one of the world’s largest and highest quality ad exchanges to ensure marketers reach exactly the audience they want. OpenX serves more than 30,000 of the world’s most recognized brands, more than 1,200 publishers and more than 2,000 premium mobile apps.
To learn more about the report, visit http://www.openx.com/ottresearch