2019 passenger vehicle pilot - mileage based user fee
TRANSCRIPT

*Formerly the I-95 Corridor Coalition
Mileage-Based User Fee Exploration
2019 Passenger Vehicle Pilot
Final ReportMarch 01, 2021
The Eastern Transportation Coalition*

THE EASTERN TRANSPORTATION COALITION
II
CONTENTS0102
03
0405
06
Introduction 1
2019 Passenger Vehicle Pilot Overview 32.1 Recruitment and Enrollment 32.2 Participants and Demographics 42.3 Mileage Reporting Options 42.4 Value-Added Amenities 52.5 MBUF Calculations 72.6 Pilot Statistics 9
Pilot Evaluation Approach 113.1 Monthly Data Reports 113.2 Surveys 123.3 Focus Groups 13
Education and Outreach 15
Key Findings 195.1 Pilots Help Close the Knowledge Gap 195.2 Change is Hard 235.3 MBUF Transforms Drivers into Customers 275.4 “Pay for What you Use” Resonates, but It’s Complicated 305.5 Pilots Provide Useful Information for Rate-Setting Policies 34
Next Steps 39
AppendicesAppendix A: Pilot MBUF Statement for Plug-in Device with LocationAppendix B: Pilot Participant Agreement

THE EASTERN TRANSPORTATION COALITION
III
AcronymsTerm Definition
2019 Pilot 2019 Passenger Vehicle Pilot
Coalition The Eastern Transportation Coalition
DelDOT Delaware Department of Transportation
DMV Department (or Division) of Motor Vehicles
DOT Department of Transportation
GPS Global Positioning System
HTF Highway Trust Fund
MBUF Mileage-Based User Fee
MPG Miles Per Gallon
OBD-II Port On-Board Diagnostic Port
PennDOT Pennsylvania Department of Transportation
STSFA Surface Transportation System Funding Alternatives
VIN Vehicle Identification Number

THE EASTERN TRANSPORTATION COALITION
1
The Eastern Transportation Coalition (the Coalition), formerly known as the I-95 Corridor Coalition, has engaged its 17 partner states and Washington, D.C. to bring Eastern Seaboard and motor carrier perspectives to the national exploration of MBUF.
Since 2017, the Coalition has worked to advance the national conversation around the importance of investing in transportation and the need for sustainable transportation funding solutions. These issues have been especially important in recent years as transportation funding faces a steady decline.Currently, most funding used to maintain the U.S. transportation system comes from a fuel tax paid on each gallon of fuel purchased at the pump. When the first state fuel tax was introduced in 1919—the federal fuel tax wouldn’t be introduced until 1933—the amount of fuel a driver purchased was closely aligned with how much they used the roads.However, as cars become more fuel efficient and electric vehicles become more prevalent, how much fuel tax a driver pays is increasingly less correlated with their road usage. Additionally, the federal fuel tax rate has not increased since 1993, and many state fuel tax rates have not kept pace with growing demand. As a result, state and federal governments face a challenging trifecta of reduced transportation funding, decreased spending power as inflation rates rise, and deteriorating infrastructure—all as drivers continue to use state and federal roads. These realities have led many transportation stakeholders to search for a sustainable alternative to the fuel tax.A mileage-based user fee (MBUF) system is seen as a possible alternative. Unlike the fuel tax model, an MBUF model charges motorists for road use instead of the amount of fuel they purchase. Until a few years ago, MBUF studies primarily focused on Western states. The Coalition quickly realized these studies did not account for the unique characteristics of the Eastern Seaboard, such as frequent cross-state travel, numerous toll facilities, and multiple major truck corridors. While neutral on the subject of whether MBUF presents the ultimate solution for transportation funding, the Coalition is dedicated to ensuring the voices of Eastern Seaboard residents as well as the trucking industry are part of the national discussion around MBUF. To support this goal, the Coalition utilizes real-world passenger and truck pilots in a multi-state environment, conducts education and outreach efforts around MBUF, and engages with policymakers to
Introduction

THE EASTERN TRANSPORTATION COALITION
2
share key findings about the effects of MBUF on the Eastern Seaboard.To bring an Eastern Seaboard perspective to the assessment of MBUF, the Coalition applied for and received funding through the U.S. Department of Transportation Surface Transportation System Funding Alternatives (STSFA) program. The Coalition launched its first passenger vehicle MBUF pilot in 2018. This pilot—the first MBUF pilot to concentrate on Eastern states— focused on Delaware and Pennsylvania and included 155 transportation stakeholders from throughout the Eastern Seaboard.In 2019, the Coalition was awarded a second STSFA grant to expand the passenger vehicle pilot. One purpose of this pilot was to bring the insights and concerns of the general public into the national discussion about a sustainable and equitable transportation funding approach. Understanding that roadways are used for a variety of purposes and vehicle types, the Coalition also conducted a pilot from October 2018 to March 2019 focused on commercial vehicles. The results of this pilot, which was the nation’s first multi-state MBUF truck pilot ,are documented in a separate report (Coalition Multi-State MBUF Truck Pilot Final Report).This document provides an overview of the Coalition’s 2019 Passenger Vehicle Pilot, which was conducted from July to October 2019. Topics explored in this report include approaches to recruitment, enrollment, data evaluation, and education and outreach. Additionally, this report shares five key findings from the pilot and provides a window into how these findings will be further explored in the Coalition’s 2020-2021 (STSFA Phase 3) work.

THE EASTERN TRANSPORTATION COALITION
3
With its 2019 Passenger Vehicle Pilot, the Coalition built on its earlier pilot work by gathering insights from the general public through a four-month pilot that ran from July 1 to October 31, 2019.
2.1 Recruitment and EnrollmentThe Coalition set demographic targets during pilot recruitment with a goal of having participation from the general public reflect the geographic, age, and vehicle distribution in Pennsylvania and Delaware. Recruitment began in May 2019 with a target of 800 participants from the general public in Delaware and Pennsylvania. Partnering with the Delaware Department of Transportation (DelDOT) and the Pennsylvania Department of Transportation (PennDOT), the Coalition tailored recruitment efforts to each state to best reach potential participants.Recruitment efforts in Pennsylvania included a social media awareness campaign, postcard distribution (see Figure 2-1), postings on Department of Motor Vehicles (DMV) television screens, and a $10 gift card incentive for non-governmental participants who enrolled. State agencies, including PennDOT and the Pennsylvania Office of Administration, also shared recruitment materials with partners and stakeholders.In Delaware, recruitment leaned heavily on a social media campaign and DelDOT partner outreach to metropolitan planning organizations, industry interest groups, academies, and other interested organizations. These DelDOT partners were encouraged to sign up and invite their members to participate. Other efforts included a Delaware-oriented postcard, media releases, media interviews, postings on DMV television screens, and a $10 gift card incentive for non-governmental participants who enrolled.The pilot included recruitment of key transportation stakeholders in both states (e.g., DOT and DMV staff). The Coalition also extended pilot invitations to additional member states to expand the MBUF conversation across the Eastern Seaboard and provide stakeholders throughout the region the opportunity to experience an MBUF system and operations firsthand.Pilot recruitment concluded in August. The four-month recruitment effort ran concurrently with participant enrollment.
2019 Passenger Vehicle Pilot Overview
2
Figure 2-1: Sample Postcard

THE EASTERN TRANSPORTATION COALITION
4
2.2 Participants and DemographicsCoalition and state partner recruitment efforts for the 2019 Passenger Vehicle Pilot yielded a total of 889 enrolled participants from 14 Coalition states and Washington, D.C. Eighty percent of participants were from the general public in Delaware (287 drivers) and Pennsylvania (421 drivers). Table 2-1 shows the demographic breakdown of participation in Delaware and Pennsylvania compared to recruitment targets, and Figure 2-2 and Figure 2-3 show the locations of participants.These data include both general public and stakeholder participants.The remaining pilot participants were key stakeholders identified across Coalition states.Table 2-1: 2019 Passenger Vehicle Pilot Participant Demographics for PA and DE
2.3 Mileage Reporting OptionsPart of the exploration of MBUF centers on the methods used to assess drivers’ miles driven. For this reason, the Coalition incorporated MBUF technology into the pilot to better assess available MBUF reporting options. Azuga, a third-party vendor, was selected to provide the mileage reporting technology and account management support for the 2019 Pilot. Azuga offered pilot participants two mileage reporting options:
Demographic RangePennsylvania-428 vehicles Delaware-293 vehicles
Target Actual Target Actual
LocationUrban 71% 76% 68% 64%Rural 22% 19% 17% 20%
Urban Cluster 8% 5% 15% 15%
Age18-34 29% 22% 28% 14%35-54 32% 51% 33% 53%55+ 39% 27% 39% 13%
Vehicle TypeICE / Diesel 96% 94% 96% 91%
Hybrid 2% 5% 2% 8%Electric 2% 1% 2% 1%
Urban, rural, and urban cluster are based on census definitions as follows:• Urban – Densely settled core of census tracks and/or census blocks of 50,000 or more people• Urban Cluster– Settled core of census tracks and/or census blocks of at least 2,500 and less than 50,000 people• Rural – All population, housing, and territory not included within in an urban or urban cluster area
Figure 2-2: Location of Enrolled Participants in PA Figure 2-3: Location of Enrolled Participants in DE

THE EASTERN TRANSPORTATION COALITION
5
1. Plug-In Device with Location: This device plugs into the vehicle’s on-board diagnostic (OBD-II) port, using vehicle data and location to calculate the MBUF based on the state(s) where miles were actually driven. A location-based MBUF enables funds collected to be accurately distributed between states based on how many miles were driven in each state. The location-based device also provides a broader array of value-added features for the vehicle owner (see Figure 2-4).2. Plug-In Device without Location: This device plugs into the vehicle’s OBD-II port that uses vehicle data to calculate the MBUF based on a pre-defined estimate of the state(s) where miles are driven. The non-location MBUF option reduces privacy concerns regarding trip data but does not provide a connection between the funds collected and where the miles were accrued, reducing the accuracy of fund distribution between states. Not having the location technology also reduces the number of value-added amenities available.During the project’s concept development and testing period, the Coalition explored additional mileage reporting options, including use of in-vehicle telematics and plug-in devices for the 12-volt power outlet for cars that do not have an OBD-II port. However, these were not incorporated into the pilot due to technology limitations, cost, or reporting accuracy concerns.
2.4 Value-Added AmenitiesVehicle technology and driver interest in vehicle and travel information provide an opportunity to change how transportation is funded. For example, there is a growing market for devices that convert data stored in a vehicle’s computer (or data collected by a plug-in device) into useful information for drivers. The different types of vehicle and travel information provided to drivers are known as “value-added amenities.” These amenities were offered to pilot participants to assess their interest in receiving access to vehicle and driving behavior information made available through the mileage reporting technology used in the pilot. Table 2-2 summarizes the available value-added amenities provided by Azuga for each mileage reporting option in the 2019 Passenger Vehicle Pilot. Figure 2-5 provides pictures and screenshots of some of these amenities.
Figure 2-4: Plug-In Device

THE EASTERN TRANSPORTATION COALITION
6
Table 2-2: 2019 Passenger Vehicle Pilot Value-Added Amenities
Value-Added Amenities
Plug-in Device
with Location
Plug-In Device without
LocationMBUF Details: Allows participants to view all data pertaining to MBUF charges, includ-ing miles traveled and fuel tax credit. Location-based devices provide this information by state.
X X
Trip Logs: Provides users detailed trip logs so they can see details about their trips, including duration, cost, and carbon footprint. X X
Vehicle Health: Offers valuable information about what’s happening when the Check Engine light goes on or when the plug-in device provides a diagnostic trouble code. An email identifying the code is sent to the user along with a link to a webpage that provides a detailed description of the code.
X X
Battery Voltage: Provides drivers information about their car’s battery health. Thisincludes automatically sending an email to the user when the battery charge drops below a specified level.
X X
Driver Scoring: Gives feedback to the user on how smoothly they drive. Driving factors that are scored include high speed, acceleration, braking, and idling. X X
Safe Zones: Allows users to establish geographical zones on a map and notifies the user when the vehicle has entered or exited those zones. X
Enhanced Visual Trip Logs: Shows individual trips on a map and is shareable with friends. Also shows instances of poor driving (e.g., excessive speed, hard breaking). X
2MyCar: Guides users back to their vehicle (using their smartphone) and either pro-vides turn-by-turn instructions or a straight-line route. X
Figure 2-5: Value-Added Amenities

THE EASTERN TRANSPORTATION COALITION
7
2.5 MBUF CalculationsThe per-mile rates and fuel tax credits used for calculating the MBUF for the 2019 Pilot are based on the concept of “net revenue neutral.” In other words, a vehicle operating at the national average of 22 miles per gallon (MPG) would pay an MBUF that is equal to the amount paid for the state fuel taxes. An additional 19% fee was added to cover the estimated costs associated with MBUF system administration and compliance.1
The per-mile rate calculation is: Per-Mile Rate = (State Fuel tax/National Fuel Economy Average of 22 MPG) * 1.19Azuga’s account management system collects mileage and fuel consumption data from the plug-in device installed in the vehicle and processes the data to determine MBUF and fuel tax credits for each participant. The driver is simply responsible for plugging the device into the OBD-II port to activate the device at the beginning of the pilot. All charges assessed by Azuga and the Coalition were simulated—no actual monies were collected from participants.All mileage driven and recorded during the 2019 pilot was charged the MBUF (less credit for the estimated fuel tax). The rates and assumptions for each reporting option are provided as follows:• Plug-in device with location – Mileage collected was differentiated by the state where the mileage
was driven. The net mileage fee was based on each state’s per-mile rate, less a credit for the state fuel tax for the estimated gas consumed in each state. The per-mile rates and state fuel tax amounts for each Coalition state are shown in Table 2-3.
Table 2-3 : Per-Mile Rates and Fuel Tax Credits (i.e., State Fuel Tax)
1 The 19% addition was based on the results of financial analyses prepared for Delaware and Pennsylvania during the 2018 MBUF work. Additional details of the analysis and results are provided in the Administration and Compliance Issues Tech Memo (August 2019) (https://www.i95coalitionmbuf.org/tech-memos).
State Per-Mile Rate(cents per mile)
Fuel tax Credit (cents per gallon)
Connecticut 1.99 36.85
Delaware 1.25 23.00
Washington, D.C. 1.27 23.50
Florida 2.27 41.99
Georgia 1.90 35.28
Maine 1.62 30.01
Maryland 1.91 35.30
Massachusetts 1.44 26.54
New Hampshire 1.2 9 23.83
New Jersey 2.24 41. 40
New York 2.39 44.10
North Carolina 1.97 36.45
Pennsylvania 3.18 58.70
Rhode Island 1.84 34.00
South Carolina 1.12 20.75
Vermont 1.69 31.19
Virginia 1.12 20.66

THE EASTERN TRANSPORTATION COALITION
8
• Plug-in device without location – For each vehicle, a percentage2 of the mileage and fuel tax payments was assumed to have occurred in the vehicle’s home state. The MBUF was calculated by applying the participant’s state of residence per-mile rate and fuel tax to this estimated in-state mileage. The remaining percentage of the vehicle’s mileage was assumed to have been driven in states adjacent to the participant’s home state. For the mileage estimated to have been driven in adjacent states, the average per-mile fee and average fuel tax for out-of-state mileage were based on the per-mile rates and state fuel taxes in adjacent states. The percentages used to estimate the out-of-state mileage driven by residents3, average out-of-state per-mile rates, and average fuel taxes for each state are shown in Table 2-4. The per-mile rates and state fuel taxes in Table 2-4 are “blended” rates based on the noted assumptions and percentage of out-of-state travel done by the residents of each state.
Table 2-4: Assumed Percentages of Out-of-State Mileage by In-State Vehicles and Associated Out-of-State Per-Mile Rates and Fuel taxes Used for Plug-in Device without Location Option
For a plug-in device with location, mileage is differentiated by the state in which it is accrued, and the mileage charge is calculated accordingly. For this vehicle, the MBUF charge would be calculated as shown in Table 2-5.
2 This percentage was based on U.S. Census statistics pertaining to levels of work‐related cross‐state travel. 3 These percentages are derived from U.S. Census information on the percent of residents in each state that work in another state.
StateOut-of-State Mileage by
Resident Drivers
Out-of-State Per-Mile Rate
(cents per mile)
Out-of-State Fuel Tax Credit
Assumptions for Out-of-State Rates and Fuel
TaxesConnecticut 8% 2.01 37.19 NY (50%), RI, MA
Delaware 18% 2.63 48.53 PA (50%), NJ, MD
Washington, D.C. 30% 1.51 27.98 VA, MD
Florida 1% 1.91 35.28 GA
Georgia 3% 1.70 31.37 SC, Fl
Maine 5% 1.36 25.19 NH, MA
Maryland 20% 1.50 27.71 DC (35 %), VA (35%), PA, DE
Massachusetts 5% 1.88 34.70 CT, NH, RI, NY
New Hampshire 18% 1.55 28.57 MA (50%), VT, ME
New Jersey 15% 2.78 51. 40 NY, PA
New York 4% 2.1 2 39.13 NJ, CT
North Carolina 3% 1.1 2 20.71 VA, SC
Pennsylvania 6% 1.95 35.95 DE, MD, NJ, NY
Pennsylvania 6% 1.95 35.95 DE, MD, NJ, NY
Rhode Island 16% 1.72 31. 70 CT, MA
South Carolina 5% 1.94 35.8 7 GA, NC
Vermont 8% 1.84 33.9 7 NH, NY
Virginia 10% 1.59 29.40 DC, MD

THE EASTERN TRANSPORTATION COALITION
9
Table 2-5: Device with Location Example: Calculations for Delaware-Registered Vehicle with 30 MPG Average
For a plug-in device without location, mileage is not differentiated by the state in which it is accrued. Instead, the mileage charge is calculated based on the assumptions and rates identified previously in Table 2-4. For this vehicle, the MBUF charge would be calculated as detailed in Table 2-6.
Table 2-6: Device without Location Example: Calculations for Delaware-Registered Vehicle with 30 MPG Average
Example calculations are shown in Table 2-5 and Table 2-6 for a vehicle registered in Delaware averaging 30 MPG that drives 1,200 miles in one month with 800 of those miles driven in Delaware, 300 miles driven in Pennsylvania, and 100 miles driven in Maryland.
2.6 Pilot Statistics Nearly 900 vehicles from 14 Coalition states and Washington, D.C. participated in the 2019 Passenger Vehicle Pilot, which ran for four months from July 1 to October 31, 2019. These vehicles accumulated almost 3.13 million miles across 42 states and Canada (Figure 2-6) with 13% of those miles driven out of state. Eighty percent of pilot participants selected the plug-in device with location. Table 2-7 summarizes the average monthly mileage and MBUF per vehicle over the course of the four-month pilot. As shown in the table, the average number of miles driven by pilot participants each month was just over 1,200 miles, which is higher than the 2018 average of 965 miles driven per month by passenger vehicles4. The average monthly MBUF paid per vehicle was $27.67, which is nearly $7.50 more per vehicle, on average, than the estimated fuel tax paid per vehicle. This increased MBUF amount, relative to the gas tax, is the result of two factors:
4 From the Federal Highway Administration. (2018; Revised November 2019). Highway Statistics 2018, Table VM-1. Retrieved from https://www.fhwa.dot.gov/policyinformation/statistics/2018/vm1.cfm. The annual value for light-duty vehicles is 11,576 miles/vehicle, which equates to a monthly average of 965.
Without Location (Assumed State Mile-
age)Mileage Charge Fuel tax Credit Net Difference
Delaware (82%) 984 x 0.0125 = $12.30 (984/30) x 0.23 = $7.54 $4.76
Other States (18%) 216 x 0.0263 = $5.68 (216/30) x 0.4853 = $3.49 $2.19
Total $17.98 $11.03 $6.95
With Location MBUF Charged Estimated Fuel tax Credit Net Difference
Delaware 800 x 0.0125 = $10.00 (800/30) x 0.23 = $6.13 $3.87
Pennsylvania 300 x 0.0318 = $9.54 (300/30) x 0.587 = $5.87 $3.67
Maryland 100 x 0.0191 = $1.91 (100/30) x 0.353 = $1.18 $0.73
Total $21.45 $13.18 $8.27

THE EASTERN TRANSPORTATION COALITION
10
Month Average # Vehicles
Monthly Averages per Vehicle
Chargeable Miles MBUF Gas Tax Cred-
itsNet
RevenueJuly 2019 201 1,103 $28.34 -$20.33 $8.02
August 2019 587 1,261 $30.32 -$22.49 $8.14
September 2019 846 1,223 $27.33 -$19.94 $7.38
October 2019 886 1,228 $27.15 -$19.80 $7.35
Pilot Average 630 1,203 $27.67 -$20.25 $7.49
• When using a single MBUF rate framework based on the national average of 22 MPG, vehicles with fuel efficiency greater than 22 MPG will pay more in MBUF than paid in fuel taxes. Similarly, a vehicle with less than 22 MPG will receive a credit because the MBUF paid is less than the amount paid in fuel tax. The average fuel efficiency of the vehicles participating in the pilot was 25.3 MPG, resulting in an increase in MBUF payments.
• The 19% included in the 2019 MBUF rates to cover the additional estimated administration and compliance efforts associated with MBUF.
About a third of the increased average monthly payment of $7.49 can be attributed to the higher average MPG of participant vehicles and the remainder can be attributed to additional administrative and compliance costs.
Figure 2-6: States Where Mileage Was Accrued During 2019 Passenger Vehicle Pilot Table 2-7 : Average Monthly Mileage and MBUF Per Vehicle
3,129,096MILES DRIVEN
Passenger Vehiclesfrom 15 States
Drove across 42 States+Canada
889PARTICIPANTS
13% of miles driven are out of state miles
States traveled by participant
Participants’ base state

THE EASTERN TRANSPORTATION COALITION
11
The Coalition team, consisting of subject matter experts from Jacobs, Burns & McDonnell, and DHM Research, analyzed pilot data and conducted statewide surveys, participant surveys, and focus groups to assess the accuracy, understanding, and acceptance of MBUF.
The 2019 Passenger Vehicle Pilot evaluation process used pilot data, statewide surveys, and participant focus groups to assess the opinions and perspectives of the general public and key stakeholders, while also continuing the assessment of unique attributes of the Eastern Seaboard (e.g., multi-state travel and tolling) in an MBUF context. Information the Coalition collected and analyzed are summarized in the subsections below. Key findings from these evaluation activities are presented in Section 5.
3.1 Monthly Data ReportsOver the course of the pilot, Azuga provided a series of monthly reports to the Coalition team. The monthly reports were used to evaluate the effectiveness and accuracy of the technologies and approaches included in the pilots. They were also used to develop pilot statistics regarding miles driven and MBUF charges (overall and average per participant), levels of out-of-state mileage, and any other issues that arose during the month as reflected in Help Desk information. The monthly reports from the account manager that were used for the evaluation included:• Mileage and MBUF Revenue Report: Provided the
reported mileage from each vehicle and the gross and net (minus fuel tax credits) MBUF charges by state.
• Vehicle Identification Number (VIN) Summary Report: Included a list of all vehicles enrolled with the account manager for the 2019 Pilot. Note: All personally identifiable information was protected.
• Errors and Events Report: Provided any technical errors, anomalies, or events encountered by mileage reporting hardware or the data gathering process.
• Account and VIN Update Report: Reported all account attribute changes and status updates regarding participants and vehicles in the pilot. This report also included the status of the participants in the pilot.
• Help Desk Report: Reported all customer support issues, resolution actions, and associated response and resolution times logged by the account manager.
Pilot Evaluation Approach3

THE EASTERN TRANSPORTATION COALITION
12
The individual reports were subsequently combined to provide a statistical picture of the entire pilot. The following information was included in these monthly summary reports:• Total number of vehicles enrolled in the pilot versus total number of vehicles actually reporting mileage• Total miles traveled by in-state and out-of-state mileage • Net road charge paid compared to fuel tax paid (including by state of travel and fuel tax credits) and average monthly
MBUF• Errors and events by type (e.g., new vehicle connection, disconnects/reconnects)• Analysis and summary of Help Desk logs (e.g., instances, types, time to respond and fix)The data included in all reports were sanitized and anonymized to protect participant privacy. These precautions included removing all participant-specific personal information (for example, names and mailing addresses). Individual participants’ data were never shared with the participating states or with the Coalition. Additionally, neither detailed location information (e.g., routes taken) nor information on driving behavior was provided to the Coalition, the Coalition member states, the project consultant team, or any third party.
3.2 SurveysThree surveys were conducted over the course of the pilot:1. Statewide Surveys: The Coalition commissioned statewide phone surveys in Pennsylvania and
Delaware in February 2019 to achieve the following objectives: » Assess transportation priorities and knowledge about how transportation is funded » Gauge attitudes toward an MBUF model » Establish a benchmark to monitor and evaluate change in attitudes over time » Help tailor the education and outreach effort for recruiting the general driving public to participate in
the MBUF pilotSurvey participants consisted of 500 residents from Pennsylvania and 500 residents from Delaware. This is a sufficient sample size to assess resident opinions generally and to review findings by multiple subgroups, including age, gender, income bracket, education level, and area of state. The survey took participants about 17 minutes to complete. Survey methodology included quotas and weighting by age, gender, area of state, and ethnicity to ensure a representative sample. The margin of error was ±4.4% for each state. 2. Pre-Pilot Survey: This survey was administered at the beginning of the pilot after participants enrolled
and installed their devices. The survey focused on capturing participants’ attitudes about the enrollment and onboarding processes, their current driving and fueling habits, and their baseline attitudes about MBUF and knowledge of transportation funding. This initial survey had a response rate of approximately 84%.
3. Post-Pilot Survey: This survey was administered after the pilot was completed and focused on pilot activities, such as what participants thought about the accuracy of the data collected, participants’ overall experience, changes in driving behavior, efficacy of pilot incentives, and their experience with the account manager and the Coalition. It also provided a final update on attitudes about MBUF. The final pilot survey had a response rate of approximately 65%.

THE EASTERN TRANSPORTATION COALITION
13
The results from these participant surveys are not statistically significant. However, given the fact that the surveys conducted in Pennsylvania and Delaware included members of the driving public, they do provide useful information on general trends and changes in attitudes between the start and the end of the pilot.
3.3 Focus GroupsIn addition to the surveys, the Coalition conducted four focus groups with 33 pilot participants. These focus groups provided useful anecdotal information that can help further explain results from the statewide surveys and participant pilots. Two focus groups were held in Pennsylvania and two were held in Delaware. The Pennsylvania focus groups occurred in West Mifflin, near Pittsburgh, on October 28, 2019, and in Harrisburg on October 29, 2019. The Delaware focus groups occurred in Newark, near Wilmington, on October 30, 2019, and in Dover on November 2, 2019. Focus group participants were recruited from pilot participants with efforts made to ensure diversity by gender, age, occupation, income, education level, political orientation, and ethnicity. Additional efforts were made to recruit a mix of focus group participants with the following attributes: • Participants from urban, suburban, and rural areas• Drivers of older and newer vehicles• Drivers of gas, diesel, hybrid, plug-in hybrid, and electric vehicles• Participants who drive an average of 10 miles or less, 11–45 miles, or more than 50 miles on a daily
basis The focus groups assessed motives for participation in the pilot; experiences in the pilot, especially responses to invoices; perceptions of value-added amenities; and attitudes about MBUF. The focus groups also provided the opportunity to gain deeper insights into why participants supported or opposed MBUF. For example, through the focus group discussions, participants were able to unpack the overly simplistic assumption that an MBUF would be more costly to drivers than a fuel tax for those who drive more miles.

THE EASTERN TRANSPORTATION COALITION
14

THE EASTERN TRANSPORTATION COALITION
15
Education and Outreach
4 • Presentations – Coalition Executive Director Patricia Hendren delivered over a dozen presentations to regional and national groups with an interest in transportation funding. These groups included the following: » American Association of State Highway and
Transportation Officials » Northeast Association of State Transportation Officials » Southeastern Association of State Highway and
Transportation Officials » International Bridge, Tunnel and Turnpike Association » Mileage-Based User Fee Alliance » American Road and Transportation Builders Association » National Governors Association » American Public Transportation Association » Chamber of Commerce » Council of State Governments » State groups (Virginia Governor’s Transportation
Conference, Maine Blue Ribbon Commission, Kentucky Mileage Based Funding Task Force)
» Coalition Executive Board (CEOs of 17 DOTs) » Federal Highway Administration
• Project Website (www.TETCoalitionMBUF.org) – The project website had 11,111 unique visitors and 22,835 page views between January 1, 2019 and December 31, 2019. Approximately two-thirds of all visitors accessed the site directly using the URL rather than a search engine or other source. The website contains a number of valuable, distributable resources, including the following: » 2019 Passenger Pilot Fact Sheet – The fact sheet is
located on the project website and is broadly distributed.
In addition to the various materials developed as part of the participant recruitment activities described in Section 3, education and outreach activities in the 2019 Pilot included the following:
Education and outreach activities were a major component of this work and included efforts to inform the public about the need for a sustainable transportation funding approach as well as the MBUF concept and what a shift to MBUF would mean for them.

THE EASTERN TRANSPORTATION COALITION
16
» Frequently Asked Questions (FAQs) – This page provides additional details on the Coalition pilot, how an MBUF works, how the MBUF rates are developed, and how MBUF charges are calculated.
» Video – This resource is available on the project website and explains the value and importance of transportation, discusses how transportation is funded, and gives a brief overview of an MBUF and the work the Coalition is conducting.
• MBUF Cost Calculator – The calculator is included on the project website and provides users an estimate of what they might pay under an MBUF system compared to the current fuel tax. Users simply input information about where they live (state), vehicle make/model and the associated average fuel efficiency, and the average number of miles they drive in a month.
• Monthly Pilot Statement – The monthly pilot statement was reconfigured from the 2018 pilot to be used as an additional education tool. The monthly pilot statement is described in greater detail below.
Figure 4-1: Screenshot of MBUF Cost Calculator on Project Website

THE EASTERN TRANSPORTATION COALITION
17
The education and outreach efforts for the 2019 Passenger Vehicle Pilot include a reconfiguration and expansion of the monthly pilot statement to provide participants a broader picture of the cost of driving. As part of this reconfiguration, the information shown in Table 4-1 was added, including the cost of fuel (the operating expense), the state fuel tax, the federal fuel tax, and MBUF in lieu of the state fuel tax. A copy of a complete MBUF statement from the 2019 Pilot is provided in Appendix A.
Table 4-1: Example Monthly Pilot Statement Summary of Transportation Costs
Please note that all charges reflected on this statement are simulated. No amount of monetary value will be exchanged.
Note: Fuel cost is based on the average mid-month fuel price in your home state times the number of gallons used for the month. Average statewide fuel prices are obtained from AAA.
The participant surveys and focus groups were used in the 2019 Pilot to obtain feedback on the new MBUF statement. As shown in Figure 4-2, the vast majority of participants found the monthly
Billable Miles Driven During the Month 1,000Gallons of Fuel Used During the Month 33
Transportation Costs, Fees, and Taxes Estimated Costs You Currently Pay
Estimated Costs with a MBUF
Fuel Costs (excluding state and federal taxes) $74.46 $74.46
Mileage-Based User Fee (miles driven × per-mile rates for each state) $0.00 $17.25
State Gas Tax $14.46 $0.00
Federal Gas Tax $8.36 $8.36
Total Estimated Costs $97.28 $100.07
Net Difference $2.79
Figure 4-2: Pilot Participants’ Reactions to the Monthly Statement
to understand to understand or easy tounderstand
Easy to understand
Very easyto understand
90%
100%
2% 2%
11%
36%
49%80%
60%
70%
50%
40%
30%
10%
20%
0%
%1
6%
9%

THE EASTERN TRANSPORTATION COALITION
18
statement format easy to understand. Focus group participants shared that the monthly statements clearly communicated the amount they would be billed. Participants were also very satisfied with the statement’s ability to differentiate between what drivers would pay with an MBUF as opposed to a fuel tax. In general, their primary interest in the statement was to see whether their total taxes and fees would increase or decrease with MBUF.The education and outreach activities will continue to be a major element in the Coalition’s future MBUF endeavors. These activities will include regularly updating the Coalition’s MBUF website, continuing to make presentations to interested stakeholder and policy groups, and delivering updates to pilot participants and other interested individuals.

THE EASTERN TRANSPORTATION COALITION
19
Key Findings
55.1 Pilots help Close the Knowledge GapBy providing real-world experiences, pilots can help fill knowledge gaps that exist in the U.S. about how the transportation system is funded. Coalition surveys revealed that information gaps can be numerous when it comes to transportation—and these gaps can have notable implications for policymakers.
5.1.1 Identify Knowledge GapsCoalition surveys conducted before the 2019 Pilot found that 74% of Pennsylvania and Delaware residents surveyed believe transportation funding is not decreasing (see Figure 5-1), even though funding is actually decreasing. Additionally, 66% of Delaware and Pennsylvania residents believe roads are in good or excellent condition.These beliefs pose a challenge for policymakers: because most residents do not perceive a problem with the current state of roads and erroneously believe funding is not declining, they also may not see a problem with transportation funding. Residents may therefore view any attempts to raise additional transportation funding with concern.
Additionally, most Delaware and Pennsylvania residents have a limited understanding of how transportation funding works. As shown in Figure 5-2, in Delaware, 58% of residents surveyed were either not aware of the fuel tax or were unable to provide an estimate as to the fuel tax amount per gallon of fuel. Similarly, 41% of Pennsylvania residents were unaware of the fuel tax rate or unable to venture a guess. These low awareness numbers align with survey work done around the country and are likely due to the fact that, in the current fuel tax system, the fuel tax is lumped with the total purchase cost of a filling a tank.
The 2019 Passenger Vehicle Pilot, surveys, and focus groups led the Coalition to five key findings: 1. Pilots help close the
knowledge gap.2. Change is hard.3. MBUF transforms drivers
into customers.4. “Pay for what you use”
resonates, but it’s complicated.
5. Pilots provide useful information for rate-setting policies.
Figure 5-1 : DE and PA Statewide Survey Results on Perceptions of Road Conditions and Funding
Perception of Road Condition
66%Total
8%Excellent
58%Total
Participate
Perception of Road Funding
Staying thesame
Decreasing
Don’t Know
39%
35% 74%
13%
13%

THE EASTERN TRANSPORTATION COALITION
20
5.1.2 Increased Understanding of Transportation FundingAll pilot participants received a monthly statement that provided fuel costs separated from federal and state fuel taxes, as well as the estimated MBUF for that month. These pilot statements provided participants with a better understanding of the cost of transportation and how much they pay in fuel taxes.
As shown in Figure 5-3, most participants did not know how much they paid prior to the pilot, or believed they paid more or less than they actually did. When participants were asked if they became more aware of the amount they pay in state and federal fuel taxes as a result of the pilot, 69% responded that they agreed or strongly agreed with this change in awareness.In the focus groups, some participants suggested enhancing the statement by providing comparison information, similar to the data many utilities provide on monthly statements. Information might include monthly change over time and comparisons with other vehicles that were either more fuel efficient or less fuel efficient. When it came to satisfaction with the ability of the monthly statement to provide helpful information about how transportation is funded, focus group responses were far more mixed. Responses ranged from “very well” (9%) and “somewhat well” (27%) to “not too well” (21%) and “not well at all” (9%), with the remainder being uncertain (34%). This may be because the invoice did not explicitly state that the listed taxes or fees were the primary sources of transportation revenue. These focus group discussions provide yet another example of the need to explain how transportation is funded in our country.
Figure 5-2: DE and PA Awareness of Fuel Tax per Gallon
14%11%
28%
47%
I thought I paid more
I thought I paid less
That’s what I thought it would be
I did not know
50
45
40
30
35
25
20
15
5
10
0
7%4
Figure 5-3: Participant Awareness of Simulated Monthly Payments
No Estimate
Delaware
How much per gallon goes toward the gas tax?Baseline Survey
Not Aware
None 1%
26%
31%No Estimate
Pennsylvania
Not Aware
None 1%
15%
25%
After seeing your simulated monthly statement(s) from the Pilot, did you think:

THE EASTERN TRANSPORTATION COALITION
21
5.1.3 Increased Understanding of MBUF ConceptThe statewide surveys indicated that most residents in Delaware and Pennsylvania—76%—were generally unfamiliar with the MBUF concept (see Figure 5-4).
As this was the first pilot along the Eastern Seaboard involving volunteers from the driving public, the participant survey included a question asking participants why they signed up for the pilot. Major reasons for participation included a desire to share opinions on funding with policymakers, to learn more about how transportation is funded, and to understand how much is paid in fuel taxes (see Figure 5-5).
Focus group participants were also asked to share their motives for participation. The top three motives in all cases were similar: curiosity about transportation funding and MBUF, an interest in how fuel taxes and MBUF might affect their pocketbooks, and a desire to share their data and opinions with policymakers.
“I would like to see a chart, similar to utility bills, [showing] how much I used this month, so I can compare how I have done for the past few months.”
Pennsylvania (Harrisburg) Focus Group Participant
76%Not familiar
20%Not too
55%Not at all
Figure 5-4: Familiarity in DE and PA with the MBUF Concept
“I don’t remember it having total transporta-tion costs or how transportation is funded in Delaware. I don’t remember seeing that.”
Delaware (Dover) Focus Group Participant
Opportunities to share opinions with policy makers
Learning how much I pay in fuel taxes
Understanding how road maintenance andoperations are funded
Opportunity to try value-added amenities available with tracking device
Understanding how pilot will protect privacy and keep data secure
Keeping better track of how many miles I drive
Very motivating Somewhat motivating
46%
37%
35%
25% 28%
27%
28%
22%
22%
24%
21%
30% 76%
65%
62%
53%
46%
43%
Figure 5-5: Motivation for Pilot Participation (Pre-Pilot Survey Results)

THE EASTERN TRANSPORTATION COALITION
22
5.1.4 Address Concerns with MBUFExperiencing firsthand how MBUF works can reduce many concerns about the concept. As shown in Figure 5-6, pilot participants’ concerns about accuracy of fees, accuracy of accrued miles, security, privacy, and time all decreased during the 2019 Pilot.
Participant concerns about privacy and security show a particularly interesting drop after experiencing an MBUF pilot. In pre- and post-pilot surveys, 2019 Pilot participants were asked to rank their concerns about “privacy and security of my personal data” on a 5-point scale, with “1” indicating the respondent was “not at all concerned” and “5” indicating the respondent was “very concerned.” The percentage of participants who ranked “privacy and security of my personal data” as a high concern dropped from 49% in the pre-pilot survey to 20% in the post-pilot survey. Importantly, participants’ reduced privacy concerns may have been related to their feeling that the pilot provided sufficient data privacy and security protections. In focus groups, a majority of participants voiced satisfaction with these protections, with about one-third being “very satisfied” (36%) and others feeling “somewhat satisfied” (24%); a third group “never thought about [the concerns]” (36%) until the focus group itself. Only 3% were “not too satisfied”. The “very satisfied” focus group participants appreciated that they were not required to provide extensive personal data to participate and that they had the option to decline the location capability (the global positioning system option, or GPS). Furthermore, several noted that they experienced no known negative consequences as a result of sharing their data.
Figure 5-6: Participant Concerns with MBUF: Pre- and Post-Pilot
As it relates to potential concerns from your participation in the Pilot Project, please rate how you feel about each of the following from 1 (not at all concerned)
to 5 (very concerned):
Accuracy of fuel tax paid
Accuray of how many miles I drive
Accuracy to how out-of-state mileage is determined
Security and privacy of my personal data
Time needed to manage an MBUF account
0.00 0.50 1.00 1.50 2.00 2.50 3.00 3.50 4.00
Pre-Pilot Survey Post-Pilot Survey
THE EASTERN TRANSPORTATION COALITION
23
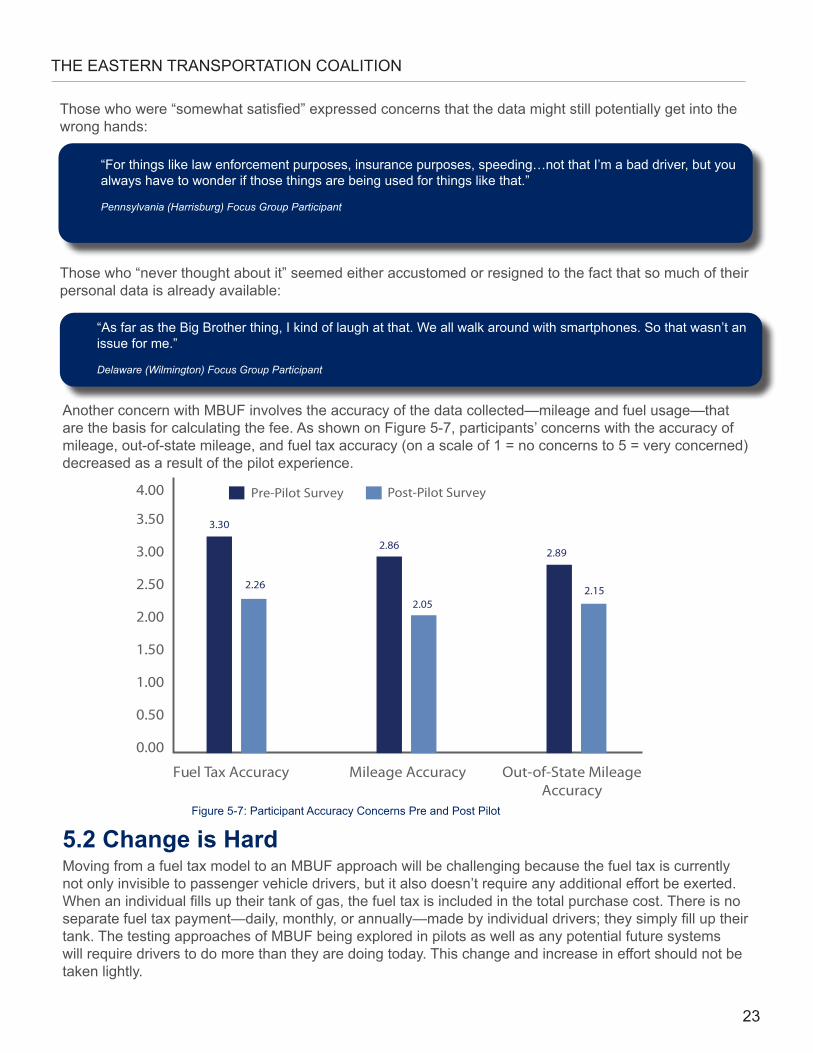
Those who were “somewhat satisfied” expressed concerns that the data might still potentially get into the wrong hands:
Those who “never thought about it” seemed either accustomed or resigned to the fact that so much of their personal data is already available:
“For things like law enforcement purposes, insurance purposes, speeding…not that I’m a bad driver, but you always have to wonder if those things are being used for things like that.”
Pennsylvania (Harrisburg) Focus Group Participant
“As far as the Big Brother thing, I kind of laugh at that. We all walk around with smartphones. So that wasn’t an issue for me.”
Delaware (Wilmington) Focus Group Participant
Another concern with MBUF involves the accuracy of the data collected—mileage and fuel usage—that are the basis for calculating the fee. As shown on Figure 5-7, participants’ concerns with the accuracy of mileage, out-of-state mileage, and fuel tax accuracy (on a scale of 1 = no concerns to 5 = very concerned) decreased as a result of the pilot experience.
5.2 Change is HardMoving from a fuel tax model to an MBUF approach will be challenging because the fuel tax is currently not only invisible to passenger vehicle drivers, but it also doesn’t require any additional effort be exerted. When an individual fills up their tank of gas, the fuel tax is included in the total purchase cost. There is no separate fuel tax payment—daily, monthly, or annually—made by individual drivers; they simply fill up their tank. The testing approaches of MBUF being explored in pilots as well as any potential future systems will require drivers to do more than they are doing today. This change and increase in effort should not be taken lightly.
Figure 5-7: Participant Accuracy Concerns Pre and Post Pilot
Fuel Tax Accuracy Mileage Accuracy Out-of-State MileageAccuracy
3.50
4.00
3.30
2.892.86
2.26 2.152.05
3.00
2.50
2.00
1.50
1.00
0.50
0.00
Pre-Pilot Survey Post-Pilot Survey

THE EASTERN TRANSPORTATION COALITION
24
5.2.1 Lead with ValuesA key to enacting changes to transportation funding is explaining to residents why making the effort to change is worth it. Statewide surveys in Delaware and Pennsylvania concluded that residents view transportation as an important issue, but not necessarily an urgent one. In fact, when asked to name the most important issue in their state, Pennsylvania residents listed taxes (15%) and education (10%) as top priorities; roads and infrastructure were considered a bit lower on the priority list (7%). In Delaware, no single issue stood out as a clear priority, though education, jobs, and crime were top issues (6% each); just 5% of those surveyed mentioned roads as a top priority. These data indicate that policy leaders need to connect quality-of-life benefits to a strong transportation system by emphasizing topics such as the following: • Safe routes to school and work• Access to recreation and beauty of the state• Moving goods/services to support a healthy economy• Access for first responders to save lives• Environmental impactsIt is crucial that policy leaders connect the dots for residents and lead with values-driven messaging to highlight the urgency and importance of transportation. Residents are overwhelmingly positive about where they live—over 90% in each state say it is a good or excellent place to live—and want to maintain their quality of life.In addition, policy leaders should move away from beginning public conversations about transportation funding with topics like policy, legislation, or funding. These are areas with low awareness and where people have high skepticism of government. Given the gap in awareness, it is tempting to focus strongly on telling the policy story, but this is not necessarily the most effective way to start the conversation.Messaging about the transportation system should incorporate discussions about continued maintenance of current transportation systems and transit. Residents expect good roads and transit in an effective transportation system. Maintenance of existing infrastructure is typically a top funding priority, which is true in both partner states (83% in Delaware; 91% in Pennsylvania). Nonetheless, investment in public transportation is a higher priority than building new roads, highways, or bridges (Delaware: 57% transit, 47% new roads; Pennsylvania: 59% transit, 54% new roads). Messaging should therefore avoid focusing only on new roads and bridges. As pilot participants grew more familiar with MBUF, their acceptance of the concept grew. Most focus group participants (85%) considered the sustainability offered by MBUF to be a strong reason to support it. Moreover, after recognizing the central dilemma that growing fuel efficiency means less revenue from fuel taxes, many focus group participants came to appreciate that MBUF could also provide a more sustainable source of transportation revenue.
5.2.2 Using Amenities to Increase Driver InterestProviding valuable additional features to an MBUF system may be helpful in promoting the public’s willingness to change, particularly during the early stages of implementation. The 2019 Passenger Vehicle Pilot offered several value-added amenities to participants, as described in Section 2.4. As shown in Figure 5-8, interest in value-added amenities was fairly high among pilot participants, with higher interest in features that gauged vehicle and battery health, driver scoring, and trip logs. As Figure 5-8 illustrates, interest in these amenities did decline somewhat at the end of the pilot.
“I think that the usage fee is a better way to go. I don’t think fuel usage is a good indicator of the wear and tear that people put on the road.”
Pennsylvania (Pittsburgh) Focus Group Participant

THE EASTERN TRANSPORTATION COALITION
25
In focus groups, a majority of participants were aware of the value-added amenities available during the pilot and chose to use them. Many participants were pleasantly surprised to discover they could receive valuable information about their driving habits from the plug-in device and companion mobile and computer applications. Some participants suggested the amenities and features should be highlighted during the sign-up and enrollment process, with more details about the information that could be gleaned from the value-added amenities.When asked to identify the one value-added amenity that was most useful, visual trip logs emerged as the clear favorite. The driving score app was considered the second most useful amenity. Focus group participants who used this app felt that it was a helpful indicator of their driving habits, that it allowed them to compare driving scores among family members, and even that it appealed to their sense of competition and play. A few focus group participants also noted that MBUF might change their driving behavior somewhat regarding safety and cost.MBUF and the associated vehicle data, including the information available from the OBD-II port, might also be used to promote safety. An email the Coalition received from a pilot participant during the pilot is a great example of how the value-added information—particularly the driving score—can help improve driver safety:
“I liked to see what my average speed was when I got to work and the braking stuff. I became more conscious of how I was driving. That can obviously save gas.” Delaware (Dover) Focus Group Participant
“The other features were interesting, and it was a lot of fun to watch how you were driving.”
Pennsylvania (Harrisburg) Focus Group Participant
Please rate how useful you found the following amenities from 1 (not at all interested/useful) to 5 (very interested/useful):
2MyCar Achievements Battery Voltage
Driver Scoring
EnhancedVisual Trip Logs
Safe Zones Trip LogUsefulness
Vehicle Health
3.50
4.00
4.50
5.00
3.00
2.50
2.00
1.50
1.00
0.50
0.00
3.36
1.82
2.95
2.07
4.03
2.89
3.94
3.00 3.11
2.72 2.99
1.78
3.86
3.28
4.17
3.05
Pre-Pilot Survey Post-Pilot Survey
Figure 5-8: Pilot Participant Interest in Value-Added Amenities

THE EASTERN TRANSPORTATION COALITION
26
Usage-based car insurance programs already provide discounts for safer driving habits based on data collected through a plug-in device or smartphone app. While these amenities may not be desired by all drivers, there will be some that see them as a useful attribute of the overall system.
5.2.3 Pilots Show Change Easier than ThoughtThe majority of pilot participants (79%) were either satisfied or very satisfied with the pilot in general.Focus group participants who were highly satisfied with their pilot experience emphasized the ease of use of the provided technology. When asked how policymakers might encourage greater enrollment in pilots, focus group participants suggested that the emphasis should be placed on how easy it is to enroll and to use the technology.
The willingness to shift to an MBUF approach is linked to this positive pilot experience. During the 2019 Pilot, positive opinions about MBUF grew between pre- and post-pilot surveys. In these surveys, participants were asked to rate their approval of MBUF on a 5-point scale, with “1” representing “I don’t like the concept at all” and ”5” indicating “I really like the concept”. Participants’ average approval rating grew from 3.77 to 3.94.
“Number one, it’s painless.”Delaware (Dover) Focus Group Participant
“I would say it potentially helps to solve a problem that we’re going to have in the future. And It’s pretty painless. There is not a whole lot you have to do.” Pennsylvania (Harrisburg) Focus Group Participant
“I had my mom sign up. I love the added benefit of monitoring her driving scores because for a while now I noticed when riding with her she was braking later and harder than necessary. Since installing the device I have been able to show her on the computer I wasn’t making it up, and now she is more aware and she is being more attentive and improving her score. In fact, when the program ends, I will probably invest in our own device just to keep tabs on her skill as she is getting older. She scored fine in everything else and now her braking is improving so not only is this project helping your organization it’s helping my family. I know this is a project to design a system for user fees. If not all drivers, new drivers and drivers who may have issues should be required to have them. Perhaps a State can look into possibly requiring a safety monitor (not loca-tion) for problem drivers as part of a progressive discipline program such as if a driver gets so many points they would need to use the device and if they do and improve we possibly not suspend them vs requiring traffic school.“

THE EASTERN TRANSPORTATION COALITION
27
When the pilot ended, 67% of the participants had a positive opinion (rating of 4 or 5) of MBUF (see Figure 5-9).
Figure 5-9: Post-Pilot Survey Response to Support Implementation of an MBUF System
5.2.4 Advancing Technology Can Help Technology that already exists continues to advance and can be leveraged to provide MBUF data, making a shift to MBUF easier. These technologies include:• In-Vehicle Telematics – A growing number of vehicle makes and models include in-vehicle telematics
that provide a variety of driver services. While the 2019 Pilot did not explore this technology, it is a priority for exploration in future Coalition pilots.
• Value-Added Amenities – Many value-added amenities are available on the market for purchase by drivers, using a device plugged into the OBD-II or some other hardware. Examples include Verizon Hum and Automatic Pro.
• Usage-Based Car Insurance – Several insurance companies provide usage-based insurance where drivers install a plug-in device (similar to those used in MBUF pilots) or some other hardware or device to track mileage and driving behavior.
Among the Pennsylvania and Delaware residents surveyed in February 2019 as part of the statewide surveys, one of the top two arguments for supporting MBUF was that “gas taxes are an out-of-date way to track how much drivers use the roads. Advances in technology give us new options and we should use them.” Focus group participants also saw that MBUF, unlike the fuel tax, would be able to leverage modern technology. Discussions explored the possibility that the technology that supports MBUF might provide opportunities to better allocate fees when driving across state lines, offer tiered rates for vehicles of different fuel economy or weight, provide reduced rates to rural or low-income drivers, and even experiment with congestion pricing.
5.3 MBUF Transforms Drivers into CustomersA shift from the fuel tax to an MBUF collection system will likely require many adaptations on the part of state and federal entities. Instead of collecting the fuel tax at the rack or distributor level, MBUF charges would be paid and collected on the basis of individual vehicles and the number of miles these vehicles accrue on the roadway network. Under this MBUF paradigm, drivers will become paying customers by using the transportation network, much like customers who pay for electricity and other utilities. An MBUF approach adjusts the relationship between the owner (state and federal agencies) and system users (the driving public). As a result, how infrastructure owners approach their system users will change.

THE EASTERN TRANSPORTATION COALITION
28
5.3.1 Customer Service NeedsGiven that an MBUF system will transform users of the transportation network into customers, customer service will become a critical aspect of MBUF operations. This customer service will require a help desk function to assist users with challenges or questions. During the 2019 Pilot, Azuga provided a help desk from the start of enrollment through the off-boarding activities. A phone number and email address were provided for use by pilot participants as part of the customer support operations. A total of 361 inquiries were received by the help desk over the four-month pilot (see Figure 5-10), with the majority related to new customer and enrollment issues or questions. The four main types of issues included:1. Program inquiries/enrollment – general questions about pilot (e.g., How do I install my device? How do
I log in to my account?)2. Tech support (e.g., Device not reporting data, device disconnected from vehicle)3. Exit (e.g., Participant wants to leave program or has totaled or sold vehicle)4. Other (e.g., Billing or reporting issues)
July August September October
42
17
4
0
10
20
30
40
50
60
70
80
73
16
58
69
25
5 4
1714
25
1
9
Technical SupportProgram Inquiries/Enrollment Exit Other
361 totalinquiries over
4 months
As shown on Figure 5-11, approximately 1 in 5 survey respondents contacted the Azuga Help Desk, and those who did were largely satisfied with the support they received. Importantly, customer satisfaction may impact a user’s perception of experiencing MBUF overall.
Figure 5-10: 2019 Pilot Help Desk Inquires by Month

THE EASTERN TRANSPORTATION COALITION
29
Figure 5-11: Survey Respondents Who Used the Azuga Help Desk
No81%
Yes19%
Yes94%
No6%
No10%
Timely Response
Contact Azuga Help Desk?
Useful Response?
Yes90%
5.3.2 Compliance and Enforcement ConsiderationsFor an MBUF model to prove viable, it will be critical to enroll all vehicles subject to an MBUF system, with all mileage being accurately recorded and paid for by the vehicle owner. A number of focus group participants pointed to the enforcement challenges associated with collecting MBUF, noting that receiving a monthly or quarterly bill might prove challenging for those who fail to set aside adequate funds. They also raised concerns about how these funds would eventually be collected and what sort of penalties would be involved.
Data linkages between DMV and account managers will play an important role in compliance and enforcement efforts. For example, the DMV could flag vehicles that have not enrolled in the MBUF system or have not paid the MBUF based on information received from the account managers, placing an automatic vehicle license and title stop on registration. Linkages and information sharing would also need to accommodate changes in vehicle ownership and registration, as well as instances when a vehicle is stolen, abandoned, or destroyed.
5.3.3 Existing Customer ModelsThe concept of treating drivers as customers already exists in the transportation arena. One such transportation agency in every state that already provides such customer service is the DMV. It is anticipated that DMVs will be an important component of any MBUF system, sharing data with the account managers and also supporting compliance and efforts.
“I would want to know how much it is going to cost us to implement the program. We have an infrastructure in place already for taxes, so is the juice worth the squeeze?” Delaware (Wilmington) Focus Group Participant
“How are they going to collect this money? I think [this] is a huge thing that would have to be considered. To hit people with a huge bill every month, every quarter, once a year—and could they even collect it?”
Pennsylvania (Pittsburgh) Focus Group Participant
?

THE EASTERN TRANSPORTATION COALITION
30
Toll facilities offer another viable model since a toll system, like an MBUF system, treats drivers as customers. Tolling account management activities encompass millions of vehicles and billions of dollars annually. Several account management activities are common to both MBUF and a tolling back office, including: • Account setup• Transaction processing (transforming vehicle data into a charge)• Issuing invoices and statements• Receiving payments• Compliance and enforcement• Managing accounts receivables• Supporting audit activities• Providing customer support• Using location data to allocate charge by state/facility The potential synergies between tolling and MBUF—particularly with respect to having a tolling back office that also provides customer services and other account management activities—and the resulting economies of scale need to be further explored as a possible way to reduce administration costs associated with MBUF.
5.4 “Pay for What You Use” Resonates, but It’s ComplicatedThe principle of “pay for what you use” appealed to a basic sense of fairness for those surveyed and also had the added benefit of being simple, comprehensible, and memorable: You use the roads, you pay for them; the more you use them, the more you pay. The idea that drivers should pay for how much they use the roads was both the strongest argument and the primary recommended guiding principle for transportation policymakers. In February 2019 statewide surveys, one of the top two arguments residents indicated for supporting MBUF was, “Each driver pays their fair share based on how much they use the roads and not based on the fuel efficiency of their vehicles” (see Figure 5-12). Moreover, most of the reasons given for supporting MBUF related to the notion of fairness.
Figure 5-12: Reasons to Support Mileage-Based User Fees from Statewide Surveys

THE EASTERN TRANSPORTATION COALITION
31
A majority of focus group participants (88%) also considered perceived fairness a good reason to support MBUF. Furthermore, after recognizing the central dilemma that growing fuel efficiency means less revenue from fuel taxes, many focus group participants came to appreciate that MBUF could provide a more sustainable source of transportation revenue and can also leverage modern technology.Pilot participant surveys also showed the strength of the fairness argument as it relates to MBUF. As shown in Figure 5-13, while participating in the pilot did not significantly change attitudes toward fairness, it did decrease uncertainty and lead to a slightly greater sense of confidence that an MBUF approach was fairer than a fuel tax.
5.4.1 Fairness Is in the Eye of the BeholderWhile the concept of fairness resonates with the public, the conversation gets more complicated as different types of vehicles and road users are brought into the discussion. Statewide surveys identified a perceived lack of fairness and equity with MBUF, with rural drivers and fuel-efficient vehicle drivers being of particular concern (see Figure 5-14). Statewide surveys found that a majority of Pennsylvania and Delaware residents (64%) think MBUF is less fair to rural residents. This concern was also voiced by some focus group participants. However, further discussion seemed to dampen such concerns. Some quickly realized that levying MBUF would make little difference since long-distance drivers currently pay more fuel tax than shorter-distance drivers with similar vehicles, so a shift to MBUF would not make paying for transportation less fair.
Figure 5-14 : Reasons to Oppose Mileage-Based User Fees from Statewide Surveys
Figure 5-13: MBUF Fairness per Pilot Participants
Pre-Pilot Post-Pilot
More fair About the same Less fair Not Sure
MBUF more fair or similar fairness
(after pilot)
83%66%
17%
11%7%

THE EASTERN TRANSPORTATION COALITION
32
Concerns that mileage-based fees would be unfair to rural residents driving long distances may be based on a limited understanding of how the current fuel tax affects such residents. The potential impacts of going from the fuel tax to MBUF on urban and rural residents has been studied in several Western states⁵.1 The overall conclusion from those analyses is that under a single-rate MBUF, with the rate based on the average MPG, rural drivers end up paying less than with the fuel tax, while their urban counterparts will end up paying more compared to the fuel tax. The primary reasons for this outcome include the following:• Rural drivers do not accrue more miles than urban drivers. They tend to make longer trips, but they also
make fewer of them.• Rural drivers tend to have vehicles with lower fuel efficiencies compared to urban drivers. Accordingly,
with a revenue-neutral rate (based on the state or national average), the MBUF is less for rural drivers compared to urban drivers.
Further analysis is needed to determine whether these results and conclusions also apply to the states along the Eastern Seaboard. Drivers of fuel-efficient vehicles were also the object of concern when it comes to fairness and MBUF. Statewide surveys found that a majority of Pennsylvania and Delaware residents (56%) think MBUF is unfair to drivers who buy fuel-efficient vehicles. Though the pilot had no effect on perceptions regarding the impact of MBUF on fuel-efficient vehicles, the pilot did have a significant impact on the perceived impact on less fuel-efficient vehicles (see Figure 5-15). While the total percentage who viewed MBUF as either more fair or the same (77%) remained unchanged about fuel efficient vehicles, the percentage who saw it as more fair to less fuel efficient vehicles nearly doubled (from 24% to 50%).
5 Economic Development Research Group, Inc. (April 2017). “Financial Impacts of Road User Charges on Urban and Rural Households”. Retrieved from: https://www.ebp-us.com/sites/default/files/project/uploads/FINAL-REPORT---Financial-Impacts-of-RUC-on-Urban-and-Rural-Households_Corrected.pdf.
“If you live in a rural area, you need to drive more, so you use more gas. You’re paying more of a gas tax. Same differ-ence if you use the MBUF. If you drive more miles, it’s the same if you’re using more gas.” Delaware (Dover) Focus Group Participant
“It would probably be bad, because if you live someplace where you have to drive 20 miles to get to a grocery store, you’re probably going to end up paying more, although not necessarily…because in theory you would be paying more for gas anyway.” Pennsylvania (Pittsburgh) Focus Group Participant

THE EASTERN TRANSPORTATION COALITION
33
Pre-Pilot Survey Post-Pilot Survey
0
10
20
30
50
40
60
0
10
20
30
40
Not Sure Same Less Fair More Fair Not Sure Same Less Fair More Fair
There are two likely explanations for this shift in attitudes about the impact of MBUF on drivers of less fuel-efficient vehicles, and both relate to different understandings of fairness. The first conception is more personal: the immediate impact of mileage fees on personal finances. Participants with less fuel-efficient vehicles were able to see that the estimated MBUF payment on their invoice would not significantly increase their net costs. The second conception of fairness is more social—how their contribution compares with others. Over the course of the pilot, participants perhaps became more aware of the central challenge and current inequity of transportation funding: that those with fuel-efficient vehicles bear a disproportionately smaller share of the burden of road improvements.Focus group participants also had mixed reactions to the issue of fairness of MBUF for drivers of electric vehicles and other highly fuel-efficient vehicles. Ensuring that everyone pays their fair share, including drivers of electric or fuel-efficient vehicles who pay disproportionately less than drivers who cannot afford more fuel-efficient vehicles, seemed to appeal to a basic sense of fairness among focus group participants. In fact, many focus group participants pointed to what they perceived as the inequity of having drivers of fuel-efficient vehicles pay little or no fuel taxes to support road maintenance. Some focus group participants were concerned that MBUF might disincentivize the purchase of fuel-efficient vehicles and suggested using slightly lower rates for fuel-efficient vehicles. Such a rate would consider road usage while also rewarding users of more fuel-efficient and environmentally friendly vehicles. Focus group participants who used hybrid and electric vehicles understood they would still enjoy the benefit of lower fuel costs with a shift to a mileage-based funding model and that the amount they would pay in fees would increase. As shown in Figure 5-16, even with the application of MBUF to electric vehicles, the owners still end up paying less in fuel plus MBUF costs compared to vehicles with internal combustion engines.
Figure 5-15: Perceived Fairness of MBUF on Vehicles with Different Fuel Efficiencies
“[MBUF] is more fair because everyone pays the exact amount, no matter what type of car they have, no matter what their income is, no matter who they are. It’s the same rate per mile.” Pennsylvania (Harrisburg) Focus Group Participant

THE EASTERN TRANSPORTATION COALITION
34
w/o MBUF with MBUF w/o MBUF with MBUF w/o MBUF with MBUF w/o MBUF with MBUF0
50
100
150
200
250$230.01 $226.01
$156.83 $159.35
$98.58 $105.88
$54.40$69.78
Fuel Only (Per Gallon)
*Assumes 1,230 miles per month / 14,802 miles per year
Federal Gas Tax (Per Gallon)
Delaware State Gas Tax (Per Gallon)
MBUF (Per Mile)
Kilowatt-Hour
15 MPG(2008 Dodge Dakota)
22 MPGNational Average
35 MPG(2019 Honda Civic)
Electric Vehicle(Tesla S60D)
$2.39
$0.184
$0.23
$0.0125
$0.1379
Figure 5-16 : Fuel Tax and MBUF as a Portion of Total Fuel Costs (Based on DE prices)
When discussing such equity concerns, it is important to remember that the fuel tax represents a small portion of the total cost paid at the pump. Still, when thinking about transportation funding, focus group participants wanted to make sure policymakers would somehow continue to incentivize the use of fuel-efficient vehicles.In summary, the concept of fairness resonates with the public. However, conversations that pit groups against each other (rural vs. urban drivers, fuel-efficient cars vs. less fuel-efficient) are not necessarily effective in discussions about transportation funding alternatives. Bring the conversation back to the guiding principle that is most important to the public: it is fair that everyone pays for the roads they use.
5.5 Pilots Provide Useful Information for Rate-Setting PoliciesShould MBUF be adopted as the primary means for transportation funding in the future, the development and approval of the per-mile rates and any subsequent increases (including automatic formulas) will likely be subject to the same focus and controversy as has occurred with proposed changes to fuel taxes. As such, rate-setting options should be explored in MBUF pilots, giving states the opportunity to examine alternative per-mile rate structures and gather information that can help inform future policy decisions.
5.5.1 Administrative Costs Administrative costs are a primary concern when considering the feasibility of implementing an MBUF. Compared to the fuel tax, introducing MBUF presents increased system administrative costs, including compliance and enforcement activities. The points of taxation and associated rules for state fuel taxes vary from state to state. Some states follow
Figure 5-17 : Fuel Distribution Process and Payment of Federal and State Fuel Taxes

THE EASTERN TRANSPORTATION COALITION
35
the federal approach and impose the tax on the removal of fuel from the bulk terminal at the rack, while other states impose the tax at the distributor level (see Figure 5-17). The cost of the state and federal fuel taxes is then passed through to the retailer (e.g., individual gas stations), who then passes the tax on to the consumer as part of the cost of gas. In this manner, the retailer is reimbursed for the pre-payment of the fuel tax as part of the distribution process. To date, nearly all MBUF pilots throughout the country have used a single revenue-neutral rate applied to all passenger vehicles. This revenue-neutral rate is based on the nationwide average MPG and each state’s fuel tax rate such that a vehicle getting the average MPG would pay an MBUF equal to the amount paid for the state fuel taxes. However, such an approach may not actually be “revenue neutral” because administrative and compliance costs are not included. As discussed in Section 2.5, state-specific MBUF rates for the 2019 Pilot were calculated for each Coalition state based on the state’s fuel taxes so as to be “net revenue neutral”—that is, a vehicle getting the national average of 22 MPG would pay an MBUF equal to the amount paid for the state fuel taxes, plus an additional 19% to cover the estimated additional costs associated with MBUF system administration and compliance. The 19% addition was based on the results of a financial analysis prepared for Delaware and Pennsylvania during the 2018 MBUF work. Additional details of the analysis and results are provided in the Coalition’s 2019 Administration and Compliance Issues Tech Memo.For the 2019 Pilot, this net revenue-neutral approach provided valuable insights about potentially addressing MBUF administrative and compliance costs. First, the impact on the per-mile rate was negligible. In Delaware, the difference between the MBUF per-mile rate that included the administrative and compliance cost and the rate that did not include this cost was one-fifth of a penny, while in Pennsylvania the difference was around a half a penny. However, from the pilot participant perspective, the net revenue-neutral rate increased, on average, MBUF monthly payments. As noted in Section 2.2.6, about 70% of the increased average monthly payments can be linked to the additional administrative and compliance costs. Because the inclusion of administrative and compliance costs was done as a percentage of the state-specific rates, the actual dollar amount varied by state, as does each state’s fuel tax. It is envisioned that the MBUF administrative and compliance costs would be more consistent between states, varying mostly on the number of vehicles in the MBUF program.Finally, in reviewing the pilot results with the MBUF account manager and partner agencies, there was a general agreement that the 19% may be the correct starting point for a small pilot, but that a lower percentage was more realistic for a larger system (e.g., of over 1 million vehicles). The cost of administering and enforcing MBUF should fall over time as systems become more efficient and cost saving approaches are adapted. Overall, it was important to set a rate including the additional administrative costs to push the conversation forward.
5.5.2 Synergies Between Tolling and MBUFOn the Eastern Seaboard, tolls are an important source of transportation revenue. The approximately 3,000 miles of toll facilities along the Eastern Seaboard carry significant amounts of passenger car and commercial vehicle traffic, and all but a few states in the Coalition have toll facilities, as shown in Figure 5-18. Moreover, in some states, the tolls collected are used for transportation funding beyond the boundaries of the toll facilities themselves. For example, Delaware tolls are managed by the DOT with all toll road revenues going into the DOT’s transportation trust (along with fuel tax revenues and vehicle registration and documentation fees). The toll revenues represent over a third of the trust fund revenues⁶.2 In addition, Pennsylvania Turnpike tolls also support public transit projects and off-turnpike roads and bridges.It is therefore important that any future application of MBUF along the Eastern Seaboard also addresses
6 Tolls collected along US 301 are an exception. They are used primarily for debt service on the bonds used for the construction of the US 301 extension and operations of the extension.

THE EASTERN TRANSPORTATION COALITION
36
tolling in some manner. A potential additional feature for MBUF in this regard involves using MBUF technologies to also calculate existing tolls. In this approach, MBUF does not necessarily replace toll transponders, but rather provides another payment choice for users—perhaps reducing the number of toll transactions requiring license plate reading, which thereby reduces the associated costs. Such an approach could also result in an integrated invoice for all roadway-related charges, helping to give drivers a clearer picture of the total cost of travel. The Coalition began testing tolling interoperability during the initial 2018 Pilot. This testing was continued and expanded as part of the 2019 Pilot, with a focus on the feasibility of using MBUF technologies (with location capability) to also calculate tolls on existing toll roads using the E-ZPass toll charge structure. Testing included the following tolled routes:• I-95 Barrier Plaza (two-way toll) in
Delaware – Also included in 2018 Pilot• Delaware River Memorial Bridge (one-
“To get a fair representation of the cost in Delaware versus the other states, you have to have [GPS].” Delaware (Dover) Focus Group Participant
“If it could be done universally and there was reciprocation between states, then MBUF would be much better.” Pennsylvania (Harrisburg) Focus Group Participant
way toll entering Delaware) – Also included in 2018 Pilot • Delaware State Route 1 (toll depends on where drivers enter and exit, with two-way barrier tolls at the
beginning and end of the tolled segment.) – Also included in 2018 Pilot • U.S. Route 301 in Delaware (a new toll road where toll depends on where drivers enter and exit, with
two-way barrier toll at the Delaware – Maryland state line)• Pennsylvania Turnpike – Mainline and Northeast Extension The work included identifying the geo-locations (i.e., GPS coordinates) of the toll points along these routes, and then placing a “tolling zone” around each point. A major lesson learned from the 2018 Pilot was the need to use rectangular zones of variable sizes at each site to ensure that a vehicle traveling through a toll (as is often the case at mainline barrier tolls) would be captured during the once-per-second polling rate used for vehicles involved in the tolling POC. Figure 5-19 shows this change for the 2019 Pilot tolling proof of concept for developing toll zones.
Figure 5-18 : Coalition States with Tolls

THE EASTERN TRANSPORTATION COALITION
37
2018 Pilot Approach 2019 Pilot Approach
The project team performed testing of the 2019 tolling interoperability. In general, the accuracy of the MBUF-based tolling (capture and calculated costs relative to E-ZPass statements) was in the vicinity of 90% (up from a 56% level of accuracy during the 2018 Pilot), with most of the errors occurring at just a few toll points. Finally, as discussed in Section 5.3, there may be significant economies of scale resulting in reduced administration and compliance costs from having a tolling back office to also manage MBUF accounts. This concept should be explored in future pilots.
5.5.3 Out-of-State MileageOne of the focus areas of the Coalition’s MBUF work is exploring how out-of-state mileage and cross-state travel would be handled. In statewide surveys, residents voiced a concern that “out of state drivers using our roads may not end up paying to help keep those roads maintained.” Additionally, Delaware focus group participants expressed concerns about pass-through traffic and were especially interested in ways of capturing transportation dollars from out-of-state drivers using their roads. Notably, given the relatively small geographic size of several states along the Eastern Seaboard, determining how to address out-of-state mileage is an important issue for many Coalition members.The 2019 Pilot further verified the importance of differentiating mileage in terms of the individual states where the mileage was accrued. The percentages of out-of-state miles (based on those participants using the plug-in device with location) was as follows:• All participants – 13% • Pennsylvania – 10%• Delaware – 16%The 2018 and 2019 pilots not only demonstrated the importance of integrating out of state mileage in any MBUF system along the Eastern Seaboard, they also showed it is quite feasible to differentiate and report vehicle miles by state using a location-based approach. The 2018 and 2019 pilots also indicated that most participants appeared to be comfortable with a location-based mileage reporting option, with 80% of 2019
Figure 5-19 : MBUF Toll Point Development Approaches

THE EASTERN TRANSPORTATION COALITION
38
participants (mostly the general public) choosing the location option and 84% in 2018. In fact, some 2019 Pilot focus group participants noted that location-based technology—a key optional feature in the pilot—could be used to ensure out-of-state drivers pay their fair share to maintain in-state roads.As discussed in Section 2, the non-location mileage reporting approach accommodated out-of-state mileage by assuming, based on Census data, a specified percentage of mileage to have occurred in the vehicle’s home state, with the remaining percentage of the vehicle’s mileage assumed to have occurred in adjacent states. Data from pilot participants using location-based mileage reporting options could provide a new basis for developing accurate out-of-state mileage distributions on which the non-location per-mile rates could be based.
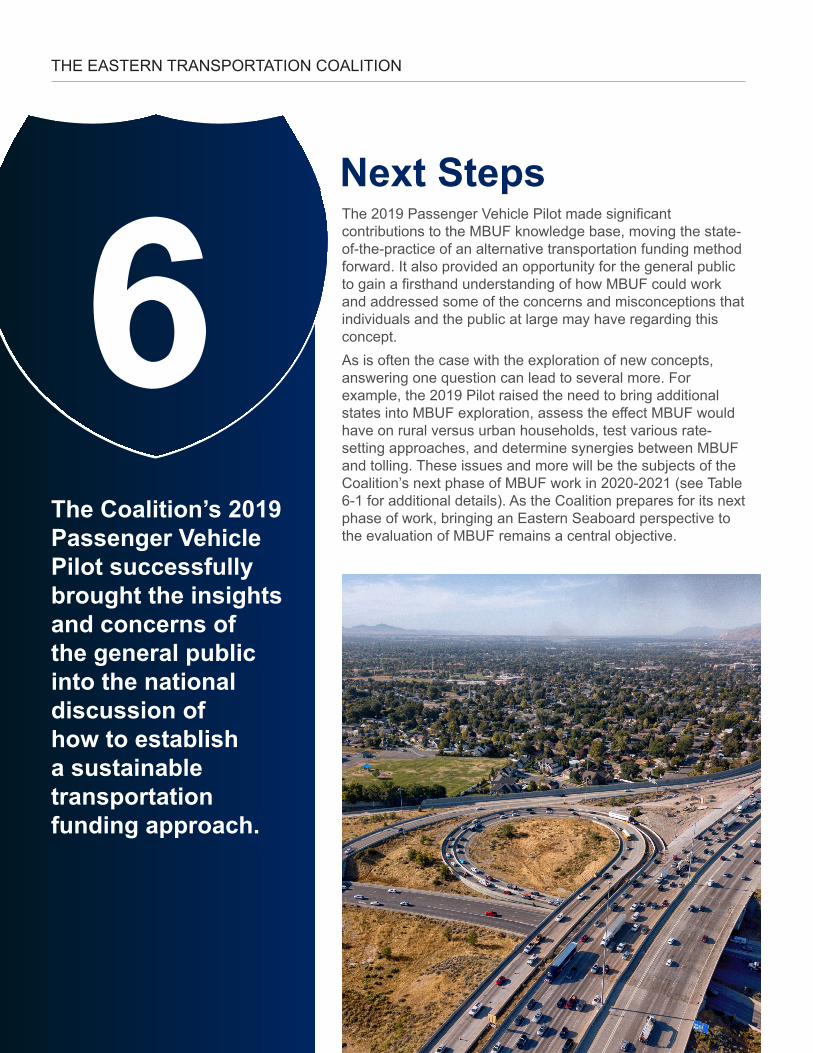
THE EASTERN TRANSPORTATION COALITION
39
Next Steps
6 The 2019 Passenger Vehicle Pilot made significant contributions to the MBUF knowledge base, moving the state-of-the-practice of an alternative transportation funding method forward. It also provided an opportunity for the general public to gain a firsthand understanding of how MBUF could work and addressed some of the concerns and misconceptions that individuals and the public at large may have regarding this concept. As is often the case with the exploration of new concepts, answering one question can lead to several more. For example, the 2019 Pilot raised the need to bring additional states into MBUF exploration, assess the effect MBUF would have on rural versus urban households, test various rate-setting approaches, and determine synergies between MBUF and tolling. These issues and more will be the subjects of the Coalition’s next phase of MBUF work in 2020-2021 (see Table 6-1 for additional details). As the Coalition prepares for its next phase of work, bringing an Eastern Seaboard perspective to the evaluation of MBUF remains a central objective.
The Coalition’s 2019 Passenger Vehicle Pilot successfully brought the insights and concerns of the general public into the national discussion of how to establish a sustainable transportation funding approach.

THE EASTERN TRANSPORTATION COALITION
40
Table 6-1 : Attributes of 2020-2021 Passenger Vehicle Pilot and Other Activities
Pilot Attribute DE PA NC NJ No. VANumber of Vehicles (up to) 50 75 150 100 400
Participant FocusDOT staff,
rural, privacy advocates
DOT staff, rural
DOT staff, key
stakeholders
DOT staff, key
stakeholders
Transurban customers,
key stakeholders
Mileage Reporting Approaches
OBD Plug In (with and w/out GPS) X X X X X
Manual X
Other Pilot Features
Value-Added Amenities X X X X
Synergies Between MBUF and Tolling X X X X X
Tiered Rates X X X X
Location of Fuel Purchases X X X
Congestion Pricing X X
Statewide Surveys X X X X
Urban-Rural Analysis X X X X

THE EASTERN TRANSPORTATION COALITION
41
Louis Neudorff, PEProject ManagerJacobs
DHM ResearchBurns & McDonnell
Jenny Roberts, PEDeputy Project ManagerJacobs
Patricia Hendren, Ph.D.Executive DirectorThe Eastern Transportation Coalition
AuthorsAcknowledgements
Contributors
The Eastern Transportation Coalition is a partnership of 17 states and Washington, D.C. focused on connecting public agencies across modes of travel to increase safety and efficiency.Formerly the I-95 Corridor Coalition, the organization started as an informal group of transportation professionals working together to manage highway incidents that impacted travel across state lines. In the past 25 years the Eastern Transportation Coalition has evolved from a small, highway-focused group to more than 100 public agencies working together to address the pressing challenges facing the eastern corridor with a focus on Transportation Systems Management & Operations, Freight, and Innovation.Today the Coalition represents the world’s second largest economy and nearly 40% of the nation’s GDP. The Eastern Transportation Coalition connects members with the data, people, resources and tools needed to create solutions and get them across the finish line.The Eastern Transportation Coalition brings its members together through virtual workshops, peer-to-peer exchanges, working groups, training, research and demonstration projects. Together we’re better and stronger as we work to support free-flowing and multimodal transportation and accelerate improvements in freight and passenger movement. The Coalition strives to keep its members at the forefront of industry innovation through participation in transformative technology, adoption of best practices, and unique professional development opportunities.
About the Coalition
Project Partners
Azuga
Delaware Department of Transportation
Pennsylvania Department of Transportation