2019 service implementation plan - soundtransit.org20draft_sip... · what’s new in the 2019...
TRANSCRIPT
DRAFT 2019 Service Implementation Plan
October 2018

I | SOUND TRANSIT 2019 SERVICE IMPLEMENTATION PLAN
Table of Contents ............................................................ I List of Tables .................................................................. II List of Figures ............................................................... III Introduction .................................................................. 1 2019 Proposed Service Plan ....................................... 7
ST Express Service Plan ..................................... 9 Proposed Service Changes by Route ................ 11 Link Service Plan ............................................... 25 Sounder Service Plan ....................................... 26 Tacoma Link Service Plan ................................ 27
Service Equity Analysis (Title VI Evaluation) .......... 29 Policies and Definitions ...................................... 29 Evaluation of 2019 Proposed Changes .............. 32 Service Quality Monitoring ................................. 39
Ridership ................................................................... 41 System Overview ............................................... 41 ST Express Ridership ........................................ 43 Sounder South Ridership ................................... 47 Sounder North Ridership ................................... 53 Link Ridership .................................................... 55 Tacoma Link Ridership ...................................... 58 Boardings at Major Transit Facilities .................. 59 Ridership Outlook 2019-2024 ............................ 64
System Performance ................................................ 67 System Overview ............................................... 69 ST Express Performance Monitoring ................. 71 Link Performance Monitoring ............................. 78 Sounder Performance Monitoring ...................... 80 Tacoma Link Performance Monitoring ............... 83
Five Year Service Outlook & Plan ............................. 85 Network Outlook ................................................ 87 Link Planning Outlook ........................................ 89 ST Express Planning Outlook ............................ 91 Sounder Planning Outlook ................................. 92 Tacoma Link Planning Outlook .......................... 93 BRT Planning Outlook ....................................... 94 Northgate Link Extension ................................... 95 East Link Extension ........................................... 97 Downtown Redmond Link Extension ................. 99 Lynnwood Link Extension ................................ 101 Federal Way Link Extension ............................ 103 SR 522/NE 145th BRT ..................................... 105 I-405 BRT......................................................... 107 Service and Fare Equity Analysis Timelines .... 109
Route Profiles ........................................................... 111 How to Read Route Profiles ............................. 111
I-5 North Corridor ............................................. 113 Route 510: Everett – Seattle ....................... 115 Route 511: Lynnwood – Seattle ................... 117 Route 512: Everett – Seattle ........................ 119 Route 513: Everett – Seattle ........................ 123
SR-522 Corridor ............................................... 125 Route 522: Woodinville – Seattle ................. 127
I-405 North Corridor ......................................... 131 Route 532: Everett – Bellevue .................... 133 Route 535: Lynnwood – Bellevue ............... 135
SR-520 Corridor ............................................... 139 Route 540: Kirkland – U. District ................. 141 Route 541: Overlake – U. District ................ 143 Route 542: Redmond – U. District .............. 145 Route 545: Redmond – Seattle .................... 147 Route 555: Northgate – Issaquah ................ 151 Route 556: Issaquah – Northgate ................ 153
I-90 Corridor ..................................................... 155 Route 550: Bellevue – Seattle ...................... 157 Route 554: Issaquah – Seattle ..................... 161
I-405 South Corridor ......................................... 165 Route 560: Westwood Village – Bellevue .... 167 Route 566: Auburn – Overlake .................... 171 Route 567: Kent – Overlake ......................... 173
I-5 South | South King Corridor ........................ 175 Route 574: Lakewood-SeaTac .................... 177 Route 577: Federal Way – Seattle .............. 181 Route 578: Puyallup – Seattle ..................... 185
I-5 South | Pierce County Corridor ................... 189 Route 586: Tacoma – U. District ................. 191 Route 590: Tacoma – Seattle ..................... 193 Route 592: DuPont – Lakewood – Seattle .. 195 Route 594: Lakewood – Seattle .................. 197 Route 595: Gig Harbor – Seattle ................. 201
Sounder Connectors ........................................ 203 Route 580: Lakewood - Puyallup ................ 205 Route 596: Bonney Lake - Sumner ............. 207
Appendix ................................................................... 209
TABLE OF CONTENTS Wayfinding through the document

II
TAB
LE OF C
ON
TENTS
LIST OF TABLES Table 1 ST Express Service Statistics 2017-2019 .............................................................................................................. 8 Table 2 ST Express Service Statistics by Partner 2017-2019 ............................................................................................. 8 Table 3 Link Service Statistics 2017-2019 .......................................................................................................................... 8 Table 4 Sounder Service Statistics 2017-2019 ................................................................................................................... 8 Table 5 Tacoma Link Service Statistics 2017-2019 ............................................................................................................ 8 Table 6 Proposed Major March 2019 Service Changes .................................................................................................... 11 Table 7 Sound Transit Service Area Definitions ................................................................................................................ 31 Table 8 Sound Transit District Populations ....................................................................................................................... 31 Table 9 Title VI Populations of the Route 550 Service ...................................................................................................... 33 Table 10 Title VI Populations of the Montlake Area ............................................................................................................ 34 Table 11 Title VI Populations of the Route 555 Impacted Service Area .............................................................................. 35 Table 12 Title VI Populations of Route 580 ......................................................................................................................... 36 Table 13 Title VI Populations of Route 513 ......................................................................................................................... 37 Table 14 Service Quality by Route ...................................................................................................................................... 38 Table 15 Ridership Growth on Sounder South by Time of Day .......................................................................................... 51 Table 16 Sound Transit System-wide Ridership 2017-2024 .............................................................................................. 64 Table 17 ST Express Boardings 2017-2024 ...................................................................................................................... 65 Table 18 Tacoma Link Boardings 2017-2024 .................................................................................................................... 65 Table 19 Sounder Boardings 2017-2024 ........................................................................................................................... 65 Table 20 Link Boardings 2017-2024 ................................................................................................................................... 65 Table 21 Boardings per Trip by Mode, 2016 vs 2017 ......................................................................................................... 69 Table 22 Boardings per Revenue Hour by Mode, 2016 vs 2017 ......................................................................................... 69 Table 23 Subsidy per Boarding by Mode, 2016 vs 2017 ..................................................................................................... 69 Table 24 Passenger Miles per Platform Mile by Mode, 2016 vs 2017 ................................................................................ 69 Table 25 On-time Performance by Mode, 2016 vs 2017 ..................................................................................................... 70 Table 26 Customer Complaints by Mode, 2016 vs 2017 .................................................................................................... 70 Table 27 Percent of Trips Operated by Mode, 2016 vs 2017 .............................................................................................. 70 Table 28 Productivity Metrics by Route ............................................................................................................................... 72 Table 29 Service Quality Metrics by Route ........................................................................................................................ 74 Table 30 Project Transit Service Levels by Mode ............................................................................................................... 87 Table 31 Link Service Hours and Miles 2017-2024 ............................................................................................................. 90 Table 32 ST Express Service Hours and Miles 2017-2024 ................................................................................................. 91 Table 33 Sounder Service Hours and Miles 2017-2024 ...................................................................................................... 92 Table 34 Tacoma Link Service Hours and Miles 2017-2024 ............................................................................................... 93 Table 35 ST Express Platform Hours Changes with Northgate Link .................................................................................. 95 Table 36 ST Express Platform Hours Changes with East Link ........................................................................................... 97 Table 37 ST Express Platform Hours Changes with Downtown Redmond Link ................................................................. 99 Table 38 ST Express Platform Hours Changes with Lynnwood Link ................................................................................ 101 Table 39 ST Express Platform Hours Changes with Federal Way Link ............................................................................ 103 Table 40 ST Express Platform Hours Changes with SR 522 BRT .................................................................................... 105 Table 41 ST Express Platform Hours Changes with I-405 BRT ........................................................................................ 107 Table 42 Sound Transit Service and Fare Equity Timelines ............................................................................................ 109

III | SOUND TRANSIT 2019 SERVICE IMPLEMENTATION PLAN
LIST OF FIGURES Figure 1 Actual and Estimated System-wide Ridership, 1999 – 201\8 ............................................................................... 3 Figure 2 Existing Sound Transit System Map .................................................................................................................... 4 Figure 3 Projected Ridership with ST2 and ST3 Extensions .............................................................................................. 5 Figure 4 Approved Sound Transit Projects System Map ................................................................................................... 6 Figure 5 ST Express 2017-2019 Service Statistics .......................................................................................................... 10 Figure 6 Summary of I-5 North ST Express Corridor Changes ........................................................................................ 12 Figure 7 Summary of SR 522 ST Express Corridor Changes ......................................................................................... 13 Figure 8 Summary of I-405 North ST Express Corridor Changes ................................................................................... 14 Figure 9 Summary of SR 520 ST Express Corridor Changes ......................................................................................... 15 Figure 10 Summary of I-90 ST Express Corridor Changes ............................................................................................... 16 Figure 11 Summary of I-405 South ST Express Corridor Changes .................................................................................. 17 Figure 12 Summary of I-5 South and Sounder Connector ST Express Corridor Changes ............................................... 18 Figure 13 New Route 550 Pathway in Downtown Seattle .................................................................................................. 19 Figure 14 Proposed Downtown Pathways in March 2019 .................................................................................................. 20 Figure 15 Link 2017-2019 Service Statistics ..................................................................................................................... 25 Figure 16 Sounder 2017-2019 Service Statistics .............................................................................................................. 26 Figure 17 Tacoma Link 2017-2019 Service Statistics ....................................................................................................... 27 Figure 18 ST Express Bus Service Low Income Population Map ...................................................................................... 31 Figure 19 ST Express Bus Service Minority Population Map ............................................................................................. 31 Figure 20 New Route 550 Pathway in Downtown Seattle ................................................................................................. 32 Figure 21 Average Weekday ST Express Ridership, 2009 - 2018 ..................................................................................... 43 Figure 22 Average Weekday ST Express Ridership by Hour ............................................................................................. 44 Figure 23 Average Weekend ST Express Ridership by Hour ............................................................................................ 44 Figure 24 Average Weekday ST Express Ridership by Corridor ....................................................................................... 45 Figure 25 Average Weekday ST Express Ridership by Route, 2016-2017 ........................................................................ 46 Figure 26 Average Weekday Sounder South Ridership, 2001-2018 .................................................................................. 47 Figure 27 Sounder South Ridership by Trip ....................................................................................................................... 48 Figure 28 Sounder South Ridership by Station ............................................................................................................. 49-50 Figure 29 Sounder South Peak Direction Travel Patterns.................................................................................................. 51 Figure 30 Transfer Patterns to Sounder South ................................................................................................................. 52 Figure 31 Transfer Patterns from Sounder South .............................................................................................................. 52 Figure 32 Transfer Locations at King Street from Sounder South ...................................................................................... 52 Figure 33 Average Weekday Sounder North Ridership, 2009-2018 .................................................................................. 53 Figure 34 Sounder North Ridership by Trip, 2017-2018 .................................................................................................... 54 Figure 35 Sounder North Station Level Ridership, 2017-2018 ........................................................................................... 54 Figure 36 Average Weekday Link Ridership, 2009-2018 ................................................................................................... 55 Figure 37 Weekday Link Ridership by Time of Day, Spring 2017 to Spring 2018 .............................................................. 56 Figure 38 Saturday Link Ridership by Time of Day, Spring 2017 to Spring 2018 .............................................................. 56 Figure 39 Sunday Link Ridership by Time of Day, Spring 2017 to Spring 2018................................................................. 56 Figure 40 Link Ridership by Station, Spring 2017 to Spring 2018 ...................................................................................... 57 Figure 41 Tacoma Link Ridership by Hour, Spring 2018 ................................................................................................... 58 Figure 42 Average Weekday Tacoma Link Ridership, 2009-2018 ..................................................................................... 58 Figure 43 Boardings in Downtown Seattle ........................................................................................................................ 59 Figure 44 Boardings at Snohomish County Facilities ........................................................................................................ 60 Figure 45 Boardings at East King County Facilities .......................................................................................................... 61 Figure 46 Boardings at South King County Facilities ........................................................................................................ 62 Figure 47 Boardings at Pierce County Facilities ................................................................................................................ 63 Figure 48 Estimated Sound Transit System-wide Ridership 2017-2024 ............................................................................ 64 Figure 49 Categories of Customer Input and Complaints ................................................................................................. 75 Figure 50 Frequency of Late Complaints by Corridor ....................................................................................................... 76

IV
TAB
LE OF C
ON
TENTS
Figure 51 Frequency of Overcrowding Complaints by Corridor ........................................................................................ 76 Figure 52 Frequency of Early Complaints by Corridor ....................................................................................................... 76 Figure 53 ST Express On-time Performance, 2017-2018 .................................................................................................. 77 Figure 54 Example of Actual ST Express Service Performance compared to Scheduled Service..................................... 77 Figure 55 Link On-time Performance, 2017-2018 .............................................................................................................. 78 Figure 56 Maximum Car Loads on Individual Link Trips by Hour of Day, Northbound (July 2018) ................................... 79 Figure 57 Maximum Car Loads on Individual Link Trips by Hour of Day, Southbound (July 2018) ................................... 79 Figure 58 Sounder On-time Performance, 2017-2018 ....................................................................................................... 83 Figure 59 Average Northbound Maximum Car Loads on Individual Sounder South Cars by Trip (Spring 2018) .............. 81 Figure 60 Average Southbound Maximum Car Loads on Individual Sounder South Cars by Trip (Spring 2018) ............. 82 Figure 61 Tacoma Link On-time Performance, 2017-2018 ................................................................................................ 83 Figure 62 Tacoma Link Average Loads, Spring 2018 ........................................................................................................ 83 Figure 63 Conceptual 2025 Sound Transit Service Network.............................................................................................. 88 Figure 64 Conceptual ST Express Service Changes with Northgate Link Extension ......................................................... 96 Figure 65 Conceptual ST Express Service Changes with East Link Extension ................................................................. 98 Figure 66 Conceptual ST Express Service Changes with Downtown Redmond Link Extension ..................................... 100 Figure 67 Conceptual ST Express Service Changes with Lynnwood Link Extension ...................................................... 102 Figure 68 Conceptual ST Express Service Changes with Federal Way Link Extension .................................................. 104 Figure 69 Conceptual ST Express Service Changes with SR 522 / NE 145th BRT ........................................................ 106 Figure 70 Conceptual ST Express Service Changes with I-405 BRT .............................................................................. 108

1 | SOUND TRANSIT 2019 SERVICE IMPLEMENTATION PLAN
DRAFT
BACKGROUND
Each year, Sound Transit prepares a Service Implementation Plan that guides delivery of ST Express bus, Sounder commuter rail, and Link light rail services. In coordination with the annual agency budget process, the Service Implementation Plan provides both a forward look at future service plans and a review of existing ridership and performance trends.
What’s new in the 2019 Service Implementation Plan document?
This year’s edition of the Service Implementation Plan refreshes the document with an easier to read two-column layout and consolidates ancillary tables and charts which were previously throughout the document into a single section in the appendix. Additionally, service changes are presented for March 2019 only. More information about potential service changes for September 2019 will be presented in early 2019.
Contents
2019 Service Plan
This section identifies changes proposed to Sound Transit services in 2019, including context of why changes were proposed as well as key themes that will guide service strategies for the next several years. This section also summarizes resources required to operate all lines of service.
Service Equity Analysis
This section evaluates the 2019 Service Plan proposals to ensure that changes to transit service are consistent with Title VI policies.
Ridership
This section summarizes ridership numbers by mode, route and corridor as well as looks at projected ridership for 2019 as a result of the service changes described in the 2019 Service Plan.
System Performance
This section describes the different performance measures as defined in Sound Transit’s Service Standards and evaluates existing services to help inform why certain service changes are proposed in the 2019 Service Plan.
Five-Year Service Outlook and Plan
This section discusses upcoming Sound Transit extensions and a scenario in which ST Express bus service may change as a result. These service assumptions will be refined closer to each extension’s opening date.
The ST Network (Route Profiles)
Route profiles highlight the performance of ST Express routes in relation to each other and provide context for service planners to identify potential changes in upcoming years. This year’s revamped route profiles have an increased emphasis on the passenger experience by evaluating frequency, service time span, loading, and on-time performance of each route.
INTRODUCTION What is the Service Implementation Plan?

2
INTR
OD
UC
TION
DRAFT
MANAGING THE TRANSIT NETWORK
Service Standards
Since 1998, Sound Transit has used its Board-adopted Service Standards and Performance Measures to plan, monitor and manage Sound Transit services. This document:
Describes how Sound Transit service should be designed to reflect the characteristics of a high-speed, limited-stop regional system.
Sets guidelines used to design, evaluate and manage transit service with the objective of maximizing efficiency, effectiveness, and service quality in the system.
Guides a multi-step process to identify the level and type of service that should be provided, as well as a process to implement any changes needed to meet established priorities.
Service Changes
Development – Sound Transit manages the transit network through service changes. Service changes may be developed out of four key processes:
– Performance Monitoring – Identify services that do not meet service standards and evaluate options for improving performance as well as identify opportunities to meet demand for services that are performing well.
– Voter approved plans – Completion of major high-capacity transit capital projects may result in modifying existing service to maximize network connectivity.
– Budget – In coordination with voter approved plans, defines the limits to how much service Sound Transit is able to provide.
– Regional coordination with partner agencies – Work with partner agencies to restructure service or to better facilitate transfers between local and regional service.
Title VI Evaluation – Determine if potential adverse effects of service changes create an unfair burden on typically underrepresented communities.
Board Approval – Major service changes are approved by the board as part of this document and the budget.
Implementation – Service changes are made in March and September of each year.
Public Process and Board Approval
Each year the Service Implementation Plan is released publicly before a presentation to the Operations and Administration Committee of the Board of Directors. In years with proposed major service changes, the public is given the opportunity to comment on any major service changes at open-house style meetings held in areas most directly affected by the proposed service changes. Prior to presentation to the Board of Directors, a public hearing is held allowing opportunities for comment on any major service changes. Customers and members of the public are encouraged to comment on the draft plan through email, letter, telephone, or in-person at a public meeting.
For more information:
soundtransit.org/sip
1-866-940-4387

3 | SOUND TRANSIT 2019 SERVICE IMPLEMENTATION PLAN
DRAFT
ST Express
ST Express bus offers fast, frequent, two-way service on 28 routes connecting Snohomish, King, and Pierce Counties. Sound Transit provides this bus service via service agreements with our transit partners: King County Metro, Pierce Transit, and Community Transit. ST Express provides service to over 50 transit centers and park-and-ride lots.
Sounder
Sounder commuter rail spans three counties, serving commuters on the north line from Everett to Seattle and on the south line from Lakewood to Seattle. Sound Transit owns the railway between Lakewood and Tacoma, and Burlington Northern Santa Fe Railway, owner of the railroad between Tacoma and Everett, operates Sounder service under a contract with Sound Transit. Amtrak provides maintenance for the Sounder fleet of locomotives and passenger cars.
Tacoma Link
Tacoma Link light rail is a 1.6-mile light rail passenger line that runs through the heart of downtown Tacoma. There are six unique stations complete with artwork that reflects the history and community of Tacoma. Trains run every 12 minutes during the day on weekdays and Saturdays, and every 24 minutes weekday evenings and Sundays.
Link
Link light rail operates on over 20 miles of alignment between the University of Washington Station in the City of Seattle and Angle Lake Station in the City of SeaTac, serving 16 passenger stations, including four stations in the Downtown Seattle Transit Tunnel (DSTT). King County Metro operates and maintains the system through an intergovernmental agreement with oversight by agency staff. Paratransit service is also operated by King County Metro within the Link service area.
05
101520253035404550
1999 2000 2001 2002 2003 2004 2005 2006 2007 2008 2009 2010 2011 2012 2013 2014 2015 2016 2017 2018E
Boar
dings
(Milli
ons)
Sound Transit current service
Estimated
Figure 1: Actual and Estimated System-wide Ridership, 1999-2018
4
INTR
OD
UC
TION
DRAFT
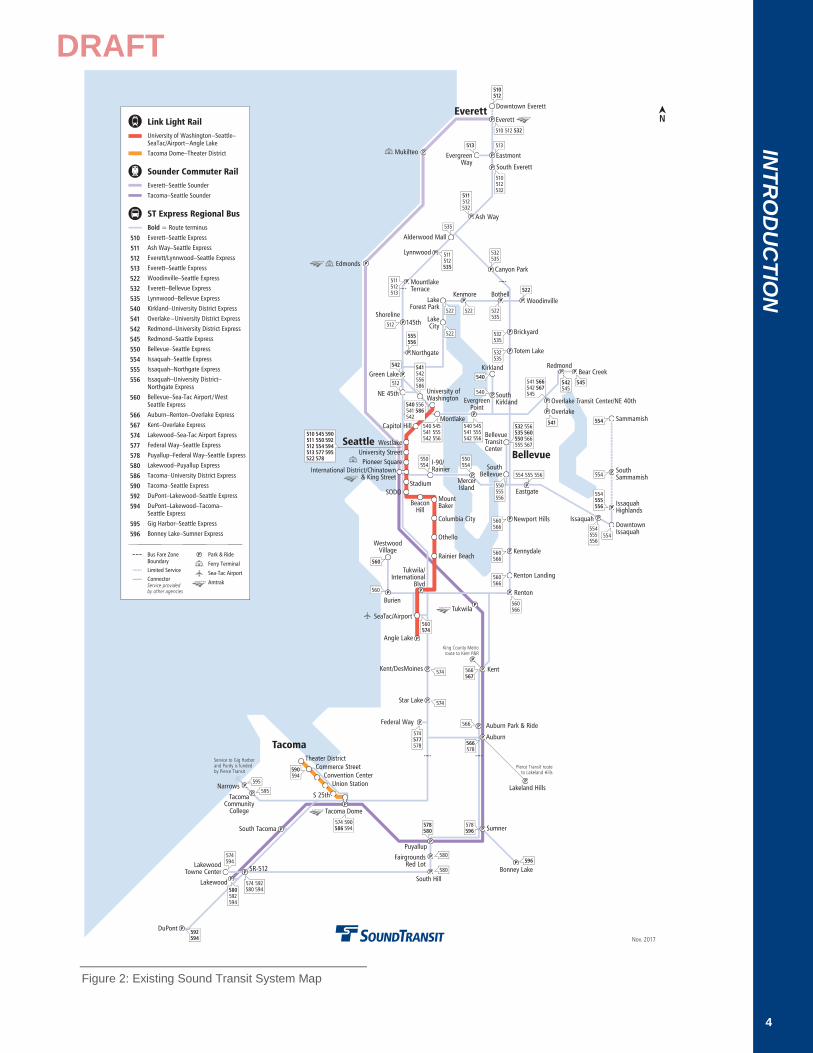
Figure 2: Existing Sound Transit System Map

5 | SOUND TRANSIT 2019 SERVICE IMPLEMENTATION PLAN
DRAFT
SYSTEM EXPANSION
In 1996, voters in Central Puget Sound approved the Sound Move plan with a mandate to build a mass transit system connecting major urban centers in Snohomish, King, and Pierce counties. Covering more than 1,000 square miles, the Sound Transit District serves a population of over 3 million people. The Sound Transit District is composed of 40 cities, including most of the urban areas of King, Pierce, and Snohomish counties. Voters approved a second phase of mass transit, Sound Transit 2 (ST2), in 2008 and a third phase of mass transit expansion, Sound Transit 3 (ST3), in 2016. Under the plans, the regional light rail system will reach over 50 miles by 2024 expanding to Lynnwood, Bellevue, Overlake, and Federal Way and over 110 miles by 2041 with expansions to Everett, Issaquah, Kirkland, West Seattle, Ballard, and Tacoma. The Sounder commuter rail line will expand to DuPont, and have frequent peak service between Seattle and Lakewood, and ST Express will continue to serve major regional travel corridors. New BRT lines will also serve SR 522 and I-405. Figure 3 shows the existing Sound Transit system ridership and projectedsystem ridership after the completion of approved ST2 and ST3 projects.
Sound Transit future service
Figure 3: Projected Ridership with ST2 and ST3 extensions
-
20
40
60
80
100
120
140
160
180
200
2017 2040
Milli
ons
Projected Ridership with ST2 and ST3 extensions
ST Express BRT Sounder Link

6
INTR
OD
UC
TION
DRAFT
Figure 4: Approved Sound Transit Projects System Map
7 | SOUND TRANSIT 2019 SERVICE IMPLEMENTATION PLAN
DRAFT
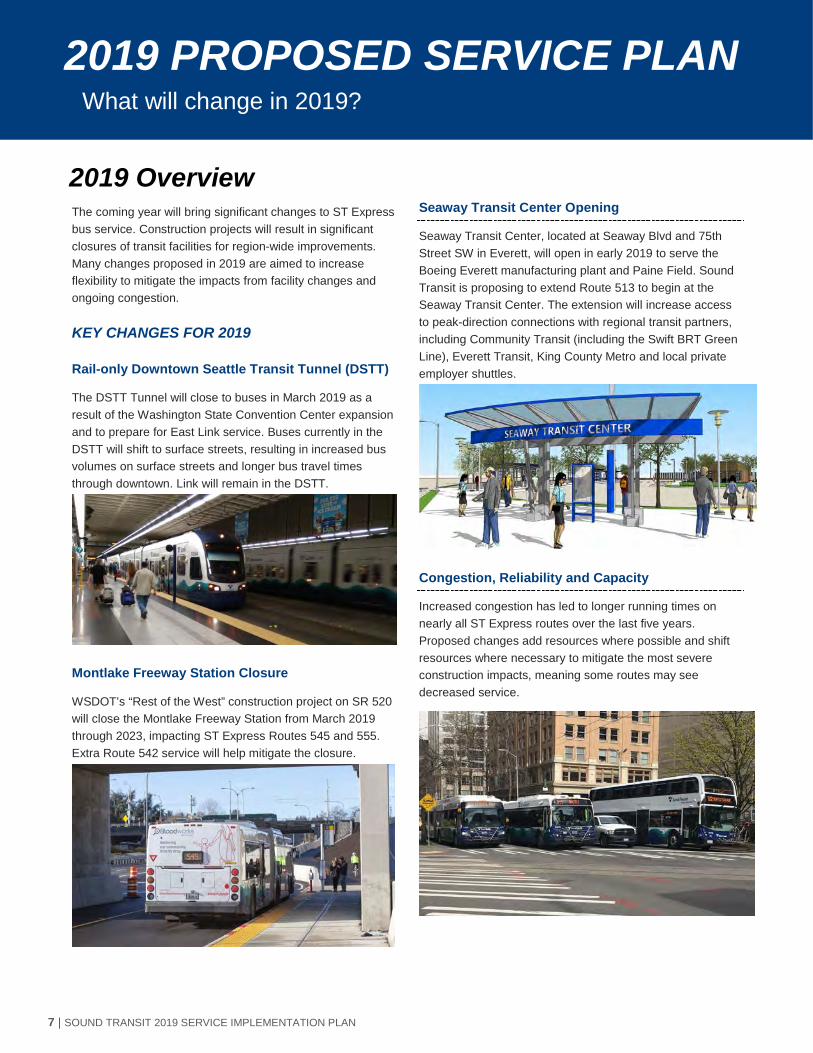
The coming year will bring significant changes to ST Express bus service. Construction projects will result in significant closures of transit facilities for region-wide improvements. Many changes proposed in 2019 are aimed to increase flexibility to mitigate the impacts from facility changes and ongoing congestion.
KEY CHANGES FOR 2019
Rail-only Downtown Seattle Transit Tunnel (DSTT)
The DSTT Tunnel will close to buses in March 2019 as a result of the Washington State Convention Center expansion and to prepare for East Link service. Buses currently in the DSTT will shift to surface streets, resulting in increased bus volumes on surface streets and longer bus travel times through downtown. Link will remain in the DSTT.
Montlake Freeway Station Closure
WSDOT’s “Rest of the West” construction project on SR 520 will close the Montlake Freeway Station from March 2019 through 2023, impacting ST Express Routes 545 and 555. Extra Route 542 service will help mitigate the closure.
Seaway Transit Center Opening
Seaway Transit Center, located at Seaway Blvd and 75th Street SW in Everett, will open in early 2019 to serve the Boeing Everett manufacturing plant and Paine Field. Sound Transit is proposing to extend Route 513 to begin at the Seaway Transit Center. The extension will increase access to peak-direction connections with regional transit partners, including Community Transit (including the Swift BRT Green Line), Everett Transit, King County Metro and local private employer shuttles.
Congestion, Reliability and Capacity
Increased congestion has led to longer running times on nearly all ST Express routes over the last five years. Proposed changes add resources where possible and shift resources where necessary to mitigate the most severe construction impacts, meaning some routes may see decreased service.
2019 PROPOSED SERVICE PLAN What will change in 2019?
2019 Overview

8
2019 SERVIC
E PLAN
DRAFT
SERVICE HOURS AND VEHICLES NEEDED
ST Express
This section describes several major service changes proposed for March 2019. September 2019 changes will be presented in early 2019. Increases in hours reflect investments in service and reliability due to construction impacts and congestion. Due to existing fleet constraints, added hours are not on pace with investments in years past.
By Partner
Routes operated by King County Metro will see major changes, where hours are proposed for investment during the midday, evenings and weekends as part of mitigation measures for the SR 520 Montlake Freeway Station closure. Community Transit and Pierce Transit will experience slight decreases in platform hours, which reflect differences on which day of the week holidays fall.
Link
There are no major changes proposed in 2019. As a result, train platform hours and miles are not expected to change significantly. Differences between 2018 and 2019 reflect differences on which day of the week holidays fall.
YEAR PLATFORM HOURS
PLATFORM MILES
PEAK TRAIN COUNT
2017 Actual 101,846 1,974,346 19 2018 Estimated 101,614 1,969,850 19 2019 Estimated 101,200 1,962,400 19
Sounder
There are no major changes proposed in 2019. As a result, train platform hours and miles are not expected to change significantly. Differences between 2018 and 2019 reflect differences on which day of the week holidays fall.
YEAR PLATFORM HOURS
PLATFORM MILES
PEAK TRAIN COUNT
2017 Actual 12,075 340,503 11 2018 Estimated 13,134 372,222 11 2019 Estimated 13,200 372,300 11
Tacoma Link
There are no major changes proposed in 2019. As a result, train platform hours and miles are not expected to change significantly. Note that these estimates do not take into account potential reduced service due to Hilltop Tacoma Link Extension construction impacts.
YEAR PLATFORM HOURS
PLATFORM MILES
PEAK TRAIN COUNT
2017 Actual 9,905 76,262 2 2018 Estimated 9,800 75,800 2 2019 Estimated 9,800 75,800 2
YEAR PLATFORM HOURS
PLATFORM MILES
PEAK VEHICLE COUNT
2017 Actual 780,901 16,298,931 256 2018 Estimated 790,772 16,428,796 258 2019 Estimated 819,722 16,883,534 270*
YEAR PLATFORM
HOURS PLATFORM MILES
PEAK VEHICLE COUNT
Comm
unity
Tr
ansit
2017 Actual 150,016 3,437,098 50
2018 Estimate 146,352 3,460,460 50
2019 Estimate 153,174 3,481,194 54*
YEAR PLATFORM
HOURS PLATFORM MILES
PEAK VEHICLE COUNT
King
Cou
nty
Metro
2017 Actual 294,058 4,829,780 101
2018 Estimate 300,350 4,803,099 102
2019 Estimate 310,765 5,190,377 102
YEAR PLATFORM
HOURS PLATFORM MILES
PEAK VEHICLE COUNT
Pier
ce
Tran
sit 2017 Actual 336,827 8,032,053 105
2018 Estimate 344,070 8,165,238 106
2019 Estimate 351,283 8,118,228 118*
* Total reflects a fleet expansion of 14 total vehicles (for an additional peak pull of 12 vehicles) by September 2019. Community Transit Peak Vehicle Count adds reflects interim conditions between March and September 2019. Pierce Transit reflects final September 2019 conditions
Table 1: ST Express Service Statistics 2017-2019
Table 3: Link Service Statistics 2017-2019
Table 4: Sounder Service Statistics 2017-2019
Table 5: Tacoma Link Service Statistics 2017-2019
Table 2: ST Express Service Statistics 2017-2019 by Partner

9 | SOUND TRANSIT 2019 SERVICE IMPLEMENTATION PLAN
DRAFT
SERVICE CONTEXT
ST Express currently operates 28 routes throughout the three county service area. Many of these routes serve downtown Seattle, with other routes operating to downtown Bellevue or serving as connectors to Sounder service.
Service changes in the last few years have added hours to address ongoing reliability concerns and regional congestion. This has resulted in an increase of approximately 30,000 annual service hours and an additional 12 buses throughout our system. Modest resources will again be added in March 2019 and September 2019 to absorb impacts on the most affected routes, with some routes shifting providers as a result due to existing bus base capacity constraints. Riders can expect route conditions to worsen as a result of several factors:
Additional bus congestion on downtown Seattle streets as the Downtown Seattle Transit Tunnel transitions to rail-only operations.
Slow moving downtown surface streets during peak periods with critical choke-points continuing to slow transit
Regional growth increasing highway congestion
Construction impacts of both private development and public infrastructure investments, including light rail construction, across the region
Constraints on regional bus base and maintenance capacity, limiting the number of buses available
2019 SERVICE STRATEGY
The 2019 service plan for ST Express aims to minimize the impact of closures and growing congestion on customers to the greatest extent possible. Below are five key themes that guided the proposed service changes.
Respond to Construction Impacts
ST Express service will adapt as a result of construction impacts throughout the region. Route 550 service will move to the surface in downtown Seattle as a result of the DSTT closure, while ridership will shift on ST Express routes along SR 520 as a result of the Montlake Freeway Station closure.
Improve Resource Efficiency
Several changes proposed in this document identify resources from underperforming services to be reallocated throughout the system to address other outstanding issues. These small tweaks to select routes increase the flexibility to respond to ongoing construction impacts and congestion.
Add Buses and Hours
Sound Transit has no additional operating capacity at King County Metro to respond to ongoing construction impacts and reliability concerns. As a result, several routes will change operators to free up capacity to respond. In March 2019, Sound Transit will add an additional 5 buses at Community Transit to respond to DSTT impacts with the movement of Route 540. By September 2019, Sound Transit is preparing to accommodate an another 9 vehicles at Pierce Transit, and shifting the 5 additional buses at Community Transit to Pierce Transit, to maintain existing service levels.
Improve Speed and Reliability
Service changes address as many reliability concerns as possible, sometimes shifting resources from lower-performing to higher-performing service. Even with limited resources, ST Express will make runtime adjustments to best reflect existing and future conditions. Additionally, Sound Transit will continue to work with partner jurisdictions to mitigate existing issues and improve regional mobility.
Service Integration
Our partner agencies complement our service by offering connections to many other regional and local routes. Some of these changes seek to improve integration in order to maximize the effectiveness of regional transit investments.
ST Express service plan

10
2019 SERVIC
E PLAN
DRAFT
DEVELOPMENT OF PROPOSED SERVICE CHANGES
Sound Transit manages the transit network through service changes. Service changes are classified as either minor or major changes. All major service changes include public participation and require approval by the Sound Transit Board of Directors. Any change classified as minor may be made without Board approval, allowing staff to be responsive in addressing minor service quality issues.
Major Service Changes
Major service changes meet one or more of the following criteria and require public outreach and Board approval:
Changes a route’s weekly platform hours by more than 25 percent
Moves the location of a stop by more than ½ mile
Closes a stop without an alternative stop within ½ mile
Minor Service Changes
Minor service changes meet one or more of the following criteria and are implemented administratively:
Changes a route’s weekly platform hours by less than 25 percent
Makes minor adjustments to a schedule
Temporarily closes a stop or adjusts route alignment due to construction
When a proposed service change saves resources, those resources will be reinvested into the same subarea in order to maintain equitable resource distribution.
626,347 617,125 638,013
784,741 795,272 819,722
2017Actual
2018Estimated
2019 Estimated
Revenue Hours Platform Hours
11,985,162 11,844,230 12,140,043
16,344,866 16,522,531 16,883,534
2017Actual
2018Estimated
2019 Estimated
Revenue Miles Platform Miles
18,374,835 18,170,000 17,980,000
2017Actual
2018Estimated
2019 Estimated
REVENUE AND PLATFORM HOURS
REVENUE AND PLATFORM MILES
RIDERSHIP
Figure 5: ST Express 2017-2019 Service Statistics

11 | SOUND TRANSIT 2019 SERVICE IMPLEMENTATION PLAN
DRAFT
The following pages show an overview of proposed service changes by corridor.
2019 PROPOSED SERVICE CHANGES REGIONAL PAGE ROUTE TYPE DESCRIPTION MONTH CORRIDOR
Major Service Changes
23 513 Route Change Routing change and new regional connections March I-5 North 21 550 Route Change Routing and stop changes in downtown Seattle March I-90 22 580 Level of Service Improve efficiency, remove lower performing trips March Sounder Connector 22 545, 555 Stop Closure WSDOT closure of Montlake Flyer Stop March SR 520
Minor Service Changes
24 512 Schedule Change Running time adjustments Seattle - Shoreline March I-5 North 24 512 Stop Closure Stop Change at 145th Street Freeway Station Early 2019 I-5 North 24 541 Schedule Change Add stop pair at 156th & 31st by Overlake Park-and-Ride March SR 520 24 596 Level of Service Discontinue midday trip March Sounder Connector
2019 PROPOSED SERVICE CHANGES REGIONAL OVERVIEW 2019 PROPOSED SERVICE CHANGES REGIONAL OVERVIEW Proposed Service Changes
Table 6: Proposed Major and Minor March 2019 Service Changes

12
2019 SERVIC
E PLAN
DRAFT
Figure 6: Summary of I-5 North ST Express Corridor Changes
Evergreen Way
196th St SW
DRAFT
02.5
51.25
Miles
Deleted 513 routing
New
513 routing
New
512 routing
513
512
510
511 99
NE 145th St
Northbound
NE 145th St
Freeway
Station closes
Seaway Transit Center
(New
stop)Eastm
ont P&R
Evergreen Way &
79th Pl SE (Stop rem
oved)
SEATTLE
EVERETT
MOUNTLAKE
TERRACE
Everett Station
Summ
ary of I-5 N Corridor Changes
March
Route 513 will serve the Seaw
ay Transit Center, o�ering new
regional connections. The segment to
Evergreen Way &
79th Pl SE to be discontinued.
The northbound NE 145th St Freew
ay Station to close due to construction. N
orthbound Route 512 to be rerouted to serve a new
stop on NE 145th St and
5th Ave NE. Southbound routing unchanged.
Route with N
o ChangeRoute w
ith Service ChangeD
iscontinued RoutingN
ew Routing
Deleted 512 routing
New
NB 512
routing
5
5 512
N0.15
0.30.075
Miles
0
NE 145th St
Roosevelt Way N
5th Ave NE
Northbound
NE 145th St
Freeway Station
closes
NE 145th St &
5th Ave N
E (N
ew stop)
15th Ave NE
see inset

12
0.5M
iles0
522
522
DOWNTOW
N SEATTLE
LAKE CITYWEDGW
OOD
KENMORE
LAKE FOREST PARK
SHORELINEBOTHELL
WOODINVILLE
No changes proposed for SR 522
corridor
13 | SOUND TRANSIT 2019 SERVICE IMPLEMENTATION PLAN
DRAFT
Figure 7: Summary of SR 522 ST Express Corridor Changes
196th St SW
NE 124th St
DRAFT
2.55
01.25
Miles
DOWNTOW
N SEATTLE
BOTHELL
KIRKLAND
BELLEVUE
LYNNWOOD
CANYON PARK
EVERETT
532
535
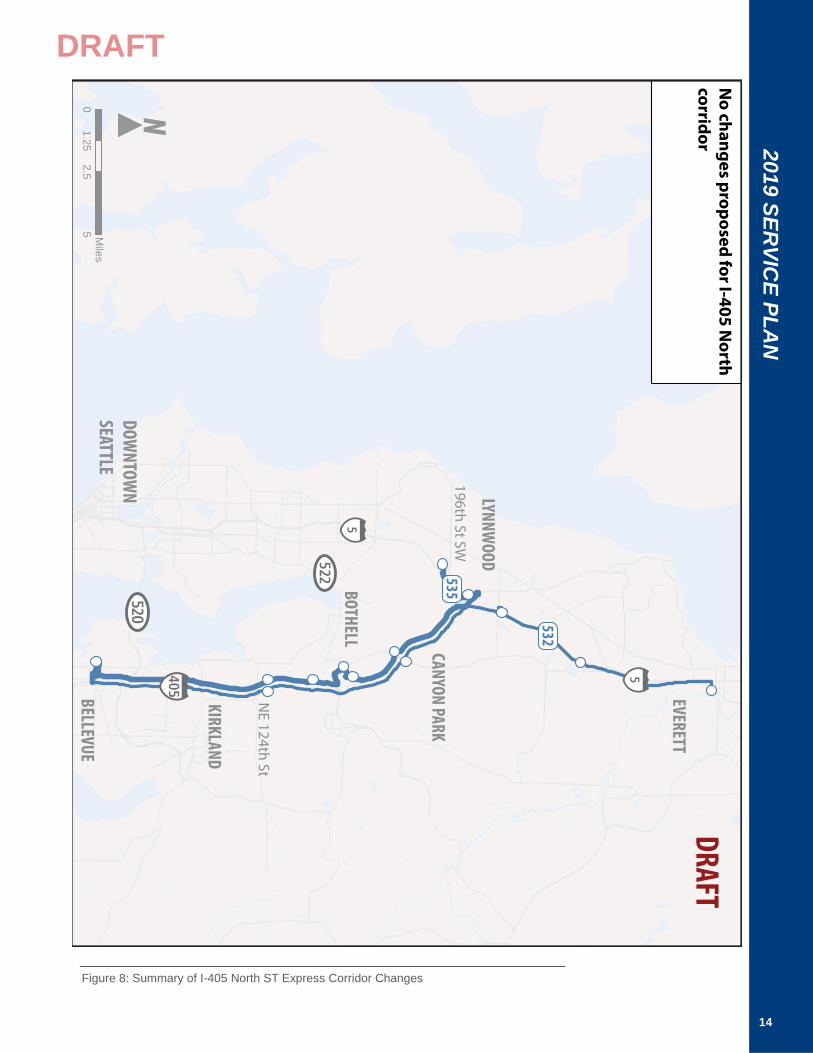
No changes proposed for I-405 N
orth corridor
14
2019 SERVIC
E PLAN
DRAFT
Figure 8: Summary of I-405 North ST Express Corridor Changes
Miles
0.52
1
DRAFT
DOWNTOW
N SEATTLEBELLEVUE
MEDINA
REDMOND
KIRKLAND
NORTH SEATTLE
SOUTH LAKE UNION
555556
556555
545
545
542540
541
555
Bellevue Transit Center
UW
Station
Issaquah Highlands
Park & Ride (Route
555 stop removed)
Eastgate Park & Ride
(Route 555 stop removed)
Richards Road (Route 555 stop rem
oved) Bellevue Way (A
ll Route 555 stops rem
oved)
Issaquah Transit Center (Route 555 stop rem
oved)
ISSAQUAH
Montlake Freew
ay Station Closes
NE 31st St &
156th A
ve NE (N
ew Stop)
Summ
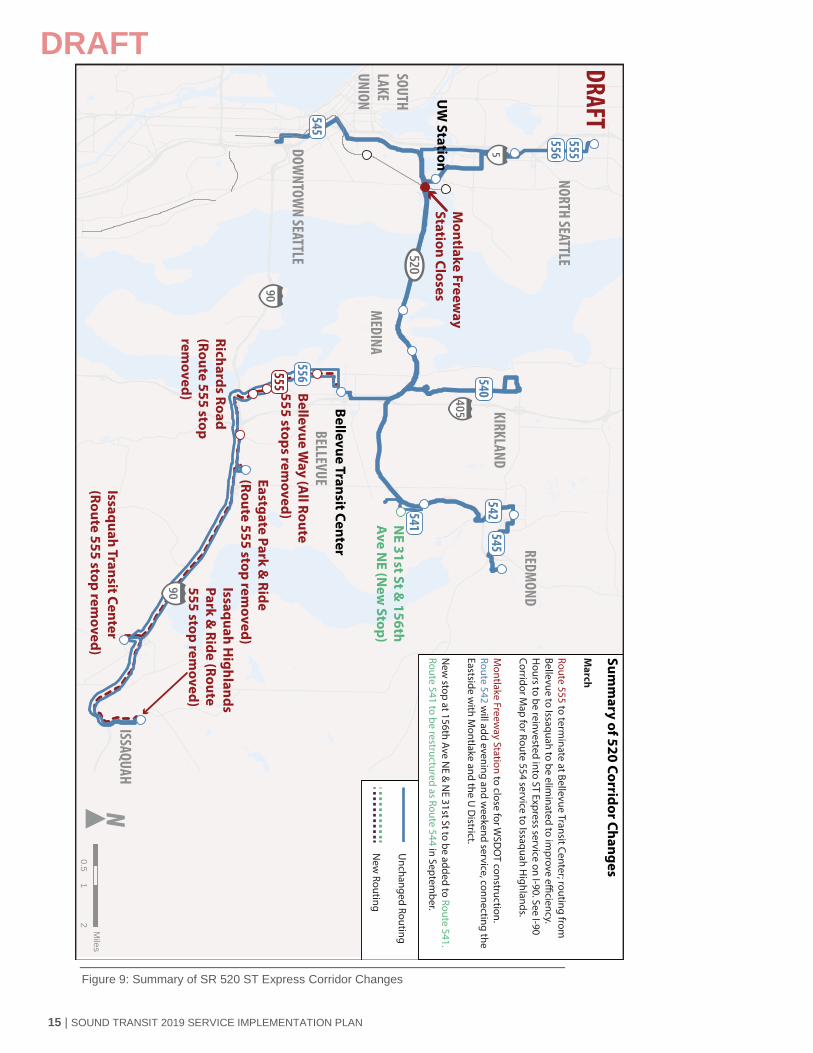
ary of 520 Corridor Changes
March
Route 555 to terminate at Bellevue Transit Center; routing from
Bellevue to Issaquah to be elim
inated to improve e�
ciency. H
ours to be reinvested into ST Express service on I-90. See I-90 Corridor M
ap for Route 554 service to Issaquah Highlands.
Montlake Freew
ay Station to close for WSD
OT construction.
Route 542 will add evening and w
eekend service, connecting the Eastside w
ith Montlake and the U
District.
New
stop at 156th Ave NE &
NE 31st St to be added to Route 541.
Route 541 to be restructured as Route 544 in September.
Unchanged Routing
New
Routing
15 | SOUND TRANSIT 2019 SERVICE IMPLEMENTATION PLAN
DRAFT
Figure 9: Summary of SR 520 ST Express Corridor Changes

12
00.5
Miles
BELLEVUE
MERCER ISLAND
ISSAQUAH
SAMM
AMISH
DOWNTOW
N SEATTLE
5
554
550
New
550 routing
Deleted 550 routing
see inset
Summ
ary of I-90 Corridor Changes M
arch
Route 550 to operate on surface streets in D
owntow
n Seattle due to the conversion of the D
owntow
n Seattle Transit Tunnel to rail-only.
DRAFT
Route with N
o ChangeRoute w
ith Service ChangeD
iscontinued RoutingN
ew Routing
0M
iles0.3
0.15
S Jackson
S Yesler St
Union StPike St
4th Avenue
2nd Avenue
James St
Spring St
N
DOWNTOW
N SEATTLECAPITOL HILL
BELLTOWN
Convention Pl & U
nion St
Deleted routing
New
routing
16
2019 SERVIC
E PLAN
DRAFT
Figure 10: Summary of I-90 ST Express Corridor Changes

DRAFT
2.50
51.25
Miles
BELLEVUE
NEWCASTLE
OVERLAKE
KENT
AUBURN
RENTONBURIEN
WEST SEATTLE
SEATAC
SEATTLE
566
566
567
567
560
167
Auburn Station
Renton Transit Center
Overlake Transit Center
No changes proposed for I-405
South corridor
Unchanged Routing
Discontinued Routing
17 | SOUND TRANSIT 2019 SERVICE IMPLEMENTATION PLAN
DRAFT
Figure 11: Summary of I-405 South ST Express Corridor Changes

DRAFT
3.57
01.75
Miles
Select trips only
TACOMA
LAKEWOOD
DUPONT
PUYALLUPSUM
NER
BONNEY LAKE
AUBURN
KENT
FEDERAL WAY
SEATAC
DOWNTOW
N SEATTLE
592
590
595
574
578
596580
594
South Hill
Federal Way TC
Lakewood
Station
Auburn Station
Summ
ary of I-5 South Corridor and Sounder Connector Changes M
archRoute 580 w
ill operate only from Puyallup to South
Hill on m
ost trips; reverse peak and midday trips
discontinued due to low ridership.
Route 596 midday trip discontinued.
LegendRoute w
ith No Change
Route with Service Change
Discontinued Routing
New
Routing
18
2019 SERVIC
E PLAN
DRAFT
Figure 12: Summary of I-5 South and Sounder Connector ST Express Corridor Changes

0Miles
0.30.15
Union StPike St
4th Avenue
2nd Avenue
Deleted routing
New routing
To Bellevue
Pike St & Convention Pl
5th & Union
6th & Pike
4th & Union
2nd & Cherry
2nd & Yesler
4th & Jackson
4th & Washington
4th & Cherry
4th & Seneca
2nd & Seneca
19 | SOUND TRANSIT 2019 SERVICE IMPLEMENTATION PLAN
DRAFT
In 2019, the DSTT will convert to rail-only as buses move operations to the surface streets of downtown Seattle. Route 550, which currently operates in separated right-of-way in the tunnel, will incur additional running time as it moves to streets with mixed traffic, traveling northbound on 4th Avenue and southbound on 2nd Avenue. Meanwhile, other downtown routes already operating on those streets will experience increased congestion from additional buses. All Metro bus routes that currently operate in the DSTT will move to the surface as well. Metro is conducting its own process to notify its riders of changes, but is working closely with Sound Transit to plan for changes. Figure xx shows the new proposed stops.
CUSTOMER IMPACTS
Riders of Route 550 will have new boarding and alightinglocations downtown and longer travel times. The pathway has been chosen to avoid the most congested streets north of Westlake. To avoid downtown congestion, Route 550customers may also choose to use Link and transfer at Pioneer Square Station eastbound 550 service.
In 2017, average transit travel times from Westlake to the International District were 7 minutes in the DSTT and 14 minutes on surface streets. Sound Transit plans to invest resources to the route to absorb some of those impacts andmaintain reliability, but routes throughout East King County may see service reductions in order to compensate for the impacts to Route 550.
CUSTOMER BENEFITS AND IMPROVEMENTS
As part of a joint agency collaboration, Sound Transit is investing in improvements in downtown Seattle to speed up travel in key transit corridors. All downtown routes will benefit from some of the improvements, which include protected right turns on 2nd and 4th Avenues, painted bus lanes on 5th and 6th Avenues, and upgraded signage throughout.
Metro and the City of Seattle are also working to arrange a new northbound transit pathway using 5th and 6th Avenues. Several Metro routes plan to use this pathway, freeing up capacity on northbound 4th Avenue for more ST Express buses.
DSTT Converts to Rail-Only | Changes for Route 550
Figure 13: New 550 pathway in Downtown Seattle

N
To layover
To I-5 Express Lanes
From layover and I-5
To Westlake Station
To International District Station
From I-90 and SODO busway
From layover
To International District
To I-5 Express Lanes
To layover, I-90 and SODO busway
Only routes moving to these paths are shown. Routes remaining on the same paths are not shown.
550150102101
550150102101
252257
7776
311316
308301
7474 41Marion St
Pike St
Union St
Olive Way
Yesler Way
6th Ave
4th Ave
3rd Ave
DSTT
2nd Ave
5th Ave
20
2019 SERVIC
E PLAN
DRAFT
Sound Transit collaborated with King County Metro and Community Transit to develop a plan for all bus routes moving out of the DSTT. As shown in Figure 14: Proposed downtown pathways, this plan spreads out routes amongst different streets and moves some existing surface routes to the new 5th/6th Avenue northbound pathway.
CUSTOMER IMPACTS AND BENEFITS
Other Sound Transit riders will notice more congestion as routes that previously operated in the tunnel now share the streets with other vehicles. While modest reliability investments will help temper some effects of congestion, regional bus base capacity constraints limit the number of buses available to add to service.
The removal of buses from the DSTT is expected to improve Link reliability by removing a major source of delay. A more reliable Link train will continue to allow ST Express customers to bypass downtown congestion by riding Link to another bus stop.
DSTT Converts to Rail-Only | Changes for Downtown
Figure 14: Proposed downtown pathways

Miles0.5 21
DRAFT
Bellevue Transit Center
Northgate Transit Center
Issaquah Highlands Park & Ride (Stop removed)
Eastgate Park & Ride (Stop removed)
Richards Road (Stop removed)
Bellevue Way (All stops removed)
Issaquah Transit Center (Stop removed)
Front St & Sunset Way (Stop removed)
DOWNTOWN SEATTLE BELLEVUE
ISSAQUAH
MEDINA
NORTH SEATTLE
Deleted routing Alternative routing
555
555271
to U-District
0Miles
0.30.15
S Jackson St
S Yesler St
Union StPike St
4th Avenue
2nd Avenue
James St
Spring St
DOWNTOWN SEATTLE
CAPITOL HILL
INTERNATIONAL DISTRICT
BELLTOWN
Deleted routing
New routing
DRAFT
21 | SOUND TRANSIT 2019 SERVICE IMPLEMENTATION PLAN
DRAFT
PROPOSED MAJOR SERVICE CHANGES
Proposed Service Changes by route
As the DSTT becomes rail-only, Route 550 will operate on surface streets in Downtown Seattle.
Route 550 will no longer operate in the Downtown Seattle Transit Tunnel. Instead, after exiting I-90 it will travel northbound on 4th Avenue and southbound on 2nd Avenue, serving most of the same stops as Route 554.
Daily Customer Impact: 10,700 (100%)
Longer and more variable travel time
Routes 550 – New Routing on Surface Streets MARCH
Strategy: Respond to Construction Impacts
Route 555 only operates between Northgate and Bellevue, Bellevue-Eastgate-Issaquah segment eliminated
Almost 80% of the current ridership on Route 555 is between the Northgate and Bellevue Transit Centers, with the Bellevue-Eastgate-Issaquah segment carrying an average of 10 riders per trip. The low-performing segment of the route would be eliminated and hours reinvested into Route 554.
Customers can ride King County Metro Route 271 between Bellevue, Eastgate and downtown Issaquah or Route 241 to Richards Road.
Daily customer impact: 175 of 740 (24%) will incur a transfer and additional travel time
Route 555 – Northgate to Bellevue only MARCH
Strategy: Improve Resource Efficiency

Tacoma Dome Station
Lakewood Station
SR 512 P&R
South Tacoma Station
Puyallup Station
Puyallup Red Lot
South Hill P&R
580
580
LAKEWOOD
SOUTH HILL
TACOMA
PUYALLUP
Select trips only
Select trips only
0 0.75 1.50.375Miles
Miles0.5 21
DRAFT
Bellevue Transit Center
Evergreen Point
Northgate Transit Center
Green Lake Park and Ride
Montlake Blvd & E Shelby St
Downtown Seattle
Redmond Transit Center
Bear Creek Park and Ride
DOWNTOWN SEATTLE
NORTH SEATTLE
MEDINA
BELLEVUE
REDMOND
OVERLAKEMontlake Freeway Station
(CLOSING)
545
555542
22
2019 SERVIC
E PLAN
DRAFT
MARCH
Construction on SR-520 closes the Montlake Freeway Station; mitigation service added to Route 542
Starting March 2019, WSDOT construction along SR-520 will require the closure of the Montlake Freeway Station. To minimize the impact, WSDOT and Sound Transit are partnering to add Route 542 service on evenings and weekends to augment existing service. The closest alternative stops will be on Montlake Boulevard, south of the Montlake cut. Route 545 and 555 customers will need to transfer.
Daily Customer Impact: 350 of 10,300(3%) will incur a transfer and additional travel time
Routes 542/545/555 – Montlake Freeway Station Closure
Route 580 between Lakewood and South Hill discontinued on most trips.
This change would discontinue service on the lowest performing segment between Lakewood Station and South Hill when there is a corresponding Sounder trip traveling to or from Lakewood. Service to Lakewood would remain when connecting to Sounder trips starting or ending in Tacoma. Saved resources would be reallocated within Pierce County.
Additionally, due to low ridership, the following 580 trips are discontinued:
• AM trips to Lakewood and PM trips to Puyallup
• The 10:03 AM departure connecting to the midday train.
Daily customer impact: 40 of 750 (5%) will have fewer options from South Hill to Lakewood or SR 512 P&R to Puyallup.
Route 580 – SR 512 Service Modifications MARCH
Strategy: Respond to Construction Impacts
Strategy: Improve Resource Efficiency

Evergr
een W
ay
0 2.5 51.25Miles
DRAFTSeaway Transit Center (New stop)
Eastmont P&R
Downtown Seattle
Evergreen & 79th (Stop removed)
SEATTLE
EVERETT
MOUNTLAKE TERRACE
New routing
513
23 | SOUND TRANSIT 2019 SERVICE IMPLEMENTATION PLAN
DRAFT
MARCHRoute 513 integrates with new Seaway Transit Center, no longer serving the Evergreen Way/79th Place stop.
In March 2019 the opening of the Seaway Transit Center will provide an opportunity to integrate ST Express service with local and regional service operated by Everett Transit and Community Transit. In order to leverage this opportunity, Route 513 would be restructured to serve the new transit center, and as a result would no longer serve the stops at Evergreen Way and 79th Place SE.
Daily customer impact: 66 of 636 (10%) will need to use a different stop
Route 513 – Starts at Seaway Transit Center
Strategy: Service Integration

NE 40th St
0.1 0.20 0.05Miles
Overlake P&R
156th Ave NE & NE 31st St (New stop)
Overlake Transit Center
SR 520 & NE 40th St
541
156th Ave NE
148th Ave NE
NE 24th St
24
2019 SERVIC
E PLAN
DRAFTMINOR ST EXPRESS SERVICE CHANGES CONSIDERED
Below is a list of administrative service changes currently being analyzed for implementation in March 2019. This list is not exhaustive and is not subject to Board approval. Other minor changes to ST Express service may occur in 2019.
Route 512 Stop Change and Reliability Investment
Lynnwood Link construction at Shoreline South/145th St will close the northbound 145th Street Freeway Station in 2019. Route 512 is proposed to be rerouted to serve the stop on surface streets at 5th Avenue NE at NE 145th Street. Additionally, schedule changes may occur to improve reliability between downtown Seattle and Snohomish County.
Route 541 Stop Addition
With construction for East Link around Overlake Transit Center impacting pedestrian access, service planning is evaluating adding a stop to Route 541 at the intersection of 156th Avenue NE and NE 31st Street to reduce walk time for customers in the area. This stop would serve the southeast portion of the Microsoft Campus.
Route 596 Midday Trip Discontinuation
Route 596 is currently timed to every peak direction Sounder trip. The Bonney Lake Park-and-Ride lot is at capacity by the end of the morning commute, and the midday 596 trip averages 2 to 4 passengers. This trip is proposed for discontinuation.
NE 145th St
Roosevelt Way N
5th
Ave
NE
15th
Ave
NE
DRAFT
0.15 0.30.075Miles
0
Northbound NE 145th St Freeway Station (Closes March 2019)
NE 145th St & 5th Ave NE (New stop)Deleted northbound
New northbound routing
512

25 | SOUND TRANSIT 2019 SERVICE IMPLEMENTATION PLAN
DRAFT
SERVICE CONTEXT
Link extensions in 2016 expanded service north to the University of Washington and south to Angle Lake. Since the opening of the three new stations, ridership has grown tremendously. In response to the increased demand for Link service, Sound Transit responded by adding more 3-car trains during peak and off-peak periods.
In preparation of the system expansion to Northgate, Bellevue and Redmond, additional fleet vehicles will be delivered and placed into pre-revenue service for testing before being deployed into service.
2019 SERVICE STRATEGY
All available resources are being utilized during weekday peak periods; however, Sound Transit will continue to monitor ridership and respond where possible especially during special events.
Staff analyzed the possibility of extending service spans to accommodate additional late night service or to continue all late night trains that currently terminate at Beacon Hill to downtown Seattle, but because track maintenance windows cannot be further shortened, there are no proposed changes to extend late night service.
With the DSTT becoming rail-only in 2019, Link service is expected to be more reliable.
96,191 95,972 95,600 101,846 101,614 101,200
2017Actual
2018Estimated
2019 Estimated
Revenue Hours Platform Hours
1,974,346 1,969,850 1,962,400 2,096,492 2,091,717 2,083,800
2017Actual
2018Estimated
2019 Estimated
Revenue Miles Platform Miles
23,002,263 24,500,000
28,400,000
2017Actual
2018Estimated
2019 Estimated
Link service plan
Why are there two-car trains during the peak? Can’t you add more?
Currently, Link operates 3-car trains all day with additional 2-car trains during peak periods. With our fleet of 62 vehicles, it is difficult to make all trains have three cars without a reduction in frequency or other significant schedule changes. The vehicles not in service may be in for longer term repairs and maintenance, or set aside in case a train in-service has a mechanical problem.
Sound Transit is aiming to receive new light rail vehicles from Siemens in 2019 and, once testing is complete, increase the number of 3-car trains available during peak periods.
REVENUE AND PLATFORM HOURS
REVENUE AND PLATFORM MILES
RIDERSHIP
Figure 15: Link 2017-2019 Service Statistics

26
2019 SERVIC
E PLAN
DRAFT
SERVICE CONTEXT
Sounder service has added three round trips in the past three years, with the addition of a midday round trip in September 2016 and two peak round trips in September 2017. These trips have been well utilized, resulting in ridership increases of 15 percent from 2015 to 2017.
2019 SERVICE STRATEGY
With the completion of trip additions from the ST2 measure, there are no planned major changes in 2019 for Sounder. Minor changes to Sounder schedules may arise from the scheduling of Amtrak Cascades trains which share tracks with Sounder.
The two factors that may have the greatest influence on Sounder ridership in 2019 are station construction projects and changes to ST Express. The Puyallup and Sumner Station Parking and Access Improvement projects may impact Sounder ridership due to the closure of parking facilities and capacity improvements. Increasing congestion on I-5 and overcrowding on ST Express may push people toward Sounder which operates in its own dedicated right of way.
Service Planning will continue to plan for serving select major events in the Puget Sound region, and will use the criteria established in the Service Standards and Performance Measures document to guide service plans.
11,240 12,361 12,400 12,075
13,134 13,200
2017Actual
2018Estimated
2019 Estimated
Revenue Hours Platform Hours
330,619 364,170 364,300
340,503 372,222 372,300
2017Actual
2018Estimated
2019 Estimated
Revenue Miles Platform Miles
4,445,568 4,650,000 4,810,000
2017Actual
2018Estimated
2019 Estimated
Ridership
Sounder service plan
Why don’t we run later weekday trains or more weekend service?
Sounder service is coordinated with BNSF who owns the majority of the track that Sounder operates on. Further agreements would need to be negotiated with BNSF in order to run more scheduled trips.
Additionally, work schedules and minimum rest periods between work shifts for train conductors dictate how late we can run service. That’s why we can only run special event service for weekend day games rather than night games.
REVENUE AND PLATFORM MILES
REVENUE AND PLATFORM HOURS
RIDERSHIP
Figure 16: Sounder 2017-2019 Service Statistics

27 | SOUND TRANSIT 2019 SERVICE IMPLEMENTATION PLAN
DRAFT
SERVICE CONTEXT
Tacoma Link has not changed its service model since the opening of the 11th and Commerce station in 2011. Service operates every 12 minutes during weekdays and Saturdays, while operating every 24 minutes on weeknights and on Sundays.
Ridership is primarily driven by special events at the Tacoma Dome as well as connections between Tacoma Dome Station and UW Tacoma or the Theater District.
2019 SERVICE STRATEGY
There are no major changes proposed to Tacoma Link service. Budgeted hours and miles for 2019 Tacoma Link service are consistent with prior years. The Hilltop Tacoma Link Extension will begin construction in 2019 which may result in disruptions to service from January through April 2019 while a temporary turn back track is installed at the existing Theater District Station.
75,983 75,500 75,500 76,262 75,800 75,800
2017Actual
2018Estimated
2019 Estimated
Revenue Miles Platform Miles
972,998 900,000
1,000,000
2017Actual
2018Estimated
2019 Estimated
Ridership
Tacoma Link service plan
REVENUE AND PLATFORM HOURS
REVENUE AND PLATFORM MILES
RIDERSHIP
9,868 9,800 9,800 9,905 9,800 9,800
2017Actual
2018Estimated
2019 Estimated
Revenue Hours Platform Hours
Figure 17: Tacoma Link 2017-2019 Service Statistics

28
2019 SERVIC
E PLAN
DRAFT
This page intentionally left blank.

30
SERVIC
E EQU
ITY AN
ALYSIS
DRAFT Adverse Effects
The adopted Sound Transit major service change policy, described above, also defines potential adverse effects of major service changes and thresholds for determining whether the proposed service change would have a disparate impact on minority populations and/or a disproportionate burden on low-income populations. The definitions are as follows:
A potential adverse effect is defined as a geographical or time-based addition or reduction in service which includes but is not limited to: changes to span of service, changes to frequency of service, or elimination of routes or route segments.
A disparate impact occurs when the minority percentage of the population adversely affected by a major service change is greater than the average minority percentage of the population of Sound Transit’s service area.
A disproportionate burden occurs when the low income percentage of the population adversely affected by a major service change is greater than the average low income percentage of the population of Sound Transit’s service area.
Per Sound Transit’s policy, if any disparate impact or disproportionate burden is found during the service equity analysis, Sound Transit will consider steps to avoid, minimize, or mitigate the adverse impacts and reanalyze the modified changes to determine if the impacts are removed or lessened.
DEFINITIONS AND DATA ANALYSIS
The following sections describe the data definitions and methodologies used by Sound Transit to develop estimates for Title VI populations within the Sound Transit service area.
Demographic Analysis Methodology and Title VI Data Definitions
Sound Transit uses census demographic data to identify Title VI communities (Minority, Low Income, & Limited English Proficiency) for service equity analysis and calculates the system-wide or mode specific average representation of these communities within the general population. Only Minority or Low Income status are used to determine if a disparate impact or disproportionate burden must be mitigated or analyzed. However, identifying Limited English Proficiency (LEP) residents helps Sound Transit to ensure that outreach efforts reach diverse customers. Sound Transit uses the 2010 designated Census Tracts as the geographic basis for assessing the Title VI populations.
Sound Transit uses the most recent five-year demographic estimates available from American Community Survey (ACS). The ACS dataset identifies Minority, Low Income and LEP populations as follows:
Minority: Persons who self-identify as being one or more of the following ethnic groups: American Indian and Alaska Native, Asian, Black or African American, Hispanic or Latino, Native Hawaiian and Other Pacific Islander.
Low income: Persons whose household income is below the federal poverty level.
Limited English Proficiency (LEP): Persons who identify a language other than English as their primary language and are not fluent in English.
The following sections describe the methodology for identifying each of the Title VI populations for the purposes of the annual service equity analysis.

29 | SOUND TRANSIT 2019 SERVICE IMPLEMENTATION PLAN
DRAFT
As part of the annual Service Implementation Plan (SIP), Sound Transit conducts a service equity analysis, also known as a Title VI evaluation analysis, to ensure that changes to transit service are consistent with Title VI policies defined by the Federal Transit Administration (FTA) and Board policies defined by the Sound Transit Board of Directors. The FTA is responsible for ensuring that federally supported transit services and related benefits are distributed by applicants and recipients of FTA assistance in a manner consistent with Title VI, Section 601 of the Civil Rights Act of 1964, which states:
No person in the United States shall, on the grounds of race, color or national origin, be excluded from participation in, be denied the benefits of, or be subjected to discrimination under any program or activity receiving Federal financial assistance.
This section of the SIP provides an assessment of potential impacts to minority, low income and limited English speaking communities associated with the proposed changes in this Service Implementation Plan.
POLICIES AND DEFINITIONS
The section below describes Sound Transit’s approved policies for conducting and identifying major service changes, as well as for assessing their impacts on Title VI populations.
Service Standards and Performance Measures
Service standards and performance measures are a set of guidelines that are used to design, evaluate and modify transit service. The standards and measures establish baselines to obtain optimum efficiency and effectiveness in the system on a short-term basis, while maintaining or improving the quality of service. Planning and day-to-day management of transit service is based on the established service standards and performance measures. The guidelines provide a multi-step process to identify the level and type of service that should be provided, as well as a process to implement any changes needed to meet established priorities.
The Service Standards and Performance Measures defines the criteria for making major or administrative service changes, as well as guidelines and driving factors for the type of changes needed to ensure Sound Transit services are meeting the demand for regional transit in the Puget Sound area.
Major Service Change
Resolution R2013-18, adopted by the Sound Transit Board of Directors in 2013, established policies for conducting equity analyses of major service changes and assessing the impacts on minority and low income populations. This policy defines a major service change as follows:
A major service change is any single change in service on an individual bus or rail route that would add or eliminate more than 25 percent of the route’s weekly platform service hours,
Move the location of a stop or station by more than a half mile.
Closing or removing a stop or station without replacement within a half mile.
SERVICE EQUITY ANALYSIS Title VI Evaluation
Introduction

31 | SOUND TRANSIT 2019 SERVICE IMPLEMENTATION PLAN
DRAFT Service Area Methodology
Most transit agencies in the United States define their service area as a buffered distance around each of their transit routes. Given the unique service characteristics of Sound Transit service – limited stops connecting regional urban and employment centers – the agency defines its service area based on a radial distance from each transit stop, rather than the transit route alignment. Table 7 below provides details on Sound Transit’s service area by stop type.
STOP TYPE SERVICE AREA (MILES)
Bus stop without parking 0.5 Rail station without parking 1.0 Major bus facilities with parking 2.5 Rail station with parking 5.5
Sound Transit Title VI Population Estimates
Using the demographic analysis and Title VI definitions previously outlined in this section, percentages for the three Title VI populations for the Sound Transit service area are identified by census tract and the district overall.
The population representation for any census tract is calculated using the percentage of area that falls within the district or mode’s service area to estimate the specific number of people that fall within each of the Title VI categories. For example, if a census tract total is 10 acres and 3 acres are in the service area, based on the previously identified methodologies, then 30 percent of the tract’s total population, and in turn the respective Title VI populations, is considered to be within the service area. This methodology assumes an even distribution of population throughout the census tract.
Table 8 shows the Title VI population averages for the Sound Transit service area using the 2012 – 2016 ACS Dataset. Minority and low-income averages serve as a comparison in the service change analysis to determine if mitigation must be considered, while LEP averages help to advise the outreach strategy. The maps at right (Figure 18, 19) show census tracts with minority and low-income populations above the Sound Transit district average.
TITLE VI POPULATIONS PERCENTAGE OF
DISTRICT POPULATION
Minority 38.1% Low Income 11.8% Limited English Proficiency 10.1%
Table 7: Service Area Definitions
Table 8: ST District Populations
Figure 18: ST Express Bus Service Low Income Population Map
Figure 19: ST Express Bus Service Minority Population Map

32
SERVIC
E EQU
ITY AN
ALYSIS
DRAFT
Each major service change being proposed has been evaluated to determine if it is causing a disparate impact or disproportionate burden to minority or low-incomepopulations. This section describes anticipated impacts of each change and either what steps have been taken to mitigate the impact or why full mitigation is not possible. In some cases, the LEP population may be cited in order to ensure robust, multilingual outreach.
NEW SURFACE ROUTING FOR ROUTE 550AS DSTT BECOMES RAIL-ONLY
The removal of Route 550 from the Downtown Seattle Transit Tunnel will impact the entire Route 550 service,causing slower speeds as buses run on surface streets.
The closure of the DSTT to buses is unavoidable due to the sale of the Convention Center and impending Link extensions closing access to the DSTT. In anticipation,regional agencies including Sound Transit, have worked together over the last few years to develop strategies that would improve traffic flow and the passenger experience on surface streets through the methods outlined in the 2019 Service Plan section. This Title VI analysis addresses impacts to Route 550 only.
SERVICE CHANGE DEVELOPMENT PROCESS
Sound Transit worked with King County Metro to look comprehensively at all bus routes expected to use Downtown Seattle surface streets in 2019 and determine the preferred routing for each route. Routes were balanced among surface streets in order to avoid overburdening one street. Route 550 will travel northbound on 4th Avenue and southbound on 2nd Avenue. In assigning a routing for Route 550, staff considered and balanced many priorities,including:
Minimize change to existing surface routes.
Preserve travel speeds, to the extent possible.
Keep routes serving the same markets together, such as ST Express and Community Transit services traveling towards Snohomish County.
Retain the current skip-stop pattern on 4th Avenue, where each route serves one of two sets of stops.
Balance high-frequency and high-ridership routes among different pathways, balancing the impacts from additional bus traffic.
Title VI Evaluation of 2019 Proposed Service Changes
Figure 20: New Route 550 Pathway in Downtown Seattle
0Miles
0.30.15
Union StPike St4th Avenue
2nd Avenue
Deleted routing
New routing
To Bellevue
Pike St & Convention Pl
5th & Union
6th & Pike
4th & Union
2nd & Cherry
2nd & Yesler
4th & Jackson
4th & Washington
4th & Cherry
4th & Seneca
2nd & Seneca

33 | SOUND TRANSIT 2019 SERVICE IMPLEMENTATION PLAN
DRAFT CUSTOMER IMPACTS
Customers will notice longer travel times and reduced reliability if they ride Route 550 through Downtown Seattle.
NUMBER OF IMPACTED CUSTOMERS
In 2017, about 9,000 customers (87%) on Route 550 boarded or alighted in the DSTT. Many other customers per day boarded Metro bus routes in the DSTT. Because current DSTT bus routes will shift operations to several different surface streets, riders of all Downtown Seattle buses will experience additional congestion and travel time increases.
COMPARISON OF IMPACTED POPULATIONS
Route 550 changes will impact all riders on Route 550 because reliability issues originating in Downtown Seattle are likely to ripple throughout the line. Therefore, the entire service area of Route 550 was compared to the service area of the Sound Transit District to determine if the Route 550 service area was disproportionately impacted.
DATA
Table 9 shows the percentage of low-income, minority, and LEP populations in the Route 550 service area as compared with the Sound Transit district overall.
AREA LEP LOW INCOME MINORITY
Sound Transit District 10.1% 11.8% 38.1% Route 550 Service Area 9.8% 12.7% 38.6%
MAPS
Maps showing percentages of minority, low-income, and LEP populations in the Route 550 service area by census tract can be found in the Appendix.
FINDINGS
The Route 550 service area has both a low-income population and minority population that are slightly above their respective averages for the Sound Transit District, resulting in a disparate impact and disproportionate burden.
CONCLUSION
The removal of buses from the DSTT is inevitable due to Convention Center expansion and impending Link Light Rail expansion; therefore, longer travel times are inevitable because will face more severe congestion on surface streets than they do in tunnel. However, Sound Transit is committed to mitigating the impacts to the extent possible. Rather than let reliability deteriorate on Route 550 as travel times increase, Sound Transit has proactively added resources to the route to absorb longer running times without impacting service levels.
Table 9: Title VI Populations of the Route 550 Service Area

Miles0.5 21
DRAFT
Bellevue Transit Center
Evergreen Point
Northgate Transit Center
Green Lake Park and Ride
Montlake Blvd & E Shelby St
Downtown Seattle
Redmond Transit Center
Bear Creek Park and Ride
DOWNTOWN SEATTLE
NORTH SEATTLE
MEDINA
BELLEVUE
REDMOND
OVERLAKEMontlake Freeway Station
(CLOSING)
545
555542
34
SERVIC
E EQU
ITY AN
ALYSIS
DRAFTMONTLAKE FREEWAY STATION CLOSES
DESCRIPTION OF CHANGE
Starting March 2019, WSDOT construction along SR-520 will require the closure of the Montlake Freeway Station,impacting Sound Transit, Metro, and Community Transit service and riders. To minimize the impact, WSDOT and Sound Transit are partnering to add Route 542 service on evenings and weekends to augment existing service. The stop at Montlake Boulevard & Shelby Street will be the closest alternative stop. Route 545 and 555 customers will need to switch routes or transfer and from Route 542 to reach Montlake.
CUSTOMER IMPACTS AND BENEFITS
In 2017, about 350 customers per day out of 10,300 (3%) boarded at Montlake Freeway Station on Routes 545 or 555. These customers will incur additional travel time as they will need to ride Route 542 from Montlake and may need to transfer to reach their final destination. Customers who currently ride Route 545, which is very frequent at peak hours, will also need to wait longer for less frequent Route 542 service.
However, customers traveling between the U-District and Overlake or Redmond will benefit from evening and weekend service on Route 542.
COMPARISON OF IMPACTED POPULATIONS
Initially, only the service area of the Montlake Freeway Station was analyzed and there was found to be no disparate impact or disproportionate burden. However, in order to more accurately capture the riders who transfer or alight at
this stop and would therefore still be impacted, this Title VI analysis expanded on the previous methodology.
This change will impact riders in the vicinity of every Route 545 and 555 stop because any of those riders could becurrently using Montlake Freeway Station. At the same time, riders at every Route 542 stop will benefit from a longer span of service. Therefore, two customer populations were analyzed for this service change. The Route 545 and 555 service area population was considered the impacted population. The Route 542 service area population was considered the benefited population, even though the geographic areas overlap significantly.
The percentage of minority, low-income and LEP residents in each population was compared to the ST district overall to determine if a disproportionate benefit or impact existed.
DATA
Table 10 shows the percentage of low-income, minority, and LEP populations in the impacted service area as compared with the benefited service area, the Montlake Freeway Station service area, and the Sound Transit district overall.
AREA LEP LOW INCOME MINORITY
ST District 10.1% 11.8% 38.1%Impacted Service Area(Route 545 & 555) 10.1% 9.6% 36.2%
Benefited Service Area(Route 542) 7.7% 10.8% 30.6%
Montlake Freeway Station 3.2% 4.9% 26.5%
MAPS
Maps showing percentages of minority, low-income, and LEP populations in the impacted and benefited service areas by census tract can be found in the Appendix.
RESULTS
Both the impacted and benefited service areas have Title VI populations at or below the ST District average so there is no disparate impact or disproportionate burden.
CONCLUSION
Because there is no disparate impact or disproportionate burden to Title VI populations, no mitigation is necessary.However, mitigation service on Route 542 is being offered because WSDOT funding was available and because not mitigating service would have caused a significant customer impact on nights and weekends.
Table 10: Title VI Population in the Montlake Area

Miles0.5 21
DRAFT
Bellevue Transit Center
Northgate Transit Center
Issaquah Highlands Park & Ride (Stop removed)
Eastgate Park & Ride (Stop removed)
Richards Road (Stop removed)
Bellevue Way (All stops removed)
Issaquah Transit Center (Stop removed)
Front St & Sunset Way (Stop removed)
DOWNTOWN SEATTLE BELLEVUE
ISSAQUAH
MEDINA
NORTH SEATTLE
Deleted routing Alternative routing
555
555271
to U-District
35 | SOUND TRANSIT 2019 SERVICE IMPLEMENTATION PLAN
DRAFTROUTE 555 TRUNCATES AT BELLEVUE TRANSIT CENTER
DESCRIPTION OF CHANGE
Almost 80% of the current ridership on Route 555 is between the Northgate and Bellevue Transit Centers, with the Bellevue-Eastgate-Issaquah segment carrying an average of 10 riders per trip. The low-performing segment of the route would be eliminated and hours reinvested into Route 554.
Customers can ride King County Metro Route 271 between Bellevue and downtown Issaquah.
CUSTOMER IMPACTS
While the majority of Route 555 riders alight at or before Bellevue Transit Center in the AM, about 175 of 740 daily customers (24%) proceed further east. These customers who board at Northgate would need to transfer at Bellevue Transit Center to Metro Route 271, incurring both a transfer penalty and additional travel time. Customers who normally board in Bellevue would simply board Route 271. Additional travel time would depend on how far a rider is traveling; to downtown Issaquah,
COMPARISON OF IMPACTED POPULATIONS
Because Route 555 operates only eastbound in the AM peak and only westbound in the PM peak, this change will impact residents in the vicinity of every stop except the Issaquah Highlands, where riders cannot board in the mornings. Even riders living near non-impacted stops may be impacted if they currently alight at an impacted stop. Therefore, the population of the service area of every stop except Issaquah Highlands was considered the Route 555 impacted service area. This population was compared to the ST Express service area as a whole to determine if a disparate impact would occur.
DATA
Table 11 shows the percentage of low-income, minority, and LEP populations in the Route 555 impacted service area as compared with the Sound Transit district overall.
_
Table 11: Title VI Populations of the Route 555 Impacted Area
MAPS
Maps in the appendix show percentages of minority, low-income, and LEP populations in the impacted and benefited service areas.
RESULTS
The Route 555 impacted service area does not have a LEP, minority, or low-income population that is greater than that of the Sound Transit district overall. Therefore, this change does not result in a disparate impact or disproportionate burden.
Given that some individual census tracts in the impacted service area do have disproportionate LEP populations, outreach about this change will be sensitive to those language needs.
CONCLUSION
This service change affects only about 24% of the current ridership of Route 555 and is necessary to use resources more efficiently. These resources will be redeployed elsewhere in East King County, primarily to restore Route 554 trips eliminated due to the closure of the Rainier Freeway Station. By redeploying resources, more riders can be served and more destinations reached than if resources continue to be spent on unproductive trips with parallel service available. Therefore, impacts to Route 555 will not be mitigated.
AREA LEP LOW INCOME MINORITY
Sound Transit District 10.1% 11.8% 38.1%Route 555 Impacted Service Area
9.2% 9.3% 32.7%

36
SERVIC
E EQU
ITY AN
ALYSIS
DRAFTROUTE 580 TRUNCATES MOST TRIPS AT SOUTH HILL P&R
DESCRIPTION OF CHANGE
This change would discontinue service on the lowest performing segment of Route 580 between Lakewood Station and South Hill Park-and-Ride, when there is a corresponding Sounder trip traveling to or from Lakewood. Service to Lakewood would remain when connecting topeak-direction Sounder trips starting or ending in Tacoma. Saved resources would be reallocated within other Pierce County ST Express services.
Additionally, due to low ridership, the following 580 trips would be discontinued:
• 3 AM trips to Lakewood and 3 PM trips to Puyallup • The 10:03 AM departure connecting to the midday
Sounder south line train.
CUSTOMER IMPACTS
Of the 750 daily Route 580 customers, on average 40 (5%) travel on the trips or segment proposed to be removed and would be impacted by this change. Some customers, traveling between Puyallup and Lakewood on trips with acorresponding Sounder train, could use Sounder to reach Lakewood Station or Puyallup Station, though they would incur a higher fare of $4.00.
Customers traveling between South Hill, the SR 512 park-and-ride lot, and Lakewood could ride Pierce Transit Route 4, or use a different park-and-ride lot to reach their final destination. Customer traveling between Lakewood and the SR 512 park-and-ride in the peak direction could also ride ST Express Route 592.
COMPARISON OF IMPACTED POPULATIONS
This change will impact riders residing near all five stops on Route 580. Therefore, the entire service area of Route 580 was compared to the service area of the ST District overall to determine if the Route 580 service area was disproportionately impacted.
DATA
Table 12 shows the percentage of low-income, minority, and LEP populations in the Route 580 service area as compared with the Sound Transit district overall.
AREA LEP LOW INCOME MINORITYSound Transit District 10.1% 11.8% 38.1%Route 580 Service Area 8.9% 17.7% 42.3%
MAPS
Maps showing percentages of minority, low-income, and LEP populations in the Route 580 service area by census tract can be found in the Appendix.
RESULTS
The Route 580 service area has both a low-income population and minority population that are above their respective averages for the Sound Transit District.
Route 580 does not have a disproportionate population of Limited English Proficient riders, but information will still be made available in various languages.
CONCLUSION
This service change affects only 40 riders or 5% of the current ridership of Route 580, and alternative service is available on Pierce Transit Route 4. This change also will help to use ST Express resources more efficiently; therefore, Sound Transit believes this to be a justifiable change.
In order to mitigate these impacts, customer care will use Rider Alerts, texts, and in-person street teams to ensure that riders are aware of their options. Additionally, resources saved from the change will be used to add a new trip to Route 592, which serves a high proportion of minority and low-income populations, including Lakewood and the SR 512 park-and-ride. Route 592 has higher ridership per trip than Route 580 and the change will serve more riders than current service.
Table 12: Title VI Populations for Route 580
Tacoma Dome Station
Lakewood Station
SR 512 P&R
South Tacoma Station
Puyallup Station
Puyallup Red Lot
South Hill P&R
580
580
LAKEWOOD
SOUTH HILL
TACOMA
PUYALLUP
Select trips only
Select trips only
0 0.75 1.50.375Miles
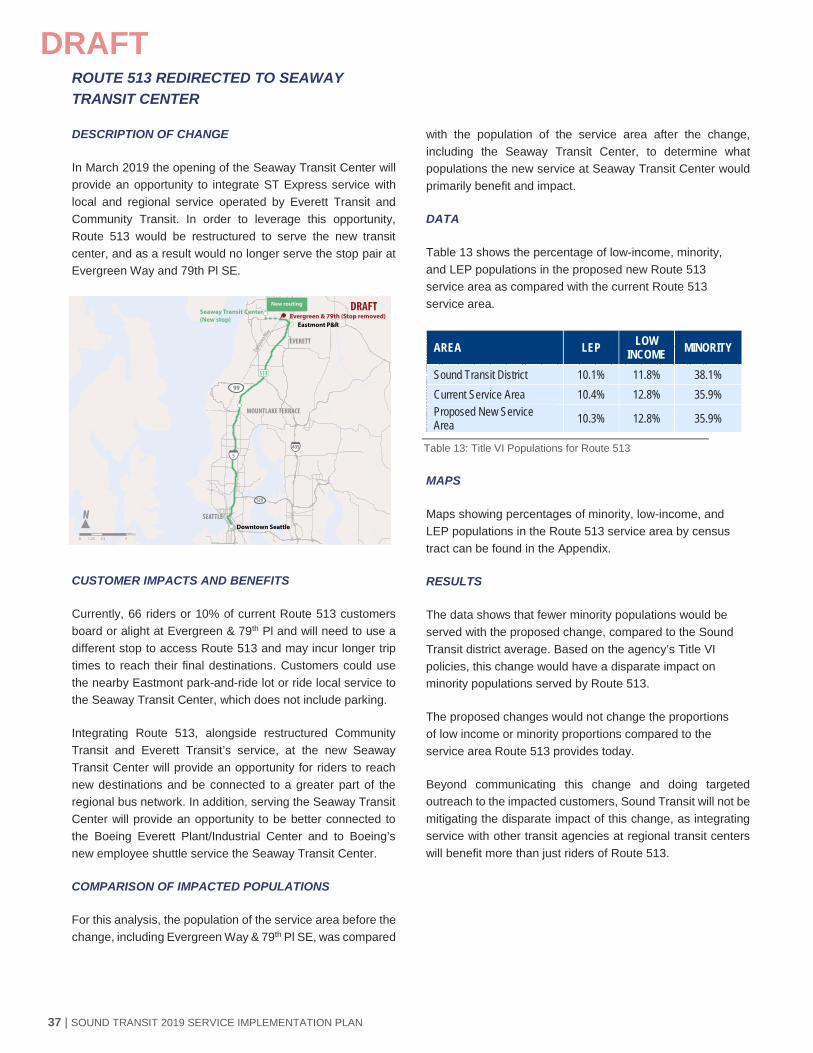
Evergr
een W
ay
0 2.5 51.25Miles
DRAFTSeaway Transit Center (New stop)
Eastmont P&R
Downtown Seattle
Evergreen & 79th (Stop removed)
SEATTLE
EVERETT
MOUNTLAKE TERRACE
New routing
513
37 | SOUND TRANSIT 2019 SERVICE IMPLEMENTATION PLAN
DRAFTROUTE 513 REDIRECTED TO SEAWAY TRANSIT CENTER
DESCRIPTION OF CHANGE
In March 2019 the opening of the Seaway Transit Center will provide an opportunity to integrate ST Express service with local and regional service operated by Everett Transit and Community Transit. In order to leverage this opportunity, Route 513 would be restructured to serve the new transit center, and as a result would no longer serve the stop pair at Evergreen Way and 79th Pl SE.
CUSTOMER IMPACTS AND BENEFITS
Currently, 66 riders or 10% of current Route 513 customersboard or alight at Evergreen & 79th Pl and will need to use a different stop to access Route 513 and may incur longer trip times to reach their final destinations. Customers could use the nearby Eastmont park-and-ride lot or ride local service to the Seaway Transit Center, which does not include parking.
Integrating Route 513, alongside restructured Community Transit and Everett Transit’s service, at the new Seaway Transit Center will provide an opportunity for riders to reach new destinations and be connected to a greater part of the regional bus network. In addition, serving the Seaway Transit Center will provide an opportunity to be better connected to the Boeing Everett Plant/Industrial Center and to Boeing’s new employee shuttle service the Seaway Transit Center.
COMPARISON OF IMPACTED POPULATIONS
For this analysis, the population of the service area before the change, including Evergreen Way & 79th Pl SE, was compared
with the population of the service area after the change, including the Seaway Transit Center, to determine what populations the new service at Seaway Transit Center would primarily benefit and impact.
DATA
Table 13 shows the percentage of low-income, minority, and LEP populations in the proposed new Route 513 service area as compared with the current Route 513 service area.
AREA LEP LOW INCOME MINORITY
Sound Transit District 10.1% 11.8% 38.1%Current Service Area 10.4% 12.8% 35.9%Proposed New Service Area 10.3% 12.8% 35.9%
MAPS
Maps showing percentages of minority, low-income, and LEP populations in the Route 513 service area by census tract can be found in the Appendix.
RESULTS
The data shows that fewer minority populations would be served with the proposed change, compared to the Sound Transit district average. Based on the agency’s Title VI policies, this change would have a disparate impact on minority populations served by Route 513.
The proposed changes would not change the proportions of low income or minority proportions compared to the service area Route 513 provides today.
Beyond communicating this change and doing targeted outreach to the impacted customers, Sound Transit will not be mitigating the disparate impact of this change, as integrating service with other transit agencies at regional transit centers will benefit more than just riders of Route 513.
Table 13: Title VI Populations for Route 513

38
SERVIC
E EQU
ITY AN
ALYSIS
DRAFT
Service Quality Monitoring by route
Route Description
Percent of Population in Title
VI Category OTP Trips Operated
Customer Complaints per
100,000 boardings Passenger
Overcrowd Rate
Title VI Category 2016 2017 2018 2016 2017 2018 2016 2017 2018 2016 2017 2018
Target M LI LEP 85% 85% 85% 99.8% 99.8% 99.8% 15 15 15 0% 0% 0%
510 Everett-Seattle 36% 15% 10% 85% 87% 87% 99.9% 99.9% 99.8% 10 11 11 1% 0% 1%
511 Lynnwood-Seattle 36% 12% 10% 82% 84% 86% 99.9% 99.9% 99.9% 2 2 2 2% 3% 2%
512 Everett-Seattle 36% 13% 10% 89% 91% 92% 99.9% 99.9% 99.9% 4 3 4 1% 0% 1%
513 Evergreen/79th-Seattle 35% 12% 10% 81% 84% 86% 99.9% 99.7% 99.8% 6 7 4 0% 0% 1%
522 Woodinville-Seattle 30% 9% 8% 85% 85% 89% 99.6% 99.8% 99.8% 1 6 3 3% 4% 4%
532 Everett-Bellevue 37% 11% 10% 95% 95% 94% 99.8% 99.9% 99.9% 16 4 13 3% 2% 3%
535 Lynnwood-Bellevue 34% 8% 9% 97% 97% 98% 99.9% 100.0% 99.9% 4 7 9 0% 0% 1%
540 Kirkland-U. District 31% 8% 8% 75% 70% 72% 99.7% 99.9% 99.9% 10 11 7 0% 0% 0%
541 Overlake-U. District 42% 9% 13% 82% 83% 89% 99.7% 99.8% 99.8% 5 9 5 0% 0% 0%
542 Redmond-U. District 30% 10% 7% 88% 86% 87% 99.8% 99.9% 99.8% 6 5 2 0% 0% 0%
545 Redmond-Seattle 34% 11% 8% 86% 85% 90% 99.7% 99.7% 99.7% 5 4 4 7% 5% 3%
550 Bellevue-Seattle 40% 10% 11% 86% 89% 90% 99.6% 99.7% 99.7% 2 2 3 7% 5% 4%
554 Issaquah-Seattle 37% 9% 9% 87% 83% 89% 99.7% 99.6% 99.7% 5 6 6 2% 2% 1%
555 Northgate-Issaquah 31% 10% 8% 70% 75% 80% 100.0% 100.0% 100.0% 17 23 46 1% 0% 0%
556 Issaquah-Northgate 33% 11% 9% 70% 74% 76% 99.6% 99.9% 99.7% 16 12 13 0% 0% 0%
560 Westwood Village-Bellevue 48% 12% 14% 79% 81% 85% 99.8% 99.9% 99.8% 5 7 8 0% 0% 0%
566 Auburn-Overlake 51% 18% 16% 80% 77% 78% 99.7% 99.8% 99.7% 13 9 6 0% 0% 0%
567 Kent-Overlake 51% 18% 16% 87% 87% 85% 99.9% 99.9% 99.9% 16 13 24 1% 1% 0%
574 Lakewood-SeaTac 51% 18% 12% 75% 70% 74% 99.8% 99.8% 99.7% 6 7 4 0% 0% 0%
577 Federal Way-Seattle 45% 14% 11% 65% 74% 75% 99.9% 99.9% 99.9% 8 6 9 1% 1% 1%
578 Puyallup-Seattle 37% 14% 9% 71% 73% 76% 99.8% 99.7% 99.7% 6 8 4 1% 1% 1%
580 Lakewood-Puyallup 39% 16% 8% 70% 72% 78% 99.8% 100.0% 99.9% 6 7 5 3% 6% 4%
586 Tacoma-U. District 42% 24% 9% 83% 79% 77% 100.0% 100.0% 99.9% 18 19 3 0% 0% 0%
590 Tacoma-Seattle 39% 19% 7% 74% 73% 76% 99.6% 99.6% 99.7% 12 7 6 1% 1% 0%
592 Olympia-Seattle 45% 18% 9% 71% 70% 71% 99.9% 99.8% 99.8% 8 15 19 0% 0% 0%
594 Lakewood-Seattle 45% 20% 9% 80% 78% 77% 99.8% 99.7% 99.8% 7 10 8 1% 0% 0%
595 Gig Harbor-Seattle 32% 13% 6% 79% 74% 77% 99.8% 99.8% 99.7% 27 32 12 0% 0% 0%
596 Bonney Lake-Sumner 18% 9% 2% 82% 82% 84% 100.0% 100.0% 99.9% 4 20 12 0% 0% 0%
ST Express System Total 38% 13% 9% 81% 81% 83% 99.8% 99.8% 99.8% 9 10 9 1% 1% 1%
Sound Transit District Total 38% 12% 10%
Table 14: Service Quality by Route

39 | SOUND TRANSIT 2019 SERVICE IMPLEMENTATION PLAN
DRAFT Sound Transit monitors key performance indicators on each of its routes to identify trends overtime and areas for improvement. Table 14: Service Quality by Route shows an example of how these metrics are evaluated. Red indicates relatively poor performance for that metric, while green indicates relatively good performance. Certain trends emerge from this analysis:
Many routes in South King county and Pierce county with high Title VI populations also have the poorest OTP, in part due to the corridors on which they are located. The 2019 service plan identifies some of these routes for reliability investments.
Overcrowding occurs on many Title VI routes, such as Route 550, and 580, but metrics have mostly improved since 2017. Non-Title VI routes with overcrowding include Route 545 and 522.
Customer complaint rates are highest on many Title VI routes, including Route 567 and 592, as well as Route 555, a non-Title VI route.
Routes with the poorest metric of Trips Operated are split between Title VI and non-Title VI routes. This metric largely depends on the operating partner, whose bus and operator constraints and policies on missed trips dictate which trips are not delivered on a given day.

40
SERVIC
E EQU
ITY AN
ALYSIS
DRAFT This page intentionally left blank

41 | SOUND TRANSIT 2019 SERVICE IMPLEMENTATION PLAN
DRAFT
NEW RECORD IN 2017
Sound Transit, with its two light rail lines, two commuter rail lines, and 28 express bus routes, serves as an integral part of the regional transit system in Central Puget Sound. In 2017, ridership on Sound Transit services hit a new record, with 47 million boardings on our trains and buses. Several factors contributed to the 2017 ridership results, with these factors continuing to influence 2018 ridership.
Link Light Rail Growth
Ridership on Link light rail continued to grow in 2017, spurred by the opening of University Link as well as Angle Lake Station in 2016. Additional use during special events pushed ridership up past 2016 levels.
New Sounder Trips
Two new sounder trips on the South line resulted in increased ridership on Sounder as well as ST Express Routes 580 and 596 which connect to Sounder at Puyallup and Sumner stations.
Regional Traffic Congestion & Construction
Congestion resulted in shifts in ridership, with some choosing to take Link and Sounder rather than ST Express on routes that parallel I-5. Additional construction impacts for East Link resulted in declining ST Express ridership on Routes 545 and 550.
Tacoma Link Events
The year 2017 saw a return of the Festival of Sail event which drew large crowds on Tacoma Link. Additional events at the Tacoma Dome such as Garth Brooks resulted in increased event ridership on Tacoma Link.
RIDERSHIP How many people used Sound Transit?
System Overview
ST Express Bus
18.4mSounder
Commuter Rail 4.4m
Tacoma Link 1.0m
Link Light Rail
23.0m

42
RID
ERSH
IP DRAFT
ST EXPRESS
ST Express bus ridership was neutral over the past several years due to increasing congestion as well as the closure of several park-and-rides to facilitate the Link system expansion. Ridership in 2018 is expected to be slightly down from 2018 as a result of the closure of the Rainier Freeway Station for East Link construction as well as additional congestion.
SOUNDER
Sounder growth has been driven by additional trips that were implemented in September 2016 and 2017, adding three new round trips on the south line. This growth is anticipated to continue in 2018.
TACOMA LINK
Tacoma Link had ridership increases compared to prior years due to the Festival of Sail which drew large crowds in 2017 as well as larger attendance special events at the Tacoma Dome such as the three day Garth Brooks shows, which drew crowds on Tacoma Link. Ridership estimates for Tacoma Link in 2018 are down due to the extended closure of the Tacoma Dome for renovations.
LINK LIGHT RAIL
Link ridership was up in 2017 which reflected the first full year of operation of the University Link and Angle Lake extensions to the system. Ridership has been robust and continues to grow in 2018, spurred by passengers avoiding congestion as well as special events.
Ridership by mode
11.5
19.123.0 24.5
2015 2016 2017 2018E
18.3 18.5 18.4 18.2
2015 2016 2017 2018E
0.97 0.94 0.97 0.90
2015 2016 2017 2018E
3.9 4.3 4.4 4.7
2015 2016 2017 2018E

43 | SOUND TRANSIT 2019 SERVICE IMPLEMENTATION PLAN
DRAFT
ST Express Ridership
0
10,000
20,000
30,000
40,000
50,000
60,000
70,000
Aver
age W
eekd
ay B
oard
ings b
y Mon
th
ST EXPRESS WEEKDAY RIDERSHIP
this section. In general, ridership on ST Express buses is lower in the December holiday season and highest during the summer months. This section’s analysis will look at ridership by time of day, corridor and route level. Stop-level ridership can be found in the facility maps later in this section as well as in the Appendix.
ST Express bus ridership has recovered since the Great Recession of the late 2000s, but more recently has seen stagnating ridership growth, even with additional hour investments over the past several years. In the past year, ridership has begun to slowly decline rather than grow, which is a result of several factors that will be discussed further in
Figure 21: Average Weekday ST Express Ridership, 2009-2018

44
RID
ERSH
IP DRAFT
RIDERSHIP BY TIME OF DAY
Weekday ridership has two distinct peaks corresponding with commute periods. PM peak ridership is higher and less spread out compared to the morning peak, a reflection of different morning departure times based on distance traveled but consistent departure times from job centers.
Weekend ridership is steady during the day, with Saturday ridership higher than Sunday ridership. On both weekdays and weekends, ridership has a slight peak at 4pm, which is likely the result of events ending around that time.
0
1,000
2,000
3,000
4,000
5,000
6,000
7,000
2 AM
4 AM
6 AM
8 AM
10 A
M
12 P
M
2 PM
4 PM
6 PM
8 PM
10 P
M
12 A
M
Wee
kday
Hou
rly R
ider
ship
0
1,000
2,000
3,000
4,000
5,000
6,000
7,000
2 AM
4 AM
6 AM
8 AM
10 A
M
12 P
M
2 PM
4 PM
6 PM
8 PM
10 P
M
12 A
M
Wee
kend
Hou
rly R
ider
ship
Saturday Sunday
Figure 22: Weekday ST Express Ridership by Hour, Spring 2018
Figure 23: Weekend ST Express Ridership by Hour, Spring 2018

45 | SOUND TRANSIT 2019 SERVICE IMPLEMENTATION PLAN
DRAFT
Largest ridership corridors in the Sound Transit District connect Seattle to East King County. Both the SR 520 corridor and the I-90 corridor have over 14,000 boardings a day. These buses have service during peak periods of every 5 to 7 minutes and provide a fast connection across Lake Washington. I-5 North and I-5 South (Pierce and King) together form the next strongest corridors in the Sound Transit system. I-405 corridors from Bellevue to Snohomish and South King County are commute oriented, with peak service having higher ridership compared to the all-day, all week service.
Sounder connectors provide connections between park-and-rides in Pierce County to Sumner and Puyallup stations. The park-and-rides are approaching capacity, resulting in limited ridership growth once those spots are filled.
Ridership by Route
580
586
574
560
550
540
532
522
510
596
590
577
566
554
541
535
511
592
578
567
542
512
594
545
513
595
555 556
0 2,000 4,000 6,000 8,000 10,000 12,000 14,000
Sounder
I-5 S Pierce
I-5 S King
I-405 S
I-90
SR 520
I-405 N
SR 522
I-5 N
Average Weekday Boardings
Figure 24: ST Express Ridership by Corridor
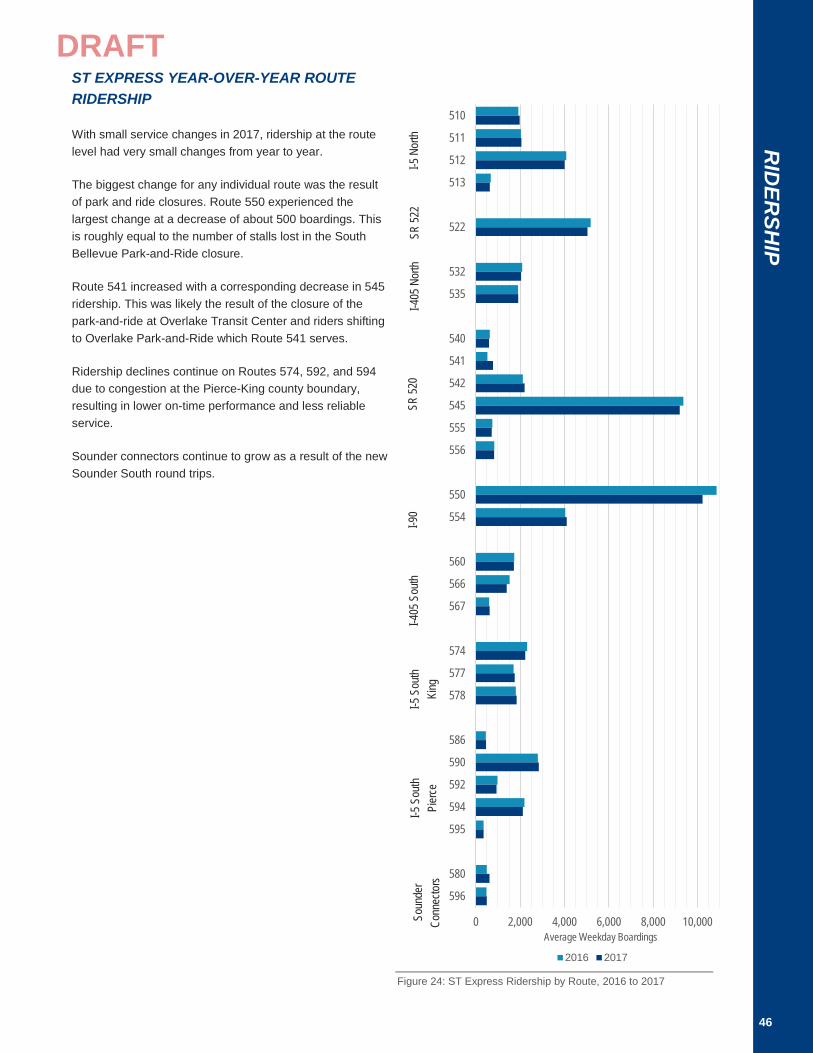
46
RID
ERSH
IP DRAFT
ST EXPRESS YEAR-OVER-YEAR ROUTE RIDERSHIP
With small service changes in 2017, ridership at the route level had very small changes from year to year.
The biggest change for any individual route was the result of park and ride closures. Route 550 experienced the largest change at a decrease of about 500 boardings. This is roughly equal to the number of stalls lost in the South Bellevue Park-and-Ride closure.
Route 541 increased with a corresponding decrease in 545 ridership. This was likely the result of the closure of the park-and-ride at Overlake Transit Center and riders shifting to Overlake Park-and-Ride which Route 541 serves.
Ridership declines continue on Routes 574, 592, and 594 due to congestion at the Pierce-King county boundary, resulting in lower on-time performance and less reliable service.
Sounder connectors continue to grow as a result of the new Sounder South round trips.
0 2,000 4,000 6,000 8,000 10,000
510
511
512
513
522
532
535
540
541
542
545
555
556
550
554
560
566
567
574
577
578
586
590
592
594
595
580
596
Average Weekday Boardings
2016 2017
Soun
der
Conn
ector
s I-5
Sou
th
Pier
ce
I-5 S
outh
Ki
ng
I-405
Sou
th
I-90
SR 52
0 I-4
05 N
orth
I-5
Nor
th
Figure 24: ST Express Ridership by Route, 2016 to 2017
SR 52
2

47 | SOUND TRANSIT 2019 SERVICE IMPLEMENTATION PLAN
DRAFT
September 2017 marked the most recent Sound Transit service expansion on Sounder south line by implementing two new round trips and adding five cars to the mid-day train to make all south line trains 7-cars.
These service changes have resulted in significant ridership gains over the past year. In the second quarter of 2018, average weekday boardings northbound increased by 442 passengers and southbound increased by 401 passengers. Q1 2018 year-over-year (YOY) growth was abnormally high due to decreased Q1 2017 ridership from the Tacoma Trestle project.
-
2,000
4,000
6,000
8,000
10,000
12,000
14,000
16,000
18,000
Aver
age W
eekd
ay B
oard
ings b
y Mon
th
2 New Round Trips added Sep 2017
Mid-day Train added Sep 2016
New Sounder South Line Trips drive ridership growth
Service to Lakewood and South Tacoma Station Oct 2012
0
200
400
600
800
1,000
2017 Q4 2018 Q1 2018 Q2
Year-over-year Avg Weekday Boardings
Northbound Southbound
SOUNDER SOUTH WEEKDAY RIDERSHIP
Figure 26: Average Weekday Sounder South Ridership, 2001-2018

48
RID
ERSH
IP DRAFT
September 2016 Service Change
September 2017 Service Change
4:364:415:015:165:265:466:066:266:467:207:357:508:10
10:1610:1816:0616:3017:0017:15
North
boun
d
6:056:156:356:507:55
14:3214:3515:1215:1515:3515:4215:5516:1216:1516:3216:3516:5216:5517:1217:2017:4517:5018:2018:30
South
boun
d
4:364:415:015:165:265:466:066:266:467:207:357:508:10
10:1610:1816:0616:3017:0017:15
6:056:156:356:507:55
14:3214:3515:1215:1515:3515:4215:5516:1216:1516:3216:3516:5216:5517:1217:2017:4517:5018:2018:30
South Line Trip-Level Ridership
Rev
erse
Pea
k Tr
ips
Rev
erse
Pea
k Tr
ips
The majority of ridership growth occurred on peak trains. The two new round trips added in the September 2017 service change eased crowding on the early morning trains and added more evening trip options. The five added cars to the mid-day train also provided much needed capacity on the afternoon southbound train.
Figure 27: Sounder South Ridership by Trip

49 | SOUND TRANSIT 2019 SERVICE IMPLEMENTATION PLAN
DRAFT
South Line Station-Level Ridership Average weekday ridership by station. Oct 2016 – Sep 2017 represents data before the September 2017 service change and Oct 2017 – Jun 2018 reflects data after the change.
Figure 28: Sounder South Ridership by Station

50
RID
ERSH
IP DRAFT

51 | SOUND TRANSIT 2019 SERVICE IMPLEMENTATION PLAN
DRAFT
Northbound Boardings
On which trains did growth occur?
Southbound Alightings
Train YOY Growth Northbound Peak 301 Northbound Midday 30 Northbound Reverse 111 Southbound Peak 292 Southbound Midday 42 Southbound Reverse 66
Peak Direction Travel Patterns
About 60% of northbound boardings occur at Puyallup, Auburn, and Kent stations, each totaling roughly 19%.
More riders alight at Kent, Auburn, and Tacoma in the afternoon than board in the morning, which seems to indicate an alternative mode choice for their morning commute.
Figure 29: Sounder South Ridership by Station
Table 15: Ridership Growth on Sounder South by Time of Day

52
RID
ERSH
IP DRAFT
What percentage of Sounder South riders take a bus to get to the station?
What connections do Sounder riders make once they get downtown?
Of the transfers that occur downtown, how many transfers are in the tunnel vs. street level?
What buses do Sounder South riders take to get to the station?
Route Percent Sound Transit Route 580 26% Sound Transit Route 596 25% Pierce Transit Route 497 11% Pierce Transit Route 400 6% King County Metro Route 180 5% King County Metro Route 186 3% Other 24%
What buses do Sounder riders transfer to downtown?
Route Percent King County Metro Route 40 7% Sound Transit Route 545 6% Sound Transit Route 590 5% Sound Transit Route 567 4% Sound Transit Route 512 4% King County Metro Route 150 4% Sound Transit Route 550 4% Kent County Metro Route 70 4% King County Metro Route 255 3% King County Metro Route 5 3% King County Metro Route 212 3% Other 53%
When Sounder riders transfer downtown it’s pretty evenly split where riders catch their transfer - about one third catch their transfer on 3rd Avenue, one third on 4th Avenue, and one third in the downtown Seattle transit tunnel.
Bus12%
April 2017
Bus14%
April 2018
Link12%
Bus32%
Streetcar1%
Other/ None55%
April 2017
Link14%
Bus31%
Streetcar1%
Other/ None53%
April 2018
Surface, 3rd Ave
32%
Surface, 4th Ave
29%
Tunnel, Bus 16%
Tunnel, Link 14%
Other 9%
Sounder Connections
Figure 30: Transfer Patterns to Sounder South
Figure 31: Transfer Patterns from Sounder South
Figure 32: Transfer Locations at King Street from Sounder South

53 | SOUND TRANSIT 2019 SERVICE IMPLEMENTATION PLAN
DRAFT
Sounder north line ridership has grown over the past 10 years, but more recently has remained fairly stable, as shown in the graph below. Major dips in average weekday ridership are due to mudslide activity which shuts down tracks for a minimum of 48 hours after the incident.
0
500
1,000
1,500
2,000
2,500
Aver
age W
eekd
ay B
oard
ings b
y Mon
thSounder North Line
SOUNDER NORTH LINE WEEKDAY RIDERSHIP
Figure 33: Average Weekday Sounder North Ridership, 2009-2018

54
RID
ERSH
IP DRAFT
TRIP ANALYSIS
Service most recently changed in February 2018, where consists of 2 and 3 cars was altered to reflect more recent ridership patterns of higher ridership on the later two cars. After the change, no major changes in ridership patterns have been observed.
STATION LEVEL ANALYSIS
Average weekday ridership by station. Oct 2016 – Sep 2017 represents data before the September 2017 service change and Oct 2017 – Jun 2018 reflects data after the change. February 2018 ridership declines are due to mudslides. Growth has only been observed at Mukilteo Station most recently.
050
100150200250300
4:05 PM 4:33 PM 5:05 PM 5:35 PM
1700 1702 1704 1706
Avg
Wee
kday
Boa
rdin
gs
Sounder North Northbound
Q2 2017 Q2 2018
050
100150200250300
5:45 AM 6:15 AM 6:45 AM 7:15 AM
1701 1703 1705 1707
Avg
Wee
kday
Boa
rdin
gs
Sounder North Southbound
Q2 2017 Q2 2018
- 50
100 150 200 250 300 350 400 450
Oct Nov Dec Jan Feb Mar Apr May Jun Jul Aug Sep
Everett
- 50
100 150 200 250 300 350 400 450 500
Oct Nov Dec Jan Feb Mar Apr May Jun Jul Aug Sep
Edmonds
- 20 40 60 80
100 120 140 160 180 200
Oct Nov Dec Jan Feb Mar Apr May Jun Jul Aug Sep
Mukilteo
- 100 200 300 400 500 600 700 800 900
1,000
Oct Nov Dec Jan Feb Mar Apr May Jun Jul Aug Sep
King Street Station
Figure 34: Sounder North Ridership by Train, 2017-2018
Figure 35: Sounder North Ridership by Station, 2017-2018

55 | SOUND TRANSIT 2019 SERVICE IMPLEMENTATION PLAN
DRAFT
CONTINUED RIDERSHIP GROWTH
Ridership is up year-over-year. Continued growth even though there have been no system expansion over the last year. Ridership peaks in the summer and is lower during the winter months. University Link more than doubled ridership in 2016, with 2018 ridership projected to be about 6 percent higher than that in 2017.
0
10,000
20,000
30,000
40,000
50,000
60,000
70,000
80,000
90,000
Aver
age W
eekd
ay B
oard
ings b
y Mon
th
March 2018 -University Link opens
September 2018 -Angle Lake opens
Link Ridership
LINK LIGHT RAIL WEEKDAY RIDERSHIP
Figure 36: Average Weekday Link Ridership, 2009-2018

56
RID
ERSH
IP DRAFT
Special Events & Ridership
Special Events such as sporting events (Mariners, Seahawks, Sounders) or major conventions (Bumbershoot, SakuraCon, Emerald City ComiCon, PAX West) are major draws to ridership. Certain weekend days can have ridership increases of up to 50 percent from a regular day!
Weekday Ridership by Time of Day
Ridership has grown in 2018 compared to 2017. This ridership growth has occurred primarily in the peak periods as well as in the evening when Mariners games end. The Mariners promotion in spring 2018 allowed ticket holders to ride Link for free from 3 hours prior to game start time through the end of the service day. This potentially explains the higher PM peak ridership gain compared to the AM peak gain. Early morning, midday, and late evening ridership has been consistent compared to the prior year.
Peak period, peak direction trains are routinely at capacity, and ridership growth will likely plateau for trips during these time periods until additional train cars are available to be placed in service. This will likely not occur until the Northgate extension in 2021.
Saturday Ridership by Time of Day
Saturday ridership in the second quarter of 2018 averaged 56,700 boardings, a slight increase over 2017. This growth is driven by sporting events primarily, with the Mariners promotion likely drawing additional crowds onto Link. Ridership grew during the midday and early afternoon hours, coinciding with the start and end time of daytime sporting events.
Sunday Ridership by Time of Day
Sunday ridership in the second quarter of 2018 averaged 44,600. As with Saturday ridership, Sunday ridership has grown in 2018 during the midday and early afternoon hours. These ridership gains likely correspond to sporting event times.
0
1,000
2,000
3,000
4,000
5,000
6,000
7,000
8,000
9,000
4 AM
6 AM
8 AM
10 A
M
12 P
M
2 PM
4 PM
6 PM
8 PM
10 P
M
12 A
M
Wee
kday
Hou
rly R
ider
ship
2017 2018
0
1,000
2,000
3,000
4,000
5,000
6,000
7,000
8,000
9,000
4 AM
6 AM
8 AM
10 A
M
12 P
M
2 PM
4 PM
6 PM
8 PM
10 P
M
12 A
M
Satu
rday
Hou
rly R
ider
ship
2017 2018
0
1,000
2,000
3,000
4,000
5,000
6,000
7,000
8,000
9,000
4 AM
6 AM
8 AM
10 A
M
12 P
M
2 PM
4 PM
6 PM
8 PM
10 P
M
12 A
M
Sund
ay H
ourly
Rid
ersh
ip
2017 2018
Figure 39: Sunday Link Ridership by Time of Day, Spring 2017 to Spring 2018
Figure 38: Saturday Link Ridership by Time of Day, Spring 2017 to Spring 2018
Figure 37: Weekday Link Ridership by Time of Day, Spring 2017 to Spring 2018

University of Washington
Pioneer Square
Beacon Hill
Rainier Beach
Capitol Hill
International District/Chinatown
Mt Baker
Tukwila/International Blvd
Westlake
Stadium
Columbia City
SeaTac Airport
University St
SODO
Othello
Angle Lake
9,942
7,365
11,410
5,638
4,306
5,780
2,113
2,250
2,830
2,471
2,631
2,544
1,975
2,934
5,872
3,566
10,517
7,837
12,179
5,872
4,317
6,308
2,136
2,354
2,890
2,482
2,654
2,665
2,263
3,104
6,031
3,967
Q2 2017 WeekdayQ2 2018 Weekday
57 | SOUND TRANSIT 2019 SERVICE IMPLEMENTATION PLAN
DRAFTLINK BOARDING BY STATION
Weekday Boardings and alightings – Compare 2017 vs 2018 Q2 to Q2.
All stations experienced ridership growth, with the largest growth occurring at Westlake, International District, and UW Stations, each gaining over 500 passengers per day.
Nearly a quarter of boardings are on the University Link segment. An additional thousand passengers boarded a Link train on this extension over 2017, accounting for a quarter of the ridership growth.
Another third of Link boardings occur in downtown Seattle. Ridership here is heavily dependent on bus frequency and reliability in the tunnel.
Stadium and SODO stations had little change in ridership.
12 percent of boardings occur in the Rainier Valley. Most ridership growth in the Rainier Valley occurred at Rainier Beach station.
Figure 40: Link Ridership by Station, Spring 2017 to Spring 2018

58
RID
ERSH
IP DRAFT
RIDERSHIP HIGHLY VARIABLE
Ridership on Tacoma Link is heavily dependent on special events in the Tacoma Dome to drive ridership. Special events can draw an additional 1,000-2,000 boardings compared to a regular weekday. Overall, without special events, Tacoma Link has an average weekday ridership of around 3,000 passengers. By time of day, as seen on the right, ridership is fairly consistent across the day without a specific peaking phenomenon. Ridership is heavily correlated with school times at UW Tacoma, with certain trips experiencing much heavier ridership compared to adjacent trips. Saturday ridership is roughly half that of weekday ridership, and Sunday ridership, with service every 24 minutes, is half that of Saturday ridership.
Tacoma Link Ridership
0
500
1,000
1,500
2,000
2,500
3,000
3,500
4,000
4,500
Aver
age W
eekd
ay B
oard
ings b
y Mon
th
TACOMA LINK WEEKDAY RIDERSHIP
0
50
100
150
200
250
300
350
5 AM
6 AM
7 AM
8 AM
9 AM
10 A
M11
AM
12 P
M1
PM2
PM3
PM4
PM5
PM6
PM7
PM8
PM9
PM10
PM
Hou
rly R
ider
ship
Weekday Saturday Sunday
Figure 42: Average Weekday Tacoma Link Ridership, 2009-2018
Figure 41: Tacoma Link Ridership by Hour, Spring 2018

550 648Total 648
Convention Place KCM: 41, 74, 101, 102, 150, 255
1
Link 11,465Total 17,429
Westlake Hub KCM (Tunnel): 41, 74, 101, 102, 150, 255
2
594 232595 21
590 197592 79
577 299578 371
550 1,718554 257
522 613545 1,093
512 510513 65
510 254511 255
550 984Link 5,663
Total 6,647
University Street KCM (Tunnel): 41, 74, 101, 102, 150, 255
3
550 608Link 4,323
Total 4,931
Pioneer Square KCM (Tunnel): 41, 74, 101, 102, 150, 255
4
South 6,751Total 17,415
King St/Int’l Dist Hub KCM (Tunnel): 41, 74, 101, 102, 150, 255
5
Link 5,799North 795
590 217592 22
577 61578 145
550 1,145554 618
522 377545 591
512 465513 28
510 128511 115
594 136595 23
522 55545 91590 55
Link 2,353Total 2,671
Stadium
594 111595 6
6KCM: 101, 102, 150, 177, 178, 190
550 298554 108
Total 406
Rainier Fwy Station KCM (Fwy Level): 111, 114, 212, 214, 216,
217, 218, 219, 630KCM (Street Level): 7, 9, 106
7
1
2
3
4
5
6
7
5th Avenue
4th Avenue
3rd Avenue
2nd Avenue
Yesler Way
S Jackson St
Stewart
StHowell S
tOlive Way
Pine St
Pike St
Union St
University St
Seneca St
59 | SOUND TRANSIT 2019 SERVICE IMPLEMENTATION PLAN
DRAFTBoardings in Downtown Seattle
Figure 43: Boardings in Downtown Seattle

0 2 41Miles
511 291 512 341 532 357
Total 989
Ash Way
532 336 535 143
Total 479
Canyon Park
511 430 512 638 535 303
Total 1,371
Lynnwood TC
511 237 512 186 513 134
Total 557
Mountlake Terrace
510 366 512 164 532 123
Total 653
South Everett
8
1,370 spaces 100%
877 spaces 100%
1,019 spaces 100%
100%
302 spaces
397 spaces
97%
163 NorthTotal 163
Mukilteo Station63 spaces 100%
370 NorthTotal 370
Edmonds Station 259 spaces 87%
510 594 512 479 532 146 North 306
Total 1,525
Everett Station1,107 spaces 83%
CT: 113, 417, 880 ET: 18, 70
CT: 107, 112, 113, 115, 116, 120, 130, 201, 202, 402, 421, 422, 425, 810, 821, 855
CT: 116, 130, 196, 416
CT: 111, 112, 119, 130, 410, 413, 415,435, 810, 871 KCM: 347
CT: Swift Blue, 201, 202, 270, 271, 280ET: 3, 4, 6, 7, 8, 17, 18, 29 Skagit: 90X IT: 412X
ET: 29
CT: 109, 112, 115, 116, 119, 196, 201, 202, 410, 413, 415, 810, 860, 880KCM: 952 CT: 105, 106, 120, 435
KCM: 952
2
5
6
7
1
3
4
4
3
1
2
56
7
8
MOUNTLAKETERRACE
LYNNWOOD
EDMONDS
MUKILTEO EVERETT
CANYON PARK
60
RID
ERSH
IPDRAFTBoardings at Snohomish County Facilities
Figure 44: Boardings at Snohomish County Facilities
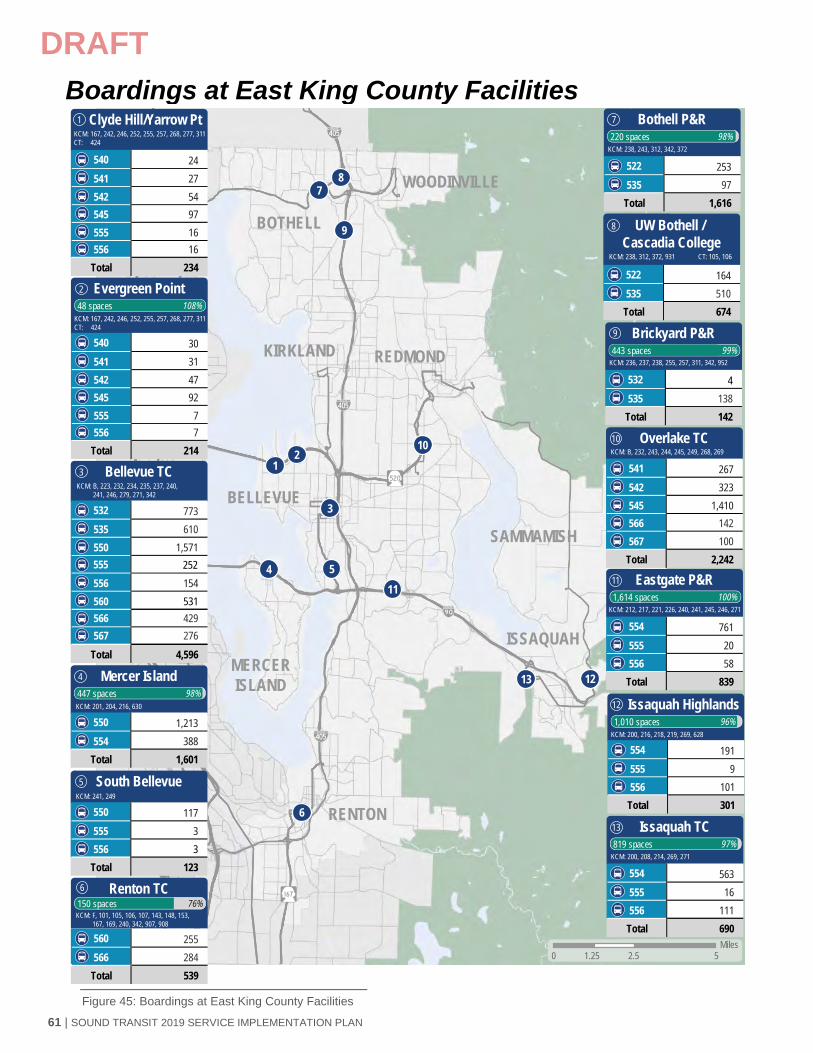
61 | SOUND TRANSIT 2019 SERVICE IMPLEMENTATION PLAN
DRAFTBoardings at East King County Facilities
0 2.5 51.25Miles
3
13
10
6
411
12
7
9
12
5
8
ISSAQUAH
BELLEVUE
REDMOND
MERCERISLAND
SAMMAMISH
KIRKLAND
BOTHELL
WOODINVILLE
RENTON
554 191 555 9 556 101
Total 301
Issaquah Highlands
554 563555 16556 111
Total 690
Issaquah TC
550 1,213 554 388
Total 1,601
Mercer Island
560 255 566 284
Total 539
Renton TC150 spaces 76%
550 117 555 3 556 3
Total 123
South Bellevue
522 164 535 510
Total 674
UW Bothell / Cascadia College
541 267 542 323 545 1,410
Total 2,242
Overlake TC
566 142 567 100
540 24 541 27 542 54
556 16 Total 234
Clyde Hill/Yarrow Pt
545 97 555 16
540 30 541 31 542 47
556 7 Total 214
Evergreen Point48 spaces 108%
545 92 555 7
522 253 535 97
Total 1,616
Bothell P&R
532 773 535 610 550 1,571
566 429
Total 4,596
Bellevue TC
556 154 560 531
567 276
532 4 535 138
Total 142
Brickyard P&R443 spaces 99%
554 761 555 20 556 58
Total 839
Eastgate P&R1,614 spaces 100%
447 spaces 98%
819 spaces 97%
1,010 spaces 96%
220 spaces 98%
1
2
3
4
5
6
7
8
9
10
11
12
13
KCM: F, 101, 105, 106, 107, 143, 148, 153, 167, 169, 240, 342, 907, 908
KCM: 238, 312, 372, 931 CT: 105, 106
KCM: 238, 243, 312, 342, 372
KCM: 236, 237, 238, 255, 257, 311, 342, 952
KCM: B, 223, 232, 234, 235, 237, 240, 241, 246, 279, 271, 342
KCM: 212, 217, 221, 226, 240, 241, 245, 246, 271
KCM: 200, 216, 218, 219, 269, 628
KCM: 200, 208, 214, 269, 271
KCM: B, 232, 243, 244, 245, 249, 268, 269
KCM: 241, 249
KCM: 201, 204, 216, 630
KCM: 167, 242, 246, 252, 255, 257, 268, 277, 311CT: 424
KCM: 167, 242, 246, 252, 255, 257, 268, 277, 311CT: 424
555 252
Figure 45: Boardings at East King County Facilities

63 | SOUND TRANSIT 2019 SERVICE IMPLEMENTATION PLAN
DRAFTBoardings at Pierce County Facilities
LAKEWOOD
DUPONT
TACOMA
PUYALLUP
SUMNER
BONNEYLAKE
580 12 592 220 594 127 South 449
Total 808
Lakewood Station600 spaces 90%
578 130 580 406
1,681 South Total 2,217
Puyallup Station364 spaces 100%
574 182 580 7 592 128 594 119
Total 436
SR 512 P&R493 spaces 94 % 578 66
596 312 South 1,331
Total 1,709
Sumner Station350 spaces 101%
574 413 586 220 590 1,318
T-Link 956 Total 4,485
Tacoma Dome2,337 spaces 100%
590 53 594 121 T-Link 651
Total 825
Union Station / S 19th
South 326 Total 326
South Tacoma Station77 spaces 83%
594 392 South 1,186
3
PT: 1, 41, 42, 102, 500, 500, 501
PT: 3
PT: 3, 4
PT: 13, 41, 42, 102, 400, 500, 501ICT: 612
PT: 400, 402, 409, 425
1
2
3
4
5
6
7
ICT: 612, 620
1
2 7
4
5
6
108
9
580 177 Total 177
Puyallup Red Lot219 spaces 98%
PT: 402
8
580 151 Total 151
South Hill P&R354 spaces 77%
PT: 402
9
596 293 Total 293
Bonney Lake P&R356 spaces 95%
10
Figure 47: Boardings at Pierce County Facilities
* Reflects September 2018 Service Change.

BURIEN
SEATAC
TUKWILA
KENT
AUBURNFEDERALWAY
0 421Miles
566 101 578 226 South 1,695
Total 2,022
Auburn Station746 spaces 100%
574 618 577 1,021 578 401
2,040 Total
Federal Way TC
566 200 567 317
South 1,974 Total 2,491
Kent Station996 spaces 100%
560 355 574 731 Link 5,792
Total 6,878
SeaTac Airport / Link
1,190 spaces 99%
Link 3,793 Total 3,793
Angle Lake
Link 3,003 Total 3,003
Tukwila/Int’l Blvd
98%1160 spaces
662 spaces 99%1
3
4
2
5
76
8
566 45 Total 45
Auburn P&R244 spaces 62%
KCM: A, F, 124, 128
990 SouthTotal 990
Tukwila Station390 spaces 91%
KCM: F, 154
2
KCM: A, 124, 156, 180
KCM: A, 635
KCM: A, 179, 181, 182, 183, 187, 193, 197, 901, 903PT: 402, 500, 501
KCM: 150, 153, 158, 159, 164, 166, 168, 169, 180, 183, 913, 914, 916, 952
KCM: 180, 181, 186, 910, 915, 917PT: 497
KCM: 180, 952
1
3
4
6
5
7
8
62
RID
ERSH
IPDRAFTBoardings at South King County Facilities
Figure 46: Boardings at South King County Facilities

64
RID
ERSH
IP DRAFT
Ridership Expected to Increase to 95 Million
Sound Transit estimates ridership for all its modes on an annual basis for inclusion in the Service Implementation Plan and the annual agency budget. Estimates are based on including historical ridership data, fuel prices, employment and other inputs developed by Sound Transit or the Puget Sound Regional Council (PSRC). Figure 48 and Table 15 show the system-wide annual ridership as well as the year-over-year ridership growth.
By 2024, Sound Transit expects to carry over 95 million passengers on an annual basis, which is double 2017 ridership. On the average weekday over 256,000 passengers will board trains and express buses. Below are some highlights at the modal level:
With the conversion of ST Express routes to light rail as well as worsening regional congestion, ST Express ridership is projected to decrease by 18 percent through 2024.
Tacoma Link ridership is projected to double as a result of the opening of the Hilltop Extension.
Sounder is anticipated to continue growing at the current ridership growth rate as new parking garages along the north and south lines open.
Link ridership growth will drive most of Sound Transit’s ridership growth with the opening of extensions to Northgate, Bellevue, Overlake, Federal Way and Downtown Redmond. Ridership is expected to more than triple between 2017 and 2024.
Why Ridership is Growing
Ridership in the upcoming years will occur primarily on Link. In 2019, with the conversion of the Downtown Seattle Transit Tunnel to a rail-only operation, passengers who normally used the first transit option available will now likely choose Link. Link extensions in the future north, south and east will continue to drive ridership growth on Sound Transit trains.
YEAR ANNUAL AVERAGE WEEKDAY
2017 Actual 46,885,799 156,002 2018 Estimated 48,280,000 157,000 2019 Estimated 52,260,000 160,000 2020 Estimated 53,350,000 171,000 2021 Estimated 57,960,000 176,000 2022 Estimated 71,330,000 191,000 2023 Estimated 80,570,000 231,000 2024 Estimated 95,690,000 256,000
Ridership Outlook 2019-2024
2.7% 8.2% 2.1% 8.6%23.1%
13.0%
18.8%
0102030405060708090
100
2017 2018 2019 2020 2021 2022 2023 2024
SYSTEM-WIDE ESTIMATED ANNUAL BOARDINGS
Table 16: Sound Transit System-Wide Ridership 2017-2024
Figure 48: Estimated Sound Transit System-Wide Ridership 2017-2024

65 | SOUND TRANSIT 2019 SERVICE IMPLEMENTATION PLAN
DRAFT
YEAR ANNUAL AVERAGE WEEKDAY
2017 Actual 18,374,834 63,963 2018 Estimated 18,170,000 63,700 2019 Estimated 17,980,000 62,900 2020 Estimated 17,510,000 61,000 2021 Estimated 17,330,000 60,000 2022 Estimated 17,300,000 59,700 2023 Estimated 16,740,000 57,600 2024 Estimated 15,140,000 52,200
YEAR ANNUAL AVERAGE WEEKDAY
2017 Actual 972,998 3,239 2018 Estimated 900,000 3,200 2019 Estimated 1,000,000 3,400 2020 Estimated 1,000,000 3,500 2021 Estimated 1,100,000 3,600 2022 Estimated 1,400,000 4,900 2023 Estimated 1,700,000 5,800 2024 Estimated 2,000,000 6,700
YEAR ANNUAL AVERAGE WEEKDAY
2017 Actual 4.445.568 17,217 2018 Estimated 4,650,000 17,600 2019 Estimated 4,810,000 18,200 2020 Estimated 4,970,000 18,800 2021 Estimated 5,140,000 19,400 2022 Estimated 5,310,000 20,100 2023 Estimated 5,490,000 20,700 2024 Estimated 5,670,000 21,400
YEAR ANNUAL AVERAGE WEEKDAY
2017 Actual 23,002,263 71,583 2018 Estimated 24,500,000 76,000 2019 Estimated 28,400,000 88,000 2020 Estimated 29,800,000 93,000 2021 Estimated 34,300,000 107,000 2022 Estimated 47,200,000 147,000 2023 Estimated 56,500,000 176,000 2024 Estimated 72,700,000 227,000
23.0 24.528.4 29.8
34.3
47.2
56.5
72.7
0
10
20
30
40
50
60
70
2017 2018 2019 2020 2021 2022 2023 2024
Annu
al B
oard
ings
(milli
ons)
LINK
Table 17: ST Express Boardings 2017-2024
Table 18: Tacoma Link Boardings 2017-2024
Table 19: Sounder Boardings 2017-2024
4.4 4.7 4.8 5.0 5.1 5.3 5.5 5.7
0
1
2
3
4
5
6
2017 2018 2019 2020 2021 2022 2023 2024
Annu
al B
oard
ings
(milli
ons)
SOUNDER
1.0 0.9 1.0 1.0 1.11.4
1.72.0
0
0.5
1
1.5
2
2.5
2017 2018 2019 2020 2021 2022 2023 2024
Annu
al B
oard
ings
(milli
ons)
TACOMA LINK
18.4 18.2 18.0 17.5 17.3 17.3 16.715.1
02468
101214161820
2017 2018 2019 2020 2021 2022 2023 2024
Annu
al B
oard
ings
(milli
ons)
ST EXPRESS
Table 20: Link Boardings 2017-2024

66
RID
ERSH
IP DRAFT
This page intentionally left blank.
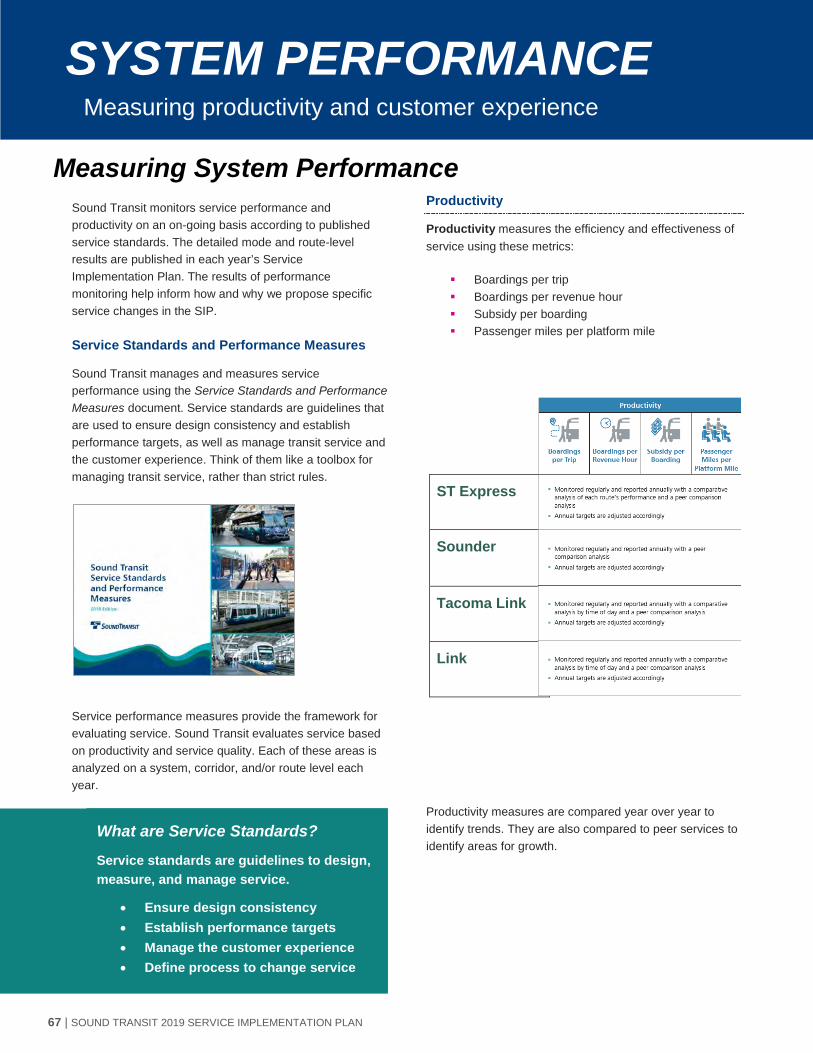
67 | SOUND TRANSIT 2019 SERVICE IMPLEMENTATION PLAN
DRAFT
Sound Transit monitors service performance and productivity on an on-going basis according to published service standards. The detailed mode and route-level results are published in each year’s Service Implementation Plan. The results of performance monitoring help inform how and why we propose specific service changes in the SIP.
Service Standards and Performance Measures
Sound Transit manages and measures service performance using the Service Standards and Performance Measures document. Service standards are guidelines that are used to ensure design consistency and establish performance targets, as well as manage transit service and the customer experience. Think of them like a toolbox for managing transit service, rather than strict rules.
Service performance measures provide the framework for evaluating service. Sound Transit evaluates service based on productivity and service quality. Each of these areas is analyzed on a system, corridor, and/or route level each year.
Productivity
Productivity measures the efficiency and effectiveness of service using these metrics:
Boardings per trip Boardings per revenue hour Subsidy per boarding Passenger miles per platform mile
Productivity measures are compared year over year to identify trends. They are also compared to peer services to identify areas for growth.
ST Express
Sounder
Tacoma Link
Link
SYSTEM PERFORMANCE Measuring productivity and customer experience
Measuring System Performance
What are Service Standards?
Service standards are guidelines to design, measure, and manage service.
• Ensure design consistency • Establish performance targets • Manage the customer experience • Define process to change service

68
SYSTEM PER
FOR
MA
NC
E DRAFT
Service Quality
Service Quality measures the passenger experience based on:
Passenger load On-time performance Customer complaints per 100,000 boardings Percentage of trips operated as scheduled
Key Findings
ST Express has declined for three of the four productivity metrics in the past year, which is likely a reflection of declining ridership.
ST Express will need to evolve to improve reliability as well as loading concerns
Sounder loads have decreased with the addition of new train cars, an improvement from overcrowding.
Link loads continue to be high, even with the additon of cars during peak periods.
ST Express
Sounder
Tacoma Link
Link

69 | SOUND TRANSIT 2019 SERVICE IMPLEMENTATION PLAN
DRAFT
Boardings per Trip
Boardings per Trip is the number of passenger boardings for each scheduled one-way trip. The decreased Sounder boardings per trip may be partially attributed to new trips added in 2017, which reduced overcrowding. ST Express boardings reflect decreases in ridership due to Link construction impacts. Ridership on Link continues to grow.
YEAR 2016 2017 EFFECT LINK 186.9 225.0 + SOUNDER 586.4 561.8 - TACOMA LINK 19.0 19.7 + ST EXPRESS 39.2 37.7 -
Boardings per Revenue Hour
Boardings per revenue hour is the number of passengers boarding a vehicle during one hour of scheduled revenue service, not including vehicle deadhead or layover time.
YEAR 2016 2017 EFFECT LINK 212 239.1 + SOUNDER 388 395 + TACOMA LINK 95.1 99.1 + ST EXPRESS 30.3 28.7 -
Subsidy per Boarding
Subsidy per Boarding is calculated by dividing the net cost of the service (cost minus fare revenue) by the number of passenger boardings in a full year. Lower costs reflect more efficient service as a result of more boardings, while the cost increase on ST Express points to a need to evaluate inefficient service.
YEAR 2016 2017 EFFECT LINK $2.78 $2.50 +
SOUNDER $7.61 $6.84 + TACOMA LINK $4.10 $3.97 + ST EXPRESS $4.30 $4.45 -
Passenger Miles per Platform Mile
The passenger miles per platform vehicle mile metric divides the miles traveled by all passengers on that mode by the number of vehicle platform miles (including deadhead and layover) travelled for a full year. Note that for trains, this metric is based on a train consist rather than individual train cars. While these metrics generally reflect ridership trends, the increase for ST Express may be due to more riders moving further away from Seattle and riding a longer distance.
YEAR 2016 2017 EFFECT LINK 63.7 72.2 + SOUNDER 338.0 325.9 - TACOMA LINK 10.8 10.9 + ST EXPRESS 14.9 15.4 +
PRODUCTIVITY
System Performance Monitoring by Mode overview
Table 21: Boardings per Trip by Mode, 2016 vs 2017
Table 22: Boardings per Rev. Hour by Mode, 2016 vs 2017
Table 23: Subsidy per Boarding by Mode, 2016 vs 2017
Table 24: Passenger Miles per Platform Mile by Mode, 2016 vs 2017

70
SYSTEM PER
FOR
MA
NC
E DRAFT
Passenger Load
Passenger load measures the number of total passengers on the bus or train in relation to the number of seats. It generally correlates with ridership, unless trips are added or removed. Link loads have increased with ridership, while Sounder loads decreased when two new round trips were added in 2017. See individual mode sections for further details on passenger loads.
On-Time Performance
On-time performance (OTP) reports the percentage of arrivals or departures at the first stop, last stop and mid-point stop that are on schedule. From 2016-17, OTP declined slightly on all modes except ST Express.
YEAR 2016 2017 EFFECT LINK 90.7% 89.2% - SOUNDER 92.8% 91.2% - TACOMA LINK 99.9% 99.8% - ST EXPRESS 82.8% 83.1% +
Customer Complaints
The target for customer complaint rates is less than 15 complaints per 100,000 boardings. Complaint rates have increased on Sounder, likely due to reliability issues, and have seen a slight uptick on Link as it grows more crowded. Rates decreased slightly on Tacoma Link and ST Express, but rates on ST Express still hover above the target range.
YEAR 2016 2017 EFFECT LINK 1.9 2.0 - SOUNDER 11.2 13.4 - TACOMA LINK 0.5 0.0 + ST EXPRESS 17.6 17.2 +
Operated as Scheduled
Operated as scheduled measures the proportion of trips that are completed, regardless of delay. Trips that do not operate as scheduled are usually due to issues such as mechanical problems or coach or operator shortages. Link and Tacoma Link both met their targets in 2017 while ST Express and Sounder were slightly below.
YEAR 2016 2017 EFFECT LINK 98.4% 98.6% + SOUNDER 98.7% 98.7% TACOMA LINK 99.9% 99.8% - ST EXPRESS 99.8% 99.6% -
SERVICE QUALITY
Table 25: On-time Performance by Mode, 2016 vs 2017
Table 26: Customer Complaints by Mode, 2016 vs 2017
Table 27: Percent of Trips Operated by Mode, 2016 vs 2017
71 | SOUND TRANSIT 2019 SERVICE IMPLEMENTATION PLAN
DRAFT
APPROACH
Productivity metrics help to identify inefficient segments that will be prioritized for restructures or routes that carry significant budget impacts.
WHAT CHANGED IN 2017/18?
Boardings
2017 presented new challenges to riders which ultimately had an impact on ridership and performance metrics. Closures of popular park-and-ride lots resulted in immediate drops in ridership on Routes 550 and 545, as ample comparable alternatives were not available to meet demand.
Meanwhile, new Sounder trips in fall 2017 increased demand from new riders in Pierce County, many of whom took advantage of Sounder connectors and increased ridership on Routes 580 and 596.
Revenue Hours and Subsidies
In downtown Bellevue, both Route 555 and 556 were significantly impacted by road closures and congestion from East Link construction, which will be discussed in the service quality section. These impacts slowed buses and increased operating expenses, leading to a routing change in June 2018.
On I-405 South, Routes 566 and 567 continued to suffer from congestion. The lack of reliability likely impacted ridership and resulted in higher operating costs, driving down productivity.
RESPONDING TO PRODUCTIVITY ISSUES WITH 2019 CHANGES
The seven lowest-performing routes were evaluated to see what changes could be made to improve service performance. In six of the seven cases, these routes suffer from poor performance in part because of the long out-of-service time it takes to start a trip from the Pierce Transit garage in Lakewood. This long trip results in higher costs without increasing ridership. The need to improve efficiency drove the change to Route 580, where resources were being spent on trips with very few riders.
Restructuring Route 513 will provide an opportunity to increase ridership by connecting with other regional service
at the new Seaway Transit Center and providing a better customer experience at the beginning of the line.
Minor changes are being analyzed on other routes for September 2019, and will be announced in an amendment to the SIP in early 2019.
PRODUCTIVITY METRICS
Table 1 lists key productivity metrics for each ST Express route. These metrics inform the graphs on subsequent pages that help to visualize trends among routes.
ST Express Performance Monitoring: Productivity

72
SYSTEM PER
FOR
MA
NC
E DRAFT
Boardings per Revenue Hour
Boardings per Passenger Trip Subsidy per Boarding Passenger Miles per
Platform Mile
2016 2017 2016 2017 2016 2017 2016 2017
1st Qua
rtile
550 Bellevue-Seattle 62.6 58.8 56.2 53.5 $3.03 $3.23 25.1 29.5
511 Lynnwood-Seattle 51.7 52.8 54.9 56 $1.94 $1.77 18.5 18.6
510 Everett-Seattle 37.1 37.6 45.7 47.4 $2.39 $2.10 23.8 25.2
532 Everett-Bellevue 38.4 37.4 50.8 50.1 $2.16 $1.75 18.1 19.2
545 Redmond-Seattle 39.4 36.5 50.2 47.4 $3.01 $3.27 21.5 23.7
522 Woodinville-Seattle 33.5 32.2 46.9 46.1 $4.10 $4.20 13.8 16.4
554 Issaquah-Seattle 33.3 33.7 39.6 39.8 $3.90 $3.82 15.4 18.2
2nd Q
uartil
e
512 Everett-Seattle 28.5 28.1 38.3 38.2 $3.36 $3.28 17.1 17
596 Bonney Lake-Sumner 62.7 60.2 28.8 26.6 $2.59 $2.80 6.4 6.1
555 Northgate-Issaquah 34.2 30.3 47.6 42.4 $3.73 $4.45 16.6 14.8
577 Federal Way-Seattle 38.1 37.5 36.8 36.4 $4.08 $4.07 13.5 13.6
556 Issaquah-Northgate 31.9 28.7 47 43.7 $4.56 $5.19 14.9 13.7
542 Redmond-U. District 31 30.1 30.6 29.9 $4.82 $4.76 15.2 14.6
594 Lakewood-Seattle 17.1 16.8 32.6 31.9 $6.04 $5.63 17.5 19.1
3rd Q
uartil
e
590 Tacoma-Seattle 22 21.6 33.5 34.1 $6.53 $5.99 14.3 15.2
578 Puyallup-Seattle 18.9 19 33.2 33.7 $6.07 $5.66 14.2 14.5
535 Lynnwood-Bellevue 24.6 24.3 28.3 28.6 $4.07 $4.13 10.9 10.4
513 Evergreen/79th-Seattle 27.4 25.6 32.7 30.3 $5.38 $5.70 11.9 11.5
574 Lakewood-SeaTac 19.9 18.9 29.3 28.3 $5.44 $5.40 13.1 12.9
595 Gig Harbor-Seattle 17.4 17.1 34.7 35.3 $8.90 $7.95 14.1 15.3
580 Lakewood-Puyallup 28.7 31.9 23.8 26.9 $5.15 $4.15 2.1 2.5
4th Qua
rtile
567 Kent-Overlake 29.3 27.1 35.9 33.7 $8.07 $8.41 7.1 7.2
592 DuPont-Seattle 15 14.9 31.3 33.3 $10.62 $10.07 11.7 12.9
541 Overlake-U. District 20.2 22.5 15.5 17.7 $8.61 $7.41 11.3 9.5
586 Tacoma-U. District 18.8 18.7 27.9 28.6 $10.76 $9.73 9.4 9.4
540 Kirkland-U. District 23.2 21.9 17.6 16.6 $6.87 $7.36 7.7 7.7
560 Westwood Village-Bellevue 15.6 15.8 25.1 24.9 $8.01 $7.85 6.1 6.5
566 Auburn-Overlake 18.3 16.4 28.2 26 $8.73 $9.83 5.7 5.4
Average 30.3 28.7 39.2 37.7 $4.30 $4.45 14.9 15.4
Table 28: Productivity Metrics by Route

73 | SOUND TRANSIT 2019 SERVICE IMPLEMENTATION PLAN
DRAFT
APPROACH
ST Express service quality measures help identify impacts to the customer experience and how they change over time. Metrics are often grouped by corridor to pinpoint share characteristics and opportunities for improvement.
WHAT CHANGED IN 2017/18?
On-Time Performance
The I-405 North corridor had the best on-time performance, as it benefits from the High-Occupancy Toll lanes with reduced congestion. The I-5 South – King and Pierce corridors suffer from the worst on time performance due to heavy congestion in both Downtown Seattle and on I-5. Sounder Connectors also suffer, but these measurements are not reliable as other routes because being late to ensure a connection with a late-arriving Sounder train is better than an on-time departure that carries no passengers.
Overcrowding
Overcrowding is most prevalent on the all-day, all week routes between Seattle and the Eastside, Routes 545 and 550. These routes have constantly high demand, but overcrowding rates have decreased as customers shifted away from the South Bellevue Park-and-Ride and Overlake Transit Center due to closures for East Link construction.
Operated as Scheduled
All routes had at least 99.6% of trips operated, meaning some were below the service standard of 99.8%. Some routes have decreased in this metric slightly over time, while others have increased, but no significant patterns exist.
Customer Complaints
Customer complaints were highest for Route 555, which suffered from worsening reliability due to East Link construction in Bellevue beginning in 2017. Route 567 also saw a doubling of complaint rates, which primarily consisted of late departures and overcrowding. Due to an occasional Sounder connection delay, certain buses may have been late, leading to higher than normal loads. Complaints on Route 592 are primarily a result of crowding
and late trips as well as the discontinuation of WSDOT-funded pilot service to Olympia.
RESPONDING TO SERVICE QUALITY ISSUES WITH 2019 CHANGES
Sound Transit has looked to improve on-time performance as well as overcrowding on many routes.
In September 2018, running time was added on Route 574 to improve the on-time performance. Route 555 was rerouted in Bellevue to avoid the worst construction impacts. ST Express has also reallocated resources to devote additional trips to Route 580 where ridership warranted service.
For this year’s SIP, the downward trend of reliability on many routes indicated a strong need to preserve service even in the face of construction impacts. When planning for the conversion of the DSTT to rail-only, Sound Transit plans to add resources to Route 550 in order to ensure that reliability does not suffer even as travel times increase.
Changes to Route 580 will reallocate resources in Pierce County to where they can be most effective in reducing crowding and improving OTP.
Montlake Freeway Station closure mitigation will seek to reduce customer impacts and complaints by conducting a robust outreach process and providing customers knowledge of their alternative travel options, including expanded Route 542 service.
SERVICE QUALITY METRICS
Table 2 depicts key service quality indicators for 2016-2018. As 2018 was not yet complete at the time of writing, this data is subject to change. Shading depicts more desirable performance outcomes (green) and less desirable (red).
ST Express Performance Monitoring: Service Quality

74
SYSTEM PER
FOR
MA
NC
E DRAFT
Route Description OTP Trips Operated
Customer Complaints per
100,000 boardings Passenger
Overcrowd Rate
2016 2017 2018 2016 2017 2018 2016 2017 2018 2016 2017 2018
Target 85% 85% 85% 99.8% 99.8% 99.8% 15.0 15.0 15.0 0.0% 0.0% 0.0%
510 Everett-Seattle 85% 87% 87% 99.9% 99.9% 99.8% 10.4 11.3 10.5 0.7% 0.5% 1.3%
511 Lynnwood-Seattle 82% 84% 86% 99.9% 99.9% 99.9% 1.9 2.3 2.3 2.1% 2.5% 1.7%
512 Everett-Seattle 89% 91% 92% 99.9% 99.9% 99.9% 4.5 3.0 4.5 0.8% 0.4% 1.4%
513 Evergreen/79th-Seattle 81% 84% 86% 99.9% 99.7% 99.8% 5.8 6.8 3.5 0.1% 0.2% 0.8%
522 Woodinville-Seattle 85% 85% 89% 99.6% 99.8% 99.8% 1.1 6.4 2.8 3.4% 3.8% 3.8%
532 Everett-Bellevue 95% 95% 94% 99.8% 99.9% 99.9% 16.0 4.0 13.3 2.7% 2.1% 2.8%
535 Lynnwood-Bellevue 97% 97% 98% 99.9% 100.0% 99.9% 4.3 7.3 9.4 0.3% 0.3% 1.1%
540 Kirkland-U. District 75% 70% 72% 99.7% 99.9% 99.9% 9.9 10.5 6.6 0.0% 0.1% 0.0%
541 Overlake-U. District 82% 83% 89% 99.7% 99.8% 99.8% 4.5 8.6 4.8 0.0% 0.2% 0.0%
542 Redmond-U. District 88% 86% 87% 99.8% 99.9% 99.8% 5.7 5.2 2.1 0.3% 0.2% 0.1%
545 Redmond-Seattle 86% 85% 90% 99.7% 99.7% 99.7% 4.6 3.8 3.6 6.7% 4.7% 3.0%
550 Bellevue-Seattle 86% 89% 90% 99.6% 99.7% 99.7% 1.6 1.6 3.0 6.8% 5.4% 4.2%
554 Issaquah-Seattle 87% 83% 89% 99.7% 99.6% 99.7% 5.1 6.4 5.6 1.7% 1.6% 1.1%
555 Northgate-Issaquah 70% 75% 80% 100.0% 100.0% 100.0% 17.4 23.5 45.5 0.8% 0.1% 0.0%
556 Issaquah-Northgate 70% 74% 76% 99.6% 99.9% 99.7% 16.2 12.4 13.0 0.3% 0.2% 0.0%
560 Westwood Village-Bellevue 79% 81% 85% 99.8% 99.9% 99.8% 5.0 7.3 7.8 0.1% 0.4% 0.5%
566 Auburn-Overlake 80% 77% 78% 99.7% 99.8% 99.7% 12.7 8.7 6.1 0.2% 0.1% 0.2%
567 Kent-Overlake 87% 87% 85% 99.9% 99.9% 99.9% 16.5 12.6 24.1 0.8% 0.5% 0.4%
574 Lakewood-SeaTac 75% 70% 74% 99.8% 99.8% 99.7% 6.3 7.2 3.6 0.2% 0.0% 0.0%
577 Federal Way-Seattle 65% 74% 75% 99.9% 99.9% 99.9% 7.6 5.8 8.6 1.1% 1.1% 0.7%
578 Puyallup-Seattle 71% 73% 76% 99.8% 99.7% 99.7% 5.7 7.8 4.3 0.8% 0.7% 1.2%
580 Lakewood-Puyallup 70% 72% 78% 99.8% 100.0% 99.9% 5.6 7.0 5.1 2.5% 6.0% 4.4%
586 Tacoma-U. District 83% 79% 77% 100.0% 100.0% 99.9% 18.4 18.9 3.3 0.0% 0.0% 0.0%
590 Tacoma-Seattle 74% 73% 76% 99.6% 99.6% 99.7% 12.4 6.9 6.0 0.9% 1.2% 0.1%
592 Olympia/DuPont-Seattle 71% 70% 71% 99.9% 99.8% 99.8% 8.5 14.7 18.5 0.0% 0.0% 0.0%
594 Lakewood-Seattle 80% 78% 77% 99.8% 99.7% 99.8% 7.1 10.2 8.5 0.9% 0.4% 0.4%
595 Gig Harbor-Seattle 79% 74% 77% 99.8% 99.8% 99.7% 27.2 32.4 11.7 0.1% 0.0% 0.0%
596 Bonney Lake-Sumner 82% 82% 84% 100.0% 100.0% 99.9% 4.1 20.0 11.8 0.1% 0.1% 0.4%
System Total 81% 81% 83% 99.8% 99.8% 99.8% 8.8 9.7 8.9 1.2% 1.2% 1.1%
Table 29: Service Quality Metrics by Route

75 | SOUND TRANSIT 2019 SERVICE IMPLEMENTATION PLAN
DRAFT CUSTOMER INPUT
Customer input is a valuable source of information about service quality and often, though not always, confirms trends suggested by other key performance indicators. Customers are the eyes and ears of our system and provide qualitative feedback to supplement data that planners see. Service planners read customer comments regularly and comments are then categorized so they can be analyzed in aggregate as well.
Early departure4%
Late departure
12%
Overcrowding7%Non-
service related
complaints77%
Commendation1%
Complaint88%
Other Comment
2%
Question0%
Request1%
Suggestion8%
Of all complaints, these were the categories
Customers Submitted Various Types of Input
From June 2013 to June 2018, Sound Transit customer service received over 9100 comments, complaints, and suggestions from customers on all topics, from service to facilities to taxing. The majority were complaints.
Late Departures Led Service-Related Complaints
Of all complaints, 23% related to three topics of interest to service planning for ST Express: early departures, late departures, and overcrowding. (Some complaints counted for multiple categories). Late departures were the most common complaint of these three.
Figure 49: Categories of Customer Input and Complaints

76
SYSTEM PER
FOR
MA
NC
E DRAFT
Corridors Varied Widely in Types of Complaints Received
Early departure, late departure, and overcrowding complaints gave insight into sources of delay. Input was also tabulated by topic, route and corridor. Some general trends were:
Many corridors with high levels of early complaints also have high levels of late complaints, which may indicate that a perceived early bus is actually the trip before it running late, or may indicate high variability in running times.
Less frequent and longer routes tend to receive more complaints, likely because customers have fewer alternate options.
4.17
3.94
3.04
2.24
1.71
1.41
0.70
0.65
0.37
0 2 4 6 8
I-5 South | PierceSounder Connector
I-405 SouthI-5 South | King
SR 522I-5 North
520 CorridorI-405 North
I-90
Overcrowding Complaints by Corridor
Per 100,000 boardings
2.07
1.62
1.45
1.36
1.34
0.80
0.67
0.58
0.56
0 2 4 6 8
SR 522
I-405 South
Sounder Connector
I-5 South | King
I-5 South | Pierce
I-90
520 Corridor
I-405 North
I-5 North
Early Complaints by CorridorPer 100,000 boardings
7.79
5.23
4.79
4.25
3.87
3.67
2.01
1.84
1.69
0 2 4 6 8
Sounder ConnectorI-405 South
SR 522I-5 South | Pierce
I-5 NorthI-5 South | King
I-90I-405 North
520 Corridor
Late Complaints by CorridorPer 100,000 boardings
The SR 522 and I-405 South corridors struggle with reliability, and a trip missed to an early departure may mean a long and unpredictable wait for the next trip, triggering a complaint.
Sounder connector riders complain the most about late arrivals, which result in missed trains and extend already long trips. I-405 South routes are also long and some connect to Sounder.
Overcrowding appears loosely linked to late complaints, because more customers accumulate at stops when a bus is late. Complaints are less likely on I-90 and 520 routes where frequency is high and trips are shorter than those to Pierce or South King County. Customers on more frequent routes can also wait for the next bus if the first one is too crowded.
What Influences Complaint Rates
Customer complaint rates are often, though not necessarily, proportional to the number of service quality issues on that route. Figures may hint at how sensitive a customer base is to poor service quality due to unique aspects of that route. More details on complaints by route can be found in the Appendix.
Figure 50: Frequency of Late Complaints by Corridor
Figure 51: Frequency of Overcrowding Complaints by Corridor
Figure 52: Frequency of Early Complaints by Corridor

77 | SOUND TRANSIT 2019 SERVICE IMPLEMENTATION PLAN
DRAFT SERVICE DELIVERY
Service delivery has the goal of delivering trips as close as possible to how they are scheduled. While percentage of trips operated is a useful metric for reporting purposes, Sound Transit conducts further analysis to understand how customers actually experience the service. The graphs on the right show one example of ideal service with even headways, and then one example of service delivered not meeting customer expectations. Trips start off close to schedule, but as time goes on, several buses run bunched with other buses (three departures around 4:30pm), followed by large gaps (with zero buses between 5 and 6pm). On this day, 90 percent of the service was operated as scheduled during the afternoon commute, but from a customer perspective about 60 percent of the service was actually delivered due to the large gaps. Four trips operated over 10 minutes after the last scheduled departure trip.
To improve the service delivery model of ST Express, routes were evaluated for their on-time performance and identify areas in need of schedule changes.
ON-TIME PERFORMANCE
On-time performance (OTP) on ST Express measures the percentage of time when a bus leaves a fixed time point no more than 5 minutes late and not early. Fixed time points are generally those that occur before the bus enters the freeway, and are where most boardings occur. Subsequent stops are generally considered estimated time points, where the bus may leave early, because people are more likely to alight there than board. These time points are not counted towards on-time performance.
Therefore, tracking only fixed time points gauges the likelihood that a customer will board a bus on time but does not accurately gauge the likelihood of reaching their final destination on time. Figure 1 compares system-wide OTP by month to the target goal of 85%.
14:30
15:00
15:30
16:00
16:30
17:00
17:30
18:00
18:30
19:00
19:30
20:00
2:30 PM
3:00 PM
3:30 PM
4:00 PM
4:30 PM
5:00 PM
5:30 PM
6:00 PM
6:30 PM
7:00 PM
7:30 PM
8:00 PM
SCHEDULED
ACTUAL
Buses bunched together
Gap between buses
70%75%80%85%90%95%
100%
Jan 1
7Fe
b 17
Mar 1
7Ap
r 17
May 1
7Ju
n 17
Jul 1
7Au
g 17
Sep 1
7Oc
t 17
Nov 1
7De
c 17
Jan 1
8Fe
b 18
Mar 1
8Ap
r 18
May 1
8Ju
n 18
Jul 1
8Perce
ntage
of T
rips O
n-Tim
e
Figure 53: ST Express On-time Performance, 2017-2018
Figure 54: Example of Actual ST Express Service Levels compared to Scheduled Service

78
SYSTEM PER
FOR
MA
NC
E DRAFT
PERFORMANCE MONITORING
With ridership gains on Link, all four productivity measurements improved in 2017 over 2016. Because no trips were added, improvements to boardings per trip and per train-set revenue hour are a direct result of the higher ridership, likely because 2017 was the first full year with three new stations open. The higher ridership also explains the higher average load experienced on Link.
LINK SERVICE QUALITY
On-time performance is measured in two ways: schedule adherence and headway performance. Because Link operates so frequently, Sound Transit reports on Link on-time performance as the scheduled headway (interval between trains) + 2 minutes rather than adherence to a posted time. This means during the morning and afternoon peaks when trains are every six minutes, if a train arrives within eight minutes of the prior train that is considered on-time.
RELIABILITY IMPACTS
While Link is the most reliable of all modes other than Tacoma Link, and OTP has improved, its OTP still hovers around 90%. Much of the reliability issues can be traced to the Downtown Seattle Transit Tunnel, where Link shares right-of-way with buses, and the Rainier Valley, where Link runs at grade. Although Link has priority, it can still be delayed waiting to enter the tunnel or advance to the next station because buses in the tunnel take longer to load. Link reliability is expected to improve in March 2019 when the DSTT converts to rail-only and buses move to surface streets.
LINK LOADS
Link loads continue to be high, with several trips sometimes exceeding the Link light rail loading standard of 2.0. However, only one trip consistently exceeds the loading standard three days a week, as defined in our service standards. This is currently a two-car train leaving University of Washington Station around 5pm. This trip is heavily loaded due to the two car train configuration as well as passengers traveling through the Downtown Seattle Transit Tunnel to connect to the 5:20 pm Sounder south line train. Sound Transit continues to monitor this trip and may make changes in 2019 to better accommodate passengers, especially after the conversion of the DSTT to a rail-only configuration.
Figure 2 and Figure 3 give a picture of Link loads by hour of day. Each dot represents an actual trip that occurred and the maximum load on each car during that trip. Train car loads are highest at peak hours, but the load of any given trip can vary substantially day by day.
80%
85%
90%
95%
100%
Jan 1
7Fe
b 17
Mar 1
7Ap
r 17
May 1
7Ju
n 17
Jul 1
7Au
g 17
Sep 1
7Oc
t 17
Nov 1
7De
c 17
Jan 1
8Fe
b 18
Mar 1
8Ap
r 18
May 1
8Ju
n 18
Jul 1
8
Perce
ntage
of T
rips O
n-Tim
eLink Performance Monitoring
Figure 55: Link On-time Performance, 2017-2018

79 | SOUND TRANSIT 2019 SERVICE IMPLEMENTATION PLAN
DRAFT
0102030405060708090
100110120130140150160170180190200210220230240250260
4:00 6:00 8:00 10:00 12:00 14:00 16:00 18:00 20:00 22:00 0:00
Max P
asse
nger
s per
Car
per T
rip
Trip Start Time
3 car train2 car train
0102030405060708090
100110120130140150160170180190200210220230240250260
4:00 6:00 8:00 10:00 12:00 14:00 16:00 18:00 20:00 22:00 0:00
Max P
asse
nger
s per
Car
per T
rip
Trip Start Time
3 car train2 car train
NORTHBOUND AVERAGE TRAIN CAR TRIP MAX LOAD
SOUTHBOUND AVERAGE TRAIN CAR TRIP MAX LOAD
Figure 56: Maximum Car Loads on Individual Link Trips by Hour of Day, Northbound (July 2018)
Figure 57: Maximum Car Loads on Individual Link Trips by Hour of Day, Southbound (July 2018)
Planning Load (148 Passengers)
Target Max Load (194 Passengers)
“Crush load” (252 Passengers)
Planning Load (148 Passengers)
Target Max Load (194 Passengers)
“Crush load” (252 Passengers)

80
SYSTEM PER
FOR
MA
NC
E DRAFT
KEY FINDINGS
On-Time Performance
Sounder on-time performance increased dramatically in spring and summer 2017 after the end of construction that had caused delays.
Passenger Load
The addition of two new round trips on the Sounder south line provided much-needed capacity to address overcrowding issues while also inducing higher ridership.
Max loads on all Sounder trips average below the number of seats. However, loads are often not distributed evenly among cars, with those nearest stairwells at King Street Station averaging higher loads, even on inbound morning trains. The front car has the highest average load. When customers complain of overcrowding, a potential solution could be to increase awareness that seats are often available elsewhere in the car.
Operated as Scheduled
Mudslides continued to cause occasional trip cancellations on Sounder north line in the winter months. Quick responses have been key to helping customers transition seamlessly to bus bridges when no train service is available, and reducing complaints.
70%
75%
80%
85%
90%
95%
100%
Jan 1
7Fe
b 17
Mar 1
7Ap
r 17
May 1
7Ju
n 17
Jul 1
7Au
g 17
Sep 1
7Oc
t 17
Nov 1
7De
c 17
Jan 1
8Fe
b 18
Mar 1
8Ap
r 18
May 1
8Ju
n 18
Jul 1
8
Perce
ntage
of T
rips O
n-Tim
eSounder Performance Monitoring: Service Quality
Figure 58: Sounder On-time Performance, 2017-2018

81 | SOUND TRANSIT 2019 SERVICE IMPLEMENTATION PLAN
DRAFT
Average Loading on Northbound Trains
The figure below shows the average portion of seats occupied on each train car of each train.
Average Loading on AM Peak Trains
Customers are most likely to get a seat cars further back. No AM trains are at their full capacity, although some customers in the front car may perceive it this way.
1500
1502
1504
1506
1508
1510
1512
1514
1516
1518
1520
1522
1524
123 103 84 75 97 89 102
South Line Train Loading: Northbound
AM P
eak
Trai
ns
Mid
day
and
Rev
erse
Pe
ak T
rain
s
Figure 59: Average Northbound Maximum Car Loads on Individual Sounder South Cars by Trip (Spring 2018)

82
SYSTEM PER
FOR
MA
NC
E DRAFT
Average Loading on Southbound Trains
The figure below shows the average portion of seats occupied on each train car of each train.
Average Loading on PM Peak Trains
Figure 60: Average Southbound Maximum Car Loads on Individual Sounder South Cars by Trip (Spring 2018)
Southbound PM peak trains are more crowded overall than trains in the AM peak due to higher ridership.
However, the overall distribution of loading is virtually the same as northbound AM peak trains – passengers tend to board the cars that are readily accessible to the stairwells at King Street Station.
1501
1503
1505
1507
1509
1511
1513
1515
1517
1519
1521
1523
1525
107 93 102 92 102 114 127
South Line Train Loading: Southbound
Rev
erse
Pea
k an
d M
idda
y Tr
ains
PM
Pea
k Tr
ains

83 | SOUND TRANSIT 2019 SERVICE IMPLEMENTATION PLAN
DRAFT
PERFORMANCE MONITORING
All statistics on Tacoma Link improved from 2017 to 2018.
SERVICE QUALITY
Tacoma Link includes a single-track portion between Union Station and Tacoma Dome, which limits headways. Because a late incoming train could interfere with an outgoing train, any trip that is more than five minutes late would result in a trip cancellation Therefore, the percentage of trips operated is equal to on-time performance.
OTP and percentage of trips operated consistently approach 100%, well above the goal of 98.5% of trips departing within three minutes of the schedule.
TRIP LOADS
All trips are within the load standard, as seen in Figure 62. Several trips have standing loads, but based on the scheduled 10 minute trip, no action will need to be taken in the upcoming year.
CUSTOMER COMMENTS
Two comments were received in Tacoma Link in 2017. Neither comment was a direct complaint of existing Tacoma Link service. High customer satisfaction may be partly because no fares are currently collected on Tacoma Link and service is generally reliable.
95%
96%
97%
98%
99%
100%
Jan 1
7Fe
b 17
Mar 1
7Ap
r 17
May 1
7Ju
n 17
Jul 1
7Au
g 17
Sep 1
7Oc
t 17
Nov 1
7De
c 17
Jan 1
8Fe
b 18
Mar 1
8Ap
r 18
May 1
8Ju
n 18
Jul 1
8
Perce
ntage
of T
rips O
n-Tim
eTacoma Link Performance Monitoring
0
10
20
30
40
50
60
Max
imum
Loa
d
SOUTHBOUND MAX LOAD
0
10
20
30
40
50
60
Max
imum
Loa
d
NORTHBOUND MAX LOAD
Seating capacity
Planning load
Seating capacity
Planning load
Figure 61: Tacoma Link On-time Performance, 2017-2018
Figure 62: Tacoma Link Average Loads, Spring 2018

84
SYSTEM PER
FOR
MA
NC
E DRAFT
This page intentionally left blank.

85 | SOUND TRANSIT 2019 SERVICE IMPLEMENTATION PLAN
DRAFT
Sound Transit will have major system expansion over the next several years as a result of the Sound Move, ST2 and ST3 voter-approved measures. The opening of new high-capacity transit investments presents significant opportunities to adjust the regional transit network to connect more people to more places. The assumptions listed in this section are preliminary and are intended to present one concept of what the regional transit network will look like as Link extensions open. The adoption of this document does not approve changes listed in this section, and changes listed here are subject to a full public engagement period and Board adoption process in the upcoming years.
PLANNING THEMES (KEY THEMES FOR CHANGE)
Link Extensions
Link will become the regional backbone of the Puget Sound Region linking Downtown Seattle north, east, and south. As congestion grows throughout the region, Link has the opportunity to provide frequent and reliable service that is separated from freeway congestion.
ST Express Evolution
ST Express will evolve significantly over the next several years as Link extensions open. Most ST Express routes which currently serve downtown Seattle will be converted to regional express routes feeding the Link network, while some routes will be converted to expand service to underserved areas such as South Lake Union. This evolution of ST Express will reduce the total number of hours, but combined with Link will provide more regional mobility to the Central Puget Sound region.
New Mode of Service
Bus Rapid Transit will replace all-day, all-week ST Express service on I-405 as well as SR 522.
In both BRT corridors, some peak ST Express bus service would be maintained to provide additional capacity and to serve commuter markets in the corridor not served by the BRT routes.
BUILDING A CONNECTED NETWORK
As Sound Transit continues building-out ST2 and ST3 projects, coordination and transit integration will play an important role in shaping transit service for Puget Sound residents. Transit integration offers opportunities to maximize the efficient use of transit resources in the region, while also improving customer experience. Sound Transit recognizes that coordination with partner agencies provides an effective regional system that customers can utilize any time of the day and week.
Sound Transit’s partner agencies, including Community Transit, King County Metro, Pierce Transit, Washington State Department of Transportation (WSDOT) Ferries System, and the City of Seattle, have all adopted updated Long Range Plans (LRPs) that include commitments to future transit integration as more light rail extensions open. As showcased with the U Link Bus-Rail integration process, King County Metro and Sound Transit worked together with key stakeholders in the region to improve reliability and provide new connections to customers with the opening of the Link extension to the University of Washington. Bus-rail transit integration will continue to be an important element of future Link light rail extension openings.
Equally important in the coming years will be transit integration of Sounder, Tacoma Link, and ST Express services with partner agency plans. For Sounder commuter rail, integration with partner agency bus services at each of the Sounder stations, on both the south and north lines, will be critical in the coming years. Coordination continues to be necessary to ensure customers are able to have a
FIVE-YEAR SERVICE OUTLOOK & PLAN Preliminary service plans & system expansion 2020-2024
System Expanision Service Assumptions: A Preliminary Look
All elements in the following section are preliminary and subject to revision and refinement in future planning efforts. Any major service change requires a full public engagement and Board adoption process.
!

86
FIVE YEAR
SERIVC
E OU
TLOO
K &
PLAN
DRAFT
smooth experience transferring to and from Sounder to the connecting systems. Continued coordination with the WSDOT Ferries System at the Edmonds and Mukilteo Sounder stations will be needed, as the Ferry System provides a critical connection for customers traveling across the Puget Sound. For Tacoma Link, Sound Transit will work with Pierce Transit to better utilize capacity on the Tacoma Link system and ensure the system complements Pierce Transit service in downtown Tacoma, and vice versa. For ST Express, as partner agencies implement additional service and strategies identified in their respective LRPs, and as ST2 and ST3 projects come online, coordination of bus service improvements will be key to providing seamless connections across modes. This effort will also ensure redundancies in service throughout the region are minimized.
SERVICE AND FARE EQUITY (SAFE) ANALYSIS
Service changes associated with major capital projects will have Service and Fare Equity Analyses conducted to assess impacts to protected groups. This equity analysis assesses the impacts of service and/or fare changes, positive or negative, on minority, low income, and limited English proficiency (LEP) customers. Each SAFE analysis includes a public outreach period to ensure that customers can comment on the impacts and results of the proposed changes.

87 | SOUND TRANSIT 2019 SERVICE IMPLEMENTATION PLAN
DRAFT
This plan only assumes potential changes that may happen over the next several years as high capacity transit is built out. Changes in this section are conceptual and at a high level, and is still subject to adoption as part of future annual service planning processes.
Modal Hours and Miles Estimates
Based on the Five-Year Service Outlook, planners worked closely with finance staff to estimate four key service statistics which drive operating costs included in the finance plan:
Platform hour: Any hour a transit vehicle is operating, which includes in-service hours, deadhead hours and layover hours. Typically, this is the total amount of time the transit vehicle is away from the operating base.
Revenue hour: An hour in which a transit vehicle is in revenue service, i.e., picking up, dropping off, and/or carrying passengers. Vehicles are not in revenue service between base and their first stop, between their last stop and base, or when traveling between the last stop on one trip and the first stop on the next trip.
Platform Mile: Any mile a transit vehicle operates, which includes in-service miles and deadhead miles. Typically, this is the total distance the transit vehicle travels while away from the operating base.
Revenue Mile: The distance a transit vehicle operates in revenue service, i.e., picking up, dropping off, and/or carrying passengers. Vehicles are not in revenue service between base and their first stop, between their last stop and base, or when traveling between the last stop on one trip and the first stop on the next trip.
ST EXPRESS
ST Express will remain constant over the next several years in terms of service hours provided, although increasing congestion may result in reductions in service delivered due to lower speed. As Link extensions open, most service hours currently allocated to ST Express will be converted over to Link Light Rail service hours. Some hours will be reinvested into the corridor to provide improved connections to the regional network.
LINK
Link will expand significantly over the next five years. With extensions north, south and east, resources will be needed to operate these extensions. Additionally, additional cars will be used to operate four-car trains in the entire system.
TACOMA LINK
Tacoma Link will continue to operate its current service levels until the Hilltop Tacoma Link Extension opens in 2022. After that, frequency will increase to have service every 10 minutes along the corridor.
SOUNDER
No changes to Sounder service are anticipated over the next five years. ST Express service may feed additional passengers into the Sounder network, however.
Network Outlook 2020-2025
Transit Service Levels (Thousands of Platform Hours) by Mode
2018 2019 2020 2021 2022 2023 2024 Bus
ST Express 795 803 807 807 807 791 727
Bus Rapid Transit - - - - - - TBD
Light Rail
Link 102 101 101 101 107 133 262
Tacoma Link 10 10 10 10 14 26 26
Commuter Rail
Sounder 13 13 13 13 13 13 13
Table 30: Projected Transit Service Levels by Mode
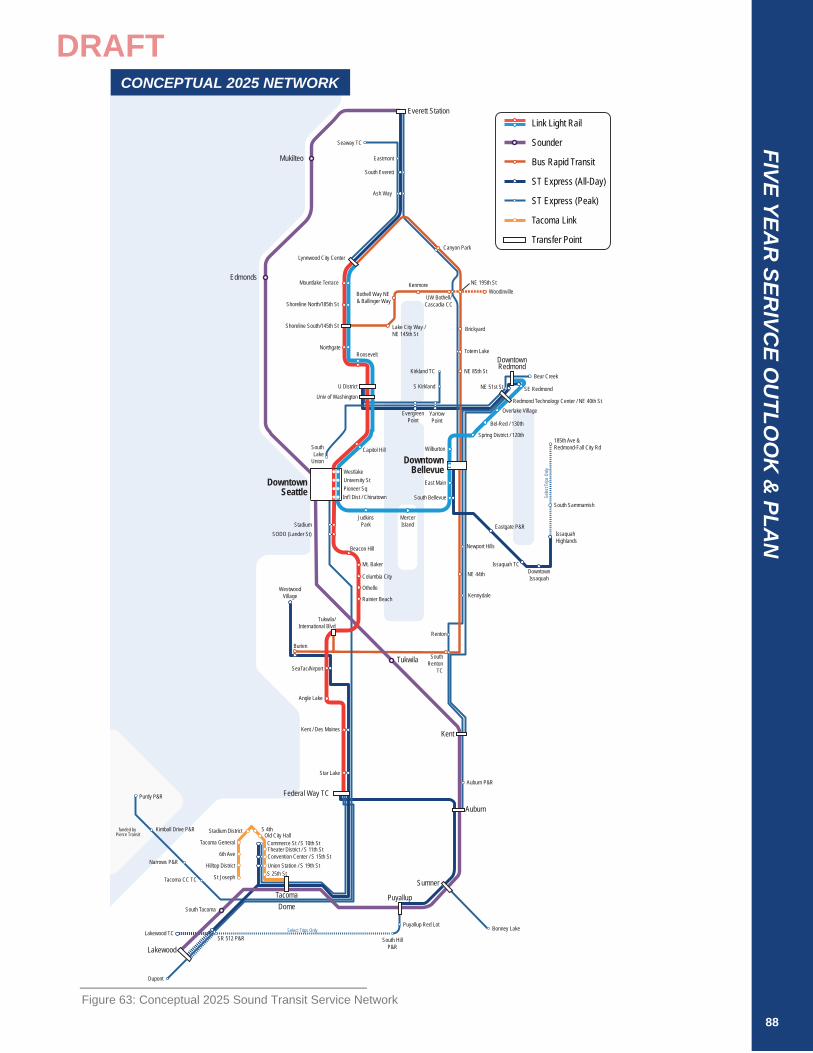
Everett Station
Seaway TC
South Everett
Ash Way
Lynnwood City Center
Mountlake Terrace
Shoreline South/145th St
Northgate
U District
Univ of Washington
Capitol Hill
DowntownSeattle
DowntownBellevue
TacomaDome
Lakewood
DowntownRedmond
Issaquah TC
IssaquahHighlands
Federal Way TC
Star Lake
Kent / Des Moines
Angle Lake
SeaTac/Airport
Tukwila/International Blvd
Mt. Baker
Columbia City
Othello
Rainier Beach
Beacon Hill
SODO (Lander St)Stadium
MercerIsland
JudkinsPark
EvergreenPoint
YarrowPoint
S Kirkland
Kirkland TC
WoodinvilleUW Bothell/
Cascadia CC
KenmoreBothell Way NE & Ballinger Way
Totem Lake
Canyon Park
Eastmont
NE 51st St
Redmond Technology Center / NE 40th St
Bear Creek
South Bellevue
Kennydale
SouthRenton
TC
Tukwila
Kent
Auburn
Auburn P&R
Dupont
Lakewood TCSR 512 P&R
South Tacoma
South HillP&R
Puyallup Red Lot
Puyallup
Purdy P&R
Kimball Drive P&R
Narrows P&R
Tacoma CC TC
Burien
Sumner
Bonney Lake
Edmonds
Mukilteo
DowntownIssaquah
Eastgate P&R
Old City Hall
Theater District / S 11th StConvention Center / S 15th StUnion Station / S 19th StS 25th St
185th Ave & Redmond-Fall City Rd
South Sammamish
Newport Hills
Brickyard
Commerce St / S 10th St
funded by Pierce Transit
Selec
t Trip
s Only
Shoreline North/185th St
Roosevelt
NE 195th St
NE 85th St
NE 44th
Renton
East Main
Wilburton
Spring District / 120th
Bel-Red / 130th
Overlake Village
SE Redmond
WestlakeUniversity StPioneer SqInt’l Dist / Chinatown
S 4thStadium District
Tacoma General
6th Ave
Hilltop District
St Joseph
SouthLake
Union
WestwoodVillage
Select Trips Only
Link Light Rail
Sounder
Bus Rapid Transit
ST Express (All-Day)
ST Express (Peak)
Tacoma Link
Transfer Point
Lake City Way /NE 145th St
88
FIVE YEAR
SERIVC
E OU
TLOO
K &
PLAN
DRAFTCONCEPTUAL 2025 NETWORK
Figure 63: Conceptual 2025 Sound Transit Service Network

89 | SOUND TRANSIT 2019 SERVICE IMPLEMENTATION PLAN
DRAFT
With the ST2 plan, voters approved approximately 36 miles of new light rail. The ST3 plan expands the system by another 50 miles of light rail. By 2024, the system would extend north from the University of Washington to Northgate and Lynnwood, south from Angle Lake in SeaTac to the Federal Way Transit Center, and east from Seattle to Bellevue and Redmond. In addition, the ST2 Plan includes funding to locate, design, and construct an additional operations and maintenance facility to accommodate future Link light rail fleet requirements. Below are brief descriptions of the light rail extensions and the new operations & maintenance facility funded as part of the ST2 plan and initial projects funded by ST3. Impacts to existing ST Express services are currently being analyzed as part of ongoing studies for specific construction impacts, while the 2025 Network Plan will analyze long term changes to the network as a result of Link extension openings.
Northgate Link Extension
Scheduled for completion in late 2021, Northgate Link extends Link light rail 4.3 miles north from the University of Washington Station to the Northgate Station, adding three stations: U District, Roosevelt and the Northgate Station. Northgate Link, along with the stations, are currently under construction, with the tunnels connecting Northgate and the University of Washington Stations now complete in both directions. With the extension to Northgate, the Link system is expected to operate four-car trains at all times.
East Link
Scheduled for completion in late 2023, East Link extends Link light rail 14 miles east from the International District/Chinatown Station to the Overlake Transit Center via downtown Bellevue, adding ten stations and preliminary engineering for a future extension to downtown Redmond. The stations include Judkins Park (Rainier Ave), Mercer Island, South Bellevue, East Main, Bellevue Downtown, Wilburton, Spring District/120th, Bel-Red/130th, Overlake
Village, and Redmond Technology (Overlake Transit Center). East Link, along with some of the stations, are currently in the initial phases of construction. With the extension to Bellevue and Overlake, Link will operate as the Blue Line between Overlake and Northgate in 2023, with four-car trains at all times. With the opening of East Link the capacity between Downtown Seattle and Northgate will double.
Downtown Redmond Link Extension
The Downtown Redmond Link Extension builds 3.7 miles of new light rail from the Redmond Technology Station, opening in 2023, to downtown Redmond by 2024. Light rail will travel along SR 520 with two new stations in southeast Redmond at Marymoor Park and Downtown Redmond. This extension is being built concurrently with the East Link project and was funded by the passage of ST3.
Lynnwood Link Extension
Scheduled for completion in mid-2024, Lynnwood Link extends Link light rail 8.5 miles north from the Northgate Station to the Lynnwood Transit Center, adding four stations and infrastructure for two potential future stations. The stations include Shoreline South/145th, Shoreline North/185th, Mountlake Terrace, and Lynnwood City Center. Lynnwood Link, along with the stations, are currently in final design. With the extension to Lynnwood, Link will operate as the Red and Blue Lines to Lynnwood with four-car trains at all times.
Federal Way Link Extension Scheduled for completion in 2024, Federal Way Link extends Link light rail 7.8 miles south from the Angle Lake Station to the Federal Way Transit Center, with stops at Kent/Des Moines and South 272nd Street. The Federal Way Link Extension is currently in final design. With the extension to Federal Way, the Link line between Lynnwood and Federal Way is expected to operate as the Red Line with four-car trains at all times.
Link planning outlook

90
FIVE YEAR
SERIVC
E OU
TLOO
K &
PLAN
DRAFT
Link Estimated Hours and Miles
Link includes both train and vehicle statistics to reflect operation of multiple cars within an individual train.
In 2018 Link service statistics will remain constant compared to 2017 service statistics, as operations post University of Washington and Angle Lake extensions have stabilized. However, vehicle statistics will increase in 2018 compared to 2017 due to the change to run 3-car trains all day in June 2017. Link service statistics are consistent in 2019 and 2020 before increasing in 2021 and 2022 with the opening of Northgate Link in late 2021. In 2023 and 2024, Link service statistics increase significantly with the opening of the East Link, Federal Way, Lynnwood, and Redmond Link
extensions. Table 31 provides details on Link train and vehicle level service statistics through 2024.
YEAR REVENUE
HOURS PLATFORM
HOURS REVENUE
MILES PLATFORM
MILES REVENUE
HOURS PLATFORM
HOURS REVENUE
MILES PLATFORM
MILES
Train Statistics Vehicle Statistics
2017 Actual 96,191 101,846 1,974,346 2,096,492 251,376 265,554 5,153,872 5,466,531 2018 Estimated 95,972 101,614 1,969,850 2,091,717 266,166 281,813 5,463,120 5,801,103 2019 Estimated 95,600 101,200 1,962,400 2,083,800 266,200 281,800 5,463,100 5,801,100 2020 Estimated 95,600 101,200 1,962,400 2,083,800 266,200 281,800 5,463,100 5,801,100 2021 Estimated 97,700 103,400 2,054,300 2,181,400 303,500 321,300 6,427,300 6,824,900 2022 Estimated 103,800 109,900 2,329,900 2,474,000 415,200 445,500 9,319,600 9,896,100 2023 Estimated 125,800 133,100 2,776,100 3,055,800 503,000 532,600 11,104,500 12,223,100 2024 Estimated 247,000 261,500 6,045,800 6,002,200 988,000 1,046,100 24,183,000 24,008,800
Table 31: Link Service Hours and Miles 2017-2024

91 | SOUND TRANSIT 2019 SERVICE IMPLEMENTATION PLAN
DRAFT
Sound Transit’s express bus network is structured around key regional travel corridors, typically on freeways or major highways to support the express, limited-stop characteristics of the service. Sound Transit will continue to coordinate with its partner agencies, key stakeholders, and the public, to analyze the best ways to serve the current ST Express markets and provide improved connections to Link light rail and other projects described in this section.
Congestion
As the Puget Sound Region continues to grow, congestion on major highways and arterials is expected to increase. Over the past several years, traffic and travel times along key corridors served by ST Express have increased significantly. Since September 2015, Sound Transit has invested over 47,000 annual service hours throughout the ST Express system to provide new connections, provide new capacity to meet growing demand, and address congestion. Most recently, another 15,000 annualized service hours were invested in September 2017 system-wide to address on-time performance and reliability.
As congestion continues to increase, Sound Transit will continue to monitor the impacts on ST Express on-time performance and schedule reliability. As funding becomes available, Sound Transit will implement strategies to minimize the impacts of congestion on ST Express service.
ST Express Connects and Evolves
The introduction of new Link extensions gives an opportunity to revisit the role and responsibility of ST Express. With these high capacity corridors coming online, in certain cases ST Express routes which currently serve downtown Seattle will be converted to regional express routes feeding the Link network. Other routes will be converted to expand service levels to future Link markets such as South Lake Union or the Boeing Everett Plant. The truncation of many of these routes, while reducing the total number of hours, will
result in increased service levels on the remaining ST Express corridors and provide more regional mobility to the Central Puget Sound region.
ST Express Estimated Hours and Miles
In 2018, ST Express service statistics are expected to increase over 2017 levels, primarily due to a full year of operation of new trips added to the Sounder Connector routes in 2017 to meet the new Sounder South Line round trips. In 2019, the increase in service statistics are a reflection of the added night and weekend service to Rt. 542 to mitigate the closure of the Montlake Freeway Station. Between 2020 and 2022 service statistics for ST Express are expected to remain constant. In 2023 and 2024, ST Express service is expected to decrease and be scaled back, as service is directly replaced by Link and BRT services in various corridors. By 2025, ST Express is expected to scale back to 600,000 annual platform hours and to remain at that level indefinitely. Table 32 provides details on ST Express service statistics through 2024.
YEAR REVENUE HOURS
PLATFORM HOURS
REVENUE MILES
PLATFORM MILES
2017 Actual 626,347 784,741 11,985,162 16,344,866 2018 Estimated 617,125 795,272 11,844,230 16,522,531 2019 Estimated 638,013 819,722 12,140,043 16,883,534 2020 Estimated 643,900 827,805 12,248,000 17,033,200 2021 Estimated 643,900 827,805 12,248,000 17,033,200 2022 Estimated 643,900 827,805 12,248,000 17,033,200 2023 Estimated 628,300 809,905 12,044,500 16,785,400 2024 Estimated 558,700 740,380 11,188,800 15,722,200
ST Express planning outlook
Table 32: ST Express Service Hours and Miles 2017-2024

92
FIVE YEAR
SERIVC
E OU
TLOO
K &
PLAN
DRAFT
The year 2017 saw the addition of the last ST2-funded service improvements to Sounder service, including additional cars, new round trips, and infrastructure improvements. Sound Transit will continue to coordinate internally and externally with partner agencies to minimize the impacts of Sounder projects, including minimizing delay impacts to customers during a project’s construction period.
Sounder Maintenance Base
Sound Transit plans to build an operations and maintenance facility to service Sounder commuter trains to accommodate existing and future ridership growth on the Sounder commuter rail system. The new Sounder maintenance facility would be constructed between Steilacoom Boulevard SW and 100th Street SW in the City of Lakewood, adjacent
to the Sound Yard Expansion project identified above. The project completed its environmental review in May 2016 and is proposed to be completed by 2023.
Sounder Estimated Hours and Miles
Sounder includes both train and vehicle statistics to reflect operation of multiple cars within an individual train.
In 2018, Sounder service statistics will increase as a result of a full year of operation of the new round trips added in late 2017. Sounder service statistics are expected to remain constant through 2024, as no new service investments are planned. Table 33 provides details on Sounder train and vehicle level service statistics through 2024 for both the North and South lines.
YEAR REVENUE
HOURS PLATFORM
HOURS REVENUE
MILES PLATFORM
MILES REVENUE
HOURS PLATFORM
HOURS REVENUE
MILES PLATFORM
MILES
Train Statistics Vehicle Statistics
North Line 2017 Actual 2,702 2,885 69,185 71,050 6,941 7,401 177,909 182,665 2018 Estimated 2,674 2,844 69,464 71,089 6,686 7,109 173,661 177,723 2019 Estimated 2,700 2,900 69,500 71,100 6,700 7,200 173,700 177,800 2020 Estimated 2,700 2,900 69,500 71,100 6,700 7,200 173,700 177,800 2021 Estimated 2,700 2,900 69,500 71,100 6,700 7,200 173,700 177,800 2022 Estimated 2,700 2,900 69,500 71,100 6,700 7,200 173,700 177,800 2023 Estimated 2,700 2,900 69,500 71,100 6,700 7,200 173,700 177,800 2024 Estimated 2,700 2,900 69,500 71,100 6,700 7,200 173,700 177,800
South Line 2017 Actual 8,538 9,190 261,434 269,453 56,994 61,247 1,741,751 1,794,380 2018 Estimated 9,687 10,290 294,706 301,132 67,807 72,032 2,062,940 2,107,926 2019 Estimated 9,700 10,300 294,800 301,200 67,900 72,100 2,063,000 2,108,000 2020 Estimated 9,700 10,300 294,800 301,200 67,900 72,100 2,063,000 2,108,000 2021 Estimated 9,700 10,300 294,800 301,200 67,900 72,100 2,063,000 2,108,000 2022 Estimated 9,700 10,300 294,800 301,200 67,900 72,100 2,063,000 2,108,000 2023 Estimated 9,700 10,300 294,800 301,200 67,900 72,100 2,063,000 2,108,000 2024 Estimated 9,700 10,300 294,800 301,200 67,900 72,100 2,063,000 2,108,000
Sounder Total 2017 Actual 11,240 12,075 330,619 340,503 63,935 68,648 1,919,660 1,977,045 2018 Estimated 12,361 13,134 364,170 372,222 74,492 79,140 2,236,601 2,285,649 2019 Estimated 12,400 13,200 364,300 372,300 74,600 79,300 2,236,700 2,285,800 2020 Estimated 12,400 13,200 364,300 372,300 74,600 79,300 2,236,700 2,285,800 2021 Estimated 12,400 13,200 364,300 372,300 74,600 79,300 2,236,700 2,285,800 2022 Estimated 12,400 13,200 364,300 372,300 74,600 79,300 2,236,700 2,285,800 2023 Estimated 12,400 13,200 364,300 372,300 74,600 79,300 2,236,700 2,285,800 2024 Estimated 12,400 13,200 364,300 372,300 74,600 79,300 2,236,700 2,285,800
Sounder planning outlook
Table 33: Sounder Service Hours and Miles 2017-2024

93 | SOUND TRANSIT 2019 SERVICE IMPLEMENTATION PLAN
DRAFT
System Expansion
The ST2 Plan included funding for a project to expand the current Tacoma Link service. In 2013, after extensive community outreach, a preferred alternative for the extension and station locations was selected. The 2.4-mile expansion will extend Tacoma Link service to the Hilltop neighborhood via the Stadium District and Martin Luther King, Jr. Way. The extension will add six additional stations and relocate the current Theater District station one block north. The expansion will also increase frequencies from every 12 minutes to every 10 minutes. In late 2015, the Sound Transit Board of Directors approved the project to be built. The Tacoma Link Expansion is funded through a partnership between Sound Transit and the City of Tacoma, in addition to grants from the U.S. Department of Transportation and the WSDOT. The project is currently in final design, with construction expected to begin in 2019, and scheduled to open in 2022. Tacoma Link will also begin fare collection upon the opening of the extension.
Sound Transit will continue to coordinate with partner agencies, key stakeholders, and the public, to minimize the impacts of construction of the Tacoma Link expansion project on the adjacent neighborhoods and the connecting bus services. In addition, Sound Transit expects to conduct a service and fare equity analysis (SAFE) analysis for the project starting in early 2021 through early 2022. The analysis will include the impacts of changes to Pierce Transit or Sound Transit bus services, if any, to Title VI communities as a result of the extension.
Fleet Operations & Maintenance Facility Expansion
With the extension of Tacoma Link service approved in 2015, the fleet requirements for operating service will
increase, from the current three vehicles to eight vehicles with the extension. The light rail vehicles are expected to begin being delivered in 2020 through 2021. Sound Transit will be working with the vendor, Brookeville Equipment Corporation, in the coming years to design the new vehicles and ensure the needs of all transit riders are incorporated.
The current operations and maintenance facility in downtown Tacoma, which can store and maintain four light rail vehicles, will reach full capacity by 2020. This facility will be expanded to the east to store, maintain, and deploy the additional vehicles needed for the Tacoma Link Extension.
Sound Transit will continue to coordinate with partner agencies, key stakeholders, and the public, to minimize the impacts of construction of the Tacoma Link OMF Expansion project on the adjacent neighborhoods. In addition, Sound Transit expects to conduct a SAFE analysis for the project in 2020. Table 25 provides details on existing and planned Tacoma Link fleet through 2023.
Tacoma Link Estimated Hours and Miles
Since Tacoma Link operates as one-car train, train and vehicle statistics are identical.
Tacoma Link service statistics are expected to remain constant between 2018 and 2021. In 2022, with the opening of the Hilltop Extension and the increase in service to 10-minute frequencies, Tacoma Link service statistics start to increase. Service statistics in 2023 and 2024 reflect full years of operations of the extension and service frequency improvements. Table 34 provides details on Link train and vehicle level service statistics through 2024.
YEAR REVENUE
HOURS PLATFORM
HOURS REVENUE
MILES PLATFORM
MILES
Train & Vehicle Statistics
2017 Actual 9,868 9,905 75,983 76,262 2018 Estimated 9,800 9,800 75,500 75,800 2019 Estimated 9,800 9,800 75,500 75,800 2020 Estimated 9,800 9,800 75,500 75,800 2021 Estimated 9,800 9,800 75,500 75,800 2022 Estimated 13,800 13,900 105,900 106,300 2023 Estimated 25,600 25,700 238,600 239,500 2024 Estimated 25,600 25,700 238,600 239,500
Tacoma Link planning outlook
Table 34: Tacoma Link Service Hours and Miles 2017-2024

94
FIVE YEAR
SERIVC
E OU
TLOO
K &
PLAN
DRAFT
The voter approved ST3 plan included two new high-capacity transit routes utilizing the bus rapid transit (BRT) technology. In 2018, the concepts, routing and service plan for these two BRT routes are being refined to reflect improved assumptions and updated knowledge about operating plans. Assumptions around station locations have not changed, but operating considerations and station location refinements will revise service planning estimates. As a result, hours and miles assumptions will be included as part of next year’s service implementation plan.
SR 522/NE 145th BRT
SR 522/NE 145th BRT will operate between the new Shoreline South/145th St Station on the Lynnwood Link Extension and communities along the north shore. The eastern terminus, as currently envisioned, will alternate between ending at UW Bothell or in Woodinville. This line is anticipated to open at the same time or soon after the Lynnwood Link extension open in 2024.
I-405 BRT
I-405 BRT will operate as two distinct lines – one operating from Lynnwood to Bellevue and the other from Bellevue to Burien. These BRT lines are anticipated to open in 2024.
BRT planning outlook

95 | SOUND TRANSIT 2019 SERVICE IMPLEMENTATION PLAN
DRAFT
Scheduled for completion in late 2021, Northgate Link extends Link light rail 4 miles north from the University of Washington Station to the Northgate Transit Center, adding two stations (U District and Roosevelt) along the way.
ST Express leverages Northgate Link
ST Express service will have an opportunity for change the opening of Northgate Link. These concepts reduce duplication of service along the corridor to potentially fund reliability improvements on the distinct segments of those routes. No changes to service hours are proposed as part of the Northgate Link Extension.
Key changes in service by route include:
Route 522 truncated at Roosevelt or Northgate Station, operating all-day all-week service from the Link station. Saved resources reinvested back into Route 522.
Route 542 truncated at U. District; service between U. District and Green Lake P&R would be discontinued. Saved resources reinvested back into Route 542.
Route 586 U. District service discontinued and service hours reinvested into service in the I-5 South corridor.
Other opportunities for changes that may be explored include:
I-5 North corridor restructure, some of the corridor’s route (Rt. 510, 511, 512, and/or 513), operating along the I-5 corridor between Snohomish County and Downtown Seattle, could be restructured to connect with Link at Northgate.
Routes 555 and 556, operating between Issaquah and Northgate, may be restructured on the segment between U-District and Northgate.
ROUTE 2019
PLATFORM HOURS
2021 PLATFORM
HOURS 522 59,099 59,099 542 30,180 30,180 586 11,178 - Other I-5 South Routes 236,694 247,872 Total 337,151 337,151
Northgate Link Extension (2021)
Table 35: ST Express Platform Hours Changes with Northgate
Service Assumptions: A Preliminary Look
All elements in these sections are preliminary and subject to revision and refinement in future planning efforts. Any major service change requires a full public engagement and Board adoption process.
!
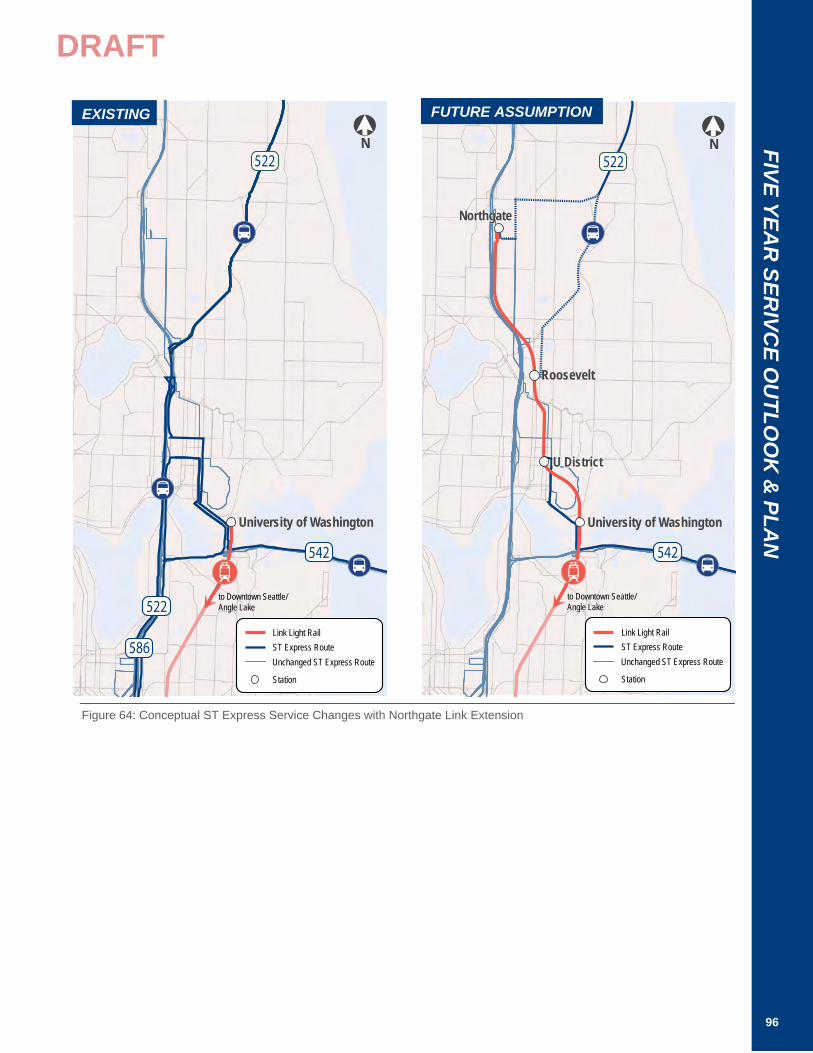
to Downtown Seattle/Angle Lake
Roosevelt
University of Washington
U District
Northgate
542
522N
Link Light RailST Express Route
Station
Unchanged ST Express Route
to Downtown Seattle/Angle Lake
University of Washington
586
522
542
522N
Link Light RailST Express Route
Station
Unchanged ST Express Route
96
FIVE YEAR
SERIVC
E OU
TLOO
K &
PLAN
DRAFT
FUTURE ASSUMPTIONEXISTING
Figure 64: Conceptual ST Express Service Changes with Northgate Link Extension

97 | SOUND TRANSIT 2019 SERVICE IMPLEMENTATION PLAN
DRAFT
Scheduled for completion in late 2023, East Link extends Link light rail 14 miles east, from the International District/Chinatown Station to the Overlake Transit Center via downtown Bellevue, adding ten stations along the way.
ST Express leverages East Link capacity
The completion of East Link will bring significant changes to ST Express service network to/from the Eastside, both on the SR-520 and I-90 corridors. Table 36 provides a snapshot by route of the current assumed changes in platform hours between now and 2025.
Key changes in service by route include:
Route 540 remains the same as today.
Route 541 eliminated, replaced by East Link.
Route 542 operates frequent all-day all-week between U. District and Downtown Redmond.
Route 545 operates frequent peak-only service between Bear Creek P&R and South Lake Union, the route would longer deviate to Capitol Hill or Overlake Transit Center.
Route 550 eliminated, replaced by East Link.
Routes 554, 555 and 556 restructured and resources merged, to provide a frequent all-day all-week connection between Downtown Bellevue and Issaquah. I-90 Seattle bound customers transfer at South Bellevue Station. Downtown Bellevue to U. District & Northgate segment eliminated and replaced by East Link. Alternate service across SR-520 would continue to be available on King County Metro Route 271.
ROUTE 2019
PLATFORM HOURS
2023 PLATFORM
HOURS 540 11,352 9,000 541 12,539 - 542 30,180 62,000 545 80,781 49,000 550 69,717 - 554 44,115
83,000 555 7,692 556 10,098 Total 266,474 203,000
East Link Extension (2023)
Service Assumptions: A Preliminary Look
All elements in these sections are preliminary and subject to revision and refinement in future planning efforts. Any major service change requires a full public engagement and Board adoption process.
!
Table 36: ST Express Platform Hours Changes with East Link

ISSAQUAH
P P
P
P
P
P
SEATTLE Wilburton
JudkinsPark
Issaquah TC
IssaquahHighlands
DowntownIssaquah
Eastgate
BELLEVUE SAMMAMISH
REDMOND
MERCERISLAND
MercerIsland
South Bellevue
East MainBellevue Downtown
Spring District / 120thBel-Red/130th
Overlake Village
Redmond Technology
SE Redmond
Downtown Redmond
University of Washington
KIRKLAND
U District
Redmond TC
Link Light RailST ExpressStation
ISSAQUAH
SEATTLE Bellevue Transit CenterBELLEVUE SAMMAMISH
REDMOND
MERCERISLAND
Redmond TCP Bear Creek P&R
Overlake TC
Issaquah TC
IssaquahHighlands
DowntownIssaquah
EastgateMercerIsland
RainierFreeway Sta.
KIRKLAND
Link Light RailST ExpressStation
98
FIVE YEAR
SERIVC
E OU
TLOO
K &
PLAN
DRAFTEXISTING
FUTURE ASSUMPTION
Figure 65: Conceptual ST Express Service Changes with East Link Extension

99 | SOUND TRANSIT 2019 SERVICE IMPLEMENTATION PLAN
DRAFT
Scheduled for completion in late 2024, a year after East Link, the Downtown Redmond Link extension extends Link light rail 3 miles east, from the Redmond Technology Center to Downtown Redmond, adding two stations along the way.
ST Express changes Redmond terminals
The completion of Downtown Redmond Link Extension will bring some minor changes to ST Express service network in Redmond, although no changes in service levels is anticipated with the opening of the Downtown Redmond Link Extension. Table 37 provides a snapshot by route of the current assumed changes in platform hours between now and 2025.
Key changes in service by route include:
Route 542 changes terminals in Redmond, starting at the new SE Redmond Station and operating to/from U. District. No change in service levels from 2023.
Route 545 remains the same as with East Link, operating between Bear Creek P&R and South Lake Union.
ROUTE 2019
PLATFORM HOURS
2024 PLATFORM
HOURS 542 30,180 62,000 545 80,781 49,000 Total 110,961 111,000
Downtown Redmond Link Extension (2024)
Table 37: ST Express Platform Hours Changes with Redmond Link
Service Assumptions: A Preliminary Look
All elements in these sections are preliminary and subject to revision and refinement in future planning efforts. Any major service change requires a full public engagement and Board adoption process.
!

RedmondTechnology
Redmond TC
Bear Creek P&RRedmond Way
NE 85th St
154th Ave NE
to Bellevue / Downtown Seattle
P
P
P
DowntownRedmond
SE Redmond
Link Light RailST ExpressStation
RedmondTechnology
Redmond TC
Bear Creek P&RRedmond Way
NE 85th St
154th Ave NE
to Bellevue / Downtown Seattle
P
Link Light RailST ExpressStation
100
FIVE YEAR
SERIVC
E OU
TLOO
K &
PLAN
DRAFTPOST EAST LINK (2023) FUTURE ASSUMPTION
Figure 66: Conceptual ST Express Service Changes with Downtown Redmond Link Extension

101 | SOUND TRANSIT 2019 SERVICE IMPLEMENTATION PLAN
DRAFT
Scheduled for completion in mid-2024, Lynnwood Link extends Link light rail 8.5 miles north, from the Northgate Station to the Lynnwood Transit Center, adding four stations along the way.
ST Express leverages Lynnwood Link reliability
The completion of Lynnwood Link will bring significant changes to ST Express service network to/from the Snohomish County along the I-5 North corridor. The extension will also provide significant reliability benefits for customers in that corridor. Table 38 provides a snapshot by route of the current assumed changes in platform hours between now and 2025.
Key changes in service by route include:
ST Express customers will transfer to Link in Lynnwood, if traveling to Downtown Seattle or other stations South of Lynnwood
Routes 510 and 512 resources merged, to provide a frequent all-day all-week connection between Downtown Everett and Lynnwood Transit Center, via South Everett.
Routes 511 and 513 resources merged, to provide a frequent peak-only bidirectional connection between Seaway Transit Center and Lynnwood Transit Center, via Eastmont P&R and Ash Way P&R.
ROUTE 2019
PLATFORM HOURS
2024 PLATFORM
HOURS 510 18,912 56,000 511 19,027 16,000 512 56,873 - 513 9,635 - Total 104,448 72,000
Lynnwood Link Extension (2024)
Table 38: ST Express Platform Hours Changes with Lynnwood Link
Service Assumptions: A Preliminary Look
All elements in these sections are preliminary and subject to revision and refinement in future planning efforts. Any major service change requires a full public engagement and Board adoption process.
!

to Downtown Seattle
Seaway TC
Ash Way
EVERETT
LYNNWOOD
MOUNTLAKETERRACE
P Northgate
P Shoreline South/145th
P Shoreline North/185th
P
PLynnwood City Center
SHORELINE
Mountlake Terrace
Everett Station
Eastmont P&R
South Everett P&R
Link Light RailST ExpressStation
to Downtown Seattle
Everett Station
Evergreen Way
Eastmont P&R
South Everett P&R
Ash Way
Lynnwood TransitCenter
Mountlake Terrace
N 145th St
EVERETT
LYNNWOOD
MOUNTLAKETERRACE
Downtown Everett
ST ExpressStation
102
FIVE YEAR
SERIVC
E OU
TLOO
K &
PLAN
DRAFT
EXISTING FUTURE ASSUMPTION
Figure 67: Conceptual ST Express Service Changes with Lynnwood Link Extension

103 | SOUND TRANSIT 2019 SERVICE IMPLEMENTATION PLAN
DRAFT
Scheduled for completion in late 2024, Federal Way Link extends Link light rail 7.8 miles south, from the Angle Lake Station to the Federal Way Transit Center, adding three stations along the way.
ST Express leverages Federal Way Link reliability
The completion of Federal Way Link will bring significant changes to ST Express service network to/from the South King County and Pierce County, The extension will also provide significant reliability benefits for customers in that corridor. Table 39 provides a snapshot by route of the current assumed changes in platform hours between now and 2025.
Key changes in service by route include:
ST Express customers will transfer to Link in Federal Way, if traveling to Downtown Seattle or other stations north of Federal Way.
Route 574 extended to Burien and Westwood Village, continuing to provide connections to SeaTac Airport.
Route 577 eliminated, replaced by Federal Way Link.
Route 578 terminates at Federal Way, providing off-peak connections between the SR-167 corridor and Federal Way.
Route 590 terminates at Federal Way, providing frequent peak-direction service between Downtown Tacoma and Federal Way Transit Center.
Route 592 terminates at Federal Way, continuing to provide peak-only service to/from DuPont P&R and Lakewood
Route 594 terminates at Federal Way, providing a frequent all-day all-week connection between Lakewood Station and Federal Way Transit Center, via Downtown Tacoma.
Route 595 remains the same, providing peak-only service between Gig Harbor and Downtown Seattle.
ROUTE 2019
PLATFORM HOURS
2024 PLATFORM
HOURS 574 44,358 69,000 577 24,960 - 578 36,293 37,000 590 52,300 16,000 592 20,693 24,000 594 50,083 63,000 595 8,007 8,000 Total 236,694 217,000
Federal Way Link Extension (2024)
Table 39: ST Express Platform Hours Changes with Federal Way
Service Assumptions: A Preliminary Look
All elements in these sections are preliminary and subject to revision and refinement in future planning efforts. Any major service change requires a full public engagement and Board adoption process.
!

SEATAC
RENTONTUKWILA
KENT
AUBURN
BONNEYLAKE
SUMNER
PUYALLUP
TACOMA
LAKEWOOD
FEDERALWAY
Federal Way P
P
PS 272 St/Star Lake
Kent/Des Moines
PAngle Lake
SeaTac Airport
AuburnP
SumnerPPuyallup P
595
574
594Tacoma Dome
Commerce& 10th
Purdy P&R
Kimball Drive P&R
Narrows P&R
Tacoma Comm. College TC
SR 512 P&RLakewood Stationto Dupont
to Westwood Village to Seattle
595594
592590574
578
574
592
595
Link Light RailST ExpressStation
SEATAC
RENTONTUKWILA
KENT
AUBURN
BONNEYLAKE
SUMNER
PUYALLUP
TACOMA
LAKEWOOD
FEDERALWAY
PAngle Lake
SeaTac Airport
S 272 St/Star Lake
Kent/Des Moines
Federal Way P
577578
AuburnP
SumnerPPuyallup P
Tacoma Dome
Commerce& 10th
Purdy P&R
Kimball Drive P&R
Narrows P&R
Tacoma Comm. College TC
SR 512 P&RLakewood Stationto Dupont
to Westwood Village to Seattle
595594
592590574
578
574
592
595
Link Light RailST ExpressStation
104
FIVE YEAR
SERIVC
E OU
TLOO
K &
PLAN
DRAFT
FUTURE ASSUMPTION
EXISTING
Figure 68: Conceptual ST Express Service Changes with Federal Way Link Extension

105 | SOUND TRANSIT 2019 SERVICE IMPLEMENTATION PLAN
DRAFT
Scheduled for completion in late 2024, SR-522/NE 145th BRT will connect communities along the SR-522 corridor to Link light rail at the Shoreline South Station.
ST Express sets the stage for BRT
The completion of the SR-522 BRT will bring changes to the ST Express service network in the corridor. This new mode will also provide significant reliability benefits for customers in that corridor. Table 40 provides a snapshot by route of the current assumed changes in platform hours between now and 2025.
Key changes in service by route include:
Rt. 522 operates peak-only service and truncates at Northgate or Roosevelt Station, continuing to provide connections along the SR-522 corridor. Note that the all-day, all-week truncation to Northgate or Roosevelt would occur as part of the Northgate Link extension in 2021. At that time, Route 522 performance will be evaluated to determine if service to Woodinville will still be warranted once the SR-522 BRT begins service.
ROUTE 2019
PLATFORM HOURS
2024 PLATFORM
HOURS 522 59,099 17,000 Total 59,099 17,000
SR 522/NE 145th BRT (2024)
Table 40: ST Express Platform Hours Changes with SR-522
Service Assumptions: A Preliminary Look
All elements in these sections are preliminary and subject to revision and refinement in future planning efforts. Any major service change requires a full public engagement and Board adoption process.
!

N
Woodinville P&R
UW Bothell / Cascadia CC
KenmoreP&R
Bothell Way NE &Ballinger Way
Lake City Way & NE 130th St
BOTHELL WOODINVILLE
KENMORE
LAKE CITY
SHORELINE
KIRKLAND
LAKEFOREST
PARK
to Downtown Seattle
Link Light Rail
Bus Rapid TransitST Express
P
StationStation with Parking
N
P
P
P
BOTHELL WOODINVILLE
KENMORE
LAKE CITY
SHORELINE
KIRKLAND
LAKEFOREST
PARK
to Downtown Seattle / Federal Way / Redmond Technology
Woodinville P&R
UW Bothell / Cascadia CC
KenmoreP&R
Bothell Way NE &Ballinger Way
Lake City Way & NE 145th StShoreline South /NE 145th St
Northgate
Roosevelt
Shoreline North /NE 185th St
PMountlake Terrace
Link Light Rail
Bus Rapid TransitST Express
P
StationStation with Parking
106
FIVE YEAR
SERIVC
E OU
TLOO
K &
PLAN
DRAFTEXISTING
FUTURE ASSUMPTION
Figure 69: Conceptual ST Express Service Changes with SR 522 / NE 145th BRT

107 | SOUND TRANSIT 2019 SERVICE IMPLEMENTATION PLAN
DRAFT
Scheduled for completion in late 2024, the I-405 BRT will connect communities along Interstate 405 between Lynnwood and Burien via Downtown Bellevue.
ST Express sets the stage for BRT
The completion of the I-405 BRT will bring changes to ST Express service network in the corridor. This new mode will also provide reliability benefits for customers in that corridor. Table 41 provides a snapshot by route of the current assumed changes in platform hours between now and 2025.
Key changes in service by route include:
Rt. 532 now serves UW Bothell/Cascadia College Campus, continuing to provide peak-only connections between Bellevue and Everett.
Rt. 535 is eliminated, replaced by I-405 BRT.
Rt. 560 is eliminated, replaced by I-405 BRT.
Rt. 566 remains the same, continuing to provide weekday connections between South King County, Bellevue, and Overlake.
Rt. 567 remains the same, continuing to provide peak-only connections between South King County, Bellevue, and Overlake.
Route 574 extended to Burien and Westwood Village, continuing to provide connections to SeaTac Airport as part of the Federal Way Link Extension project.
ROUTE 2019
PLATFORM HOURS
2024 PLATFORM
HOURS 532 18,364 30,000 535 24,421 - 560 38,499 - 566 31,051 34,000 567 13,077 12,000 Total 125,412 76,000
I-405 BRT (2024)
Table 41: ST Express Platform Hours Changes with I-405 BRT
Service Assumptions: A Preliminary Look
All elements in these sections are preliminary and subject to revision and refinement in future planning efforts. Any major service change requires a full public engagement and Board adoption process.
!

to Kent / Auburn
SEATAC
RENTON
TUKWILA
532
566
567
566567
535
560
560
532
535
Bellevue TC
LynnwoodCity Center
UW Bothell/Cascadia College
NE 85th St
BurienTC
Tukwila / Int’l Blvd
SouthRenton
TC
NE 44th St
Totem Lake
Brickyard
Canyon Park
Lynnwood TC
UW Bothell/Cascadia College
BurienTC
Tukwila / Int’l Blvd
Renton TC
Totem Lake
Brickyard
Canyon Park
Bellevue TC
SeaTac Airport SeaTac Airport
to Everett
to Kent / Auburn
to RedmondTechnology
532
566
567
566567
532
to Everett
0 2 41Miles
0 2 41Miles
Link Light Rail
SEATAC
RENTON
TUKWILA
BRT
ST ExpressStation
Link Light RailST ExpressStation
108
FIVE YEAR
SERIVC
E OU
TLOO
K &
PLAN
DRAFTEXISTING FUTURE ASSUMPTION
Figure 70: Conceptual ST Express Service Changes with I-405 BRT

109 | SOUND TRANSIT 2019 SERVICE IMPLEMENTATION PLAN
DRAFT
Per Federal Transit Administration (FTA) requirement, transit agencies in regions of over 200,000 people and that operate over 50 buses during peak periods are required to conduct a Title VI service and fare equity (SAFE) analysis when implementing a major service change and/or implementing fare changes. An equity analysis assesses the impacts of service and/or fare changes, positive or negative, on minority, low income, and limited English proficiency (LEP) customers. Each SAFE analysis includes a public outreach period to ensure that customers can comment on the impacts and results of the proposed changes.
Sound Transit’s adopted policy defines a major service changes as “any single change in service on an individual bus or rail route that would add or eliminate more than 25 percent of the route’s weekly platform service hours, and/or move the location of a stop or station by more than a half mile.” Sound Transit uses this policy when developing SAFE analysis for a service change. In addition, per FTA Circular 4702.1B, transit agencies that receive FTA funding
are required to perform a SAFE analysis for New Starts and Small Starts projects, as well as other New Fixed Guideway and major capital projects. These type of SAFE analyses are required to be conducted six months to a year prior to the project’s opening date, whether or not changes to existing service rise to the level of “major service change” as defined by the transit provider.
Table 42 below includes more details on the specific timelines for each of the SAFE analyses that Sound Transit will conduct as part of the Sound Transit 2 (ST2) buildout of the system. The analysis will look at the equity impacts of potential changes to transit service in the respective corridor to be served by the light rail extensions or major facility identified in each SAFE. Sound Transit will engage the public and its partner agencies to develop the respective SAFE analysis. Sound Transit will monitor construction and opening date schedules and work with partner agencies if changes impact the respective SAFE analysis schedule.
PROJECT MODE OF SERVICE PROJECT TYPE
SAFE DEVELOPMENT TIMELINE & PUBLIC
ENGAGEMENT SCHEDULED
OPENING DATE
OMF: East Link Light rail Capital Facility Summer 2019 to Summer 2020 December 2020 Northgate Link Link Light rail Fixed Guideway Spring 2020 to Spring 2021 Late 2021
OMF Expansion Tacoma Link Capital Facility Spring 2020 to Spring 2021 2021 Tacoma Link Expansion Tacoma Link Fixed Guideway Spring 2021 to Spring 2022 2022
Maintenance Base Sounder Capital Facility Spring 2021 to Spring 2022 2022 East Link Link Light rail Fixed Guideway Spring 2022 to Spring 2023 Late 2023
Maintenance Base BRT Capital Facility Spring 2022 to Spring 2023 2023 Lynnwood Link Link Light rail Fixed Guideway Spring 2022 to Spring 2023 Mid 2024
Redmond Link Extension Link Light rail Fixed Guideway Spring 2023 to Spring 2024 Late 2024 Federal Way Link Extension Link Light rail Fixed Guideway Spring 2023 to Spring 2024 Late 2024
I-405 BRT BRT Fixed Guideway Spring 2023 to Spring 2024 Late 2024 SR-522 BRT BRT Fixed Guideway Spring 2023 to Spring 2024 Late 2024
Service and Fare Equity SAFE analysis timelines
Table 42: Service and Fare Equity Timelines
110
FIVE YEAR
SERIVC
E OU
TLOO
K &
PLAN
DRAFT

111 | SOUND TRANSIT 2019 SERVICE IMPLEMENTATION PLAN
CORRIDOR PROFILES
Key performance indicators For each route in the corridor, shows:
Average total daily boardings for weekdays, Saturdays, and Sundays
On-time performance, showing the percentage of trips operating on time, as defined by the Service Standards
Average passengers per trip for weekdays.
Service Levels This diagram gives a glimpse of how often buses and trains arrive on the corridor by day of week and direction and how long service runs. It is not route-specific. Service frequency, how often service arrives, is grouped into four categories define in the table below. Generally, the more often transit arrives the more spontaneously customers will use the service without referencing a schedule. Frequent service also reduces wait times for customers.
SERVICE FREQUENCY Buses and trains arrive every:
Very Frequent Less than 10 minutes Frequent 10 to 20 minutes Moderate 21 to 30 minutes Minimum 31 to 60 minutes
Corridor
Identifies the corridor being profiled.
Corridor Map Illustrates the primary alignment of each route on the corridor and calls out timepoint stops. Many routes have more stops, although for clarity only timepoints are shown.
ROUTE PROFILES HOW TO INTERPRET THE DETAILED DATA

112
Individual Trip Ridership & Passenger Load Graphs Each graph illustrates the average ridership and maximum passenger load of the route by individual trip for both directions of the service.
Average Ridership by Trip The green line shows the Average Passenger Boardings for each trip. This is the total number of passengers who boarded the bus during the entire trip and may be higher than the maximum passenger load.
Average Passenger Boardings
Average Maximum Passenger Load Blue: seated passengers Orange/Red: standing passengers
Average Maximum Passenger Load Colored bars show the Average Maximum Passenger Load for each trip that the route operates. This is the point in the trip where the number of passengers on the transit vehicle at a specific point was the highest. Blue are seated passengers, while orange and red show standing passengers. Standing loads are a normal occurrence on a healthy transit system, including Sound Transit, and are not a sole cause for immediate action. Sound Transit continually monitors service and uses the service standards to identify crowding conditions. The agency uses several service management tools to reduce overcrowding as the budget allows, including: schedule adjustments to balance loads, assigning larger buses or longer train consists, and adding additional trips.
Available Capacity Blue: seats Red: seats plus standing
Available Capacity The light blue bars show total available capacity for each trip, both seated and standing passengers. The capacity shown is based on the vehicle scheduled to operate the individual trip and the number of standing passengers is defined based on the service standards.
ROUTE PROFILES
Route Map Illustrates the primary alignment of the route in the context of the greater corridor. Timepoint stops are called out and other stops are marked with white dots though not labelled.
Stop-Level Ridership Average weekday boardings and alightings are shown for each stop for each direction of the route. Timepoint stops are in bold and correspond with the stops shown on the route map above.
Three-Year Ridership Trends Graphs display average boardings on weekdays, Saturdays, and Sundays for each of the past three years. Ridership trends are shaped by service modifications or changes in demand.
RO
UTE PR
OFILES

113 | SOUND TRANSIT 2019 SERVICE IMPLEMENTATION PLAN
DRAFTI-5 North
NEverett Station
Evergreen Way
Eastmont P&R
South Everett P&R
Ash Way
Lynnwood TransitCenter
Mountlake Terrace
N 145th St
N 45th St
EVERETT
LYNNWOOD
MOUNTLAKETERRACE
SEATTLE
Downtown Everett
BELLEVUEDowntownSeattle510 511 512 513
511 512 513
512
512
511 512 535
511 512 532
510 512 532
510 512 532
510 512
513
513

Corridor I-5 NorthDay Type Direction 2 3 4 5 6 7 8 9 10 11 12 13 14 15 16 17 18 19 20 21 22 23 24 25Weekday Northbound
Weekday Southbound
Saturday Northbound
Saturday Southbound
Sunday Northbound
Sunday Southbound
Hour
Service Frequency Legend Very Frequent (<10 min) Frequent (10-20 min) Moderate (20-30 min) Minimum (30-60 min)
114
Routes
510 511 512 513DRAFT
I- 5 North
2,001
1,997
4,050
661
0 2,000 4,000 6,000
510
511
512
513
4,300
0 2,000 4,000 6,000
510
511
512
513
2,930
0 2,000 4,000 6,000
510
511
512
513
85%
86%
91%
85%
0% 50% 100%
510
511
512
513
48
54
38
32
0 20 40 60
510
511
512
513
Passengers per TripOTP
Weekday Ridership Saturday Ridership Sunday Ridership
OTP Standard

N Everett Station
Evergreen Way
Eastmont P&R
South Everett P&R
Ash Way
Lynnwood TransitCenter
Mountlake Terrace
N 145th St
N 45th St
EVERETT
LYNNWOOD
MOUNTLAKETERRACE
SEATTLE
Downtown Everett
BELLEVUEDowntownSeattle510 511 512 513
511 512 513
512
512
511 512 535
511 512 532
510 512 532
510 512 532
510 512
513
513
115 | SOUND TRANSIT 2019 SERVICE IMPLEMENTATION PLAN
DRAFT2015 2016 2017 SPRING 2018
Ride
rshi
pAverage Weekday Boardings 1,938 1,913 1,983 2,001
Average Saturday Boardings N/A N/A N/A N/A
Average Sunday Boardings N/A N/A N/A N/A
Annual Boardings 494,221 488,401 503,600
Route 510 Everett – SeattleI-5 North
NORTHBOUND STOPSto EVERETT
Average WeekdayOns Offs
4th Ave & S Jackson St 128 04th Ave & Washington St 28 1
4th Ave & Cherry St 121 24th Ave & Seneca St 153 54th Ave & Pike St 241 13
Olive Way & 6th Ave 139 5Howell St & 9th Ave 112 5
South Everett Freeway Station 29 370Broadway Ave & 34th St 2 68
Everett Station 0 484Northbound Total 951 951
SOUTHBOUND STOPSto SEATTLE
Average WeekdayOns Offs
Hewitt Ave & Fulton St 7 0Hewitt Ave & Lombard Ave 3 0
Wetmore Ave & Wall St 4 0Pacific Ave & Rockefeller Ave 2 0
Everett Station 594 7Broadway & 34th St 63 0
South Everett Freeway Station 337 6Stewart St & 9th Ave 13 241Stewart St & 7th Ave 9 1445th Ave & Pine St 13 234
5th Ave & Seneca St 14 1605th Ave & Cherry St 2 98
5th Ave & Jefferson St 9 685th Ave & S Jackson St 0 111
Southbound Total 1,070 1,070Total 2,022 2,022

116
Route 510 E
verett – Seattle
DRAFT I-5 N
orth
Weekday Northbound Average Trip Ridership & Maximum Passenger Loads
Weekday Southbound Average Trip Ridership & Maximum Passenger Loads
0
10
20
30
40
50
60
70
80
90
100
110
120
4:13
4:33
4:53
5:20
5:35
5:43
5:50
6:00
6:10
6:20
6:30
6:40
6:50
7:00
7:15
7:30
7:45
8:00
8:15
8:30
8:45Pa
ssen
ger B
oard
ings/C
apac
ity p
er T
rip
Trip Start Time
0
10
20
30
40
50
60
70
80
90
100
110
120
14:35
14:50
15:05
15:16
15:28
15:44
15:55
16:05
16:15
16:25
16:35
16:45
16:55
17:05
17:15
17:25
17:35
17:50
18:10
18:30
18:50Pa
ssen
ger B
oard
ings/C
apac
ity p
er T
rip
Trip Start Time
Average Maximum Passenger Load Orange/Red: standing passengers Blue: seated passengers
Average Passenger Boardings
Available Capacity Red: seats plus standing Blue: seats
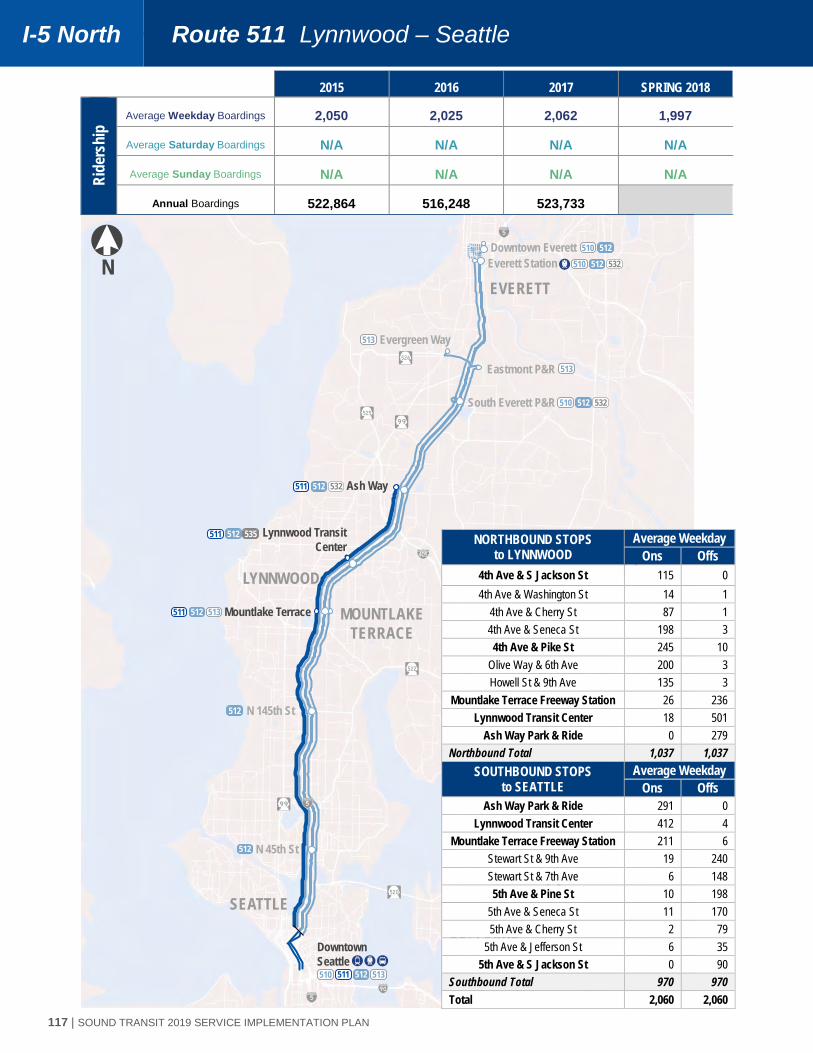
N Everett Station
Evergreen Way
Eastmont P&R
South Everett P&R
Ash Way
Lynnwood TransitCenter
Mountlake Terrace
N 145th St
N 45th St
EVERETT
LYNNWOOD
MOUNTLAKETERRACE
SEATTLE
Downtown Everett
BELLEVUEDowntownSeattle510 511 512 513
511 512 513
512
512
511 512 535
511 512 532
510 512 532
510 512 532
510 512
513
513
511
117 | SOUND TRANSIT 2019 SERVICE IMPLEMENTATION PLAN
DRAFT2015 2016 2017 SPRING 2018
Ride
rshi
pAverage Weekday Boardings 2,050 2,025 2,062 1,997
Average Saturday Boardings N/A N/A N/A N/A
Average Sunday Boardings N/A N/A N/A N/A
Annual Boardings 522,864 516,248 523,733
Route 511 Lynnwood – SeattleI-5 North
NORTHBOUND STOPSto LYNNWOOD
Average WeekdayOns Offs
4th Ave & S Jackson St 115 04th Ave & Washington St 14 1
4th Ave & Cherry St 87 14th Ave & Seneca St 198 34th Ave & Pike St 245 10
Olive Way & 6th Ave 200 3Howell St & 9th Ave 135 3
Mountlake Terrace Freeway Station 26 236Lynnwood Transit Center 18 501
Ash Way Park & Ride 0 279Northbound Total 1,037 1,037
SOUTHBOUND STOPSto SEATTLE
Average WeekdayOns Offs
Ash Way Park & Ride 291 0Lynnwood Transit Center 412 4
Mountlake Terrace Freeway Station 211 6Stewart St & 9th Ave 19 240Stewart St & 7th Ave 6 1485th Ave & Pine St 10 198
5th Ave & Seneca St 11 1705th Ave & Cherry St 2 79
5th Ave & Jefferson St 6 355th Ave & S Jackson St 0 90
Southbound Total 970 970Total 2,060 2,060

118
Route 511 Lynnw
ood – Seattle
DRAFT I-5 N
orth
Weekday Northbound Average Trip Ridership & Maximum Passenger Loads
Weekday Southbound Average Trip Ridership & Maximum Passenger Loads
0
10
20
30
40
50
60
70
80
90
100
110
120
4:21
4:41
5:01
5:21
5:41
5:56
6:11
6:26
6:40
6:55
7:10
7:25
7:39
7:54
8:09
8:25
8:40
8:55Pa
ssen
ger B
oard
ings/C
apac
ity p
er T
rip
Trip Start Time
0
10
20
30
40
50
60
70
80
90
100
110
120
14:31
14:46
15:01
15:15
15:28
15:41
15:53
16:06
16:19
16:33
16:47
17:04
17:22
17:42
18:00
18:18
18:33
18:47
19:02Pa
ssen
ger B
oard
ings/C
apac
ity p
er T
rip
Trip Start Time
Average Maximum Passenger Load Orange/Red: standing passengers Blue: seated passengers
Average Passenger Boardings
Available Capacity Red: seats plus standing Blue: seats

N Everett Station
Evergreen Way
Eastmont P&R
South Everett P&R
Ash Way
Lynnwood TransitCenter
Mountlake Terrace
N 145th St
N 45th St
EVERETT
LYNNWOOD
MOUNTLAKETERRACE
SEATTLE
Downtown Everett
BELLEVUEDowntownSeattle510 511 512 513
511 512 513
512
512
511 512 535
511 512 532
510 512 532
510 512 532
510 512
513
513
511
119 | SOUND TRANSIT 2019 SERVICE IMPLEMENTATION PLAN
DRAFT2015 2016 2017 SPRING 2018
Ride
rshi
pAverage Weekday Boardings 4,140 4,064 4,024 4,050
Average Saturday Boardings 4,190 4,145 4,233 4,300
Average Sunday Boardings 2,717 2,847 2,903 2,930
Annual Boardings 1,431,104 1,424,904 1,421,457
Route 512 Everett – SeattleI-5 North
NORTHBOUND STOPSto EVERETT
Average WeekdayOns Offs
4th Ave & S Jackson St 465 04th Ave & Washington St 48 2
4th Ave & Cherry St 158 664th Ave & Seneca St 218 384th Ave & Pike St 469 36
Olive Way & 6th Ave 233 18Howell St & 9th Ave 184 24
I-5 & NE 45th St Freeway Station 248 191I-5 & NE 145th St Freeway Station 38 52
Mountlake Terrace Freeway Station 26 200Lynnwood Transit Center 68 627
Ash Way Park & Ride 30 355South Everett Freeway Station 16 175
Broadway Ave & 34th St 2 68Everett Station 4 347
Pacific Ave & Rockefeller Ave 0 1Wetmore Ave & Wall St 0 4
Hewitt Ave & Lombard Ave 1 1Hewitt Ave & Virginia Ave 0 2
Northbound Total 2,207 2,207SOUTHBOUND STOPS
to SEATTLEAverage Weekday
Ons OffsEverett Station 476 0
Broadway & 34th St 51 3South Everett Freeway Station 148 21
Ash Way Park & Ride 335 36Lynnwood Transit Center 570 73
Mountlake Terrace Freeway Station 160 32I-5 & NE 145th St Freeway Station 43 43I-5 & NE 45th St Freeway Station 90 256
Stewart St & 9th Ave 26 289Stewart St & 7th Ave 19 1735th Ave & Pine St 42 489
5th Ave & Seneca St 30 1425th Ave & Cherry St 13 75
5th Ave & Jefferson St 32 885th Ave & S Jackson St 5 321
Southbound Total 2,040 2,040Total 4,248 4,248

120
Route 512 E
verett – Seattle
DRAFT I-5 N
orth
Weekday Northbound Average Trip Ridership & Maximum Passenger Loads
Weekday Southbound Average Trip Ridership & Maximum Passenger Loads
0
10
20
30
40
50
60
70
80
90
100
110
120
9:099:009:109:209:309:409:5010:0010:1510:3010:4511:0011:1511:3011:4512:0012:1512:3012:4513:0013:1513:3013:4514:0014:1514:3014:4515:0015:1515:3015:4516:0016:1516:3016:4517:0017:1517:3017:4518:0018:1518:3018:4519:0019:2019:4020:0020:2020:4021:0021:3022:0022:30
Pass
enge
r Boa
rding
s/Cap
acity
per
Trip
Trip Start Time
0
10
20
30
40
50
60
70
80
90
100
110
120
5:235:385:536:086:236:386:537:087:237:387:538:088:238:388:539:089:239:389:5310:0810:2310:3810:5311:0811:2311:3811:5312:0812:2312:3812:5313:0813:2313:3813:4813:5814:0814:1819:1019:2019:3019:4319:5820:1320:2820:4821:0821:2821:4822:0822:3823:0823:380:08
Pass
enge
r Boa
rding
s/Cap
acity
per
Trip
Trip Start Time
Average Maximum Passenger Load Orange/Red: standing passengers Blue: seated passengers
Average Passenger Boardings
Available Capacity Red: seats plus standing Blue: seats

121 | SOUND TRANSIT 2019 SERVICE IMPLEMENTATION PLAN
DRAFT
Saturday Southbound Average Trip Ridership & Maximum Passenger Loads
Saturday Northbound Average Trip Ridership & Maximum Passenger Loads
0
10
20
30
40
50
60
70
80
90
100
110
120
5:386:086:387:087:388:088:389:089:3810:0810:2810:4811:0811:2811:4812:0812:2812:4813:0813:2313:3813:5314:0814:2314:3814:5315:0815:2315:3815:5316:0816:2316:3816:5317:0817:2317:3817:5318:0818:2818:4819:0819:2819:4820:0820:3821:0821:3822:0822:3823:0823:380:08
Pass
enge
r Boa
rding
s/Cap
acity
per
Trip
Trip Start Time
0
10
20
30
40
50
60
70
80
90
100
110
120
5:005:306:006:306:507:107:307:508:108:308:509:109:309:5010:1010:3010:4511:0011:1511:3011:4512:0012:1512:3012:4513:0013:1513:3013:4514:0014:1514:3014:4515:0015:1515:3015:4516:0016:1516:3016:5017:1017:3018:0018:3019:0019:3020:0020:3021:0021:3022:0022:30
Pass
enge
r Boa
rding
s/Cap
acity
per
Trip
Trip Start Time
Average Maximum Passenger Load Orange/Red: standing passengers Blue: seated passengers
Average Passenger Boardings
Available Capacity Red: seats plus standing Blue: seats

122
Route 512 E
verett – Seattle
DRAFT I-5 N
orth
Southbound Average Trip Ridership & Maximum Passenger Loads Sunday
Sunday Northbound Average Trip Ridership & Maximum Passenger Loads
0
10
20
30
40
50
60
70
80
90
100
110
120
5:306:006:307:007:308:008:309:009:3010:0010:3011:0011:3012:0012:3013:0013:3014:0014:3015:0015:3016:0016:3017:0017:3018:0018:3019:0019:3020:0020:3021:0021:3022:0022:30
Pass
enge
r Boa
rding
s/Cap
acity
per
Trip
Trip Start Time
0
10
20
30
40
50
60
70
80
90
100
110
120
5:386:086:387:087:388:088:389:089:3810:0810:3811:0811:3812:0812:3813:0813:3814:0814:3815:0815:3816:0816:3817:0817:3818:0818:3819:0819:3820:0820:3821:0821:3822:0822:3823:0823:380:08
Pass
enge
r Boa
rding
s/Cap
acity
per
Trip
Trip Start Time
Average Maximum Passenger Load Orange/Red: standing passengers Blue: seated passengers
Average Passenger Boardings
Available Capacity Red: seats plus standing Blue: seats
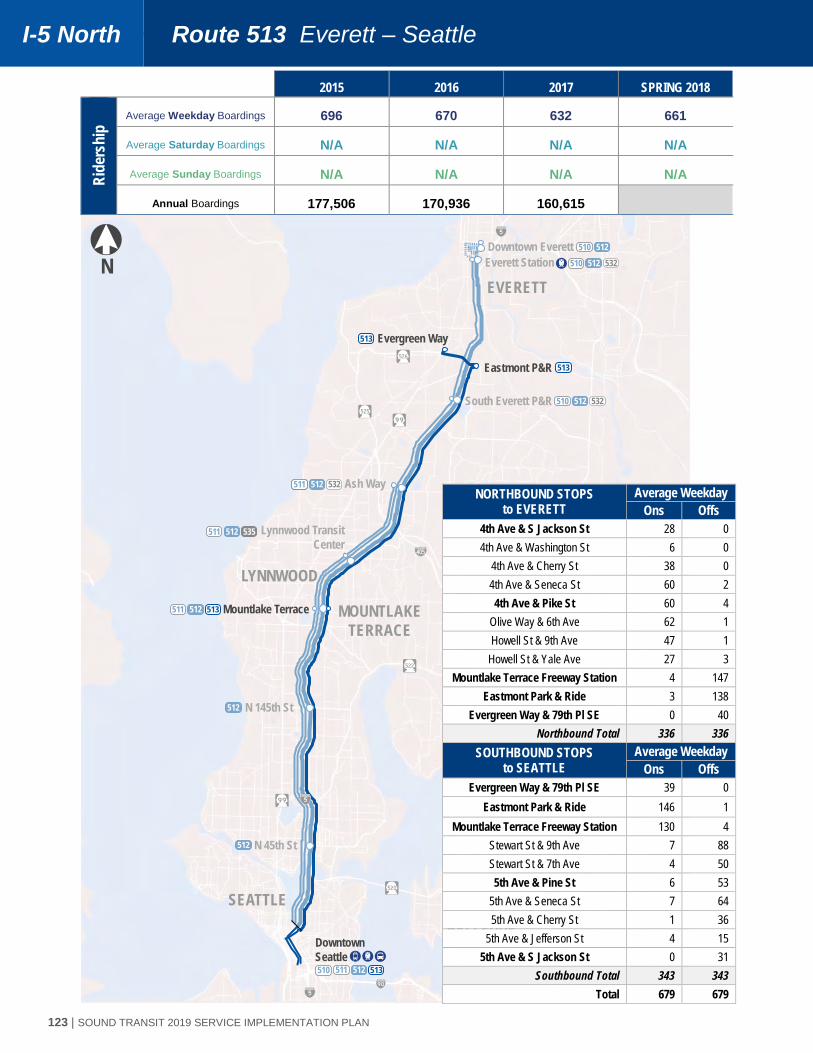
N Everett Station
Evergreen Way
Eastmont P&R
South Everett P&R
Ash Way
Lynnwood TransitCenter
Mountlake Terrace
N 145th St
N 45th St
EVERETT
LYNNWOOD
MOUNTLAKETERRACE
SEATTLE
Downtown Everett
BELLEVUEDowntownSeattle510 511 512 513
511 512 513
512
512
511 512 535
511 512 532
510 512 532
510 512 532
510 512
513
513
511
123 | SOUND TRANSIT 2019 SERVICE IMPLEMENTATION PLAN
DRAFT2015 2016 2017 SPRING 2018
Ride
rshi
pAverage Weekday Boardings 696 670 632 661
Average Saturday Boardings N/A N/A N/A N/A
Average Sunday Boardings N/A N/A N/A N/A
Annual Boardings 177,506 170,936 160,615
Route 513 Everett – SeattleI-5 North
NORTHBOUND STOPSto EVERETT
Average WeekdayOns Offs
4th Ave & S Jackson St 28 04th Ave & Washington St 6 0
4th Ave & Cherry St 38 04th Ave & Seneca St 60 24th Ave & Pike St 60 4
Olive Way & 6th Ave 62 1Howell St & 9th Ave 47 1
Howell St & Yale Ave 27 3Mountlake Terrace Freeway Station 4 147
Eastmont Park & Ride 3 138Evergreen Way & 79th Pl SE 0 40
Northbound Total 336 336SOUTHBOUND STOPS
to SEATTLEAverage Weekday
Ons OffsEvergreen Way & 79th Pl SE 39 0
Eastmont Park & Ride 146 1Mountlake Terrace Freeway Station 130 4
Stewart St & 9th Ave 7 88Stewart St & 7th Ave 4 505th Ave & Pine St 6 53
5th Ave & Seneca St 7 645th Ave & Cherry St 1 36
5th Ave & Jefferson St 4 155th Ave & S Jackson St 0 31
Southbound Total 343 343Total 679 679

124
Route 513 E
verett – Seattle
DRAFT I-5 N
orth
Weekday Northbound Average Trip Ridership & Maximum Passenger Loads
Weekday Southbound Average Trip Ridership & Maximum Passenger Loads
0
10
20
30
40
50
60
70
80
90
100
110
120
5:03
5:33
6:05
6:20
6:35
6:50
7:05
7:27
7:47
8:07
8:29
Pass
enge
r Boa
rding
s/Cap
acity
per
Trip
Trip Start Time
0
10
20
30
40
50
60
70
80
90
100
110
120
15:08
15:47
16:01
16:15
16:40
16:56
17:13
17:33
18:05
18:35
Pass
enge
r Boa
rding
s/Cap
acity
per
Trip
Trip Start Time
Average Maximum Passenger Load Orange/Red: standing passengers Blue: seated passengers
Average Passenger Boardings
Available Capacity Red: seats plus standing Blue: seats

Downtown Seattle522
N
Woodinville P&R
UW Bothell / Cascadia CC
522 535
522KenmoreP&R
Bothell Way NE & Ballinger Way522
Lake City Way & NE 130th St522
522
BOTHELL WOODINVILLE
KENMORE
LAKE CITY
SEATTLE
SHORELINE
KIRKLAND
BELLEVUE
LAKEFOREST
PARK
0 1 20.5Miles
125 | SOUND TRANSIT 2019 SERVICE IMPLEMENTATION PLAN
DRAFTSR 522

Corridor SR-522Day Type Direction 2 3 4 5 6 7 8 9 10 11 12 13 14 15 16 17 18 19 20 21 22 23 24 25Weekday Northbound
Weekday Southbound
Saturday Northbound
Saturday Southbound
Sunday Northbound
Sunday Southbound
Hour
Service Frequency Legend Very Frequent (<10 min) Frequent (10-20 min) Moderate (20-30 min) Minimum (30-60 min)
126
Route 522
DRAFT SR 522
4,981
0 2,000 4,000 6,000
522 2,592
0 2,000 4,000 6,000
522 1,951
0 2,000 4,000 6,000
522
89%
0% 50% 100%
522 48
0 20 40 60
522
Passengers per TripOTP
Weekday Ridership Saturday Ridership Sunday Ridership
OTP Standard

Downtown Seattle522
N
Woodinville P&R
UW Bothell / Cascadia CC
522 535
522KenmoreP&R
Bothell Way NE & Ballinger Way522
Lake City Way & NE 130th St522
522
BOTHELL WOODINVILLE
KENMORE
LAKE CITY
SEATTLE
SHORELINE
KIRKLAND
BELLEVUE
LAKEFOREST
PARK
0 1 20.5Miles
127 | SOUND TRANSIT 2019 SERVICE IMPLEMENTATION PLAN
DRAFT2015 2016 2017 SPRING 2018
Ride
rshi
pAverage Weekday Boardings 5,090 5,159 5,059 4,981
Average Saturday Boardings 2,669 2,575 2,657 2,592
Average Sunday Boardings 2,046 2,016 1,987 1,951
Annual Boardings 1,555,512 1,568,904 1,540,430
NORTHBOUND STOPSTO WOODINVILLE
Average Weekday SOUTHBOUND STOPS
TO SEATTLE
Average Weekday
Ons Offs Ons Offs6th Ave S & S Atlantic St 55 0 Woodinville Park & Ride 117 04th Ave S & S Jackson St 372 14 NE 178th Pl & NE 180th Pl 34 0
4th Ave & James St 205 14 Woodinville Snohomish & NE 190th St 36 04th Ave & Madison St 386 28 SR 522 & 132nd Ave NE 25 14th Ave & Union St 573 27 Beardslee Blvd & NE 195th St 62 5
Pike St & 6th Ave 567 17 UW Bothell & Cascadia College 158 45Lake City Way NE & NE 85th St 74 283 Woodinville Dr & Kaysner Way 192 7Lake City Way NE & NE 125th St 100 302 Bothell Way NE & NE 180th St 71 14Lake City Way NE & NE 130th St 54 109 NE Bothell Way & 80th Ave NE 63 12Lake City Way NE & NE 137th St 16 133 Kenmore Park & Ride 327 31Bothell Way NE & NE 145th St 23 129 NE Bothell Way & 68th Ave NE 133 25Bothell Way NE & NE 153rd St 9 46 NE Bothell Way & 61st Ave NE 96 9Bothell Way NE & NE 165th St 3 27 Bothell Way NE & Ballinger Way NE 46 8
Bothell Way NE & Lake Forest Park 11 100 Bothell Way NE & Brookside Blvd NE 82 9Bothell Way NE & Ballinger Way NE 7 18 Bothell Way NE & NE 165th St 22 2
NE Bothell Way & 61st Ave NE 13 99 Bothell Way NE & NE 153rd St 51 7NE Bothell Way & 68th Ave NE 36 136 Lake City Way NE & NE 145th St 160 23
NE Bothell Way & 73rd Ave NE 21 312 Lake City Way NE & NE 137th St 120 10NE Bothell Way & 80th Ave NE 10 61 Lake City Way NE & NE 130th St 121 48
Old Bothell Way NE & 98th Ave NE 14 127 Lake City Way NE & NE 125th St 231 72Beardslee Blvd & Sunrise Dr 7 133 Lake City Way NE & 20th Ave NE 232 34
UW Bothell & Cascadia College 61 186 Union St & 6th Ave 33 886Beardslee Blvd & NE 195th St 6 56 Union St & 4th Ave 7 578
SR 522 & 132nd Ave NE 1 36 2nd Ave & Marion St 9 232Woodinville Snohomish Rd & 139th Ave NE 0 40 2nd Ave & James St 2 118
NE 178th Pl & 138th Pl NE 0 50 2nd Ave Ext S & S Jackson St 4 230Woodinville Park And Ride 0 141 Airport Way S & S Royal Brougham Way 0 26
Northbound Total 2,625 2,625 Southbound Total 2,433 2,433Total 5,058 5,058
Route 522 Woodinville – SeattleSR 522

128
Route 522 W
oodinville – Seattle
DRAFT SR 522
0
10
20
30
40
50
60
70
80
90
100
110
120
4:455:235:245:445:525:576:146:186:206:446:456:507:027:117:117:277:307:467:488:088:088:268:488:519:169:189:439:4710:1710:4711:1611:4612:1512:4513:1513:4514:1514:4415:1315:4216:0916:3817:1917:5118:3319:0519:3620:0920:3921:3922:3923:39
Pass
enge
r Boa
rding
s/Cap
acity
per
Trip
Trip Start Time
0
10
20
30
40
50
60
70
80
90
100
110
120
5:295:586:256:567:247:538:238:549:259:5410:2310:5111:2011:5012:2012:4913:1813:3313:4814:0214:1714:2714:4714:5715:1415:2215:3715:5316:0616:1516:2216:3016:3816:4416:5216:5917:0617:1417:2417:3617:5018:0718:2718:4819:1719:5220:2620:5621:2622:2623:25
Pass
enge
r Boa
rding
s/Cap
acity
per
Trip
Trip Start Time
Weekday Northbound Average Trip Ridership & Maximum Passenger Loads
Weekday Southbound Average Trip Ridership & Maximum Passenger Loads
Average Maximum Passenger Load Orange/Red: standing passengers Blue: seated passengers
Average Passenger Boardings
Available Capacity Red: seats plus standing Blue: seats

129 | SOUND TRANSIT 2019 SERVICE IMPLEMENTATION PLAN
DRAFT
0
10
20
30
40
50
60
70
80
90
100
110
120
5:396:096:397:097:388:078:359:059:3410:0310:3011:0011:2911:5912:2612:5613:2613:5614:2614:5615:2615:5916:2916:5417:2417:5618:3019:0019:3020:0221:0722:0723:07
Pass
enge
r Boa
rding
s/Cap
acity
per
Trip
Trip Start Time
0
10
20
30
40
50
60
70
80
90
100
110
120
5:275:576:317:037:358:078:399:099:299:4910:0910:2910:4911:0911:2911:4912:0912:2912:4913:0913:2913:4914:0914:2914:4614:5815:1015:3015:4516:0016:1516:2716:4517:0017:1517:3017:4518:0018:1518:3018:4518:5419:1419:4120:0920:3821:3822:3823:38
Pass
enge
r Boa
rding
s/Cap
acity
per
Trip
Trip Start Time
Saturday Southbound Average Trip Ridership & Maximum Passenger Loads
Saturday Northbound Average Trip Ridership & Maximum Passenger Loads
Average Maximum Passenger Load Orange/Red: standing passengers Blue: seated passengers
Average Passenger Boardings
Available Capacity Red: seats plus standing Blue: seats
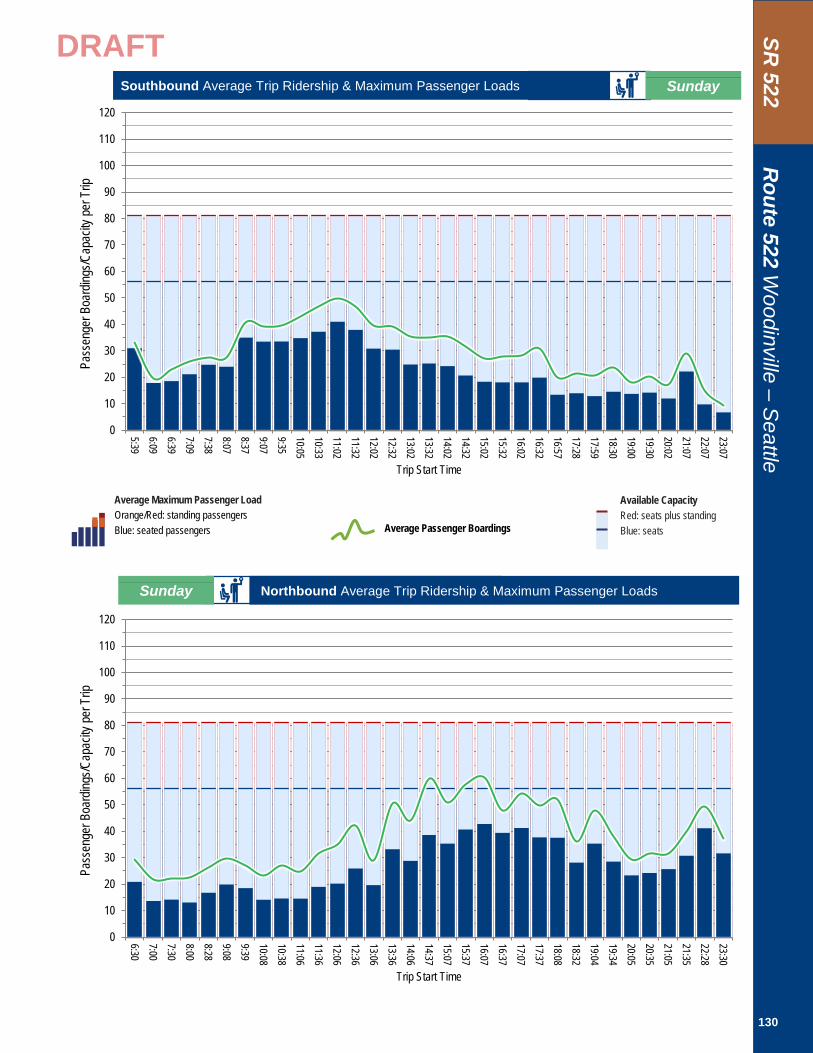
130
Route 522 W
oodinville – Seattle
DRAFT SR 522
0
10
20
30
40
50
60
70
80
90
100
110
120
6:307:007:308:008:289:089:3910:0810:3811:0611:3612:0612:3613:0613:3614:0614:3715:0715:3716:0716:3717:0717:3718:0818:3219:0419:3420:0520:3521:0521:3522:2823:30
Pass
enge
r Boa
rding
s/Cap
acity
per
Trip
Trip Start Time
0
10
20
30
40
50
60
70
80
90
100
110
120
5:396:096:397:097:388:078:379:079:3510:0510:3311:0211:3212:0212:3213:0213:3214:0214:3215:0215:3216:0216:3216:5717:2817:5918:3019:0019:3020:0221:0722:0723:07
Pass
enge
r Boa
rding
s/Cap
acity
per
Trip
Trip Start Time
Southbound Average Trip Ridership & Maximum Passenger Loads Sunday
Sunday Northbound Average Trip Ridership & Maximum Passenger Loads
Average Maximum Passenger Load Orange/Red: standing passengers Blue: seated passengers
Average Passenger Boardings
Available Capacity Red: seats plus standing Blue: seats
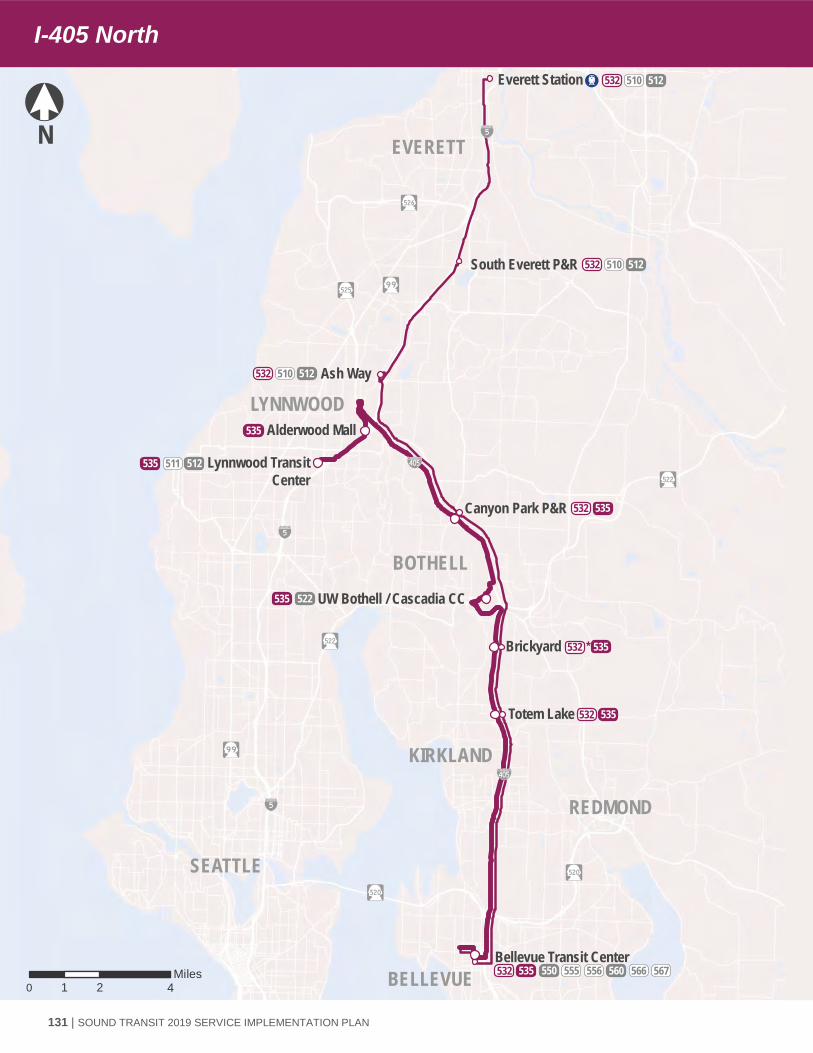
Everett Station
South Everett P&R
Ash Way
Lynnwood TransitCenter
EVERETT
LYNNWOOD
BOTHELL
SEATTLE
BELLEVUE
511 512535
510 512532
Alderwood Mall
Canyon Park P&R
Brickyard
Totem Lake
Bellevue Transit Center532 535 550 555 556 560 566 567
532 535
532 535
UW Bothell / Cascadia CC535 522
532 535
535
510 512532
510 512532
*
N
KIRKLAND
REDMOND
0 2 41Miles #
131 | SOUND TRANSIT 2019 SERVICE IMPLEMENTATION PLAN
DRAFTI-405 North

132
Routes 532 535
DRAFT I-405 N
2,057
1,977
0 1,000 2,000 3,000
532
535 573
0 1,000 2,000 3,000
532
535
No Sunday Service
92%
98%
0% 50% 100%
532
535
50
30
0 20 40 60
532
535
Passengers per Trip OTP
Weekday Ridership Saturday Ridership Sunday Ridership
OTP Standard
Corridor I-405 NorthDay Type Direction 2 3 4 5 6 7 8 9 10 11 12 13 14 15 16 17 18 19 20 21 22 23 24 25Weekday Northbound
Weekday Southbound
Saturday Northbound
Saturday Southbound
Sunday Northbound
Sunday Southbound
Hour
Service Frequency Legend Very Frequent (<10 min) Frequent (10-20 min) Moderate (20-30 min) Minimum (30-60 min)

Everett Station
South Everett P&R
Ash Way
Lynnwood TransitCenter
EVERETT
LYNNWOOD
BOTHELL
SEATTLE
BELLEVUE
511 512535
Alderwood Mall
Canyon Park P&R
Brickyard
Totem Lake
Bellevue Transit Center532 535 550 555 556 560 566 567
532 535
532 535
UW Bothell / Cascadia CC535 522
532 535
535
510 512532
510 512532
*
N
KIRKLAND
REDMOND
510 512532
0 2 41Miles #
133 | SOUND TRANSIT 2019 SERVICE IMPLEMENTATION PLAN
DRAFT2015 2016 2017 SPRING 2018
Ride
rshi
pAverage Weekday Boardings 2,007 2,083 2,052 2,057
Average Saturday Boardings N/A N/A N/A N/A
Average Sunday Boardings N/A N/A N/A N/A
Annual Boardings 511,765 531,172 521,334
Route 532 Everett – BellevueI-405 N
NORTHBOUND STOPSto EVERETT
Average WeekdayOns Offs
NE 10th St & 102nd Ave NE 62 0NE 10th St & 108th Ave NE 51 0Bellevue Transit Center 769 7
Totem Lake Freeway Station 95 155Brickyard Freeway Station 2 0
NE 195th St Flyer Stop 1 6Canyon Park Park & Ride 39 331
Ash Way Park & Ride 25 301South Everett Freeway Station 5 107
Broadway & 34th St 0 17Everett Station 0 126
Northbound Total 1,050 1,050SOUTHBOUND STOPS
to BELLEVUEAverage Weekday
Ons OffsEverett Station 146 0
Broadway & 34th St 16 0South Everett Freeway Station 118 3
Ash Way Park & Ride 332 20Canyon Park Freeway Station 297 36
NE 195th St Flyer Stop 5 2Brickyard Freeway Station 2 3
Totem Lake Freeway Station 129 103Bellevue Transit Center 4 799NE 8th St & 106th Ave NE 0 49NE 8th St & 102nd Ave NE 0 13
NE 10th St & 102nd Ave NE 0 19Southbound Total 1,050 1,050Total 2,100 2,100

134
Route 532 E
verett – Bellevue
DRAFT I-405 N
Weekday Northbound Average Trip Ridership & Maximum Passenger Loads
Weekday Southbound Average Trip Ridership & Maximum Passenger Loads
0
10
20
30
40
50
60
70
80
90
100
110
120
4:30
5:00
5:20
5:35
5:45
5:55
6:05
6:15
6:25
6:35
6:45
6:55
7:05
7:25
7:55
8:25
15:58
16:27
16:55
17:24Pa
ssen
ger B
oard
ings/C
apac
ity p
er T
rip
Trip Start Time
0
10
20
30
40
50
60
70
80
90
100
110
120
6:00
6:30
7:00
7:30
14:12
14:42
15:11
15:26
15:41
15:56
16:11
16:21
16:31
16:41
16:51
17:01
17:11
17:26
17:41
18:11
18:43Pa
ssen
ger B
oard
ings/C
apac
ity p
er T
rip
Trip Start Time
Average Maximum Passenger Load Orange/Red: standing passengers Blue: seated passengers
Average Passenger Boardings
Available Capacity Red: seats plus standing Blue: seats

Everett Station
South Everett P&R
Ash Way
Lynnwood TransitCenter
EVERETT
LYNNWOOD
BOTHELL
SEATTLE
BELLEVUE
511 512535
Alderwood Mall
Canyon Park P&R
Brickyard
Totem Lake
Bellevue Transit Center532 535 550 555 556 560 566 567
532 535
532 535
UW Bothell / Cascadia CC535 522
532 535
535
510 512532
510 512532
*
N
KIRKLAND
REDMOND
510 512532
0 2 41Miles #
135 | SOUND TRANSIT 2019 SERVICE IMPLEMENTATION PLAN
DRAFT2015 2016 2017 SPRING 2018
Ride
rshi
pAverage Weekday Boardings 1,876 1,901 1,921 1,977
Average Saturday Boardings 580 532 547 573
Average Sunday Boardings N/A N/A N/A N/A
Annual Boardings 508,603 512,940 516,330
Route 535 Lynnwood – BellevueI-405 N
NORTHBOUND STOPSto LYNNWOOD
Average WeekdayOns Offs
NE 10th St & 102nd Ave NE 59 0NE 10th St & 108th Ave NE 15 0Bellevue Transit Center 605 12Totem Lake Fwy Station 79 124
Brickyard Fwy Station 23 109Beardslee Blvd & Sunrise Dr 12 113
UW Bothell & Cascadia College 139 137NE 195th St Flyer Stop 21 20
Canyon Park Park & Ride 23 102Alderwood Mall 6 112
Alderwood Mall Pkwy & Beech Rd 2 26Lynnwood Transit Center 0 228
Northbound Total 984 984SOUTHBOUND STOPS
to BELLEVUEAverage Weekday
Ons OffsLynnwood Transit Center 303 0
Alderwood Mall Pkwy & Beech Rd 28 3Alderwood Mall 78 4
Canyon Park Fwy Station 120 22Beardslee Blvd & Ross Rd 35 32
UW Bothell & Cascadia College 143 140Bothell Park & Ride 85 7
Brickyard Fwy Station 115 23Totem Lake Fwy Station 117 66Bellevue Transit Center 5 655NE 8th St & 106th Ave NE 0 29NE 8th St & 102nd Ave NE 0 19
NE 10th St & 102nd Ave NE 0 29Southbound Total 1,029 1,029
Total 1,938 1,938

136
Route 535 Lynnw
ood – Bellevue
DRAFT I-405 N
Weekday Eastbound Average Trip Ridership & Maximum Passenger Loads
Weekday Westbound Average Trip Ridership & Maximum Passenger Loads
0
10
20
30
40
50
60
70
80
90
100
110
120
4:48
5:18
5:48
6:18
6:48
7:18
7:48
8:18
8:48
9:18
9:48
10:18
10:48
11:18
11:48
12:18
12:48
13:18
13:48
14:18
14:48
15:18
15:48
16:18
16:48
17:18
17:48
18:18
18:48
19:18
20:18
21:18Pa
ssen
ger B
oard
ings/C
apac
ity p
er T
rip
Trip Start Time
0
10
20
30
40
50
60
70
80
90
100
110
120
5:456:156:457:157:458:158:459:159:4510:1510:4511:1511:4512:1412:4413:1413:4414:0514:3515:0415:3416:0416:3417:0417:3418:0618:2918:5219:1519:4520:1521:1522:15
Pass
enge
r Boa
rding
s/Cap
acity
per
Trip
Trip Start Time
Average Maximum Passenger Load Orange/Red: standing passengers Blue: seated passengers
Average Passenger Boardings
Available Capacity Red: seats plus standing Blue: seats

137 | SOUND TRANSIT 2019 SERVICE IMPLEMENTATION PLAN
DRAFT
Saturday Westbound Average Trip Ridership & Maximum Passenger Loads
Saturday Eastbound Average Trip Ridership & Maximum Passenger Loads
0
10
20
30
40
50
60
70
80
90
100
110
120
7:18
8:18
9:18
10:18
11:18
12:18
13:18
14:18
15:18
16:18
17:18
18:18
19:18
20:18
21:18Pa
ssen
ger B
oard
ings/C
apac
ity p
er T
rip
Trip Start Time
0
10
20
30
40
50
60
70
80
90
100
110
120
8:14
9:14
10:14
11:14
12:14
13:14
14:14
15:14
16:14
17:14
18:14
19:14
20:14
21:14
22:14Pa
ssen
ger B
oard
ings/C
apac
ity p
er T
rip
Trip Start Time
Average Maximum Passenger Load Orange/Red: standing passengers Blue: seated passengers
Average Passenger Boardings
Available Capacity Red: seats plus standing Blue: seats

138
Route 535 Lynnw
ood – Bellevue
DRAFT I-405 N
NO SUNDAY SERVICE OPERATED ON ROUTE 535
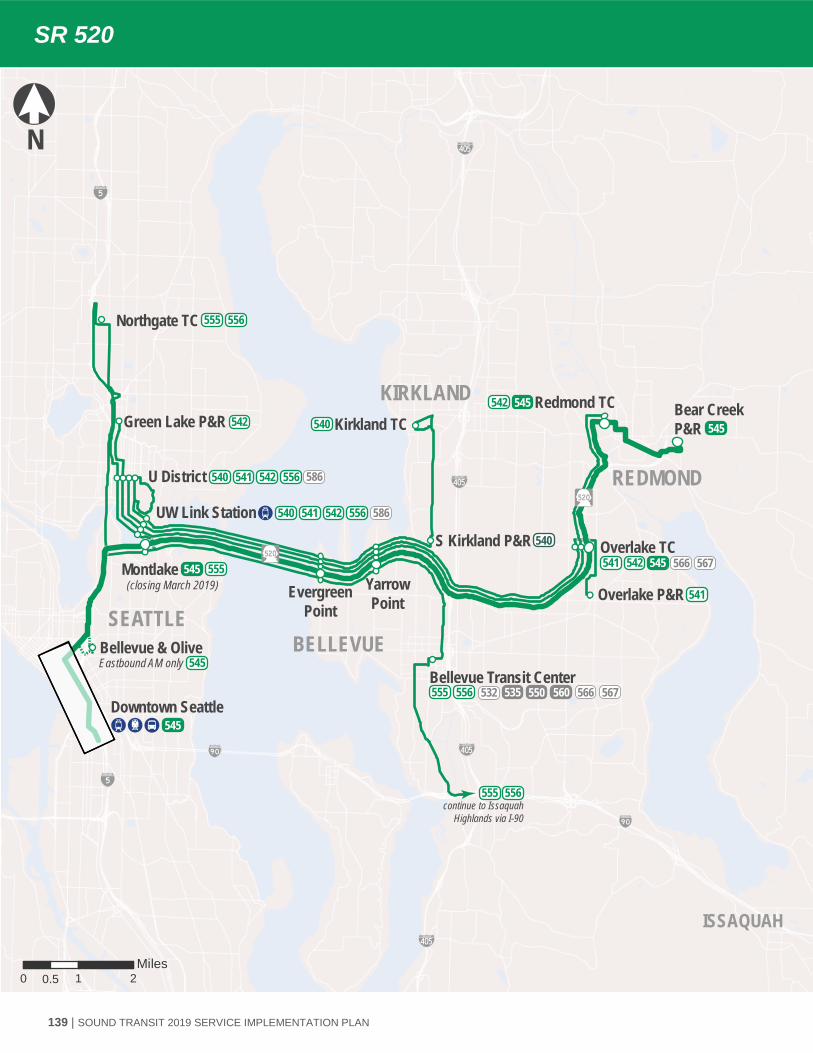
SEATTLEBELLEVUE
REDMOND
KIRKLAND
ISSAQUAH
N
Bellevue Transit Center532 535555 556 560 566 567550
S Kirkland P&R Overlake TC
Overlake P&RYarrowPoint
EvergreenPoint
Montlake (closing March 2019)
UW Link Station
U District
Green Lake P&R
Northgate TC
Bellevue & Olive
Downtown Seattle545
Kirkland TCRedmond TC Bear Creek
P&R
Eastbound AM only
continue to IssaquahHighlands via I-90
556555
0 20.5 1Miles
545
540 542541 556 586
540 542541 556
540
540
542541 545
541
542 545
545
555545
555 556
542
586
566 567
139 | SOUND TRANSIT 2019 SERVICE IMPLEMENTATION PLAN
DRAFTSR 520

140
Routes 540 541 542 545 555 556
DRAFT SR 520
592
808
2,228
8,636
686
779
0 3,000 6,000 9,000
540
541
542
545
555
556
2,222
0 3,000 6,000 9,000
540
541
542
545
555
556
1,612
0 3,000 6,000 9,000
540
541
542
545
555
556
75%
90%
86%
89%
78%
74%
0% 50% 100%
540
541
542
545
555
556
17
19
31
47
40
42
0 20 40 60
540
541
542
545
555
556
Passengers per Trip OTP
Weekday Ridership Saturday Ridership Sunday Ridership
OTP Standard
Corridor SR-520Day Type Direction 2 3 4 5 6 7 8 9 10 11 12 13 14 15 16 17 18 19 20 21 22 23 24 25Weekday Eastbound
Weekday Westbound
Saturday Eastbound
Saturday Westbound
Sunday Eastbound
Sunday Westbound
Hour
Service Frequency Legend Very Frequent (<10 min) Frequent (10-20 min) Moderate (20-30 min) Minimum (30-60 min)

141 | SOUND TRANSIT 2019 SERVICE IMPLEMENTATION PLAN
DRAFT2015 2016 2017 SPRING 2018
Ride
rshi
pAverage Weekday Boardings 660 631 598 592
Average Saturday Boardings N/A N/A N/A N/A
Average Sunday Boardings N/A N/A N/A N/A
Annual Boardings 168,214 160,862 151,869
Route 540 Kirkland – University DistrictSR 520
EASTBOUND STOPSto KIRKLAND
Average Weekday WESTBOUND STOPSto UNIVERSITY DISTRICT
Average WeekdayOns Offs Ons Offs
15th Ave NE & NE 42nd St 0 0 Kirkland Transit Center 52 0Stevens Way & Memorial Way 19 6 6th St S & 9th Ave S 45 0Stevens Way & Pend Oreille Rd 20 4 108th Ave NE & NE 58th St 7 0
Stevens Way & Benton Ln 20 6 South Kirkland Park & Ride 152 2Stevens Way & Rainier Vis 4 2 SR 520 & 92nd Ave NE 19 9
Stevens Way & Garfield Ln 4 2 Evergreen Point Freeway Station 7 3Grant Ln & Stevens Way 21 3 Montlake Blvd E & E Shelby St 3 7
15th Ave NE & NE 40th St 51 2 University of Washington Link Station 22 140NE Pacific St & 15th Ave NE 31 1 15th Ave NE & NE Pacific St 3 29
University of Washington Link Station 65 7 15th Ave NE & NE 40th St 2 57Montlake Blvd E & E Lake Washington Bl 7 2 15th Ave NE & NE 42nd St 0 56
Evergreen Point Freeway Station 23 13 Stevens Way & Memorial Way 1 3SR 520 & 92nd Ave NE 5 3 Stevens Way & Pend Oreille Rd 2 2
South Kirkland Park & Ride 4 131 Stevens Way & Benton Ln 1 3108th Ave NE & NE 58th St 0 8 Stevens Way & Rainier Vis 0 1
6th St S & NE 68th St 1 36 Stevens Way & Garfield Ln 0 2Kirkland Transit Center 0 51 Grant Ln & Stevens Way 0 1
Eastbound Total 277 277 Westbound Total 317 317Total 594 594
N
Bellevue Transit Center532 535555 556 560 566 567550
S Kirkland P&R Overlake TC
Overlake P&RYarrowPoint
EvergreenPoint
Montlake (closing March 2019)
UW Link Station
U District
Green Lake P&R
Northgate TC
Bellevue & Olive
Downtown Seattle545
Kirkland TCRedmond TC Bear Creek
P&R
Eastbound AM only
continue to IssaquahHighlands via I-90
556555
0 20.5 1Miles
545
540 542541 556 586
540 542541 556
540
540
542541 545
541
542 545
545
555545
555 556
542
586
566 567

142
Route 540 K
irkland – University D
istrict DRAFT SR 520
Weekday Eastbound Average Trip Ridership & Maximum Passenger Loads
Weekday Westbound Average Trip Ridership & Maximum Passenger Loads
0
10
20
30
40
50
60
70
80
90
100
110
120
6:00
6:34
6:56
7:18
7:40
8:02
8:24
8:50
9:11
9:36
10:01
15:01
15:31
16:01
16:23
16:53
17:17
17:39Pa
ssen
ger B
oard
ings/C
apac
ity p
er T
rip
Trip Start Time
0
10
20
30
40
50
60
70
80
90
100
110
120
6:25
6:59
7:21
7:48
8:10
8:32
8:54
14:29
14:59
15:29
15:51
16:13
16:35
16:56
17:19
17:51
18:17
18:46Pa
ssen
ger B
oard
ings/C
apac
ity p
er T
rip
Trip Start Time
Average Maximum Passenger Load Orange/Red: standing passengers Blue: seated passengers
Average Passenger Boardings
Available Capacity Red: seats plus standing Blue: seats

143 | SOUND TRANSIT 2019 SERVICE IMPLEMENTATION PLAN
DRAFT2015 2016 2017 SPRING 2018
Ride
rshi
pAverage Weekday Boardings N/A 521 778 808
Average Saturday Boardings N/A N/A N/A N/A
Average Sunday Boardings N/A N/A N/A N/A
Annual Boardings N/A 132,851 197,726
Route 541 Overlake – University DistrictSR 520
EASTBOUND STOPSto OVERLAKE
Average Weekday WESTBOUND STOPSto UNIVERSITY DISTRICT
Average WeekdayOns Offs Ons Offs
15th Ave NE & NE 43rd St 60 0 Overlake Park & Ride 118 015th Ave NE & NE Campus Pkwy 42 1 Overlake Transit Center 136 3
15th Ave NE & NE 40th St 43 0 SR 520 & NE 40th St 131 6NE Pacific St & 15th Ave NE 33 4 Yarrow Point Freeway Station 26 11
University of Washington Link Station 111 20 Evergreen Point Freeway Station 9 9Montlake Blvd E & E Lake Washington Blvd 28 6 Montlake Blvd E & E Shelby St 5 22
Evergreen Point Freeway Station 18 31 University of Washington Link Station 38 211Yarrow Point Freeway Station 6 7 15th Ave NE & NE Pacific St 7 22
SR 520 & NE 40th St 8 137 15th Ave NE & NE 40th St 4 70156th Ave NE & NE 40th St 9 36 15th Ave NE & NE 42nd St 4 49
Overlake Park & Ride 0 114 15th Ave NE & NE 45th St 0 31NE 50th St & University Way NE 0 44
Eastbound Total 357 357 Westbound Total 478 478Total 835 835
N
Bellevue Transit Center532 535555 556 560 566 567550
S Kirkland P&R Overlake TC
Overlake P&RYarrowPoint
EvergreenPoint
Montlake (closing March 2019)
UW Link Station
U District
Green Lake P&R
Northgate TC
Bellevue & Olive
Downtown Seattle545
Kirkland TCRedmond TC Bear Creek
P&R
Eastbound AM only
continue to IssaquahHighlands via I-90
556555
0 20.5 1Miles
545
540 542541 556 586
540 542541 556
540
540
542541 545
541
542 545
545
555545
555 556
542
586
566 567

144
Route 541 O
verlake – University D
istrict DRAFT SR 520
Weekday Eastbound Average Trip Ridership & Maximum Passenger Loads
Weekday Westbound Average Trip Ridership & Maximum Passenger Loads
0
10
20
30
40
50
60
70
80
90
100
110
120
6:41
7:02
7:20
7:36
7:51
8:07
8:22
8:37
8:52
9:09
9:23
15:26
15:41
15:57
16:13
16:29
16:45
17:01
17:19
17:39
17:59Pa
ssen
ger B
oard
ings/C
apac
ity p
er T
rip
Trip Start Time
0
10
20
30
40
50
60
70
80
90
100
110
120
6:54
7:14
7:34
7:50
8:06
8:22
8:40
8:54
15:00
15:15
15:32
15:47
16:01
16:17
16:32
16:47
17:02
17:20
17:39
17:59
18:18
18:38
18:58Pa
ssen
ger B
oard
ings/C
apac
ity p
er T
rip
Trip Start Time
Average Maximum Passenger Load Orange/Red: standing passengers Blue: seated passengers
Average Passenger Boardings
Available Capacity Red: seats plus standing Blue: seats

145 | SOUND TRANSIT 2019 SERVICE IMPLEMENTATION PLAN
DRAFT2015 2016 2017 SPRING 2018
Ride
rshi
pAverage Weekday Boardings 1,704 2,116 2,206 2,228
Average Saturday Boardings N/A N/A N/A N/A
Average Sunday Boardings N/A N/A N/A N/A
Annual Boardings 434,469 539,674 560,364
Route 542 Redmond – University DistrictSR 520
EASTBOUND STOPSto REDMOND
Average Weekday WESTBOUND STOPSto UNIVERSITY DISTRICT
Average WeekdayOns Offs Ons Offs
Green Lake Park & Ride 195 0 Redmond Transit Center 213 0NE 50th St & University Way NE 102 2 NE 85th St & 160th Ave NE 100 1
15th Ave NE & NE 45th St 47 3 154th Ave NE & NE 85th St 34 015th Ave NE & NE 43rd St 124 16 West Lake Sammamish & Leary Way 50 1
15th Ave NE & NE Campus Pkwy 137 17 SR 520 & NE 51st St 184 515th Ave NE & NE 40th St 104 7 SR 520 & NE 40th St 293 22
NE Pacific St & 15th Ave NE 80 29 SR 520 & 92nd Ave NE 54 9University of Washington Link Station 213 69 SR 520 & Evergreen Point Rd 30 8Montlake Blvd E & E Lake Washington Bl 59 13 Montlake Blvd E & E Shelby St 9 47
SR 520 & Evergreen Point Rd 17 60 University of Washington Link Station 91 358SR 520 & 92nd Ave NE 10 25 15th Ave NE & NE Pacific St 41 65SR 520 & NE 40th St 30 387 15th Ave NE & NE 40th St 22 200SR 520 & NE 51st St 9 135 15th Ave NE & NE 42nd St 15 115
West Lake Sammamish & Leary Way 1 41 15th Ave NE & NE 45th St 2 75NE 85th St & 154th Ave NE 0 42 NE 50th St & University Way NE 2 110NE 85th St & 161st Ave NE 1 96 Green Lake Park & Ride 0 125Redmond Transit Center 0 189
Eastbound Total 1,131 1,131 Westbound Total 1,140 1,140Total 2,270 2,270
N
Bellevue Transit Center532 535555 556 560 566 567550
S Kirkland P&R Overlake TC
Overlake P&RYarrowPoint
EvergreenPoint
Montlake (closing March 2019)
UW Link Station
U District
Green Lake P&R
Northgate TC
Bellevue & Olive
Downtown Seattle545
Kirkland TCRedmond TC Bear Creek
P&R
Eastbound AM only
continue to IssaquahHighlands via I-90
556555
0 20.5 1Miles
545
540 542541 556 586
540 542541 556
540
540
542541 545
541
542 545
545
555545
555 556
542
586
566 567

146
Route 542 R
edmond – U
niversity District
DRAFT SR 520
Weekday Eastbound Average Trip Ridership & Maximum Passenger Loads
Weekday Westbound Average Trip Ridership & Maximum Passenger Loads
0
10
20
30
40
50
60
70
80
90
100
110
120
5:255:506:106:306:507:107:267:427:578:128:278:428:579:3210:0210:3211:0211:3212:0212:3213:0213:3214:0214:3215:0215:3215:4716:0316:1916:3516:5117:0717:2717:4718:0718:2718:4719:076:37
Pass
enge
r Boa
rding
s/Cap
acity
per
Trip
Trip Start Time
0
10
20
30
40
50
60
70
80
90
100
110
120
6:577:177:337:508:068:228:388:549:109:259:409:5510:1110:3811:0811:3812:0812:3813:0813:3814:0814:3114:4614:5915:1415:3115:4516:0016:1616:3116:4617:0117:2117:4018:00
Pass
enge
r Boa
rding
s/Cap
acity
per
Trip
Trip Start Time
Average Maximum Passenger Load Orange/Red: standing passengers Blue: seated passengers
Average Passenger Boardings
Available Capacity Red: seats plus standing Blue: seats

147 | SOUND TRANSIT 2019 SERVICE IMPLEMENTATION PLAN
DRAFT2015 2016 2017 SPRING 2018
Ride
rshi
pAverage Weekday Boardings 9,727 9,330 9,234 8,636
Average Saturday Boardings 2,438 2,340 2,390 2,222
Average Sunday Boardings 1,796 1,761 1,783 1,612
Annual Boardings 2,711,310 2,605,320 2,574,790
Route 545 Redmond – SeattleSR 520
EASTBOUND STOPS to REDMOND Average Weekday WESTBOUND STOPS to SEATTLE Average WeekdayOns Offs Ons Offs
6th Ave & Atlantic St 92 0 Bear Creek Park & Ride 380 04th Ave & S Jackson St 601 32 NE 76th St & 177th Pl NE 193 7
4th Ave & James St 224 59 NE Redmond Way & NE 79th St 177 144th Ave & Madison St 487 116 Redmond Transit Center 667 54
4th Ave & University St 0 0 NE 85th St & 160th Ave NE 368 234th Ave & Pike St 1,044 105 154th Ave NE & NE 85th St 67 3
Olive Way & 8th Ave 653 61 West Lake Sammamish & Leary Way 202 9Olive Way & Terry Ave 360 36 SR 520 Ramp & NE 51st St 407 35
Bellevue Ave & Olive St 430 8 Overlake Transit Center 555 39Montlake Freeway Station 257 57 SR 520 & NE 40th St 839 116
Evergreen Point Freeway Station 41 64 Yarrow Point Freeway Station 68 30Yarrow Pt Freeway Station 29 54 Evergreen Point Freeway Station 51 15
SR-520 & NE 40th St 155 1,566 Montlake Freeway Station 44 328SR-520 & NE 51st St 36 408 Stewart St & Yale Ave 75 695
W. Lake Sammamish Pkwy & Leary Way 7 185 Stewart St & 9th Ave 51 470NE 85th St & 154th Ave 5 130 Stewart St & 7th Ave 37 547NE 85th St & 161st Ave 19 351 5th Ave & Pine St 64 818
Redmond Transit Center 69 589 5th Ave & Seneca St 61 410Cleveland St & 166th Ave 8 145 5th Ave & Cherry St 19 217
NE 76th St & 177th Pl 4 227 5th Ave & Jefferson St 52 131Bear Creek Park & Ride 0 328 5th Ave S & S Jackson St 13 401
Airport Way S & S Royal Brougham Way 0 27Eastbound Total 4,521 4,521 Westbound Total 4,388 4,388
Total 8,909 8,909
N
Bellevue Transit Center532 535555 556 560 566 567550
S Kirkland P&R NE 40th / Overlake TC
Overlake P&RYarrowPoint
EvergreenPoint
Montlake (closing March 2019)
UW Link Station
U District
Green Lake P&R
Northgate TC
Bellevue & Olive
Kirkland TCRedmond TC Bear Creek
P&R
Eastbound AM only
continue to IssaquahHighlands via I-90
556555
0 20.5 1Miles
545
540 542541 556 586
540 542541 556
540
540
542541 545
541
542 545
545
555545
555 556
542
586
566 567
NE 51st St
DowntownSeattle 545

148
Route 545 R
edmond – S
eattle DRAFT SR 520
Weekday Eastbound Average Trip Ridership & Maximum Passenger Loads
Weekday Westbound Average Trip Ridership & Maximum Passenger Loads
0
10
20
30
40
50
60
70
80
90
100
110
120
4:275:015:315:466:016:116:216:316:386:466:537:017:077:137:197:257:317:367:417:467:517:578:018:078:138:198:258:318:378:438:498:559:019:079:139:199:259:319:419:5110:0110:1610:3110:4611:0111:1611:3111:4612:0112:1612:3112:4613:0113:1613:3113:4614:0114:1614:3114:4514:5515:0515:1515:2515:3515:4515:5516:0516:1516:2516:3516:4516:5517:0517:1517:2517:3517:4517:5518:0518:1518:2518:3518:4518:5519:0719:2119:3619:5920:2220:5221:2322:2323:23
Pass
enge
r Boa
rding
s/Cap
acity
per
Trip
Trip Start Time
0
10
20
30
40
50
60
70
80
90
100
110
120
5:045:345:546:096:186:276:366:456:547:037:127:207:307:397:447:517:588:068:158:238:318:398:478:559:039:119:199:279:359:439:519:5910:0910:1910:3210:4711:0211:1711:3211:4712:0212:1712:3212:4713:0213:1713:3213:4714:0214:1714:3214:4214:5215:0215:1215:2215:3215:4215:5216:0216:1116:1916:2716:3316:3916:4316:4816:5316:5817:0417:1117:1917:2817:3617:4617:5418:0418:1418:2418:3418:4418:5419:0919:2419:4420:0420:2420:5521:2521:5522:2522:5523:55
Pass
enge
r Boa
rding
s/Cap
acity
per
Trip
Trip Start Time
Average Maximum Passenger Load Orange/Red: standing passengers Blue: seated passengers
Average Passenger Boardings
Available Capacity Red: seats plus standing Blue: seats

149 | SOUND TRANSIT 2019 SERVICE IMPLEMENTATION PLAN
DRAFT
0
10
20
30
40
50
60
70
80
90
100
110
120
6:25
6:55
7:25
7:55
8:25
8:54
9:25
9:55
10:25
10:54
11:24
11:54
12:24
12:54
13:24
13:54
14:24
14:54
15:24
15:54
16:24
16:54
17:24
17:55
18:25
18:56
19:26
19:55
20:25
21:25
22:25Pa
ssen
ger B
oard
ings/C
apac
ity p
er T
rip
Trip Start Time
Saturday Westbound Average Trip Ridership & Maximum Passenger Loads
Saturday Eastbound Average Trip Ridership & Maximum Passenger Loads
0
10
20
30
40
50
60
70
80
90
100
110
120
6:19
6:48
7:18
7:48
8:18
8:48
9:18
9:43
10:11
10:41
11:09
11:39
12:09
12:39
13:09
13:39
14:09
14:39
15:09
15:39
16:09
16:39
17:09
17:39
18:11
18:47
19:17
19:47
20:18
21:18
22:18
23:17Pa
ssen
ger B
oard
ings/C
apac
ity p
er T
rip
Trip Start Time
Average Maximum Passenger Load Orange/Red: standing passengers Blue: seated passengers
Average Passenger Boardings
Available Capacity Red: seats plus standing Blue: seats

150
Route 545 R
edmond – S
eattle DRAFT SR 520
Westbound Average Trip Ridership & Maximum Passenger Loads Sunday
Sunday Eastbound Average Trip Ridership & Maximum Passenger Loads
0
10
20
30
40
50
60
70
80
90
100
110
120
6:25
6:55
7:25
7:55
8:25
8:54
9:24
9:54
10:24
10:53
11:23
11:53
12:23
12:53
13:23
13:53
14:23
14:53
15:23
15:53
16:23
16:53
17:23
17:54
18:24
18:55
19:25
19:55
20:25
21:25
22:25Pa
ssen
ger B
oard
ings/C
apac
ity p
er T
rip
Trip Start Time
0
10
20
30
40
50
60
70
80
90
100
110
120
6:19
6:48
7:18
7:48
8:18
8:48
9:18
9:43
10:11
10:41
11:09
11:39
12:09
12:39
13:09
13:39
14:09
14:39
15:09
15:39
16:09
16:39
17:09
17:39
18:11
18:47
19:17
19:47
20:18
21:18
22:18
23:17Pa
ssen
ger B
oard
ings/C
apac
ity p
er T
rip
Trip Start Time
Average Maximum Passenger Load Orange/Red: standing passengers Blue: seated passengers
Average Passenger Boardings
Available Capacity Red: seats plus standing Blue: seats
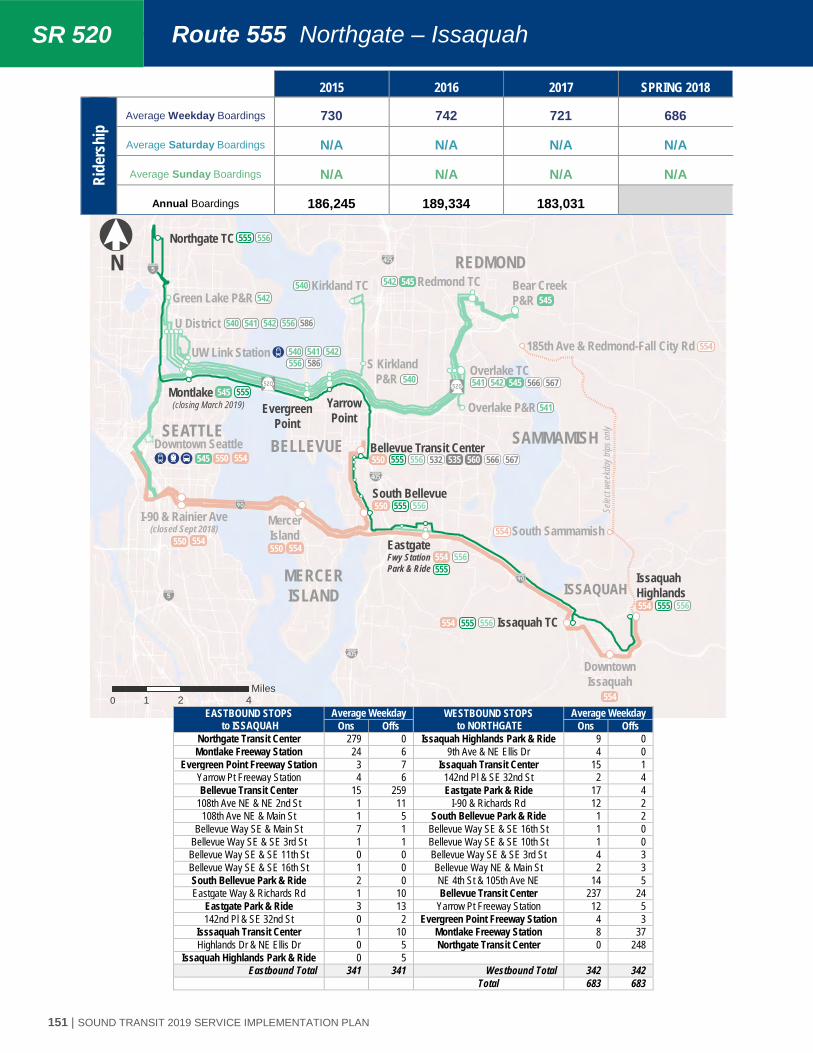
ISSAQUAH
N
0 2 41Miles
S Kirkland P&R Overlake TC
Overlake P&RYarrowPoint
EvergreenPoint
Montlake (closing March 2019)
UW Link Station
U District
Green Lake P&R
Northgate TC
Kirkland TC Redmond TC Bear CreekP&R
540 542541556 586
540 542541 556
540
540 542541 545
541
542 545
545
555545
555 556
542
586
566 567
545Downtown Seattle
550
SEATTLE554
Bellevue Transit Center532 535555 556 560 566 567550
MercerIsland
I-90 & Rainier Ave(closed Sept 2018)
550 554550 554
554 556555
South Bellevue555550 556
Issaquah TC555554 556
IssaquahHighlands
555554 556
DowntownIssaquah
554
South SammamishEastgateFwy StationPark & Ride
185th Ave & Redmond-Fall City Rd
554
554
Selec
t wee
kday
trips
only
BELLEVUE SAMMAMISH
REDMOND
MERCERISLAND
151 | SOUND TRANSIT 2019 SERVICE IMPLEMENTATION PLAN
DRAFT2015 2016 2017 SPRING 2018
Ride
rshi
pAverage Weekday Boardings 730 742 721 686
Average Saturday Boardings N/A N/A N/A N/A
Average Sunday Boardings N/A N/A N/A N/A
Annual Boardings 186,245 189,334 183,031
Route 555 Northgate – IssaquahSR 520
EASTBOUND STOPSto ISSAQUAH
Average Weekday WESTBOUND STOPSto NORTHGATE
Average WeekdayOns Offs Ons Offs
Northgate Transit Center 279 0 Issaquah Highlands Park & Ride 9 0Montlake Freeway Station 24 6 9th Ave & NE Ellis Dr 4 0
Evergreen Point Freeway Station 3 7 Issaquah Transit Center 15 1Yarrow Pt Freeway Station 4 6 142nd Pl & SE 32nd St 2 4Bellevue Transit Center 15 259 Eastgate Park & Ride 17 4
108th Ave NE & NE 2nd St 1 11 I-90 & Richards Rd 12 2108th Ave NE & Main St 1 5 South Bellevue Park & Ride 1 2
Bellevue Way SE & Main St 7 1 Bellevue Way SE & SE 16th St 1 0Bellevue Way SE & SE 3rd St 1 1 Bellevue Way SE & SE 10th St 1 0Bellevue Way SE & SE 11th St 0 0 Bellevue Way SE & SE 3rd St 4 3Bellevue Way SE & SE 16th St 1 0 Bellevue Way NE & Main St 2 3South Bellevue Park & Ride 2 0 NE 4th St & 105th Ave NE 14 5Eastgate Way & Richards Rd 1 10 Bellevue Transit Center 237 24
Eastgate Park & Ride 3 13 Yarrow Pt Freeway Station 12 5142nd Pl & SE 32nd St 0 2 Evergreen Point Freeway Station 4 3
Isssaquah Transit Center 1 10 Montlake Freeway Station 8 37Highlands Dr & NE Ellis Dr 0 5 Northgate Transit Center 0 248
Issaquah Highlands Park & Ride 0 5Eastbound Total 341 341 Westbound Total 342 342
Total 683 683

152
Route 555 N
orthgate – Issaquah DRAFT SR 520
Weekday Eastbound Average Trip Ridership & Maximum Passenger Loads
Weekday Westbound Average Trip Ridership & Maximum Passenger Loads
0
10
20
30
40
50
60
70
80
90
100
110
120
14:25
14:55
15:25
15:54
16:23
16:57
17:32
18:02
Pass
enge
r Boa
rding
s/Cap
acity
per
Trip
Trip Start Time
0
10
20
30
40
50
60
70
80
90
100
110
120
5:34
6:11
6:34
7:04
7:21
7:36
8:14
8:49
9:24
Pass
enge
r Boa
rding
s/Cap
acity
per
Trip
Trip Start Time
Average Maximum Passenger Load Orange/Red: standing passengers Blue: seated passengers
Average Passenger Boardings
Available Capacity Red: seats plus standing Blue: seats

ISSAQUAH
N
0 2 41Miles
Downtown Seattle550
SEATTLE554
Bellevue Transit Center532 535555 556 560 566 567550
MercerIsland
I-90 & Rainier Ave(closed Sept 2018)
550 554550 554
554 556555
South Bellevue555550 556
Issaquah TC555554 556
IssaquahHighlands
555554 556
DowntownIssaquah
554
South SammamishEastgateFwy StationPark & Ride
185th Ave & Redmond-Fall City Rd
554
554
Selec
t wee
kday
trips
only
BELLEVUE SAMMAMISH
REDMOND
MERCERISLAND
540 542541556 586
540 542541 556
540
540 542541 545
541
542 545
545
555545
555 556
542
586
566 567
545
S Kirkland P&R Overlake TC
Overlake P&RYarrowPoint
EvergreenPoint
Montlake (closing March 2019)
UW Link Station
U District
Green Lake P&R
Northgate TC
Kirkland TC Redmond TC Bear CreekP&R
153 | SOUND TRANSIT 2019 SERVICE IMPLEMENTATION PLAN
DRAFT2015 2016 2017 SPRING 2018
Ride
rshi
pAverage Weekday Boardings 859 825 829 779
Average Saturday Boardings N/A N/A N/A N/A
Average Sunday Boardings N/A N/A N/A N/A
Annual Boardings 218,954 210,471 210,443
Route 556 Issaquah – NorthgateSR 520
EASTBOUND STOPSto ISSAQUAH
Average Weekday WESTBOUND STOPSto NORTHGATE
Average WeekdayOns Offs Ons Offs
Northgate Transit Center 36 0 Issaquah Highlands Park & Ride 101 0NE 50th St & University Way 8 4 9th Ave & NE Ellis Dr 16 0
15th Ave & NE 45th St 15 2 Issaquah Transit Center 107 215th Ave & NE 43rd St 24 2 Eastgate Freeway Station 41 6
15th Ave & NE Campus Pkwy 33 2 South Bellevue Park & Ride 2 115th Ave & NE 40th St 20 1 Bellevue Way SE & SE 16th St 6 0Pacific St & 15th Ave 26 2 Bellevue Way SE & SE 10th St 2 1
University of Washington Link Station 45 24 Bellevue Way SE & SE 3rd St 11 2Montlake Freeway Station 3 3 Bellevue Way NE & Main St 5 2
Evergreen Point Freeway Station 1 18 NE 4th St & 105th Ave NE 3 60Yarrow Point Freeway Station 2 4 Bellevue Transit Center 36 117
Bellevue Transit Center 118 52 Yarrow Point Freeway Station 14 3108th Ave NE & NE 2nd St 33 2 Evergreen Point Freeway Station 6 0
108th Ave NE & Main St 14 4 Montlake Blvd & Shelby St 1 3Bellevue Way SE & Main St 4 3 University of Washington Link Station 13 51
Bellevue Way SE & SE 3rd St 1 5 Pacific St & 15th Ave 1 22Bellevue Way SE & SE 11th St 0 1 15th Ave & NE 40th St 2 43Bellevue Way SE & SE 16th St 1 3 15th Ave & NE 42nd St 1 20South Bellevue Park & Ride 1 1 15th Ave & NE 45th St 1 14Eastgate Freeway Station 17 33 NE 50th St & University Way 2 4Issaquah Transit Center 4 108 Northgate Transit Center 0 23Highlands Dr & NE Ellis Dr 0 36
Issaquah Highlands Park & Ride 0 96Eastbound Total 406 406 Westbound Total 372 372
T t l 777 777

154
Route 556 Issaquah – N
orthgate DRAFT SR 520
Weekday Eastbound Average Trip Ridership & Maximum Passenger Loads
Weekday Westbound Average Trip Ridership & Maximum Passenger Loads
0
10
20
30
40
50
60
70
80
90
100
110
120
5:12
5:41
6:12
6:43
6:56
7:15
7:44
8:13
8:44
9:13
Pass
enge
r Boa
rding
s/Cap
acity
per
Trip
Trip Start Time
0
10
20
30
40
50
60
70
80
90
100
110
120
14:18
14:47
15:12
15:40
16:08
16:31
17:02
17:31
18:04
Pass
enge
r Boa
rding
s/Cap
acity
per
Trip
Trip Start Time
Average Maximum Passenger Load Orange/Red: standing passengers Blue: seated passengers
Average Passenger Boardings
Available Capacity Red: seats plus standing Blue: seats

ISSAQUAH
N
0 2 41Miles
Downtown Seattle550
SEATTLE
554
continue to Northgate / U Districtvia SR 520
556555
Bellevue Transit Center532 535555 556 560 566 567550
MercerIsland
I-90 & Rainier Ave(closed Sept 2018)
550 554550 554
554 556555
South Bellevue555550 556
Issaquah TC555554 556
IssaquahHighlands
555554 556
DowntownIssaquah
554
South SammamishEastgateFwy StationPark & Ride
185th Ave & Redmond-Fall City Rd
554
554
Selec
t wee
kday
trips
onlyBELLEVUE SAMMAMISH
REDMOND
MERCERISLAND
155 | SOUND TRANSIT 2019 SERVICE IMPLEMENTATION PLAN
DRAFTI-90

Corridor I-90Day Type Direction 2 3 4 5 6 7 8 9 10 11 12 13 14 15 16 17 18 19 20 21 22 23 24 25Weekday Eastbound
Weekday Westbound
Saturday Eastbound
Saturday Westbound
Sunday Eastbound
Sunday Westbound
Hour
Service Frequency Legend Very Frequent (<10 min) Frequent (10-20 min) Moderate (20-30 min) Minimum (30-60 min)
156
Routes
550 554DRAFT I-90
9,893
4,059
0 5,000 10,000
550
554
4,017
1,566
0 5,000 10,000
550
554
2,511
1,229
0 5,000 10,000
550
554
89%
89%
0% 50% 100%
550
554
55
42
0 20 40 60
550
554
Passengers per TripOTP
Weekday Ridership Saturday Ridership Sunday Ridership
OTP Standard

157 | SOUND TRANSIT 2019 SERVICE IMPLEMENTATION PLAN
DRAFT2015 2016 2017 SPRING 2018
Ride
rshi
pAverage Weekday Boardings 10,362 10,816 10,269 9,893
Average Saturday Boardings 4,462 4,325 4,331 4,017
Average Sunday Boardings 2,886 2,808 2,735 2,511
Annual Boardings 3,044,248 3,151,998 2,998,662
Route 550 Bellevue – SeattleI-90
EASTBOUND STOPSto BELLEVUE
Average Weekday WESTBOUND STOPSto SEATTLE
Average Weekday
Ons Offs Ons OffsConvention Place Station 648 0 110th Ave & NE 10th St 445 0
Westlake Station 1,688 36 Bellevue Transit Center 1,538 52University St Station 932 37 NE 4th St & 108th Ave 257 9
Pioneer Square Station 530 55 Bellevue Way & NE 4th St 373 23International District/Chinatown Station 828 426 Bellevue Way & NE 1st St 278 36
Rainier Avenue Freeway Station 224 165 Belleway Way & Main St 105 47Mercer Island Park & Ride 220 1,227 Bellevue Way & SE 3rd St 48 15
South Bellevue Park & Ride 13 97 Bellevue Way & SE 11th St 123 25Bellevue Way & SE 16th St 25 134 South Bellevue Park & Ride 104 15Bellevue Way & SE 10th St 13 62 Mercer Island Park & Ride 993 182Bellevue Way & SE 3rd St 77 131 Rainier Avenue Freeway Station 74 208Bellevue Way & Main St 35 300 International District/Chinatown Station 317 955NE 4th St & 105th Ave 42 750 Pioneer Square Station 79 627
Bellevue Transit Center 32 1,450 University St Station 52 913110th Ave & NE 10th St 0 438 Westlake Station 30 1,239
Convention Place Station 0 470Eastbound Total 5,308 5,308 Westbound Total 4,816 4,816
Total 10,124 10,124
ISSAQUAH
N
0 2 41Miles
Downtown Seattle550
SEATTLE
554
continue to Northgate / U Districtvia SR 520
556555
Bellevue Transit Center532 535555 556 560 566 567550
MercerIsland
I-90 & Rainier Ave(closed Sept 2018)
550 554550 554
554 556555
South Bellevue555550 556
Issaquah TC555554 556
IssaquahHighlands
555554 556
DowntownIssaquah
554
South SammamishEastgateFwy StationPark & Ride
185th Ave & Redmond-Fall City Rd
554
554
Selec
t wee
kday
trips
onlyBELLEVUE SAMMAMISH
REDMOND
MERCERISLAND

158
Route 550 B
ellevue – Seattle
DRAFT I-90
Weekday Eastbound Average Trip Ridership & Maximum Passenger Loads
Weekday Westbound Average Trip Ridership & Maximum Passenger Loads
0
10
20
30
40
50
60
70
80
90
100
110
120
4:525:225:526:036:136:206:276:366:426:456:546:597:007:097:147:197:207:297:347:357:447:497:507:598:008:068:148:228:308:388:468:549:049:149:249:349:449:5910:1410:2910:4410:5911:1411:2911:4411:5912:1412:2912:4412:5913:1413:2913:4413:5914:1414:2914:4414:5915:1415:2915:3915:4915:5916:0916:1916:2916:3816:4816:5817:0817:1817:2817:4317:5918:1418:2918:4418:5919:1419:2920:0220:3421:0421:3422:0122:3223:1223:420:12
Pass
enge
r Boa
rding
s/Cap
acity
per
Trip
Trip Start Time
0
10
20
30
40
50
60
70
80
90
100
110
120
5:005:275:435:596:146:286:426:547:067:187:287:387:487:588:088:208:338:489:029:189:349:5010:0510:2110:3610:5111:0611:2111:3611:5112:0612:2112:3612:5113:0613:2113:3613:5214:0714:2214:3714:5014:5915:0815:1615:2315:3115:3815:4515:5316:0016:0516:1216:1816:2416:3016:3616:4216:4716:5216:5717:0217:0717:1217:1717:2217:2717:3217:3717:4217:4817:5518:0218:0918:1718:2318:3018:4018:5019:0019:1019:2119:3619:5120:2120:5121:2121:5022:2122:5223:2323:58
Pass
enge
r Boa
rding
s/Cap
acity
per
Trip
Trip Start Time
Average Maximum Passenger Load Orange/Red: standing passengers Blue: seated passengers
Average Passenger Boardings
Available Capacity Red: seats plus standing Blue: seats

159 | SOUND TRANSIT 2019 SERVICE IMPLEMENTATION PLAN
DRAFT
Saturday Westbound Average Trip Ridership & Maximum Passenger Loads
Saturday Eastbound Average Trip Ridership & Maximum Passenger Loads
0
10
20
30
40
50
60
70
80
90
100
110
120
6:176:477:177:478:178:479:159:309:4510:0010:1410:2910:4410:5911:1411:2911:4411:5912:1412:2912:4412:5913:1413:2913:4413:5914:1414:2914:4414:5915:1415:2915:4415:5916:1416:2916:4416:5917:1417:2917:4417:5918:1418:2918:4418:5919:1419:2920:0420:3421:0421:3422:0222:3223:1223:420:12
Pass
enge
r Boa
rding
s/Cap
acity
per
Trip
Trip Start Time
0
10
20
30
40
50
60
70
80
90
100
110
120
6:016:317:017:318:018:318:529:079:229:379:5210:0710:2210:3710:5211:0711:2211:3711:5212:0712:2212:3712:5213:0713:2213:3713:5214:0714:2214:3714:5215:0715:2215:3715:5216:0716:2216:3716:5217:0717:2217:3717:5218:0718:2218:3718:5319:2319:5120:2120:5121:2121:5122:2122:5123:2123:58
Pass
enge
r Boa
rding
s/Cap
acity
per
Trip
Trip Start Time
Average Maximum Passenger Load Orange/Red: standing passengers Blue: seated passengers
Average Passenger Boardings
Available Capacity Red: seats plus standing Blue: seats

160
Route 550 B
ellevue – Seattle
DRAFT I-90
Westbound Average Trip Ridership & Maximum Passenger Loads Sunday
Sunday Eastbound Average Trip Ridership & Maximum Passenger Loads
0
10
20
30
40
50
60
70
80
90
100
110
120
6:176:477:177:478:178:479:179:4510:1410:4411:1411:4412:1412:4413:1413:4414:1414:4415:1415:4416:1416:4417:1417:4418:1418:4419:2920:0420:3421:0421:3422:0222:3423:1223:420:12
Pass
enge
r Boa
rding
s/Cap
acity
per
Trip
Trip Start Time
0
10
20
30
40
50
60
70
80
90
100
110
120
6:056:357:047:348:048:349:089:3810:0810:3811:0811:3812:0812:3813:0813:3814:0814:3815:0815:3816:0816:3817:0817:3818:0818:5419:2319:5220:2220:5221:2221:5222:2222:5223:2223:59
Pass
enge
r Boa
rding
s/Cap
acity
per
Trip
Trip Start Time
Average Maximum Passenger Load Orange/Red: standing passengers Blue: seated passengers
Average Passenger Boardings
Available Capacity Red: seats plus standing Blue: seats

ISSAQUAH
N
0 2 41Miles
Downtown Seattle550
SEATTLE
554
continue to Northgate / U Districtvia SR 520
556555
Bellevue Transit Center532 535555 556 560 566 567550
MercerIsland
I-90 & Rainier Ave(closed Sept 2018)
550 554550 554
554 556555
South Bellevue555550 556
Issaquah TC555554 556
IssaquahHighlands
555554 556
DowntownIssaquah
554
South SammamishEastgateFwy StationPark & Ride
185th Ave & Redmond-Fall City Rd
554
554
Selec
t wee
kday
trips
onlyBELLEVUE SAMMAMISH
REDMOND
MERCERISLAND
161 | SOUND TRANSIT 2019 SERVICE IMPLEMENTATION PLAN
DRAFT2015 2016 2017 SPRING 2018
Ride
rshi
pAverage Weekday Boardings 3,720 4,020 4,116 4,059
Average Saturday Boardings 1,533 1,561 1,672 1,566
Average Sunday Boardings 1,310 1,237 1,339 1,229
Annual Boardings 1,104,901 1,180,368 1,213,152
Route 554 Issaquah – SeattleI-90
EASTBOUND STOPSto ISSAQUAH
Average Weekday WESTBOUND STOPSto SEATTLE
Average WeekdayOns Offs Ons Offs
Lenora St & 4th Ave 275 0 Redmond Way & 185th Ave 1 02nd Ave & Stewart St 255 4 229th Ave & NE 25th Way 1 02nd Ave & Seneca St 440 5 228th Ave & NE 8th St 1 02nd Ave & Cherry St 249 8 228th Ave & SE 8th St 1 0
S Washington St & 4th Ave S 80 5 South Sammamish Park & Ride 2 05th Ave S & S Jackson St 487 15 Issaquah Pine Lake Rd & SE 37th Pl 0 0
Rainier Avenue Freeway Station 85 10 Issaquah Highlands Park & Ride 186 0Mercer Island Park & Ride 80 126 9th Ave & NE Ellis Dr 69 1Eastgate Freeway Station 175 873 Sunset Way & 1st Ave 190 29Issaquah Transit Center 39 606 Issaquah Transit Center 524 30
Sunset Way & Rainier Blvd 31 195 Eastgate Freeway Station 586 115Highlands Dr & NE Ellis Dr 1 117 Mercer Island Park & Ride 308 76
Issaquah Highlands Park & Ride 5 222 Rainier Avenue Freeway Station 22 71Issaquah Pine Lake Rd & Issaquah Fall City Rd 0 2 4th Ave & S Jackson St 52 472
Issaquah Pine Lake Rd & SE 40th Pl 0 1 4th Ave & Washington St 6 62Issaquah Pine Lake Rd & SE 37th Pl 0 5 4th Ave & Cherry St 13 260
South Sammamish Park & Ride 0 4 4th Ave & Seneca St 3 300228th Ave NE & NE 8th St 0 3 4th Ave & Pike St 3 339
228th Ave NE & NE 25th Way 0 1 4th Ave & Stewart St 0 210NE Redmond Fall City & 185th Ave NE 0 3 4th Ave & Lenora St 0 0
Eastbound Total 2,202 2,202 Westbound Total 1,968 1,968Total 4,170 4,170

162
Route 554 Issaquah – S
eattle DRAFT I-90
Weekday Eastbound Average Trip Ridership & Maximum Passenger Loads
Weekday Westbound Average Trip Ridership & Maximum Passenger Loads
0
10
20
30
40
50
60
70
80
90
100
110
120
4:264:285:025:526:096:266:416:567:117:277:417:568:128:288:449:009:139:239:4010:0010:2010:4011:0011:2011:4012:0012:2012:4013:0013:2013:4013:5914:1814:3814:5815:2315:5216:2416:5617:2818:0218:3419:0419:3420:0420:3421:3422:34
Pass
enge
r Boa
rding
s/Cap
acity
per
Trip
Trip Start Time
0
10
20
30
40
50
60
70
80
90
100
110
120
5:275:576:317:037:358:078:399:099:299:4910:0910:2910:4911:0911:2911:4912:0912:2912:4913:0913:2913:4914:0914:2914:4614:5815:1015:3015:4516:0016:1516:2716:4517:0017:1517:3017:4518:0018:1518:3018:4518:5419:1419:4120:0920:3821:3822:3823:38
Pass
enge
r Boa
rding
s/Cap
acity
per
Trip
Trip Start Time
Average Maximum Passenger Load Orange/Red: standing passengers Blue: seated passengers
Average Passenger Boardings
Available Capacity Red: seats plus standing Blue: seats

163 | SOUND TRANSIT 2019 SERVICE IMPLEMENTATION PLAN
DRAFT
Saturday Westbound Average Trip Ridership & Maximum Passenger Loads
Saturday Eastbound Average Trip Ridership & Maximum Passenger Loads
0
10
20
30
40
50
60
70
80
90
100
110
120
6:25
7:25
8:24
9:24
10:24
10:54
11:24
11:54
12:24
12:54
13:24
13:54
14:24
14:54
15:24
15:54
16:24
16:54
17:24
17:54
18:24
18:54
19:24
20:25
21:25
22:25Pa
ssen
ger B
oard
ings/C
apac
ity p
er T
rip
Trip Start Time
0
10
20
30
40
50
60
70
80
90
100
110
120
6:24
7:24
8:22
9:22
10:15
10:45
11:15
11:45
12:15
12:45
13:15
13:45
14:15
14:45
15:15
15:45
16:15
16:45
17:17
17:48
18:18
18:52
19:25
20:26
21:26
22:26
23:26Pa
ssen
ger B
oard
ings/C
apac
ity p
er T
rip
Trip Start Time
Average Maximum Passenger Load Orange/Red: standing passengers Blue: seated passengers
Average Passenger Boardings
Available Capacity Red: seats plus standing Blue: seats

164
Route 554 Issaquah – S
eattle DRAFT I-90
Westbound Average Trip Ridership & Maximum Passenger Loads Sunday
Sunday Eastbound Average Trip Ridership & Maximum Passenger Loads
0
10
20
30
40
50
60
70
80
90
100
110
120
6:24
7:24
8:24
9:23
10:18
10:48
11:18
11:48
12:18
12:48
13:18
13:48
14:18
14:48
15:18
15:48
16:18
16:48
17:18
17:48
18:18
18:52
19:25
20:26
21:26
22:26
23:26Pa
ssen
ger B
oard
ings/C
apac
ity p
er T
rip
Trip Start Time
0
10
20
30
40
50
60
70
80
90
100
110
120
6:25
7:25
8:24
9:24
10:24
10:54
11:24
11:54
12:24
12:54
13:24
13:54
14:24
14:54
15:24
15:54
16:24
16:54
17:24
17:54
18:24
18:54
19:24
20:25
21:25
22:25Pa
ssen
ger B
oard
ings/C
apac
ity p
er T
rip
Trip Start Time
Average Maximum Passenger Load Orange/Red: standing passengers Blue: seated passengers
Average Passenger Boardings
Available Capacity Red: seats plus standing Blue: seats

* Reverse Peak Only
SEATAC
BURIEN
SEATTLEBELLEVUE
REDMOND
RENTON
TUKWILA
KENT
AUBURN
FEDERALWAY
NBellevue Transit Center
566560 535532 550 555 556
Newport Hills
Kennydale
Renton TC
Kent Station
Auburn Station
Auburn P&R
SeaTac Airport
Burien TC
Westwood Village
Overlake TC (SR520/NE 40th)566 567
566 567
560 566
560 566
*
*
560 566
560
560
560
566
566 578
574
541 542 545
567
0 2 41Miles
165 | SOUND TRANSIT 2019 SERVICE IMPLEMENTATION PLAN
DRAFTI-405 South

Corridor I-405 SouthDay Type Direction 2 3 4 5 6 7 8 9 10 11 12 13 14 15 16 17 18 19 20 21 22 23 24 25Weekday Northbound
Weekday Southbound
Saturday Northbound
Saturday Southbound
Sunday Northbound
Sunday Southbound
Hour
Service Frequency Legend Very Frequent (<10 min) Frequent (10-20 min) Moderate (20-30 min) Minimum (30-60 min)
166
Routes
560 566 567DRAFT I-405 S
1,794
1,408
681
0 1,000 2,000
560
566
567
827
0 1,000 2,000
560
566
567
720
0 1,000 2,000
560
566
567
83%
76%
82%
0% 50% 100%
560
566
567
27
26
34
0 20 40
560
566
567
Passengers per TripOTP
Weekday Ridership Saturday Ridership Sunday Ridership
OTP Standard
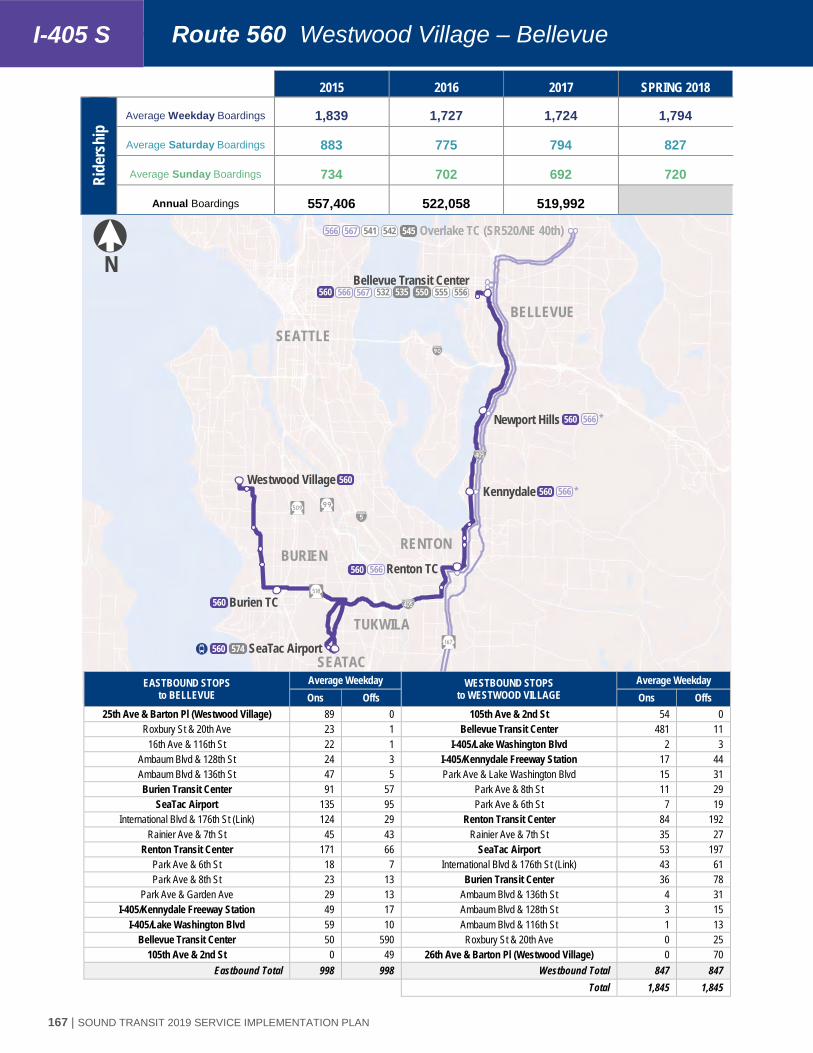
SEATAC
BURIEN
SEATTLEBELLEVUE
RENTON
TUKWILA
NBellevue Transit Center
566560 535532 550 555 556
Newport Hills
Kennydale
Renton TC
SeaTac Airport
Burien TC
Westwood Village
Overlake TC (SR520/NE 40th)566 567
560 566
560 566
*
*
560 566
560
560
560
574
541 542 545
567
0 2 41Miles
167 | SOUND TRANSIT 2019 SERVICE IMPLEMENTATION PLAN
DRAFT2015 2016 2017 SPRING 2018
Ride
rshi
pAverage Weekday Boardings 1,839 1,727 1,724 1,794
Average Saturday Boardings 883 775 794 827
Average Sunday Boardings 734 702 692 720
Annual Boardings 557,406 522,058 519,992
Route 560 Westwood Village – BellevueI-405 S
EASTBOUND STOPS to BELLEVUE
Average Weekday WESTBOUND STOPS to WESTWOOD VILLAGE
Average WeekdayOns Offs Ons Offs
25th Ave & Barton Pl (Westwood Village) 89 0 105th Ave & 2nd St 54 0Roxbury St & 20th Ave 23 1 Bellevue Transit Center 481 11
16th Ave & 116th St 22 1 I-405/Lake Washington Blvd 2 3Ambaum Blvd & 128th St 24 3 I-405/Kennydale Freeway Station 17 44Ambaum Blvd & 136th St 47 5 Park Ave & Lake Washington Blvd 15 31Burien Transit Center 91 57 Park Ave & 8th St 11 29
SeaTac Airport 135 95 Park Ave & 6th St 7 19International Blvd & 176th St (Link) 124 29 Renton Transit Center 84 192
Rainier Ave & 7th St 45 43 Rainier Ave & 7th St 35 27Renton Transit Center 171 66 SeaTac Airport 53 197
Park Ave & 6th St 18 7 International Blvd & 176th St (Link) 43 61Park Ave & 8th St 23 13 Burien Transit Center 36 78
Park Ave & Garden Ave 29 13 Ambaum Blvd & 136th St 4 31I-405/Kennydale Freeway Station 49 17 Ambaum Blvd & 128th St 3 15
I-405/Lake Washington Blvd 59 10 Ambaum Blvd & 116th St 1 13Bellevue Transit Center 50 590 Roxbury St & 20th Ave 0 25
105th Ave & 2nd St 0 49 26th Ave & Barton Pl (Westwood Village) 0 70Eastbound Total 998 998 Westbound Total 847 847
Total 1,845 1,845

168
Route 560 W
estwood V
illage – Bellevue
DRAFT I-405 S
0
10
20
30
40
50
60
70
80
90
100
110
120
4:435:115:406:076:337:047:348:058:359:049:3410:0310:3311:0311:3212:0212:3112:5913:2913:5914:2414:5415:2615:5216:2616:5317:2318:0419:0620:0721:0722:1023:10
Pass
enge
r Boa
rding
s/Cap
acity
per
Trip
Trip Start Time
Weekday Eastbound Average Trip Ridership & Maximum Passenger Loads
Weekday Westbound Average Trip Ridership & Maximum Passenger Loads
0
10
20
30
40
50
60
70
80
90
100
110
120
5:035:326:026:327:017:328:028:329:029:3210:0210:3211:0211:3212:0212:3213:0213:3214:0114:3215:0215:3216:0116:3117:0017:2918:0118:3219:0219:3220:3221:3222:33
Pass
enge
r Boa
rding
s/Cap
acity
per
Trip
Trip Start Time
Average Maximum Passenger Load Orange/Red: standing passengers Blue: seated passengers
Average Passenger Boardings
Available Capacity Red: seats plus standing Blue: seats

169 | SOUND TRANSIT 2019 SERVICE IMPLEMENTATION PLAN
DRAFT
Saturday Westbound Average Trip Ridership & Maximum Passenger Loads
Saturday Eastbound Average Trip Ridership & Maximum Passenger Loads
0
10
20
30
40
50
60
70
80
90
100
110
120
5:15
6:15
7:15
8:05
9:00
10:00
11:00
12:00
13:08
14:08
15:08
16:08
17:08
18:10
19:14
20:14
21:14
22:17
23:17Pa
ssen
ger B
oard
ings/C
apac
ity p
er T
rip
Trip Start Time
0
10
20
30
40
50
60
70
80
90
100
110
120
5:30
6:30
7:30
8:30
9:30
10:30
11:30
12:30
13:30
14:30
15:30
16:30
17:30
18:30
19:30
20:30
21:30
22:30Pa
ssen
ger B
oard
ings/C
apac
ity p
er T
rip
Trip Start Time
Average Maximum Passenger Load Orange/Red: standing passengers Blue: seated passengers
Average Passenger Boardings
Available Capacity Red: seats plus standing Blue: seats

170
Route 560 W
estwood V
illage – Bellevue
DRAFT I-405 S
Westbound Average Trip Ridership & Maximum Passenger Loads Sunday
Sunday Eastbound Average Trip Ridership & Maximum Passenger Loads
0
10
20
30
40
50
60
70
80
90
100
110
120
5:31
6:31
7:31
8:31
9:31
10:31
11:31
12:31
13:31
14:31
15:31
16:31
17:31
18:31
19:31
20:31
21:31
22:31Pa
ssen
ger B
oard
ings/C
apac
ity p
er T
rip
Trip Start Time
0
10
20
30
40
50
60
70
80
90
100
110
120
5:16
6:16
7:16
8:16
9:12
10:12
11:10
12:10
13:08
14:08
15:08
16:08
17:08
18:10
19:14
20:14
21:14
22:17
23:17Pa
ssen
ger B
oard
ings/C
apac
ity p
er T
rip
Trip Start Time
Average Maximum Passenger Load Orange/Red: standing passengers Blue: seated passengers
Average Passenger Boardings
Available Capacity Red: seats plus standing Blue: seats

SEATAC
BURIEN
SEATTLEBELLEVUE
RENTON
TUKWILA
KENT
AUBURN
FEDERALWAY
NBellevue Transit Center
566560535
532550 555 556
Newport Hills
Kennydale
Renton TC
Kent Station
Auburn Station
Auburn P&R
SeaTac Airport
Burien TC
Westwood Village
Overlake TC (SR520/NE 40th)566 567
566 567
560 566
560 566
*
*
560 566
560
560
560
566
566 578
574
541 542 545
567
#0 2 41
Miles
171 | SOUND TRANSIT 2019 SERVICE IMPLEMENTATION PLAN
DRAFT2015 2016 2017 SPRING 2018
Ride
rshi
pAverage Weekday Boardings 1,653 1,516 1,401 1,408
Average Saturday Boardings N/A N/A N/A N/A
Average Sunday Boardings N/A N/A N/A N/A
Annual Boardings 421,642 386,674 355,782
Route 566 Auburn – OverlakeI-405 S
NORTHBOUND STOPS to OVERLAKE
Average WeekdayOns Offs
Auburn Station 100 0Auburn Park & Ride 44 7Smith St & 4th Ave 5 5
Kent Station 174 25Central Ave & 228th St 19 13
Rainier Ave & 7th St 65 19Renton Transit Center 200 71
Park Ave & 6th St 20 10Park Ave & 8th St 25 11
Park Ave & Garden Ave 30 5Kennydale Freeway Station 8 3
Newport Hills Freeway Station 5 0Bellevue Transit Center 51 432
SR 520 & 40th St 0 146Northbound Total 747 747
SOUTHBOUND STOPS to KENT/AUBURN
Average Weekday
Ons Offs
Overlake Transit Center 84 0SR 520 & 40th St 56 2
Bellevue Transit Center 372 46Newport Hills Freeway Station 0 0
Kennydale Freeway Station 3 8Park Ave & Lake Washington Blvd 6 34
Park Ave & 8th St 9 31Park Ave & 6th St 8 14
Renton Transit Center 80 214Rainier Ave & 7th St 17 31
Central Ave & 228th St 9 15Kent Station 23 138
Smith St & 4th Ave 1 9Auburn Park & Ride 7 43
Auburn Station 0 90Southbound Total 675 675
Total 1,422 1,422

172
Route 566 A
uburn – Overlake
DRAFT I-405 S
Weekday Southbound Average Trip Ridership & Maximum Passenger Loads
Weekday Northbound Average Trip Ridership & Maximum Passenger Loads
0
10
20
30
40
50
60
70
80
90
100
110
120
4:45
4:59
5:31
5:42
6:08
6:13
6:18
6:43
6:48
7:03
7:13
7:46
8:14
8:45
9:15
9:45
10:28
11:29
12:29
13:29
14:29
15:11
15:41
16:11
16:37
17:16
17:45
18:31Pa
ssen
ger B
oard
ings/C
apac
ity p
er T
rip
Trip Start Time
0
10
20
30
40
50
60
70
80
90
100
110
120
6:08
6:36
7:06
7:31
8:01
9:40
10:40
11:40
12:38
13:38
13:32
14:02
14:32
14:59
15:29
15:54
16:00
16:21
16:30
16:49
16:57
17:22
17:56
18:31
19:06
19:51Pa
ssen
ger B
oard
ings/C
apac
ity p
er T
rip
Trip Start Time
Average Maximum Passenger Load Orange/Red: standing passengers Blue: seated passengers
Average Passenger Boardings
Available Capacity Red: seats plus standing Blue: seats

SEATAC
BURIEN
SEATTLEBELLEVUE
RENTON
TUKWILA
KENT
AUBURN
FEDERALWAY
NBellevue Transit Center
566560535
532550 555 556
Newport Hills
Kennydale
Renton TC
Kent Station
Auburn Station
Auburn P&R
SeaTac Airport
Burien TC
Westwood Village
Overlake TC (SR520/NE 40th)566 567
566 567
560 566
560 566
*
*
560 566
560
560
560
566
566 578
574
541 542 545
567
#0 2 41
Miles
173 | SOUND TRANSIT 2019 SERVICE IMPLEMENTATION PLAN
DRAFT2015 2016 2017 SPRING 2018
Ride
rshi
pAverage Weekday Boardings 586 596 624 681
Average Saturday Boardings N/A N/A N/A N/A
Average Sunday Boardings N/A N/A N/A N/A
Annual Boardings 149,318 151,971 158,455
Route 567 Kent – OverlakeI-405 S
NORTHBOUND STOPS to OVERLAKE
Average WeekdayOns Offs
Kent Station 317 0Central Ave & 228 St 9 4
Bellevue Transit Center 14 258SR 520 & 40th St 0 78
Northbound Total 340 340
SOUTHBOUND STOPS to KENT
Average WeekdayOns Offs
Overlake Transit Center 67 0SR 520 & 40th St 33 0
Bellevue Transit Center 261 26Central Ave & 228 St 2 7
Kent Station 0 331Southbound Total 364 364Total 704 704
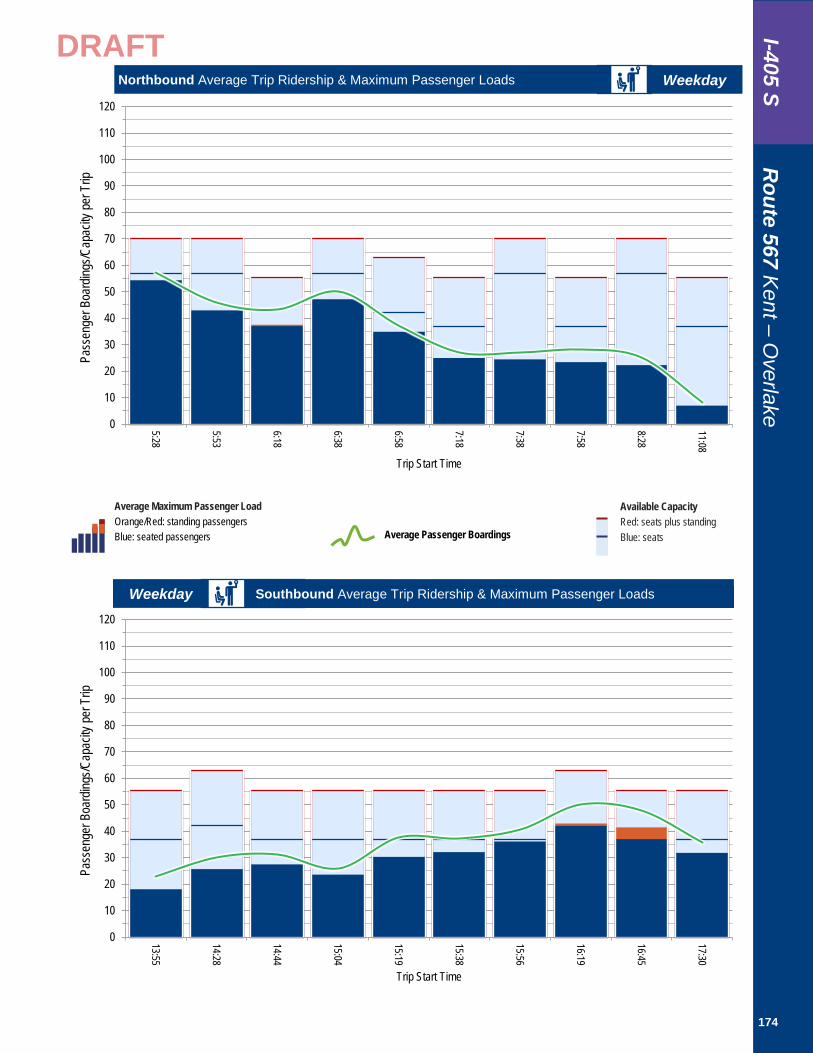
174
Route 567 K
ent – Overlake
DRAFT I-405 S
Weekday Southbound Average Trip Ridership & Maximum Passenger Loads
Weekday Northbound Average Trip Ridership & Maximum Passenger Loads
0
10
20
30
40
50
60
70
80
90
100
110
120
5:28
5:53
6:18
6:38
6:58
7:18
7:38
7:58
8:28
11:08
Pass
enge
r Boa
rding
s/Cap
acity
per
Trip
Trip Start Time
0
10
20
30
40
50
60
70
80
90
100
110
120
13:55
14:28
14:44
15:04
15:19
15:38
15:56
16:19
16:45
17:30
Pass
enge
r Boa
rding
s/Cap
acity
per
Trip
Trip Start Time
Average Maximum Passenger Load Orange/Red: standing passengers Blue: seated passengers
Average Passenger Boardings
Available Capacity Red: seats plus standing Blue: seats

SEATTLE
SEATAC
RENTONTUKWILA
KENT
AUBURN
SUMNER
PUYALLUP
TACOMA
LAKEWOOD
FEDERALWAY
BURIEN
0 2.51.25Miles
5
DowntownSeattle
578577
Federal Way Transit Center578577574
Tacoma Dome Station590 594586
Auburn Station
Puyallup StationSumner Station 596578
578 566
580
578
578578
574
SeaTac Airport
Star Lake P&R
Kent / Des Moines P&R
560574
574
574
592 594580574SR 512 P&RLakewood TransitCenter
574
N
175 | SOUND TRANSIT 2019 SERVICE IMPLEMENTATION PLAN
DRAFTI-5 South – S. King

Corridor I-5 South KingDay Type Direction 2 3 4 5 6 7 8 9 10 11 12 13 14 15 16 17 18 19 20 21 22 23 24 25Weekday Northbound
Weekday Southbound
Saturday Northbound
Saturday Southbound
Sunday Northbound
Sunday Southbound
Hour
Service Frequency Legend Very Frequent (<10 min) Frequent (10-20 min) Moderate (20-30 min) Minimum (30-60 min)
176
Routes
574 577 578DRAFT I -5 S
S. King
2,207
1,885
1,914
0 500 1,000 1,500 2,000 2,500
574
577
578
1,477
555
1,211
0 500 1,000 1,500 2,000 2,500
574
577
578
1,353
410
978
0 500 1,000 1,500 2,000 2,500
574
577
578
72%
78%
75%
0% 50% 100%
574
577
578
29
46
35
0 20 40 60
574
577
578
Passengers per TripOTP
Weekday Ridership Saturday Ridership Sunday Ridership
OTP Standard

SEATTLE
SEATAC
RENTONTUKWILA
KENT
AUBURN
BONNEYLAKE
SUMNER
PUYALLUP
TACOMA
LAKEWOOD
FEDERALWAY
BURIEN
0 2.51.25Miles
5
DowntownSeattle
578577
Federal Way Transit Center578577574
Tacoma Dome Station590 594586
Auburn Station
Puyallup StationSumner Station 596578
578 566
580
578
578578
574
SeaTac Airport
Star Lake P&R
Kent / Des Moines P&R
560574
574
574
592 594580574SR 512 P&RLakewood TransitCenter
574
#
N
177 | SOUND TRANSIT 2019 SERVICE IMPLEMENTATION PLAN
DRAFT2015 2016 2017 SPRING 2018
Ride
rshi
pAverage Weekday Boardings 2,402 2,309 2,236 2,207
Average Saturday Boardings 1,755 1,686 1,611 1,477
Average Sunday Boardings 1,511 1,517 1,428 1,353
Annual Boardings 791,421 766,163 735,955
Route 574 Lakewood – SeaTacI-5 SS. King
NORTHBOUND STOPSto SEATAC AIRPORT
Average WeekdayOns Offs
Lakewood Transit Center 283 0SR-512 Park & Ride 168 17D St E & E 25th St 6 17
Tacoma Dome Station 347 57Federal Way Transit Center 216 195
Star Lake Park & Ride 19 14I-5/Kent Des Moines Rd 19 34S 188th St & Military Rd 7 17S 188th St & 42nd Ave 7 9S 188th St & 36th Ave 1 5
International Blvd & S 188th St 3 39International Blvd & S 180th St 1 20
International Blvd & S 176th St (Link) 6 160SeaTac Airport 0 497
Northbound Total 1,082 1,082SOUTHBOUND STOPS
to LAKEWOODAverage Weekday
Ons OffsInternational Blvd & S 176th St (Link) 77 0
SeaTac Airport 647 13International Blvd & S 182nd St 44 2International Blvd & S 188th St 39 3
S 188th St & 36th Ave 5 3S 188th St & 42nd Ave 9 6S 188th St & 46th Ave 21 12
I-5/Kent Des Moines Rd 25 12Star Lake Park & Ride 13 22
Federal Way Transit Center 186 252Tacoma Dome Station 66 373
E 26th St & D St E 0 4SR-512 Park & Ride 14 167
Lakewood Transit Center 0 277Southbound Total 1,146 1,146
Total 2,227 2,227

178
Route 574 Lakew
ood – SeaTac
DRAFT I-5 S S. K
ing
Weekday Southbound Average Trip Ridership & Maximum Passenger Loads
Weekday Northbound Average Trip Ridership & Maximum Passenger Loads
0
10
20
30
40
50
60
70
80
90
100
110
120
2:132:282:483:083:384:084:365:065:366:056:347:047:348:048:349:049:3410:0410:3411:1911:4912:1912:4913:1913:4914:1914:4915:1915:4916:1916:4917:1917:4918:2118:5119:5120:5221:52
Pass
enge
r Boa
rding
s/Cap
acity
per
Trip
Trip Start Time
0
10
20
30
40
50
60
70
80
90
100
110
120
4:325:025:326:026:327:027:328:018:319:019:3110:0110:3111:0111:3112:0112:2112:4113:0113:2113:4114:0114:2114:4114:5915:2815:5816:2816:5717:2717:5818:2819:0219:3220:0220:3421:3422:3423:34
Pass
enge
r Boa
rding
s/Cap
acity
per
Trip
Trip Start Time
Average Maximum Passenger Load Orange/Red: standing passengers Blue: seated passengers
Average Passenger Boardings
Available Capacity Red: seats plus standing Blue: seats

179 | SOUND TRANSIT 2019 SERVICE IMPLEMENTATION PLAN
DRAFT Saturday Northbound Average Trip Ridership & Maximum Passenger Loads
Saturday Southbound Average Trip Ridership & Maximum Passenger Loads
0
10
20
30
40
50
60
70
80
90
100
110
120
2:13
2:38
3:08
3:38
4:08
4:38
5:38
6:38
7:38
8:38
9:38
10:08
10:38
11:21
11:51
12:21
12:51
13:21
13:51
14:21
14:51
15:21
15:51
16:21
16:51
17:21
17:51
18:52
19:53
20:53
21:53Pa
ssen
ger B
oard
ings/C
apac
ity p
er T
rip
Trip Start Time
0
10
20
30
40
50
60
70
80
90
100
110
120
4:33
5:33
6:33
7:33
8:33
9:33
10:33
11:33
12:03
12:33
13:03
13:33
14:03
14:33
15:03
15:33
16:03
16:33
17:03
17:33
18:03
18:33
19:03
19:33
20:33
21:33
22:33
23:33Pa
ssen
ger B
oard
ings/C
apac
ity p
er T
rip
Trip Start Time
Average Maximum Passenger Load Orange/Red: standing passengers Blue: seated passengers
Average Passenger Boardings
Available Capacity Red: seats plus standing Blue: seats

180
Route 574 Lakew
ood – SeaTac
DRAFT I-5 S S. K
ing
Northbound Average Trip Ridership & Maximum Passenger Loads Sunday
Sunday Southbound Average Trip Ridership & Maximum Passenger Loads
0
10
20
30
40
50
60
70
80
90
100
110
120
2:13
2:38
3:08
3:38
4:08
4:38
5:38
6:38
7:38
8:38
9:38
10:08
10:38
11:21
11:51
12:21
12:51
13:21
13:51
14:21
14:51
15:21
15:51
16:21
16:51
17:21
17:51
18:52
19:53
20:53
21:53Pa
ssen
ger B
oard
ings/C
apac
ity p
er T
rip
Trip Start Time
0
10
20
30
40
50
60
70
80
90
100
110
120
4:33
5:33
6:33
7:33
8:33
9:33
10:33
11:33
12:03
12:33
13:03
13:33
14:03
14:33
15:03
15:33
16:03
16:33
17:03
17:33
18:03
18:33
19:03
19:33
20:33
21:33
22:33
23:33Pa
ssen
ger B
oard
ings/C
apac
ity p
er T
rip
Trip Start Time
Average Maximum Passenger Load Orange/Red: standing passengers Blue: seated passengers
Average Passenger Boardings
Available Capacity Red: seats plus standing Blue: seats

SEATTLE
SEATAC
RENTONTUKWILA
KENT
AUBURN
BONNEYLAKE
SUMNER
PUYALLUP
TACOMA
LAKEWOOD
FEDERALWAY
BURIEN
0 2.51.25Miles
5
DowntownSeattle
578577
Federal Way Transit Center578577574
Tacoma Dome Station590 594586
Auburn Station
Puyallup StationSumner Station 596578
578 566
580
578
578578
574
SeaTac Airport
Star Lake P&R
Kent / Des Moines P&R
560574
574
574
592 594580574SR 512 P&RLakewood TransitCenter
574
#
N
181 | SOUND TRANSIT 2019 SERVICE IMPLEMENTATION PLAN
DRAFT2015 2016 2017 SPRING 2018
Ride
rshi
pAverage Weekday Boardings 1,631 1,694 1,761 1,885
Average Saturday Boardings 641 588 558 555
Average Sunday Boardings 405 405 377 410
Annual Boardings 472,732 486,572 498,657
Route 577 Federal Way – SeattleI-5 SS. King
NORTHBOUND STOPSto SEATTLE
Average WeekdayOns Offs
Federal Way Transit Center 1,021 05th Ave & Seneca St 4 471Pine St & 3rd Ave 2 4552nd Ave & Pike St 1 38
2nd Ave & Marion St 1 342nd Ave & James St 0 11
2nd Ave & S Jackson St 1 22Northbound Total 1,031 1,031
SOUTHBOUND STOPSto FEDERAL WAY
Average WeekdayOns Offs
Fairview Ave & Thomas St 103 0Boren Ave & Virginia St 35 1
Stewart St & 9th Ave 80 6Stewart St & 7th Ave 112 4Stewart St & 4th Ave 97 152nd Ave & Pike St 198 15
2nd Ave & Marion St 124 302nd Ave & James St 52 12
2nd Ave & S Jackson St 61 62Federal Way Transit Center 0 719
Southbound Total 862 862Total 1,894 1,894

182
Route 577 Federal W
ay – Seattle
DRAFT I-5 S S. K
ing
Weekday Southbound Average Trip Ridership & Maximum Passenger Loads
Weekday Northbound Average Trip Ridership & Maximum Passenger Loads
0
10
20
30
40
50
60
70
80
90
100
110
120
5:00
5:10
5:30
5:45
6:00
6:10
6:20
6:30
6:40
6:48
6:56
7:04
7:14
7:26
7:38
7:50
8:02
8:14
8:27
8:45Pa
ssen
ger B
oard
ings/C
apac
ity p
er T
rip
Trip Start Time
0
10
20
30
40
50
60
70
80
90
100
110
120
5:30
6:00
6:16
6:44
6:54
7:28
14:37
14:57
15:12
15:27
15:42
15:57
16:06
16:16
16:25
16:34
16:44
16:53
17:08
17:24
17:45Pa
ssen
ger B
oard
ings/C
apac
ity p
er T
rip
Trip Start Time
Average Maximum Passenger Load Orange/Red: standing passengers Blue: seated passengers
Average Passenger Boardings
Available Capacity Red: seats plus standing Blue: seats

183 | SOUND TRANSIT 2019 SERVICE IMPLEMENTATION PLAN
DRAFT
Saturday Northbound Average Trip Ridership & Maximum Passenger Loads
Saturday Southbound Average Trip Ridership & Maximum Passenger Loads
0
10
20
30
40
50
60
70
80
90
100
110
120
6:43
7:43
8:43
9:43
10:43
11:44
12:44
13:44
14:44
15:44
16:44
17:44
18:43
19:43
20:43
21:43Pa
ssen
ger B
oard
ings/C
apac
ity p
er T
rip
Trip Start Time
0
10
20
30
40
50
60
70
80
90
100
110
120
6:15
7:15
8:15
9:15
10:15
11:15
12:15
13:15
14:15
15:15
16:15
17:15
18:15
19:15
20:15
21:15Pa
ssen
ger B
oard
ings/C
apac
ity p
er T
rip
Trip Start Time
Average Maximum Passenger Load Orange/Red: standing passengers Blue: seated passengers
Average Passenger Boardings
Available Capacity Red: seats plus standing Blue: seats

184
Route 577 Federal W
ay – Seattle
DRAFT I-5 S S. K
ing
Northbound Average Trip Ridership & Maximum Passenger Loads Sunday
Sunday Southbound Average Trip Ridership & Maximum Passenger Loads
0
10
20
30
40
50
60
70
80
90
100
110
120
6:15
7:15
8:15
9:15
10:15
11:15
12:15
13:15
14:15
15:15
16:15
17:15
18:15
19:15Pa
ssen
ger B
oard
ings/C
apac
ity p
er T
rip
Trip Start Time
0
10
20
30
40
50
60
70
80
90
100
110
120
6:43
7:43
8:43
9:43
10:43
11:44
12:44
13:44
14:44
15:44
16:44
17:44
18:43
19:43Pa
ssen
ger B
oard
ings/C
apac
ity p
er T
rip
Trip Start Time
Average Maximum Passenger Load Orange/Red: standing passengers Blue: seated passengers
Average Passenger Boardings
Available Capacity Red: seats plus standing Blue: seats

SEATTLE
SEATAC
RENTONTUKWILA
KENT
AUBURN
BONNEYLAKE
SUMNER
PUYALLUP
TACOMA
LAKEWOOD
FEDERALWAY
BURIEN
0 2.51.25Miles
5
DowntownSeattle
578577
Federal Way Transit Center578577574
Tacoma Dome Station590 594586
Auburn Station
Puyallup StationSumner Station 596578
578 566
580
578
578578
574
SeaTac Airport
Star Lake P&R
Kent / Des Moines P&R
560574
574
574
592 594580574SR 512 P&RLakewood TransitCenter
574
#
N
185 | SOUND TRANSIT 2019 SERVICE IMPLEMENTATION PLAN
DRAFT2015 2016 2017 SPRING 2018
Ride
rshi
pAverage Weekday Boardings 1,813 1,796 1,848 1,914
Average Saturday Boardings 1,311 1,168 1,220 1,211
Average Sunday Boardings 968 944 979 978
Annual Boardings 586,487 574,684 590,546
Route 578 Puyallup – SeattleI-5 SS. King
NORTHBOUND STOPSto SEATTLE
Average WeekdayOns Offs
Puyallup Station 130 0Sumner Station 47 18Auburn Station 186 44
Federal Way Transit Center 477 794th Ave & Pike St 11 550
Olive Way & 6th Ave 3 94Howell St & 9th Ave 1 18
Howell St & Yale Ave 0 10Eastlake Ave & Stewart St 0 41
Northbound Total 854 854SOUTHBOUND STOPS
to PUYALLUPAverage Weekday
Ons OffsFairview Ave & Thomas St 77 0
Boren Ave & Virginia St 11 0Stewart St & 9th Ave 66 2Stewart St & 7th Ave 65 2Stewart St & 4th Ave 85 52nd Ave & Pike St 274 9
2nd Ave & Marion St 102 62nd Ave & James St 60 4
2nd Ave & S Jackson St 145 11Federal Way Transit Center 73 581
Auburn Station 40 189Sumner Station 19 67Puyallup Station 0 141
Southbound Total 1,018 1,018Total 1,872 1,872
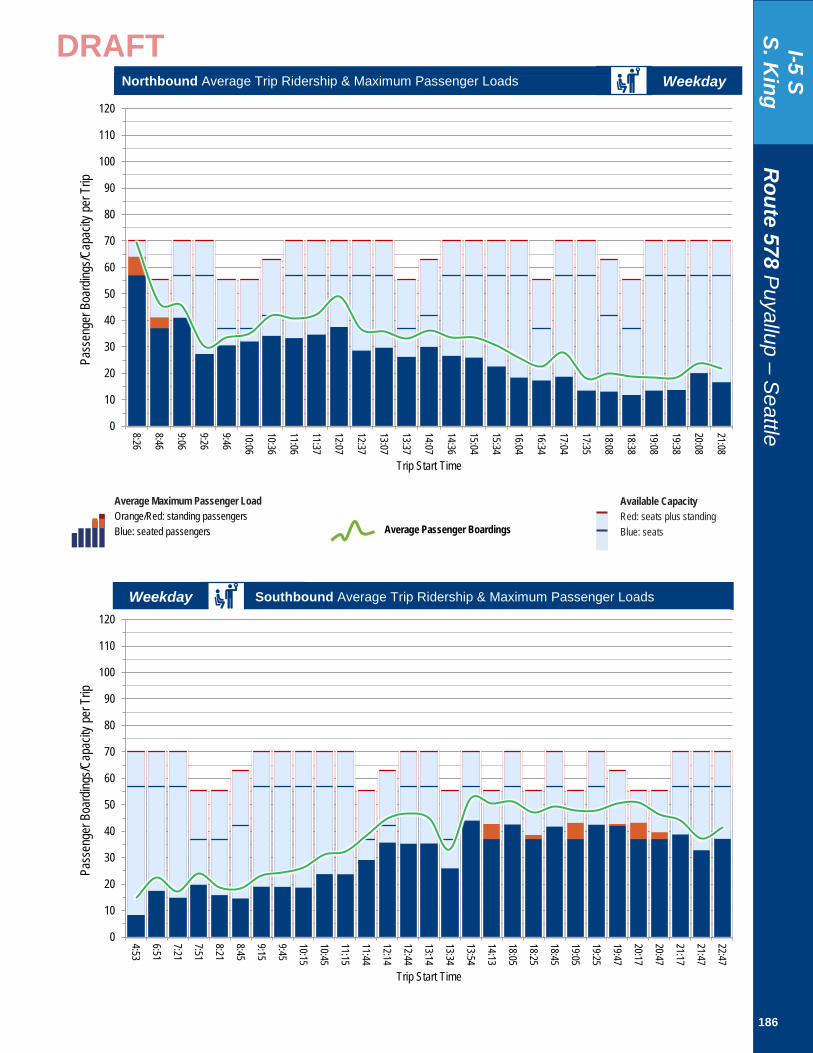
186
Route 578 P
uyallup – Seattle
DRAFT I-5 S S. K
ing
Weekday Southbound Average Trip Ridership & Maximum Passenger Loads
Weekday Northbound Average Trip Ridership & Maximum Passenger Loads
0
10
20
30
40
50
60
70
80
90
100
110
120
4:53
6:51
7:21
7:51
8:21
8:45
9:15
9:45
10:15
10:45
11:15
11:44
12:14
12:44
13:14
13:34
13:54
14:13
18:05
18:25
18:45
19:05
19:25
19:47
20:17
20:47
21:17
21:47
22:47Pa
ssen
ger B
oard
ings/C
apac
ity p
er T
rip
Trip Start Time
0
10
20
30
40
50
60
70
80
90
100
110
120
8:26
8:46
9:06
9:26
9:46
10:06
10:36
11:06
11:37
12:07
12:37
13:07
13:37
14:07
14:36
15:04
15:34
16:04
16:34
17:04
17:35
18:08
18:38
19:08
19:38
20:08
21:08Pa
ssen
ger B
oard
ings/C
apac
ity p
er T
rip
Trip Start Time
Average Maximum Passenger Load Orange/Red: standing passengers Blue: seated passengers
Average Passenger Boardings
Available Capacity Red: seats plus standing Blue: seats

187 | SOUND TRANSIT 2019 SERVICE IMPLEMENTATION PLAN
DRAFT
Saturday Northbound Average Trip Ridership & Maximum Passenger Loads
Saturday Southbound Average Trip Ridership & Maximum Passenger Loads
0
10
20
30
40
50
60
70
80
90
100
110
120
8:00
9:00
10:00
11:00
12:01
13:01
14:01
15:01
16:01
17:01
18:00
19:00
20:00
21:00
22:00Pa
ssen
ger B
oard
ings/C
apac
ity p
er T
rip
Trip Start Time
0
10
20
30
40
50
60
70
80
90
100
110
120
6:01
7:01
8:01
9:01
10:01
11:01
12:01
13:01
14:01
15:01
16:01
17:01
18:01
19:01
20:01Pa
ssen
ger B
oard
ings/C
apac
ity p
er T
rip
Trip Start Time
Average Maximum Passenger Load Orange/Red: standing passengers Blue: seated passengers
Average Passenger Boardings
Available Capacity Red: seats plus standing Blue: seats

188
Route 578 P
uyallup – Seattle
DRAFT I-5 S S. K
ing
Northbound Average Trip Ridership & Maximum Passenger Loads Sunday
Sunday Southbound Average Trip Ridership & Maximum Passenger Loads
0
10
20
30
40
50
60
70
80
90
100
110
120
6:01
7:01
8:01
9:01
10:01
11:01
12:01
13:01
14:01
15:01
16:01
17:01
18:01
19:01
20:01Pa
ssen
ger B
oard
ings/C
apac
ity p
er T
rip
Trip Start Time
0
10
20
30
40
50
60
70
80
90
100
110
120
8:00
9:00
10:00
11:00
12:01
13:01
14:01
15:01
16:01
17:01
18:00
19:00
20:00
21:00
22:00Pa
ssen
ger B
oard
ings/C
apac
ity p
er T
rip
Trip Start Time
Average Maximum Passenger Load Orange/Red: standing passengers Blue: seated passengers
Average Passenger Boardings
Available Capacity Red: seats plus standing Blue: seats

UA
SEATAC
RENTONTUKWILA
KENT
AUBURN
BONNEYLAKE
SUMNER
PUYALLUP
TACOMA
LAKEWOOD
FEDERALWAY
N
Select weekday trips only
540 542541 556
U District
Downtown Seattle594
SODO
Tacoma Dome590 594586 574
Commerce& 10th
Purdy P&R
Kimball Drive P&R
DuPont
UW Link Station
Narrows P&R
Tacoma Comm. College TC
595
595
595
595
594
SR 512 P&R 592 594 580574Lakewood Station592 594 580
592
586
540 542541 556586
590 592 595
594590 595
590 594
0 52.5Miles
10
189 | SOUND TRANSIT 2019 SERVICE IMPLEMENTATION PLAN
DRAFTI-5 South - Pierce

Corridor I-5 PierceDay Type Direction 2 3 4 5 6 7 8 9 10 11 12 13 14 15 16 17 18 19 20 21 22 23 24 25Weekday Northbound
Weekday Southbound
Saturday Northbound
Saturday Southbound
Sunday Northbound
Sunday Southbound
Hour
Service Frequency Legend Very Frequent (<10 min) Frequent (10-20 min) Moderate (20-30 min) Minimum (30-60 min)
190
Routes
586 590 592 594 595DRAFT I -5 S
Pierce
475
2,845
843
2,141
335
0 1,000 2,000 3,000
586
590
592
594
595
2,248
0 1,000 2,000 3,000
586
590
592
594
595
1,803
0 1,000 2,000 3,000
586
590
592
594
595
76%
74%
70%
78%
79%
0% 50% 100%
586
590
592
594
595
29
34
27
33
33
0 20 40
586
590
592
594
595
Passengers per TripOTP
Weekday Ridership Saturday Ridership Sunday Ridership
OTP Standard

U
SEATAC
RENTONTUKWILA
KENT
AUBURN
SUMNER
PUYALLUP
TACOMA
LAKEWOOD
FEDERALWAY
N
Select weekday trips only
540 542541 556
U District
Downtown Seattle594
SODO
Tacoma Dome590 594586 574
Commerce& 10th
Purdy P&R
Kimball Drive P&R
UW Link Station
Narrows P&R
Tacoma Comm. College TC
595
595
595
595
SR 512 P&R 592 594 580574Lakewood Station592 594 580
586
540 542541 556586
590 592 595
594590 595
590 594
0 52.5Miles
10
191 | SOUND TRANSIT 2019 SERVICE IMPLEMENTATION PLAN
DRAFT2015 2016 2017 SPRING 2018
Ride
rshi
pAverage Weekday Boardings 559 446 458 475
Average Saturday Boardings N/A N/A N/A N/A
Average Sunday Boardings N/A N/A N/A N/A
Annual Boardings 142,624 113,823 116,249
Route 586 Tacoma – U. DistrictI-5 SPierce
NORTHBOUND STOPSto UNIVERSITY DISTRICT
Average WeekdayOns Offs
Tacoma Dome Station 220 045th St & Roosevelt Way 3 42
45th St & University Way 1 3915th Ave & 43rd St 2 32
15th Ave & Campus Pkwy 1 3615th Ave & NE 40th 1 13
Pacific St & UW Hitchcock Hall 0 28University of Washington Link Station 0 39Northbound Total 228 228
SOUTHBOUND STOPSto TACOMA
Average WeekdayOns Offs
45th St & Roosevelt Way 33 045th St & University Way 34 0
15th Ave & 43rd St 24 115th Ave & Campus Pkwy 48 1
15th Ave & 40th St 19 1Pacific St & UW Hitchcock Hall 31 3
University of Washington Link Station 50 8Tacoma Dome Station 0 224
Southbound Total 238 238Total 466 466

192
Route 586 Tacom
a – University D
istrict DRAFT I-5 S
Pierce
Weekday Southbound Average Trip Ridership & Maximum Passenger Loads
Weekday Northbound Average Trip Ridership & Maximum Passenger Loads
0
10
20
30
40
50
60
70
80
90
100
110
120
5:15
5:38
6:01
6:29
6:38
6:54
7:26
8:00
Pass
enge
r Boa
rding
s/Cap
acity
per
Trip
Trip Start Time
0
10
20
30
40
50
60
70
80
90
100
110
120
14:31
15:00
15:30
15:59
16:29
17:00
17:30
18:13
Pass
enge
r Boa
rding
s/Cap
acity
per
Trip
Trip Start Time
Average Maximum Passenger Load Orange/Red: standing passengers Blue: seated passengers
Average Passenger Boardings
Available Capacity Red: seats plus standing Blue: seats

U
SEATAC
RENTONTUKWILA
KENT
AUBURN
BONNEYLAKE
SUMNER
PUYALLUP
TACOMA
LAKEWOOD
FEDERALWAY
N
Select weekday trips only
540 542541 556
U District
Downtown Seattle594
SODO
Tacoma Dome590 594586 574
Commerce& 10th
Purdy P&R
Kimball Drive P&R
DuPont
UW Link Station
Narrows P&R
Tacoma Comm. College TC
595
595
595
595
594
SR 512 P&R 592 594 580574Lakewood Station592 594 580
592
586
540 542541 556586
590 592 595
594590 595
590 594
0 52.5Miles
10
193 | SOUND TRANSIT 2019 SERVICE IMPLEMENTATION PLAN
DRAFT2015 2016 2017 SPRING 2018
Ride
rshi
pAverage Weekday Boardings 2,870 2,789 2,853 2,845
Average Saturday Boardings N/A N/A N/A N/A
Average Sunday Boardings N/A N/A N/A N/A
Annual Boardings 731,746 711,131 724,644
Route 590 Tacoma – SeattleI-5 SPierce
NORTHBOUND STOPS to SEATTLE
Average WeekdayOns Offs
Commerce St & 10th St 151 0Pacific Ave & 14th St 42 1Pacific Ave & 19th St 52 1Pacific Ave & 24th St 62 1
Tacoma Dome Station 1,281 49SODO Busway & Spokane St 19 66
SODO Busway & Lander St 25 103SODO Busway & Holgate St 7 19
SODO Busway & Royal Brougham Way 5 454th Ave & S Jackson St 135 2254th Ave & Washington St 10 66
4th Ave & Cherry St 11 3694th Ave & Seneca St 10 2824th Ave & Pike St 14 244
Olive Way & 6th Ave 5 151Howell St & 9th Ave 1 82
Howell St & Yale Ave 0 41Eastlake Ave & Stewart St 0 82
Northbound Total 1,827 1,827
SOUTHBOUND STOPSto TACOMA
Average WeekdayOns Offs
Stewart St & Yale Ave 53 1Stewart St & 9th Ave 108 2Stewart St & 7th Ave 106 2Stewart St & 4th Ave 102 102nd Ave & Stewart St 81 132nd Ave & Seneca St 211 112nd Ave & Cherry St 105 7
2nd Ave & Yesler Way 82 14SODO Busway & Royal Brougham Way 50 7
SODO Busway & Holgate St 17 3SODO Busway & Lander St 51 5
SODO Busway & Spokane St 50 6Tacoma Dome Station 38 796
Pacific Ave & 24th St 1 24Pacific Ave & 19th St 1 31Pacific Ave & 14th St 0 24
Commerce St & 10th St 0 99Southbound Total 1,057 1,057
Total 2,884 2,884

194
Route 590 Tacom
a – Seattle
DRAFT I-5 S Pierce
Weekday Southbound Average Trip Ridership & Maximum Passenger Loads
Weekday Northbound Average Trip Ridership & Maximum Passenger Loads
0
10
20
30
40
50
60
70
80
90
100
110
120
5:576:126:276:5714:2614:3614:4614:5615:0615:1615:2615:3315:4115:4815:5616:0216:0816:1416:2016:2616:3216:3916:4516:5116:5717:0317:0917:1517:2117:2717:3417:4217:4917:5718:0918:21
Pass
enge
r Boa
rding
s/Cap
acity
per
Trip
Trip Start Time
0
10
20
30
40
50
60
70
80
90
100
110
120
4:054:254:454:514:495:055:115:095:255:225:385:365:505:555:516:056:106:066:206:256:216:356:436:366:506:556:517:067:037:187:157:307:277:427:397:547:518:078:068:228:218:378:3615:3816:0816:3817:0817:38
Pass
enge
r Boa
rding
s/Cap
acity
per
Trip
Trip Start Time
Average Maximum Passenger Load Orange/Red: standing passengers Blue: seated passengers
Average Passenger Boardings
Available Capacity Red: seats plus standing Blue: seats

U
SEATAC
RENTONTUKWILA
KENT
AUBURN
BONNEYLAKE
SUMNER
PUYALLUP
TACOMA
LAKEWOOD
FEDERALWAY
N
Select weekday trips only
540 542541 556
U District
Downtown Seattle594
SODO
Tacoma Dome590 594586 574
Commerce& 10th
Purdy P&R
DuPont
UW Link Station
Narrows P&R
Tacoma Comm. College TC
595
595
595
594
SR 512 P&R 592 594 580574Lakewood Station592 594 580
592
586
540 542541 556586
590 592 595
594590 595
590 594
0 52.5Miles
10
195 | SOUND TRANSIT 2019 SERVICE IMPLEMENTATION PLAN
DRAFT2015 2016 2017 SPRING 2018
Ride
rshi
pAverage Weekday Boardings 1,021 971 940 843
Average Saturday Boardings N/A N/A N/A N/A
Average Sunday Boardings N/A N/A N/A N/A
Annual Boardings 260,337 247,527 238,773
Route 592 DuPont – Lakewood – SeattleI-5 SPierce
NORTHBOUND STOPS to SEATTLE
Average WeekdayOns Offs
DuPont Station 112 0Lakewood Station 211 10
SR-512 Park & Ride 124 45th Ave & Seneca St 2 205
4th Ave & Pike St 5 108Olive Way & 6th Ave 2 53Howell St & 9th Ave 0 31
Howell St & Minor Ave 0 2Howell St & Yale Ave 0 6
Eastlake Ave & Stewart St 0 39Northbound Total 456 456
SOUTHBOUND STOPS to DUPONT
Average WeekdayOns Offs
Stewart St & Yale Ave 49 0Stewart St & 9th Ave 53 1Stewart St & 7th Ave 53 1Stewart St & 4th Ave 42 42nd Ave & Stewart St 32 52nd Ave & Seneca St 87 42nd Ave & Cherry St 40 2
2nd Ave & Yesler Way 22 5SR-512 Park & Ride 4 133Lakewood Station 9 133
DuPont Station 0 104Southbound Total 392 392
Total 848 848

196
Route 592 D
uPont – Lakew
ood – Seattle
DRAFT I-5 S Pierce
Weekday Southbound Average Trip Ridership & Maximum Passenger Loads
Weekday Northbound Average Trip Ridership & Maximum Passenger Loads
0
10
20
30
40
50
60
70
80
90
100
110
120
14:33
14:48
15:03
15:18
15:33
15:48
16:03
16:18
16:33
16:48
17:03
17:18
17:33
17:48
18:04
18:19Pa
ssen
ger B
oard
ings/C
apac
ity p
er T
rip
Trip Start Time
0
10
20
30
40
50
60
70
80
90
100
110
120
4:05
4:25
4:45
5:05
5:20
5:35
5:50
6:05
6:20
6:35
6:50
7:05
7:20
7:35
7:50Pa
ssen
ger B
oard
ings/C
apac
ity p
er T
rip
Trip Start Time
Average Maximum Passenger Load Orange/Red: standing passengers Blue: seated passengers
Average Passenger Boardings
Available Capacity Red: seats plus standing Blue: seats
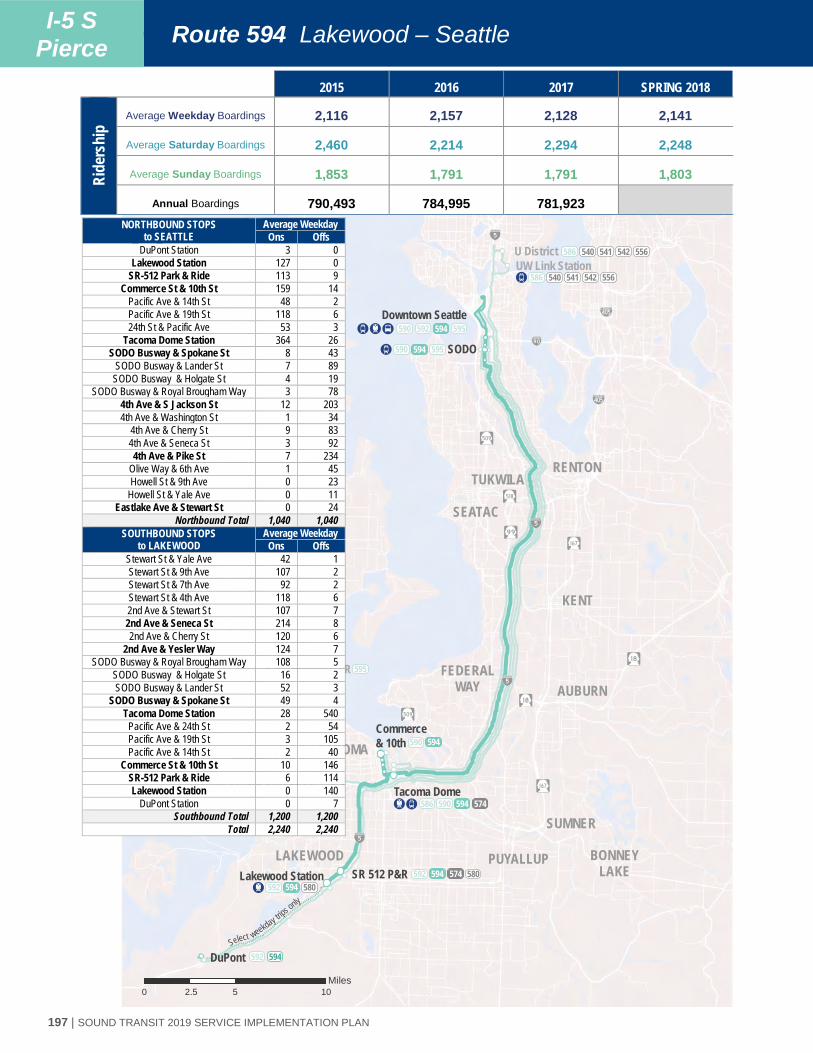
U
SEATAC
RENTONTUKWILA
KENT
AUBURN
BONNEYLAKE
SUMNER
PUYALLUP
TACOMA
LAKEWOOD
FEDERALWAY
N
Select weekday trips only
540 542541 556
U District
Downtown Seattle594
SODO
Tacoma Dome590 594586 574
Commerce& 10th
Purdy P&R
Kimball Drive P&R
DuPont
UW Link Station
Narrows P&R
Tacoma Comm. College TC
595
595
595
595
594
SR 512 P&R 592 594 580574Lakewood Station592 594 580
592
586
540 542541 556586
590 592 595
594590 595
590 594
0 52.5Miles
10
197 | SOUND TRANSIT 2019 SERVICE IMPLEMENTATION PLAN
DRAFT2015 2016 2017 SPRING 2018
Ride
rshi
pAverage Weekday Boardings 2,116 2,157 2,128 2,141
Average Saturday Boardings 2,460 2,214 2,294 2,248
Average Sunday Boardings 1,853 1,791 1,791 1,803
Annual Boardings 790,493 784,995 781,923
Route 594 Lakewood – SeattleI-5 SPierce
NORTHBOUND STOPS to SEATTLE
Average WeekdayOns Offs
DuPont Station 3 0Lakewood Station 127 0
SR-512 Park & Ride 113 9Commerce St & 10th St 159 14
Pacific Ave & 14th St 48 2Pacific Ave & 19th St 118 624th St & Pacific Ave 53 3
Tacoma Dome Station 364 26SODO Busway & Spokane St 8 43
SODO Busway & Lander St 7 89SODO Busway & Holgate St 4 19
SODO Busway & Royal Brougham Way 3 784th Ave & S Jackson St 12 2034th Ave & Washington St 1 34
4th Ave & Cherry St 9 834th Ave & Seneca St 3 924th Ave & Pike St 7 234
Olive Way & 6th Ave 1 45Howell St & 9th Ave 0 23
Howell St & Yale Ave 0 11Eastlake Ave & Stewart St 0 24
Northbound Total 1,040 1,040SOUTHBOUND STOPS
to LAKEWOODAverage Weekday
Ons OffsStewart St & Yale Ave 42 1Stewart St & 9th Ave 107 2Stewart St & 7th Ave 92 2Stewart St & 4th Ave 118 62nd Ave & Stewart St 107 72nd Ave & Seneca St 214 82nd Ave & Cherry St 120 6
2nd Ave & Yesler Way 124 7SODO Busway & Royal Brougham Way 108 5
SODO Busway & Holgate St 16 2SODO Busway & Lander St 52 3
SODO Busway & Spokane St 49 4Tacoma Dome Station 28 540
Pacific Ave & 24th St 2 54Pacific Ave & 19th St 3 105Pacific Ave & 14th St 2 40
Commerce St & 10th St 10 146SR-512 Park & Ride 6 114Lakewood Station 0 140
DuPont Station 0 7Southbound Total 1,200 1,200
Total 2,240 2,240

198
Route 594 Lakew
ood – Seattle
DRAFT I-5 S Pierce
Weekday Southbound Average Trip Ridership & Maximum Passenger Loads
Weekday Northbound Average Trip Ridership & Maximum Passenger Loads
0
10
20
30
40
50
60
70
80
90
100
110
120
8:30
8:50
9:10
9:30
9:50
10:10
10:30
10:50
11:10
11:30
11:50
12:10
12:30
13:00
13:30
14:00
14:30
15:00
15:30
16:00
16:30
16:41
17:30
18:00
18:30
19:00
19:30
20:00
20:30
21:00
21:30
22:00Pa
ssen
ger B
oard
ings/C
apac
ity p
er T
rip
Trip Start Time
0
10
20
30
40
50
60
70
80
90
100
110
120
5:276:427:127:428:128:429:129:4210:1210:4211:1211:4212:1212:4213:0213:2213:4214:0214:1618:3318:4518:5719:1719:3719:5720:1920:4221:1221:4222:1222:4223:1223:42
Pass
enge
r Boa
rding
s/Cap
acity
per
Trip
Trip Start Time
Average Maximum Passenger Load Orange/Red: standing passengers Blue: seated passengers
Average Passenger Boardings
Available Capacity Red: seats plus standing Blue: seats

199 | SOUND TRANSIT 2019 SERVICE IMPLEMENTATION PLAN
DRAFT
Saturday Northbound Average Trip Ridership & Maximum Passenger Loads
Saturday Southbound Average Trip Ridership & Maximum Passenger Loads
0
10
20
30
40
50
60
70
80
90
100
110
120
5:006:006:307:007:308:008:309:009:3010:0010:3011:0011:3012:0012:3013:0013:3014:0014:3015:0015:3016:0016:3017:0017:3018:0018:3019:0019:3020:0020:3021:0021:3022:00
Pass
enge
r Boa
rding
s/Cap
acity
per
Trip
Trip Start Time
0
10
20
30
40
50
60
70
80
90
100
110
120
6:407:408:108:409:109:4010:1010:4011:1011:4012:1012:4013:1013:4014:1014:4015:1015:4016:1016:4017:1017:4018:1018:4019:1019:4020:1020:4021:1021:4022:1022:4023:1023:40
Pass
enge
r Boa
rding
s/Cap
acity
per
Trip
Trip Start Time
Average Maximum Passenger Load Orange/Red: standing passengers Blue: seated passengers
Average Passenger Boardings
Available Capacity Red: seats plus standing Blue: seats

200
Route 594 Lakew
ood – Seattle
DRAFT I-5 S Pierce
Northbound Average Trip Ridership & Maximum Passenger Loads Sunday
Sunday Southbound Average Trip Ridership & Maximum Passenger Loads
0
10
20
30
40
50
60
70
80
90
100
110
120
6:407:408:108:409:109:4010:1010:4011:1011:4012:1012:4013:1013:4014:1014:4015:1015:4016:1016:4017:1017:4018:1018:4019:1019:4020:1020:4021:1021:4022:1022:4023:1023:40
Pass
enge
r Boa
rding
s/Cap
acity
per
Trip
Trip Start Time
0
10
20
30
40
50
60
70
80
90
100
110
120
5:006:006:307:007:308:008:309:009:3010:0010:3011:0011:3012:0012:3013:0013:3014:0014:3015:0015:3016:0016:3017:0017:3018:0018:3019:0019:3020:0020:3021:0021:3022:00
Pass
enge
r Boa
rding
s/Cap
acity
per
Trip
Trip Start Time
Average Maximum Passenger Load Orange/Red: standing passengers Blue: seated passengers
Average Passenger Boardings
Available Capacity Red: seats plus standing Blue: seats

U
SEATAC
RENTONTUKWILA
KENT
AUBURN
TACOMA
FEDERALWAY
N 540 542541 556U District
Downtown Seattle594
SODO
Tacoma Dome590 594586 574
Commerce& 10th
Purdy P&R
Kimball Drive P&R
UW Link Station
Narrows P&R
Tacoma Comm. College TC
595
595
595
595
586540 542541 556586
590 592 595
594590 595
590 594
0 52.5Miles
10
201 | SOUND TRANSIT 2019 SERVICE IMPLEMENTATION PLAN
DRAFT2015 2016 2017 SPRING 2018
Ride
rshi
pAverage Weekday Boardings 371 346 352 335
Average Saturday Boardings N/A N/A N/A N/A
Average Sunday Boardings N/A N/A N/A N/A
Annual Boardings 94,603 88,218 89,496
Route 595 Gig Harbor – SeattleI-5 SPierce
NORTHBOUND STOPS to SEATTLE
Average WeekdayOns Offs
Purdy Park & Ride 38 0Kimball Dr Park & Ride 51 0Narrows Park & Ride 19 0
Tacoma City College Transit Center 41 2SODO Busway & Spokane St 1 5
SODO Busway & Lander St 2 9SODO Busway & Holgate St 1 4
SODO Busway & Royal Brougham Way 0 24th Ave & S Jackson St 12 174th Ave & Washington St 1 3
4th Ave & Cherry St 1 384th Ave & Seneca St 1 314th Ave & Pike St 1 18
Olive Way & 6th Ave 1 20Howell St & 9th Ave 0 8
Howell St & Minor Ave 0 0Howell St & Yale Ave 0 3
Eastlake Ave & Stewart St 0 8Northbound Total 169 169
SOUTHBOUND STOPSto GIG HARBOR
Average WeekdayOns Offs
Stewart St & Yale Ave 11 0Stewart St & 9th Ave 14 0Stewart St & 7th Ave 17 0Stewart St & 4th Ave 12 12nd Ave & Stewart St 8 12nd Ave & Seneca St 37 12nd Ave & Cherry St 21 0
2nd Ave & Yesler Way 11 1SODO Busway & Royal Brougham Way 6 1
SODO Busway & Holgate St 5 0SODO Busway & Lander St 6 1
SODO Busway & Spokane St 5 0Tacoma City College Transit Center 2 44
Narrows Park & Ride 0 17Kimball Dr Park & Ride 1 53
Purdy Park & Ride 0 35Southbound Total 155 155
Total 324 324

202
Route 595 G
ig Harbor – S
eattle DRAFT I-5 S
Pierce
Weekday Southbound Average Trip Ridership & Maximum Passenger Loads
Weekday Northbound Average Trip Ridership & Maximum Passenger Loads
0
10
20
30
40
50
60
70
80
90
100
110
12014:56
15:24
15:54
16:27
16:59
Pass
enge
r Boa
rding
s/Cap
acity
per
Trip
Trip Start Time
0
10
20
30
40
50
60
70
80
90
100
110
120
4:50
5:12
5:34
5:56
6:20
Pass
enge
r Boa
rding
s/Cap
acity
per
Trip
Trip Start Time
Average Maximum Passenger Load Orange/Red: standing passengers Blue: seated passengers
Average Passenger Boardings
Available Capacity Red: seats plus standing Blue: seats

203 | SOUND TRANSIT 2019 SERVICE IMPLEMENTATION PLAN
DRAFTSounder Connector
S
SEATAC
RENTONTUKWILA
KENT
AUBURN
BONNEYLAKE
SUMNER
PUYALLUP
TACOMA
SEATTLE
LAKEWOOD
FEDERALWAY
UNIVERSITYPLACE
5
N
Tukwila Station
Kent Station
Auburn Station
PuyallupStation
Red Lot
South Hill P&RBonney Lake P&R
Sumner StationSouth Tacoma
Lakewood StationSR 512 P&R
Tacoma Dome590 594586574
592 594580
592 594580
580
580596
580 596578 578
578566
566 567
574
0 2.51.25Miles
to King Street Seattle

Corridor Sounder ConnectorsDay Type Direction 2 3 4 5 6 7 8 9 10 11 12 13 14 15 16 17 18 19 20 21 22 23 24 25Weekday Eastbound
Weekday Westbound
Saturday Eastbound
Saturday Westbound
Sunday Eastbound
Sunday Westbound
Hour
Service Frequency Legend Very Frequent (<10 min) Frequent (10-20 min) Moderate (20-30 min) Minimum (30-60 min)
204
Routes
580 596DRAFT
Sounder C
onnector
760
595
0 200 400 600 800 1,000
580
596
No Saturday Service No Sunday Service
80%
84%
0% 50% 100%
580
596
28
30
0 10 20 30
580
596
Passengers per TripOTP
Weekday Ridership Saturday Ridership Sunday Ridership
OTP Standard

K
TACOMA
N
PUYALLUP
LAKEWOOD
PuyallupStation
Red Lot
South Hill P&R
South Tacoma
LakewoodStation
SR 512 P&R
Tacoma Dome590 594586574
592 594580
592 594580
580
580
580 578
574
12
205 | SOUND TRANSIT 2019 SERVICE IMPLEMENTATION PLAN
DRAFT2015 2016 2017 SPRING 2018
Ride
rshi
pAverage Weekday Boardings 117 489 621 760
Average Saturday Boardings N/A N/A N/A N/A
Average Sunday Boardings N/A N/A N/A N/A
Annual Boardings 29,885 124,657 157,820
Route 580 Lakewood – PuyallupSounder Connector
EASTBOUND STOPSto PUYALLUP
Average WeekdayOns Offs
Lakewood Station 12 0SR-512 Park & Ride 6 1
South Hill Park & Ride 148 3Fairground Red Lot 174 2
Puyallup Station 0 333Eastbound Total 339 339
WESTBOUND STOPSto LAKEWOOD
Average WeekdayOns Offs
Puyallup Station 406 0Fairground Red Lot 3 201
South Hill Park & Ride 3 178SR-512 Park & Ride 1 6Lakewood Station 0 27
Westbound Total 412 412Total 751 751

206
Route 580 Lakew
ood – Puyallup
DRAFT Sounder
Connector
Weekday Westbound Average Trip Ridership & Maximum Passenger Loads
Weekday Eastbound Average Trip Ridership & Maximum Passenger Loads
0
10
20
30
40
50
60
70
80
90
100
110
120
6:50
7:20
8:40
15:20
16:00
16:20
16:40
17:00
17:20
17:40
18:05
18:30
19:15
Pass
enge
r Boa
rding
s/Cap
acity
per
Trip
Trip Start Time
0
10
20
30
40
50
60
70
80
90
100
110
120
4:27
4:52
5:16
5:36
5:55
6:13
6:33
6:53
7:23
10:03
15:36
15:55
16:40
Pass
enge
r Boa
rding
s/Cap
acity
per
Trip
Trip Start Time
Average Maximum Passenger Load Orange/Red: standing passengers Blue: seated passengers
Average Passenger Boardings
Available Capacity Red: seats plus standing Blue: seats

BONNEYLAKE
SUMNER
PUYALLUP
N
Bonney Lake P&R
Sumner Station
596
596 578
410
207 | SOUND TRANSIT 2019 SERVICE IMPLEMENTATION PLAN
DRAFT2015 2016 2017 SPRING 2018
Ride
rshi
pAverage Weekday Boardings 460 478 493 595
Average Saturday Boardings N/A N/A N/A N/A
Average Sunday Boardings N/A N/A N/A N/A
Annual Boardings 117,291 121,821 125,247
Route 596 Bonney Lake – SumnerSounder Connector
EASTBOUND STOPS Average WeekdayOns Offs
Sumner Station 312 0Bonney Lake Park & Ride 0 312
Eastbound Total 312 312
WESTBOUND STOPS Average WeekdayOns Offs
Bonney Lake Park & Ride 293 0Sumner Station 0 293
Eastbound Total 293 293Total 605 605

208
Route 596 B
onney Lake – Sum
ner DRAFT
Sounder C
onnector
Weekday Eastbound Average Trip Ridership & Maximum Passenger Loads
Weekday Westbound Average Trip Ridership & Maximum Passenger Loads
0
10
20
30
40
50
60
70
80
90
100
110
120
4:50
5:15
5:40
6:00
6:20
6:40
7:00
7:20
7:50
10:30
Pass
enge
r Boa
rding
s/Cap
acity
per
Trip
Trip Start Time
0
10
20
30
40
50
60
70
80
90
100
110
120
15:16
15:56
16:16
16:36
16:56
17:16
17:36
18:01
18:26
19:11
Pass
enge
r Boa
rding
s/Cap
acity
per
Trip
Trip Start Time
Average Maximum Passenger Load Orange/Red: standing passengers Blue: seated passengers
Average Passenger Boardings
Available Capacity Red: seats plus standing Blue: seats