2020-10-28 3q20 earnings release - final
TRANSCRIPT

NEWS RELEASE Coeur Reports Third Quarter 2020 Results
Multi-Year High Financial Results Driven by Increased Production and Higher Prices; Provides Updated Full-Year 2020 Guidance
Chicago, Illinois - October 28, 2020 - Coeur Mining, Inc. (“Coeur” or the “Company”) (NYSE: CDE) today reported third quarter 2020 financial results, including revenue of $229.7 million, cash flow from operating activities of $79.5 million and GAAP net income from continuing operations of $26.9 million, or $0.11 per share. On an adjusted basis1, the Company reported EBITDA of $90.8 million, cash flow from operating activities prior to changes in working capital of $57.4 million and net income from continuing operations of $38.2 million, or $0.16 per share.
Key Highlights
• Highest quarterly financial results in nearly a decade - Revenue increased 49% and adjusted EBITDA1 more than doubled quarter-over-quarter. Operating cash flow was eight-times higher and now totals $81.4 million through the first nine months of the year. Free cash flow1 increased significantly to $56.5 million, leading to year-to-date positive free cash flow1 of $19.5 million
• Strong quarter-over-quarter production growth - Gold production increased 23% to 95,995 ounces driven by improved operational performance at Palmarejo, Rochester and Wharf, while silver production of 2.6 million ounces was 58% higher largely due to positive results at Palmarejo
• Well-executed restart at Palmarejo following temporary suspension - Palmarejo generated strong operational and financial results after being temporarily suspended for approximately 45 days in the prior period due to a COVID-19-related government decree. Gold production nearly doubled while silver production was more than two-times higher quarter-over-quarter, helping to generate $49.7 million and $44.7 million in operating and free cash flow1, respectively
• Successfully commenced construction on schedule for Rochester expansion - The Company broke ground in early August on the Plan of Operations Amendment 11 (“POA 11”) expansion project at its Rochester mine. Coeur plans to file an updated technical report in December, which will provide a detailed economic and technical overview of the expansion project
• Record quarterly results at Wharf - Wharf produced 33,440 ounces of gold, which generated $39.1 million in operating cash flow and $38.6 million free cash flow1 during the third quarter - all new quarterly records since Coeur’s acquisition of Wharf in early 2015 for approximately $99.5 million. Cumulative operating and free cash flow1 since acquisition now totals $256.0 million and $232.4 million, respectively
• Continued execution of the Company’s largest exploration program in its history2 - Building on the success from the first half of the year, approximately 20 drill rigs continue to operate across the Company, including at the new C-Horst discovery located in the northernmost portion of the Crown Block in southern Nevada. Results indicate potential for strong resource growth at Palmarejo, Rochester, Kensington, Silvertip and C-Horst, while infill drilling has demonstrated near-term upside potential for reserve growth at Palmarejo and Rochester
1

• Bolstered balance sheet and financial flexibility - The Company reduced total debt3 by $47.5 million, or 14%, quarter-over-quarter while cash and cash equivalents increased 9% to $77.1 million as of September 30, 2020
“Strong production growth and higher gold and silver prices combined to generate multi-year high financial results during the third quarter,” said Mitchell J. Krebs, President and Chief Executive Officer. “A strong rebound from Palmarejo and a record-breaking quarter at Wharf helped showcase the benefit of our balanced portfolio of North American-based precious metals assets. Quarterly revenue was the highest in nearly a decade, adjusted EBITDA1 more than doubled and free cash flow1 now totals $19.5 million through the first nine months of the year after jumping to $56.5 million in the third quarter.”
Mr. Krebs continued, “We achieved a major milestone by commencing construction on schedule on the POA 11 expansion project at Rochester and look forward to sharing the results of the updated technical report in December. In addition to strong operational execution at several sites, we significantly reduced debt while increasing cash, leaving us well-positioned as we head into major construction activities at Rochester next year. With strengthening operational performance, successful execution of our near-term organic growth opportunities and a sustained commitment to our exploration investments, we remain on-track to fundamentally reposition the Company and unlock meaningful long-term value for our stockholders.”
2
Financial and Operating Highlights (Unaudited)
(Amounts in millions, except per share amounts, gold ounces produced & sold, and per-ounce/pound metrics) 3Q 2020 2Q 2020 1Q 2020 4Q 2019 3Q 2019
Gold Sales $ 167.1 $ 127.9 $ 127.6 $ 134.3 $ 141.9
Silver Sales $ 62.6 $ 26.3 $ 44.9 $ 54.8 $ 51.6
Consolidated Revenue $ 229.7 $ 154.2 $ 173.2 $ 195.0 $ 199.5
Costs Applicable to Sales4 $ 112.8 $ 90.0 $ 118.9 $ 146.6 $ 141.0
General and Administrative Expenses $ 7.8 $ 8.6 $ 8.9 $ 7.6 $ 9.6
Net Income (Loss) $ 26.9 $ (1.2) $ (11.9) $ (270.9) $ (14.3)
Net Income (Loss) Per Share $ 0.11 $ (0.01) $ (0.05) $ (1.13) $ (0.06)
Adjusted Net Income (Loss)1 $ 38.2 $ 2.6 $ (0.9) $ (3.3) $ (5.3)
Adjusted Net Income (Loss)1 Per Share $ 0.16 $ 0.01 $ — $ (0.01) $ (0.02)
Weighted Average Shares Outstanding 243.8 240.9 240.3 238.7 225.9
EBITDA1 $ 77.3 $ 35.3 $ 25.5 $ (214.5) $ 37.6
Adjusted EBITDA1 $ 90.8 $ 42.2 $ 46.5 $ 59.8 $ 61.0
Cash Flow from Operating Activities $ 79.5 $ 9.9 $ (8.0) $ 39.3 $ 42.0
Capital Expenditures $ 23.0 $ 16.7 $ 22.2 $ 21.0 $ 30.7
Free Cash Flow1 $ 56.5 $ (6.7) $ (30.2) $ 18.4 $ 11.3
Cash, Equivalents & Short-Term Investments $ 77.1 $ 70.9 $ 52.9 $ 55.6 $ 65.3
Total Debt3 $ 301.1 $ 348.6 $ 343.1 $ 295.5 $ 298.7
Average Realized Price Per Ounce – Gold $ 1,754 $ 1,641 $ 1,490 $ 1,407 $ 1,413
Average Realized Price Per Ounce – Silver $ 24.15 $ 16.25 $ 16.63 $ 16.99 $ 17.17
Gold Ounces Produced 95,995 78,229 85,077 94,716 99,782
Silver Ounces Produced 2.6 1.6 2.7 3.1 3.0
Gold Ounces Sold 95,283 77,933 85,635 95,532 100,407
Silver Ounces Sold 2.6 1.6 2.7 3.3 3.0
Financial Results
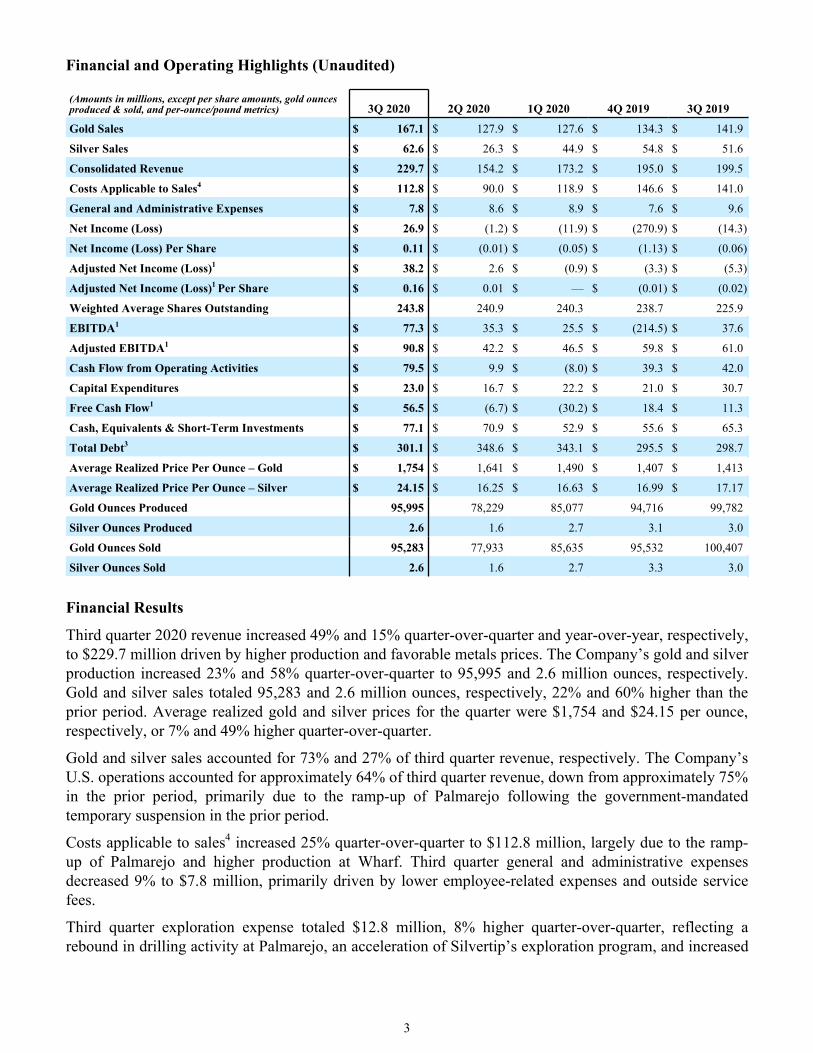
Third quarter 2020 revenue increased 49% and 15% quarter-over-quarter and year-over-year, respectively, to $229.7 million driven by higher production and favorable metals prices. The Company’s gold and silver production increased 23% and 58% quarter-over-quarter to 95,995 and 2.6 million ounces, respectively. Gold and silver sales totaled 95,283 and 2.6 million ounces, respectively, 22% and 60% higher than the prior period. Average realized gold and silver prices for the quarter were $1,754 and $24.15 per ounce, respectively, or 7% and 49% higher quarter-over-quarter.
Gold and silver sales accounted for 73% and 27% of third quarter revenue, respectively. The Company’s U.S. operations accounted for approximately 64% of third quarter revenue, down from approximately 75% in the prior period, primarily due to the ramp-up of Palmarejo following the government-mandated temporary suspension in the prior period.
Costs applicable to sales4 increased 25% quarter-over-quarter to $112.8 million, largely due to the ramp-up of Palmarejo and higher production at Wharf. Third quarter general and administrative expenses decreased 9% to $7.8 million, primarily driven by lower employee-related expenses and outside service fees.
Third quarter exploration expense totaled $12.8 million, 8% higher quarter-over-quarter, reflecting a rebound in drilling activity at Palmarejo, an acceleration of Silvertip’s exploration program, and increased
3

drilling expense at Kensington and Wharf. See the “Operations” and “Exploration” sections for additional detail on the Company’s exploration activities.
Operating costs related to COVID-19 mitigation and response efforts totaled $4.0 million during the third quarter, compared to $6.1 million in the prior period. These additional costs are primarily driven by employee-related expenses at Palmarejo and Kensington, and are included in “Pre-development, reclamation, and other expenses” on the Company’s income statement.
Coeur recorded an income tax expense of $13.1 million during the third quarter, primarily related to strong financial performance at Palmarejo. Cash income and mining taxes paid during the quarter totaled approximately $3.3 million, bringing the full-year figure to $20.1 million. The Company expects to pay approximately $30.0 to $35.0 million of cash income and mining taxes in 2020.
Quarterly operating cash flow improved to $79.5 million compared to $9.9 million in the prior period, reflecting strong revenue growth and margin expansion quarter-over-quarter. Changes in working capital during the quarter totaled $22.1 million, compared to $(6.5) million in the second quarter of 2020, largely driven by the timing of tax payments in Mexico, payables related to the ramp-up of Palmarejo and interest payments. Third quarter operating cash flow includes a cash outflow of $5.1 million associated with the Company’s prepayment agreement at Kensington. Coeur expects the remaining $9.9 million cash outflow under the arrangement to occur in the fourth quarter.
Third quarter capital expenditures were $23.0 million compared to $16.7 million in the prior period, reflecting higher investment across the Company’s operations as well as increased spending on POA 11. Sustaining and development capital expenditures accounted for approximately 51% and 49%, respectively, of the Company’s capital expenditures during the quarter.
Liquidity Update
Coeur continued to prudently manage its balance sheet during the third quarter of 2020 by repaying $47.5 million of total debt3, including $40.0 million of outstanding indebtedness under its senior secured revolving credit facility (“RCF”). The Company intends to repay the remaining $20.0 million RCF balance by year end from internally generated cash flow. At September 30, 2020, cash and cash equivalents totaled $77.1 million (9% higher quarter-over-quarter), while total debt3 outstanding was $301.1 million (14% lower quarter-over-quarter).
Hedging Update
The Company did not execute any additional zero-cost collar (“ZCC”) hedges during the third quarter. Coeur’s hedging strategy remains focused on supporting cash flow generation during the POA 11 expansion at Rochester, which the Company expects to fund with a combination of cash on hand, internally generated cash flow and existing debt capacity.
Coeur completed its gold hedging program for 2021 earlier this year and will proactively monitor market conditions to potentially layer in additional ZCC hedges on up to 50% of expected gold production in 2022. The Company’s silver price exposure remains unhedged. An overview of the hedges currently implemented is outlined below:
4

4Q 2020 2021 2022
Gold Ounces Hedged 55,500 158,700 126,000
Avg. Ceiling ($/oz) $1,823 $1,875 $2,030
Avg. Floor ($/oz) $1,471 $1,600 $1,626
Rochester Expansion
Coeur commenced construction on the POA 11 expansion project on schedule in early August 2020, advancing early-stage earthworks and establishing infrastructure at site to support construction activities. The expansion project includes the construction of a new leach pad, a crushing facility equipped with two high-pressure grinding roll (“HPGR”) units, a Merrill-Crowe process plant, and related infrastructure to support the extension of Rochester’s mine life.
Together with SNC-Lavalin, Coeur’s engineering, procurement and project management contractor, the Company has completed over 75% of detailed design for the expansion project. Major construction is expected to begin in 2021 and be largely completed by late 2022. The project remains on schedule with no changes to key elements of the timeline (highlighted below).
Expected Start Date Target Completion Date
Leach Pad (Incl. Ancillary Facilities) 2H 2020 P Mid-2022
Merrill-Crowe Process Plant 1H 2021 YE 2022
Crushing Circuit 1H 2021 YE 2022
Supporting Infrastructure 2H 2020 Mid-2022
The Company expects to publish an updated technical report for Rochester in December further outlining details of the expansion, including estimated capital expenditures, an updated mine plan, and detailed operational and financial information regarding the expected impacts of HPGR technology.
5
Operations
Third quarter 2020 highlights for each of the Company’s operations are provided below.
Palmarejo, Mexico
(Dollars in millions, except per ounce amounts) 3Q 2020 2Q 2020 1Q 2020 4Q 2019 3Q 2019
Tons milled 492,474 269,641 479,562 486,779 442,464
Average gold grade (oz/t) 0.07 0.07 0.07 0.07 0.09
Average silver grade (oz/t) 4.37 4.46 4.69 5.11 4.88
Average recovery rate – Au 91.3% 86.0% 91.6% 84.9% 81.7%
Average recovery rate – Ag 82.8% 72.2% 81.5% 81.7% 79.6%
Gold ounces produced 29,296 15,223 31,578 28,702 31,779
Silver ounces produced (000’s) 1,784 867 1,835 2,029 1,720
Gold ounces sold 27,252 16,924 31,287 27,952 32,731
Silver ounces sold (000’s) 1,765 875 1,895 1,980 1,747
Average realized price per gold ounce $1,446 $1,399 $1,331 $1,238 $1,269
Average realized price per silver ounce $23.98 $16.35 $17.25 $17.28 $17.05
Metal sales $81.8 $38.0 $74.3 $68.9 $71.3
Costs applicable to sales4 $34.3 $18.8 $36.0 $34.8 $37.4
Adjusted CAS per AuOz1 $602 $686 $645 $622 $660
Adjusted CAS per AgOz1 $10.06 $8.13 $8.37 $8.79 $8.95Exploration expense $2.0 $0.9 $1.5 $2.0 $1.6Cash flow from operating activities $49.7 $(3.5) $28.9 $41.4 $36.3Sustaining capital expenditures (excludes capital lease payments) $4.9 $4.5 $7.1 $6.2 $4.7
Development capital expenditures $0.1 $— $— $2.4 $3.1
Total capital expenditures $5.0 $4.5 $7.1 $8.6 $7.8
Free cash flow1 $44.7 $(8.0) $21.8 $32.8 $28.5
Operational
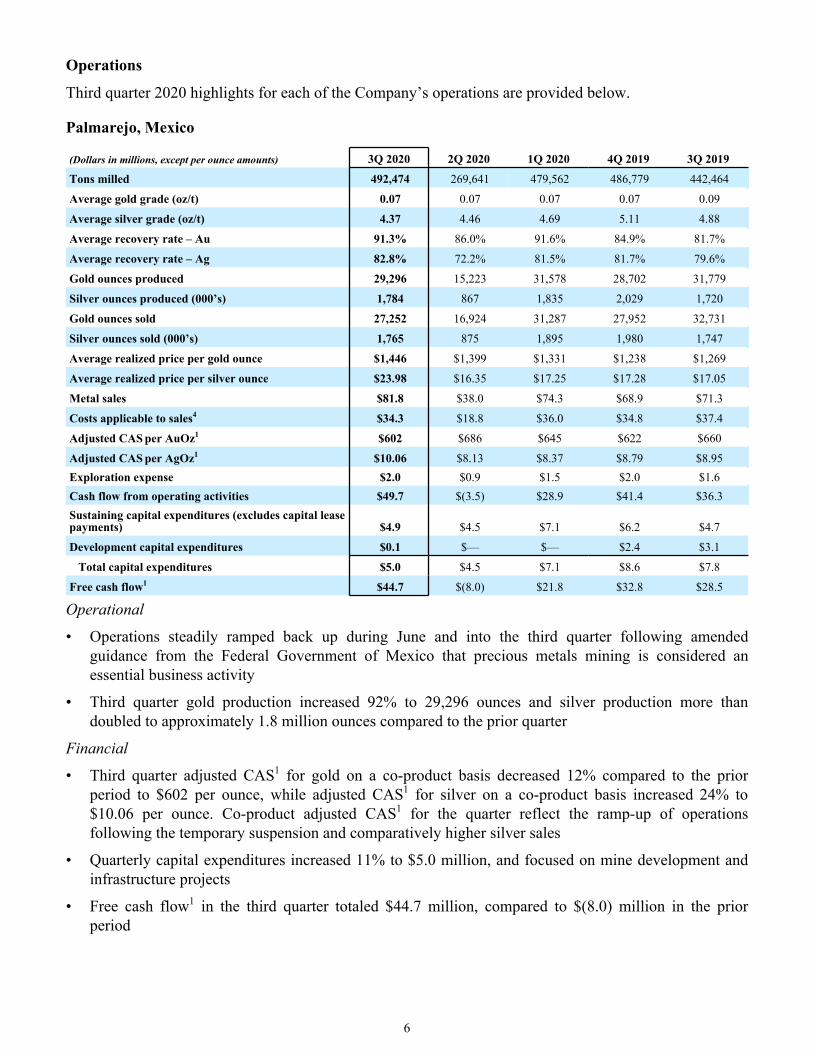
• Operations steadily ramped back up during June and into the third quarter following amended guidance from the Federal Government of Mexico that precious metals mining is considered an essential business activity
• Third quarter gold production increased 92% to 29,296 ounces and silver production more than doubled to approximately 1.8 million ounces compared to the prior quarter
Financial
• Third quarter adjusted CAS1 for gold on a co-product basis decreased 12% compared to the prior period to $602 per ounce, while adjusted CAS1 for silver on a co-product basis increased 24% to $10.06 per ounce. Co-product adjusted CAS1 for the quarter reflect the ramp-up of operations following the temporary suspension and comparatively higher silver sales
• Quarterly capital expenditures increased 11% to $5.0 million, and focused on mine development and infrastructure projects
• Free cash flow1 in the third quarter totaled $44.7 million, compared to $(8.0) million in the prior period
6

Exploration
• Exploration investment during the third quarter totaled approximately $3.2 million ($2.0 million expensed and $1.2 million capitalized), compared to approximately $1.5 million ($0.9 million expensed and $0.6 million capitalized) in the prior quarter
• Coeur began the third quarter with four active rigs and ramped up to seven surface and underground core rigs during the period. A total of 18 expansion and 30 infill holes were drilled during the quarter for a total of 68,554 feet (20,895 meters)
• Exploration activity focused on infill drilling within the two mine complexes, Independencia and Guadalupe, and on resource expansion north, southwest and southeast of both mine complexes. New resource expansion holes were also drilled east, northwest and north of Independencia
• Resource expansion results continue to be encouraging, cutting multiple mineralized zones that extend south, northwest and north of Independencia. Similarly, infill drilling has been successful south and southwest of Guadalupe
• Coeur expects to continue with seven active rigs during the fourth quarter, primarily focusing on resource expansion drilling as well as infill drilling on select targets. Three expansion rigs have recently been mobilized to focus on growing mineralized material between Independencia and the mill
Other
• Workforce staffing levels gradually increased to near full capacity during September, up from approximately 85% earlier in the quarter due to government-imposed restrictions related to COVID-19. The Company is maintaining its rigorous health and safety protocols at Palmarejo aimed at limiting the exposure and transmission of COVID-19
• Approximately 38% of Palmarejo’s gold sales in the third quarter, or 10,348 ounces, were sold under its gold stream agreement at a price of $800 per ounce
Guidance
• Full-year 2020 gold production is expected to be slightly higher at 100,000 - 110,000 ounces (previously 95,000 - 105,000 ounces), while silver production is expected to be 6.0 - 7.0 million ounces (no change)
• With higher expected gold production and solid cost controls, CAS1 for gold are expected to be $650 - $750 per ounce (previously $785 - $885 per ounce), while CAS1 for silver are anticipated to be $9.50 - $10.50 per ounce (no change)
• Capital expenditures are expected to be modestly lower at approximately $27 - $30 million (previously $32 - $36 million)
7
Rochester, Nevada
(Dollars in millions, except per ounce amounts) 3Q 2020 2Q 2020 1Q 2020 4Q 2019 3Q 2019Ore tons placed 4,523,767 3,743,331 3,428,578 2,612,319 2,516,353Average silver grade (oz/t) 0.49 0.51 0.57 0.47 0.43Average gold grade (oz/t) 0.002 0.002 0.002 0.003 0.004Silver ounces produced (000’s) 740 728 687 848 982Gold ounces produced 6,462 5,159 5,936 10,634 7,901Silver ounces sold (000’s) 786 724 632 932 951Gold ounces sold 6,834 5,278 5,473 11,248 7,651Average realized price per silver ounce $24.49 $16.11 $16.99 $17.22 $17.02Average realized price per gold ounce $1,882 $1,702 $1,583 $1,484 $1,476Metal sales $32.1 $20.6 $19.4 $32.6 $27.5Costs applicable to sales4 $19.1 $18.3 $17.0 $25.3 $27.7Adjusted CAS per AgOz1 $14.98 $13.75 $14.38 $13.25 $14.24Adjusted CAS per AuOz1 $1,148 $1,481 $1,359 $1,142 $1,230Exploration expense $0.5 $1.8 $0.2 $0.4 $0.1Cash flow from operating activities $2.1 $(5.6) $(9.3) $6.9 $8.3Sustaining capital expenditures (excludes capital lease payments) $2.5 $1.5 $0.1 $0.9 $(1.0)Development capital expenditures $7.3 $4.3 $5.0 $4.1 $11.2
Total capital expenditures $9.8 $5.8 $5.1 $5.0 $10.2Free cash flow1 $(7.7) $(11.4) $(14.4) $1.9 $(1.9)
Operational
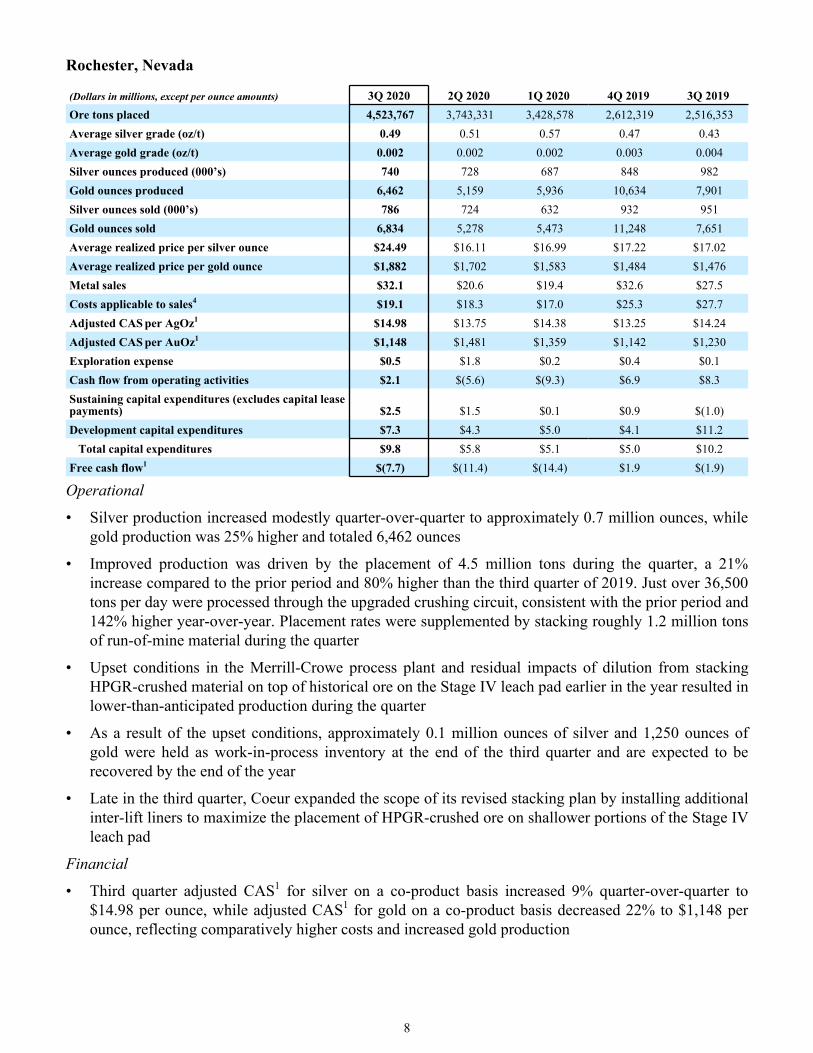
• Silver production increased modestly quarter-over-quarter to approximately 0.7 million ounces, while gold production was 25% higher and totaled 6,462 ounces
• Improved production was driven by the placement of 4.5 million tons during the quarter, a 21% increase compared to the prior period and 80% higher than the third quarter of 2019. Just over 36,500 tons per day were processed through the upgraded crushing circuit, consistent with the prior period and 142% higher year-over-year. Placement rates were supplemented by stacking roughly 1.2 million tons of run-of-mine material during the quarter
• Upset conditions in the Merrill-Crowe process plant and residual impacts of dilution from stacking HPGR-crushed material on top of historical ore on the Stage IV leach pad earlier in the year resulted in lower-than-anticipated production during the quarter
• As a result of the upset conditions, approximately 0.1 million ounces of silver and 1,250 ounces of gold were held as work-in-process inventory at the end of the third quarter and are expected to be recovered by the end of the year
• Late in the third quarter, Coeur expanded the scope of its revised stacking plan by installing additional inter-lift liners to maximize the placement of HPGR-crushed ore on shallower portions of the Stage IV leach pad
Financial
• Third quarter adjusted CAS1 for silver on a co-product basis increased 9% quarter-over-quarter to $14.98 per ounce, while adjusted CAS1 for gold on a co-product basis decreased 22% to $1,148 per ounce, reflecting comparatively higher costs and increased gold production
8

• Third quarter capital expenditures totaled $9.8 million compared to $5.8 million in the prior period, largely due to increased investment in POA 11
• Free cash flow1 totaled $(7.7) million in the third quarter, compared to $(11.4) million in the second
quarter, primarily driven by improved operating cash flow and partially offset by higher capital expenditures
Exploration
• Exploration investment for the third quarter totaled approximately $1.3 million ($0.5 million expensed and $0.9 million capitalized), compared to approximately $2.2 million ($1.8 million expensed and $0.4 million capitalized) in the prior period
• Following the success of prior drill programs, two core rigs continued directional drilling at East Rochester to test areas of potential mineralization under the Stage I and Stage II leach pads. A total of four new expansion core holes were drilled during the quarter (12 through the first nine months of 2020). The core rigs were then moved to complete geotechnical holes in the existing open pit
• One reverse circulation rig continued infill drilling within the existing open pit. A total of 15 infill holes and five expansion holes were drilled during the quarter
• Based on the results received to date, significant potential exists for additional reserve and resource growth in the existing open pit and at East Rochester. Additionally, target generation in the district highlighted priorities for future drilling north of East Rochester and East Packard as well as around the Lincoln Hill, Gold Ridge and Independence Hill zones located immediately west of Rochester
• Based on the drilling success at East Rochester, Coeur has extended the expansion program through the winter with one reverse circulation rig focused on testing the extension of the zone northwards towards the Stage IV leach pad
Other
• Mining remains an essential business in Nevada. The Company continues to maintain rigorous health and safety protocols aimed at limiting the exposure and transmission of COVID-19 at Rochester and in the surrounding communities
Guidance
• Full-year 2020 silver production is anticipated to be modestly lower at 3.1 - 3.7 million ounces (previously 3.5 - 4.5 million ounces) given greater-than-expected impacts from dilution, while gold production guidance remains consistent at 27,000 - 33,000 ounces (no change)
• Given lower expected silver production, CAS1 for silver in 2020 are expected to be $13.50 - $14.75 per ounce (previously $12.75 - $14.00 per ounce). Comparatively higher gold production is expected to drive CAS1 to $1,150 - $1,300 per ounce of gold (previously $1,250 - $1,400 per ounce)
• Capital expenditures are expected to remain relatively unchanged at approximately $38 - $42 million (previously $38 - $43 million)
9

Kensington, Alaska
(Dollars in millions, except per ounce amounts) 3Q 2020 2Q 2020 1Q 2020 4Q 2019 3Q 2019
Tons milled 163,276 170,478 162,341 167,061 166,475
Average gold grade (oz/t) 0.18 0.21 0.21 0.20 0.22
Average recovery rate 93.7% 92.0% 93.5% 87.2% 93.2%
Gold ounces produced 26,797 33,058 32,022 29,736 34,156
Gold ounces sold 27,815 32,367 32,781 29,293 35,452
Average realized price per gold ounce, gross $1,917 $1,762 $1,603 $1,493 $1,505
Treatment and refining charges per gold ounce $35 $57 $27 $24 $20
Average realized price per gold ounce, net $1,882 $1,705 $1,576 $1,469 $1,485
Metal sales $52.4 $55.2 $51.7 $43.0 $52.6
Costs applicable to sales4 $31.5 $30.4 $30.5 $28.8 $29.5
Adjusted CAS per AuOz1 $1,128 $934 $928 $976 $822
Prepayment, working capital cash flow $(5.1) $7.0 $(7.0) $4.7 $(14.7)
Exploration expense $3.4 $2.6 $1.8 $1.6 $1.5
Cash flow from operating activities $9.1 $27.8 $11.9 $19.9 $4.5Sustaining capital expenditures (excludes capital lease payments) $5.3 $3.9 $4.8 $4.3 $4.9
Development capital expenditures $— $— $— $— $—
Total capital expenditures $5.3 $3.9 $4.8 $4.3 $4.9
Free cash flow1 $3.8 $23.9 $7.1 $15.6 $(0.4)
Operational
• Gold production in the third quarter totaled 26,797 ounces compared to 33,058 ounces in the prior period, reflecting the impact of several positive COVID-19 cases isolated to the underground mining workforce. The Company conducted comprehensive testing, contact tracing and sanitization efforts, helping to mitigate the threat of further transmission across the operation
• Average gold grade decreased approximately 14% to 0.18 ounces per ton, largely due to the processing of additional development ore and surface stockpile material as a result of mine sequencing and COVID-19 contact tracing, respectively
• Jualin accounted for approximately 18% of Kensington’s third quarter production, increasing from approximately 16% in the prior quarter. For the full year, Jualin is expected to account for approximately 15-20% of Kensington’s total production
Financial
• Adjusted CAS1 totaled $1,128 per ounce compared to $934 per ounce in the prior period, reflecting
modestly higher costs and lower production
• Capital expenditures increased 36% quarter-over-quarter to $5.3 million, largely due to the completion of certain capital projects prior to the winter months
• Free cash flow1 totaled $3.8 million during the third quarter, including cash outflow of approximately
$5.1 million associated with Coeur’s prepayment agreement at Kensington. Excluding the effect of the prepayment, free cash flow1
totaled approximately $8.9 million in the third quarter
Exploration
• Exploration investment increased 30% compared to the prior quarter to approximately $3.5 million (substantially all expensed)
10

• Three core rigs, two surface and one underground, were active during the quarter and focused on resource expansion drilling. A total of 52 resource expansion holes were drilled during the quarter for a total of 45,138 feet (13,758 meters)
• The surface program accelerated to two helicopter-supported rigs drilling on the upper Raven, Big Lake and upper Johnson veins, while the underground program targeted the lower and mid levels of the Elmira vein
• Significant intervals of mineralized core were observed from the surface program at the upper Raven vein as well as at the recently discovered Jennifer vein located near the Raven vein. Drilling from the uppermost 2050 drift has also generated positive visual mineralized core, specifically at the Kensington, Eureka, upper Kensington Zone 30 and Northern Belle veins
• With surface drilling now complete, the three core rigs were moved underground and are anticipated to maintain a similar pace during the fourth quarter. Exploration activities are expected to continue focusing on resource expansion drilling at the Eureka, upper Kensington Zone 30 and Johnson veins, as well as infill drilling at the Elmira vein
Other
• Mining continues to be considered an essential business in Alaska. Rotational schedules remain extended from 14 days to 28 days in response to concerns related to COVID-19. All employees are required to quarantine for 7 days and undergo viral COVID-19 testing prior to starting their 28-day rotation
Guidance
• Production in 2020 is expected to be slightly lower at 122,500 - 130,000 ounces of gold (previously 125,000 - 135,000 ounces)
• CAS1 in 2020 are expected to remain consistent at $900 - $1,000 per ounce (no change)
• Given investments made through the first three quarters of 2020, full-year capital expenditures are anticipated to be modestly lower at $22 - $27 million ($28 - $33 million)
11

Wharf, South Dakota
(Dollars in millions, except per ounce amounts) 3Q 2020 2Q 2020 1Q 2020 4Q 2019 3Q 2019
Ore tons placed 1,315,542 1,401,237 946,449 1,100,393 1,503,021
Average gold grade (oz/t) 0.025 0.032 0.025 0.023 0.027
Gold ounces produced 33,440 24,789 15,541 25,644 25,946
Silver ounces produced (000’s) 42 25 15 20 18
Gold ounces sold 33,382 23,364 16,094 27,039 24,573
Silver ounces sold (000’s) 41 23 15 21 17
Average realized price per gold ounce $1,872 $1,715 $1,592 $1,482 $1,481
Metal sales $63.5 $40.5 $25.9 $40.5 $36.7
Costs applicable to sales4 $27.9 $22.5 $17.8 $25.7 $22.1Adjusted CAS per AuOz1 $804 $804 $1,090 $802 $887
Exploration expense $0.5 $0.1 $— $0.2 $0.1
Cash flow from operating activities $39.1 $19.1 $2.6 $17.0 $17.6Sustaining capital expenditures (excludes capital lease payments) $0.5 $0.3 $0.4 $0.8 $0.8
Development capital expenditures $— $— $— $— $—
Total capital expenditures $0.5 $0.3 $0.4 $0.8 $0.8
Free cash flow1 $38.6 $18.8 $2.2 $16.2 $16.8
Operational
• Gold production increased 35% quarter-over-quarter driven by higher placement rates and improved grades over the past two quarters
Financial
• Adjusted CAS1 on a by-product basis remained consistent quarter-over-quarter at $804 per ounce
• Third quarter capital expenditures totaled $0.5 million, modestly higher than the prior period
• Free cash flow1 of $38.6 million was more than two-times higher quarter-over-quarter. Coeur has now generated cumulative free cash flow of more than double its original investment of approximately $99.5 million in February 2015
Exploration
• Exploration investment in the third quarter totaled approximately $0.5 million (substantially all expensed), compared to approximately $0.1 million (substantially all expensed) in the prior period. The exploration program is currently using one reverse circulation rig and has completed approximately 20,880 feet (6,364 meters) during the quarter
• Exploration activity focused on resource expansion drilling at Richmond Hill, which is located approximately four miles north-northeast of Wharf. Coeur has an exclusive option agreement with two subsidiaries of Barrick Gold Corporation to acquire the project that expires in September 2021
• Additionally, geologic mapping and geochemical sampling were successfully completed over the claims contained within Richmond Hill as well as outer zones that may be of interest to Coeur, with most assays pending
12

Other
• South Dakota’s public order mandating the closure of all public-facing businesses does not include Wharf. Coeur continues to follow rigorous health and safety protocols aimed at limiting the exposure and transmission of COVID-19 at Wharf and in the surrounding communities
Guidance
• Given strong operating results during the first three quarters of the year, gold production in 2020 is expected to be 85,000 - 95,000 ounces (previously 80,000 - 90,000 ounces)
• As a result of higher production, CAS1 are expected to be $875 - $925 per ounce (previously $950 - $1,000 per ounce)
• Full-year capital expenditures are expected to remain consistent at approximately $2 - $3 million (no change)
Silvertip, British Columbia
(Dollars in millions, except per ounce and per pound amounts) 3Q 2020 2Q 2020 1Q 2020 4Q 2019 3Q 2019
Metal sales $— $— $1.9 $10.2 $11.3
Costs applicable to sales4 $— $— $17.7 $32.0 $24.2
Exploration expense $3.9 $2.9 $0.3 $0.9 $0.8
Cash flow from operating activities $(8.2) $(14.9) $(27.1) $(28.6) $(15.3)Sustaining capital expenditures (excludes capital lease payments) $(1.8) $1.9 $4.6 $2.0 $6.4
Development capital expenditures $3.9 $— $— $— $—
Total capital expenditures $2.1 $1.9 $4.6 $2.0 $6.4
Free cash flow1 $(10.3) $(16.8) $(31.7) $(30.6) $(21.7)
• Mining and operating activities were temporarily suspended at Silvertip on February 19, 2020 (unrelated to COVID-19)
Operational
• The internal pre-feasibility study to evaluate a potential expansion and restart was substantially completed during the third quarter. Results from the technical analysis and test work have been positive and have largely addressed the key performance challenges experienced prior to suspension
• Based on the positive results to date, the Company has allocated an additional $6.0 million to continue with engineering work, including detailed design of a potential mill expansion to further de-risk the project and enhance the economics of a potential restart
• To strengthen confidence in the results of the pre-feasibility study, third-party technical reviews are expected to be conducted during the fourth quarter
Financial
• Temporary suspension costs related to the ramp-down of active mining and processing activities totaled $0.8 million in the third quarter compared to $1.7 million in the prior period
• Ongoing carrying costs in the third quarter totaled $3.9 million, compared to $5.2 million in the prior period. Coeur expects ongoing quarterly carrying costs to remain at similar levels during the suspension
13

• Capital expenditures during the third quarter increased 6% to approximately $2.1 million, reflecting additional work completed on the pre-feasibility study
• Free cash flow1 for the quarter totaled $(10.3) million
Exploration
• Exploration investment in the third quarter totaled approximately $3.9 million (substantially all expensed), compared to approximately $2.9 million (substantially all expensed) in the prior period
• The focus throughout 2020 has been on near-mine resource expansion and larger step-out (“scout”) drilling to test the edges of the mineralized system. Results demonstrate the potential for resource growth with over two miles (3.5 kilometers) of north-south strike length, more than triple the previous resource strike length
• The Company had up to six active drill rigs during the period, ending with five rigs at quarter end. A total of 83,047 feet (25,313 meters) was drilled during the quarter in five zones, including the last phases of scout drilling, completing the initial 2020 exploration program ahead of schedule and under budget
• Results from resource expansion drilling continue to be encouraging, specifically east and south of the Discovery zone and at the new Tour Ridge and Camp Creek zones, which are located in the south and southwest extensions of the Silvertip area, respectively. Additionally, the Silvertip resource zones continue to remain open to the south as scout drilling tested the southern limits of mineralization. New core drilling at the Tour Ridge, Discovery South and Camp Creek zones have all returned significant sulfide mineralization, suggesting the ore bodies are increasing in thickness to the south
• Coeur has allocated approximately $1.0 million of additional capital for underground development in the fourth quarter to bolster exploration efforts and help facilitate follow-up drilling of encouraging results received during the first nine months of the year
• As winter approaches, the Company plans to transition its drill rigs to lower-elevation drill pads and continue its near-mine resource expansion program during the fourth quarter, ramping down to three active rigs by early November
Other
• Mining continues to be considered an essential business in British Columbia. Rotational schedules remain at 14 days (previously extended to 21 days in early 2020). The Company continues to maintain rigorous health and safety protocols at Silvertip aimed at limiting the exposure and transmission of COVID-19
Guidance
• With additional capital allocated to underground development and ongoing work to further de-risk Silvertip, capital expenditures are expected to be modestly higher at approximately $10 - $12 million (previously $8 - $10 million) in 2020
14

Exploration
During the third quarter, the Company drilled 256,882 feet (78,299 meters) at a total investment of approximately $15.2 million ($12.8 million expensed and $2.3 million capitalized), compared to 194,043 feet (59,145 meters) at a total investment of roughly $13.0 million ($11.9 million expensed and $1.1 million capitalized) in the prior period. Total feet drilled was approximately 32% and 108% higher quarter-over-quarter and year-over-year, respectively. The increase was primarily due to the re-start of drilling activities at Palmarejo, acceleration of Silvertip’s exploration program, and additional drilling at Kensington and Wharf.
In addition to the Company’s mine sites, up to three drill rigs were active at the Crown exploration property in southern Nevada during the third quarter. The Company drilled a total of 23,465 feet (7,152 meters) in the quarter, compared to 23,680 feet (7,218 meters) in the prior period. Two reverse circulation rigs and one core rig were active during the period.
One of the reverse circulation rigs initially began at Sterling, before it was moved to Wharf to focus on expansion drilling at Richmond Hill early in the quarter, while the other rig remained at C-Horst. The core rig focused on drilling for metallurgical and engineering studies, specifically testing the C-Horst, Daisy and Secret Pass deposits. Drilling from the core rig is expected to be completed during the fourth quarter.
The drilling at C-Horst continues to look encouraging with 36 holes now completed from four permitted drill pads. An amended notice was approved in the beginning of October, providing Coeur the opportunity to drill from six additional platforms. If successful, these platforms have the potential to continue expanding mineralization at C-Horst, which remains open south and southwest of Coeur’s initial discovery.
For the remainder of the year, Coeur plans to utilize three rigs, two reverse circulation and one core, to drill within its recently received 300-acre disturbance permit at Crown as well as from the newly permitted drill platforms at C-Horst.
The Company expects to invest $50 - $60 million (previously $44 - $54 million) in exploration in 2020, including $43 - $49 million (previously $37 - $43 million) of expensed exploration and $7 - $11 million (no change) of capitalized exploration. Increased investment in exploration is largely driven by higher planned expansion drilling at Silvertip and Crown.
15

2020 Production Guidance
Previous UpdatedGold Silver Gold Silver(oz) (K oz) (oz) (K oz)
Palmarejo 95,000 - 105,000 6,000 - 7,000 100,000 - 110,000 6,000 - 7,000Rochester 27,000 - 33,000 3,500 - 4,500 27,000 - 33,000 3,100 - 3,700Kensington 125,000 - 135,000 — 122,500 - 130,000 —Wharf 80,000 - 90,000 — 85,000 - 95,000 —Total 327,000 - 363,000 9,500 - 11,500 334,500 - 368,000 9,100 - 10,700
2020 Costs Applicable to Sales Guidance
Previous UpdatedGold Silver Gold Silver($/oz) ($/oz) ($/oz) ($/oz)
Palmarejo (co-product) $785 - $885 $9.50 - $10.50 $650 - $750 $9.50 - $10.50Rochester (co-product) $1,250 - $1,400 $12.75 - $14.00 $1,150 - $1,300 $13.50 - $14.75Kensington $900 - $1,000 — $900 - $1,000 —Wharf (by-product) $950 - $1,000 — $875 - $925 —
2020 Capital, Exploration and G&A Guidance
Previous Updated($M) ($M)
Capital Expenditures, Sustaining $70 - $85 $55 - $60Capital Expenditures, Development $40 - $45 $45 - $55Exploration, Expensed $37 - $43 $43 - $49Exploration, Capitalized $7 - $11 $7 - $11General & Administrative Expenses $32 - $36 $32 - $36
Note: The Company’s previous guidance reflects realized prices through the first half of 2020 and estimated prices of $1,650/oz gold and $16.50/oz silver as well as CAD of 1.36 and MXN of 21.00 for the second half of the year. The Company’s updated guidance reflects realized prices through September 30, 2020 and estimated prices of $1,850/oz gold and $24.00/oz silver as well as CAD of 1.30 and MXN of 21.00 for the fourth quarter.
16
Financial Results and Conference Call
Coeur will host a conference call to discuss its third quarter 2020 financial results on October 29, 2020 at 11:00 a.m. Eastern Time.
Dial-In Numbers: (855) 560-2581 (U.S.)
(855) 669-9657 (Canada)
(412) 542-4166 (International)
Conference ID: Coeur Mining
Hosting the call will be Mitchell J. Krebs, President and Chief Executive Officer of Coeur, who will be joined by Thomas S. Whelan, Senior Vice President and Chief Financial Officer, Michael “Mick” Routledge, Senior Vice President and Chief Operating Officer, and other members of management. A replay of the call will be available through November 12, 2020.
Replay numbers: (877) 344-7529 (U.S.)
(855) 669-9658 (Canada)
(412) 317-0088 (International)
Conference ID: 101 47 941
About CoeurCoeur Mining, Inc. is a U.S.-based, well-diversified, growing precious metals producer with five wholly-owned operations: the Palmarejo gold-silver complex in Mexico, the Rochester silver-gold mine in Nevada, the Kensington gold mine in Alaska, the Wharf gold mine in South Dakota, and the Silvertip silver-zinc-lead mine in British Columbia. In addition, the Company has interests in several precious metals exploration projects throughout North America.
Cautionary StatementsThis news release contains forward-looking statements within the meaning of securities legislation in the United States and Canada, including statements regarding exploration and development efforts and plans, the pre-feasibility study regarding an expansion of the mill at Silvertip, the impact of the new crushing circuit, POA 11 expansion project and technical report preparation at Rochester, expected timing of completion of the Company’s obligations under the prepayment agreement at Kensington, hedging strategies, repositioning, value creation, liquidity management, cash flow, debt repayment, catalysts, anticipated production, costs and expenses, COVID-19 mitigation efforts, and operations at Palmarejo, Rochester, Wharf, Kensington and Silvertip. Such forward-looking statements involve known and unknown risks, uncertainties and other factors which may cause Coeur’s actual results, performance or achievements to be materially different from any future results, performance or achievements expressed or implied by the forward-looking statements. Such factors include, among others, the risk that anticipated production, cost and expense levels are not attained, the risks and hazards inherent in the mining business (including risks inherent in developing large-scale mining projects, environmental hazards, industrial accidents, weather or geologically-related conditions), changes in the market prices of gold, silver, zinc and lead and a sustained lower price or higher treatment and refining charge environment, the uncertainties inherent in Coeur’s production, exploratory and developmental activities, including risks relating to permitting and regulatory delays (including the impact of government shutdowns), ground conditions and, grade variability, any future labor disputes or work stoppages (involving the Company and its subsidiaries or third parties), the uncertainties inherent in the estimation of mineral reserves, changes that could result from Coeur’s future acquisition of new mining properties or businesses, the loss of access or insolvency of any third-party refiner or smelter to which Coeur markets its production, the potential effects of the COVID-19 pandemic, including impacts to the availability of our workforce, continued access to financing sources, government orders that may require temporary suspension of operations at one or more of our sites and effects on our suppliers or the refiners and smelters to whom the Company markets its production, the effects of environmental and other governmental regulations and government shut-downs, the risks inherent in the ownership or operation of or investment in mining properties or businesses in foreign countries, Coeur’s ability to raise additional financing necessary to conduct its business, make payments or refinance its debt, as well as other uncertainties and
17

risk factors set out in filings made from time to time with the United States Securities and Exchange Commission, and the Canadian securities regulators, including, without limitation, Coeur’s most recent reports on Form 10-K and Form 10-Q. Actual results, developments and timetables could vary significantly from the estimates presented. Readers are cautioned not to put undue reliance on forward-looking statements. Coeur disclaims any intent or obligation to update publicly such forward-looking statements, whether as a result of new information, future events or otherwise. Additionally, Coeur undertakes no obligation to comment on analyses, expectations or statements made by third parties in respect of Coeur, its financial or operating results or its securities. This does not constitute an offer of any securities for sale.
Christopher Pascoe, Coeur’s Director, Technical Services and a qualified person under Canadian National Instrument 43-101, approved the scientific and technical information concerning Coeur’s mineral projects in this news release. For a description of the key assumptions, parameters and methods used to estimate mineral reserves and resources, as well as data verification procedures and a general discussion of the extent to which the estimates may be affected by any known environmental, permitting, legal, title, taxation, socio-political, marketing or other relevant factors, Canadian investors should refer to the Technical Reports for each of Coeur’s properties as filed on SEDAR at www.sedar.com.
Non-U.S. GAAP MeasuresWe supplement the reporting of our financial information determined under United States generally accepted accounting principles (U.S. GAAP) with certain non-U.S. GAAP financial measures, including EBITDA, adjusted EBITDA, adjusted EBITDA margin, free cash flow, adjusted net income (loss), operating cash flow excluding changes in working capital and adjusted costs applicable to sales per ounce (gold and silver) or pound (zinc or lead). We believe that these adjusted measures provide meaningful information to assist management, investors and analysts in understanding our financial results and assessing our prospects for future performance. We believe these adjusted financial measures are important indicators of our recurring operations because they exclude items that may not be indicative of, or are unrelated to our core operating results, and provide a better baseline for analyzing trends in our underlying businesses. We believe EBITDA, adjusted EBITDA, adjusted EBITDA margin, free cash flow, adjusted net income (loss) and adjusted costs applicable to sales per ounce (gold and silver) and pound (zinc and lead) are important measures in assessing the Company’s overall financial performance. For additional explanation regarding our use of non-U.S. GAAP financial measures, please refer to our Form 10-K for the year ended December 31, 2019 and our Form 10-Q for the quarter ended September 30, 2020.
Notes1. EBITDA, adjusted EBITDA, adjusted EBITDA margin, free cash flow, adjusted net income (loss), operating cash flow
excluding changes in working capital and adjusted costs applicable to sales per ounce (gold and silver) or pound (lead and zinc) are non-GAAP measures. Please see tables in the Appendix for the reconciliation to U.S. GAAP. Free cash flow is defined as cash flow from operating activities less capital expenditures and gold production royalty payments. Please see table in Appendix for the calculation of consolidated free cash flow.
2. For additional information and complete tables of all drill results published in 2020, please refer to the following links: https://www.coeur.com/_resources/news/nr_20200811.pdf; https://www.coeur.com/_resources/pdfs/2020-08-11_Exploration_Update_Appendix_-_Final.pdf.3. Includes capital leases. Net of debt issuance costs and premium received.4. Excludes amortization.
Average Spot Prices
3Q 2020 2Q 2020 1Q 2020 4Q 2019 3Q 2019
Average Gold Spot Price Per Ounce $ 1,908 $ 1,711 $ 1,583 $ 1,481 $ 1,472
Average Silver Spot Price Per Ounce $ 24.26 $ 16.38 $ 16.90 $ 17.32 $ 16.98
Average Zinc Spot Price Per Pound $ 1.06 $ 0.89 $ 0.96 $ 1.08 $ 1.07
Average Lead Spot Price Per Pound $ 0.85 $ 0.76 $ 0.84 $ 0.93 $ 0.92
For Additional InformationCoeur Mining, Inc.104 S. Michigan Avenue, Suite 900Chicago, IL 60603Attention: Paul DePartout, Director, Investor RelationsPhone: (312) 489-5800 www.coeur.com
18

COEUR MINING, INC. AND SUBSIDIARIESCONDENSED CONSOLIDATED BALANCE SHEETS (UNAUDITED)
September 30, 2020 December 31, 2019ASSETS In thousands, except share data
CURRENT ASSETSCash and cash equivalents $ 77,148 $ 55,645 Receivables 22,490 18,666 Inventory 46,978 55,886 Ore on leach pads 72,326 66,192 Prepaid expenses and other 20,285 14,047
239,227 210,436 NON-CURRENT ASSETSProperty, plant and equipment, net 226,115 248,789 Mining properties, net 708,744 711,955 Ore on leach pads 87,420 71,539 Restricted assets 8,819 8,752 Equity and debt securities 19,862 35,646 Receivables 23,493 28,709 Other 57,466 62,810
TOTAL ASSETS $ 1,371,146 $ 1,378,636 LIABILITIES AND STOCKHOLDERS’ EQUITY
CURRENT LIABILITIESAccounts payable $ 71,461 $ 69,176 Accrued liabilities and other 107,990 95,616 Debt 23,265 22,746 Reclamation 3,094 3,114
205,810 190,652 NON-CURRENT LIABILITIESDebt 277,873 272,751 Reclamation 139,608 133,417 Deferred tax liabilities 30,947 41,976 Other long-term liabilities 52,681 72,836
501,109 520,980 COMMITMENTS AND CONTINGENCIESSTOCKHOLDERS’ EQUITYCommon stock, par value $0.01 per share; authorized 300,000,000 shares, 243,744,601 issued and outstanding at September 30, 2020 and 241,529,021 at December 31, 2019 2,437 2,415 Additional paid-in capital 3,608,102 3,598,472 Accumulated other comprehensive income (loss) (26,312) (136) Accumulated deficit (2,920,000) (2,933,747)
664,227 667,004 TOTAL LIABILITIES AND STOCKHOLDERS’ EQUITY
$ 1,371,146 $ 1,378,636
19

COEUR MINING, INC. AND SUBSIDIARIESCONDENSED CONSOLIDATED STATEMENTS OF COMPREHENSIVE INCOME (LOSS) (UNAUDITED)
Three Months Ended September 30,
Nine Months Ended September 30,
2020 2019 2020 2019In thousands, except share data
Revenue $ 229,728 $ 199,469 $ 557,144 $ 516,462 COSTS AND EXPENSESCosts applicable to sales(1) 112,772 140,952 321,704 404,550 Amortization 32,216 45,678 96,254 130,758 General and administrative 7,757 9,635 25,293 26,859 Exploration 12,818 5,893 31,059 15,326 Pre-development, reclamation, and other 15,031 4,851 40,261 13,619
Total costs and expenses 180,594 207,009 514,571 591,112 OTHER INCOME (EXPENSE), NETLoss on debt extinguishment — (1,282) — (1,282) Fair value adjustments, net 2,243 4,377 3,491 8,201 Interest expense, net of capitalized interest (5,096) (5,980) (15,989) (19,259) Other, net (6,312) (3,634) (4,310) (2,931)
Total other income (expense), net (9,165) (6,519) (16,808) (15,271) Income (loss) before income and mining taxes 39,969 (14,059) 25,765 (89,921) Income and mining tax (expense) benefit (13,113) (218) (12,018) 13,986 Income (loss) from continuing operations $ 26,856 $ (14,277) $ 13,747 $ (75,935) Income (loss) from discontinued operations — — — 5,693 NET INCOME (LOSS) $ 26,856 $ (14,277) $ 13,747 $ (70,242) OTHER COMPREHENSIVE INCOME (LOSS):Change in fair value of derivative contracts designated as cash flow hedges, net of tax of $0 and $365 for the three and nine months ended September 30, 2020 and 2019 respectively. (18,606) 1,132 (26,176) 1,132 Unrealized gain (loss) on debt and equity securities — — — 59 Other comprehensive income (loss) (18,606) 1,132 (26,176) 1,191 COMPREHENSIVE INCOME (LOSS) $ 8,250 $ (13,145) $ (12,429) $ (69,051)
NET INCOME (LOSS) PER SHAREBasic income (loss) per share:Net income (loss) from continuing operations $ 0.11 $ (0.06) $ 0.06 $ (0.36) Net income (loss) from discontinued operations — — — 0.03 Basic(2) $ 0.11 $ (0.06) $ 0.06 $ (0.33) Diluted income (loss) per share:Net income (loss) from continuing operations $ 0.11 $ (0.06) $ 0.06 $ (0.36) Net income (loss) from discontinued operations — — — 0.03 Diluted(2) $ 0.11 $ (0.06) $ 0.06 $ (0.33)
(1) Excludes amortization.(2) Due to rounding, the sum of net income per share from continuing operations and discontinued operations may not equal net income per share.
20

COEUR MINING, INC. AND SUBSIDIARIESCONDENSED CONSOLIDATED STATEMENTS OF CASH FLOWS (UNAUDITED)
Three Months Ended September 30,
Nine Months Ended September 30,
2020 2019 2020 2019In thousands
CASH FLOWS FROM OPERATING ACTIVITIES:Net income (loss) $ 26,856 $ (14,277) $ 13,747 $ (70,242) (Income) loss from discontinued operations — — — (5,693) Adjustments:
Amortization 32,216 45,678 96,254 130,758 Accretion 2,969 3,073 8,724 9,023 Deferred taxes (4,515) (10,545) (11,547) (27,962) Loss on debt extinguishment — 1,282 — 1,282 Fair value adjustments, net (2,243) (4,377) (3,491) (8,201) Stock-based compensation 1,969 2,432 6,269 6,642 Gain on modification of right of use lease — — (4,051) — Write-downs 1,232 13,966 16,821 41,285 Deferred revenue recognition (5,485) (15,250) (21,167) (16,008) Other 4,379 8,994 2,374 15,733
Changes in operating assets and liabilities:Receivables (1,497) (3,350) (3,846) (20,709) Prepaid expenses and other current assets (1,921) 1,375 (1,186) (2,143) Inventory and ore on leach pads (3,066) (9,389) (33,047) (42,601) Accounts payable and accrued liabilities 28,570 22,384 15,566 41,421
CASH PROVIDED BY (USED IN) OPERATING ACTIVITIES OF CONTINUING OPERATIONS 79,464 41,996 81,420 52,585
CASH PROVIDED BY (USED IN )OPERATING ACTIVITIES OF DISCONTINUED OPERATIONS — — — —
CASH PROVIDED BY (USED IN) OPERATING ACTIVITIES 79,464 41,996 81,420 52,585 CASH FLOWS FROM INVESTING ACTIVITIES:
Capital expenditures (22,996) (30,678) (61,886) (78,865) Proceeds from the sale of assets 730 26 5,245 930 Purchase of investments (2,500) — (2,500) — Sale of investments — 1,007 19,802 2,109 Proceeds from notes receivable — — — 7,168 Other (25) (57) (225) 1,961
CASH PROVIDED BY (USED IN) INVESTING ACTIVITIES OF CONTINUING OPERATIONS (24,791) (29,702) (39,564) (66,697)
CASH USED IN INVESTING ACTIVITIES OF DISCONTINUED OPERATIONS — — — — CASH PROVIDED BY (USED IN) INVESTING ACTIVITIES (24,791) (29,702) (39,564) (66,697) CASH FLOWS FROM FINANCING ACTIVITIES:
Issuance of common stock — 73,781 — 122,668 Issuance of notes and bank borrowings, net of issuance costs — 30,000 150,000 45,000 Payments on debt, finance leases, and associated costs (48,557) (87,778) (150,171) (201,051) Silvertip contingent consideration — — (18,750) — Other 114 301 (1,718) (2,958)
CASH PROVIDED BY (USED IN) FINANCING ACTIVITIES OF CONTINUING OPERATIONS (48,443) 16,304 (20,639) (36,341)
CASH USED IN FINANCING ACTIVITIES OF DISCONTINUED OPERATIONS — — — — CASH PROVIDED BY (USED IN) FINANCING ACTIVITIES (48,443) 16,304 (20,639) (36,341)
Effect of exchange rate changes on cash and cash equivalents (10) (192) 293 65
INCREASE (DECREASE) IN CASH, CASH EQUIVALENTS AND RESTRICTED CASH 6,220 28,406 21,510 (50,388)
Less net cash used in discontinued operations — — — — 6,220 28,406 21,510 (50,388)
Cash, cash equivalents and restricted cash at beginning of period 72,308 39,275 57,018 118,069 Cash, cash equivalents and restricted cash at end of period $ 78,528 $ 67,681 $ 78,528 $ 67,681
21
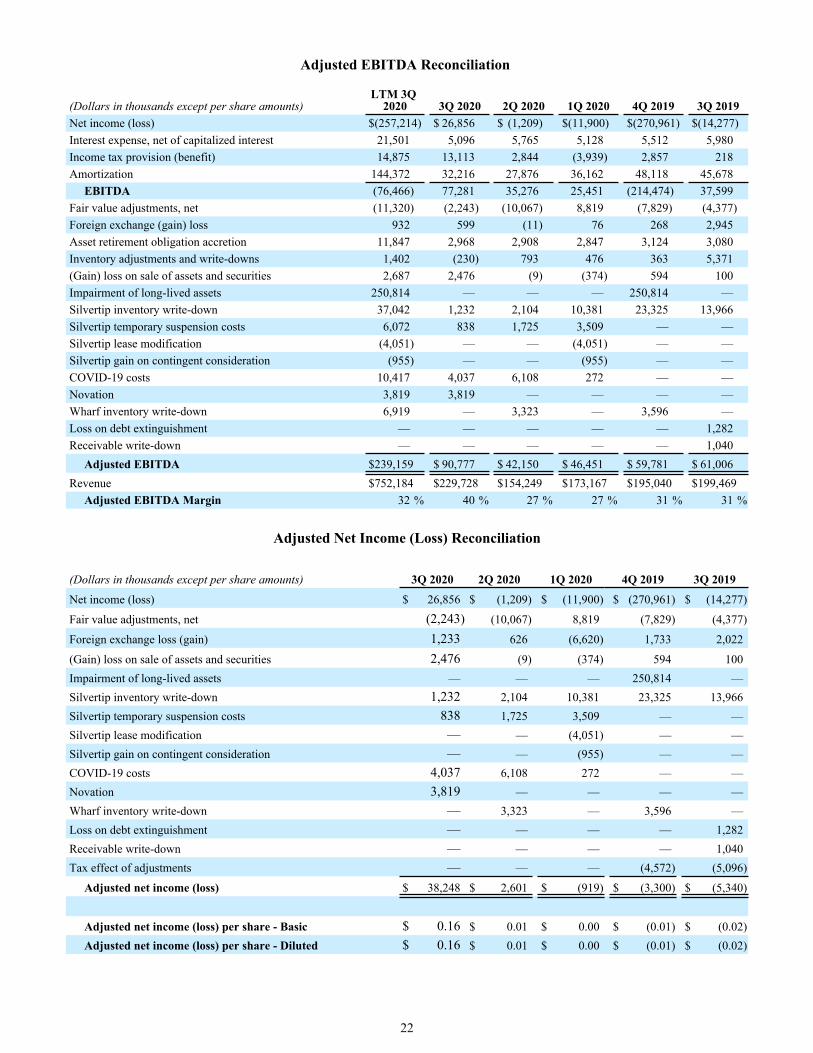
Adjusted EBITDA Reconciliation
(Dollars in thousands except per share amounts)LTM 3Q
2020 3Q 2020 2Q 2020 1Q 2020 4Q 2019 3Q 2019Net income (loss) $ (257,214) $ 26,856 $ (1,209) $ (11,900) $ (270,961) $ (14,277) Interest expense, net of capitalized interest 21,501 5,096 5,765 5,128 5,512 5,980 Income tax provision (benefit) 14,875 13,113 2,844 (3,939) 2,857 218 Amortization 144,372 32,216 27,876 36,162 48,118 45,678
EBITDA (76,466) 77,281 35,276 25,451 (214,474) 37,599 Fair value adjustments, net (11,320) (2,243) (10,067) 8,819 (7,829) (4,377) Foreign exchange (gain) loss 932 599 (11) 76 268 2,945 Asset retirement obligation accretion 11,847 2,968 2,908 2,847 3,124 3,080 Inventory adjustments and write-downs 1,402 (230) 793 476 363 5,371 (Gain) loss on sale of assets and securities 2,687 2,476 (9) (374) 594 100 Impairment of long-lived assets 250,814 — — — 250,814 — Silvertip inventory write-down 37,042 1,232 2,104 10,381 23,325 13,966 Silvertip temporary suspension costs 6,072 838 1,725 3,509 — — Silvertip lease modification (4,051) — — (4,051) — — Silvertip gain on contingent consideration (955) — — (955) — — COVID-19 costs 10,417 4,037 6,108 272 — — Novation 3,819 3,819 — — — — Wharf inventory write-down 6,919 — 3,323 — 3,596 — Loss on debt extinguishment — — — — — 1,282 Receivable write-down — — — — — 1,040
Adjusted EBITDA $ 239,159 $ 90,777 $ 42,150 $ 46,451 $ 59,781 $ 61,006 Revenue $ 752,184 $ 229,728 $ 154,249 $ 173,167 $ 195,040 $ 199,469
Adjusted EBITDA Margin 32 % 40 % 27 % 27 % 31 % 31 %
Adjusted Net Income (Loss) Reconciliation
(Dollars in thousands except per share amounts) 3Q 2020 2Q 2020 1Q 2020 4Q 2019 3Q 2019
Net income (loss) $ 26,856 $ (1,209) $ (11,900) $ (270,961) $ (14,277)
Fair value adjustments, net (2,243) (10,067) 8,819 (7,829) (4,377)
Foreign exchange loss (gain) 1,233 626 (6,620) 1,733 2,022
(Gain) loss on sale of assets and securities 2,476 (9) (374) 594 100 Impairment of long-lived assets — — — 250,814 — Silvertip inventory write-down 1,232 2,104 10,381 23,325 13,966 Silvertip temporary suspension costs 838 1,725 3,509 — — Silvertip lease modification — — (4,051) — — Silvertip gain on contingent consideration — — (955) — — COVID-19 costs 4,037 6,108 272 — — Novation 3,819 — — — — Wharf inventory write-down — 3,323 — 3,596 — Loss on debt extinguishment — — — — 1,282 Receivable write-down — — — — 1,040 Tax effect of adjustments — — — (4,572) (5,096)
Adjusted net income (loss) $ 38,248 $ 2,601 $ (919) $ (3,300) $ (5,340)
Adjusted net income (loss) per share - Basic $ 0.16 $ 0.01 $ 0.00 $ (0.01) $ (0.02) Adjusted net income (loss) per share - Diluted $ 0.16 $ 0.01 $ 0.00 $ (0.01) $ (0.02)
22
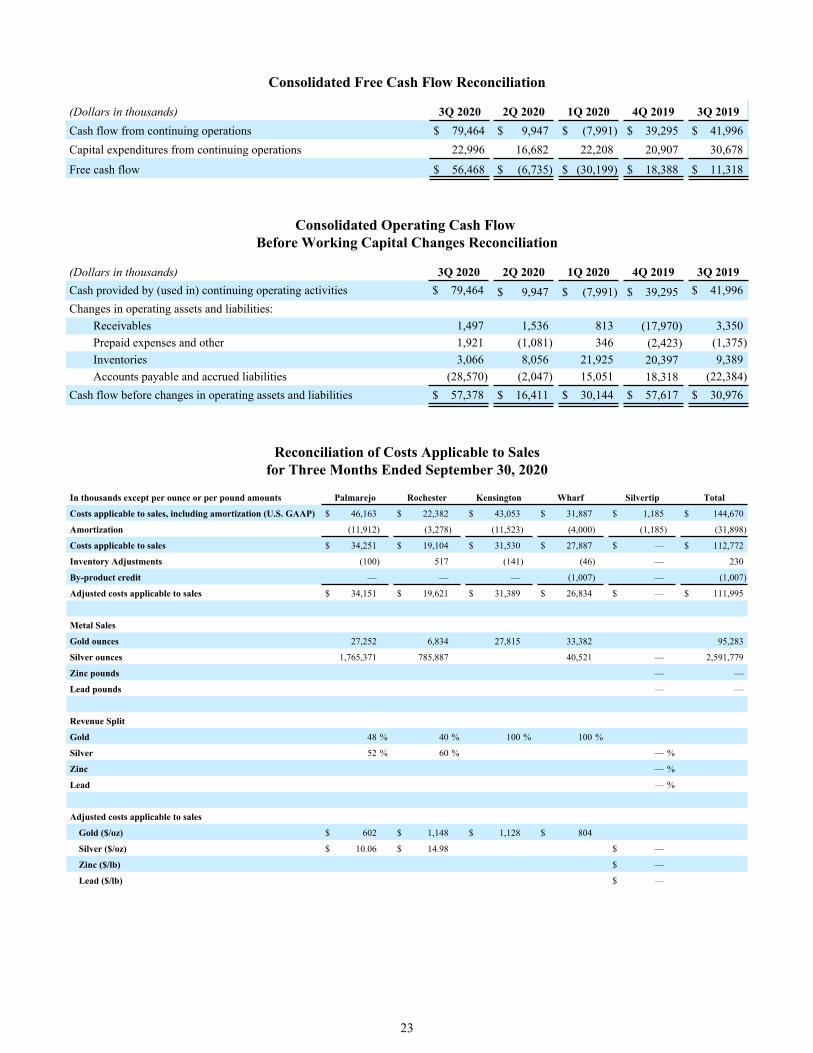
Consolidated Free Cash Flow Reconciliation
(Dollars in thousands) 3Q 2020 2Q 2020 1Q 2020 4Q 2019 3Q 2019Cash flow from continuing operations $ 79,464 $ 9,947 $ (7,991) $ 39,295 $ 41,996 Capital expenditures from continuing operations 22,996 16,682 22,208 20,907 30,678
Free cash flow $ 56,468 $ (6,735) $ (30,199) $ 18,388 $ 11,318
Consolidated Operating Cash Flow Before Working Capital Changes Reconciliation
(Dollars in thousands) 3Q 2020 2Q 2020 1Q 2020 4Q 2019 3Q 2019Cash provided by (used in) continuing operating activities $ 79,464 $ 9,947 $ (7,991) $ 39,295 $ 41,996 Changes in operating assets and liabilities:
Receivables 1,497 1,536 813 (17,970) 3,350 Prepaid expenses and other 1,921 (1,081) 346 (2,423) (1,375) Inventories 3,066 8,056 21,925 20,397 9,389 Accounts payable and accrued liabilities (28,570) (2,047) 15,051 18,318 (22,384)
Cash flow before changes in operating assets and liabilities $ 57,378 $ 16,411 $ 30,144 $ 57,617 $ 30,976
Reconciliation of Costs Applicable to Salesfor Three Months Ended September 30, 2020
In thousands except per ounce or per pound amounts Palmarejo Rochester Kensington Wharf Silvertip Total
Costs applicable to sales, including amortization (U.S. GAAP) $ 46,163 $ 22,382 $ 43,053 $ 31,887 $ 1,185 $ 144,670
Amortization (11,912) (3,278) (11,523) (4,000) (1,185) (31,898)
Costs applicable to sales $ 34,251 $ 19,104 $ 31,530 $ 27,887 $ — $ 112,772
Inventory Adjustments (100) 517 (141) (46) — 230
By-product credit — — — (1,007) — (1,007)
Adjusted costs applicable to sales $ 34,151 $ 19,621 $ 31,389 $ 26,834 $ — $ 111,995
Metal Sales
Gold ounces 27,252 6,834 27,815 33,382 95,283
Silver ounces 1,765,371 785,887 40,521 — 2,591,779
Zinc pounds — —
Lead pounds — —
Revenue Split
Gold 48 % 40 % 100 % 100 %
Silver 52 % 60 % — %
Zinc — %
Lead — %
Adjusted costs applicable to sales
Gold ($/oz) $ 602 $ 1,148 $ 1,128 $ 804
Silver ($/oz) $ 10.06 $ 14.98 $ —
Zinc ($/lb) $ —
Lead ($/lb) $ —
23

Reconciliation of Costs Applicable to Salesfor Three Months Ended June 30, 2020
In thousands except per ounce or per pound amounts Palmarejo Rochester Kensington Wharf Silvertip Total
Costs applicable to sales, including amortization (U.S. GAAP) $ 26,095 $ 21,348 $ 43,235 $ 25,653 $ 1,231 $ 117,562
Amortization (7,270) (3,012) (12,853) (3,181) (1,231) (27,547)
Costs applicable to sales $ 18,825 $ 18,336 $ 30,382 $ 22,472 $ — $ 90,015
Inventory Adjustments (106) (566) (139) (3,304) — (4,115)
By-product credit — — — (385) — (385)
Adjusted costs applicable to sales $ 18,719 $ 17,770 $ 30,243 $ 18,783 $ — $ 85,515
Metal Sales
Gold ounces 16,924 5,278 32,367 23,364 77,933
Silver ounces 874,642 723,679 22,707 — 1,621,028
Zinc pounds — —
Lead pounds — —
Revenue Split
Gold 62 % 44 % 100 % 100 %
Silver 38 % 56 % — %
Zinc — %
Lead — %
Adjusted costs applicable to sales
Gold ($/oz) $ 686 $ 1,481 $ 934 $ 804
Silver ($/oz) $ 8.13 $ 13.75 $ —
Zinc ($/lb) $ —
Lead ($/lb) $ —
Reconciliation of Costs Applicable to Salesfor Three Months Ended March 31, 2020
In thousands except per ounce or per pound amounts Palmarejo Rochester Kensington Wharf Silvertip Total
Costs applicable to sales, including amortization (U.S. GAAP) $ 49,149 $ 19,860 $ 42,429 $ 20,267 $ 23,002 $ 154,707
Amortization (13,175) (2,904) (11,922) (2,444) (5,345) (35,790)
Costs applicable to sales $ 35,974 $ 16,956 $ 30,507 $ 17,823 $ 17,657 $ 118,917
Inventory Adjustments 73 (422) (101) (25) (10,381) (10,856)
By-product credit — — — (248) — (248)
Adjusted costs applicable to sales $ 36,047 $ 16,534 $ 30,406 $ 17,550 $ 7,276 $ 107,813
Metal Sales
Gold ounces 31,287 5,473 32,781 16,094 85,635
Silver ounces 1,894,789 632,237 14,768 158,984 2,700,778
Zinc pounds 3,203,446 3,203,446
Lead pounds 2,453,485 2,453,485
Revenue Split
Gold 56 % 45 % 100 % 100 %
Silver 44 % 55 % 26 %
Zinc 48 %
Lead 26 %
Adjusted costs applicable to sales
Gold ($/oz) $ 645 $ 1,359 $ 928 $ 1,090
Silver ($/oz) $ 8.37 $ 14.38 $ 11.79
Zinc ($/lb) $ 1.12
Lead ($/lb) $ 0.74
24

Reconciliation of Costs Applicable to Salesfor Three Months Ended December 31, 2019
In thousands except per ounce or per pound amounts Palmarejo Rochester Kensington Wharf Silvertip Total
Costs applicable to sales, including amortization (U.S. GAAP) $ 49,590 $ 31,100 $ 41,537 $ 29,818 $ 42,189 $ 194,234
Amortization (14,799) (5,791) (12,776) (4,072) (10,166) (47,604)
Costs applicable to sales $ 34,791 $ 25,309 $ 28,761 $ 25,746 $ 32,023 $ 146,630
Inventory Adjustments (11) (116) (176) (3,677) (23,325) (27,305)
By-product credit — — — (373) — (373)
Adjusted costs applicable to sales $ 34,780 $ 25,193 $ 28,585 $ 21,696 $ 8,698 $ 118,952
Metal Sales
Gold ounces 27,953 11,248 29,293 27,039 — 95,533
Silver ounces 1,979,315 931,326 21,132 294,498 3,226,271
Zinc pounds 4,052,554 4,052,554
Lead pounds 4,223,504 4,223,504
Revenue Split
Gold 50 % 51 % 100 % 100 %
Silver 50 % 49 % 38 %
Zinc 32 %
Lead 30 %
Adjusted costs applicable to sales
Gold ($/oz) $ 622 $ 1,142 $ 976 $ 802
Silver ($/oz) $ 8.79 $ 13.25 $ 11.22
Zinc ($/lb) $ 0.69
Lead ($/lb) $ 0.62
Reconciliation of Costs Applicable to Salesfor Three Months Ended September 30, 2019
In thousands except per ounce or per pound amounts Palmarejo Rochester Kensington Wharf Silvertip Total
Costs applicable to sales, including amortization (U.S. GAAP) $ 53,237 $ 31,999 $ 43,085 $ 25,385 $ 32,457 $ 186,163
Amortization (15,840) (4,250) (13,552) (3,301) (8,268) (45,211)
Costs applicable to sales $ 37,397 $ 27,749 $ 29,533 $ 22,084 $ 24,189 $ 140,952
Inventory Adjustments (175) (4,799) (405) (7) (13,966) (19,352)
By-product credit — — — (293) — (293)
Adjusted costs applicable to sales $ 37,222 $ 22,950 $ 29,128 $ 21,784 $ 10,223 $ 121,307
Metal Sales
Gold ounces 32,731 7,651 35,452 24,573 100,407
Silver ounces 1,747,250 951,043 16,612 289,910 3,004,815
Zinc pounds 4,076,390 4,076,390
Lead pounds 4,330,862 4,330,862
Revenue Split
Gold 58 % 41 % 100 % 100 %
Silver 42 % 59 % 39 %
Zinc 29 %
Lead 32 %
Adjusted costs applicable to sales
Gold ($/oz) $ 660 $ 1,230 $ 822 $ 887
Silver ($/oz) $ 8.95 $ 14.24 $ 14.14
Zinc ($/lb) $ 0.75
Lead ($/lb) $ 0.71
25
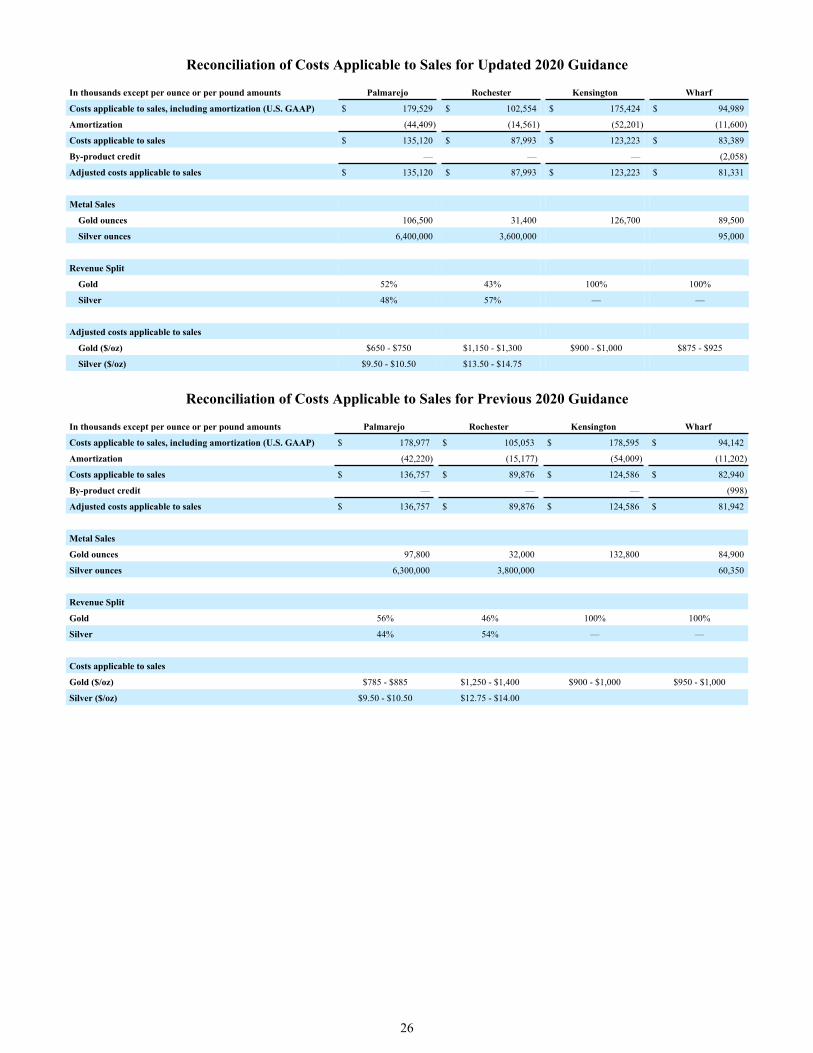
Reconciliation of Costs Applicable to Sales for Updated 2020 Guidance
In thousands except per ounce or per pound amounts Palmarejo Rochester Kensington Wharf
Costs applicable to sales, including amortization (U.S. GAAP) $ 179,529 $ 102,554 $ 175,424 $ 94,989
Amortization (44,409) (14,561) (52,201) (11,600)
Costs applicable to sales $ 135,120 $ 87,993 $ 123,223 $ 83,389
By-product credit — — — (2,058)
Adjusted costs applicable to sales $ 135,120 $ 87,993 $ 123,223 $ 81,331
Metal Sales
Gold ounces 106,500 31,400 126,700 89,500
Silver ounces 6,400,000 3,600,000 95,000
Revenue Split
Gold 52% 43% 100% 100%
Silver 48% 57% — —
Adjusted costs applicable to sales
Gold ($/oz) $650 - $750 $1,150 - $1,300 $900 - $1,000 $875 - $925
Silver ($/oz) $9.50 - $10.50 $13.50 - $14.75
Reconciliation of Costs Applicable to Sales for Previous 2020 Guidance
In thousands except per ounce or per pound amounts Palmarejo Rochester Kensington Wharf
Costs applicable to sales, including amortization (U.S. GAAP) $ 178,977 $ 105,053 $ 178,595 $ 94,142
Amortization (42,220) (15,177) (54,009) (11,202)
Costs applicable to sales $ 136,757 $ 89,876 $ 124,586 $ 82,940
By-product credit — — — (998)
Adjusted costs applicable to sales $ 136,757 $ 89,876 $ 124,586 $ 81,942
Metal Sales
Gold ounces 97,800 32,000 132,800 84,900
Silver ounces 6,300,000 3,800,000 60,350
Revenue Split
Gold 56% 46% 100% 100%
Silver 44% 54% — —
Costs applicable to sales
Gold ($/oz) $785 - $885 $1,250 - $1,400 $900 - $1,000 $950 - $1,000
Silver ($/oz) $9.50 - $10.50 $12.75 - $14.00
26