2020 integrated resource plan - dominion energy
TRANSCRIPT

2020 Integrated Resource Plan
Dominion Energy South Carolina, Inc.
Revised: May 29, 2020 Filed: February 28, 2020

Table of Contents Page
Executive Summary 1 Introduction 4 Act No. 62 Requirements 7 Glossary of Terms 8 I. DESC’s Demand and Energy Forecast for the Fifteen-Year
Period Ending 2034 9
A. Annual Energy Sales and Peak Demand by Season 9 B. Economic Scenario Analysis 10 C. Wholesale Sales Scenario Analysis 11 D. Electric Vehicle Scenario Analysis 12
II. DESC’s Program for Meeting Its Demand and Energy
Forecasts in an Economic and Reliable Manner 18
A. Demand Side Management 18 1. Energy Efficiency 18
a. Demand Side Management Programs 18 b. Energy Conservation 21
2. Load Management Programs 22 a. Standby Generator Program 22 b. Interruptible Load Program 22 c. Real Time Pricing (“RTP”) Rate 22 d. Time of Use Rates 22 e. Winter Peak Clipping 22
B. Supply Side Management 23
1. Existing Sources of Clean Energy 23 a. Solar Power 23 b. Hydro Power 23 c. Nuclear Power 24
2. Distribution Resource Plan 25 Smart Grid Activities 25
3. Future Clean Energy 26 a. Hydro-Power 26 b. CO2 and Methane Goals 26 c. Renewables 27 d. Cogeneration/Combined Heat and Power 29 e. Energy Storage 30
4. Supply Side Resources at DESC 31 a. Existing Supply Resources 31 b. Limitations on Existing Resources 34 c. Environmental Rules 34
5. Resource Plan Analysis 37 a. Overview 37 b. Reserve Margin 37 c. Meeting the Base Resource Need 38
i. Resource Plans 40 ii. Methodology 41
iii. Demand Side Management (“DSM”) Assumptions 42 iv. DSM Sensitivity 42

Table of Contents Page
v. Discussion of Results by DSM Scenario 43 vi. Emissions and Fuel Sensitivity 44
vii. Resource Plan Rankings by Gas Price and CO2 Price 45 viii. Discussion of Scenario Results by Cost 46
ix. Resource Plan Rankings by Total Fuel Cost 46 x. Resource Plan Rankings by CO2 Emissions 47
xi. Discussion of CO2 Results by Resource Plan 48 xii. Forecast of Renewable Generation 49
Resource Plan 2 Schedule 50 Resource Plan 8 Schedule 51 III. Transmission System Assessment and Planning 52 IV. Conclusions 57 APPENDIX A Intervenor Provided Resource Plans and Scenarios A-1

1
Executive Summary For decades, utilities created Integrated Resource Plans (“IRP”) to show when customer
demand growth required the addition of new resources. During that time, the load forecast and
fuel price were the most influential factors in determining which resource plans had the most
cost-effective features to provide a safe and reliable supply.
Historically load growth was well anticipated, and even fuel prices were relatively well-
known. Other factors like demand side management, energy efficiency, environmental
regulations, and greenhouse gas emissions have increasingly dictated the research of additional
options and consideration of those options against different measures.
Over the planning horizon, Dominion Energy South Carolina, Inc. (“DESC” or
“Company”) expects societal trends toward clean energy to continue. Many customer segments
from universities and financial institutions to retail chains have expressed interest in renewable
energy solutions. Indeed, many large companies including some of the State’s largest employers
have publicly committed to 100% renewable energy. Moreover, South Carolina cities including
Columbia and Charleston are each developing clean energy initiatives with the goal of
decreasing their overall carbon footprint.
Furthermore, DESC intends to utilize more power generated from clean energy sources.
This IRP also reflects DESC’s commitment to clean energy in the energy efficiency programs
offered to customers and in the probable modifications to the Company’s electric transmission
and distribution grid which will facilitate the growth of clean energy solutions while assuring
that energy continues to be provided in a safe, reliable, and affordable manner. Aside from the
expanding interest in clean energy, renewable resources continue to become a more cost-
effective means of meeting the growing energy needs of customers. For example, the continuing
development of solar photovoltaic technology has made this type of generation more cost-
competitive with traditional forms of generation. Currently, this type of generation does not
meet all of the needs of a highly dynamic and critical infrastructure system like the electric grid.
It will take innovation and research to find a cost-effective combination of generation,
transmission, and distribution to provide reliable clean energy for the future.
In addition to these rapidly increasing influences, the South Carolina General Assembly
has enacted new requirements beginning with the 2020 IRP that have impacted its content and
scope. Some topics not directly relevant to the required content were not carried over from
previous IRPs. Instead, the content is highly focused on information needed to understand and

2
interpret the range of model inputs and sensitivities, and ultimately, the comparison of results
shown in the Resource Plan Analysis section.
The newly enacted Act No. 62 as codified at S.C. Code Ann. § 58-37-40(B)(1)
establishes mandatory content of IRPs as detailed in the table on Page 4 in the Introduction
section. Topics and requirements include sensitivities on the load forecast, generation
technologies, renewable resources, electric transmission plans, demand side management
(“DSM”), generator retirements, fuel costs, and environmental regulations. As directed, multiple
resources plans have been created to provide reliability while including a mix of retirements,
new generation technologies, and the expansion of renewables. Several sensitivities are modeled
by varying the inputs so relevant comparisons can be made. These sensitivities include CO2
costs, natural gas/commodity pricing, and customer usage/demand.
Part I explains the considerations and analysis that have resulted in the load forecast
including consideration of the relatively new electric vehicle (“EV”) market in South Carolina.
The Charleston Metropolitan area is poised for EV growth. The overall demographics, the
DESC partnership with the Charleston Area Regional Transportation Authority and plans by
other private entities to add larger more robust charging stations are helping EV growth in the
strongest market. The Company anticipates that the strong growth in Charleston will continue to
gain strength. The Company is also seeing strong interest for EV charging along major
transportation corridors. Similar adoption rates are expected to follow in markets such as
Columbia, Hilton Head and Aiken. The increased local energy demand will certainly require
adaptation, initially in all urban areas, and later in rural areas. Urban distribution systems will
need additional support from automation and hardening investment in the next few years. DESC
will continue to evaluate the EV markets and infrastructure and their potential impact on load.
The Company is considering the impact of privately-owned cars and trucks, transit buses, school
buses, off road vehicles and commercial fleet vehicles. The demand and energy impact from EV
charging is expected to impact grid-level planning in this decade, and the IRP will be adjusted as
the EV forecast matures.
Although a preferred scenario is not named in the Resource Plan Analysis, focusing on
the most likely inputs identifies Resource Plan 2 (“RP2”) that features combustion turbines to
maintain the Reserve Margin as the least cost. Resource Plan 8 (“RP8”) that features the
retirement of all coal generation by 2030 shows modestly higher costs but yields the greatest

3
CO2 reductions. These results show a path to CO2 reductions and associated costs. RP8 could
result in a 59% CO2 reduction by 2030 from 2005 levels verses only a 39% reduction in RP2.
DESC concludes that no major changes to the generation fleet are required in the near
term to meet customer’s energy and capacity needs in a safe, affordable and reliable manner.
However, with a commitment to a more sustainable energy future, the Company needs to
upgrade its electric system through measures such as rolling out Advanced Metering
Infrastructure (“AMI”), converting some of its older peaking generation to more reliable and
quick- start peaking generation, continuing to expand DSM, and studying transmission system to
minimize the impact of eventual steam unit retirements and additional intermittent renewable
generation.

4
Introduction
This document presents DESC’s IRP which includes several resource plans for meeting
the energy and capacity needs of its customers over the next fifteen years, 2020 through 2034.
This document is filed with the Public Service Commission of South Carolina (“Commission”)
in accordance with S.C. Code Ann. § 58-37-40 (2019) and Order No. 98-502 and satisfies the
annual reporting requirements of the Utility Facility Siting and Environmental Protection Act,
S.C. Code Ann. § 58-33-430 (2015). The objective of the Company’s IRP is to develop a
resource plan that will provide safe, reliable cost-effective energy to the Company’s customers
while complying with all laws and regulations. Given the dynamic nature of the current electric
power industry with respect to societal trends, customer preferences, technological advances, and
environmental regulations, it is important that Company remain flexible with respect to
expansion plans. As such, the resource plans identified in this 2020 IRP present several
plausible paths the Company may or may not elect to pursue. What’s most imperative is that the
Company remain agile regarding expansion of its electric generation portfolio. Therefore, at this
time, the Company recommends following a short-term plan consistent with RP2 (and other grid
modifications identified in the Conclusions section of this IRP). Simultaneously, the Company
shall continue to study and reasonably develop the alternatives put forth in RP8.
DESC’s IRP is organized into four parts:
Part I presents the expected loads and peaks on the DESC system over the next fifteen
years. Winter peak load forecasted annual growth fell from 0.9% in DESC’s 2019 IRP to 0.7%
in the 2020 IRP. Many factors were considered in the load forecast including historical sales
data, economic factors impacting the Company’s commercial and residential customers, DSM
which includes energy efficiency (“EE”) and load management, and EVs. Low and high demand
growth estimates were also derived as required under §58-37-40(B)(1)(a) of Act No. 62 to
validate the reasonableness of the final load forecast.
Part II discusses DESC’s programs for meeting its demand and energy forecasts,
beginning with existing demand and supply-side resources. Highlights include both current
expanded DSM programs that will be proposed to customers over the next five years beginning
in 2020 since the Potential Study was completed and approved in 2019. The resulting report
“Dominion Energy South Carolina: 2020‒2029 Achievable DSM Potential and PY10–PY14
Program Plan” (the “2019 Potential Study”) was approved by the Public Service Commission of

5
South Carolina in December 2019 pursuant to Commission Order No. 2019-880. From this
study, the DSM target increased from a 0.33% reduction in retail sales growth in the 2019 IRP to
0.7% by 2023 in the 2020 IRP. The supply-side resources include the current generation
portfolio along with discussions about the extreme age of equipment and its end of useful life. A
detailed listing can be found in the Existing Long-term Supply Resource Table which lists life
expectancy/retirement date as required in Act No. 62 as codified at SC Code Ann. § 58-37-
40(B)(1)(a). A detailed Resource Plan Analysis was performed to assess generation scenarios
that could meet the future needs of DESC’s customers. Several resource plans were created by
varying retirements, environmental regulations, and additional renewable resources. While the
Company makes observations and conclusions as to which resource plan results in the least cost,
the results do not reflect any final decision by the Company for its path forward.
Part III summarizes DESC’s transmission planning practices and program development
for timely modifications to the DESC transmission system to ensure reliable and economical
delivery of power. DESC assesses and designs its transmission system to be compliant with the
requirements as set forth in the North American Electric Reliability Corporation (“NERC”)
Reliability Standards. A summary of the electrical transmission investments planned by the
DESC are provided based on the latest assessment studies. The transmission expansion plan is
continuously reviewed and may change due to changes in key data and assumptions. This
summary of projects does not represent a commitment to build.
Conclusions are presented in Part IV.
Appendix A contains the results of five resource plans run by DESC using the DESC
PROSYM production model but with inputs specifically defined by intervening third parties.
Although the intervenor resource plans utilized many of the same data inputs, no direct
comparisons to DESC’s resource plans were included in this IRP due to the low resource cost
information provided by the third parties, which in DESC’s view, results in a low portfolio cost
bias and prevents a practical comparison.
Pursuant to the requirements in S.C. Code Ann. § 58-37-40(B), this IRP (1) demonstrates
through various scenarios the resource adequacy and capacity to serve the anticipated peak
electrical load and its applicable planning reserve margins, (2) identifies the least cost for
consumer affordability, (3) is in compliance with applicable state and federal regulations, (4)

6
ensure power supply reliability, (5) minimizes commodity price risks, and (6) offers diversity in
its generation supply. The details of the IRP requirements under Act No. 62 are shown in the
following table along with a reference to each section of the Company’s IRP demonstrating
compliance:

7
Act 62 Requirements
Act No. 62 58-37-40
Requirement 2020 IRP Section
(B)(1)(a) a long-term forecast of the utility's sales and peak demand under various reasonable scenarios;
I.A I.B
(B)(1)(b) the type of generation technology proposed for a generation facility contained in the plan and the proposed capacity of the generation facility, including fuel cost sensitivities under various reasonable scenarios;
II.B.5.c
(B)(1)(c) projected energy purchased or produced by the utility from a renewable energy resource;
II.B.3.c
(B)(1)(d) a summary of the electrical transmission investments planned by the utility;
III
(B)(1)(e) several resource portfolios developed with the purpose of fairly evaluating the range of demand-side, supply-side, storage, and other technologies and services available to meet the utility’s service obligations. Such portfolios and evaluations must include an evaluation of low, medium, and high cases for the adoption of renewable energy and cogeneration, energy efficiency, and demand response measures, including consideration of the following:
(i) customer energy efficiency and demand response programs; (ii) facility retirement assumptions; and (iii) sensitivity analyses related to fuel costs, environmental
regulations, and other uncertainties or risks;
II.B.5.c II.B.3.d
(B)(1)(f) data regarding the utility's current generation portfolio, including the age, licensing status, and remaining estimated life of operation for each facility in the portfolio;
II.B.1 II.B.3 II.B.4.a
(B)(1)(g) plans for meeting current and future capacity needs with the cost estimates for all proposed resource portfolios in the plan;
II.B.5.c
(B)(1)(h) an analysis of the cost and reliability impacts of all reasonable options available to meet projected energy and capacity needs; and
II.B.5.c
(B)(1)(i) a forecast of the utility's peak demand, details regarding the amount of peak demand reduction the utility expects to achieve, and the actions the utility proposes to take in order to achieve that peak demand reduction.
I.A II.A.1 II.A.2
(B)(2) An integrated resource plan may include distribution resource plans or integrated system operation plans.
II.A.2 II.B.2

8
Table of Abbreviations Abbreviation Name ACE Affordable Clean Energy ATW Ash Transport Water BAA Balancing Authority Area BEV Battery Electric Vehicles BSER Best System of Emissions Reduction CC Combined Cycle Power Plant CO2 Carbon Dioxide DER Distributed Energy Resource DR Demand Response DSM Demand Side Management EE Energy Efficiency EIA Energy Information Administration EIPC Eastern Interconnection Planning Collaborative ELG Effluent Limitation Guidelines EPA Environmental Protection Agency ERO Electric Reliability Organization FERC Federal Energy Regulatory Commission FGD Flue Gas Desulphurization GWh Gigawatt Hour HVAC Heating, Ventilation, and Air Conditioning ICT Internal Combustion Turbine kW Kilowatt kWh Kilowatt Hour MW Megawatt MWh Megawatt Hour NEEP Neighborhood Energy Efficiency Program NERC North American Electric Reliability Corporation NPV Net Present Value ORS Office of Regulatory Staff PHEV Plug-in Hybrid Electric Vehicles PPA Power Purchase Agreement PV Photovoltaic SCADA Supervisory Control and Data Acquisition SEPA Southeastern Power Administration

9
I. Demand and Energy Forecast for the Fifteen-Year Period Ending
2034 A. DESC’s Annual Energy Sales and Peak Demand by Season
The following table shows the Company’s annual sales and its gross peak demand, i.e.,
its total internal demand, by season over the next fifteen years.
Annual Energy and Demand Forecast By Season
Annual Peak Demands Sales Summer Winter GWh MW MW 2020 24,003 4,816 4,891 2021 24,091 4,847 4,924 2022 24,029 4,879 4,955 2023 24,097 4,905 4,964 2024 24,092 4,916 4,992 2025 24,163 4,941 5,022 2026 24,252 4,967 5,051 2027 24,334 4,993 5,077 2028 24,404 5,019 5,102 2029 24,490 5,041 5,152 2030 24,682 5,090 5,209 2031 24,882 5,146 5,266 2032 25,131 5,201 5,319 2033 25,365 5,256 5,375 2034 25,587 5,309 5,428 Note: winter season follows summer.
Over this planning horizon, the Company is projecting through its statistical and
econometric forecasting models that sales will grow at 0.5% while the summer and winter peak
demands both grow at 0.7%. The following two tables show the Company’s projected demand
response capacity and the resulting net firm peak demand, i.e., net internal demand, by season.
The net firm peak demand in summer and winter are projected to grow at 0.7%.

10
Net Firm Peak Hour Demand by Year Demand Response Net Firm Peak
Peak Demands Peak Demands Year Summer Winter Year Summer Winter MW MW MW MW 2020 227 224.4 2020 4,589 4,667 2021 228 225.9 2021 4,619 4,698 2022 229 227.7 2022 4,650 4,727 2023 230 230.2 2023 4,675 4,733 2024 231 234.0 2024 4,685 4,758 2025 232 239.4 2025 4,709 4,782 2026 233 248.9 2026 4,734 4,802 2027 234 261.1 2027 4,759 4,815 2028 235 275.4 2028 4,784 4,826 2029 236 276.4 2029 4,805 4,875 2030 237 277.4 2030 4,853 4,931 2031 238 278.4 2031 4,908 4,987 2032 239 279.4 2032 4,962 5,039 2033 240 280.4 2033 5,016 5,094 2034 241 281.4 2034 5,068 5,146
B. Economic Scenario Analysis The Company analyzed the sensitivity of its sales growth rate as required by § 58-37-
40(B)(1)(a) under Act No. 62. The forecasted growth rate in sales over the 15-year IRP planning
horizon of 2020-2034 is 0.5%. To develop a low growth scenario, DESC analyzed the first time
it experienced a 15-year negative growth rate which was in 2019 with a compounded annual
growth rate of (0.1) %. During this period 2004-2019, DESC lost several wholesale customers.
When the growth rate is adjusted for this unusual loss, the growth rate increases to 0%. Given
that the State of South Carolina has experienced strong economic growth in recent years, a
growth rate of 0% over the long term is highly unlikely. Therefore, the average of this 0% and
the base case growth rate of 0.5% was used in the low growth scenario. The low growth rate
then is 0.25%. For the high growth scenario, DESC analyzed its growth rate experience prior to
the Great Recession which occurred from December 2007 through June 2009. The 15-year
growth rates experienced by the Company during this period included a high of 3.4% and a low
of 2.7% occurring just prior to the recession, i.e., over the period 1992-2007. When analyzing

11
the detail behind the 2.7% growth rate, the residential and commercial customer growth rates
were unusually high, due in part to the housing bubble leading to the recession. Also, the growth
in wholesale sales was unreasonable as a proxy for the future because of changes in that class.
When the 2.7% was adjusted for these components, the growth rate dropped to 1.7% and was
selected as the high growth rate for this scenario analysis. While it is certainly true that DESC’s
sales could grow less than the low rate of 0.25% or more than the high rate of 1.7%, these rates
represent reasonable ranges for the sales forecast. The changes in sales and peak demands from
the base case are shown in the following table.
Annual Energy Forecast and Seasonal Peak Demand Change from Base Forecast
for High and Low DSM
High Scenario: Change from Base Low Scenario: Change from Base
Annual Peak Demands Annual Peak Demands
Year Sales Summer Winter Year Sales Summer Winter
GWh MW MW GWh MW MW
2020 0.0 0.0 0.0 2020 0.0 0.0 0.0
2021 297.9 59.9 60.9 2021 -49.8 -10.0 -10.2
2022 598.0 121.4 123.3 2022 -99.2 -20.1 -20.5
2023 905.1 184.2 186.4 2023 -149.1 -30.4 -30.7
2024 1214.1 247.7 251.6 2024 -198.6 -40.5 -41.1
2025 1531.5 313.2 318.3 2025 -248.7 -50.9 -51.7
2026 1856.1 380.1 386.5 2026 -299.2 -61.3 -62.3
2027 2186.3 448.6 456.1 2027 -349.9 -71.8 -73.0
2028 2521.5 518.6 527.1 2028 -400.7 -82.4 -83.8
2029 2864.6 589.7 602.6 2029 -451.9 -93.0 -95.1
2030 3227.9 665.7 681.2 2030 -505.5 -104.2 -106.7
2031 3602.1 745.0 762.3 2031 -560.0 -115.8 -118.5
2032 3993.9 826.6 845.3 2032 -616.3 -127.6 -130.4
2033 4394.6 910.6 931.2 2033 -673.2 -139.5 -142.7
2034 4804.4 996.9 1019.1 2034 -730.6 -151.6 -155.0
C. Wholesale Sales Scenario Analysis
Wholesale energy sales represent about 3.6% of the Company’s total sales. Wholesale
customers are served by the Company through negotiated long-term power supply contracts.
For periods of time beyond the terms of the existing long-term power supply contracts, the
Company has to compete with other power suppliers for the wholesale customers’ business. The
CORRECTED

12
Company plans to successfully renew these contracts with current customers and has included
the load in its forecast. The table below shows the level of sales and peak demand attributed in
its forecasting process to the Company’s wholesale business in its base forecast.
Wholesale Portion of Base Forecast
Annual Peak Demands Year Sales Summer Winter GWh MW MW 2020 871.0 148 147 2021 871.0 148 147 2022 873.0 149 147 2023 876.3 149 148 2024 879.6 150 148 2025 882.9 151 149 2026 886.3 151 150 2027 889.8 152 150 2028 893.3 153 151 2029 896.8 154 152 2030 900.3 154 152 2031 903.9 155 153 2032 908.0 156 154 2033 912.1 157 155 2034 916.2 157 156
D. Electric Vehicle Scenario Analysis Electric vehicles have become more common as technology and customer desires change.
Various automotive original equipment manufacturers (“OEMs”) have released more EV models
for sale to the public in the Company’s service territory. While the overall penetration of EVs
has been somewhat low, recent registration data from the South Carolina Department of Motor
Vehicles (“DMV”) demonstrates steady growth with a total of 4,145 electric vehicles registered
in the state as of mid-year 2019, compared to 2,652 in mid-year 2018 (50% growth rate). This
growth coincided with the availability of the popular Model 3 Tesla for purchase. The Company
did not augment its 2020 IRP load forecast to account for additional load from EVs; therefore, it
should be considered conservative. The forecast only includes incremental load from EVs that is
imbedded in history. The next few years will provide the Company with a better understanding

13
about EVs and their impact on the SC energy markets. Load forecasts included in future
Company IRPs will include a specific adjustment to account for EV incremental growth.
Before discussing EV scenarios, it is important to understand that a scenario is not a
forecast, and it is not a prediction of the future. A scenario analysis is only a “What if” analysis.
The EV market in South Carolina is emerging but the data cannot yet be relied upon to make
meaningful predictions. However, the scenario analysis is still worth performing because EV
market penetration is not a question of “if” but a question of “when”. The Company is still in the
process of refining its methods for forecasting incremental electric demand growth resulting
from the expected increase of EVs in the marketplace. Below a linear analysis was completed
meaning demand for EVs would grow evenly over time; however, EV demand growth could be
nonlinear or even exponentially higher.
The following table shows an estimate of the number of registered vehicles in DESC’s
territory. It assumes 2.1 vehicles per household applied to the DESC’s residential customer
forecast. A distinction is not made between two types of EVs: battery electric vehicles (“BEV”)
and plug-in electric vehicles (“PHEV”). PHEVs run on both electricity and gasoline. Three
scenarios are defined by an assumed EV market share at the end of the IRP planning period. The
three assumed ending market shares are: 1%, 5% and 10%. The table shows the number of EVs
in DESC’s service area under each scenario.

14
EVs within DESC by Scenario EV Scenarios
Year DESC 2034 Saturation Scenario Vehicles 1% 5% 10%
2020 1,356,174 1,085 1,085 1,085 2021 1,375,662 1,293 2,256 2,806 2022 1,393,867 1,505 3,457 4,572 2023 1,411,311 1,722 4,686 6,379 2024 1,428,727 1,943 5,944 8,229 2025 1,446,356 2,170 7,232 10,124 2026 1,464,460 4,100 13,180 22,846 2027 1,482,268 6,077 19,269 35,871 2028 1,499,629 8,098 25,494 49,188 2029 1,516,523 10,161 31,847 62,784 2030 1,532,794 12,262 38,320 76,640 2031 1,550,199 13,177 48,444 96,887 2032 1,567,528 14,108 58,782 117,565 2033 1,584,626 15,054 69,327 138,655 2034 1,601,342 16,013 80,067 160,134
An approximation of the amount of electric power these EVs will need can be calculated
by assuming two quantities: the number of miles driven each year, i.e., 15,000 miles and the
number of miles per kWh required, i.e., 4 miles per kWh. The following table shows the results
of these assumptions on energy sales over the IRP planning horizon. Customers on the DESC
system require about 25,000 GWh per year so in the early years serving these EV sales will not
require an immediate adjustment to the resource plan.

15
EV Energy Sales in 2034 (GWh) 2034 Saturation Scenarios
Year 1% 5% 10% 2020 4.1 4.1 4.1 2021 4.8 8.5 10.5 2022 5.6 13.0 17.1 2023 6.5 17.6 23.9 2024 7.3 22.3 30.9 2025 8.1 27.1 38.0 2026 15.4 49.4 85.7 2027 22.8 72.3 134.5 2028 30.4 95.6 184.5 2029 38.1 119.4 235.4 2030 46.0 143.7 287.4 2031 49.4 181.7 363.3 2032 52.9 220.4 440.9 2033 56.5 260.0 520.0 2034 60.1 300.3 600.5
To derive a table of on-peak MW demand, the Company made certain assumptions. It is
assumed that with Level 1 charging, it takes 10 hours on average to fully charge the vehicle’s
battery while with Level 2 charging, it takes 3 hours. A Level 1 charger charges at 120 volts
while a Level 2 charger charges at 240 volts. While the amperage varies and has been increasing,
a reasonable assumption is to assume a maximum charge of 1.4 kW for Level 1 charging and 9.6
kW for Level 21. Of course, the number of hours to charge will vary with the car and the size of
its battery and its power acceptance rate. Another assumption is the split between Level 1 and
Level 2 charging and the percent of on-peak charging. For the three scenarios of 1%, 5% and
10%, it is assumed that the percent of Level 1 charging is 80%, 50% and 20% respectively and
the MW on-peak percentages are 50%, 30% and 20%. It is assumed that with a higher saturation
of EVs DESC will design a time of use rate that provides a more significant advantage to off-
peak charging. The adjacent table shows the results of these assumptions.
1 There are Level 3 chargers, which include direct current fast chargers, that can charge at rates between 50 kW and 350 kW and possibly larger.

16
EV Peak Demand (MW) 2034 Saturation Scenarios
Year 1% 5% 10% 2020 0.6 0.5 0.5 2021 0.8 1.1 1.3 2022 0.9 1.6 2.1 2023 1.0 2.2 3.0 2024 1.2 2.8 3.8 2025 1.3 3.4 4.7 2026 2.4 6.2 10.7 2027 3.6 9.1 16.8 2028 4.8 12.1 23.0 2029 6.1 15.1 29.3 2030 7.3 18.2 35.8 2031 7.9 23.0 45.2 2032 8.4 27.9 54.9 2033 9.0 32.9 64.8 2034 9.6 38.0 74.8
There are four other EV markets to consider: transit buses, school buses, off-road
vehicles and commercial fleet vehicles. Charleston Area Regional Transportation Authority has
placed 3 Proterra transit buses in service as of January 2020 with 3 more being delivered in
January 2021. Each bus will require an estimated 80,000 kwh per year and a peak demand of 125
KW.
DESC expects EVs to have the largest initial impact on distribution systems in urban
growth areas. Although much of the DESC service territory is rural, the Charleston Metropolitan
area is already seeing EV growth. The overall demographics, DESC’s partnership with the
Charleston Area Regional Transportation Authority, and plans by private entities to add larger
more robust charging stations in the Charleston area and along major transportation corridors in
South Carolina are helping EV growth. The Company anticipates the strong growth in urban
Charleston will continue to gain strength. This year will be a pivotal year for EV sales with 40
models of plug-in EV’s already offered, and 14 newer and more attractive models being
introduced for 2020. As battery prices are decreasing and driving down the cost of EVs, they
will appeal to broader cross section of South Carolina customers. Like Charleston, adoption
rates are expected to increase in markets like Columbia, Hilton Head and Aiken. The local
distribution impacts will certainly require additional planning and investments. A single Tesla

17
supercharger charging bay has a maximum rated output of 250 kW (350 kW stand-alone) which
is almost 40 times that of a residential water heater. Commonly arranged in eight charging bays,
the supercharger station could demand 1 MW of new load in a single location. Urban
distribution systems will need automation and hardening in the next few years.

18
II. DESC’s Program for Meeting Its Demand and Energy
Forecasts in an Economic and Reliable Manner A. Demand Side Management
DSM can be broadly defined as the set of actions that can be taken to influence the level
and timing of the consumption of energy. There are two common subsets of Demand Side
Management: Energy Efficiency and Load Management (also known as Demand Response).
Energy Efficiency typically includes actions designed to increase efficiency by maintaining the
same level of production or comfort but using less energy input in an economically efficient way.
Load Management typically includes actions specifically designed to encourage customers to
reduce usage during peak times or shift that usage to other times.
1. Energy Efficiency
DESC’s Energy Efficiency programs include the portfolio of Demand Side Management
Programs, and Energy Conservation. A description of each follows:
a. Demand Side Management Programs: Beginning in 2018, DESC, through
independent third-party consultants, conducted a comprehensive potential study and
DSM program analysis. By Commission Order No. 2019-880, dated December 20, 2019,
the Commission approved the suite of ten modified, expanded and new DSM programs,
which was identified by the 2019 Potential Study, for the next five years beginning in
2020. Eight of these programs are an expansion or modification of existing programs,
and two are new programs. The program impacts identified in the 2019 Potential Study
are also the basis for the Medium DSM case in the Resource Plan Analysis. The
portfolio includes seven (7) programs targeting DESC’s residential customer classes and
three (3) programs targeting commercial and industrial customer classes that have not
opted out of the DSM rider. A description of each program follows:
1. Residential Home Energy Reports provides customers with monthly/bi-monthly
reports comparing their energy usage to a peer group and providing household
information to help identify, analyze and act upon potential energy efficiency
measures and behaviors. Participants are solicited via direct-mail and e-mail
campaigns under an opt-in approach. Per the results of the 2019 Potential Study,
the program will begin the necessary activities to phase down existing participants
19
in the current opt-in model and then phase in an opt-out program model which
will include expanding participation. It is expected that by 2023, the program will
have completed the full transition to opt-out.
2. Residential Home Energy Check-up provides customers with a visual energy
assessment performed by DESC staff at the customer’s home. At the completion
of the visit, customers are offered an energy efficiency kit containing simple
energy conservation measures, such as energy efficient bulbs, water heater wraps
and/or pipe insulation. The Home Energy Check-up (Tier 1) is provided at no
additional cost to all residential customers who elect to participate. Per the results
of the 2019 Potential Study, DESC will begin developing an implementation
timeline for a Tier 2 component. Tier 2 will include customer incentives for the
installation of energy efficiency measures that aim to increase efficient operation
of the house.
3. Residential EnergyWise Savings Store incentivizes residential customers to
purchase and install high-efficiency ENERGY STAR® qualified lighting products
by providing deep discounts directly to customers. In 2019, DESC continued to
offer lighting incentives via an online store, in addition to providing energy
efficiency lighting kits to customers at various business office locations,
community events and via direct mail. New to the online store, DESC introduced
smart thermostats to provide deeper heating and cooling savings to participants.
4. Residential Heating & Cooling Program provides incentives to customers for
purchasing and installing high efficiency HVAC equipment in existing homes.
Additionally, the program provides residential customers with incentives to
improve the efficiency of existing air conditioning and heat pump systems
through complete duct replacements, duct insulation and duct sealing. Per the
results of the 2019 Potential Study, the program will be adding heat pump water
heaters, increasing heating and cooling equipment and duct work improvement
rebate amounts to encourage participation. An additional new offering will
include a rebate for replacing electric resistant heat with a heat pump.
5. Neighborhood Energy Efficiency Program (“NEEP”) provides income-
qualified customers with energy efficiency education and direct installation of
multiple low-cost energy conservation measures as part of a neighborhood door-

20
to-door sweep approach to reach customers. In 2019, neighborhoods in
Walterboro, Holly Hill, Charleston and North Charleston participated in the
program. Additionally, the NEEP Program continued offerings to mobile and
manufactured homes to include additional measures specific to this housing
stock. Per the results of the 2019 Potential Study, NEEP will increase customer
participation by increasing the number of neighborhoods, increasing penetration
into selected neighborhoods and selecting larger neighborhoods,
6. Residential Appliance Recycling Program provides incentives to residential
customers for allowing DESC to collect and recycle less efficient, but operable,
secondary refrigerators, and/or standalone freezers, permanently removing the
units from service. Per the results of the 2019 Potential Study, the program will
focus on increasing participation through increased marketing and promotional
events.
7. Residential Multifamily program will focus on helping customers living in non-
single-family dwellings, as well as apartment building owners and managers,
overcome the split-incentive and other market barriers to residential energy
efficiency. The split incentive barrier exists in rental situations: non-occupant
building owners are less inclined to make efficiency upgrades when they do not
pay efficiency bills, and renters are less likely to make efficiency upgrades
because they do not own their dwelling. The program will achieve this goal by
directly installing LEDs and water-saving measures in apartments, and by
providing high incentives for building common area measures, such as lighting
and HVAC upgrades. Although the Neighborhood Energy Efficiency and Home
Energy Check-up programs both include multifamily units, the specific targeting
of multifamily properties is a new effort and program for DESC.
8. EnergyWise for Your Business Program provides incentives to non-residential
customers (who have not opted out of the DSM rider) to invest in high-efficiency
lighting and fixtures, high efficiency motors and other equipment. To ensure
simplicity, the program includes a master list of prescriptive measures and
incentive levels that are easily accessible to commercial and industrial customers
on DESC’s website. Additionally, a custom path provides incentives to
commercial and industrial customers based on the calculated efficiency benefits

21
of their energy efficiency plans or new construction proposals. This program
applies to technologies and applications that are more complex and customer
specific. All aspects of this program fit within the parameters of retrofits,
building tune-ups and new construction projects. Per the 2019 Potential Study,
the program will increase customer participation and determine an
implementation timeline for offering two new components: Agricultural and
Strategic Energy Management.
9. Small Business Energy Solutions Program is a turnkey program, tailored to
help owners of small businesses manage energy costs by providing incentives for
energy efficiency lighting and refrigeration upgrades. The program is available to
DESC’s small business and small nonprofit customers with an annual energy
usage of 350,000 kWh or less, and five or fewer DESC electric accounts. Per the
results of the 2019 Potential Study, DESC will increase the incentive levels to
reduce the barrier to entry for small business customers.
10. Municipal LED Lighting program will offer municipalities in the DESC service
territory incentives to replace street lighting with high efficiency LED streetlights.
The incentives will allow for a financially neutral option for municipalities to
convert while improving performance, providing remote monitoring/outage and
better overall customer experience. This is a new program that DESC anticipates
will be well received by municipalities.
b. Energy Conservation: Energy conservation is a term that has been used
interchangeably with energy efficiency. However, energy conservation has the
connotation of using less energy in order to save rather than using less energy to perform
the same or better function more efficiently. The following is an overview of each DESC
energy conservation offering:
i. Energy Saver / Conservation Rate: Rate 6 (Energy Saver/ Conservation)
rewards homeowners and homebuilders with a reduced electric rate when they
upgrade existing homes or build new homes to a high level of energy efficiency.
ii. Seasonal Rates: Many of our rates are designed with components that vary by
season. Energy provided in the peak usage season is charged a premium to
encourage conservation and efficient use.

22
2. Load Management Programs
The primary goal of DESC’s load management programs is to reduce the need for additional
generating capacity. There are four existing load management programs: Standby Generator
Program, Interruptible Load Program, Real Time Pricing Rate and the Time of Use Rates. A
description of each follows:
a. Standby Generator Program: The Standby Generator Program for wholesale
customers provides about 27 MW of peaking capacity that can be called upon when
reserve capacity is low on the system. This capacity is owned by DESC’s wholesale
customers and is made available to DESC System Controllers through contractual
arrangements. DESC has a retail version of its standby generator program in which
DESC can call on participants to run their emergency generators. This retail program
provides approximately 10 MW of additional capacity when called upon.
b. Interruptible Load Program: DESC has over 200 megawatts of interruptible
customer load under contract. Participating industrial customers receive a discount
on their demand charges for shedding load when DESC is short of capacity.
c. Real Time Pricing (“RTP”) Rate: A number of customers receive power under
DESC’s real time pricing rate. During peak usage periods throughout the year when
capacity availability is low in the market, the RTP program sends a high price signal
to participating customers which encourages conservation and load shifting.
Alternatively, during high capacity availability periods, prices are lower.
d. Time of Use Rates: DESC’s time of use rates contain higher charges during the peak
usage periods of the day and lower charges during off-peak periods. This encourages
customers to conserve energy during peak periods and to shift energy consumption to
off-peak periods. All DESC customers have the option of purchasing electricity
under a time of use rate.
e. Winter Peak Clipping: An investigation of winter peaking programs was performed
as part of the 2019 Potential Study. DESC, through independent third-party
consultants, modeled a suite of new direct load control and other measures for
residential and commercial customers that would rely on AMI being installed.
Within the five-year program planning cycle, none of these new DR programs were
found to be cost-effective and thus none were pursued further due to the cost of

23
installing AMI as a DSM program expense. However, the 2019 Potential Study
showed that a rollout of AMI system-wide outside of the DSM context would support
additional expansion of these DR programs. The study indicated that, with a
sufficient saturation of AMI in place, Time of Use and Critical Peak Pricing could be
cost effective. In absolute terms, by winter 2029, an additional 43 MW could be
achieved. Program plans will be assessed as the installation of AMI meters reaches
an appropriate level of saturation and can support cost-effective DR programs.
B. Supply Side Management
1. Existing Sources of Clean Energy
Clean Energy at DESC: Clean energy includes nuclear power, hydro power, some forms of
combined heat and power, and renewable energy. Over the planning horizon, DESC expects
societal trends toward clean energy to continue. Technological improvements and innovation
in areas like renewable natural gas, carbon capture, energy storage, energy efficiency and
hydrogen are likely to progress in the future. DESC intends to utilize more power generated
from clean energy sources while assuring that electricity continues to be safe, reliable and
affordable. DESC will continue to monitor the trends toward clean energy to identify
approaches to providing customers a path to clean energy while maintaining the standard of
reliability and affordability necessary to fuel South Carolina’s modern economy.
Current Generation: DESC utilizes clean energy generated by hydro, nuclear and solar.
a. Solar Power: DESC has PPA’s with utility scale solar energy providers totaling 641
MW-AC currently in commercial operation in addition to over 95 MW of customer scale
solar installations interconnected to its grid. The utility scale supply is expected to grow
to 973 MW by December 2020.
b. Hydro-Power: DESC owns five hydroelectric generating plants, one of which is a
pumped storage facility, that combine for a total of 802 MW of clean capacity in the
winter and 794 MW in the summer. The Saluda Hydro plant in Irmo, SC has a
generating capacity of 198 MW. Saluda Hydro was put into service in 1930 and in
August 2008 DESC filed an application requesting a new fifty-year license with the

24
Federal Energy Regulatory Commission (“FERC”). The Company is still waiting for the
issuance of this new license. In June 2019, DESC filed an application with the FERC
requesting a new fifty-year license for the Parr Hydroelectric Project, which consists of
the Parr Shoals Development and Fairfield Pumped Storage Development. The current
license expires in June 2020. This project is critical for the future of DESC’s generation
portfolio. With the increased adoption rate of non-dispatchable, intermittent solar
generation on the DESC system, Fairfield Pumped Storage is an important asset for grid
stability, reliability and power quality for DESC customers. In 2019, DESC’s
hydroelectric plants produced 288.1 gigawatt-hours (“GWh”) of clean energy for SC
customers. DESC’s pumped storage facility, Fairfield Pumped Storage, has a net
dependable generating capacity of 576 MW and is a valuable asset to the DESC
generation fleet. Fairfield Pumped Storage contributed 469.5 gigawatt-hours (“GWh”) in
2019 and has been a reliable resource for responding to rapid load changes on the DESC
system. In 2018, the Company started the process of relicensing the Stevens Creek
Hydroelectric Project which expires in October 2025. DESC will file an application with
the FERC by October 2023 requesting a new fifty-year license for this project. This
project provides fairly constant generation as it re-regulates the releases from the US
Army Corps of Engineers J. Strom Thurmond Hydroelectric Project.
c. Nuclear Power: Unit 1 at the V. C. Summer Nuclear Station (“VCSNS”) produces a
substantial amount of clean energy and has a significant beneficial impact on the
environment. The Unit came online in January 1984 and has a capacity of 971 MW with
DESC owning 650 MW (two-thirds of the output of the facility) and Santee Cooper
owning the balance. DESC received a 20-year extension to its original operating license
in April 2004 and will enter its period of extended operation in 2022, since it is now
licensed to operate until August 2042. Once VCSNS enters its period of extended
operation, DESC expects to request and receive approval of a subsequent license renewal,
extending its licensed operation to 2062. In 2019, Unit 1 produced over 5,720 gigawatt-
hours (“GWh”) of clean base load energy, which represented 20% of DESC’s energy
production. Over these next 22 years Unit 1 should produce approximately 110,000 GWh
of clean base load energy for DESC. Nuclear generation currently displaces
approximately 3.2 million tons per year of CO2 that would be emitted if replaced by fossil
resources.

25
2. Distribution Resource Plans
DESC is participating in activities seeking to advance technologies in grid
transformation.
Smart Grid Activities:
Advanced Metering Infrastructure: DESC currently has approximately 30,000
AMI meters that are installed predominately on medium and large commercial/industrial
customers and all accounts with customer generation (net metering). They are also used
for accounts on time-of-use or demand rates. These meters utilize public wireless
networks as the communication backbone and have full two-way communication
capability. Meter readings and load profile interval data are remotely collected daily from
all AMI meters. In addition to traditional metering functions, the technology also
provides real-time monitoring capability including power outage/restoration, meter/site
diagnostics, and power quality monitoring. Load profile data is made available to
customers daily via web applications enabling these customers to have quick access to
energy usage allowing better management of their energy consumption. DESC is in the
early implementation stage for mass AMI technology for all electric meters with full
scale deployment scheduled to begin in 2020. Deployment plans have meter installations
ramping from 10,000 meters per month to 35,000 meters per month over the next three
years. Depending on customer growth, the final total meter count will be just over
765,000 AMI meters installed in the DESC service territory. This expands the
opportunity to field Home Area Network devices that communicate via AMI meters.
This project will allow DESC to offer and customers to participate in demand response,
demand shifting, and demand shedding programs around load control devices including
water heaters, HVAC systems, pool pumps and electric vehicle chargers.
Distribution Automation: DESC is continuing to expand Supervisory Control
and Data Acquisition (“SCADA”) switching and other intelligent devices throughout the
system. DESC has approximately 1,100 SCADA switches and reclosers, most of which
can detect system outages and operate automatically to isolate sections of line with
problems thereby minimizing outage times and limiting affected customers. Some of
these isolating switches can communicate with each other to determine the optimal

26
configuration to restore service to as many customers as possible without operator
intervention. DESC continues to evaluate systems that will further enable these
automated devices to communicate with each other and safely reconfigure the system in a
fully automated fashion, let operators know exactly where the faulted section of a line is,
and monitor the status of the system as it is affected by outages, switching, and customer
generation (solar). As distributed renewable generation proliferates in the system,
identifying issues such as voltage control and load flows are imperative to maintaining
reliability now and for future grid stability planning.
3. Future Clean Energy
a. Hydro-Power: DESC plans to continue to rely on clean dispatchable power from all
of the existing hydro and pumped storage units through successful completion of the
relicensing processes of Saluda, Parr, and Stevens Creek hydroelectric projects and
Fairfield Pumped Storage Facility.
b. CO2 and Methane Goals: As one of the nation's largest producers and transporters of
energy, Dominion Energy is committed to providing safe, reliable, affordable and
sustainable delivery of energy to its customers. The Dominion Energy expects to cut the
electric generating fleet’s carbon dioxide emissions 55 percent by 2030 relative to 2005
emissions and reduce methane emissions from its gas assets 65 percent by 2030, 80
percent by 2040, both relative to 2010 emission levels. Dominion Energy has further
committed to achieve net zero CO2 and methane emissions from its electric generation
and natural gas infrastructure operations by 2050. To the extent possible, subject to
South Carolina stakeholder processes, DESC plans to participate in efforts to meet these
corporate commitments.

27
c. Renewables: The following table provides a projection of renewable generation from
signed PPAs as used in DESC Resource Plan #2 in the Resource Plan Analysis
section.
Resource Plan 2 Renewable Energy by Year (GWh)
Year GWh 2020 1,609 2021 2,032 2022 2,034 2023 2,034 2024 2,034 2025 2,034 2026 2,030 2027 2,032 2028 2,042 2029 2,032 2030 2,032 2031 2,034 2032 2,036 2033 2,034 2034 2,034
DESC has 973 MW-AC of solar capacity currently under executed PPAs. The
preceding table shows the amount of energy projected to be generated by these renewable
facilities in each of the 15 years of the IRP planning horizon. Please note, all 973 MW-
AC of capacity is expected to be online by January 2021 and the table does not take into
consideration solar projects in development without a PPA at this time. Retiring coal-
fired generation has the greatest impact on CO2, and some of that energy can be supplied
by additional solar generation. Still, as hundreds and thousands of solar panels are added,
significant transmission and distribution upgrades along with a combination of energy
storage and quick start combustion turbines will be required on the electric grid due to
intermittency.
Photovoltaic solar generation systems are quite different from traditional supply-
side resources like coal, nuclear, and natural gas-fired power plants. All levels of the
existing electric infrastructure, standards and operating protocols were originally
designed for a dispatchable generation fleet, and the system is having to adapt to integrate

28
these new resources. Solar generation systems, in contrast, only produce electricity when
the sun is shining; therefore, energy output is variable and cannot be dispatched.
As a NERC registered Balancing Authority, DESC must maintain real time load-
interchange-generation balance within its Balancing Authority Area (“BAA”) between
customer demand and generation (which can include traditional coal, nuclear, gas, and
hydro, as well as solar resources and off-system purchases). The criteria within which
the Company must operate are defined by multiple NERC Reliability Standards and
require the Company to maintain a balance of resources and demand within defined
limits. Variability in solar generation can cause sudden swings in this balance and can
result in both reliability issues and NERC Standards Violations if operators’ actions are
insufficient. To counter the swings caused by solar generators, the Company must
maintain complementary dispatchable generation online and available to respond to
reliability events created by sudden swings in solar generation output.
In particular, downward ramp rates for PV solar generators are nearly
instantaneous when cloud cover rolls over panels, so the Company must have
compensating supply-side resources online or ready to respond with quick start times and
fast ramp rates. For this reason, operating reserves from slow moving coal units are not
adequate, making other quick moving resources including pumped storage facilities,
batteries and quick start combustion turbines more critical and necessary as intermittent
resources are added.
From a supply standpoint, the BAA peak load is approximately 5,000 MW, but
loads at this level are only seen a few hours each year. These peak loads occur late in the
afternoon on the hottest July and August days, or the coldest early morning hours in
January or February just before sunrise. For the Company’s 2019 summer peak of 4,714
MWh, PV generation directly connected to the Company’s transmission and distribution
system contributed 264 MW-AC or 52% of its installed capacity, while for the winter
peak of 4,087 MWh to date in 2020 (mild winter), solar generation contributed 9 MW-
AC or 1.4% of installed capacity toward meeting the peak. The remainder of load in both
scenarios (4,450 MWh in July and 4,078 MWh in January) was balanced with traditional
Company generation and off system purchases. At a minimum, these numbers
demonstrate that capacity from solar generation is out of sync with peak loads in the
winter and only partially in sync in the summer. Therefore, large amounts of energy

29
storage and dispatchable generation must be available to respond to load demand and
reliability events on peak days because solar cannot functionally provide that reliability
benefit alone.
Quick start, flexible, and reliable combustion turbines are especially critical for
capacity and energy supply in the winter. Winter peak demand occurs in the morning and
often before sunrise when solar resources are not producing. The issue is further
impacted by the fact that in the winter the days are shorter meaning batteries have less
charging time. Combustion turbines can cost-effectively meet this peak need when solar
plants are producing little or no output. In situations where it is not only cold but also
cloudy, as often happens in the winter, combustion turbines provide the energy supply
needs of our customers into the day. Another critical energy situation exists when it is
cloudy for several days in a row. In this situation, very little solar power is being
produced for days. For systems with heavy reliance on solar resources, several cold and
cloudy days in a row will be a reliability design issue. A cost-effective strategy must be
in place to replace renewable energy during these events. Even batteries paired with
solar will not solve the very real and not so distant problem of low solar output for
several cloudy days with high demands. Efficient, reliable, combustion turbines are an
essential facet of a low carbon future.
DESC anticipates increasing levels of renewable resources along with the
research and innovation that will make reliable operations possible. Technical advances
must be implemented with regard to cost and reliability and in conjunction with
established flexible technologies. The incremental implementation of solar and storage
technology with moderate additions over several years will allow the electric grid to
adapt to operational impacts in a cost-effective manner.
d. Cogeneration/Combined Heat and Power: The Company is open to combined heat
and power that provides clean energy or improved efficiency should a specific project
present itself. Combined heat and power projects are highly dependent upon the steam
user’s individual steam requirements and are therefore impossible to accurately model as
a generic project. The Company is open to customer-sited generation opportunities; this
includes siting generation assets to supply critical infrastructure during system
emergencies including (but not limited to): military installations, hospitals, universities,
and major government facilities. Such distributed generation assets can also be used for

30
operation during system peak periods. Both Resource Plan 1 (“RP1”) and RP2 could be
configured to be a cogeneration plan to utilize the waste heat produced.
e. Energy Storage: Energy storage is critical to providing continued reliability for our
customers as we expand our renewable portfolio. There are several types of energy
storage technologies including pump storage, capacitors, compressed air, flywheels and
batteries. Except for pump storage and batteries, most of these technologies are not yet
cost competitive. Pump storage requires specific land features and lengthy permitting;
therefore, this IRP focuses on batteries in conjunction with its existing Fairfield Pump
Storage Facility.
The Company continues to evaluate storage as an option to manage minimum
loads and integrate increasing levels of renewables onto the system. Because solar
generates when the sun is shining and doesn’t generate when the sun is not shining, its
generation does not always correspond with the system’s need for generation. Energy
storage can enable the utility to shift solar energy from periods when it’s not needed.
These minimum and maximum load issues are most visible in the winter. The winter
peak occurs in the early morning before the sun comes up. After the sun comes up, in the
winter, the load begins to drop as temperatures begin to rise. Solar generation increases as
the load drops. This is an example of a minimum load issue that could be resolved by
storing solar energy. This stored solar energy can be used to help meet maximum loads
during a later period when solar is not generating. Battery storage has made significant
strides in recent years, in both efficiency and cost but it is still in the early stages of
utility-scaled deployment.

31
4. Supply Side Resources at DESC
a. Existing Supply Resources: DESC currently owns and operates two (2) coal-fired steam
plants, one (1) dual-fuel coal and/or natural gas-fired steam plant, two (2) natural gas-
fired steam plants, three (3) combined cycle gas turbine/steam generator plants (gas/oil
fired), seven (7) peaking turbine facilities, four (4) hydroelectric generating plants, and
one pumped storage facility. The total fossil-hydro generating capability rating of these
facilities is 5,001 MW in summer and 5,248 MW in winter. These ratings, which are
updated at least on an annual basis, reflect the expectation for the coming summer and
winter seasons. When DESC includes its nuclear capacity (650 MW in summer and 662
MW in winter), additional capacity (20 MW) provided through a contract with the
Southeastern Power Administration and solar capacity, the total supply capacity for 2020
is 6,507 MW in summer and 6,905 MW in winter. This is summarized in the table on
Page 33.
Solar only contributes a portion of its capacity toward the summer peak and
virtually none of its capacity toward the winter peak. This difference is because the solar
profile and DESC’s load profile are not congruent. Summer peaks happen in the
afternoon after solar generation has begun to decline and winter peaks happen in early
mornings before solar begins to generate. The Company continues to assess combining
solar technology with batteries and other storage technology to optimize the amount of
solar generation that can efficiently serve the Company’s peak load demand.
The bar chart below shows DESC’s actual 2019 relative energy generation and
relative capacity by fuel source. This information includes the summer and winter
capacity contribution of Solar PPAs which was 3% of summer capacity and 0% of winter
capacity.

32
DESC 2019 Resource Relative Production
The purpose of this chart is to emphasize the resources that have provided the
highest capacity contribution on peak and the most energy supply over a year. Hydro
resources provided disproportionately higher capacity value while the nuclear plant
contributed well to capacity and extremely well for energy supply. Thermal resources
continued to contribute significantly to both energy and capacity needs. Without storage
capability, the solar contribution to on peak capacity is low.
45%
26%
23%
3%
3%
43%
30%
11%
13%
3%
46%
29%
11%
14%
0%
0% 5% 10% 15% 20% 25% 30% 35% 40% 45% 50%
Gas
Coal
Nuclear
Hydro
Solar
2019 Resource Mix
Winter Capacity Summer Capacity Generation

33
Existing Long-Term Supply Resources
The following table shows the DESC available generating capacity in 2020.
In-Service Probable Retirement1 Summer 2020 Winter 2020
Date Date (MW) (MW) Coal-Fired Steam: Wateree – Eastover, SC 1970 2044 684 684 Williams – Goose Creek, SC2 1973 2047 605 610 Cope4 - Cope, SC 1996 2071 415 415 Total Coal-Fired Steam Capacity 1,704 1,709 Gas-Fired Steam: McMeekin – Irmo, SC 1958 2028 250 250 Urquhart – Beech Island, SC 1954 2028 95 96 Total Gas-Fired Steam Capacity 345 346 Nuclear: V. C. Summer - Parr, SC 1982 2062 650 662 Gas Turbines: Hardeeville, SC 1968 2018 0 0 Urquhart 1,2,3 – Beech Island, SC 1969 2044 39 48 Urquhart 4 – Beech Island, SC 1999 2059 48 49 Coit – Columbia, SC 1969 2029 26 36 Parr, SC 1970 2030 60 73 Williams – Goose Creek, SC 1997 2057 40 52 Hagood 4 – Charleston, SC 1991 2051 88 99 Hagood 5 – Charleston, SC 2010 2070 18 21 Hagood 6 – Charleston, SC 2010 2070 20 21 Urquhart Combined Cycle – Beech Island, SC 2002 2077 458 484 Jasper Combined Cycle – Jasper, SC 2004 2079 852 924 CEC Combined Cycle – Columbia, SC 2004 2079 519 586
Total I.C. Turbines Capacity 2,168 2,393 Hydro: Neal Shoals – Carlisle, SC 1905 2055 3 4 Parr Shoals – Parr, SC 1914 2064 7 12 Stevens Creek - Near Martinez, GA 1929 2079 8 10 Saluda - Irmo, SC 1932 2082 198 198 Fairfield Pumped Storage - Parr, SC 1978 2128 576 576 Total Hydro Capacity 792 800 Solar:3
Company Owned 2011 2031 2.4 2.4 PPA DER Program 2015-2019 2039 64 64 PPA Non-DER Program, 2017-2020 2040 762 909
Total Solar Capacity 828 975 Other:
Southeastern Power Administration (SEPA) 20 20
Grand Total (Name Plate): 6,507 6,905 Notes: 1. Probable retirement dates are based on the 2014 Depreciation Study. 2. Williams Station is owned by South Carolina Generation Company (“GENCO”), a wholly-owned subsidiary of SCANA
Corporation which is a wholly-owned subsidiary of Dominion Energy, Inc. and GENCO’s electricity is sold exclusively to DESC. 3. Solar MW are nameplate values and do not represent the contribution to peak demand. 4. Cope Station is dual fuel and is run on both coal and natural gas.

34
b. Limitations on Existing Resources: DESC is evaluating the possible replacement of
existing peaking generation assets as intermittent renewable resources continue to expand
in the service territory and several combustion turbines reach end of life. DESC’s
existing fleet of simple-cycle combustion turbines is on average over 42 years old, with
multiple units at or approaching over 50 years since initial commercial operation.
DESC’s natural gas-fired steam units (McMeekin Units 1 and 2 and Urquhart Unit 3) also
typically operate as peaking resources, and these units are over 60 years old. Reliable,
fast-starting, and efficient peaking resources provide significant capabilities to balance
intermittent renewable generation. Replacement of DESC’s aging peaking generation
resources with flexible aeroderivative-type combustion turbines is seen as a likely
potential path to provide the flexibility to allow for further integration and additional
expansion of intermittent renewable resources in the near-term. As discussed above in
the Introduction, DESC expects trends toward clean energy to continue. Further, the
Company is committed to utilizing more power generated from clean energy sources. As
such, the Company will continue in future IRPs to explore generation, transmission, and
distribution technologies necessary to achieve this clean energy goal.
This IRP contains references to retiring generators. DESC Transmission Planning
must conduct System Impact Studies to determine the impacts of any planned generator
interconnection, retirement, or replacement requests. DESC Transmission Planning
studies these requests to determine the reliability impact to the DESC Bulk Electric
System. Those studies determine what transmission system upgrades are necessary to
support the associated generator requests and are performed independently from DESC’s
Power Generation and DESC Retail Electric organizations.
c. Environmental Rules: DESC continues to closely monitor developments with the US
Environmental Protection Agency’s (“EPA”) Steam Electric Effluent Limitation
Guidelines (“ELG”) following the Agency’s actions after the 2015 final rule was
published. This regulation is anticipated to require significant capital expenditures for
flue gas desulphurization (“FGD”) wastewater treatment at both Wateree and Williams
Stations and for modifications to limit or eliminate the discharge of ash transport water at
Williams Station. Recent fuel price trends along with increased intermittent renewable
generation have resulted in cyclic operation of these facilities along with reduced

35
capacity factors. These conditions make FGD wastewater treatment retrofits challenging
and costly.
In November 2019, EPA issued a proposed rule to revise the 2015 standards. In
the 2019 proposed rulemaking, EPA proposed significant changes to the rule including
new effluent limits and an incentive for early retirement of existing generating units.
DESC will continue to closely monitor the EPA’s rulemaking in anticipation of a final
ELG regulation in 2020. Along with the additional costs of stack emission reductions
and the ELG Rule, traditional coal-fired steam boiler generating units emit CO2 at twice
the rate of the highest efficiency natural gas fired combined cycle unit due to fuel carbon
content and efficiency. For immediate reductions in CO2 emissions, coal-fired units must
be operated less frequently by reducing demand, operating more natural gas-fired
generation, and adding solar generation with batteries along with combustion turbines for
back up and load following.
EPA released the final version of the Affordable Clean Energy (“ACE”) rule, the
replacement for the Clean Power Plan (“CPP”) on June 19, 2019. The rule was published
on July 8, 2019 and applies to existing coal-fired power plants greater than or equal to 25
MW. Through the ACE rule, the EPA finalized the repeal of the CPP. It is also asserted
that the repeal is intended to be severable, such that it will survive even if the remainder
of the ACE rule is invalidated.
Under the ACE rule, EPA has set the Best System of Emissions Reduction
(“BSER”) for existing coal-fired steam electric generating units as heat rate efficiency
improvements (“HRI”) based on a range of "candidate technologies" and improved
operating and maintenance practices that can be applied at the unit level. States are
directed to determine which of the candidate technologies apply to each unit and establish
standards of performance (expressed as an emissions rate in CO2 lb/MWh) based on the
degree of emission reduction achievable with the application of BSER. EPA requires that
each state determine which of the candidate technologies apply to each coal-fired unit
based on consideration of remaining useful plant life and other factors such as reasonable
cost of the candidate technologies.
The rule requires compliance at the unit level; it does not allow averaging across
units at the same facility or between facilities as a compliance option. In addition, it does
not allow states to use alternative carbon mitigation programs, such as a cap-and-trade

36
program, to demonstrate compliance as part of their state plans. A steam generating unit
that is subject to a federally enforceable permit limiting annual net-electric sales to one-
third or less of its potential electric output, or 219,000 MWh or less can be excluded from
the ACE rule. The ACE rule requires states to develop plans by July 2022. These state
plans must be approved by the EPA by January 2024. If states do not submit a plan or if
their submitted plan is not acceptable, the EPA will have two years to develop a federal
plan.

37
5. Resource Plan Analysis
a. Overview The following pages document a resource planning study that was performed to
assess several resource plans to meet customers’ need for power while varying future market
conditions and regulations. Included in the Company’s study were eight resource plans and
three sets of DSM scenarios. The eight plans were also evaluated under three levels of
natural gas prices and two CO2 emission cost prices. The Company’s base forecast of energy
and demands was used in the study. The Load Forecast (discussed in Part I) is called the
Medium DSM case. Medium DSM is based on the expected program levels identified in the
2019 Potential Study and are the programs the Company plans to deploy. By modifying the
Load Forecast with other levels of DSM, Low and High DSM sensitivities are included in the
Resource Plan Analysis. The existing DSM level is called Low DSM. The 2019 Potential
Study level is called Medium DSM, and a 1.0% level of DSM is called the High DSM case.
The DSM Low and Medium cases were studied for cost-effectiveness and provide a reliable
cost estimate that is unique to the portfolio of programs and customers in DESC’s electric
system. The High DSM case was not supported in the 2019 Potential Study and is based on
estimates.
Resource plans were created around retirements, environmental regulations and
additional renewable resources. These scenarios create a large array of output data. The
following pages include several displays of the high-level output data meant to emphasize the
most relevant results. Understanding the common basis of each resource plan and limited
changes between resource plans provide for relevant comparisons. Comparing resource plans
created with dissimilar assumptions will yield inappropriate conclusions, and care must be
taken to understand the inputs that are held constant versus inputs that have changed to avoid
such pitfalls.
b. Reserve Margin DESC’s reserve margin policy is summarized in the following table. Peaking
reserves are considered the capacity needed during the five highest peak load days in the
season while base reserves are needed for the balance of the season.

38
DESC’s Reserve Margin Policy Summer Winter Base Reserves 12% 14% Peaking Reserves 14% 21% Increment for Peaking 2% 7%
Statements about reserve margin are generally addressing Base Reserve criteria.
c. Meeting the Base Resource Need In the context of base or peaking, base resources are the resources explicitly identified in
a resource plan’s 40-year schedule to meet the summer or winter base reserve margin.
Peaking reserve margin assists in quantifying reliability risk but is not used for deciding on
permanent capacity resources. For base resources the winter base reserve margin of 14%
was used to determine the timing of adding generation resources. DESC created a list of
seven generating resources to be considered. The following table lists these resources.
Wateree and Williams are assumed retired when they reach their end of life, which is years
2044 and 2047 respectively, if not retired earlier. The capital costs are escalated or de-
escalated from 2020 to the year that the generator is installed. The installation year varies by
resource plan. The capacity used in the resource plan schedule for CC and ICT resources is
their winter capacity.

39
Description of Potential Resources
Resource Capital Cost 2020
$/kW
Escalation Rate
Capacity Source of Data
Battery Storage
$1,911 -2.463% 100 MW with 4 hour duration
• Dominion Energy Services - Generation Construction Financial Management & Controls
• CAPEX Escalation is from NREL Mid Technology Cost Scenario forecast of CAPEX, 30 Year Average
Solar $1,151 -1.498% 100 or 400 MW • Dominion Energy Services - Generation Construction Financial Management & Controls
• CAPEX Escalation is from NREL Mid Technology Cost Scenario forecast of CAPEX, 30 Year Average
CC 1-on-1 $1,330 3.75% 553 MW • Dominion Energy Services - Generation Construction Financial Management & Controls
• CAPEX Escalation is from Handy Whitman July 2019 15 year Average – Total Plant
ICT Frame J (2x)
$469 3.75% 523 MW • Dominion Energy Services - Generation Construction Financial Management & Controls
• CAPEX Escalation is from Handy Whitman July 2019 15 year Average – Total Plant
ICT Aero (2x)
$918 3.75% 131 MW • Dominion Energy Services - Generation Construction Financial Management & Controls
• CAPEX Escalation is from Handy Whitman July 2019 15 year Average – Total Plant
Solar PPA N/A N/A 400 MW • NREL 2019, Mid Technology Cost Scenario

40
i. Resource Plans
These six resources above were combined in various ways to develop eight resource
plans, some of which consider the retirement of some existing generating units. The eight
resource plans are listed in the following table which is followed by a description of each
resource plan.
Description of Resource Plans
Resource Plan ID
Resource Plan Name Resource Plan Description
RP1 CC Combined Cycle, ICTs RP2 ICT ICTs RP3 Retire Wateree Wateree 1 & 2 retirement, Combined Cycle, ICTs RP4 Retire McMeekin McMeekin and Urquhart 3 retirement, ICTs RP5 Solar + Storage Flexible Solar + Battery Storage, Combined Cycle, ICTs RP6 Solar Flexible Solar, ICTs RP7 Solar PPA + Storage Flexible Solar PPA + Battery Storage, ICTs
RP8 Retire Coal Replace Wateree and Williams with Combined Cycle, Solar and Battery Storage, ICTs
Flexible solar is a solar facility which can be curtailed when systems conditions require
and/or dispatched with system needs
Resource Plan 1: In this resource plan a 553 MW (winter capacity) combined cycle gas
generator is added when the winter reserve margin drops below 14%. 523 MW blocks of
ICTs are added to maintain the 14% winter reserve margin during the modeling period.
Resource Plan 2: In this resource plan 523 MW (winter capacity) of ICT gas generators
are added when the winter reserve margin drops below 14% during the modeling period.
Resource Plan 3: In this resource plan Wateree units 1 and 2 are retired in 2028 and a
combined cycle gas generator is added in 2028. Five hundred twenty-three (523) MW
blocks of ICTs are added to maintain the 14% winter reserve margin during the modeling
period.

41
Resource Plan 4: In this resource plan McMeekin 1 and 2 along with Urquhart 3 are
retired in 2028. Their 346 MW of capacity are replaced by 523 MW of ICT capacity.
Five hundred twenty-three (523) MW blocks of ICTs are added to maintain the 14%
winter reserve margin during the modeling period.
Resource Plan 5: In this resource plan 400 MW of Company owned flexible solar
generation plus 100 MW of battery storage are added in 2026. The next increment of
capacity necessary to maintain a 14% winter reserve margin is a 553 MW combined
cycle gas generator. After the CC, 523 MW blocks of ICTs are added to maintain the
14% winter reserve margin during the modeling period.
Resource Plan 6: In this resource plan 400 MW of Company owned flexible solar
generation is added in 2026. Five hundred twenty-three (523) MW blocks of ICTs are
added to maintain the 14% winter reserve margin during the modeling period.
Resource Plan 7: In this resource plan 400 MW of flexible solar PPA generation plus
100 MW of battery storage are added in 2026. Five hundred twenty-three (523) MW
blocks of ICTs are added to maintain the 14% winter reserve margin during the modeling
period.
Resource Plan 8: In this resource plan Wateree and Williams are retired in 2028 and
replaced with a 553 MW 1-on-1 combined cycle plant and Five hundred twenty-three
(523) MW of ICTs. Dual fuel capability is eliminated at Cope, so Cope burns only
natural gas starting in 2030. Additional tranches of 100 MW of battery storage and 131
MW ICTs are added to maintain the 14% winter reserve margin during the modeling
period. Solar is added each year from 2029 to 2048. This resource plan is the low carbon
plan.
ii. Methodology
The incremental revenue requirements associated with each of the eight resource plans
was computed using the PROSYM computer program to estimate production costs and an
EXCEL revenue requirements model to calculate the associated capital costs. The EXCEL
revenue requirements model combines the capital costs with the production costs to estimate
total incremental revenue requirements over a 40-year planning horizon.

42
iii. Demand Side Management Assumptions
Three DSM cases were created. The low DSM is equivalent to DSM programs and
levels on the DESC electric system prior to the 2019 Potential Study. The medium DSM
used the results of the 2019 Potential Study described in Part II.A. High DSM assumed DSM
Growth to 1% of retail sales by 2024. It should be noted that the High DSM case was not
supported in the 2019 Potential Study and is based only on estimates, likely not achievable
and cost effectiveness is unknown.
The three DSM cases created three demand and energy forecasts. A low level of
DSM creates higher demands and energy. A high level of DSM creates demands and
energies that are lower. The cost for each DSM case was calculated over a 40-year period
and applied to the appropriate scenario. Assuming no baseload retirements, the first need for
additional capacity occurs in the winter of 2035 when using the Medium DSM demands, in
2032 when using the Low DSM demands and 2038 when using the High DSM demands.
iv. DSM Sensitivity
The following tables summarizes the results for all eight resource plans under the three different
DSM cases. (1 – Green = Least cost, 2 – Blue = Second Lowest and 8 - Orange = Highest cost)
Resource Plan Rankings by Levelized NPV for Low, Medium and High DSM
Resource Plan ID
Resource Plan Name Low DSM Medium DSM High DSM
RP1 CC 6 5 4 RP2 ICT 1 1 1 RP3 Retire Wateree 2 6 6 RP4 Retire McMeekin 5 3 5 RP5 Solar + Storage 8 7 8 RP6 Solar 4 4 2
RP7 Solar PPA + Storage 3 2 3
RP8 Retire Coal 7 8 7
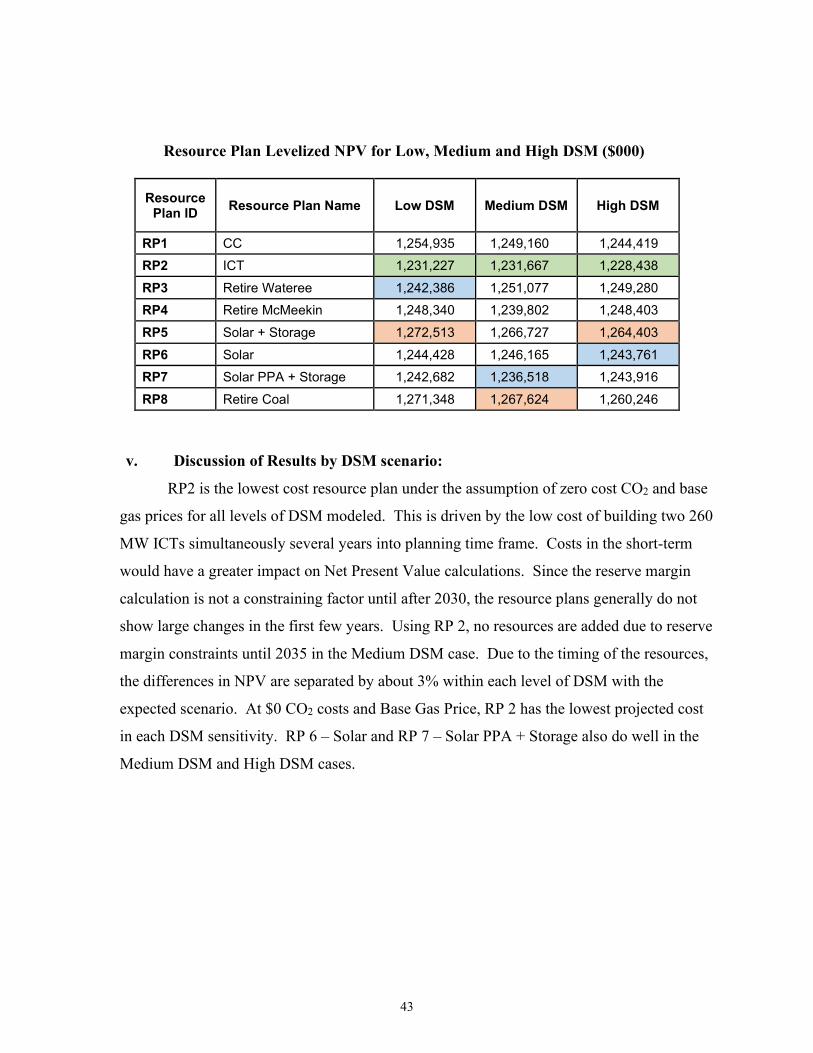
43
Resource Plan Levelized NPV for Low, Medium and High DSM ($000)
Resource Plan ID Resource Plan Name Low DSM Medium DSM High DSM
RP1 CC 1,254,935 1,249,160 1,244,419 RP2 ICT 1,231,227 1,231,667 1,228,438 RP3 Retire Wateree 1,242,386 1,251,077 1,249,280 RP4 Retire McMeekin 1,248,340 1,239,802 1,248,403 RP5 Solar + Storage 1,272,513 1,266,727 1,264,403 RP6 Solar 1,244,428 1,246,165 1,243,761 RP7 Solar PPA + Storage 1,242,682 1,236,518 1,243,916 RP8 Retire Coal 1,271,348 1,267,624 1,260,246
v. Discussion of Results by DSM scenario:
RP2 is the lowest cost resource plan under the assumption of zero cost CO2 and base
gas prices for all levels of DSM modeled. This is driven by the low cost of building two 260
MW ICTs simultaneously several years into planning time frame. Costs in the short-term
would have a greater impact on Net Present Value calculations. Since the reserve margin
calculation is not a constraining factor until after 2030, the resource plans generally do not
show large changes in the first few years. Using RP 2, no resources are added due to reserve
margin constraints until 2035 in the Medium DSM case. Due to the timing of the resources,
the differences in NPV are separated by about 3% within each level of DSM with the
expected scenario. At $0 CO2 costs and Base Gas Price, RP 2 has the lowest projected cost
in each DSM sensitivity. RP 6 – Solar and RP 7 – Solar PPA + Storage also do well in the
Medium DSM and High DSM cases.

44
vi. Emissions and Fuel Sensitivity
The medium DSM case was evaluated using three gas price assumption plus two CO2
cost assumptions. The combination of the three gas price assumptions and two CO2 cost
assumptions created 6 different scenarios. The chart below shows the three gas price
forecasts used. The high gas price forecast is the 2019 EIA gas price forecast. The base gas
and low gas scenarios are based on NYMEX gas prices for years 2020-2022 then escalated at
two different rates. The base escalation rate is derived from the EIA gas price forecast. The
low gas scenario escalation rate is half of the base gas escalation rate. The two CO2
assumptions used were $0/ton and $25/ton. All plans include assumptions about expenses
that will be required to meet ELGs for Wateree and Williams.
Low, Base and High Gas Price Forecast
0
2
4
6
8
10
12
2017
2018
2019
2020
2021
2022
2023
2024
2025
2026
2027
2028
2029
2030
2031
2032
2033
2034
2035
2036
2037
2038
2039
2040
2041
2042
2043
2044
2045
2046
2047
2048
2049
$/DT
Year
Gas Price Forecast
BASE LOW HIGH ACTUAL

45
vii. Resource Plan Rankings by Gas Price and CO2 Price
The following tables summarizes the 40 year levelized NPV cost results for all
eight resource plans under the three different gas price cases and two different CO2 price
cases. (1 - Green= Least cost, 2 – Blue = Second Lowest and 8 - Orange = Highest cost)
Resource Plan Levelized NPV Rankings for Medium DSM
Resource Plan ID
Resource Plan Name
$0/ton CO2,
$0/ton CO2,
$0/ton CO2,
$25/ton CO2,
$25/ton CO2,
$25/ton CO2,
Low Gas Base Gas High Gas Low Gas Base Gas High Gas
RP1 CC 6 5 5 7 6 6
RP2 ICT 1 1 2 3 4 3
RP3 Retire Wateree 5 6 7 4 3 5
RP4 Retire McMeekin 2 3 4 6 7 8
RP5 Solar + Storage 8 7 6 8 8 7
RP6 Solar 4 4 3 5 5 4
RP7 Solar PPA + Storage
3 2 1 2 2 2
RP8 Retire Coal 7 8 8 1 1 1
Resource Plan Levelized NPV for Medium DSM ($000)
Resource Plan ID
Resource Plan Name
$0/ton CO2,
$0/ton CO2,
$0/ton CO2,
$25/ton CO2,
$25/ton CO2,
$25/ton CO2,
Low Gas Base Gas High Gas Low Gas Base Gas High Gas
RP1 CC $1,166,528 $1,249,160 $1,427,424 $1,385,375 $1,469,436 $1,668,590
RP2 ICT $1,145,532 $1,231,667 $1,416,354 $1,370,853 $1,461,736 $1,665,599
RP3 Retire Wateree $1,165,235 $1,251,077 $1,444,505 $1,372,378 $1,460,334 $1,666,688
RP4 Retire McMeekin $1,154,191 $1,239,802 $1,425,558 $1,380,307 $1,470,231 $1,675,337
RP5 Solar + Storage $1,186,034 $1,266,727 $1,435,093 $1,394,516 $1,475,915 $1,669,182
RP6 Solar $1,163,394 $1,246,165 $1,423,590 $1,378,987 $1,465,797 $1,665,995
RP7 Solar PPA + Storage
$1,154,889 $1,236,518 $1,413,532 $1,370,024 $1,455,686 $1,654,813
RP8 Retire Coal $1,183,714 $1,267,624 $1,467,499 $1,356,160 $1,438,706 $1,646,153
CORRECTED

46
viii. Discussion of Scenario Costs Results:
RP2, RP4, and RP7 are lower cost when CO2 is assumed to be $0/ton. These
resource plans use ICTs to meet the reserve margin going forward. RP4 includes
retirements of McMeekin and Urquhart 3 in 2028 and has higher carbon production. RP7
includes a solar PPA plus storage in 2026. RP1, RP3 and RP5 add combined cycle
generation and are generally more expensive when CO2 costs are zero. RP3 and RP8
include retirement of a coal plant. RP8 retires all coal generating capacity by 2030 and is
the least cost resource plan when CO2 costs are $25/ton but is more expensive when CO2
cost is $0/ton and gas prices are low.
Since RP2 is the least cost alternative under zero cost CO2, Base Gas, and Medium DSM,
it is considered the base case. Under new regulations or changes in the market, however,
the base case may change. Given societal trends that are requiring more sustainable
sources of clean energy, RP7 and RP8 have significant merits. The Company will
continue to study the cost and benefit of portfolio alternatives that lower CO2 emissions
and promote more sources of clean energy.
ix. Resource Plan Rankings by Total Fuel Costs
The following table summarizes the 40 year levelized NPV total fuel cost
rankings for all eight resource plans under the three different gas price cases and two
different CO2 price cases.
Resource Plan Rankings by Total Fuel Costs for Medium DSM
Resource Plan ID Resource Plan Name $0/ton
CO2, $0/ton CO2,
$0/ton CO2,
$25/ton CO2,
$25/ton CO2,
$25/ton CO2,
Low Gas
Base Gas
High Gas
Low Gas
Base Gas
High Gas
RP1 CC 6 6 5 6 6 5 RP2 ICT 7 7 7 7 7 7 RP3 Retire Wateree 4 5 6 4 5 6 RP4 Retire McMeekin 8 8 8 8 8 8 RP5 Solar + Storage 2 2 2 2 2 2 RP6 Solar 5 4 4 5 4 4 RP7 Solar PPA + Storage 3 3 3 3 3 3 RP8 Retire Coal 1 1 1 1 1 1

47
Discussion of Resource Plan Fuel Costs Results:
One observation is how consistent the relative rank of each resource plan is with
regards to total fuel costs alone. RP 5 and RP8 are consistently least cost based on a
ranking of total fuel costs alone. These two resource plans add a combined cycle gas
generator with its additional fixed gas transportation costs but still remain least cost based
on total fuel costs. RP4 which retires McMeekin 1 and 2 and Urquhart 3 and meets the
reserve margin with ICTs is consistently the most expensive.
x. Resource Plan Rankings by 2030 CO2 Emissions
The following tables summarize the CO2 emissions results for all eight resource
plans under the three different gas price cases and two different CO2 price cases.
Resource Plan Rankings by CO2 for Medium DSM
Resource Plan ID
Resource Plan Name
$0/ton CO2,
$0/ton CO2,
$0/ton CO2,
$25/ton CO2,
$25/ton CO2,
$25/ton CO2,
Low Gas
Base Gas
High Gas
Low Gas
Base Gas
High Gas
RP1 CC 7 7 7 7 7 7 RP2 ICT 7 7 7 7 7 7 RP3 Retire Wateree 2 2 2 2 2 2 RP4 Retire McMeekin 6 6 6 6 6 6 RP5 Solar + Storage 4 3 5 4 4 4 RP6 Solar 3 5 4 3 3 3 RP7 Solar PPA + Storage 5 4 3 5 5 5 RP8 Retire Coal 1 1 1 1 1 1

48
Resource Plan 2030 CO2 for Medium DSM (K Tons)
Resource Plan ID Resource Plan Name $0/ton
CO2, $0/ton CO2,
$0/ton CO2,
$25/ton CO2,
$25/ton CO2,
$25/ton CO2,
Low Gas
Base Gas
High Gas
Low Gas
Base Gas
High Gas
RP1 CC 11,196 11,421 13,262 10,922 11,033 11,595 RP2 ICT 11,196 11,421 13,262 10,922 11,033 11,595 RP3 Retire Wateree 10,069 10,144 10,990 9,967 9,912 10,281 RP4 Retire McMeekin 11,190 11,393 13,177 10,862 10,850 11,452 RP5 Solar + Storage 10,826 11,054 13,073 10,549 10,609 11,230 RP6 Solar 10,788 11,083 12,950 10,512 10,586 11,218 RP7 Solar PPA + Storage 10,826 11,054 12,889 10,549 10,609 11,230 RP8 Retire Coal 7,781 7,781 7,754 7,763 7,750 7,722
xi. Discussion of CO2 Results by Resource Plan:
Under all scenarios CO2 is lowest in RP8 which includes the retirement of all coal
generation by 2030 and the addition of a new efficient combined cycle, combustion
turbines, and batteries. The second lowest CO2 occurs in RP3 which retires Wateree in
2028. The lowest value in the table is 7,754 K Tons which is a 59% reduction of CO2
emission from year 2005. This shows that a significant reduction in CO2 can be achieved
with a 3% increase in costs.
The $25/ton CO2 adder had the biggest impact when coupled with high gas prices.
Resource Plan 4 includes a retirement of all gas steam plants and doesn’t make a
significant impact to total CO2 emissions. Also, RP1 with a combined cycle plant,
Resource Plan 2 with combustion turbines, and RP4 that retires three gas fired boilers
have the highest CO2 emission in 2030 and do not achieve CO2 reduction goals.
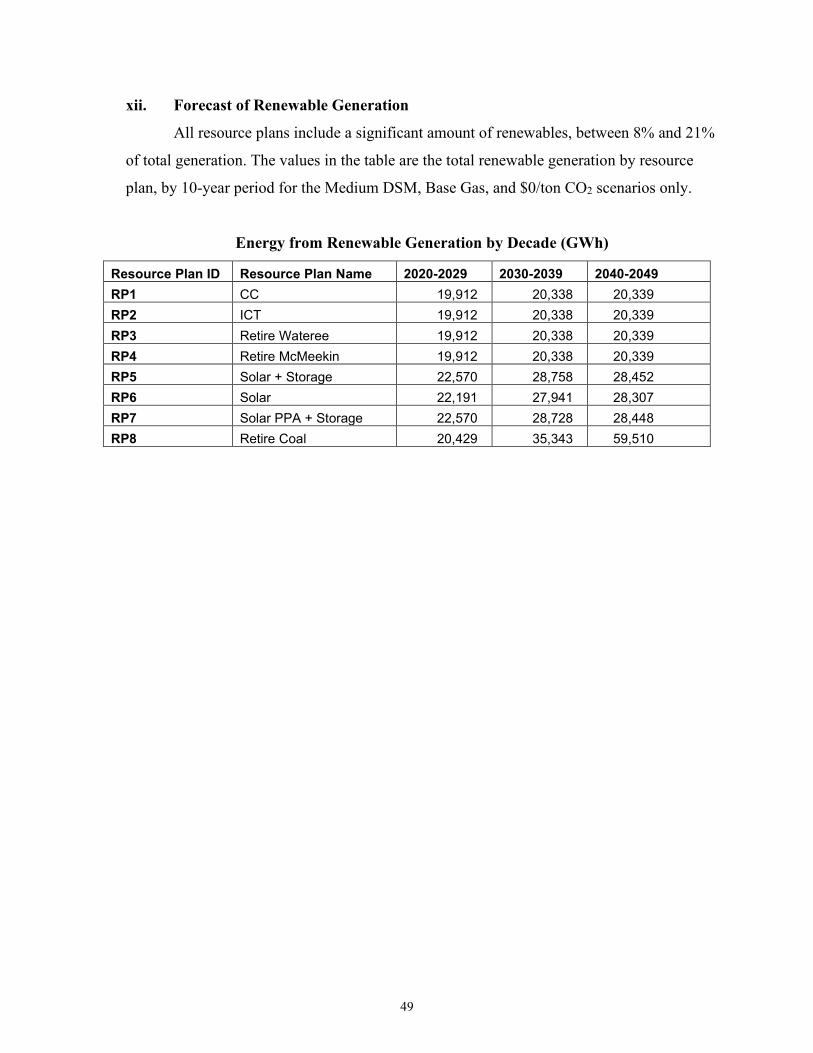
49
xii. Forecast of Renewable Generation
All resource plans include a significant amount of renewables, between 8% and 21%
of total generation. The values in the table are the total renewable generation by resource
plan, by 10-year period for the Medium DSM, Base Gas, and $0/ton CO2 scenarios only.
Energy from Renewable Generation by Decade (GWh)
Resource Plan ID Resource Plan Name 2020-2029 2030-2039 2040-2049 RP1 CC 19,912 20,338 20,339 RP2 ICT 19,912 20,338 20,339 RP3 Retire Wateree 19,912 20,338 20,339 RP4 Retire McMeekin 19,912 20,338 20,339 RP5 Solar + Storage 22,570 28,758 28,452 RP6 Solar 22,191 27,941 28,307 RP7 Solar PPA + Storage 22,570 28,728 28,448 RP8 Retire Coal 20,429 35,343 59,510

50
The following resource plan is the least cost resource plan.
Resource Plan 2
New resources are added to meet either a 12% summer reserve margin or a 14% winter reserve margin. Because of the higher loads in the winter
and 972 MW of solar that contribute some capacity to the summer reserves but not in the winter, the need for winter reserves drives the need to add
new capacity. Even then, with just a 0.7% peak load growth rate, no new resources are added until 2035 which is outside the fifteen-year window
shown above.
YEAR
S W S W S W S W S W S W S W S W S W S W S W S W S W S W S W
Load Forecast
1 Baseline Trend 4816 4891 4847 4948 4903 5003 4955 5037 4992 5089 5043 5143 5095 5197 5148 5249 5202 5301 5252 5351 5301 5408 5357 5465 5412 5518 5467 5574 5520 5627
2 EE Impact 0 0 0 -24 -24 -48 -50 -73 -76 -97 -102 -121 -128 -147 -155 -172 -183 -199 -211 -199 -211 -199 -211 -199 -211 -199 -211 -199 -211 -199
3 Gross Territorial Peak 4816 4891 4847 4924 4879 4955 4905 4964 4916 4992 4941 5022 4967 5050 4993 5077 5019 5102 5041 5152 5090 5209 5146 5266 5201 5319 5256 5375 5309 5428
System Capacity
4 Existing 5689 5915 5664 5915 5664 5915 5664 5915 5664 5915 5664 5915 5664 5915 5664 5915 5664 5915 5664 5915 5664 5915 5664 5915 5664 5915 5664 5915 5664 5915
5 Existing Solar 263 0 329 0 448 0 448 0 448 0 448 0 448 0 448 0 448 0 448 0 448 0 448 0 448 0 448 0 448 0
6 Demand Response 227 224 228 226 229 228 230 230 231 234 232 239 233 249 234 261 235 275 236 276 237 277 238 278 239 279 240 280 241 281
Additions:
7 Solar Plant 67 0 118 0
8 Peaking/Intermediate
9 Baseload
10 Retirements -25
11 Total System Capacity 6220 6139 6340 6141 6341 6143 6342 6145 6343 6149 6344 6154 6345 6164 6346 6176 6347 6190 6348 6191 6349 6192 6350 6193 6351 6194 6352 6195 6353 6196
12
13 Total Production Capability 6220 6139 6340 6141 6341 6143 6342 6145 6343 6149 6344 6154 6345 6164 6346 6176 6347 6190 6348 6191 6349 6192 6350 6193 6351 6194 6352 6195 6353 6196
Reserves
14 Margin (L13-L3) 1404 1248 1493 1217 1462 1188 1436 1182 1426 1157 1403 1133 1378 1113 1353 1100 1327 1089 1306 1040 1258 983.7 1203 927.7 1149 875.7 1095 820.7 1043 768.7
15 % Reserve Margin (L14/L3) 29.2% 25.5% 30.8% 24.7% 30.0% 24.0% 29.3% 23.8% 29.0% 23.2% 28.4% 22.6% 27.7% 22.0% 27.1% 21.7% 26.4% 21.3% 25.9% 20.2% 24.7% 18.9% 23.4% 17.6% 22.1% 16.5% 20.8% 15.3% 19.7% 14.2%
DESC Forecast of Summer and Winter Loads and Resources - 2020 IRP
(MW)2020 2021 2022 2023 2024 2025 2026 2027 20342028 2029 2030 2031 2032 2033
CORRECTED

51
The following plan has the lowest CO2.
Resource Plan 8
YEAR
S W S W S W S W S W S W S W S W S W S W S W S W S W S W S W
Load Forecast
1 Baseline Trend 4816 4891 4847 4948 4903 5003 4955 5037 4992 5089 5043 5143 5095 5197 5148 5249 5202 5301 5252 5351 5301 5408 5357 5465 5412 5518 5467 5574 5520 5627
2 EE Impact 0 0 0 -24 -24 -48 -50 -73 -76 -97 -102 -121 -128 -147 -155 -172 -183 -199 -211 -199 -211 -199 -211 -199 -211 -199 -211 -199 -211 -199
3 Gross Territorial Peak 4816 4891 4847 4924 4879 4955 4905 4964 4916 4992 4941 5022 4967 5050 4993 5077 5019 5102 5041 5152 5090 5209 5146 5266 5201 5319 5256 5375 5309 5428
System Capacity
4 Existing 5689 5915 5664 5915 5664 5915 5664 5915 5664 5915 5664 5915 5664 5915 5664 5915 5664 5915 5446 5697 5394 5697 5394 5697 5494 5797 5494 5797 5594 5897
5 Existing Solar 263 0 329 0 448 0 448 0 448 0 448 0 448 0 448 0 452 0 456 0 456 0 465 0 474 0 483 0 492 0
6 Demand Response 227 224 228 226 229 228 230 230 231 234 232 239 233 249 234 261 235 275 236 276 237 277 238 278 239 279 240 280 241 281
Additions:
7 Solar Plant 67 0 118 0 4.4 4.4 8.8 8.8 8.8 8.8 8.8
8 Peaking/Intermediate 523 -38 100 100 100
9 Baseload 553 -19
10 Retirements -25 -1294 5
11 Total System Capacity 6220 6139 6340 6141 6341 6143 6342 6145 6343 6149 6344 6154 6345 6164 6350 6176 6355 5972 6086 5973 6096 5974 6106 6075 6216 6076 6226 6177 6335 6278
12
13 Total Production Capability 6220 6139 6340 6141 6341 6143 6342 6145 6343 6149 6344 6154 6345 6164 6350 6176 6355 5972 6086 5973 6096 5974 6106 6075 6216 6076 6226 6177 6335 6278
Reserves
14 Margin (L13-L3) 1404 1248 1493 1217 1462 1188 1436 1182 1426 1157 1403 1133 1378 1113 1357 1100 1336 870.7 1045 821.7 1006 765.7 959.9 809.7 1015 757.7 969.5 802.7 1026 850.7
15 % Reserve Margin (L14/L3) 29.2% 25.5% 30.8% 24.7% 30.0% 24.0% 29.3% 23.8% 29.0% 23.2% 28.4% 22.6% 27.7% 22.0% 27.2% 21.7% 26.6% 17.1% 20.7% 15.9% 19.8% 14.7% 18.7% 15.4% 19.5% 14.2% 18.4% 14.9% 19.3% 15.7%
2032 2033
DESC Forecast of Summer and Winter Loads and Resources - 2020 IRP Update
(MW)2020 2021 2022 2023 2024 2025 2026 2027 20342028 2029 2030 2031
CORRECTED

52
III. Transmission System Assessment and Planning
DESC's transmission planning practices develop and coordinate a program that provides
for timely modifications to the DESC transmission system to ensure a reliable and economical
delivery of power. This program includes the determination of the current capability of the
electrical network and a ten-year schedule of future additions and modifications to the system.
These additions and modifications are required to support customer growth, provide emergency
assistance and maintain economic opportunities for DESC’s customers while meeting DESC and
industry transmission performance standards.
DESC has an ongoing process to determine the current and future performance level of the
DESC transmission system. Numerous internal studies are undertaken that address the service
needs of customers. These needs include: 1) distributed load growth of existing residential,
commercial, industrial, and wholesale customers, 2) new residential, commercial, industrial, and
wholesale customers, 3) customers who use only transmission services on the DESC system and
4) generator interconnection services.
DESC has developed and adheres to a set of internal Long-Range Planning Criteria
which can be summarized as follows:
The requirements of the DESC “LONG RANGE PLANNING CRITERIA” will be satisfied if the system is designed so that during any of the following contingencies, only short-time overloads, low voltages and local loss of load will occur and that after appropriate switching and re-dispatching, all non-radial load can be served with reasonable voltages and that lines and transformers are operating within acceptable limits.
a. Loss of any bus and associated facilities operating at a voltage level of 115kV or above b. Loss of any line operating at a voltage level of 115kV or above c. Loss of entire generating capability in any one plant d. Loss of all circuits on a common structure e. Loss of any transmission transformer f. Loss of any generating unit simultaneous with the loss of a single transmission line
Outages are considered acceptable if they will not cause equipment damage or result in uncontrolled cascading outside the local area.
Furthermore, DESC subscribes to the set of mandatory Electric Reliability Organization
(“ERO”) Standards, also known as the North American Electric Reliability Corporation
(“NERC”) Reliability Standards for Transmission Planning, as approved by the NERC Board of

53
Trustees and the Federal Energy Regulatory Commission (“FERC”).
DESC assesses and designs its transmission system to be compliant with the requirements
as set forth in these standards. A copy of the NERC Reliability Standards is available at the
NERC website www.nerc.com.
The DESC transmission system is interconnected with Duke Energy Progress, Duke
Energy Carolinas, South Carolina Public Service Authority (“Santee Cooper”), Georgia Power
(“Southern Company”) and the Southeastern Power Administration (“SEPA”) systems. Because
of these interconnections with neighboring systems, system conditions on other systems can affect
the capabilities of the DESC transmission system just as system conditions on the DESC
transmission system can affect other systems. DESC participates with other transmission
planners throughout the southeast to develop current and future power flow, stability and short
circuit models of the integrated transmission grid for the NERC Eastern Interconnection. All
participants’ models are merged together to produce current and future models of the integrated
electrical network. Using these models, DESC evaluates its current and future transmission
system for compliance with the DESC Long Range Planning Criteria and the NERC Reliability
Standards.
Electrical transmission investments planned by DESC:
Planned Project Tentative
Completion Date
Thomas Island - Jack Primus 115 kV Line: Acquire R/W & Construct Feb-20
Saluda Hydro-Denny Terrace 115kV: Broad River Rebuild Apr-20
Hugh Leatherman 115 kV Tap: Construct Apr-20
Lake Murray-Lexington Jct 115kV: String 1272 ACSR May-20
Lake Murray - Michelin 115 kV: Pull new wire on existing structure / Rebuild as Double
Circuit
May-20
Cope - Denmark 115 kV: Upgrade to 1272 ACSR from Denmark Sub to Str. 68 May-20
Hooks 115kV Switching Station: Construct May-20
Urquhart - Graniteville - South Augusta 230/115 kV Tielines Jun-20
Saluda Hydro - Denny Terrace & Lake Murray - Harbison Oct-20
Batesburg-Gilbert 115 kV Line Dec-20

54
Note: The projects listed above are the currently planned projects based on the latest assessment
studies. The transmission expansion plan is continuously reviewed and may change due to
changes in key data and assumptions. This summary of projects does not represent a commitment
to build.
To ensure the reliability of the DESC transmission system while considering conditions on
other systems and to assess the reliability of the wide-area integrated transmission grid, DESC
participates in assessment studies with neighboring transmission planners in South Carolina,
North Carolina and Georgia. Also, DESC on a periodic and ongoing basis participates with other
transmission planners throughout the southeast to assess the reliability of the southeastern
integrated transmission grid for the long-term horizon (up to 10 years) and for upcoming seasonal
Briggs Rd-Stevens Creek 115kV: Rebuild Dec-20
Stevens Creek - Briggs Road Tie-line Construct Dec-20
Bluffton - (SCPSA) Bluffton 115 kV Tie Line Construct Dec-20
Williams Street - Park Street 115 kV: Construct Dec-20
Pepperhill - Summerville 230 kV Construct Jan-21
Edmund - Pelion Tap 115 kV Line Jan-21
Church Creek-Faber Place 230kV & 115kV: Rebuild the Ashley River Crossing May-21
Emory 230 kV Distribution Sub: Construct May-21
Queensboro - Ft Johnson 115 kV Tap May-21
Canadys 230 kV: Add Back-to-Back Bus Tie Breakers Jun-21
Canadys 230 kV Sub: Reterminate Various Lines Jun-21
Urq Jct - Toolbeck 230 kV Fold In Dec-21
Lake Murray - Gilbert 115 kV Line Dec-21
Lex Westside - Gilbert 115 kV Line Dec-21
Batesburg - Ward 115 kV Line Dec-21
Trenton - Briggs Rd 115 kV Line Dec-21
Toolebeck – Aiken 230kV Tie: Construct Dec-21
Coit - Gills Creek 115 kV Line: Construct Dec-22
Burton - Yemassee 115 kV #2 Line Rebuild as Double Circuit Dec-22
Stevens Creek-Ward-Lake Murray Line and Associated System Hardening Construct Mar-23
Union Pier 115-13.8 kV Sub: Tap Construct Dec-24
Canadys - Ritter 115 kV: Rebuild as 230/115 kV Double Circuit May-27

55
(summer and winter) system conditions.
The following is a list of joint studies with neighboring transmission planners completed over
the past year:
1. SERC NTWG Reliability 2019 Summer Study 2. SERC NTWG Reliability 2019/2020 Winter Study 3. SERC NTWG OASIS 2019 January Studies (19Q1) 4. SERC NTWG OASIS 2019 April Studies (19Q2) 5. SERC NTWG OASIS 2019 July Studies (19Q3) 6. SERC NTWG OASIS 2019 October Studies (19Q4) 7. SERC LTWG 2024 Future Year Study 8. CTCA 2021 Daytime Minimum, 2022 Daytime Minimum, 2024 Summer Peak –
Reliability and Transfer Capability Studies 9. SCRTP 2020 Summer and 2023/24 Winter Transfer Studies
The acronyms used above have the following reference:
SERC – SERC Reliability Corporation NTSG – Near Term Study Group OASIS – Open Access Same-time Information System LTSG – Long Term Study Group CTCA – Carolinas Transmission Coordination Arrangement SCRTP – South Carolina Regional Transmission Planning
These activities, as discussed above, provide for a reliable and cost-effective transmission system
for DESC customers and comply with Federal regulations.
Eastern Interconnection Planning Collaborative (EIPC)
The Eastern Interconnection Planning Collaborative (“EIPC”) was initiated by a coalition of
regional Planning Authorities (including DESC). These Planning Authorities are entities listed on
the NERC compliance registry as Planning Authorities and represent the majority of the Eastern
Interconnection.
The EIPC provides a grass-roots approach which builds upon the regional expansion plans
developed each year by regional stakeholders in collaboration with their respective NERC
Planning Authorities. This approach provides coordinated interregional analysis for the entire
Eastern Interconnection.
The EIPC purpose is to model the impact on the grid of various policy options determined to
be of interest by state, provincial and federal policy makers and other stakeholders. This work
builds upon, rather than replaces, the current local and regional transmission planning processes

56
developed by the Planning Authorities and associated regional stakeholder groups within the
entire Eastern Interconnection. Those processes are informed by the EIPC analysis efforts
including the interconnection-wide review of the existing regional plans and development of
transmission options associated with the various policy options.
Distributed Generation Integration
All levels of the existing electric infrastructure, standards, and operating protocols were
originally designed around a fully dispatchable generation fleet required to satisfy variable load
conditions. Equipment configurations and operating standards have been designed to ensure grid
reliability and stability through the control of system frequency and voltage. In contrast, Solar
PV generation systems are intermittent where energy output is variable with limited dispatch
capability. Further, traditional generation facilities are typically large centralized plants with high
MW ratings while solar PV generating facilities are smaller in size and, in many cases, installed at
the distribution level by the end user (e.g., a homeowner, business, or other non-utility entity) –
often mounting the PV panels on the roof of a building or on smaller scale developer-built
sites. As the movement towards clean energy grows, the Company expects that power from solar
PV installations may be injected onto its system from hundreds or even thousands of
interconnection points that may either be at the transmission level or at on the distribution
level. To accommodate these changes, generation facilities, transmission grids, and distribution
systems must allow for two-way power flows all while maintaining the highest level of reliability
possible. The Company continues to study this paradigm shift in generation technology and its
impact on the Company’s transmission grid and distribution system, and the results of this work
could require design modifications to assure system stability and reliability. Examples may
include partial system re-configuration and/or deployment of new technologies such as batteries,
synchronous condensers, and static synchronous compensators (“STATCOM”).
DESC plans to continue to study the issues associated with solar PV integration described
above. The results of those studies will be published in future IRP’s.

57
IV. Conclusions
The results in this document reflect that in the near term the Company does not need to
make any major changes to the baseload generation fleet in order to meet customer’s energy and
capacity needs in a safe, reliable, and cost-effective manner. However in an effort to produce a
more sustainable future, the Company is implementing or evaluating upgrading its distribution
network with projects like AMI, replacing older peaking units with quick-start, flexible, and
reliable generation, expanding DSM and studying its transmission system to minimize the impact
of eventual steam unit retirements and allow for additional intermittent renewable generation.
Some useful results in the Resource Plan Analysis include that RP2 was the least cost
plan under all DSM cases, with base gas and $0/ton CO2, though the cost difference between all
cases was modest. RP7 and RP8 were least cost plans under numerous scenarios. RP8 resulted
in the least carbon impact under all scenarios. All resource plans include the addition of
combustion turbines or combined cycle plants but Resource Plans 5 – 8 also add renewables.
RP2 which adds only combustion turbines, Resource Plan 7 which has solar with storage, and
RP8 which retires coal, rank the least cost depending upon the sensitivity selection. RP8 has the
lowest 2030 CO2 emissions by a significant margin, and the lowest cost in some scenarios. All
resource plans were within 3% of levelized NPV of each other when the assumptions about
DSM, CO2 and gas were held constant. These differences indicate that the relative rankings
could change based on updated information in the future. While the Company makes
observations and conclusions as to which resource plan results in the least cost, the results do not
reflect a decision by the Company for its path forward
Since the 2019 IRP and 2019 Potential Study, DESC has implemented a much larger
commitment to AMI which will increase the potential for deployment of additional cost-effective
DSM, which includes both EE and DR. AMI will allow the Company to target new and specific
demand response programs for study. End of life retirement of some of the Company’s older
combustion turbines are the only near-term issue that may adversely impact the Company’s
ability to maintain the proper level of planning reserves. The Company plans to continue to
study this issue and will inform the PSC of its conclusion regarding these older combustion
turbines after the final analysis is complete. At this time, however, no immediate action is

58
needed for resource retirements or additions based on the IRP. This IRP does indicate that
several potential retirements and other resource plans are viable and will be studied over the next
few years. Expenditures over the IRP time horizon will be primarily toward environmental
compliance, reliability of supply, grid reliability and the continued shift toward renewable
resources. The Company will continue to study these alternatives in detail.
On an energy basis, photovoltaic solar technology is becoming more cost-competitive
with traditional forms of generation. Currently, stand-alone solar does not meet all of the needs
of a highly dynamic and critical infrastructure system like the electric grid. As previously
mentioned, solar provides little winter peaking capacity. It will take innovation and research to
find a cost-effective combination of combustion turbine and energy storage technologies to
provide reliable clean energy supply for the future. Using the results of several resource plans
and scenarios provides a reasonable means of estimating the cost benefit ratio for CO2
reductions. Comparing RP2 and RP8 shows that a 3% increase in costs could result in
significantly better CO2 reduction by 2030 of 59% reduction verses RP2’s 39%, both from 2005
levels. The only substantive CO2 reductions are a result of reducing or eliminating energy
generated from coal resources as shown in RP3 and RP8.
The IRP process is designed to develop and evaluate potential resource plans under
various scenarios to understand risks, costs and environmental impacts to reserve margins.
Given the dynamic nature of the current electric power industry with respect to societal trends,
customer preferences, technological advances, and environmental regulations, it is important that
Company remain flexible with respect to future expansion plans. As such, the DESC resource
plans identified in this 2020 IRP present several plausible paths the Company may or may not
elect to pursue. What’s most imperative is that the Company remain agile regarding
management of its electric generation portfolio in response to changing energy supply and
customer usage.
The Charleston Metropolitan area is poised for EV growth. Several factors are promoting
EV growth in the strongest market ahead of more rural areas in the DESC service territory. The
Company anticipates that the growth in the Charleston area will continue to gain strength.
Similar adoption rates are expected to follow in the Columbia, Hilton Head and Aiken areas.
The local increased energy demand will certainly require adaptation initially in all urban areas.

59
Urban distribution systems will need additional support from automation as adoption increases.
In the next 15 years, DESC will be working toward creating the infrastructure that opens
the way for lower cost generation and non-emitting resources, but those steps must also be
affordable. However, with a commitment to a more sustainable energy future, the Company
needs to upgrade its distribution network through measures such as rolling out Advanced
Metering Infrastructure, converting some of its older peaking generation to more reliable and
quick- start peaking generation, continuing to expand DSM, and studying transmission system to
minimize the impact of eventual steam unit retirements and additional intermittent renewable
generation.

A-1
Appendix A
Intervenor Provided Resource Plans and Scenarios
As a part of the Dominion Energy/SCANA merger settlement DESC agreed that “During
the development of the IRP, intervenors in the previous year's IRP can request (via the Office of
Regulatory Staff ("ORS")) that the SCE&G evaluate a limited number of alternative resource
plans for modeling during the IRP development. For purposes of this condition, the limited
number of alternative resource plans required shall not exceed five and shall be agreed upon by
SCE&G in consultation with ORS.” The following resources and scenarios were suggested by
the intervenors. Although these resource plans utilized many of the same data inputs, no direct
comparisons to DESC’s resource plans were possible due to the low resource cost information
provided by the third parties, which in DESC’s view, results in a low portfolio cost bias and
prevents a practical comparison.
The following table lists the resources examined in the intervenors’ resource plans.
Resource Capital Cost 2020 $/kW
Description Source of Data
Stand Alone Battery PPA
N/A 100 MW with 4 hour duration
2019 NREL Low Technology Cost Scenario pricing
Solar PPA N/A Various Sizes 2019 NREL Low Technology Cost Scenario pricing
Solar + Storage PPA
N/A 400 MW Solar + 100 MW Battery Storage
2019 NREL Low Technology Cost Scenario pricing
ICT 1097 93 MW aeroderivative
Dominion Energy Services - Generation Construction Financial Management & Controls
Capacity Purchases
N/A 50 MW increments DESC estimates
These five resources were combined in various ways to develop five resource plans, some
of which consider the retirement of some existing generating units. The five resource plans are
listed in the following table with a description of each resource plan. Wateree and Williams are
retired when they reach their end of life, which is years 2044 and 2047 respectively, if not retired
earlier.

A-2
Intervenor Resource Plan ID
Intervenor Resource Plan
SBA 1 Solar PPA, ICT, Base DSM SBA 2 Williams Retirement, 1.25% DSM, Standalone Battery Storage
PPA, Solar PPA SBA 3 Williams and Wateree Retirement, 1.25% DSM, Capacity
Purchases, Solar PPA, Standalone Battery Storage, Solar+Storage PPA
SBA 4 McMeekin and Urquhart 3 Retirement, 1.25% DSM, Solar PPA, Standalone Battery Storage
SBA 5 Solar PPA in 2021, Standalone Battery Storage PPA, Base DSM
Intervenor Resource Plan Definitions
Resource Plan SBA 1: In this resource plan a 400 MW Solar PPA is added in 2026. 93 MW of
combustion turbines are added to maintain the 14% winter reserve margin during the modeling
period.
Resource Plan SBA 2: In this resource plan Williams is retired in year 2028. 831 MW Solar
PPA, 358 MW Storage, and DSM equal to 1.25% of retail sales plus 43 MW of DR are added.
100 MW standalone storage are added to maintain the 14% winter reserve margin during the
modeling period.
Resource Plan SBA 3: In this resource plan Williams and Wateree are retired in 2026. 1774
MW Solar PPA, 603 MW Storage, 500 MW capacity purchases and DSM equal to 1.25% of
retail sales plus 43 MW of DR are added to replace the retired capacity and energy. Capacity
purchases terminate in 2029 and are replaced by a 500 MW standalone battery storage PPA. 400
MW Solar +100 MW Storage PPAs are added to maintain the 14% winter reserve margin during
the modeling period.
Resource Plan SBA 4: In this resource plan McMeekin 1 and 2 along with Urquhart 3 are
retired in 2029. The retired capacity and energy is replaced by 64 MW of standalone battery
storage, 94 MW of solar PPA, and DSM equal to 1.25% of retail sales plus 43 MW of DR. 100
MW standalone battery storage PPAs are added to maintain the 14% winter reserve margin
during the modeling period.
Resource Plan SBA 5: In this resource plan 200 MW of solar PPA is added in 2021. 43 MW of
DR is added in 2029. Base level of DSM is used in this resource plan. 100 MW standalone
battery storage is added to maintain the 14% winter reserve margin during the modeling period.

A-3
PPA Price Assumptions
The intervenors specified that the renewable costs used in modeling their five resource plans be
based on the NREL Annual Technology Baseline database “Low Technology Cost Scenarios.”
The results would have been more useful had the intervenors specified that DESC use the “Mid
Technology Cost Scenarios.” Below are NREL definitions for their two scenarios:
• Mid Technology Cost Scenario: based on the median of literature projections of future
CAPEX; O&M technology pathway analysis
• Low Technology Cost Scenario: based on the low bound of literature projections of
future CAPEX and O&M technology pathway analysis.
The CAPEX forecast for solar under the “Low Technology Cost Scenario” drops an aggressive
61% from 2020 to 2050. Under the “Mid Technology Cost Scenario” the CAPEX forecast for
solar drops a more realistic 36% from 2020 to 2050. By specification, the resulting levelized
cost for all five intervenor resource plans is very likely to be understated.
Methodology
The incremental revenue requirements associated with each of the five intervenor
resource plans was computed using the PROSYM computer program to estimate production
costs and a Microsoft® Excel capital cost model to calculate the associated capital costs. The
capital cost model is combined the capital costs with the production costs to estimate total
incremental revenue requirements over a 40-year planning horizon.
Demand Side Management (DSM) Assumptions
Two DSM cases were used in resource plans provided by the intervenors. Medium DSM
is based on the results of the 2019 Potential Study and is used for Resource Plans 1 and 5. DSM
specified in Resource Plans 2 – 4 requires that DSM grows to 1.25% by 2024. It should be noted
that DSM levels above those provided within the 2019 Potential Study, are not likely to be
achievable and cost-effectiveness is unknown. It should also be noted that the costs used to
model the 1.25% DSM in Resource Plans 2 – 4 are only estimates. No comprehensive study or
program analysis has been completed to determine the actual costs to achieve 1.25% savings and
such costs can be expected to grow exponentially as higher and higher levels of energy savings
are sought.

A-4
Emissions and Fuel Sensitivity
Each resource plan was evaluated using three gas price forecasts plus $0 and $25 per ton
CO2 costs. The combination of the three gas price assumptions and two CO2 cost assumptions
created 6 different scenarios. The high gas price forecast is the 2019 EIA gas price forecast. The
base gas and low gas scenarios are based on NYMEX gas prices for years 2020-2022 then
escalated at two different rates. The base escalation rate is derived from the EIA gas price
forecast. The low gas scenario escalation rate is half of the base gas escalation rate. The two CO2
assumptions used were $0/ton and $25/ton.
Intervenor Resource Plan Rankings
The following tables summarizes the 40 year levelized NPV cost results for all five resource
plans under the three different gas price cases and two different CO2 price cases.
(1 - Green= Least cost, 2 – Blue = Second Lowest and 8 - Orange = Highest cost)
Resource Plan ID $0/ton CO2, $0/ton CO2, $0/ton CO2, $25/ton
CO2, $25/ton
CO2, $25/ton
CO2, Low Gas Base Gas High Gas Low Gas Base Gas High Gas SBA 1 4 4 5 4 5 5 SBA 2 1 1 1 2 2 2 SBA 3 3 3 2 1 1 1 SBA 4 5 5 4 5 4 4 SBA 5 2 2 3 3 3 3
40 Year Levelized NPV of the Intervenor Resource Plans
Resource Plan ID $0/ton CO2, $0/ton CO2, $0/ton CO2, $25/ton
CO2, $25/ton
CO2, $25/ton
CO2, Low Gas Base Gas High Gas Low Gas Base Gas High Gas SBA 1 $1,181,917 $1,259,710 $1,426,579 $1,396,358 $1,475,537 $1,669,170 SBA 2 $1,142,465 $1,211,484 $1,368,241 $1,333,510 $1,406,644 $1,583,127 SBA 3 $1,179,934 $1,236,930 $1,382,570 $1,329,021 $1,389,003 $1,544,806 SBA 4 $1,192,393 $1,261,454 $1,421,922 $1,401,112 $1,472,960 $1,651,763 SBA 5 $1,157,146 $1,233,152 $1,400,031 $1,372,049 $1,451,312 $1,639,753

A-5
Discussion of Cost Results:
Resource Plans 2 and 3 are least cost as modeled. Resource Plans 2 through 4 assumed a
level of DSM that is not cost effective Therefore, only Resource Plans 1 and 5 provide
meaningful results within the constraints specified.
Since $0/Ton CO2 and Base Gas is the most likely scenario, Resource Plan 1 is the least
cost of these scenarios when only Resource Plans 1 and 5 are considered.
2030 CO2 Emissions Rankings
The following tables summarize the CO2 emissions results for all five resource plans under the
three different gas price cases and two different CO2 price cases. Green shading denotes the lowest
CO2 production and the number 1 ranking. Blue is second lowest, and brown is the highest CO2
production at the number 5 ranking
Resource Plan ID $0/ton CO2, $0/ton CO2, $0/ton CO2, $25/ton
CO2, $25/ton
CO2, $25/ton
CO2, Low Gas Base Gas High Gas Low Gas Base Gas High Gas
SBA 1 4 4 4 4 4 4
SBA 2 2 2 2 2 2 2
SBA 3 1 1 1 1 1 1
SBA 4 3 3 3 3 3 3
SBA 5 5 5 5 5 5 5
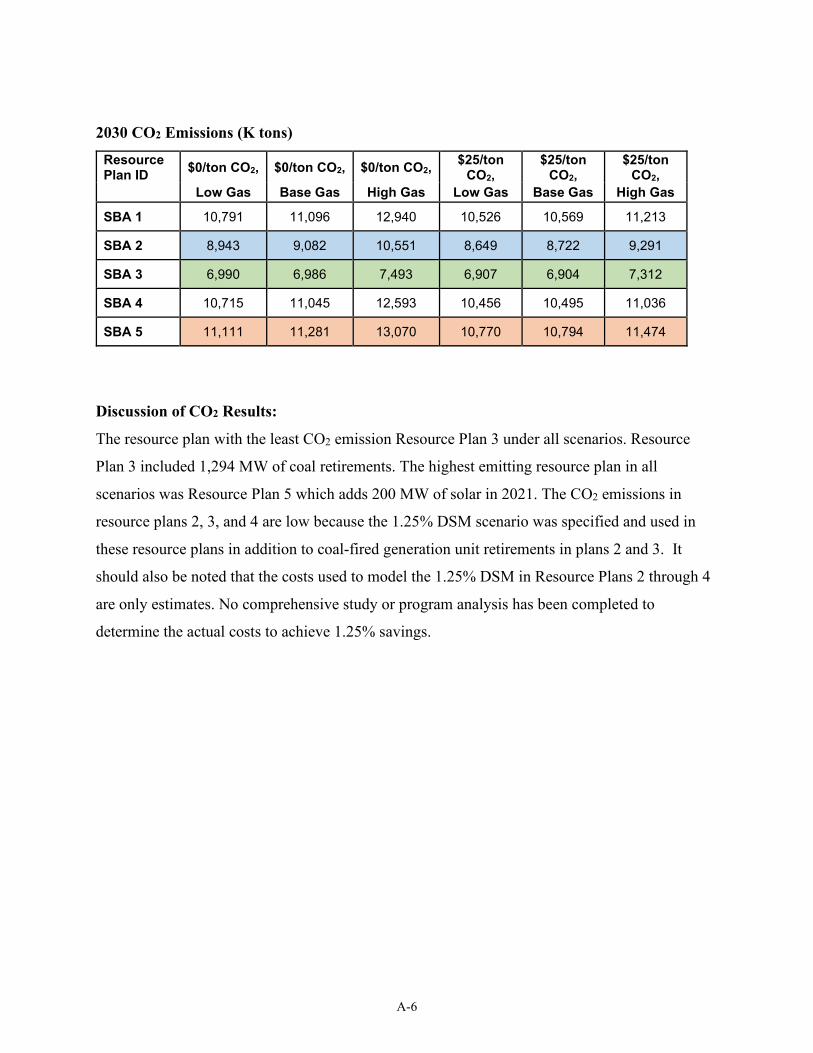
A-6
2030 CO2 Emissions (K tons)
Resource Plan ID $0/ton CO2, $0/ton CO2, $0/ton CO2, $25/ton
CO2, $25/ton
CO2, $25/ton
CO2, Low Gas Base Gas High Gas Low Gas Base Gas High Gas
SBA 1 10,791 11,096 12,940 10,526 10,569 11,213
SBA 2 8,943 9,082 10,551 8,649 8,722 9,291
SBA 3 6,990 6,986 7,493 6,907 6,904 7,312
SBA 4 10,715 11,045 12,593 10,456 10,495 11,036
SBA 5 11,111 11,281 13,070 10,770 10,794 11,474
Discussion of CO2 Results:
The resource plan with the least CO2 emission Resource Plan 3 under all scenarios. Resource
Plan 3 included 1,294 MW of coal retirements. The highest emitting resource plan in all
scenarios was Resource Plan 5 which adds 200 MW of solar in 2021. The CO2 emissions in
resource plans 2, 3, and 4 are low because the 1.25% DSM scenario was specified and used in
these resource plans in addition to coal-fired generation unit retirements in plans 2 and 3. It
should also be noted that the costs used to model the 1.25% DSM in Resource Plans 2 through 4
are only estimates. No comprehensive study or program analysis has been completed to
determine the actual costs to achieve 1.25% savings.