2020 maryland and district of columbia state
TRANSCRIPT

PJM©2021www.pjm.com | Public
2020 Maryland and District of Columbia
State Infrastructure Report(January 1, 2020 – December 31, 2020)
April 2021

PJM©20212www.pjm.com | Public
Table of Contents
1. Planning• Generation Portfolio Analysis• Transmission Analysis• Load Forecast
2. Markets• Market Analysis• Net Energy Import/Export Trend
3. Operations• Emissions Data

PJM©20213www.pjm.com | Public
Executive Summary2020 Maryland & D.C. State Infrastructure Report
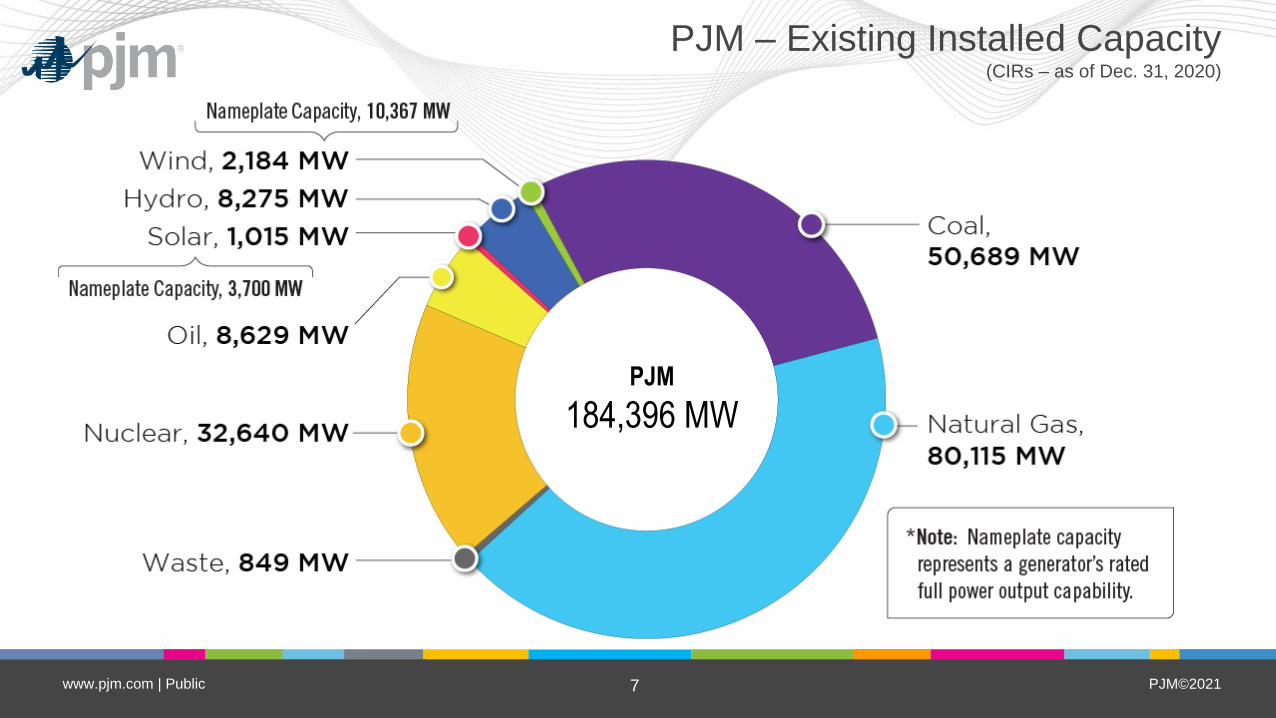
• Existing Capacity: Natural gas represents approximately 41.6 percent of the total
installed capacity in the Maryland service territory while coal represents
approximately 28 percent. Comparatively, across PJM natural gas and coal are at
43.4 and 27.5 percent of total installed capacity.
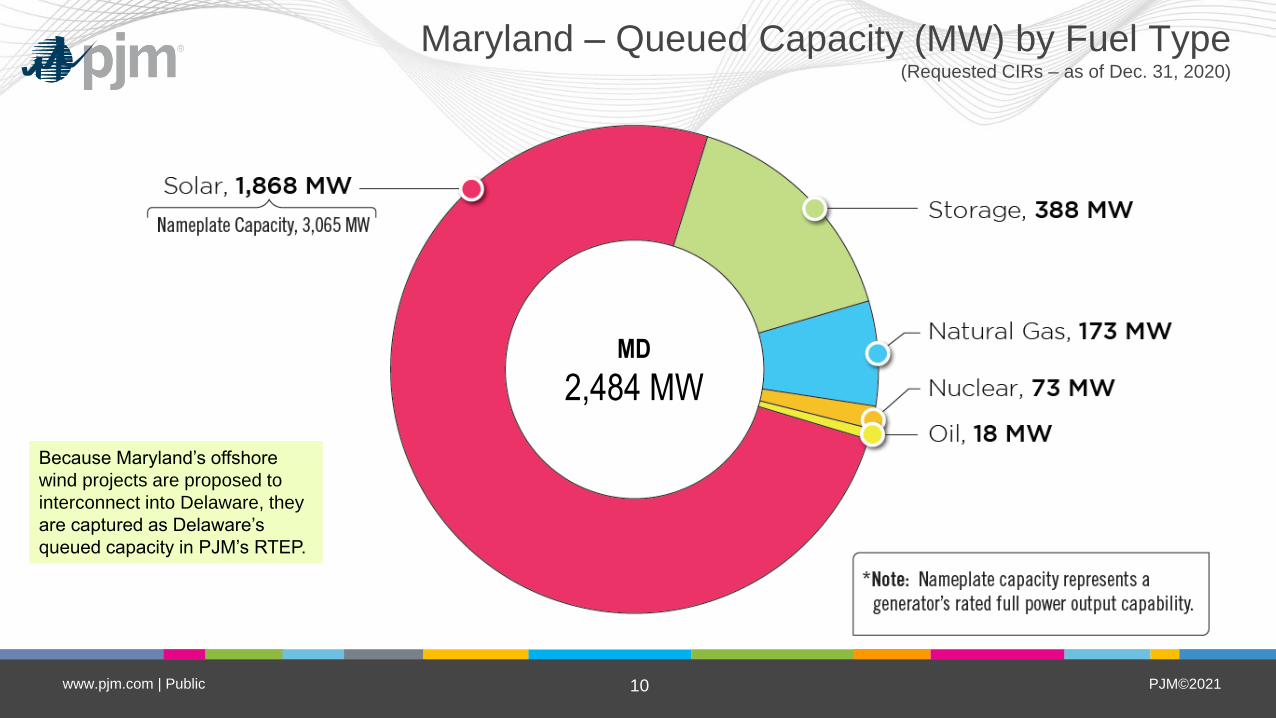
• Interconnection Requests: Solar represents 75.2 percent of new interconnection
requests in Maryland, while storage represents approximately 15.6 percent of new
requests.
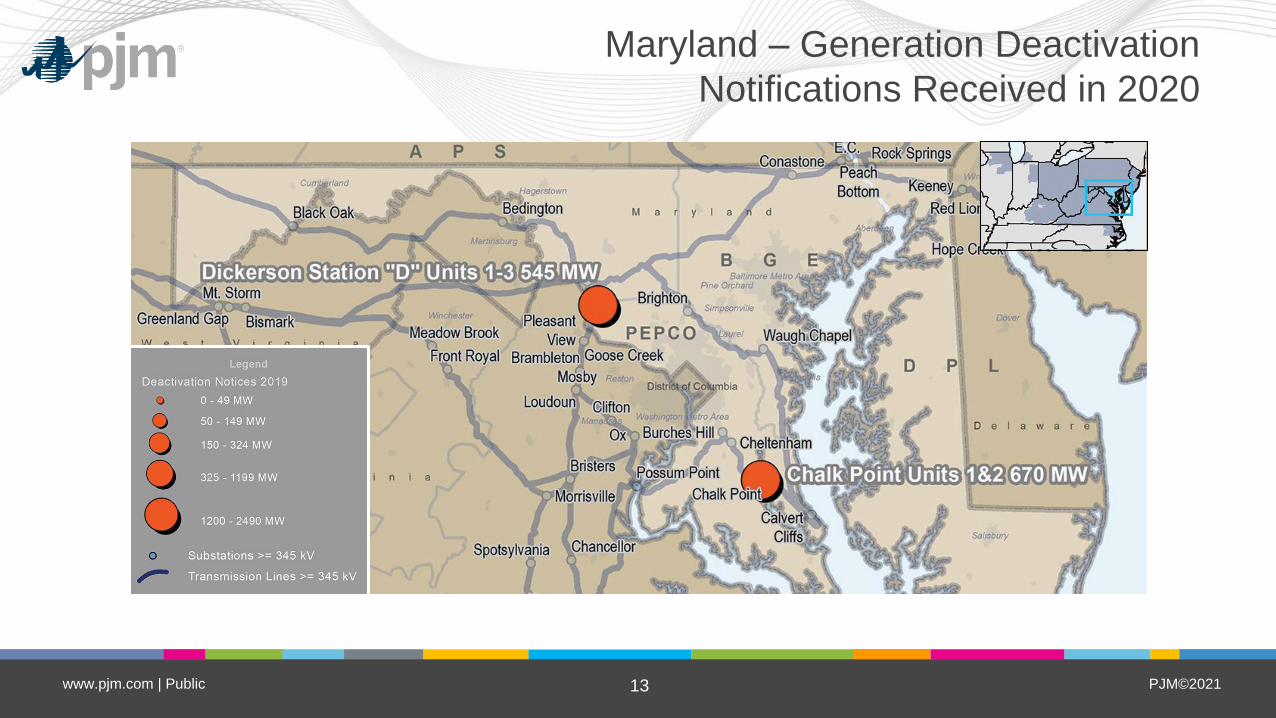
• Deactivations: 1,210.8 MW in Maryland provided notification of deactivation in
2020.
• RTEP 2020: Maryland’s 2020 RTEP projects total approximately $152.9 million in
investment, which is slightly down from the 2019 total. Approximately 90.2 percent
of that represents supplemental projects. These investment figures only represent
RTEP projects that cost at least $5 million.

PJM©20214www.pjm.com | Public
Executive Summary2020 Maryland & D.C. State Infrastructure Report
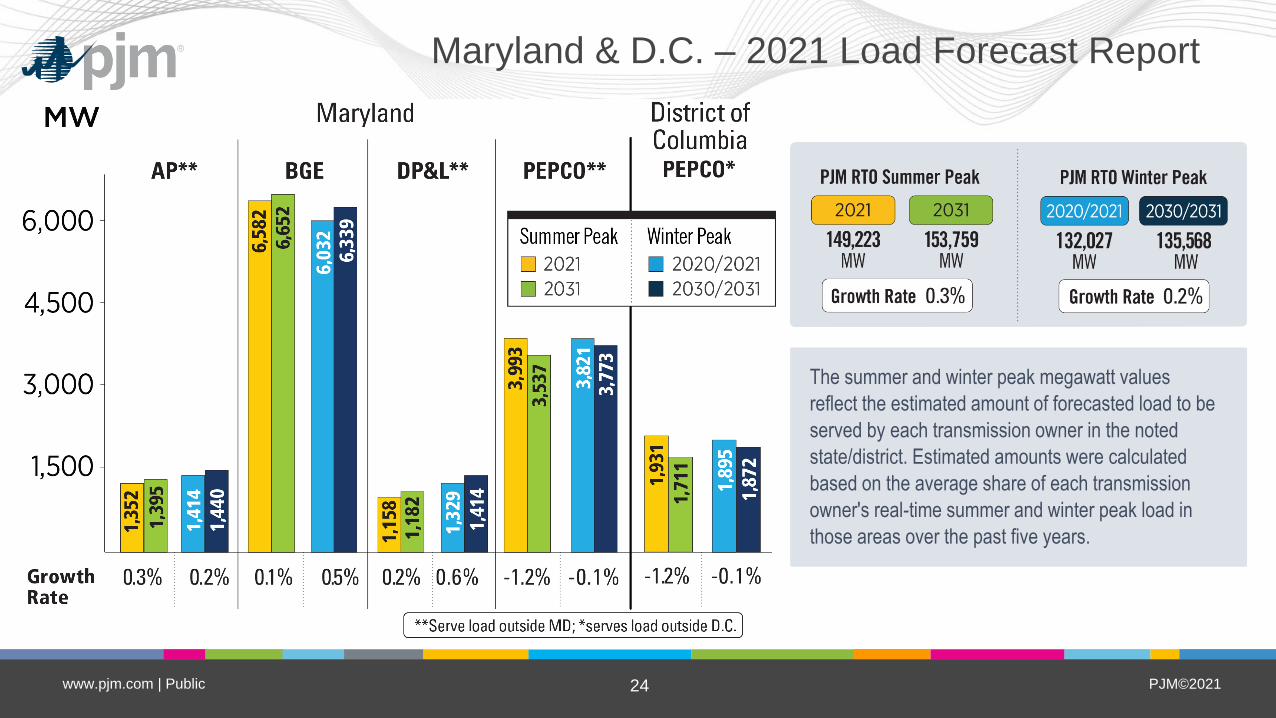
• Load Forecast: Maryland and Washington, D.C.’s projected summer peak load
growth is relatively flat, averaging between -1.2 and 0.3 percent annually over the
next 10 years depending on the service territory. Comparatively, the overall PJM
RTO projected load growth rate is 0.3 percent.
• 2022/23 Capacity Market: No Base Residual Auction was conducted in 2020. For
the most recent auction results, please see the 2018 Maryland & District of
Columbia State Infrastructure Report.
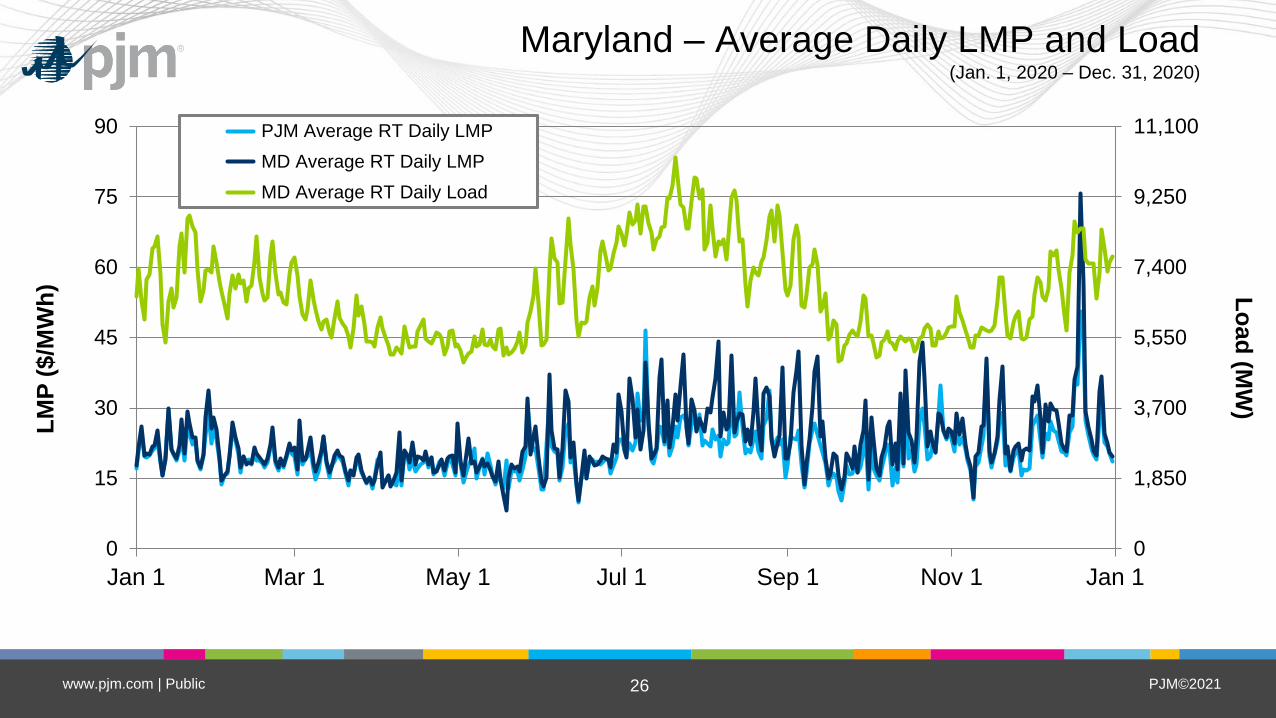
• 1/1/20 – 12/31/20 Market Performance: Maryland and D.C.’s average hourly
LMPs were slightly higher than the PJM average hourly LMP.
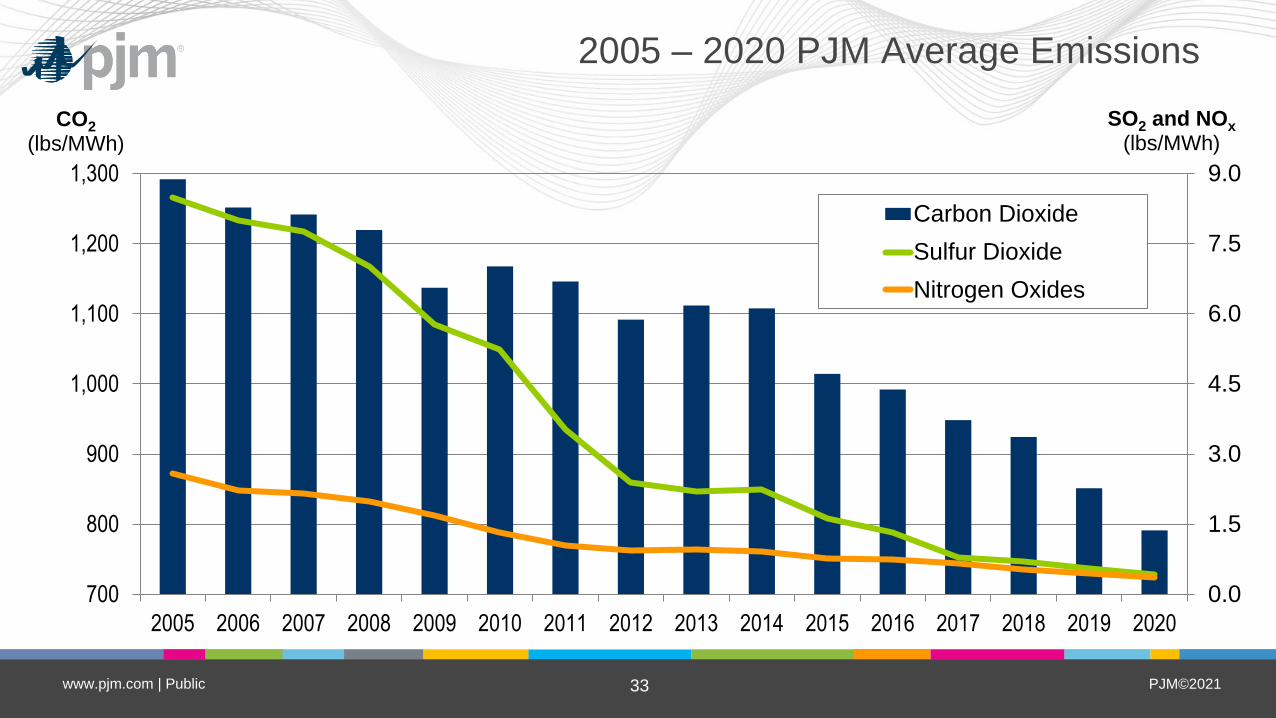
• Emissions: 2020 carbon dioxide, sulfur dioxide, and nitrogen oxide emissions in
Maryland decreased from 2019 levels.

PJM©20215www.pjm.com | Public
PJM Service Area – Maryland & D.C.

PJM©20216www.pjm.com | Public
Planning
Generation Portfolio Analysis
PJM©20217www.pjm.com | Public
PJM – Existing Installed Capacity(CIRs – as of Dec. 31, 2020)
PJM
184,396 MW

PJM©20218www.pjm.com | Public
Maryland – Existing Installed Capacity(CIRs – as of Dec. 31, 2020)
MD
13,079 MW

PJM©20219www.pjm.com | Public
PJM – Queued Capacity (MW) by Fuel Type(Requested CIRs – as of Dec. 31, 2020)
PJM
104,837 MW
PJM©202110www.pjm.com | Public
Maryland – Queued Capacity (MW) by Fuel Type(Requested CIRs – as of Dec. 31, 2020)
MD
2,484 MW
Because Maryland’s offshore
wind projects are proposed to
interconnect into Delaware, they
are captured as Delaware’s
queued capacity in PJM’s RTEP.
PJM©202111www.pjm.com | Public
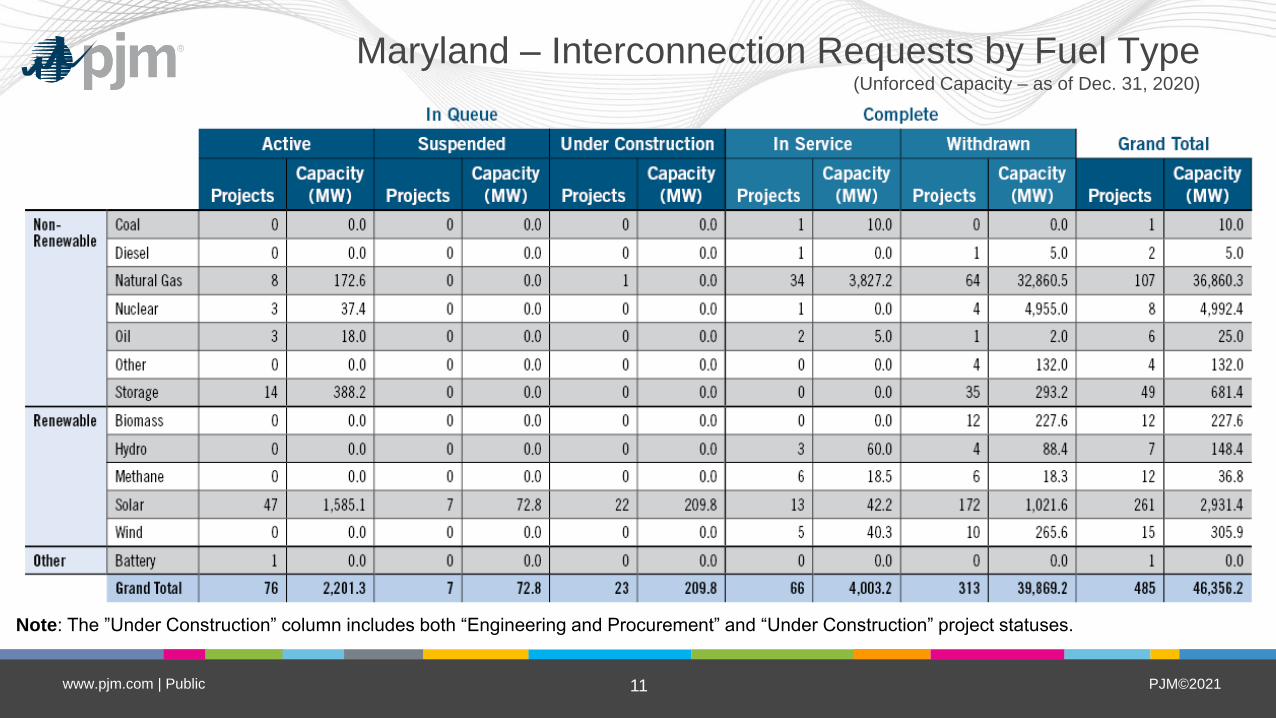
Maryland – Interconnection Requests by Fuel Type(Unforced Capacity – as of Dec. 31, 2020)
Note: The ”Under Construction” column includes both “Engineering and Procurement” and “Under Construction” project statuses.
PJM©202112www.pjm.com | Public
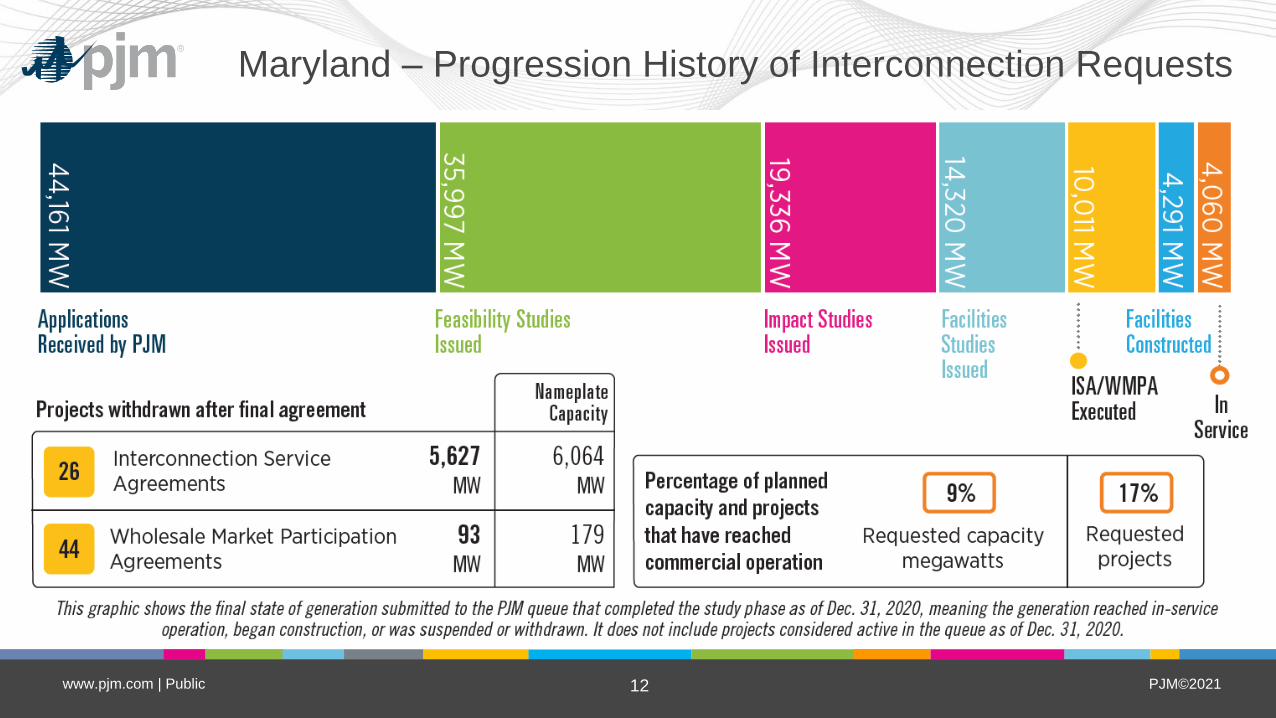
Maryland – Progression History of Interconnection Requests
PJM©202113www.pjm.com | Public
Maryland – Generation Deactivation
Notifications Received in 2020

PJM©202114www.pjm.com | Public
Maryland – Generation Deactivation
Notifications Received in 2020

PJM©202115www.pjm.com | Public
Planning
Transmission Infrastructure Analysis
PJM©202116www.pjm.com | Public
Please note that PJM historically used $5 million as the threshold for listing projects in the RTEP report.
Beginning in 2018, it was decided to increase this cutoff to $10 million. All RTEP projects with costs totaling
at least $5 million are included in this state report. However, only projects that are $10 million and above
are displayed on the project maps.
For a complete list of all RTEP projects, please visit the “RTEP Upgrades & Status – Transmission
Construction Status” page on pjm.com.
https://www.pjm.com/planning/project-construction

PJM©202117www.pjm.com | Public
Maryland – RTEP Baseline Projects(No baseline projects were planned in Washington, D.C. in the 2020 RTEP; Projects greater than $10 million)
Note: Baseline upgrades are those that resolve a system reliability criteria violation.

PJM©202118www.pjm.com | Public
Maryland – RTEP Baseline Projects(No baseline projects were planned in Washington, D.C. in the 2020 RTEP; Projects greater than $5 million)
Map
ID Project Description
Required
In-Service Date
Project
Cost ($M)
TO
Zone
TEAC
Date
1 b3155Rebuild approximately 12 miles of Wye Mills - Stevensville line to achieve needed
ampacity.12/1/2023 $15.00 DP&L 12/16/2019

PJM©202119www.pjm.com | Public
Maryland & D.C. – RTEP Network Projects(Projects greater than $5 million)
Note: Network upgrades are new or upgraded facilities required primarily to eliminate reliability criteria violations caused by proposed generation,
merchant transmission or long term firm transmission service requests, as well as certain direct connection facilities required to interconnect proposed
generation projects.
Maryland and Washington, D.C. had no network project upgrades in 2020.

PJM©202120www.pjm.com | Public
Maryland – TO Supplemental Projects(No supplemental projects were planned in Washington, D.C. in the 2020 RTEP; Projects greater than $10 million)
Note: Supplemental projects are transmission expansions or enhancements that are not required for compliance with PJM criteria and are not state
public policy projects according to the PJM Operating Agreement. These projects are used as inputs to RTEP models, but are not required for
reliability, economic efficiency or operational performance criteria, as determined by PJM.

PJM©202121www.pjm.com | Public
Maryland – TO Supplemental Projects(No supplemental projects were planned in Washington, D.C. in the 2020 RTEP; Projects greater than $5 million)
Map
ID Project Description
Projected
In-Service Date
Project
Cost ($M)
TO
Zone
TEAC
Date
1 s2209Rebuild two single-circuit 115 kV wood H-frame circuits (110617/110618) as one
double-circuit steel-pole line.12/31/2021 $21.40 BGE 3/20/2020
2 s2356
Rebuild 10 miles of existing Talbert-Oak Grove 230 kV double-circuit lattice tower
transmission lines 23067 and 23087 with new steel monopole structures along the
existing route.
12/1/2024 $38.00 PEPCO 9/1/2020
Construct two 69 kV substations along the existing Wye Mills to Stevensville circuit
and retire existing Grasonville substation.
Construct new five-breaker ring bus substation west of existing Grasonville substation
(w/30 MVAR Capacitor Bank).
Construct new five-breaker ring bus substation west of existing Wye Mills substation
(w/30 MVAR Capacitor Bank).
4 s2386
Rebuild and reconductor the FE portion of the Doubs-Goose Creek 500 kV line
(~14.8 miles of steel lattice tower construction) utilizing existing right-of-way. Replace
breaker disconnect switches, line metering and relaying, substation conductor and
breakers at Doubs 500 kV station.
6/1/2025 $60.00 AP 10/6/2020
10/15/20203 s2378 6/1/2023 $18.50 DP&L

PJM©202122www.pjm.com | Public
Planning
Load Forecast

PJM©202123www.pjm.com | Public
PJM Annual Load Forecasts (Jan. 2021)
PJM©202124www.pjm.com | Public
The summer and winter peak megawatt values
reflect the estimated amount of forecasted load to be
served by each transmission owner in the noted
state/district. Estimated amounts were calculated
based on the average share of each transmission
owner's real-time summer and winter peak load in
those areas over the past five years.
Maryland & D.C. – 2021 Load Forecast Report

PJM©202125www.pjm.com | Public
Markets
Market Analysis
PJM©202126www.pjm.com | Public
Maryland – Average Daily LMP and Load(Jan. 1, 2020 – Dec. 31, 2020)
Lo
ad
(MW
)L
MP
($/M
Wh
)
0
1,850
3,700
5,550
7,400
9,250
11,100
0
15
30
45
60
75
90
Jan 1 Mar 1 May 1 Jul 1 Sep 1 Nov 1 Jan 1
PJM Average RT Daily LMP
MD Average RT Daily LMP
MD Average RT Daily Load

PJM©202127www.pjm.com | Public
Maryland – Average Hourly LMP and Load(Jan. 1, 2020 – Dec. 31, 2020)
Maryland’s average hourly LMPs were slightly higher than the PJM average hourly LMP.
Lo
ad
(MW
)L
MP
($/M
Wh
)
0
1,500
3,000
4,500
6,000
7,500
9,000
0
10
20
30
40
50
60
0 2 4 6 8 10 12 14 16 18 20 22
Hour Beginning
PJM Average RT Hourly LMP
MD Average RT Hourly LMP
MD Average RT Hourly Load
PJM©202128www.pjm.com | Public
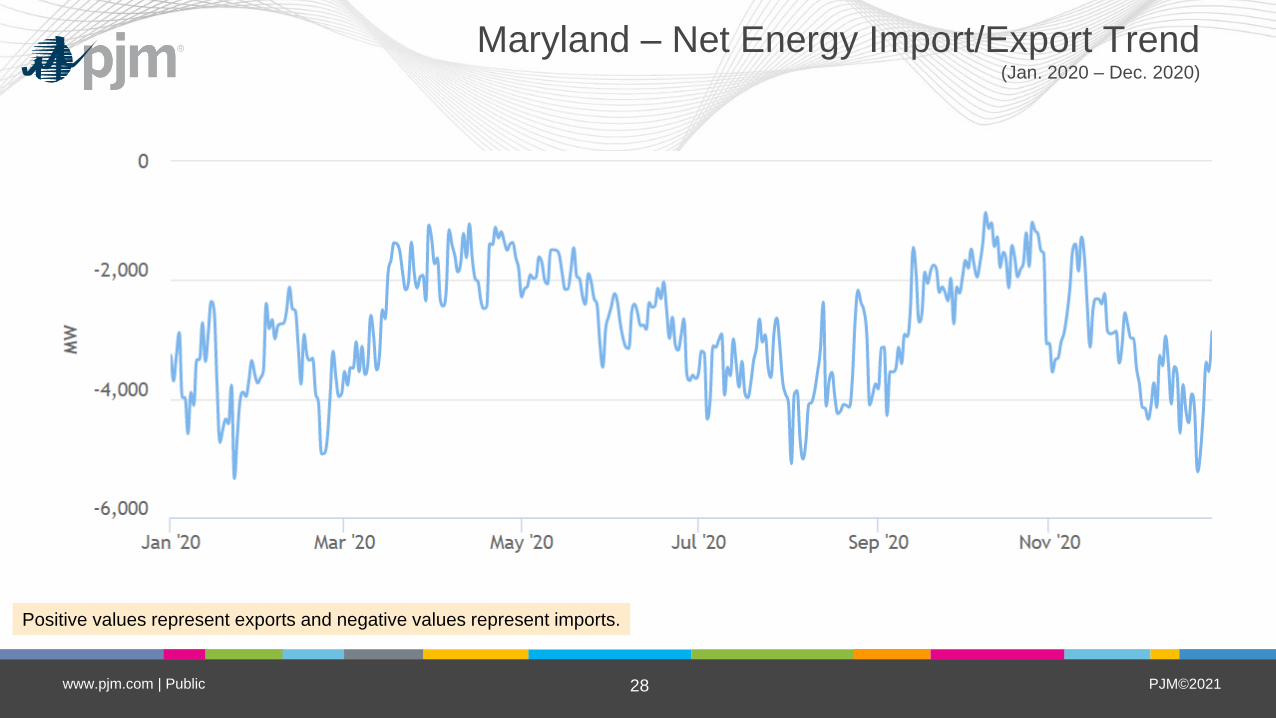
Maryland – Net Energy Import/Export Trend(Jan. 2020 – Dec. 2020)
Positive values represent exports and negative values represent imports.

PJM©202129www.pjm.com | Public
Washington, D.C. – Average Daily LMP and Load(Jan. 1, 2020 – Dec. 31, 2020)
Lo
ad
(MW
)L
MP
($/M
Wh
)
0
275
550
825
1,100
1,375
1,650
0
15
30
45
60
75
90
Jan 1 Mar 1 May 1 Jul 1 Sep 1 Nov 1 Jan 1
PJM Average RT Daily LMP
DC Average RT Daily LMP
DC Average RT Daily Load

PJM©202130www.pjm.com | Public
Washington, D.C. – Average Hourly LMP and Load(Jan. 1, 2020 – Dec. 31, 2020)
Washington, D.C.’s average hourly LMPs were slightly higher than the PJM average hourly LMP.
Lo
ad
(MW
)L
MP
($/M
Wh
)
0
250
500
750
1,000
1,250
1,500
0
10
20
30
40
50
60
0 2 4 6 8 10 12 14 16 18 20 22
Hour Beginning
PJM Average RT Hourly LMP
DC Average RT Hourly LMP
DC Average RT Hourly Load

PJM©202131www.pjm.com | Public
Washington, D.C. – Net Energy Import/Export Trend(Jan. 2020 – Dec. 2020)
Positive values represent exports and negative values represent imports.
PJM©202132www.pjm.com | Public
Operations
Emissions Data
PJM©202133www.pjm.com | Public
2005 – 2020 PJM Average Emissions
0.0
1.5
3.0
4.5
6.0
7.5
9.0
700
800
900
1,000
1,100
1,200
1,300
2005 2006 2007 2008 2009 2010 2011 2012 2013 2014 2015 2016 2017 2018 2019 2020
SO2 and NOx
(lbs/MWh) CO2
(lbs/MWh)
Carbon Dioxide
Sulfur Dioxide
Nitrogen Oxides

PJM©202134www.pjm.com | Public
Maryland – Average Emissions (lbs/MWh)(Feb. 2021)
0
2
4
6
8
10
12
14
16
600
700
800
900
1,000
1,100
1,200
1,300
1,400
2005 2006 2007 2008 2009 2010 2011 2012 2013 2014 2015 2016 2017 2018 2019 2020
SO2 and NOx
(lbs/MWh) CO2
(lbs/MWh)
Carbon Dioxide
Sulfur Dioxide
Nitrogen Oxides