2020 revenue sufficiency and rate study – water and
TRANSCRIPT

2020 Revenue Sufficiency and Rate Study – Water and Wastewater Systems Final Report / August 20, 2020
TOWN OF HIGHLAND BEACH

341 N. Maitland Avenue, Suite 300 Maitland, FL 32751
www.raftelis.com
August 20, 2020 Honorable Mayor and Members of the Town Commissioners Town of Highland Beach 3614 South Ocean Boulevard Highland Beach, FL 33487 Subject: 2020 Revenue Sufficiency and Rate Study – Water and Wastewater Systems Ladies and Gentlemen: Raftelis Financial Consultants, Inc. (“Raftelis”) is pleased to submit this report for your review and consideration regarding the preparation of a six- (6) year financial forecast (the “Financial Forecast”) for the water and wastewater utility enterprise fund (the “System”) operations on behalf of the Town of Highland Beach (the “Town”). The primary purpose of the development of the financial forecast was to identify the ability of the System operating revenues (derived essentially from bi-monthly rates for service) to adequately fund the expenditure requirements of the System, including the funding of the identified capital improvements or needs as identified by the Town (the “net revenue requirements”) and to propose adjusted rates to fully fund the cost of providing service and to promote a favorable fiscal position for the System to minimize financial risk (the “Financial Forecast”). The study also included an evaluation of the rate structure used to recover the cost of providing service and offers suggestions to more equitably recover the cost of providing service, continues to promote conservation, and follows industry norms. Specifically, the Financial Forecast focuses on the sufficiency of the existing rate revenues to fund the operation and maintenance expenses and the capital improvement plan and provide additional information to the Town with respect to the anticipated sources of available funding (i.e., anticipated indebtedness, increased operating margins from future rate adjustments, etc.) for the capital project and major maintenance expenditures identified for the Fiscal Year 2020 (the current budget year and referred to as the “Test Year”) and the projected Fiscal Years 2021 through 2029 (the “Projection Period” and including the Test Year, the “Forecast Period”). This attached report includes: i) a summary of the customer and billing statistics and rates for service; ii) a discussion of the significant assumptions used in the development of the Financial Forecast; iii) an analysis of the ability of revenues of the System to meet the estimated operating and capital expenditure requirements; iv) the presentation of the identified financing plan for the identified six- (6) year capital program; and v) proposed rates for service and a comparison of the proposed rates for the first year of the Projection Period. The analysis is based on detailed financial information provided by Town staff, including but not limited to, historical customer billing statistics, financial and operating records, and engineering reports. To the extent we have performed our analyses using data and information obtained from the Town, we have relied upon such information to be accurate, no assurances are intended, and no representation or warranties are made with respect thereto.
Honorable Mayor and Members of the Town Commission Town of Highland Beach August 20, 2020 Page 2
K:\DC\1104-03\Rpt\Rev Suffic Rpt - Final
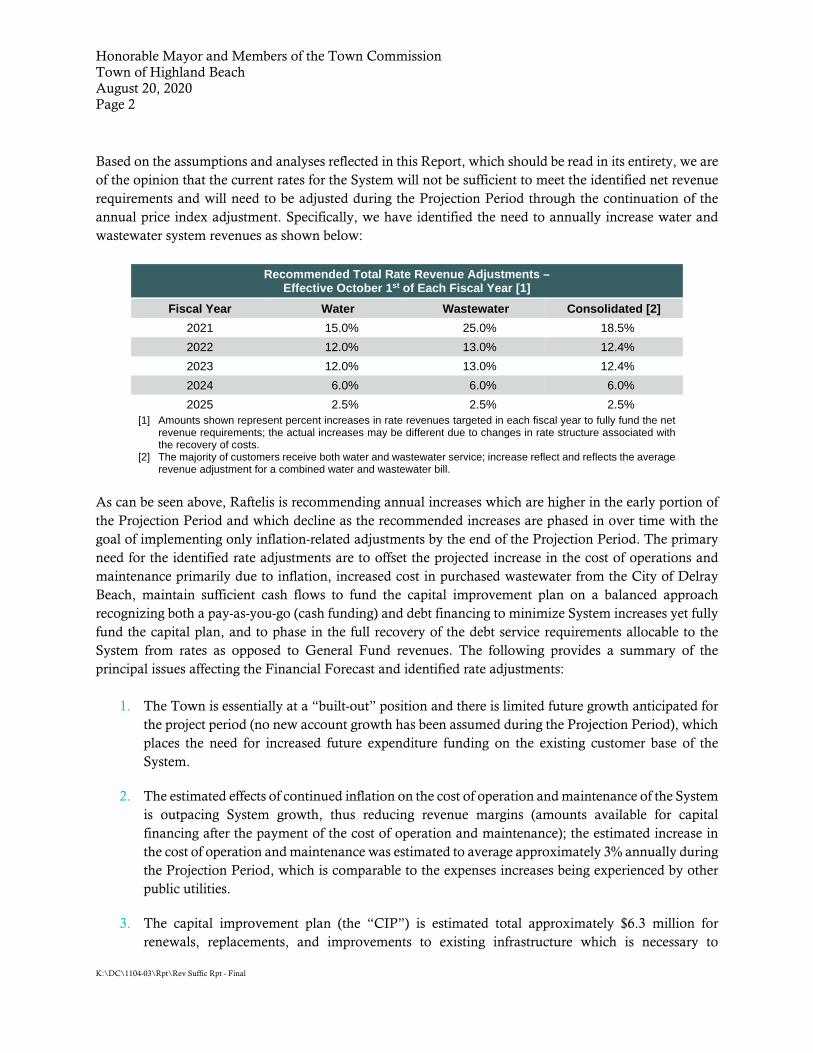
Based on the assumptions and analyses reflected in this Report, which should be read in its entirety, we are of the opinion that the current rates for the System will not be sufficient to meet the identified net revenue requirements and will need to be adjusted during the Projection Period through the continuation of the annual price index adjustment. Specifically, we have identified the need to annually increase water and wastewater system revenues as shown below:
Recommended Total Rate Revenue Adjustments – Effective October 1st of Each Fiscal Year [1]
Fiscal Year Water Wastewater Consolidated [2] 2021 15.0% 25.0% 18.5% 2022 12.0% 13.0% 12.4% 2023 12.0% 13.0% 12.4% 2024 6.0% 6.0% 6.0% 2025 2.5% 2.5% 2.5%
[1] Amounts shown represent percent increases in rate revenues targeted in each fiscal year to fully fund the net revenue requirements; the actual increases may be different due to changes in rate structure associated with the recovery of costs.
[2] The majority of customers receive both water and wastewater service; increase reflect and reflects the average revenue adjustment for a combined water and wastewater bill.
As can be seen above, Raftelis is recommending annual increases which are higher in the early portion of the Projection Period and which decline as the recommended increases are phased in over time with the goal of implementing only inflation-related adjustments by the end of the Projection Period. The primary need for the identified rate adjustments are to offset the projected increase in the cost of operations and maintenance primarily due to inflation, increased cost in purchased wastewater from the City of Delray Beach, maintain sufficient cash flows to fund the capital improvement plan on a balanced approach recognizing both a pay-as-you-go (cash funding) and debt financing to minimize System increases yet fully fund the capital plan, and to phase in the full recovery of the debt service requirements allocable to the System from rates as opposed to General Fund revenues. The following provides a summary of the principal issues affecting the Financial Forecast and identified rate adjustments:
1. The Town is essentially at a “built-out” position and there is limited future growth anticipated for the project period (no new account growth has been assumed during the Projection Period), which places the need for increased future expenditure funding on the existing customer base of the System.
2. The estimated effects of continued inflation on the cost of operation and maintenance of the System is outpacing System growth, thus reducing revenue margins (amounts available for capital financing after the payment of the cost of operation and maintenance); the estimated increase in the cost of operation and maintenance was estimated to average approximately 3% annually during the Projection Period, which is comparable to the expenses increases being experienced by other public utilities.
3. The capital improvement plan (the “CIP”) is estimated total approximately $6.3 million for renewals, replacements, and improvements to existing infrastructure which is necessary to

Honorable Mayor and Members of the Town Commission Town of Highland Beach August 20, 2020 Page 3
K:\DC\1104-03\Rpt\Rev Suffic Rpt - Final
maintain ongoing service for the benefit of the community. This level of spending is representative of amounts in prior studies and it is indicative of need to have an ongoing capital re-investment plan due to the assets continuing to reach their service lives. The need for asset replacement is becoming an increasing issue facing utilities in the Southeast Florida region. Funding for the CIP as identified in the Financial Forecast presented in this report is derived from existing cash reserves, future rate revenues, as well as the issuance of additional debt secured from the revenues of the System.
4. Historically, a significant amount of the capital improvements was financed from debt secured by the full faith and credit of the Town (i.e., a general obligation debt of the General Fund). As an enterprise fund and since the debt is for the benefit of the existing customers (represented the funding of asset replacements and System betterments), at the direction of the Town the debt repayment obligation being made from General Fund revenues is being phased out and being replaced as an obligation of the System. This equitably assigns the cost of debt recovery from those benefitting from the assets financed by the debt – the existing ratepayers of the System.
5. The proposed Fiscal Year 2021 rates for both water and wastewater service were compared with neighboring and peer communities and it is expected that the Town’s rates will remain competitive and that this position will continue during the Projection Period.
6. Based on the assumptions regarding the expenditure requirements as delineated in this report, which should be read in its entirety, and assuming that the Town implements the proposed rate increases as recommended, the revenues are projected to be sufficient to fully fund the identified net revenue requirements of the System, provides for an attainable finance plan that promotes a positive fiscal credit, and should allow for the ability to secure debt financing to fund a portion of its capital improvement plan, which will promote long-term System rate and service sustainability and affordability.
(Remainder of page intentionally left blank)

Honorable Mayor and Members of the Town Commission Town of Highland Beach August 20, 2020 Page 4
K:\DC\1104-03\Rpt\Rev Suffic Rpt - Final
We appreciate the opportunity to be of service to the Town in meeting its financial goals and objectives and would like to thank the Town and its staff for the valuable assistance and cooperation provided in the development of this report. Very truly yours,
Raftelis Financial Consultant, Inc. Robert J. Ori Executive Vice President Mark Tuma Consultant RJO/dlc Attachments

K:\DC\1104-01\Rpt\Final\Rev Suffic Rpt - Finalt -v-
TOWN OF HIGHLAND BEACH, FLORIDA
2020 REVENUE SUFFICIENCY AND RATE STUDY – WATER AND WASTEWATER SYSTEMS
TABLE OF CONTENTS
Letter of Transmittal
Table of Contents ........................................................................................................................ i
List of Tables ............................................................................................................................. ii
Introduction ............................................................................................................................ 1
Financial Forecast and Rate Analysis Methodology ............................................................. 2
Existing Water Rates .............................................................................................................. 3
Historical and Projected System Sales and Customer Usage Statistics and Demands .......... 4
General .............................................................................................................................. 4
Projected Customer and Sales Statistics ........................................................................... 4
Financial Forecast and Sufficiency of Existing Rate Revenues ............................................ 7
General .............................................................................................................................. 7
Principal Considerations and Assumptions Regarding Projected Operating Results ............ 9
Net Revenue Requirements – Water System ........................................................................ 18
Net Revenue Requirements – Wastewater System ............................................................... 19
Net Revenue Requirements – Combined System ................................................................. 21
Projected Reserve Fund Transfers ........................................................................................ 23
Proposed Rates for Service ................................................................................................... 25
General ............................................................................................................................. 25
Proposed Fiscal Year 2021 Water System Rates ............................................................. 26
Proposed Fiscal Year 2021 Wastewater System Rates .................................................... 29
Proposed Fiscal Year 2022 – 2025 Rates ......................................................................... 31
Rate Comparisons ................................................................................................................. 31
Conclusions and Rate Recommendations ............................................................................. 34
K:\DC\1104-03\Rpt\Rev Suffic Rpt - Final -vi-
TOWN OF HIGHLAND BEACH, FLORIDA
2020 REVENUE SUFFICIENCY AND RATE STUDY –
WATER AND WASTEWATER SYSTEMS
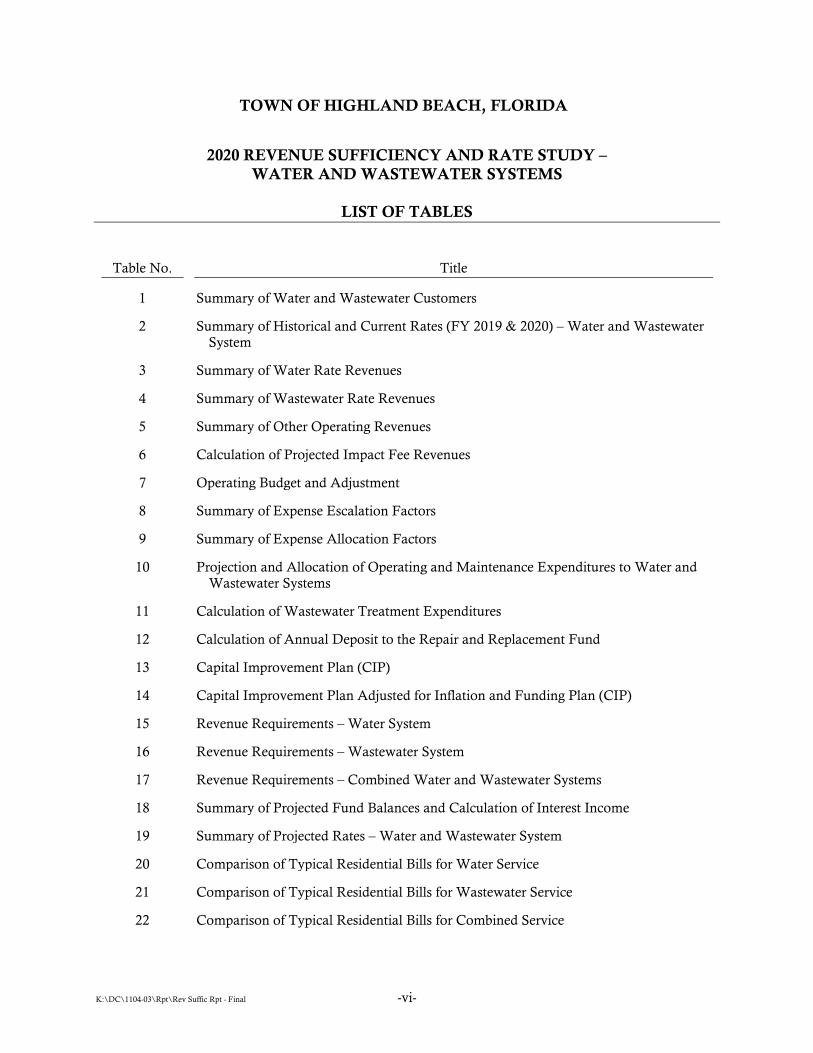
LIST OF TABLES
Table No. Title
1 Summary of Water and Wastewater Customers
2 Summary of Historical and Current Rates (FY 2019 & 2020) – Water and Wastewater System
3 Summary of Water Rate Revenues
4 Summary of Wastewater Rate Revenues
5 Summary of Other Operating Revenues
6 Calculation of Projected Impact Fee Revenues
7 Operating Budget and Adjustment
8 Summary of Expense Escalation Factors
9 Summary of Expense Allocation Factors
10 Projection and Allocation of Operating and Maintenance Expenditures to Water and Wastewater Systems
11 Calculation of Wastewater Treatment Expenditures
12 Calculation of Annual Deposit to the Repair and Replacement Fund
13 Capital Improvement Plan (CIP)
14 Capital Improvement Plan Adjusted for Inflation and Funding Plan (CIP)
15 Revenue Requirements – Water System
16 Revenue Requirements – Wastewater System
17 Revenue Requirements – Combined Water and Wastewater Systems
18 Summary of Projected Fund Balances and Calculation of Interest Income
19 Summary of Projected Rates – Water and Wastewater System
20 Comparison of Typical Residential Bills for Water Service
21 Comparison of Typical Residential Bills for Wastewater Service
22 Comparison of Typical Residential Bills for Combined Service
K:\DC\1104-03\Rpt\Rev Suffic Rpt - Final -1-
TOWN OF HIGHLAND BEACH, FLORIDA
2020 REVENUE SUFFICIENCY AND RATE STUDY – WATER AND WASTEWATER SYSTEMS
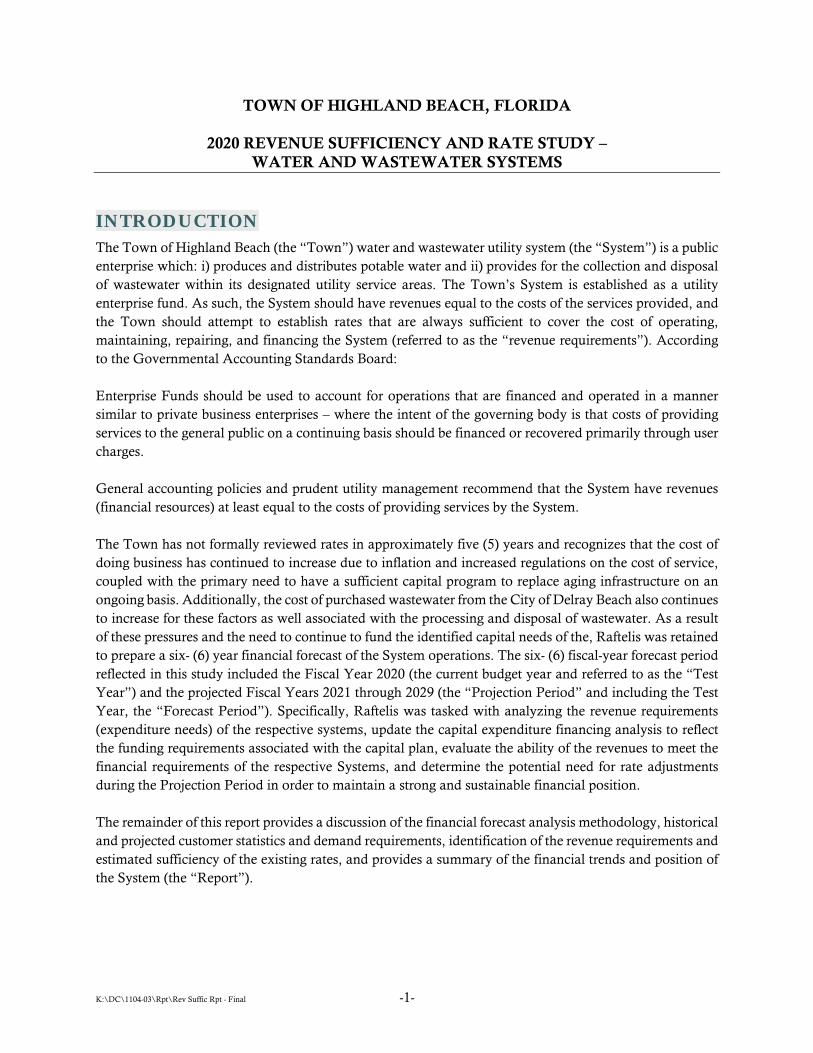
INTRODUCTION The Town of Highland Beach (the “Town”) water and wastewater utility system (the “System”) is a public enterprise which: i) produces and distributes potable water and ii) provides for the collection and disposal of wastewater within its designated utility service areas. The Town’s System is established as a utility enterprise fund. As such, the System should have revenues equal to the costs of the services provided, and the Town should attempt to establish rates that are always sufficient to cover the cost of operating, maintaining, repairing, and financing the System (referred to as the “revenue requirements”). According to the Governmental Accounting Standards Board: Enterprise Funds should be used to account for operations that are financed and operated in a manner similar to private business enterprises – where the intent of the governing body is that costs of providing services to the general public on a continuing basis should be financed or recovered primarily through user charges. General accounting policies and prudent utility management recommend that the System have revenues (financial resources) at least equal to the costs of providing services by the System. The Town has not formally reviewed rates in approximately five (5) years and recognizes that the cost of doing business has continued to increase due to inflation and increased regulations on the cost of service, coupled with the primary need to have a sufficient capital program to replace aging infrastructure on an ongoing basis. Additionally, the cost of purchased wastewater from the City of Delray Beach also continues to increase for these factors as well associated with the processing and disposal of wastewater. As a result of these pressures and the need to continue to fund the identified capital needs of the, Raftelis was retained to prepare a six- (6) year financial forecast of the System operations. The six- (6) fiscal-year forecast period reflected in this study included the Fiscal Year 2020 (the current budget year and referred to as the “Test Year”) and the projected Fiscal Years 2021 through 2029 (the “Projection Period” and including the Test Year, the “Forecast Period”). Specifically, Raftelis was tasked with analyzing the revenue requirements (expenditure needs) of the respective systems, update the capital expenditure financing analysis to reflect the funding requirements associated with the capital plan, evaluate the ability of the revenues to meet the financial requirements of the respective Systems, and determine the potential need for rate adjustments during the Projection Period in order to maintain a strong and sustainable financial position. The remainder of this report provides a discussion of the financial forecast analysis methodology, historical and projected customer statistics and demand requirements, identification of the revenue requirements and estimated sufficiency of the existing rates, and provides a summary of the financial trends and position of the System (the “Report”).

K:\DC\1104-03\Rpt\Rev Suffic Rpt - Final -2-
FINANCIAL FORECAST AND RATE ANALYSIS METHODOLOGY In developing the Financial Forecast, the rate revenue requirements are based on an approach that is commonly used by public utilities throughout the industry. The approach generally supports the budget / cash flow determination needs of the System and included:
1. An evaluation of the service area requirements for the individual water and wastewater systems. This included a review of recent historical customers served and corresponding respective usage and water production / wastewater treatment requirements such that: i) a representative forecast of System needs by specific system from a financial standpoint could be prepared; ii) a projection of rate revenues consistent with the projected service area needs could be developed; and iii) to identify the variable costs associated with meeting the water production and wastewater treatment- related service area demands.
2. A projection of the net revenue requirements from rates, which equates to the expenditure requirements funded from monthly user charges, was analyzed. A summary of the determination of the Net Revenue Requirements is shown below:
+ Cost of Operation and Maintenance + Debt Service Payments (Senior and Subordinate) + Transfers to Repair and Replacement Fund / Capital Funded from Operations +/– Operating and Capital Reserve + Working Capital Reserves / Financial Compliance – Interest Income – Other Operating Revenue / Other Transfers in = Net Revenue Requirements (Funded from Rates)
3. Included as a component of Net Revenue Requirements was the development of a funding plan for the System capital improvements. The funding of these improvements recognized the following parameters: i) the use of available (unencumbered) operating reserves or other available cash balances as a first priority (above targeted reserve balances); ii) the use of Impact Fees, to the extent available, to fund expansion-related System capital expenditures; iii) the recognition of a pay-as-you-go (PAYGO) capital funding program (e.g., funded by deposits to a Repair and Replacement Fund [discussed in more detail later in this Report]) to finance capital projects that primarily benefit existing rate payers; and iv) the use of additional debt / loans to fund large capital expenditures (initially financed from ad-valorem tax revenues accounted for in the Town’s General Fund but planned to be funded from System net revenues) as discussed with Town staff.
4. Perform a review and projection of the Town’s System cash account and fund balances to maintain adequate operating reserves to provide funds for unexpected expenditures (say due to a storm event), to economically attract external funds to finance the capital program, and to minimize the overall financial risk of the System.
5. An evaluation of compliance with internal financial targets and rate covenants associated with any assumed additional debt requirements, if applicable during the Projection Period.

K:\DC\1104-03\Rpt\Rev Suffic Rpt - Final -3-
6. The determination of the identified and projected annual rate adjustments required to fund the net revenue requirements and the overall financial needs of the Utility.
EXISTING WATER RATES The existing water rates were became effective on October 1, 2019 pursuant to the adoption of Resolution No. 19-026R by the City Commission on November 5, 2019 (the “Rate Resolution”) associated with a rate evaluation in Fiscal Year 2015 (supported the implementation of a five- (5) year rate phasing plan and the rates placed into effect for the Fiscal Year 2020 represented the last year of such rate phasing plan). The existing water rates that are currently in effect for the Fiscal Year 2020 are summarized below and on Table 2:
Bi-monthly Water Rate Schedule
Bi-monthly Service Charge: Residential (Single- and Multi-Family) and Commercial Service [1] [2]
Current Rate Flat Charge – All Dwelling Units $33.59
Residential (Single-Family) and Commercial Service (per Account)
Bi-monthly Usage Charges 0 – 19,000 Gallons $2.41 per 1,000 Gallons 20,000 – 49,000 Gallons $4.18 per 1,000 Gallons 50,000 Gallons or More $5.15 per 1,000 Gallons
Multi-Family Service (per Unit)
0 – 13,000 Gallons $2.41 per 1,000 Gallons 14,000 – 23,000 Gallons $4.18 per 1,000 Gallons 24,000 Gallons or More $5.15 per 1,000 Gallons
__________ [1] Amounts shown derived from the Rate Resolution. [2] Metering of multi-family accounts where a single meter is installed in a
water connection serving a multi-family structure, the minimum monthly service charge shall be not less than an amount equal to the number of dwelling units multiplied by the flat bi-monthly rate.
As shown above, the Town has a conservation-promoting water rate structure. This initiative taken by the Town is consistent with the water use policies of the South Florida Water Management District (the “SFWMD”) to encourage water conservation efforts.
Bi-monthly Wastewater Rate Schedule
Bi-monthly Service Charge: Residential (Single- and Multi-Family) and Commercial Service [1]
Current Rate Flat Charge – per Dwelling Unit $44.03
__________ [1] Amounts shown derived from the Rate Resolution; all wastewater charges are
currently billed on a “Flat Rate” basis.

K:\DC\1104-03\Rpt\Rev Suffic Rpt - Final -4-
HISTORICAL AND PROJECTED SYSTEM SALES AND CUSTOMER USAGE STATISTICS AND DEMANDS
General The projection of the number of customer accounts and the corresponding metered and billed water use (i.e., customer demands) are referred to as the “customer statistics” and serve as the basis for developing the projected rate revenues for the Forecast Period. The customer statistics consist of two main components, which include: i) the number of individual meters in active service (customers) and the corresponding units served by such meters; and ii) their respective demand (metered or billed use) for water service per consumption block or usage range. An updated projection of the Town’s customer service area demands and growth was developed based on discussions with Town staff, recognition of recent historical trends in customers served, the amount of metered water consumption per account and by customer class, and recognition of current economic conditions. The evaluation of the customer statistics is also necessary to have a proper matching of rate revenues anticipated to be received under existing fee schedules with the projected operating and capital expenditure requirements of the respective systems. This is significant since revenues derived from the application of the rates for monthly service (user charges) currently account for approximately 92% of the total estimated System revenues (exclusive of the use of funds from the General Fund for allocated utility debt repayment). For purposes of this financial analysis and in order to assist the Town in its continuing long-term financing efforts, a financial projection period encompassing the historical Fiscal Year 2019 (which at the time of the initiation of the study was the most recently completed fiscal year), the current Fiscal Year 2020 which is the budget year in effect at time the study was being prepared (the "Test Year"), and the subsequent five (5) Fiscal Years 2020 through 2025 (the Study focused on the five Fiscal Years ending 2025 and was previously defined as the “Projection Period”). This length of analysis was recognized in order to identify trends in the cost of providing service, to examine the estimated near term financial effects of funding the Town’s five- (5) year capital improvement program, and initiate the full funding of the System allocated debt service requirements from rate revenues.
Projected Customer and Sales Statistics During the Fiscal Year 2019, it is estimated that the Town provided water and wastewater service to an average of 461 retail customers representing approximately 4,334 equivalent residential dwelling units (“EDU”). An EDU is generally representative of the average daily capacity or demands of a single-family residential unit and generally represents the lowest level and the most common level of use and is used to evaluate the size and capacity needs of a utility system. Since multi-family (condominiums) and commercial customers may be served by a larger-sized meter than the standard residential customers and generally have different (higher) water usage per account / meter requirements, it is useful to equate such customers on an equivalent basis to the single-family residential class to provide a more consistent presentation of the total customer base served. The estimated EDUs were based on the data contained in the utility customer billing program; no detailed evaluation of the EDUs allocated to a particular customer was performed in this study since it was not part of our scope of services. The Town reports that all the water customers also receive wastewater service. The following table provides details concerning the composition of the estimated water customer base during the Fiscal Years 2018 and estimated for Fiscal Year 2019:

K:\DC\1104-03\Rpt\Rev Suffic Rpt - Final -5-
Historical Water System Customer Statistics by Class [1]
Fiscal Year Ended September 30, 2018 2019
Single-family Residential Customers: Average Annual Accounts 384 381 Average Annual EDUs 384 384 Annual Consumption (000s Gallons) 142,015 118,258 Average Monthly Use per EDU 30,819 25,866
Multi-family Residential Customers:
Average Annual Accounts 78 78 Average Annual Units 3,883 3,883 Average Annual EDUs 3,883 3,883 Annual Consumption (000s Gallons) 283,021 244,853 Average Monthly Use per EDU 6,074 5,255
Commercial Customers:
Average Annual Accounts 5 5 Average Annual EDUs 132 132 Annual Consumption (000s Gallons) 18,614 17,888 Average Monthly Use per EDU 11,751 11,293
Total Water System:
Average Annual Accounts 467 464 Average Annual EDUs 4,399 4,396 Annual Consumption (000s Gallons) 443,650 380,999 Average Monthly Use per EDU 8,404 7,222
Finished Water Produced (000s Gallons) 414,860 408,288 Non-Revenue Water (Unbilled) as Percent of Production ---% 6.68% __________ EDU = Equivalent Residential Dwelling Unit [1] Amounts shown derived from Table 1 at the end of this Report and were based on detailed customer
billing data as provided by Town staff.
(Remainder of page intentionally left blank)
K:\DC\1104-03\Rpt\Rev Suffic Rpt - Final -6-
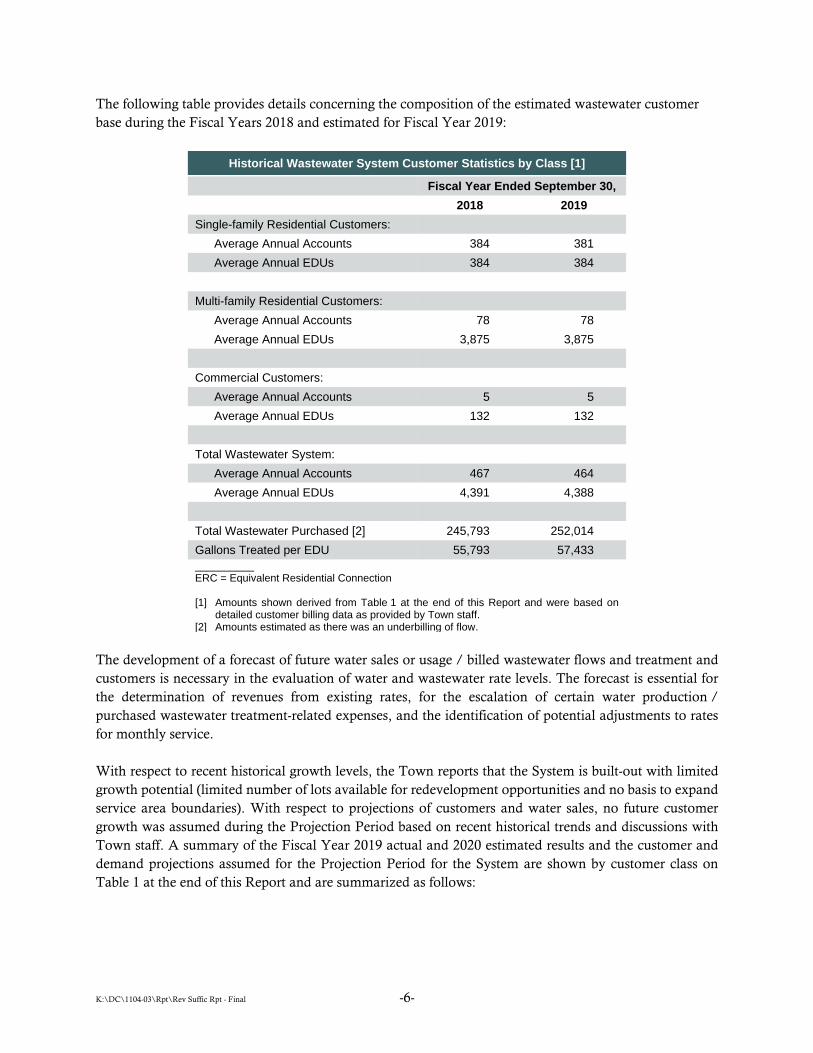
The following table provides details concerning the composition of the estimated wastewater customer base during the Fiscal Years 2018 and estimated for Fiscal Year 2019:
Historical Wastewater System Customer Statistics by Class [1]
Fiscal Year Ended September 30, 2018 2019
Single-family Residential Customers: Average Annual Accounts 384 381 Average Annual EDUs 384 384
Multi-family Residential Customers:
Average Annual Accounts 78 78 Average Annual EDUs 3,875 3,875
Commercial Customers:
Average Annual Accounts 5 5 Average Annual EDUs 132 132
Total Wastewater System:
Average Annual Accounts 467 464 Average Annual EDUs 4,391 4,388
Total Wastewater Purchased [2] 245,793 252,014 Gallons Treated per EDU 55,793 57,433 __________ ERC = Equivalent Residential Connection [1] Amounts shown derived from Table 1 at the end of this Report and were based on
detailed customer billing data as provided by Town staff. [2] Amounts estimated as there was an underbilling of flow.
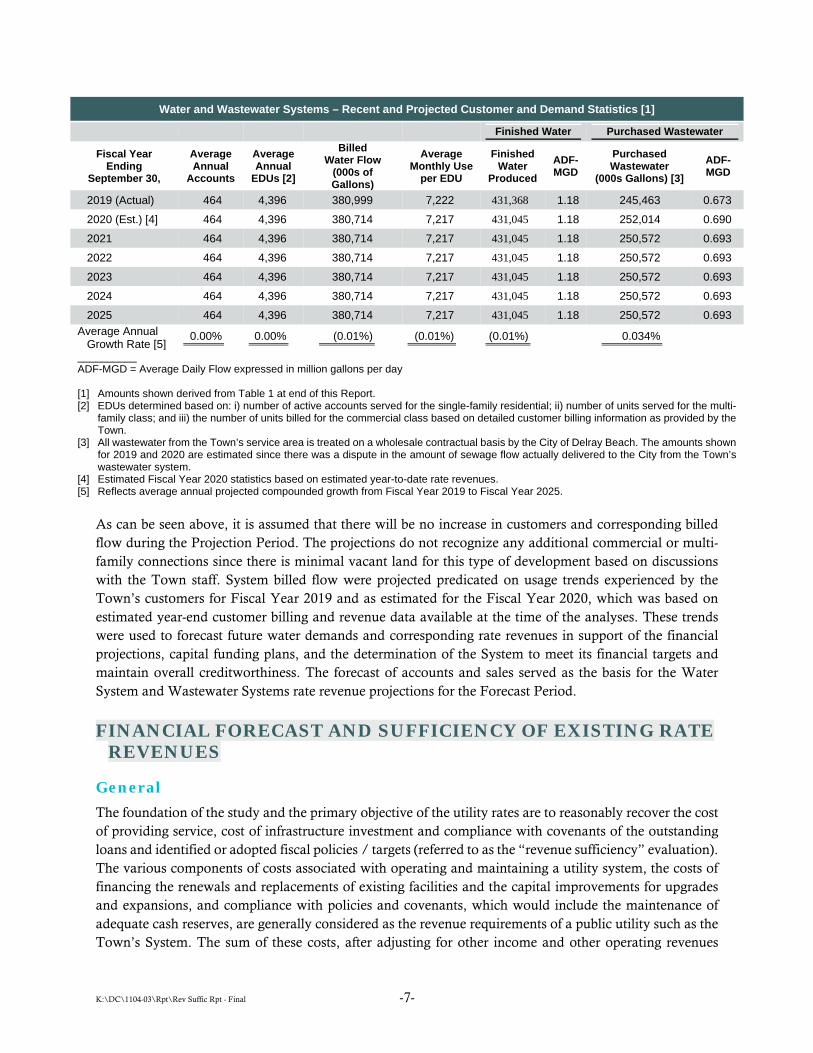
The development of a forecast of future water sales or usage / billed wastewater flows and treatment and customers is necessary in the evaluation of water and wastewater rate levels. The forecast is essential for the determination of revenues from existing rates, for the escalation of certain water production / purchased wastewater treatment-related expenses, and the identification of potential adjustments to rates for monthly service. With respect to recent historical growth levels, the Town reports that the System is built-out with limited growth potential (limited number of lots available for redevelopment opportunities and no basis to expand service area boundaries). With respect to projections of customers and water sales, no future customer growth was assumed during the Projection Period based on recent historical trends and discussions with Town staff. A summary of the Fiscal Year 2019 actual and 2020 estimated results and the customer and demand projections assumed for the Projection Period for the System are shown by customer class on Table 1 at the end of this Report and are summarized as follows:
K:\DC\1104-03\Rpt\Rev Suffic Rpt - Final -7-
Water and Wastewater Systems – Recent and Projected Customer and Demand Statistics [1]
Finished Water Purchased Wastewater
Fiscal Year Ending
September 30,
Average Annual
Accounts
Average Annual
EDUs [2]
Billed Water Flow
(000s of Gallons)
Average Monthly Use
per EDU
Finished Water
Produced ADF-MGD
Purchased Wastewater
(000s Gallons) [3] ADF- MGD
2019 (Actual) 464 4,396 380,999 7,222 431,368 1.18 245,463 0.673 2020 (Est.) [4] 464 4,396 380,714 7,217 431,045 1.18 252,014 0.690 2021 464 4,396 380,714 7,217 431,045 1.18 250,572 0.693 2022 464 4,396 380,714 7,217 431,045 1.18 250,572 0.693 2023 464 4,396 380,714 7,217 431,045 1.18 250,572 0.693 2024 464 4,396 380,714 7,217 431,045 1.18 250,572 0.693 2025 464 4,396 380,714 7,217 431,045 1.18 250,572 0.693
Average Annual Growth Rate [5]
0.00% 0.00% (0.01%) (0.01%) (0.01%) 0.034% __________ ADF-MGD = Average Daily Flow expressed in million gallons per day [1] Amounts shown derived from Table 1 at end of this Report. [2] EDUs determined based on: i) number of active accounts served for the single-family residential; ii) number of units served for the multi-
family class; and iii) the number of units billed for the commercial class based on detailed customer billing information as provided by the Town.
[3] All wastewater from the Town’s service area is treated on a wholesale contractual basis by the City of Delray Beach. The amounts shown for 2019 and 2020 are estimated since there was a dispute in the amount of sewage flow actually delivered to the City from the Town’s wastewater system.
[4] Estimated Fiscal Year 2020 statistics based on estimated year-to-date rate revenues. [5] Reflects average annual projected compounded growth from Fiscal Year 2019 to Fiscal Year 2025.
As can be seen above, it is assumed that there will be no increase in customers and corresponding billed flow during the Projection Period. The projections do not recognize any additional commercial or multi-family connections since there is minimal vacant land for this type of development based on discussions with the Town staff. System billed flow were projected predicated on usage trends experienced by the Town’s customers for Fiscal Year 2019 and as estimated for the Fiscal Year 2020, which was based on estimated year-end customer billing and revenue data available at the time of the analyses. These trends were used to forecast future water demands and corresponding rate revenues in support of the financial projections, capital funding plans, and the determination of the System to meet its financial targets and maintain overall creditworthiness. The forecast of accounts and sales served as the basis for the Water System and Wastewater Systems rate revenue projections for the Forecast Period.
FINANCIAL FORECAST AND SUFFICIENCY OF EXISTING RATE REVENUES
General The foundation of the study and the primary objective of the utility rates are to reasonably recover the cost of providing service, cost of infrastructure investment and compliance with covenants of the outstanding loans and identified or adopted fiscal policies / targets (referred to as the “revenue sufficiency” evaluation). The various components of costs associated with operating and maintaining a utility system, the costs of financing the renewals and replacements of existing facilities and the capital improvements for upgrades and expansions, and compliance with policies and covenants, which would include the maintenance of adequate cash reserves, are generally considered as the revenue requirements of a public utility such as the Town’s System. The sum of these costs, after adjusting for other income and other operating revenues

K:\DC\1104-03\Rpt\Rev Suffic Rpt - Final -8-
available to the utility, represents the net revenue requirements of a utility system required to be funded from monthly user charges or rates. The evaluation of the sufficiency of the existing rate revenues were identified independently on a water and wastewater system basis. The following figure provides and overview of the derivation of the net revenue requirement derivation:
The net revenue requirements signify a minimum level of expenditures required to be recovered from monthly user fees or rates. The development of the net revenue requirements of the System is a critical component of the study since water utility rates should be designed to fully recover the projected cost of providing service. The estimates of the revenue requirements associated with the System are consistent with methods generally employed by publicly owned utilities that rely on revenue bond financing to fund capital investment needs. The projected revenue requirements of the System can be organized into four main categories: i) operation and maintenance expenses (does not include capital, depreciation, debt service, or transfers); ii) annual principal and interest payments on existing and future debt / loans / notes allocable to the System (funded from rate revenues); iii) capital improvements to the utility infrastructure funded from System rates; and iv) transfers to other departments / cost centers and for the maintenance of reserves for the System to maintain or meet management objectives / policies regarding financial position and long-term sustainability of the System. The sum of these payments represent the gross revenue requirements of the respective Systems which are to be recovered from the available financial resources of such Systems, including where applicable rate revenues, other operating revenues and investment income, and impact fees (developer contributions), and available cash reserves.
(Remainder of page intentionally left blank)

K:\DC\1104-03\Rpt\Rev Suffic Rpt - Final -9-
PRINCIPAL CONSIDERATIONS AND ASSUMPTIONS REGARDING PROJECTED OPERATING RESULTS
In making the projections and estimates summarized in this Report, the principal considerations and assumptions made by Raftelis and the information and assumptions provided to us, or prepared by others, include the following:
1. The actual Fiscal Year 2019 operating results, the adopted Fiscal Year 2020 Budget, the estimated year-end operating results for Fiscal Year 2020, and the adopted Fiscal Year 2021 budget available at the time the analysis was preformed, as provided by the Town served as the baseline for the expenditure projections for the Fiscal Years 2020 and 2021. Such amounts were compared to prior period results and the underlying projections included therein by the Town were considered as being reasonable and have been assumed to reflect anticipated operations and overall System financial needs. The Fiscal Year 2021 Budget (the “Budget”) represented the most recent financial plan / forecast as approved by the Town Commission at the time of the analytical evaluations included in this Report. The Budget recognizes anticipated changes by System management in operations and costs based on known events, trends, and actual historical financial results and based on a comparison with actual Fiscal Year 2019 and estimated Fiscal Year 2020 results, certain adjustments were made to the Budget to reflect more current estimates; these adjustments are included Table 7 at the end of this Report. Such amounts were incorporated into the Fiscal Year 2021 component of the Forecast Period except for certain adjustments and assumptions as noted hereunder and served as the basis for the operating expense forecast.
2. Projected revenues from current rates and charges for the Town’s water and wastewater utility systems have been based on the schedule of rates and charges currently in effect as adopted by the Town Commission pursuant to the Rate Resolution. Such rates and charges were applied to the forecast of water and wastewater customers and sales forecast for the individual systems as previously discussed.
3. The Town currently charges an impact fee to new customer growth or development to recover the pro rata share of the System cost of water and/or wastewater capacity allocable to such customers. Since no growth was assumed for the Projection Period, no impact fee revenues have been assumed. As discussed later in the report, the Town does have certain impact fee funds on deposit in its impact fee account and it is recommended that the available impact fees be used to pay expansion-related debt service issued on behalf of the System since there was no expansion-related capital expenditures identified for the System during the Projection Period.
4. Included in the financial projections are other operating revenues associated with fire hydrant maintenance fees, interest income, disposition of fixed assets and administrative reimbursements, and other miscellaneous revenues. For the purposes of this Report, other operating revenues were based on: i) the Fiscal Year 2021 budgeted revenues; ii) a review of historical amounts received from such charges; and iii) discussions with the Town staff. Based on a review of such sources, it was assumed that such revenues would remain constant during the Projection Period.
5. The development of the projected operation and maintenance (operating) expenses for the Town’s individual water and wastewater systems was based upon: i) a review of recent cost escalation trends in expenses for the System; ii) the Fiscal Year 2020 operating budget and year-to-date actuals

K:\DC\1104-03\Rpt\Rev Suffic Rpt - Final -10-
and the Fiscal Year 2021 operating budget, which represents the most recent financial forecast as prepared by the Town; iii) expense cost trends based on actual results for the Historical Period; iii) historical cost indices as published the Bureau of Labor Statistics, the Florida Public Service Commission (used in regulation of private utilities), and in the Engineering News Record associated with the change in construction costs, iv) the forecast of the Consumer Price Index as prepared by the Congressional Budget Office and published in the February 2020 Economic and Budget Outlook; and v) certain other assumptions and considerations as identified within this report.
Projected operating expenses associated with operation of the System have been escalated from Fiscal Year 2021 levels based upon several assumptions and the nature of the expense. The 2021 Budget represented the Town’s current annual financial plan for the System at the time of the analysis and based on a comparison of such projections to recent reported amounts (Fiscal Year 2019 audited and Fiscal Year 2020 unaudited results), it was determined that the underlying assumptions used by the Town in the development of such budgets were considered reasonable and reflect reasonable costs for anticipated operations of the System. Such amounts were projected based on a variety of escalation parameters respective of the specific cost to provide service.
A summary of the projected operating expenses for the Water System is summarized below for the Projection Period:
Summary of Forecasted Water System Operating Expenses ($000s) [1]
Description 2020 2021 2022 2023 2024 2025 Allocated Salaries and Benefits $573,108 $598,800 $726,581 $750,659 $775,616 $801,483 Professional Fees and Other
Contractual Services 106,520 187,000 112,962 115,786 118,565 121,292
Communications 4,050 3,700 3,796 3,891 3,984 4,076 Telephone 0 0 0 0 0 0 Insurance 145,000 145,000 148,770 152,489 156,149 159,740 Electricity 300,000 300,000 307,890 315,988 324,298 332,827 Repairs and Maintenance 260,000 218,925 174,200 181,168 524,105 195,951 Administrative Charges 327,870 325,000 333,450 341,786 349,989 358,039 Operating Supplies 237,950 237,950 244,137 250,240 256,246 262,140 Contingency 67,925 72,294 75,635 78,266 80,727 83,082
Total Water Operating Expenses $2,022,423 $2,088,669 $2,127,421 $2,190,272 $2,589,679 $2,318,630 __________ [1] Amounts shown derived from Table 10 at end of this Report.
(Remainder of page intentionally left blank)

K:\DC\1104-03\Rpt\Rev Suffic Rpt - Final -11-
A summary of the projected operating expenses for the Wastewater System is summarized below for the Projection Period:
Summary of Forecasted Wastewater System Operating Expenses ($000s) [1]
Description 2020 2021 2022 2023 2024 2025 Allocated Salaries and Benefits $310,607 $324,205 $335,191 $346,570 $358,356 $370,566 Professional Fees and Other
Contractual Services 79,000 124,000 79,494 81,481 83,437 85,356
Communications 0 0 0 0 0 0 Telephone 0 0 0 0 0 0 Insurance 7,000 9,000 9,360 9,734 10,124 10,529 Electricity 40,000 40,000 41,052 42,132 43,240 44,377 Purchased Wastewater Treatment 959,755 988,052 909,542 936,816 964,924 993,866 Repairs and Maintenance 57,000 80,000 83,200 86,528 89,989 93,589 Administrative Charges 147,000 154,350 158,363 162,322 166,218 170,041 Operating Supplies 0 1,000 1,026 1,052 1,077 1,102 Contingency 38,693 41,892 38,461 39,602 40,770 41,966
Total Wastewater Operating Expenses $1,639,055 $1,762,499 $1,655,690 $1,706,237 $1,758,135 $1,811,391 __________ [1] Amounts shown derived from Table 10 at end of this Report.
The projected water and wastewater system revenue requirements, as shown on Table 10 at the end of this report, were based upon certain assumptions, considerations, and analyses. The major assumptions, considerations, and analyses that are included in the development of the projected revenue requirements for the study period are as:
a. Based on discussions with the Town, the escalation of wages and salaries above Fiscal Year 2021 budgeted amounts for the System was increased by approximately 3.0% annually to reflect increases due to inflation and allowances for salary adjustments such as merit increases and cost of living adjustments. Personnel benefits (i.e., contributions toward retirement, health insurance, FICA, Other-Post-Employment-Benefits, etc.) were projected to increase by approximately 5.0% annually due to recent projections of escalating costs of sustaining such benefits (e.g., medical insurance) in addition to discussions with the Town.
b. Based on discussions with the Town, no additional personnel above the amount of Full Time Equivalent positions as budgeted for the Fiscal Year 2021 for the System were assumed to be required during the remainder of the Projection Period.
c. Materials and supplies expenses, other contractual services expenses, repair and maintenance expenses, and certain other operating expenses for the System have been projected to increase in general from historical and current budgetary levels at an annual rate equal to inflation ranging from 2.3% to 4.0% based on the nature of the expenditure. These escalation factors were based on the Consumer Price Index forecast prepared by the Congressional Budget Office as contained in the Economic and Budget Outlook dated February 2020, trends experienced by other utilities, a review of recent trends in expenses for the System as reported by the Town, and discussions with the Town.

K:\DC\1104-03\Rpt\Rev Suffic Rpt - Final -12-
d. With respect to the projection of variable costs for water plant operations which included the cost for purchased power and chemicals for water pumping and treatment, such projections were based on the Town’s Budget and was escalated for the Forecast Period based on an allowance for inflation, which is consistent with recent historical trends, and the projection of flow requirements as discussed earlier in this Report. For the Forecast Period, the following was assumed for the variable expenses:
i. Current period System electrical expenses were increased during the Forecast Period by a general or base inflation allowance of 2.63% based on 20-year average change in the Consumer Price Index for All Urban Consumers for Electricity (CUSR0000SEFH01) as published by the Bureau of Labor Statistics as of June 2020 plus an allowance for increased finished water production, if any. Based on these assumptions, the increase in System electric expenses for the Water System was projected to average approximately 2.63% annually after Fiscal Year 2021 for the Projection Period (no increase in finished water production was assumed).
ii. Current period System chemical expenses were increased during the Forecast Period by a general or base inflation allowance of 2.54% based on 20-year average change in the Consumer Price Index for All Urban Consumers for Industrial Chemicals (WPU061) as published by the Bureau of Labor Statistics as of May 2020 plus an allowance for System growth. Based on these assumptions, the increase in System chemical expenses was projected to average approximately 2.54% annually after Fiscal Year 2020 for the Projection Period (no increase in finished water production was assumed).
e. Pursuant to the Amended and Restated Interlocal Agreement with the City of Delray Beach (the “City” or “Delray Beach”) dated May 21, 2004, the City provides all of the wastewater treatment services for the Town’s Wastewater System from its South Central Regional Wastewater Treatment Facility (the “Wastewater Service Agreement”). The Wastewater Service Agreement provides, among other things, for the rate to be charged to the Town, including the basis for any increases in costs will be passed along to the Town. The projected wastewater treatment expense is shown on Table 11 at the end of this Report and was based on the rates currently being charged by Delray Beach pursuant to the provisions of the Wastewater Service Agreement, projections of wastewater customers, and recent trends regarding the wastewater treated per EDU.
f. A contingency allowance equal to three percent (3.0%) for the respective Water and Wastewater Systems total operating expenses was recognized in each fiscal year of the Forecast Period beginning in Fiscal Year 2020. The allowance has been included in order to i) recognize unknown or unplanned expenditures that may occur throughout the fiscal year; and ii) provide an allowance for any potential negative changes in the revenues that may occur due to weather, conservation, and other factors, including customer adjustments due to changes in rate structure. This allowance increases the revenue requirements of the combined Water and Wastewater System by approximately $112,400 annually and is included as an operating expense for each specific utility with respect to the determination of total revenue requirements. To the extent the contingency allowance is not required to meet the projected operating expenses or provide funds for ongoing System operations, such monies would accrue to the benefit of the System and could be used for other purposes such as providing increased

K:\DC\1104-03\Rpt\Rev Suffic Rpt - Final -13-
funds for deposit to the Renewal and Replacement Fund to finance renewals, replacements, and upgrades to the System over time or to reduce potential rate adjustments that may be required in the future.
g. An allowance for bad debt expense has been made to recognize a certain amount of revenues that will be considered as uncollectible and written off throughout the year. This expenditure item has been included as an operating expense and was projected based on trends incurred by utilities statewide and discussions with Town staff. A bad debt expense ratio estimated at 0.15% of sales revenues was assumed for the Forecast Period and was projected to average $7,000 per year.
h. Although considered a System operating expense for financial reporting purposes, depreciation and amortization expenses have not been recognized as an Operating Expense for the purposes of this report. The analysis does recognize the dedicated funding of a capital fund associated with the accrual of funds for ongoing capital re-investment which is discussed later in this report.
6. The Town currently has four (5) outstanding series of loans issued on behalf of the Water System that represent a debt accounted for in the utility system but are secured for repayment by ad valorem taxes (General Fund revenues); there has been not loans issued by the Town to fund wastewater improvements. The following loans were outstanding as of September 30, 2019; they were issued by the Town on behalf of the Water System:
Current Principal Amount of Outstanding Loans Issued on Behalf of System
Issue Principal Outstanding [1]
Annual Debt Payment
Year of Final Maturity
Bank of America Promissory Note, 2007 (the “2007 Note”) $2,387,936 $296,880 2029
Revolving Fund Loan DW 500200 [2] 1,864,328 198,311 2030 Revolving Fund Loan DW 500201 [2] 495,729 52,136 2030 Revolving Fund Loan DW 502901 [2] 3,096,315 738,424 2024 Revolving Fund Loan DW 500210 [2] 4,367,393 263,472 2038 Total Outstanding Loans Allocated to
System (the “Outstanding Loans”) $12,211,701 $1,549,223 __________ [1] Amount outstanding as of October 1, 2019; all loans secured by the Town are for capital improvements
allocable to the Water System. [2] Amounts represent low-interest State Revolving Fund (“SRF”) loans administered by the Florida Department
of Environmental Protection. As can be seen above, a significant amount of the annual debt service on the Outstanding Loans will mature as 2030 which will provide a financial benefit to the System and allow for future leveraging (debt issue) capability. The annual debt service payments for each series of notes and loans are level (the same each year).
Historically (including the Fiscal Year 2020), the Town has funded the Outstanding Loans from General Fund revenues consistent with the pledge for repayment. Because these loans are secured for repayment from the Town’s General Fund and to identify the net revenue requirements of the System for our study, we have recognized i) the annual debt service associated with the Outstanding Loans as a component of the Water System revenue requirements since these loans

K:\DC\1104-03\Rpt\Rev Suffic Rpt - Final -14-
are directly associated with System capital financing activities and are accounted for as a System liability for financial reporting purposes, offset by ii) a transfer (contribution) from the General Fund as a financial resource to pay for the annual loan repayment requirements.
There are no loans that have been issued by the Town to finance any capital improvements for the Wastewater System; it should be noted that any capital improvements associated with the cost of wastewater treatment services purchased from Delray Beach is included as a component of the cost of purchased wastewater and is included as a component of the operating expenses for the System.
7. Based on discussions with the Town and to fully recognize that utility rates should fund the full cost of providing service, the payment of the annual debt service on the Outstanding Loans and any additional loans that may be issued in the future should be from System rate revenues and not from revenues realized within the General Fund. In the development of the financial forecast and to recognize the full cost recovery objective, the forecast assumes a phasing-out of the debt repayment solely from General Fund revenues to being fully funded from System rates (i.e., would be a transfer to the General Fund in support of the pledge of revenues for debt repayment). The change in funding of the annual debt service payment was fully modified by Fiscal Year 2025 (the last year of the Projection Period) as is summarized below:
Summary of Annual Debt Service Payment Funding – for the Projection Period [1]
Fiscal Year Total Annual Debt Service
Payment
Less Amounts
Funded from Connection Charges [2]
Total Net Annual Debt
Service Payment
Amount Funded from System Rate
Revenues
Amount Funded from
General Fund
Revenues 2020 $1,549,224 $--- $1,549,224 $119,224 $1,430,000
2021 1,549,224 (226,353) 1,322,871 264,574 1,058,297
2022 [3] 1,612,824 (234,202) 1,378,622 551,449 827,173
2023 1,676,424 (242,323) 1,343,101 860,461 573,640
2024 1,307,212 (250,726) 1,056,486 851,343 205,144
2025 938,000 (259,420) 678,580 678,580 --- __________ [1] Derived from Table 10 at the end of this report. [2] Based on discussions with the Town staff, it was recommended that the use of available Water System
Connection Fees be used to fund a portion of the annual Debt Service Payment on the Outstanding Loans; reference Assumption No. 8 below.
[3] During Fiscal Year 2022 and based on the assumed capital plan recognized for the Financial Forecast, additional loans are anticipated to be secured by the Town to fund a portion of the capital improvement plan; reference Assumption No. 9 below.
The change in the funding of the Outstanding Loan to System revenues is a major driver for the need to adjust System rates during the Projection Period.

K:\DC\1104-03\Rpt\Rev Suffic Rpt - Final -15-
8. As mentioned above, the financial forecast assumes the use of water-related connection fees to be applied towards the payment of the Outstanding Loans. Currently, the Town has on deposit $2.288 million in water connection fees which are available to fund expansion-related projects. Since the CIP is primarily driven by the need to perform renewals and replacements and a portion of the Outstanding Loans were issued to fund the expansion of the water treatment plant, the use of the connection fees to be applied to expansion-related debt was recognized to reduce the cash flow requirements from water rates. The use of connection fees to fund expansion-related debt is a lawful use of the fees collected. For the purposes of preparing the financial forecast, it was assumed that the available water connection fees would be used to pay the annual principal payments associated with the 2007 Note for the remaining term of the note since it was obtained for the purpose of financing the expansion of the Town’s water treatment plant. This served to reduce the debt funded from the General Fund by approximately $242,000 annually beginning in Fiscal Year 2021.
9. Based on the identified capital needs of the System as identified by the Town and as referenced on Table 14 of the report, it is anticipated that during the Forecast Period, additional System debt will be required to finance a portion of the capital improvement plan (“CIP”) (referred to as the “additional debt”). It is assumed that the additional debt will be issued on the same basis as the Outstanding Loans. Therefore, it is assumed that the debt will be considered as System debt and will be accounted for as a System liability for financial reporting purposes but the pledge for repayment will be secured from the revenues of the General Fund. Specifically, the financial forecast recognizes the issuance of in the aggregate principal amount of approximately $4.2 million in additional indebtedness during the Forecast Period.
The following is a summary of the assumed terms and assumptions associated with the issuance of the additional debt to finance a portion of the CIP:
Summary of Assumptions – Issuance of Additional Debt [1]
Issue Principal Amount Issued
Capital Projects
Being Financed
Assumed Issue Date
First Year of
Debt Payment
Average Annual Interest
Rate
Term (Yrs.)/ Assumed
Year of Maturity
Average Annual Debt
Payment from Rates [3]
2022 Additional Loan [1] $4,240,000 $4,175,291 April 2022 2022 [2] 3.0% 15 / 2037 $379,024 __________ [1] The 2022 Additional Loan has been recognized to fund a portion of the capital improvement program; reference Table 14 of report. [2] For the Fiscal Year 2022, a partial interest payment was assumed to be due based on the debt repayment schedule assumed for
the capital funding plan. [3] Based on discussions with Town staff, the financing schedule for the 2022 Additional Loan assumes the payment of interest-only
payments through April 2025 to “wrap” the debt payments after the maturity of the Revolving Fund Loan DW 502901 in 2024 to minimize the debt payments during the first two years of the Projection Period (full debt service payments begin in 2026).
10. In order to accrue funds to finance the ongoing capital re-investment requirements for the System, Raftelis is recommending that the Town annually fund an allowance for major capital repairs and ongoing or recurring capital improvements from rates. The funding of these expenditures should be on an annual basis in support of the capital funding process (similar to the recognition of depreciation expense on the financial statements for the System). Specifically, Raftelis recommends the establishment of a capital / repair-related account – the Capital Renewal and Replacement Fund – to allow the System to annually accrue funds to finance future capital improvements due to changes in regulation, service needs and other factors, pay for large recurring plant replacements (i.e., water treatment plant membranes), and fund ongoing annual or recurring

K:\DC\1104-03\Rpt\Rev Suffic Rpt - Final -16-
utility plant or asset replacements (i.e., vehicles and meters). It is recommended that in order to establish this fund the System should make an initial deposit from available operating reserves to initially provide monies to establish the fund; for the purposes of this Report it was assumed this deposit would be made during the Fiscal Year 2020 in the amount of $164,280 or 5% or prior System gross revenues. Additionally, a dedicated deposit to a capital-related account reflects industry norms and a positive management practice for the funding of a major portion of the repairs, renewals, replacements, rehabilitations, and betterments to a utility system and is considered as a prudent business practice by the bond rating agencies that evaluate utility credits. For the purposes of developing the financial forecast beginning in the Fiscal Year 2021, the deposit to the Capital Renewal and Replacement Fund was assumed to be equal ten percent (10%) of the prior year gross revenues and increased to 115% beginning in Fiscal Year 2023. Although a policy decision of the Town, the recommended funding level target for capital re-investment is 15% of prior year gross revenues and it is assumed that this funding level may be achieved after the Projection Period. This deposit was based on the capital improvement needs as developed by the Town and was assumed to be made annually from rate revenues, regardless of the timing of the expenditure requirement under the premise that the ratepayer should annually fund for the repairs and replacement of the utility assets used to provide service during such year (i.e., a depreciation equivalent). As shown on Table 12 and based on this funding assumption, the annual deposit to the Capital Renewal and Replacement Fund averaged approximately $486,000 during the Fiscal Years 2021 through 2025 (60% of current year depreciation expense).
With respect to the System, Raftelis is of the opinion that the Capital Renewal and Replacement Fund should be maintained to fund the ongoing capital needs of the respective systems and to limit the amount of future debt that may be issued by the Town on behalf of such system. Specifically the annual capital funding from rates provides a balanced capital funding plan since it: i) promotes pay-as-you-go (“PAYGO”) funding of these projects which are for renewals, repairs, and replacements of existing assets that have reached their service life and which generally benefit the existing ratepayer; ii) increases the Town’s equity in the System; iii) preserves the potential future debt leveraging capability of the System for expansion-related or large capital projects that normally would be funded from additional loans; and iv) promotes the long-term rate stability of the System. For the Forecast Period, the annual deposit to the Capital Renewal and Replacement Fund recognized from rates for capital PAYGO financing is as follows:
(Remainder of page intentionally left blank)

K:\DC\1104-03\Rpt\Rev Suffic Rpt - Final -17-
Annual Deposits to Capital Renewal and Replacement Fund for Capital Reinvestment (PAYGO) from System Operations [1]
Fiscal Year Ending September 30, 2020 2021 2022 2023 2024 2025
Initial Deposit from Operating Reserves: [2] $164,280 $0 $0 $0 $0 $0
Percent of Prior Year Gross Revenues 0% 10% 11% 11% 11% 11%
Water System:
Renewal and Replacement Deposit $0 $302,690 $383,752 $449,267 $502,497 $531,473
Wastewater System:
Renewal and Replacement Deposit $0 $36,482 $46,251 $54,147 $60,563 $64,055
Total System R&R Fund Deposits $164,280 $339,172 $430,003 $503,414 $563,060 $595,528 __________ [1] Amounts shown derived from Table 12 and assume the adoption of the identified rate adjustments as presented in this Report. [2] Amounts shown represents initial deposit from operating reserves to the Repair and Replacement Fund and is set equal to one- (1) year’s
depreciation expense. 11. Investment income on funds and accounts created by the Town (e.g., utility-related operating
reserves, Capital Renewal and Replacement Fund, etc.) has been estimated utilizing average annual interest rates ranging from 1.0% to 1.20% during the Forecast Period. We have also assumed that any interest earnings on any balances in the Connection Fee Funds and the Construction Funds (from future bond or loan proceeds on deposit for the System) will be deposited in the respective funds and not be available for operating expenses consistent with the provisions of the Florida State Statute 163 and case law (regarding impact fees) or pursuant to a loan agreement (note that no balances on these funds were assumed for the Forecast Period). Table 18 provides a summary of the transfers in and out of each fund / account and corresponding ending cash balances for each fund / account maintained by the Town on behalf of the System.
12. The capital improvement program for the respective Water and Wastewater Systems was based on: i) the Fiscal Year 2020 estimated capital expenditures; ii) the Fiscal Year 2021 five- (5) year capital improvement plan budget; iii) information provided by Town Staff regarding the status of current projects and future projects (e.g., costs incurred to date, updated capital costs due to changes in scope of the project, etc.); and iv) the application of an inflationary allowance for all projects planned after Fiscal Year 2021 to account for increased construction costs in the year the expenditure is assumed to occur. The primary purpose for the capital projects by the Town is to provide for the ongoing of renewals, repairs, betterments, and replacements of the existing infrastructure of the System. The following table summarizes the projected capital expenditures (when funds are appropriated for projects and must be available, which may be slightly different from when the cash expenditures actually occur).
(Remainder of page intentionally left blank)
K:\DC\1104-03\Rpt\Rev Suffic Rpt - Final -18-
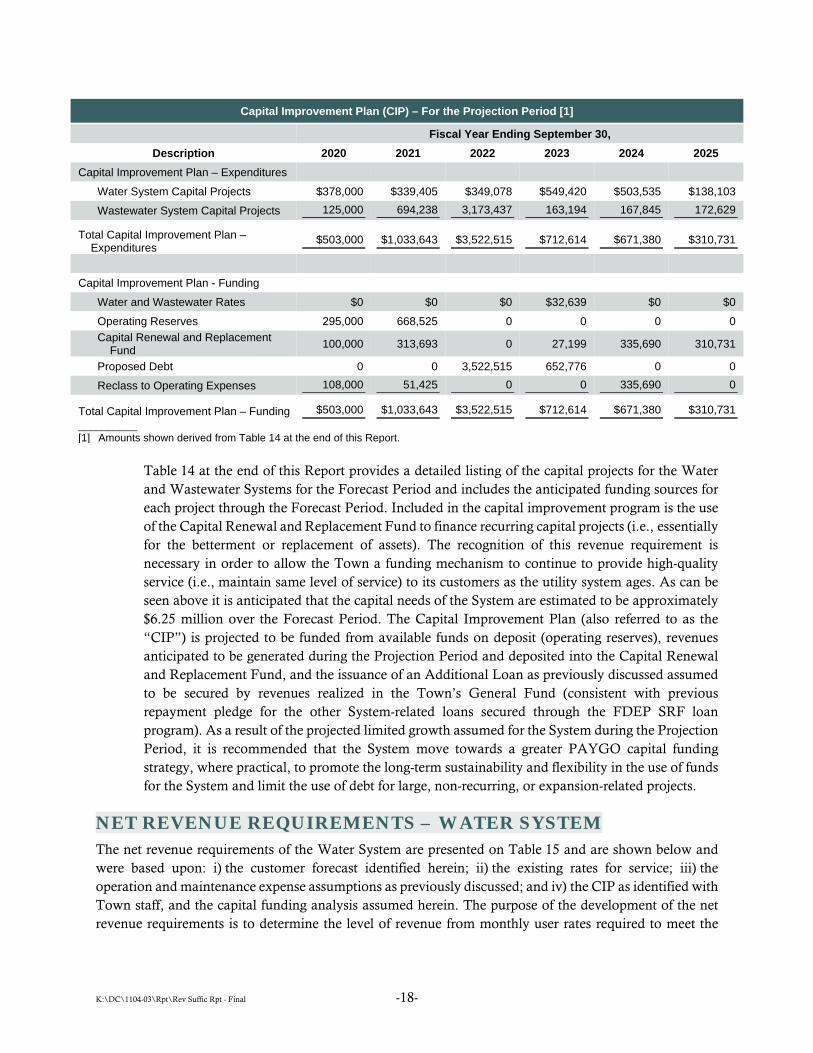
Capital Improvement Plan (CIP) – For the Projection Period [1]
Fiscal Year Ending September 30, Description 2020 2021 2022 2023 2024 2025
Capital Improvement Plan – Expenditures Water System Capital Projects $378,000 $339,405 $349,078 $549,420 $503,535 $138,103 Wastewater System Capital Projects 125,000 694,238 3,173,437 163,194 167,845 172,629
Total Capital Improvement Plan – Expenditures
$503,000 $1,033,643 $3,522,515 $712,614 $671,380 $310,731
Capital Improvement Plan - Funding
Water and Wastewater Rates $0 $0 $0 $32,639 $0 $0 Operating Reserves 295,000 668,525 0 0 0 0 Capital Renewal and Replacement
Fund 100,000 313,693 0 27,199 335,690 310,731
Proposed Debt 0 0 3,522,515 652,776 0 0 Reclass to Operating Expenses 108,000 51,425 0 0 335,690 0
Total Capital Improvement Plan – Funding $503,000 $1,033,643 $3,522,515 $712,614 $671,380 $310,731 __________ [1] Amounts shown derived from Table 14 at the end of this Report.
Table 14 at the end of this Report provides a detailed listing of the capital projects for the Water and Wastewater Systems for the Forecast Period and includes the anticipated funding sources for each project through the Forecast Period. Included in the capital improvement program is the use of the Capital Renewal and Replacement Fund to finance recurring capital projects (i.e., essentially for the betterment or replacement of assets). The recognition of this revenue requirement is necessary in order to allow the Town a funding mechanism to continue to provide high-quality service (i.e., maintain same level of service) to its customers as the utility system ages. As can be seen above it is anticipated that the capital needs of the System are estimated to be approximately $6.25 million over the Forecast Period. The Capital Improvement Plan (also referred to as the “CIP”) is projected to be funded from available funds on deposit (operating reserves), revenues anticipated to be generated during the Projection Period and deposited into the Capital Renewal and Replacement Fund, and the issuance of an Additional Loan as previously discussed assumed to be secured by revenues realized in the Town’s General Fund (consistent with previous repayment pledge for the other System-related loans secured through the FDEP SRF loan program). As a result of the projected limited growth assumed for the System during the Projection Period, it is recommended that the System move towards a greater PAYGO capital funding strategy, where practical, to promote the long-term sustainability and flexibility in the use of funds for the System and limit the use of debt for large, non-recurring, or expansion-related projects.
NET REVENUE REQUIREMENTS – WATER SYSTEM The net revenue requirements of the Water System are presented on Table 15 and are shown below and were based upon: i) the customer forecast identified herein; ii) the existing rates for service; iii) the operation and maintenance expense assumptions as previously discussed; and iv) the CIP as identified with Town staff, and the capital funding analysis assumed herein. The purpose of the development of the net revenue requirements is to determine the level of revenue from monthly user rates required to meet the

K:\DC\1104-03\Rpt\Rev Suffic Rpt - Final -19-
financial obligations of the Water System. Summarized below are the projected net revenue requirements and overall recommended rate adjustments for the Water System:
Projected Water System Net Revenue Requirements – For the Forecast Period
Fiscal Year Ending September 30, Description 2020 2021 2022 2023 2024 2025
Operation and Maintenance Expenses $2,022,423 $2,088,669 $2,127,421 $2,190,272 $2,589,679 $2,318,630 Annual Debt Service:
Existing Debt $1,549,224 $1,549,224 $1,549,224 $1,549,224 $1,180,012 $810,800 Proposed Debt 0 0 12,775 25,550 25,550 25,550 Less Connection Charges to Pay Debt Service 0 (226,353) (234,202) (242,323) (250,726) (259,420)
Other Revenue Requirements:
Capital Funded from Rate Revenues $0 $0 $0 $32,639 $0 $0 Transfers to the Renewal and Replacement Fund 0 302,690 383,752 449,267 502,497 531,473
Gross Revenue Requirements $3,571,647 $3,714,230 $3,838,970 $4,004,629 $4,047,012 $3,427,033 Less Other Income and Funds from Other Sources:
Other Revenue $179,720 $187,070 $191,083 $195,042 $198,938 $202,761 Unrestricted Interest Income 42,528 40,425 41,264 43,439 43,386 43,820 General Fund Transfers - Debt Service Payment 1,430,000 1,058,297 796,691 533,004 184,823 0 Transfers from Operating Reserves 119,224 0 0 0 0 0
Net Revenue Requirements $1,800,176 $2,428,438 $2,809,932 $3,233,144 $3,619,866 $3,180,452 Revenue Under Existing Water Rates:
Water System Rate Revenue $2,083,498 $2,083,498 $2,083,498 $2,083,498 $2,083,498 $2,083,498 Prior and Current Year Rate Adjustment 0 0 312,525 600,048 922,073 1,102,407
Total Applicable Rate Revenue $2,083,498 $2,083,498 $2,396,023 $2,683,546 $3,005,571 $3,185,906 Percent Rate Increase 0.00% 15.00% 12.00% 12.00% 6.00% 2.50%
Effective Months of Increase (Assumes Oct. 1st) 12 12 12 12 12 12 Percent of Current Year Effective 100% 100% 100% 100% 100% 100%
Revenue from Current Year Rate Adjustments $0 $312,525 $287,523 $322,026 $180,334 $79,648
Total Rate Revenue $2,083,498 $2,396,023 $2,683,546 $3,005,571 $3,185,906 $3,265,553 Revenue Surplus / (Deficiency):
Amount $283,323 ($32,415) ($126,386) ($227,573) ($433,960) $85,101 Percent of Rate Revenue 13.60% (1.35%) (4.71%) (7.57%) (13.62%) 2.61%
It should be noted that no adjustment is shown for Fiscal Year 2020 since the fiscal year is nearing completion and any rate adjustment that could be implemented would not generate sufficient revenue during the fiscal year to significantly impact the financial position of the System for such fiscal year.
NET REVENUE REQUIREMENTS – WASTEWATER SYSTEM The net revenue requirements of the Wastewater System are presented on Table 16 and are shown below and were based upon: i) the customer forecast identified herein; ii) the existing rates for service; iii) the

K:\DC\1104-03\Rpt\Rev Suffic Rpt - Final -20-
operation and maintenance expense assumptions as previously discussed, including the projections of purchased wastewater treatment service from Delray Beach; iv) the CIP as identified with the Town and the capital funding analysis assumed herein. The purpose of the development of the net revenue requirements is to determine the level of revenue from monthly user rates required to meet the financial obligations of the Wastewater System. Summarized below are the projected net revenue requirements and overall recommended rate adjustments for the Wastewater System:
Projected Wastewater System Net Revenue Requirements – For the Forecast Period
Fiscal Year Ending September 30, Description 2020 2021 2022 2023 2024 2025
Operation and Maintenance Expenses $1,640,793 $1,764,672 $1,658,146 $1,709,013 $1,761,077 $1,814,406 Annual Debt Service:
Existing Debts $0 $0 $0 $0 $0 $0 Proposed Debts 0 0 50,825 101,650 101,650 101,650
Other Revenue Requirements:
Transfers to the Renewal and Replacement Fund $0 $36,482 $46,251 $54,147 $60,563 $64,055
Gross Revenue Requirements $1,640,793 $1,801,154 $1,755,222 $1,864,810 $1,923,290 $1,980,112 Less Other Income and Funds from
Other Sources:
Other Revenue $0 $0 $0 $0 $0 $0 Unrestricted Interest Income 23,904 22,722 23,193 24,416 24,386 24,630 General Fund Transfers – Debt
Service Payment 0 0 30,482 40,637 20,321 0
Transfers from Operating Reserves 105,000 105,000 0 0 0 0
Net Revenue Requirements $1,511,890 $1,673,432 $1,701,546 $1,799,758 $1,878,583 $1,955,481 Revenue Under Existing Wastewater
Rates:
Wastewater System Rate Revenue $1,159,222 $1,159,222 $1,159,222 $1,159,222 $1,159,222 $1,159,222 Prior and Current Year Rate
Adjustment 0 0 289,805 478,179 691,041 802,057
Total Applicable Rate Revenue $1,159,222 $1,159,222 $1,449,027 $1,637,401 $1,850,263 $1,961,279 Percent Rate Increase 0.00% 25.00% 13.00% 13.00% 6.00% 2.50%
Effective Months of Increase (Assumes Oct. 1st) 12 12 12 12 12 12
Percent of Current Year Effective 100% 100% 100% 100% 100% 100%
Revenue from Current Year Rate Adjustments
$0 $289,805 $188,374 $212,862 $111,016 $49,032
Total Rate Revenue $1,159,222 $1,449,027 $1,637,401 $1,850,263 $1,961,279 $2,010,311 Revenue Surplus / (Deficiency):
Amount ($352,668) ($224,405) ($64,145) $50,505 $82,696 $54,830 Percent of Rate Revenue (30.42%) (15.49%) (3.92%) 2.73% 4.22% 2.73%
As can be seen above and as shown in more detail on Table 16, the existing wastewater rate revenues are not anticipated to be sufficient to adequately fund the identified Net Revenue Requirements of the
K:\DC\1104-03\Rpt\Rev Suffic Rpt - Final -21-
Wastewater System during the Forecast Period and provide funds to maintain operating reserves to maintain a strong utility credit. As was previously discussed for the Water System, no adjustment is shown for Fiscal Year 2020 since the fiscal year is nearing completion and any rate adjustment that could be implemented would not generate sufficient revenue during the fiscal year to significantly impact the financial position of the System for such fiscal year.
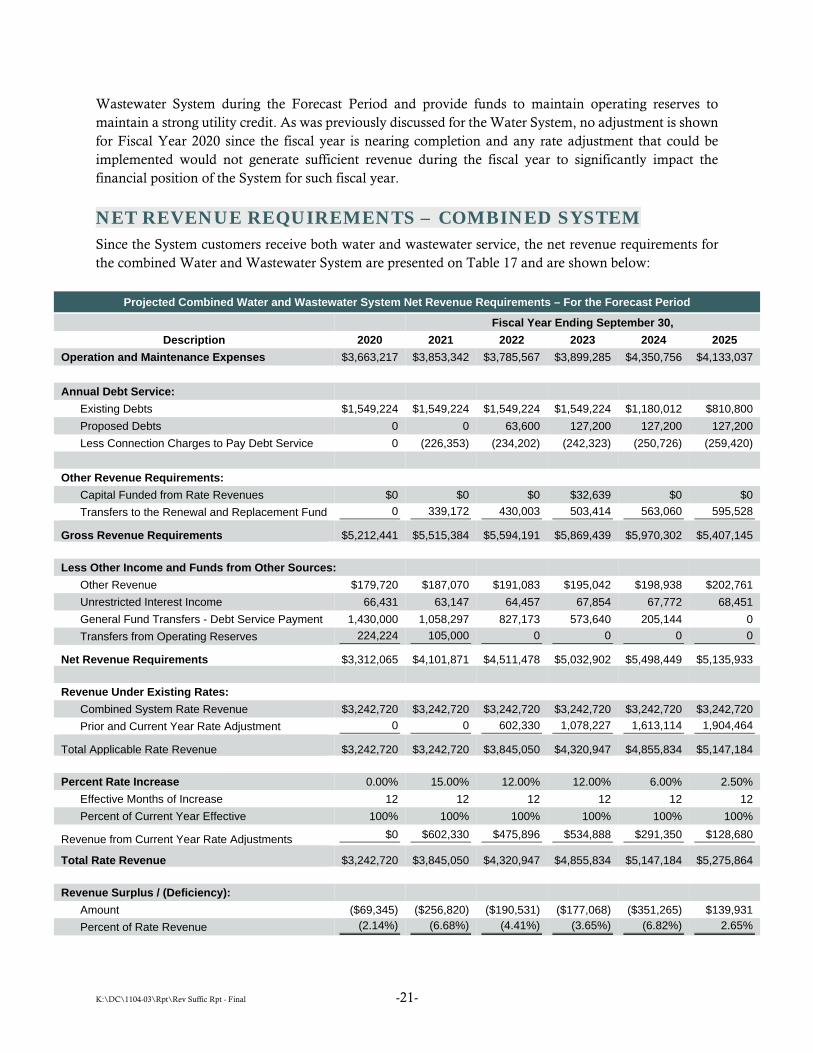
NET REVENUE REQUIREMENTS – COMBINED SYSTEM Since the System customers receive both water and wastewater service, the net revenue requirements for the combined Water and Wastewater System are presented on Table 17 and are shown below:
Projected Combined Water and Wastewater System Net Revenue Requirements – For the Forecast Period
Fiscal Year Ending September 30, Description 2020 2021 2022 2023 2024 2025
Operation and Maintenance Expenses $3,663,217 $3,853,342 $3,785,567 $3,899,285 $4,350,756 $4,133,037 Annual Debt Service:
Existing Debts $1,549,224 $1,549,224 $1,549,224 $1,549,224 $1,180,012 $810,800 Proposed Debts 0 0 63,600 127,200 127,200 127,200 Less Connection Charges to Pay Debt Service 0 (226,353) (234,202) (242,323) (250,726) (259,420)
Other Revenue Requirements:
Capital Funded from Rate Revenues $0 $0 $0 $32,639 $0 $0 Transfers to the Renewal and Replacement Fund 0 339,172 430,003 503,414 563,060 595,528
Gross Revenue Requirements $5,212,441 $5,515,384 $5,594,191 $5,869,439 $5,970,302 $5,407,145 Less Other Income and Funds from Other Sources:
Other Revenue $179,720 $187,070 $191,083 $195,042 $198,938 $202,761 Unrestricted Interest Income 66,431 63,147 64,457 67,854 67,772 68,451 General Fund Transfers - Debt Service Payment 1,430,000 1,058,297 827,173 573,640 205,144 0 Transfers from Operating Reserves 224,224 105,000 0 0 0 0
Net Revenue Requirements $3,312,065 $4,101,871 $4,511,478 $5,032,902 $5,498,449 $5,135,933 Revenue Under Existing Rates:
Combined System Rate Revenue $3,242,720 $3,242,720 $3,242,720 $3,242,720 $3,242,720 $3,242,720 Prior and Current Year Rate Adjustment 0 0 602,330 1,078,227 1,613,114 1,904,464
Total Applicable Rate Revenue $3,242,720 $3,242,720 $3,845,050 $4,320,947 $4,855,834 $5,147,184 Percent Rate Increase 0.00% 15.00% 12.00% 12.00% 6.00% 2.50%
Effective Months of Increase 12 12 12 12 12 12 Percent of Current Year Effective 100% 100% 100% 100% 100% 100%
Revenue from Current Year Rate Adjustments $0 $602,330 $475,896 $534,888 $291,350 $128,680
Total Rate Revenue $3,242,720 $3,845,050 $4,320,947 $4,855,834 $5,147,184 $5,275,864 Revenue Surplus / (Deficiency):
Amount ($69,345) ($256,820) ($190,531) ($177,068) ($351,265) $139,931 Percent of Rate Revenue (2.14%) (6.68%) (4.41%) (3.65%) (6.82%) 2.65%

K:\DC\1104-03\Rpt\Rev Suffic Rpt - Final -22-
As can be seen above and as shown in more detail on Table 17, the existing rate revenues on a combined basis beginning in Fiscal Year 2020 are not anticipated to be sufficient to adequately fund the identified Net Revenue Requirements of the combined Water and Wastewater System during the Forecast Period. While the System does continue to operate in deficiency after the implementation of the proposed rate adjustments during the remainder of the Forecast Period, Raftelis is of the opinion that this deficiency is acceptable considering the levels of operating reserves the System currently has and the primary driver is the need to adjust the responsibility for the repayment of the Outstanding and Additional Loans from rates as opposed to General Fund revenues (i.e., if there is an issue, a delay in the debt funding can be effectuated). The following table summarizes the recommended percent rate adjustments for both water and wastewater service based on the financial forecast presented in this report:
Recommended Total Rate Revenue Adjustments – Effective October 1st of Each Fiscal Year [1]
Fiscal Year Water Wastewater Consolidated [2] 2021 15.0% 25.0% 18.5% 2022 12.0% 13.0% 12.4% 2023 12.0% 13.0% 12.4% 2024 6.0% 6.0% 6.0% 2025 2.5% 2.5% 2.5%
__________ [1] Amounts shown represent percent increases in rate revenues targeted in each fiscal year to fully fund the net
revenue requirements; the actual increases may be different due to changes in rate structure associated with the recovery of costs.
[2] The majority of customers receive both water and wastewater service; increase reflect and reflects the average revenue adjustment for a combined water and wastewater bill.
The primary reasons for the System rate adjustments is associated with:
• Continued increases in the cost to operate the System due to continued inflation on cost of operation and maintenance and on the capital costs associated with infrastructure replacement and the need to maintain existing revenue margins to provide for funds for capital re-investment, debt service payments, and to maintain a favorable fiscal position.
• Increases in the cost of purchased wastewater treatment expenses also due to continued inflationary impacts on the cost of service coupled with the repayment of certain billing issues (causing an underpayment per the Town).
• Based on the capital funding plan, the need to have sufficient funds and cash flow to pay the anticipated debt service requirements on Additional Loans assumed to be issued during the Projection Period.
• Pursuant to Town directives, recognize that the System debt liability be funded from rates as opposed to General Fund revenues to accurately match the cost of service to the rates charged for service.

K:\DC\1104-03\Rpt\Rev Suffic Rpt - Final -23-
• Recognition of the need to develop and maintain a capital re-investment plan (recognized as deposits to the Capital Renewal and Replacement Fund), in order to provide for ongoing utility plant replacement, rehabilitation, and improvements and to limit the issuance of future debt for utility plant replacement.
• Limited System customer growth of the System (no increase in revenues or receipt of connection fees) which places a greater emphasis on maintaining current operating margins to fund debt repayment and pay-as-you-go capital funding.
PROJECTED RESERVE FUND TRANSFERS In the development of the System revenue requirements, projected fund transfers to operating and capital funds were assumed to provide: i) sufficient operating reserves to provide a hedge against unknown events (e.g., COVID-19, storm events, etc.), to maintain a strong fiscal position to attract external capital at reduced borrowing costs, and to provide for the stabilization of rates in the event any short-term deficiencies occur in net revenue requirements; and ii) dedicated transfers to provide for the re-investment of capital into the System and to provide funds for any unknown or extraordinary event that may occur (whether regulatory or an asset failure / mortality). We would recommend that the two separate reserves balances be maintained since they are for different purposes with operating reserves providing a funds for annual cash flow considerations (i.e., expenses, fluctuation in rate revenues, etc.) and capital reserves providing for plant investment and long-term utility service (asset replacement, major maintenance, etc.) and to promote ongoing service. To provide adequate levels of cash reserves for operations the financial forecast assumes an internal reserve target of one hundred fifty (150) days of operating expenses was recognized. The minimum targeted level of operating reserves is generally consistent with recommended policy by the Government Finance Officers Association (“GFOA”) and credit rating agencies and serve to: i) mitigate current and future risks regarding revenue shortfalls and unanticipated expenses; and ii) ensure stable services and rates. The following chart provides a projection of ending cash balances for operating reserves:
(Remainder of page intentionally left blank)
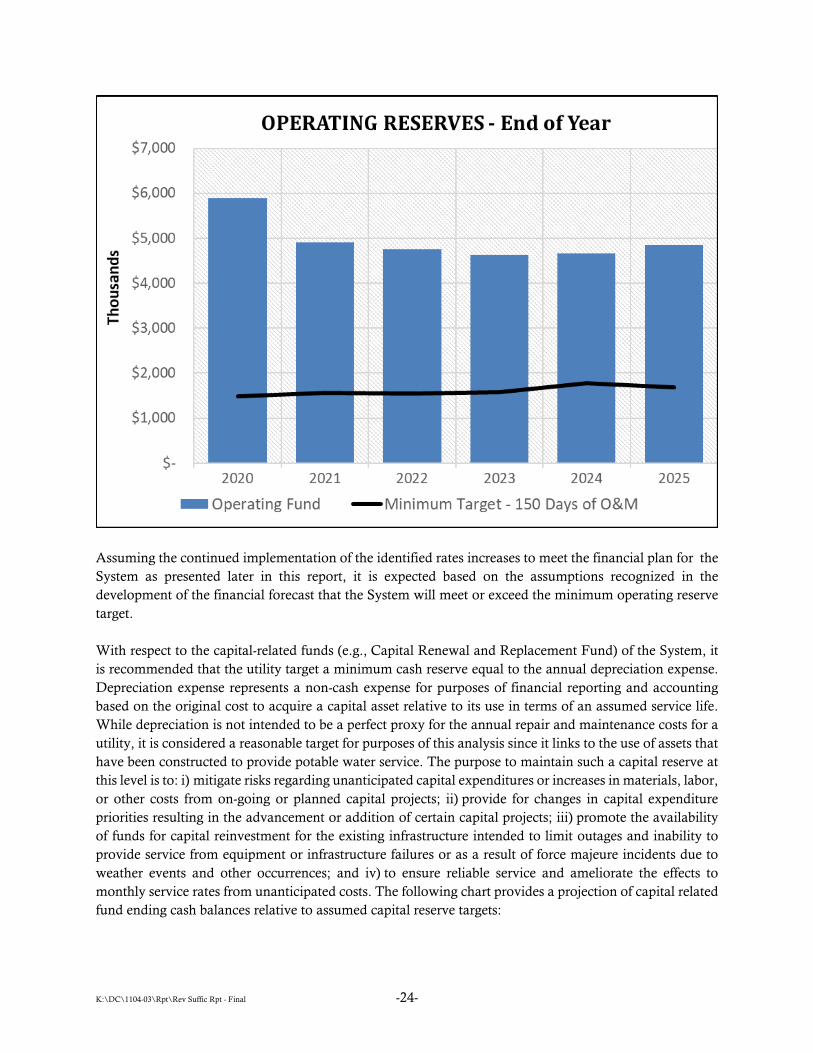
K:\DC\1104-03\Rpt\Rev Suffic Rpt - Final -24-
Assuming the continued implementation of the identified rates increases to meet the financial plan for the System as presented later in this report, it is expected based on the assumptions recognized in the development of the financial forecast that the System will meet or exceed the minimum operating reserve target. With respect to the capital-related funds (e.g., Capital Renewal and Replacement Fund) of the System, it is recommended that the utility target a minimum cash reserve equal to the annual depreciation expense. Depreciation expense represents a non-cash expense for purposes of financial reporting and accounting based on the original cost to acquire a capital asset relative to its use in terms of an assumed service life. While depreciation is not intended to be a perfect proxy for the annual repair and maintenance costs for a utility, it is considered a reasonable target for purposes of this analysis since it links to the use of assets that have been constructed to provide potable water service. The purpose to maintain such a capital reserve at this level is to: i) mitigate risks regarding unanticipated capital expenditures or increases in materials, labor, or other costs from on-going or planned capital projects; ii) provide for changes in capital expenditure priorities resulting in the advancement or addition of certain capital projects; iii) promote the availability of funds for capital reinvestment for the existing infrastructure intended to limit outages and inability to provide service from equipment or infrastructure failures or as a result of force majeure incidents due to weather events and other occurrences; and iv) to ensure reliable service and ameliorate the effects to monthly service rates from unanticipated costs. The following chart provides a projection of capital related fund ending cash balances relative to assumed capital reserve targets:

K:\DC\1104-03\Rpt\Rev Suffic Rpt - Final -25-
As shown in the above figure, in the early years of the Forecast Period, the majority of the cash reserves allocated to capital primarily consists of utility connection fees which are restricted in their use (expansion-related expenditures). Over time, the balance shifts to a more balanced structure with connection fee balances declining as expansion-related debt is paid and the Capital Renewal and Replacement Fund accrues funds for future asset reinvestment. Based on the assumptions developed in support of the preparation of the Financial Forecast, the ending balance in the Capital Renewal and Replacement Fund meets the minimum target which Raftelis considers favorable.
PROPOSED RATES FOR SERVICE
General The Town requested that Raftelis provide alternative rates for consideration by the Commission to promote water conservation, implement a wastewater consumption charge to promote fairness in use, provide rate consistency among customer classes and other factors. Rate design involves the development of bi-monthly rates and charges for each customer classification (e.g., residential, commercial, etc.) that recover the net revenue requirements of the System and meet the financial objectives of the Town and promote fairness among the customer classes. The proposed utility rates, to the extent practical, should meet the following criteria for service provided by publicly owned utilities:

K:\DC\1104-03\Rpt\Rev Suffic Rpt - Final -26-
• Utility rates should fully recover the cost of providing service.
• Utility rates should be based on a policy that calls for the lowest possible prices consistent with the requirements of providing quality service on an ongoing and sustainable basis.
• Utility rates should be simple and understandable.
• Utility rates should reasonably recover the cost of providing service to customers, taking into consideration the cost of providing service to the various users of the System.
• Utility rate and cost recovery strategies should recognize the System's current financial needs, when rates were last adjusted, and where possible help develop approaches to avoid "rate shock" in the future.
• Utility rates should be designed to encourage water conservation.
• Utility rates should comply with applicable orders and requirements of local, state, and federal regulatory authorities, if any, that may have jurisdiction.
• Utility rates should provide sufficient revenues to comply with the rate covenants as delineated in the Bond Resolution and other loan agreements or documents as well as promote the financial creditworthiness of the Utility (including revenue stability).
• Other considerations that often have an effect on the design of the user fees include historical rate form and comparability with rates of neighboring utility systems.
The Town currently classifies its customer base into three categories which include:
1. Single-family residential service which generally relates to individually metered residential service where each account equates to one (1) EDU.
2. Multi-family residential service which relates to master-metered residential service where two (2) or more EDUs are provided service through a single (master) meter (i.e., each account would have a multitude of EDUs based on the property characteristics).
3. Commercial or Non-Residential service which relates to individually metered accounts that have EDUs assigned to the account based on the characteristics of the account (may relate to meter size, customer demands, etc.).
Proposed Fiscal Year 2021 Water System Rates The Town's current water rates include two separate rate structure (cost recovery) components. These components are: i) a bi-monthly flat rate (minimum) charge that serves as a readiness-to-serve charge that recovers a portion on the revenue requirements considered as being fixed (links to capacity); and ii) a volumetric or flow charge which includes an inverted block rate structure to promote water conservation. The fixed costs represent expenses that are consistent and do not vary based on the water use or the customer demands of the system. Fixed costs generally would include, but are not limited to, debt service and capital facility funding, certain employee salaries and other employee benefits, insurance on utility
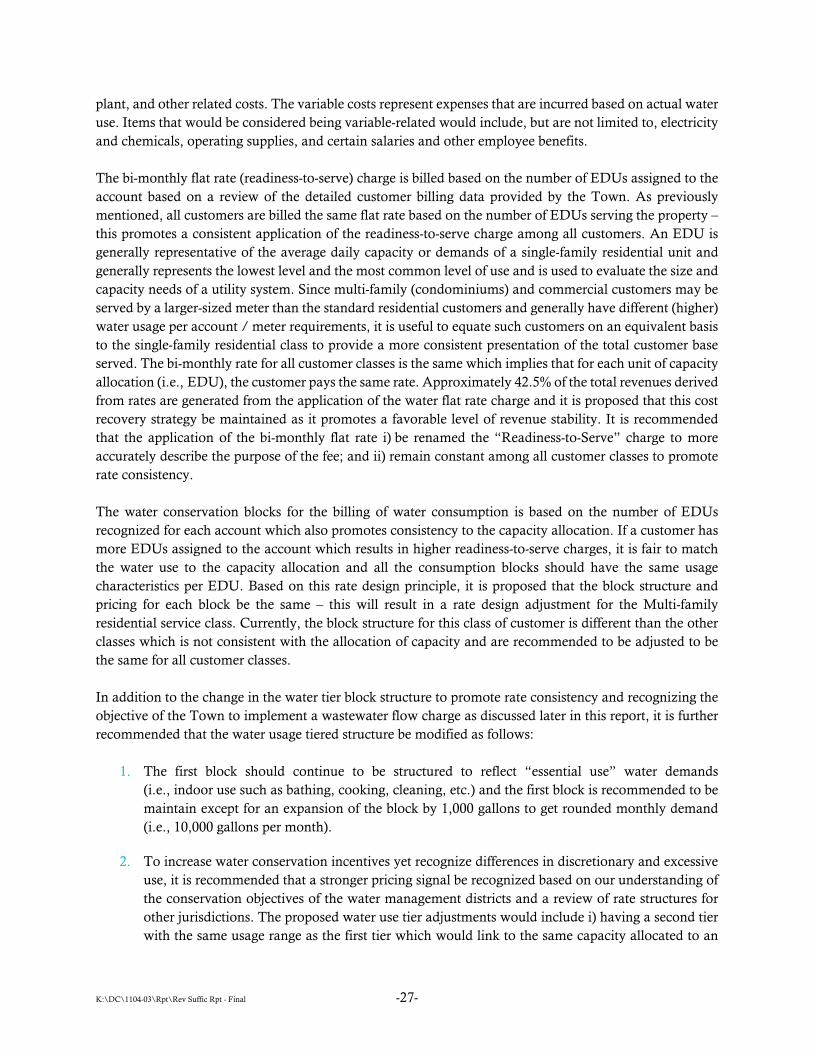
K:\DC\1104-03\Rpt\Rev Suffic Rpt - Final -27-
plant, and other related costs. The variable costs represent expenses that are incurred based on actual water use. Items that would be considered being variable-related would include, but are not limited to, electricity and chemicals, operating supplies, and certain salaries and other employee benefits. The bi-monthly flat rate (readiness-to-serve) charge is billed based on the number of EDUs assigned to the account based on a review of the detailed customer billing data provided by the Town. As previously mentioned, all customers are billed the same flat rate based on the number of EDUs serving the property – this promotes a consistent application of the readiness-to-serve charge among all customers. An EDU is generally representative of the average daily capacity or demands of a single-family residential unit and generally represents the lowest level and the most common level of use and is used to evaluate the size and capacity needs of a utility system. Since multi-family (condominiums) and commercial customers may be served by a larger-sized meter than the standard residential customers and generally have different (higher) water usage per account / meter requirements, it is useful to equate such customers on an equivalent basis to the single-family residential class to provide a more consistent presentation of the total customer base served. The bi-monthly rate for all customer classes is the same which implies that for each unit of capacity allocation (i.e., EDU), the customer pays the same rate. Approximately 42.5% of the total revenues derived from rates are generated from the application of the water flat rate charge and it is proposed that this cost recovery strategy be maintained as it promotes a favorable level of revenue stability. It is recommended that the application of the bi-monthly flat rate i) be renamed the “Readiness-to-Serve” charge to more accurately describe the purpose of the fee; and ii) remain constant among all customer classes to promote rate consistency. The water conservation blocks for the billing of water consumption is based on the number of EDUs recognized for each account which also promotes consistency to the capacity allocation. If a customer has more EDUs assigned to the account which results in higher readiness-to-serve charges, it is fair to match the water use to the capacity allocation and all the consumption blocks should have the same usage characteristics per EDU. Based on this rate design principle, it is proposed that the block structure and pricing for each block be the same – this will result in a rate design adjustment for the Multi-family residential service class. Currently, the block structure for this class of customer is different than the other classes which is not consistent with the allocation of capacity and are recommended to be adjusted to be the same for all customer classes. In addition to the change in the water tier block structure to promote rate consistency and recognizing the objective of the Town to implement a wastewater flow charge as discussed later in this report, it is further recommended that the water usage tiered structure be modified as follows:
1. The first block should continue to be structured to reflect “essential use” water demands (i.e., indoor use such as bathing, cooking, cleaning, etc.) and the first block is recommended to be maintain except for an expansion of the block by 1,000 gallons to get rounded monthly demand (i.e., 10,000 gallons per month).
2. To increase water conservation incentives yet recognize differences in discretionary and excessive use, it is recommended that a stronger pricing signal be recognized based on our understanding of the conservation objectives of the water management districts and a review of rate structures for other jurisdictions. The proposed water use tier adjustments would include i) having a second tier with the same usage range as the first tier which would link to the same capacity allocated to an

K:\DC\1104-03\Rpt\Rev Suffic Rpt - Final -28-
EDU; ii) having the third tier rate with the same usage range as the first block that would also link to the capacity of an EDU but would be priced higher to reflect a water use considered as being excessive; and iii) a fourth block that would further promote water conservation.
Based on these rate structure modifications to promote rate consistency among the customer classes, the following rate blocks are being recommended:
Comparison of Existing and Proposed Water Consumption Blocks - Per Unit
Class and Water Use Block Designation Existing Proposed
Residential / Commercial (Expanded per Unit): Block 1 0 – 19,000 Gallons 0 – 20,000 Gallons Block 2 20,000 – 50,000 Gallons 20,000 – 40,000 Gallons Block 3 51,000 Gallons or More 41,000 – 60,000 Gallons Block 4 61,000 Gallons or More
Master-Metered Residential (Expanded per Unit):
Block 1 0 – 13,000 Gallons 0 – 20,000 Gallons Block 2 14,000 – 23,000 Gallons 20,000 – 40,000 Gallons Block 3 24,000 Gallons or More 41,000 – 60,000 Gallons Block 4 61,000 Gallons or More
With respect to pricing the blocks, the following cost recovery attributes were recognized:
1. The first block was essentially increased by the average rate adjustment to limit the amount of impact to the low use water customers (target the average increase as previously discussed in the determination of the Financial Plan).
2. Since the first block is considered as the flow allocated to an EDU, the second block was designed to recover an additional readiness-to-serve charge (if the customer is going to use twice the flow of an indoor customer, then the second block usage charge will be designed to recover the readiness-to-serve charge – this continues for each consumption block thereafter and is the reason why the water use tiers are consistent).
3. The third block was designed to essentially recover an additional connection charge under the assumption that the customer is consistently incurring a water use demand that is higher than allocated.
4. The fourth block represents an additional charge to further promote conservation and the general fact that cost of peak day capacity is the most expensive capacity.
As discussed later in this report, the Town is considering a wastewater rate structure which includes a volumetric or flow component. If it is to be the policy of the Town to allow a separate irrigation meter and there may be an instance where a customer may request such a service, we would recommend that an irrigation rate be considered. Since irrigation use would represent discretionary and excessive water use and would be in addition to the domestic water use, it is recommended that the irrigation rate i) be set at

K:\DC\1104-03\Rpt\Rev Suffic Rpt - Final -29-
one (1) EDU since there are no dwelling units assigned to this service; and ii) the pricing be set at the higher use blocks consistent with the type of service. Based on the above referenced rate structure adjustments and the proposed water increase as identified in the development of the Financial Forecast, the following rates are being proposed:
Proposed Bi-monthly Water Rate Schedule
Bi-monthly Service Charge: All Residential and Commercial Classes
Proposed Rates Readiness-to-Serve Charge – All Units [1] $38.63 per Unit
Water Use per Unit:
Bi-monthly Usage Charges (per Unit): 0 – 20,000 Gallons $2.60 per 1,000 Gallons 21,000 – 40,000 Gallons $4.53 per 1,000 Gallons 41,000 – 60,000 Gallons $5.81 per 1,000 Gallons 61,000 Gallons or More $7.09 per 1,000 Gallons
Irrigation Class:
Readiness-to-Serve Charge – All Accounts [2] $38.63 per Account
Water Use per Account: Bi-monthly Usage Charges (per Account):
0 – 40,000 Gallons $4.53 per 1,000 Gallons 41,000 – 60,000 Gallons $5.81 per 1,000 Gallons 61,000 Gallons or More $7.09 per 1,000 Gallons
__________ [1] Rate applicable to all dwelling units assigned to an account as determined by the Town with
single family residential being considered as 1 unit (EDU). [2] All individually-metered irrigation water meters are recommended to be classified as 1 EDU.
Based on the estimated billing determinates assumed for the Fiscal Year 2021 and the basis of the application of the rates as shown in the above table, approximately 42.1% of the total revenues derived from rates are generated from the application of the water readiness-to-serve charge, thus maintaining the same cost recovery strategy as the existing rates to continue to promote a favorable level of revenue stability.
Proposed Fiscal Year 2021 Wastewater System Rates The Town's current wastewater rates includes only one rate structure (cost recovery) component which is a bi-monthly flat rate (minimum) charge that serves as a readiness-to-serve charge that recovers all of the allocated revenue requirements of the Wastewater System. As was previously discussed for the Water System, the bi-monthly flat rate (readiness-to-serve) charge is billed based on the number of EDUs assigned to the account based on a review of the detailed customer billing data provided by the Town. All customers are billed the same flat rate based on the number of EDUs serving the property which promotes a consistent application of the readiness-to-serve charge among all customers.

K:\DC\1104-03\Rpt\Rev Suffic Rpt - Final -30-
The Town requested that Raftelis prepare a rate structure that includes a volumetric or use component. To develop a wastewater usage charge, the following cost recovery attributes were recognized:
1. The rates would maintain a readiness-to-serve charge that is applied to all EDUs or units on the same basis as currently being performed for the Wastewater System.
2. The costs to be recovered in the volumetric charge included the net variable costs associated with purchased wastewater treatment from the City of Delray Beach, since it is billed on a volumetric basis to the Town, and the cost of utilities for pumping. All other costs were assumed to be recovered in the proposed readiness-to-serve charge. Based on the allocation of costs, approximately 57% of the net Wastewater System revenue requirements were proposed to be recovered in the flow charge with the remaining 43% to be recovered in the readiness-to-serve charge. This cost allocation basis was consistent with the cost recovery strategy of the Water System.
3. The basis to bill for wastewater flow service is through the use of water meter readings. For the single-family and master metered residential customer classes, it was assumed that a bi-monthly wastewater flow cap equal to 20,000 gallons applied to each EDU or unit of billed water service be implemented to recognize that not all of the metered water use is returned to the wastewater system. This is a common rate application structure in the state. The monthly wastewater usage cap was designed to equal the first block of the water flow charges which was considered more of an indoor use (thus a higher probability of being returned to the wastewater system). No billing cap on commercial service is being recommended which is also consistent with how other utilities bill for wastewater service. It was also assumed that for those customers that are classified as a master-metered residential customer that receive service through multiple meters, that the sum of all the billed water flow would be applied the wastewater flow charge.
It should be noted that with the introduction of a volumetric charge, the bi-monthly readiness-to-serve charge will reduce so customers with low flow could actually experience a wastewater rate reduction and customers with higher “per EDU” flows will experience an increase higher than the Wastewater System average. Based on the cost recovery attributes mentioned above, the following Wastewater System rates are being proposed:
(Remainder of page intentionally left blank)

K:\DC\1104-03\Rpt\Rev Suffic Rpt - Final -31-
Proposed Bi-monthly Wastewater Rate Schedule
Proposed Rates Bi-monthly Service Charge:
All Residential and Commercial Classes: Readiness-to-Serve Charge – All Units $28.50 per Unit
Wastewater Use per Unit:
All Residential Classes $2.56 per 1,000 Gallons [1]
Commercial Class $2.56 per 1,000 Gallons (All Metered Water Use)
__________ [1] Rates based on metered water usage at customer premise. Bi-monthly wastewater
usage charges shall be based on the water meter readings for all meters serving the applicant’s property with a maximum billed bi-monthly flow equal to 20,000 gallons multiplied by the number of units.
Proposed Fiscal Year 2022 – 2025 Rates The Financial Forecast reflected in this study includes projections of rate adjustments through the Fiscal Year 2025. It is recommended that the rates for service subsequent to the Fiscal Year 2021 be increased uniformly based on the proposed water and wastewater service rates adjustments as previously discussed. The proposed rates for the remainder of the Projection Period are included on Table 19 at the end of this report.
RATE COMPARISONS
In order to provide additional information to the Town regarding the effects of the recommended change in rates for water and wastewater service, an analysis to illustrate the impact for a typical residential customer (considered as one EDU or unit) was prepared. This is also comparative to the usage characteristics of the Multi-Family customer class (while these customers are master metered, on a per unit basis are representative to the single-family customer class and represent the largest class in terms of EDUs served by the Town). The average multi-family residential unit (the majority of the residential units are classified as multi-family) is billed approximately 6,000 gallons per month for water service metered at the customer premise. The typical or average single-family residential customer used approximately 30,000 gallons per month. It should be noted that the Town renders water and wastewater bills to the residential class on a bi-monthly basis; a monthly comparison is presented since most utilities bill at this frequency level in the State. The effect of the proposed rate adjustments for Fiscal Year 2020 for the average multi-family and single-family residential customer would be as follows:
(Remainder of page intentionally left blank)
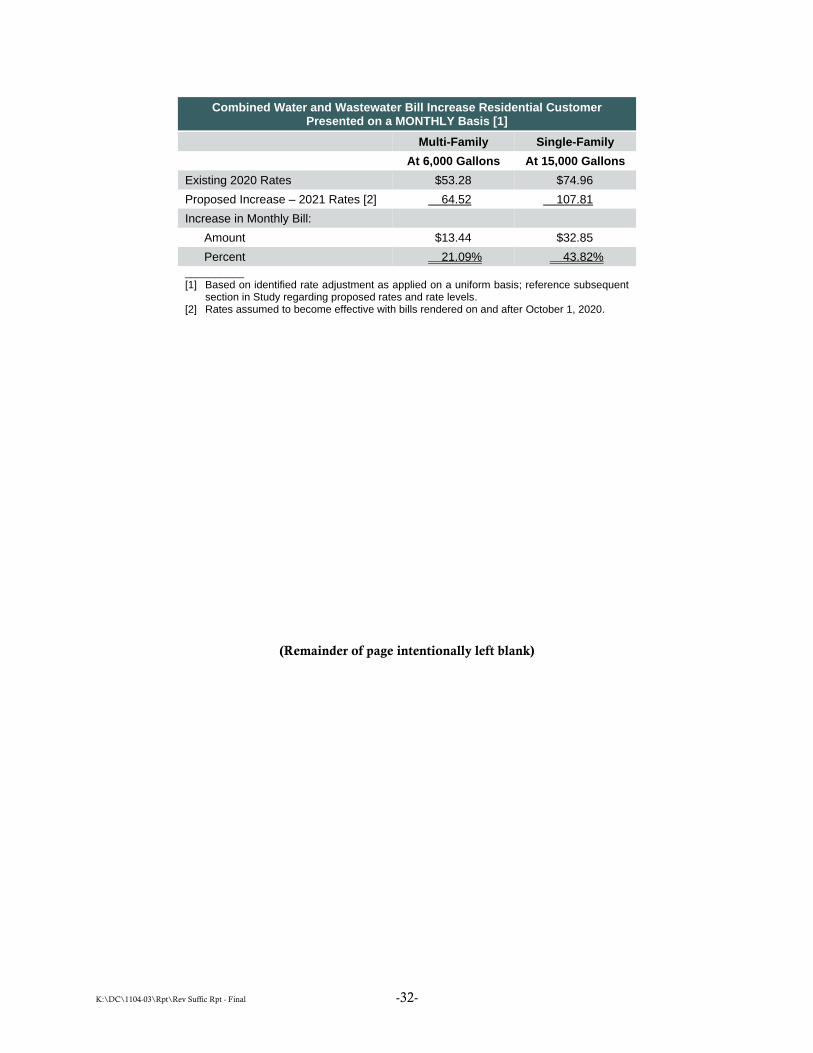
K:\DC\1104-03\Rpt\Rev Suffic Rpt - Final -32-
Combined Water and Wastewater Bill Increase Residential Customer Presented on a MONTHLY Basis [1]
Multi-Family Single-Family At 6,000 Gallons At 15,000 Gallons
Existing 2020 Rates $53.28 $74.96 Proposed Increase – 2021 Rates [2] 64.52 107.81 Increase in Monthly Bill:
Amount $13.44 $32.85 Percent 21.09% 43.82%
__________ [1] Based on identified rate adjustment as applied on a uniform basis; reference subsequent
section in Study regarding proposed rates and rate levels. [2] Rates assumed to become effective with bills rendered on and after October 1, 2020.
(Remainder of page intentionally left blank)
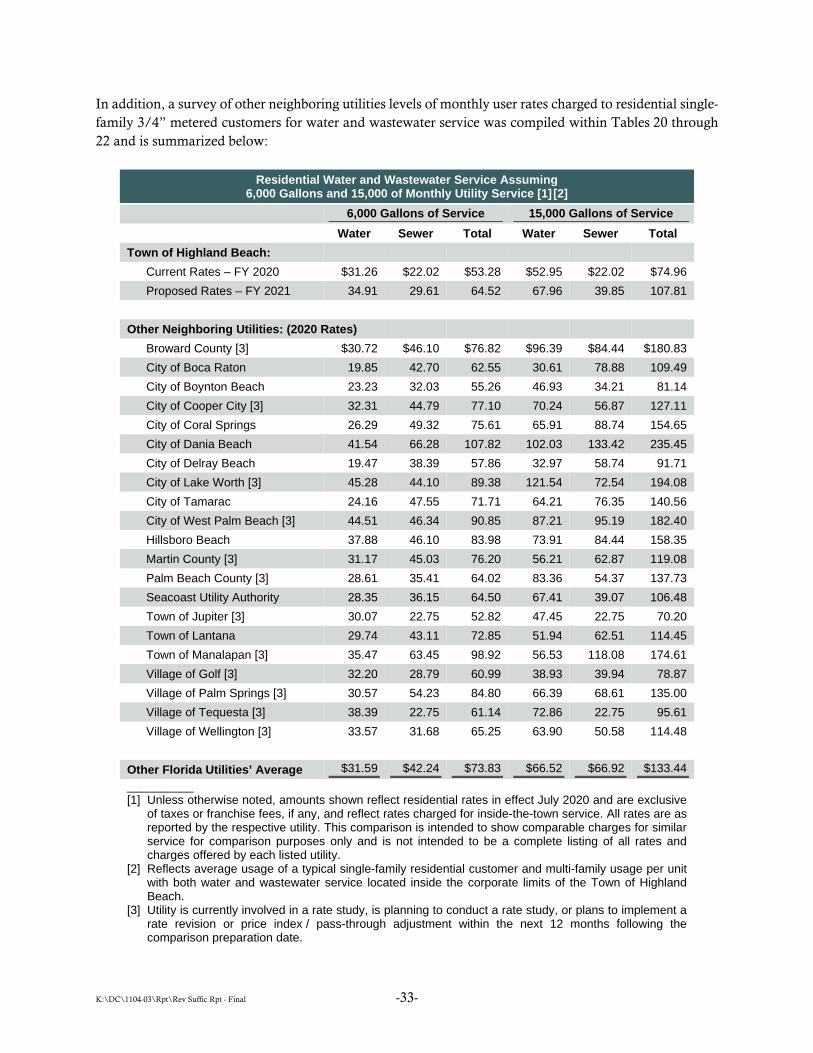
K:\DC\1104-03\Rpt\Rev Suffic Rpt - Final -33-
In addition, a survey of other neighboring utilities levels of monthly user rates charged to residential single-family 3/4” metered customers for water and wastewater service was compiled within Tables 20 through 22 and is summarized below:
Residential Water and Wastewater Service Assuming 6,000 Gallons and 15,000 of Monthly Utility Service [1] [2]
6,000 Gallons of Service 15,000 Gallons of Service Water Sewer Total Water Sewer Total
Town of Highland Beach: Current Rates – FY 2020 $31.26 $22.02 $53.28 $52.95 $22.02 $74.96 Proposed Rates – FY 2021 34.91 29.61 64.52 67.96 39.85 107.81
Other Neighboring Utilities: (2020 Rates)
Broward County [3] $30.72 $46.10 $76.82 $96.39 $84.44 $180.83 City of Boca Raton 19.85 42.70 62.55 30.61 78.88 109.49 City of Boynton Beach 23.23 32.03 55.26 46.93 34.21 81.14 City of Cooper City [3] 32.31 44.79 77.10 70.24 56.87 127.11 City of Coral Springs 26.29 49.32 75.61 65.91 88.74 154.65 City of Dania Beach 41.54 66.28 107.82 102.03 133.42 235.45 City of Delray Beach 19.47 38.39 57.86 32.97 58.74 91.71 City of Lake Worth [3] 45.28 44.10 89.38 121.54 72.54 194.08 City of Tamarac 24.16 47.55 71.71 64.21 76.35 140.56 City of West Palm Beach [3] 44.51 46.34 90.85 87.21 95.19 182.40 Hillsboro Beach 37.88 46.10 83.98 73.91 84.44 158.35 Martin County [3] 31.17 45.03 76.20 56.21 62.87 119.08 Palm Beach County [3] 28.61 35.41 64.02 83.36 54.37 137.73 Seacoast Utility Authority 28.35 36.15 64.50 67.41 39.07 106.48 Town of Jupiter [3] 30.07 22.75 52.82 47.45 22.75 70.20 Town of Lantana 29.74 43.11 72.85 51.94 62.51 114.45 Town of Manalapan [3] 35.47 63.45 98.92 56.53 118.08 174.61 Village of Golf [3] 32.20 28.79 60.99 38.93 39.94 78.87 Village of Palm Springs [3] 30.57 54.23 84.80 66.39 68.61 135.00 Village of Tequesta [3] 38.39 22.75 61.14 72.86 22.75 95.61 Village of Wellington [3] 33.57 31.68 65.25 63.90 50.58 114.48
Other Florida Utilities’ Average $31.59 $42.24 $73.83 $66.52 $66.92 $133.44 __________ [1] Unless otherwise noted, amounts shown reflect residential rates in effect July 2020 and are exclusive
of taxes or franchise fees, if any, and reflect rates charged for inside-the-town service. All rates are as reported by the respective utility. This comparison is intended to show comparable charges for similar service for comparison purposes only and is not intended to be a complete listing of all rates and charges offered by each listed utility.
[2] Reflects average usage of a typical single-family residential customer and multi-family usage per unit with both water and wastewater service located inside the corporate limits of the Town of Highland Beach.
[3] Utility is currently involved in a rate study, is planning to conduct a rate study, or plans to implement a rate revision or price index / pass-through adjustment within the next 12 months following the comparison preparation date.
K:\DC\1104-03\Rpt\Rev Suffic Rpt - Final -34-
As can be seen above, the average bills produced from the rates that have been adopted by the Town for the Fiscal Year 2021 are comparable or lower than that of other neighboring utilities surveyed and are considered reasonable and comparable. It should be noted that several of the utilities surveyed are anticipating a rate change in the next 12 months (pursuant to a rate evaluation that is underway, an adopted rate-phasing program, or through the application of a price [inflationary] index), which would further improve the competitive position of the System from what is indicated above.
CONCLUSIONS AND RATE RECOMMENDATIONS Based on assumptions and analyses as presented in this report and shown in more detail in the tables at the end of this report relative to the determination of the Financial Forecast and revenue sufficiency analysis for the System and in the design of the proposed rates for utility service, the following conclusions and recommendations are made:
1. The existing rates are not projected to be sufficient to meet the forecasted financial needs of the System, including: i) the funding of the ongoing operation and maintenance expenses; ii) the capital improvement program primarily for the renewal and replacements of the System utility infrastructure; iii) the issuance of additional debt to fund a portion of the identified capital plan; and iv) the phase-out of the Outstanding and Additional Loan debt service payment from the General Fund.
2. Based upon the assumptions as disclosed herein and the findings of this analysis, which includes the implementation and recognition of the proposed rate adjustments effective October 1st of each fiscal year, the Town’s financial operating targets and goals are anticipated to be generally achieved:
a. The revenue requirements of the Utility are fully funded.
b. The projected capital needs of the Utility are fully funded.
c. Targeted ending cash balances are met throughout the Projection Period.
3. The proposed rates are designed to implement rate structure changes in support of the rate objectives of the Town. It is unknown how customers may react and how that will affect the amount of rate revenues to be received. It is recommended that the Town closely monitor the actual revenues realized from the proposed rates and make corresponding adjustments, if necessary, to assure full cost recovery.
4. Recognizing that the proposed rates as reflected in this study represent an increase in the rates charged for utility service and pursuant to Florida Statutes, Chapter 180.136, the Town will need to notice the proposed increase to each customer of the utility through the utility’s billing process. The notice needs to state the date, time, and place of the Town’s meeting at which the proposed rates will be considered.
5. For all years after Fiscal Year 2021, the rates are proposed to be adjusted uniformly by the percent increase. The projected rates for water and wastewater service were compared with neighboring and peer communities. It is expected that the Town’s rates will remain competitive recognizing implementation of the identified rate implementation plan.

K:\DC\1104-03\Rpt\Rev Suffic Rpt - Final -35-
6. Recognizing that actual results may vary from projections, it is recommended that the Town periodically perform updates to this revenue sufficiency evaluation in order meet the capital, rate and financial objectives and best management practices as discussed in this report.
7. Based on our review of the detailed customer billing information conducted in support of the determination of the existing rate revenues and the proposed rates for utility service, several of the customers appeared to possibly not be classified correctly in the utility billing system. Tt is recommended that the Town conduct a customer analysis of the rate classifications to assure that the customers are properly recognized and are being billed in accordance with the proposed rate classifications and rates recommendations.
(Remainder of page intentionally left blank)

TOWN OF HIGHLAND BEACH, FLORIDA
2020 REVENUE SUFFICIENCY AND RATE STUDY – WATER AND WASTEWATER SYSTEMS
LIST OF TABLES
Table No. Title
1 Summary of Water and Wastewater Customers
2 Summary of Historical and Current Rates (FY 2019 & 2020) – Water and Wastewater System
3 Summary of Water Rate Revenues
4 Summary of Wastewater Rate Revenues
5 Summary of Other Operating Revenues
6 Calculation of Projected Impact Fee Revenues
7 Operating Budget and Adjustment
8 Summary of Expense Escalation Factors
9 Summary of Expense Allocation Factors
10 Projection and Allocation of Operating and Maintenance Expenditures to Water and Wastewater Systems
11 Calculation of Wastewater Treatment Expenditures
12 Calculation of Annual Deposit to the Repair and Replacement Fund
13 Capital Improvement Plan (CIP)
14 Capital Improvement Plan Adjusted for Inflation and Funding Plan (CIP)
15 Revenue Requirements – Water System
16 Revenue Requirements – Wastewater System
17 Revenue Requirements – Combined Water and Wastewater Systems
18 Summary of Projected Fund Balances and Calculation of Interest Income
19 Summary of Projected Rates – Water and Wastewater System
20 Comparison of Typical Residential Bills for Water Service
21 Comparison of Typical Residential Bills for Wastewater Service
22 Comparison of Typical Residential Bills for Combined Service

Page 1 of 2Table 1
Town of Highland Beach, FloridaRevenue Sufficiency and Rate Study - Water and Wastewater Systems
Summary of Water and Wastewater Customers
Line Projected Fiscal Year Ending September 30,No. Customer Type 2017 2018 2019 2020 2021 2022 2023 2024 2025
WATERSingle Family Residential Customers
1 Estimated Growth 0 0 0 0 0 02 Average Annual Accounts 378 384 381 381 381 381 381 381 3813 Average Annual Units 378 384 381 381 381 381 381 381 381 4 Annual Water Sales (000's) 111,280 142,015 118,258 118,186 118,186 118,186 118,186 118,186 118,1865 Average Monthly Usage (Per Unit) 24,533 30,819 25,866 25,850 25,850 25,850 25,850 25,850 25,850
Multi-Family Residential Customers6 Estimated Growth (Units) 0 0 0 0 0 07 Average Annual Accounts 79 78 78 78 78 78 78 78 788 Average Annual Units 3,880 3,883 3,883 3,883 3,883 3,883 3,883 3,883 3,8839 Annual Water Sales (000's) 222,907 283,021 244,853 244,629 244,629 244,629 244,629 244,629 244,629
10 Average Monthly Usage (Per Unit) 4,788 6,074 5,255 5,250 5,250 5,250 5,250 5,250 5,250
Other Customers11 Estimated Growth 0 0 0 0 0 0
Average Annual Accounts (Meter Sizes)12 Other Customers 5 5 5 5 5 5 5 5 513 Average Annual Accounts 5 5 5 5 5 5 5 5 5 14 Average Annual Units 132 132 132 132 132 132 132 132 132 15 Annual Water Sales (000's) 15,601 18,614 17,888 17,899 17,899 17,899 17,899 17,899 17,89916 Average Monthly Usage (Per Unit) 9,849 11,751 11,293 11,300 11,300 11,300 11,300 11,300 11,300
Total Water SystemEstimated Growth - - - - - -
17 Annual Accounts 462 467 464 464 464 464 464 464 464 18 Annual Units 4,390 4,399 4,396 4,396 4,396 4,396 4,396 4,396 4,396 19 Estimated Billed Flow (000s) 349,788 443,650 380,999 380,714 380,714 380,714 380,714 380,714 380,714 20 Estimated Finished Water (000s) 414,860 408,288 431,368 431,045 431,045 431,045 431,045 431,045 431,045

Page 2 of 2Table 1
Town of Highland Beach, FloridaRevenue Sufficiency and Rate Study - Water and Wastewater Systems
Summary of Water and Wastewater Customers
Line Projected Fiscal Year Ending September 30,No. Customer Type 2017 2018 2019 2020 2021 2022 2023 2024 2025
WASTEWATERSingle Family Residential Customers
21 Estimated Growth 0 0 0 0 0 022 Average Annual Accounts 378 384 381 381 381 381 381 381 38123 Average Annual Units 378 384 381 381 381 381 381 381 381
Multi-Family Residential Customers24 Estimated Growth (Units) 0 0 0 0 0 025 Average Annual Accounts 78 78 78 78 78 78 78 78 7826 Average Annual Units 3,875 3,875 3,875 3,875 3,875 3,875 3,875 3,875 3,875
Other Customers27 Estimated Growth 0 0 0 0 0 0
Average Annual Accounts (Meter Sizes)28 Other Customers 5 5 5 5 5 5 5 5 529 Average Annual Accounts 5 5 5 5 5 5 5 5 5 30 Average Annual Units 132 132 132 132 132 132 132 132 132
Total Wastewater SystemEstimated Growth - - - - - -
31 Annual Accounts 461 467 464 464 464 464 464 464 464 32 Annual Units 4,385 4,391 4,388 4,388 4,388 4,388 4,388 4,388 4,388

Page 1 of 1Table 2
Town of Highland Beach, FloridaRevenue Sufficiency and Rate Study - Water and Wastewater Systems
Summary of Historical and Current Rates - Water and Wastewater System
Line Fiscal Year Ending September 30,No. Description 2019 2020
Water Service:Residential Metered Services (Bi-Monthly)
1 Water Flat Charge 32.80$ 33.59$
Usage Charge per Unit (per 1,000 gallons)2 Block 1 (0-19,000 gallons) 2.35$ 2.41$ 3 Block 2 (19,001-49,000 gallons) 4.08 4.18 4 Block 3 (49,001 gallons and above) 5.03 5.15
Multi-Family Services (Bi-Monthly)5 Water Flat Charge 32.80$ 33.59$
Usage Charge per Unit (per 1,000 gallons)6 Block 1 (0-13,000 gallons) 2.35$ 2.41$ 7 Block 2 (13,001-23,000 gallons) 2.83 2.90 8 Block 3 (23,001 gallons and above) 5.03 5.15
Commercial Services (Bi-Monthly)Base Service Charge:
9 Water Flat Charge 32.80$ 33.59$
Usage Charge per Unit (per 1,000 gallons)10 Block 1 (0-19,000 gallons) 2.35$ 2.41$ 11 Block 2 (19,001-49,000 gallons) 4.08 4.18 12 Block 3 (49,001 gallons and above) 5.03 5.15
Wastewater Service:
Residential Metered Services (Bi-Monthly)13 Flat Charge 43.00$ 44.03$
Multi-Family Services (Bi-Monthly)14 Flat Charge 43.00$ 44.03$
Commercial Services (Bi-Monthly)15 Flat Charge 43.00$ 44.03$
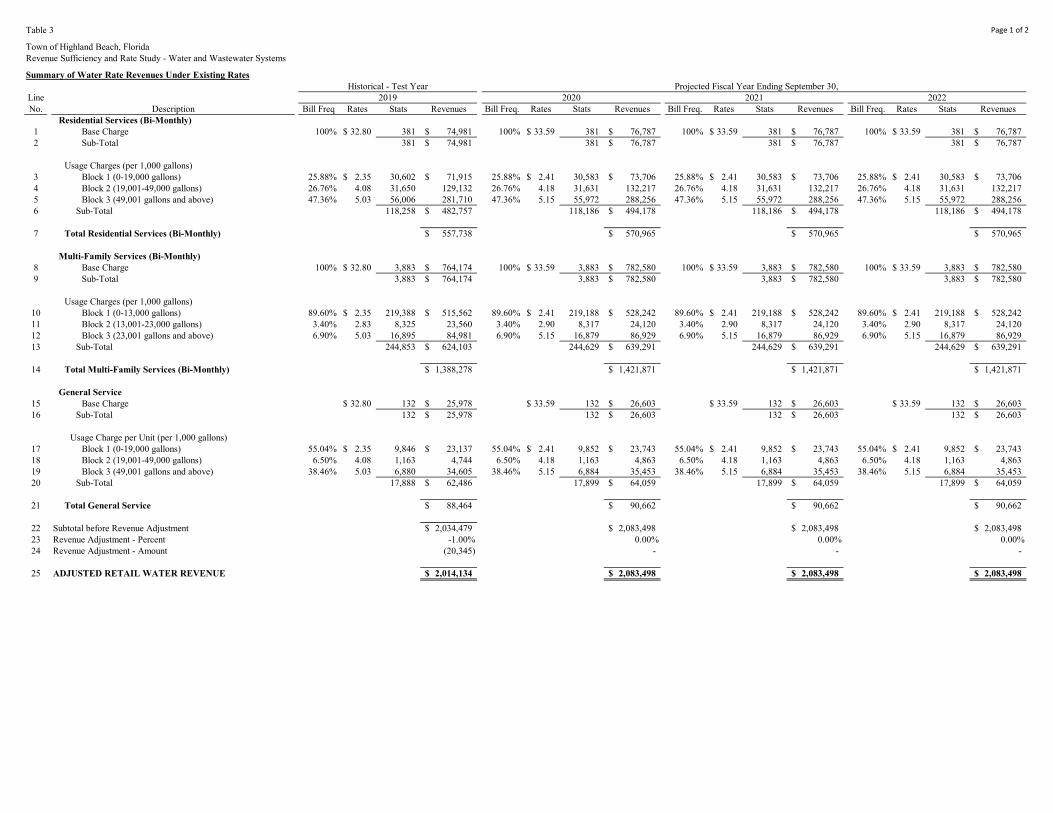
Page 1 of 2Table 3
Town of Highland Beach, FloridaRevenue Sufficiency and Rate Study - Water and Wastewater Systems
Summary of Water Rate Revenues Under Existing RatesHistorical - Test Year Projected Fiscal Year Ending September 30,
Line 2019 2020 2021 2022No. Description Bill Freq Rates Stats Revenues Bill Freq. Rates Stats Revenues Bill Freq. Rates Stats Revenues Bill Freq. Rates Stats Revenues
Residential Services (Bi-Monthly)1 Base Charge 100% 32.80$ 381 74,981$ 100% 33.59$ 381 76,787$ 100% 33.59$ 381 76,787$ 100% 33.59$ 381 76,787$ 2 Sub-Total 381 74,981$ 381 76,787$ 381 76,787$ 381 76,787$
Usage Charges (per 1,000 gallons)3 Block 1 (0-19,000 gallons) 25.88% 2.35$ 30,602 71,915$ 25.88% 2.41$ 30,583 73,706$ 25.88% 2.41$ 30,583 73,706$ 25.88% 2.41$ 30,583 73,706$ 4 Block 2 (19,001-49,000 gallons) 26.76% 4.08 31,650 129,132 26.76% 4.18 31,631 132,217 26.76% 4.18 31,631 132,217 26.76% 4.18 31,631 132,217 5 Block 3 (49,001 gallons and above) 47.36% 5.03 56,006 281,710 47.36% 5.15 55,972 288,256 47.36% 5.15 55,972 288,256 47.36% 5.15 55,972 288,256 6 Sub-Total 118,258 482,757$ 118,186 494,178$ 118,186 494,178$ 118,186 494,178$
7 Total Residential Services (Bi-Monthly) 557,738$ 570,965$ 570,965$ 570,965$
Multi-Family Services (Bi-Monthly)8 Base Charge 100% 32.80$ 3,883 764,174$ 100% 33.59$ 3,883 782,580$ 100% 33.59$ 3,883 782,580$ 100% 33.59$ 3,883 782,580$ 9 Sub-Total 3,883 764,174$ 3,883 782,580$ 3,883 782,580$ 3,883 782,580$
Usage Charges (per 1,000 gallons)10 Block 1 (0-13,000 gallons) 89.60% 2.35$ 219,388 515,562$ 89.60% 2.41$ 219,188 528,242$ 89.60% 2.41$ 219,188 528,242$ 89.60% 2.41$ 219,188 528,242$ 11 Block 2 (13,001-23,000 gallons) 3.40% 2.83 8,325 23,560 3.40% 2.90 8,317 24,120 3.40% 2.90 8,317 24,120 3.40% 2.90 8,317 24,120 12 Block 3 (23,001 gallons and above) 6.90% 5.03 16,895 84,981 6.90% 5.15 16,879 86,929 6.90% 5.15 16,879 86,929 6.90% 5.15 16,879 86,929 13 Sub-Total 244,853 624,103$ 244,629 639,291$ 244,629 639,291$ 244,629 639,291$
14 Total Multi-Family Services (Bi-Monthly) 1,388,278$ 1,421,871$ 1,421,871$ 1,421,871$
General Service15 Base Charge 32.80$ 132 25,978$ 33.59$ 132 26,603$ 33.59$ 132 26,603$ 33.59$ 132 26,603$ 16 Sub-Total 132 25,978$ 132 26,603$ 132 26,603$ 132 26,603$
Usage Charge per Unit (per 1,000 gallons)17 Block 1 (0-19,000 gallons) 55.04% 2.35$ 9,846 23,137$ 55.04% 2.41$ 9,852 23,743$ 55.04% 2.41$ 9,852 23,743$ 55.04% 2.41$ 9,852 23,743$ 18 Block 2 (19,001-49,000 gallons) 6.50% 4.08 1,163 4,744 6.50% 4.18 1,163 4,863 6.50% 4.18 1,163 4,863 6.50% 4.18 1,163 4,863 19 Block 3 (49,001 gallons and above) 38.46% 5.03 6,880 34,605 38.46% 5.15 6,884 35,453 38.46% 5.15 6,884 35,453 38.46% 5.15 6,884 35,453 20 Sub-Total 17,888 62,486$ 17,899 64,059$ 17,899 64,059$ 17,899 64,059$
21 Total General Service 88,464$ 90,662$ 90,662$ 90,662$
22 Subtotal before Revenue Adjustment 2,034,479$ 2,083,498$ 2,083,498$ 2,083,498$ 23 Revenue Adjustment - Percent -1.00% 0.00% 0.00% 0.00%24 Revenue Adjustment - Amount (20,345) - - -
25 ADJUSTED RETAIL WATER REVENUE 2,014,134$ 2,083,498$ 2,083,498$ 2,083,498$

Page 2 of 2Table 3
Town of Highland Beach, FloridaRevenue Sufficiency and Rate Study - Water and Wastewater Systems
Summary of Water Rate Revenues Under Existing Rates
LineNo. Description
Residential Services (Bi-Monthly)1 Base Charge 2 Sub-Total
Usage Charges (per 1,000 gallons)3 Block 1 (0-19,000 gallons)4 Block 2 (19,001-49,000 gallons)5 Block 3 (49,001 gallons and above)6 Sub-Total
7 Total Residential Services (Bi-Monthly)
Multi-Family Services (Bi-Monthly)8 Base Charge 9 Sub-Total
Usage Charges (per 1,000 gallons)10 Block 1 (0-13,000 gallons)11 Block 2 (13,001-23,000 gallons)12 Block 3 (23,001 gallons and above)13 Sub-Total
14 Total Multi-Family Services (Bi-Monthly)
General Service15 Base Charge 16 Sub-Total
Usage Charge per Unit (per 1,000 gallons)17 Block 1 (0-19,000 gallons)18 Block 2 (19,001-49,000 gallons)19 Block 3 (49,001 gallons and above)20 Sub-Total
21 Total General Service
22 Subtotal before Revenue Adjustment23 Revenue Adjustment - Percent24 Revenue Adjustment - Amount
25 ADJUSTED RETAIL WATER REVENUE
Projected Fiscal Year Ending September 30,2023 2024 2025
Bill Freq. Rates Stats Revenues Bill Freq. Rates Stats Revenues Bill Freq. Rates Stats Revenues
100% 33.59$ 381 76,787$ 100% 33.59$ 381 76,787$ 100% 33.59$ 381 76,787$ 381 76,787$ 381 76,787$ 381 76,787$
25.88% 2.41$ 30,583 73,706$ 25.88% 2.41$ 30,583 73,706$ 25.88% 2.41$ 30,583 73,706$ 26.76% 4.18 31,631 132,217 26.76% 4.18 31,631 132,217 26.76% 4.18 31,631 132,217 47.36% 5.15 55,972 288,256 47.36% 5.15 55,972 288,256 47.36% 5.15 55,972 288,256
118,186 494,178$ 118,186 494,178$ 118,186 494,178$
570,965$ 570,965$ 570,965$
100% 33.59$ 3,883 782,580$ 100% 33.59$ 3,883 782,580$ 100% 33.59$ 3,883 782,580$ 3,883 782,580$ 3,883 782,580$ 3,883 782,580$
89.60% 2.41$ 219,188 528,242$ 89.60% 2.41$ 219,188 528,242$ 89.60% 2.41$ 219,188 528,242$ 3.40% 2.90 8,317 24,120 3.40% 2.90 8,317 24,120 3.40% 2.90 8,317 24,120 6.90% 5.15 16,879 86,929 6.90% 5.15 16,879 86,929 6.90% 5.15 16,879 86,929
244,629 639,291$ 244,629 639,291$ 244,629 639,291$
1,421,871$ 1,421,871$ 1,421,871$
33.59$ 132 26,603$ 33.59$ 132 26,603$ 33.59$ 132 26,603$ 132 26,603$ 132 26,603$ 132 26,603$
55.04% 2.41$ 9,852 23,743$ 55.04% 2.41$ 9,852 23,743$ 55.04% 2.41$ 9,852 23,743$ 6.50% 4.18 1,163 4,863 6.50% 4.18 1,163 4,863 6.50% 4.18 1,163 4,863
38.46% 5.15 6,884 35,453 38.46% 5.15 6,884 35,453 38.46% 5.15 6,884 35,453 17,899 64,059$ 17,899 64,059$ 17,899 64,059$
90,662$ 90,662$ 90,662$
2,083,498$ 2,083,498$ 2,083,498$ 0.00% 0.00% 0.00%
- - -
2,083,498$ 2,083,498$ 2,083,498$

Page 1 of 2Table 4
Town of Highland Beach, FloridaRevenue Sufficiency and Rate Study - Water and Wastewater Systems
Summary of Wastewater Rate Revenue Under Existing RatesHistorical - Test Year Projected Fiscal Year Ending September 30,
Line 2019 2020 2021 2022No. Description Bill Freq Rates Stats Revenues Bill Freq. Rates Stats Revenues Bill Freq. Rates Stats Revenues Bill Freq. Rates Stats Revenues
Residential Metered Services (Bi-Monthly)1 Base Charge 100.00% 43.00$ 381 98,298$ 100.00% 44.03$ 381 100,653$ 100.00% 44.03$ 381 100,653$ 100.00% 44.03$ 381 100,653$ 2 Sub-Total 381 98,298$ 381 100,653$ 381 100,653$ 381 100,653$
Multi-Family Services (Bi-Monthly)3 Base Charge 100.00% 43.00$ 3,875 999,750$ 100.00% 44.03$ 3,875 1,023,698$ 100.00% 44.03$ 3,875 1,023,698$ 100.00% 44.03$ 3,875 1,023,698$ 4 Sub-Total 3,875 999,750$ 3,875 1,023,698$ 3,875 1,023,698$ 3,875 1,023,698$
Other Customers Service (Bi-Monthly)5 Base Charge 100.00% 43.00$ 132 34,056$ 100.00% 44.03$ 132 34,872$ 100.00% 44.03$ 132 34,872$ 100.00% 44.03$ 132 34,872$ 6 Sub-Total 132 34,056$ 132 34,872$ 132 34,872$ 132 34,872$
7 Subtotal before Revenue Adjustment 1,132,104$ 1,159,222$ 1,159,222$ 1,159,222$ 8 Revenue Adjustment - Percent 0.00% 0.00% 0.00% 0.00%9 Revenue Adjustment - Amount - - - -
10 ADJUSTED RETAIL WASTEWATER REVENUE 1,132,104$ 1,159,222$ 1,159,222$ 1,159,222$
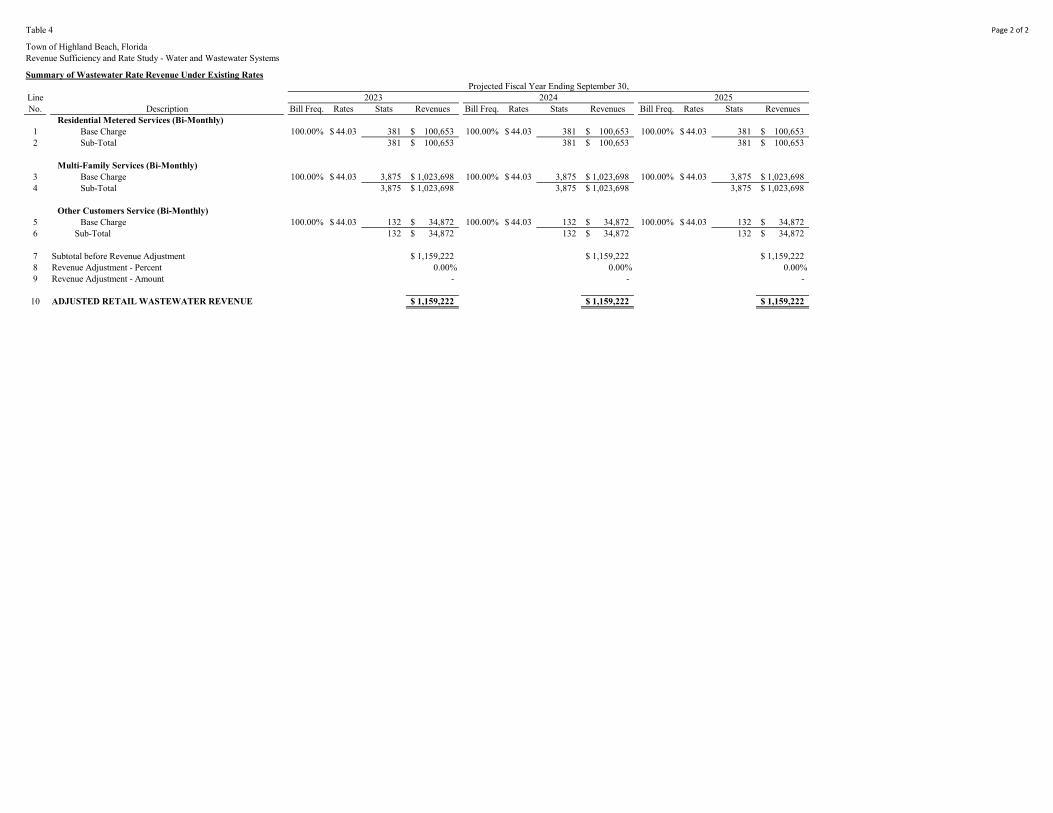
Page 2 of 2Table 4
Town of Highland Beach, FloridaRevenue Sufficiency and Rate Study - Water and Wastewater Systems
Summary of Wastewater Rate Revenue Under Existing Rates
LineNo. Description
Residential Metered Services (Bi-Monthly)1 Base Charge 2 Sub-Total
Multi-Family Services (Bi-Monthly)3 Base Charge 4 Sub-Total
Other Customers Service (Bi-Monthly)5 Base Charge 6 Sub-Total
7 Subtotal before Revenue Adjustment8 Revenue Adjustment - Percent9 Revenue Adjustment - Amount
10 ADJUSTED RETAIL WASTEWATER REVENUE
Projected Fiscal Year Ending September 30,2023 2024 2025
Bill Freq. Rates Stats Revenues Bill Freq. Rates Stats Revenues Bill Freq. Rates Stats Revenues
100.00% 44.03$ 381 100,653$ 100.00% 44.03$ 381 100,653$ 100.00% 44.03$ 381 100,653$ 381 100,653$ 381 100,653$ 381 100,653$
100.00% 44.03$ 3,875 1,023,698$ 100.00% 44.03$ 3,875 1,023,698$ 100.00% 44.03$ 3,875 1,023,698$ 3,875 1,023,698$ 3,875 1,023,698$ 3,875 1,023,698$
100.00% 44.03$ 132 34,872$ 100.00% 44.03$ 132 34,872$ 100.00% 44.03$ 132 34,872$ 132 34,872$ 132 34,872$ 132 34,872$
1,159,222$ 1,159,222$ 1,159,222$ 0.00% 0.00% 0.00%
- - -
1,159,222$ 1,159,222$ 1,159,222$

Page 1 of 1Table 5
Town of Highland Beach, FloridaRevenue Sufficiency and Rate Study - Water and Wastewater Systems
Summary of Other Operating Revenues
Line Historical Budget Adjusted Budget Adjusted Fiscal Year Ending September 30,No. Description 2017 2018 2019 2020 Adjustments 2020 Escalator 2021 Adjustments 2021 2022 2023 2024 2025
Other System Revenues YesWater - Other Revenues
1 Fire Hydrant - Maintenance Fee 30,720$ 30,720$ -$ 30,720$ -$ 30,720$ Constant 30,720$ -$ 30,720$ 30,720$ 30,720$ 30,720$ 30,720$ 2 Interest on Investments 15,463 56,479 84,797 60,000 (60,000) - Constant 35,000 (35,000) - - - - - 3 Disposition of Fixed Assets - - - - - - Constant - - - - - - - 4 Administrative Reimbursements 140,000 140,000 140,000 147,000 - 147,000 Calculated 154,350 - 154,350 158,363 162,322 166,218 170,041 5 Insurance Reimbursements - - 2,965 - - - Constant - - - - - - - 6 Other Miscellaneous Revenue 3,561 2,027 289 3,000 (1,000) 2,000 Constant 3,000 (1,000) 2,000 2,000 2,000 2,000 2,000 7 Total Water - Other Revenues 189,744$ 229,226$ 228,051$ 240,720$ (61,000)$ 179,720$ 223,070$ (36,000)$ 187,070$ 191,083$ 195,042$ 198,938$ 202,761$
Wastewater - Other Revenues8 Interest on Investments 6,443$ 24,731$ 37,982$ 25,000$ (25,000)$ -$ Constant 15,000$ (15,000)$ -$ -$ -$ -$ -$ 9 Insurance Reimbursements - - 35 - - - Constant - - - - - - - 10 Other Miscellaneous Revenue - - - - - - Constant - - - - - - - 11 Total Wastewater - Other Revenues 6,443$ 24,731$ 38,017$ 25,000$ (25,000)$ -$ 15,000$ (15,000)$ -$ -$ -$ -$ -$
12 Total Other System Revenues 196,187$ 253,958$ 266,068$ 265,720$ (86,000)$ 179,720$ 238,070$ (51,000)$ 187,070$ 191,083$ 195,042$ 198,938$ 202,761$

Page 1 of 1Table 6
Town of Highland Beach, FloridaRevenue Sufficiency and Rate Study - Water and Wastewater Systems
Calculation of Projected Impact Fee Revenues
Line Fiscal Year Ending September 30,No. Description 2020 2021 2022 2023 2024 2025
Water System1 Additional Customers (ERUs) - - - - - -
Reconnects 2 Percentage 0.00% 100.00% 100.00% 100.00% 100.00% 100.00%3 Customers (3/4" Meters) - - - - - - 4 New Connections - - - - - -
Connection Fees5 Water 3,000 3,000 3,000 3,000 3,000 3,0006 Total Connection Fees $3,000 $3,000 $3,000 $3,000 $3,000 $3,000
Revenues7 Water $0.00 $0.00 $0.00 $0.00 $0.00 $0.008 Total Revenues $0.00 $0.00 $0.00 $0.00 $0.00 $0.00
Wastewater System9 Additional Customers (ERUs) - - - - - -
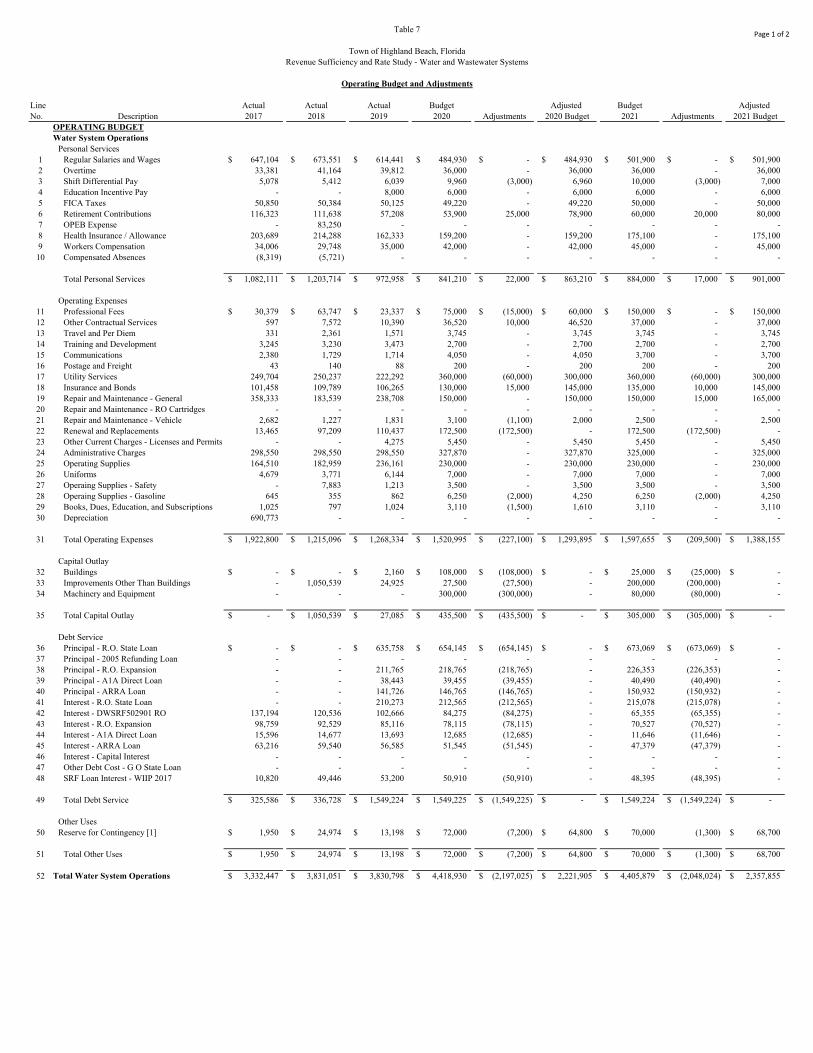
Page 1 of 2Table 7
Town of Highland Beach, FloridaRevenue Sufficiency and Rate Study - Water and Wastewater Systems
Operating Budget and Adjustments
Line Actual Actual Actual Budget Adjusted Budget Adjusted No. Description 2017 2018 2019 2020 Adjustments 2020 Budget 2021 Adjustments 2021 Budget
OPERATING BUDGETWater System Operations
Personal Services1 Regular Salaries and Wages 647,104$ 673,551$ 614,441$ 484,930$ -$ 484,930$ 501,900$ -$ 501,900$ 2 Overtime 33,381 41,164 39,812 36,000 - 36,000 36,000 - 36,000 3 Shift Differential Pay 5,078 5,412 6,039 9,960 (3,000) 6,960 10,000 (3,000) 7,000 4 Education Incentive Pay - - 8,000 6,000 - 6,000 6,000 - 6,000 5 FICA Taxes 50,850 50,384 50,125 49,220 - 49,220 50,000 - 50,000 6 Retirement Contributions 116,323 111,638 57,208 53,900 25,000 78,900 60,000 20,000 80,000 7 OPEB Expense - 83,250 - - - - - - - 8 Health Insurance / Allowance 203,689 214,288 162,333 159,200 - 159,200 175,100 - 175,100 9 Workers Compensation 34,006 29,748 35,000 42,000 - 42,000 45,000 - 45,000
10 Compensated Absences (8,319) (5,721) - - - - - - -
Total Personal Services 1,082,111$ 1,203,714$ 972,958$ 841,210$ 22,000$ 863,210$ 884,000$ 17,000$ 901,000$
Operating Expenses11 Professional Fees 30,379$ 63,747$ 23,337$ 75,000$ (15,000)$ 60,000$ 150,000$ -$ 150,000$ 12 Other Contractual Services 597 7,572 10,390 36,520 10,000 46,520 37,000 - 37,000 13 Travel and Per Diem 331 2,361 1,571 3,745 - 3,745 3,745 - 3,745 14 Training and Development 3,245 3,230 3,473 2,700 - 2,700 2,700 - 2,700 15 Communications 2,380 1,729 1,714 4,050 - 4,050 3,700 - 3,700 16 Postage and Freight 43 140 88 200 - 200 200 - 200 17 Utility Services 249,704 250,237 222,292 360,000 (60,000) 300,000 360,000 (60,000) 300,000 18 Insurance and Bonds 101,458 109,789 106,265 130,000 15,000 145,000 135,000 10,000 145,000 19 Repair and Maintenance - General 358,333 183,539 238,708 150,000 - 150,000 150,000 15,000 165,000 20 Repair and Maintenance - RO Cartridges - - - - - - - - - 21 Repair and Maintenance - Vehicle 2,682 1,227 1,831 3,100 (1,100) 2,000 2,500 - 2,500 22 Renewal and Replacements 13,465 97,209 110,437 172,500 (172,500) - 172,500 (172,500) - 23 Other Current Charges - Licenses and Permits - - 4,275 5,450 - 5,450 5,450 - 5,450 24 Administrative Charges 298,550 298,550 298,550 327,870 - 327,870 325,000 - 325,000 25 Operating Supplies 164,510 182,959 236,161 230,000 - 230,000 230,000 - 230,000 26 Uniforms 4,679 3,771 6,144 7,000 - 7,000 7,000 - 7,000 27 Operaing Supplies - Safety - 7,883 1,213 3,500 - 3,500 3,500 - 3,500 28 Operaing Supplies - Gasoline 645 355 862 6,250 (2,000) 4,250 6,250 (2,000) 4,250 29 Books, Dues, Education, and Subscriptions 1,025 797 1,024 3,110 (1,500) 1,610 3,110 - 3,110 30 Depreciation 690,773 - - - - - - - -
31 Total Operating Expenses 1,922,800$ 1,215,096$ 1,268,334$ 1,520,995$ (227,100)$ 1,293,895$ 1,597,655$ (209,500)$ 1,388,155$
Capital Outlay32 Buildings -$ -$ 2,160$ 108,000$ (108,000)$ -$ 25,000$ (25,000)$ -$ 33 Improvements Other Than Buildings - 1,050,539 24,925 27,500 (27,500) - 200,000 (200,000) - 34 Machinery and Equipment - - - 300,000 (300,000) - 80,000 (80,000) -
35 Total Capital Outlay -$ 1,050,539$ 27,085$ 435,500$ (435,500)$ -$ 305,000$ (305,000)$ -$
Debt Service36 Principal - R.O. State Loan -$ -$ 635,758$ 654,145$ (654,145)$ -$ 673,069$ (673,069)$ -$ 37 Principal - 2005 Refunding Loan - - - - - - - - - 38 Principal - R.O. Expansion - - 211,765 218,765 (218,765) - 226,353 (226,353) - 39 Principal - A1A Direct Loan - - 38,443 39,455 (39,455) - 40,490 (40,490) - 40 Principal - ARRA Loan - - 141,726 146,765 (146,765) - 150,932 (150,932) - 41 Interest - R.O. State Loan - - 210,273 212,565 (212,565) - 215,078 (215,078) - 42 Interest - DWSRF502901 RO 137,194 120,536 102,666 84,275 (84,275) - 65,355 (65,355) - 43 Interest - R.O. Expansion 98,759 92,529 85,116 78,115 (78,115) - 70,527 (70,527) - 44 Interest - A1A Direct Loan 15,596 14,677 13,693 12,685 (12,685) - 11,646 (11,646) - 45 Interest - ARRA Loan 63,216 59,540 56,585 51,545 (51,545) - 47,379 (47,379) - 46 Interest - Capital Interest - - - - - - - - - 47 Other Debt Cost - G O State Loan - - - - - - - - - 48 SRF Loan Interest - WIIP 2017 10,820 49,446 53,200 50,910 (50,910) - 48,395 (48,395) -
49 Total Debt Service 325,586$ 336,728$ 1,549,224$ 1,549,225$ (1,549,225)$ -$ 1,549,224$ (1,549,224)$ -$
Other Uses50 Reserve for Contingency [1] 1,950$ 24,974$ 13,198$ 72,000$ (7,200) 64,800$ 70,000$ (1,300) 68,700$
51 Total Other Uses 1,950$ 24,974$ 13,198$ 72,000$ (7,200)$ 64,800$ 70,000$ (1,300)$ 68,700$
52 Total Water System Operations 3,332,447$ 3,831,051$ 3,830,798$ 4,418,930$ (2,197,025)$ 2,221,905$ 4,405,879$ (2,048,024)$ 2,357,855$
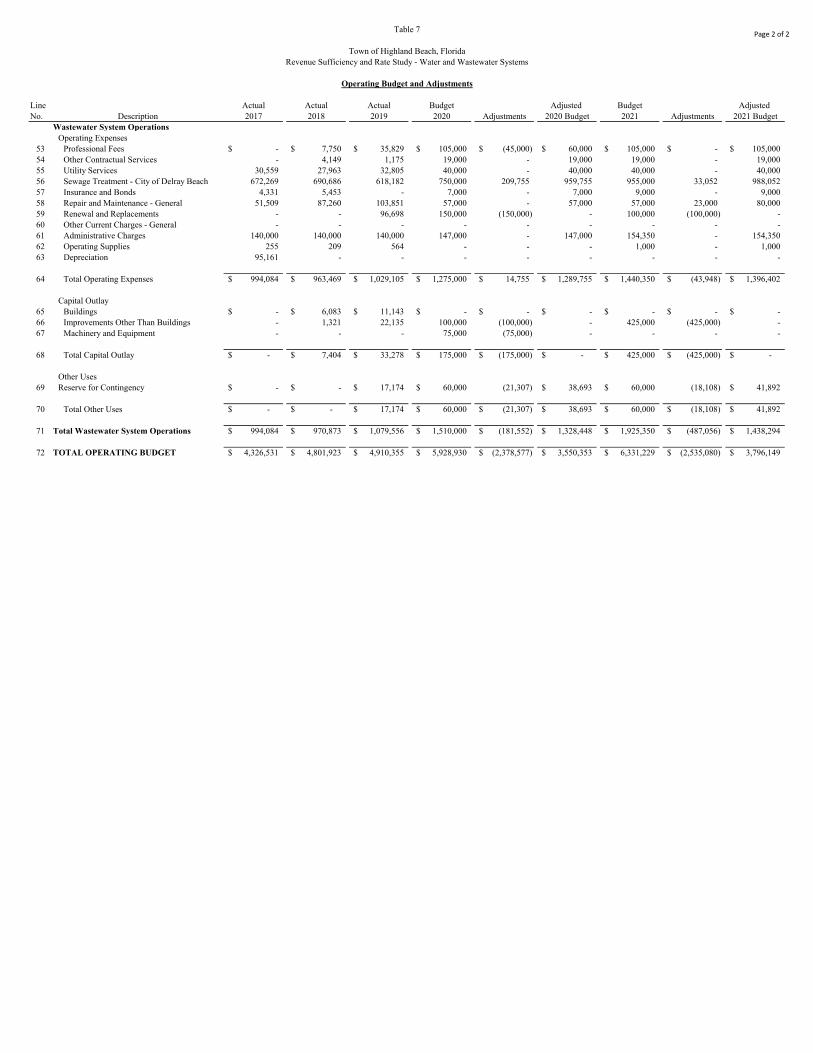
Page 2 of 2Table 7
Town of Highland Beach, FloridaRevenue Sufficiency and Rate Study - Water and Wastewater Systems
Operating Budget and Adjustments
Line Actual Actual Actual Budget Adjusted Budget Adjusted No. Description 2017 2018 2019 2020 Adjustments 2020 Budget 2021 Adjustments 2021 Budget
Wastewater System OperationsOperating Expenses
53 Professional Fees -$ 7,750$ 35,829$ 105,000$ (45,000)$ 60,000$ 105,000$ -$ 105,000$ 54 Other Contractual Services - 4,149 1,175 19,000 - 19,000 19,000 - 19,000 55 Utility Services 30,559 27,963 32,805 40,000 - 40,000 40,000 - 40,000 56 Sewage Treatment - City of Delray Beach 672,269 690,686 618,182 750,000 209,755 959,755 955,000 33,052 988,052 57 Insurance and Bonds 4,331 5,453 - 7,000 - 7,000 9,000 - 9,000 58 Repair and Maintenance - General 51,509 87,260 103,851 57,000 - 57,000 57,000 23,000 80,000 59 Renewal and Replacements - - 96,698 150,000 (150,000) - 100,000 (100,000) - 60 Other Current Charges - General - - - - - - - - - 61 Administrative Charges 140,000 140,000 140,000 147,000 - 147,000 154,350 - 154,350 62 Operating Supplies 255 209 564 - - - 1,000 - 1,000 63 Depreciation 95,161 - - - - - - - -
64 Total Operating Expenses 994,084$ 963,469$ 1,029,105$ 1,275,000$ 14,755$ 1,289,755$ 1,440,350$ (43,948)$ 1,396,402$
Capital Outlay65 Buildings -$ 6,083$ 11,143$ -$ -$ -$ -$ -$ -$ 66 Improvements Other Than Buildings - 1,321 22,135 100,000 (100,000) - 425,000 (425,000) - 67 Machinery and Equipment - - - 75,000 (75,000) - - - -
68 Total Capital Outlay -$ 7,404$ 33,278$ 175,000$ (175,000)$ -$ 425,000$ (425,000)$ -$
Other Uses69 Reserve for Contingency -$ -$ 17,174$ 60,000$ (21,307) 38,693$ 60,000$ (18,108) 41,892$
70 Total Other Uses -$ -$ 17,174$ 60,000$ (21,307)$ 38,693$ 60,000$ (18,108)$ 41,892$
71 Total Wastewater System Operations 994,084$ 970,873$ 1,079,556$ 1,510,000$ (181,552)$ 1,328,448$ 1,925,350$ (487,056)$ 1,438,294$
72 TOTAL OPERATING BUDGET 4,326,531$ 4,801,923$ 4,910,355$ 5,928,930$ (2,378,577)$ 3,550,353$ 6,331,229$ (2,535,080)$ 3,796,149$
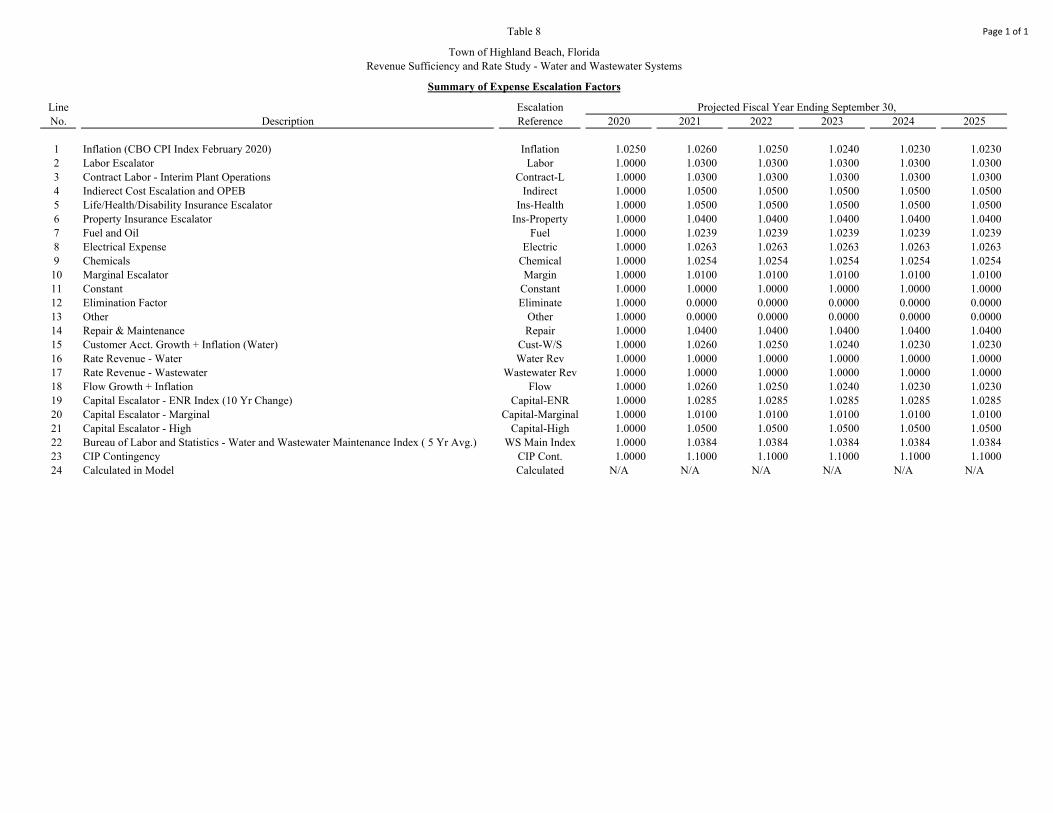
Page 1 of 1Table 8
Town of Highland Beach, FloridaRevenue Sufficiency and Rate Study - Water and Wastewater Systems
Summary of Expense Escalation Factors
Line Escalation Projected Fiscal Year Ending September 30,No. Description Reference 2020 2021 2022 2023 2024 2025
1 Inflation (CBO CPI Index February 2020) Inflation 1.0250 1.0260 1.0250 1.0240 1.0230 1.02302 Labor Escalator Labor 1.0000 1.0300 1.0300 1.0300 1.0300 1.03003 Contract Labor - Interim Plant Operations Contract-L 1.0000 1.0300 1.0300 1.0300 1.0300 1.03004 Indierect Cost Escalation and OPEB Indirect 1.0000 1.0500 1.0500 1.0500 1.0500 1.05005 Life/Health/Disability Insurance Escalator Ins-Health 1.0000 1.0500 1.0500 1.0500 1.0500 1.05006 Property Insurance Escalator Ins-Property 1.0000 1.0400 1.0400 1.0400 1.0400 1.04007 Fuel and Oil Fuel 1.0000 1.0239 1.0239 1.0239 1.0239 1.02398 Electrical Expense Electric 1.0000 1.0263 1.0263 1.0263 1.0263 1.02639 Chemicals Chemical 1.0000 1.0254 1.0254 1.0254 1.0254 1.0254
10 Marginal Escalator Margin 1.0000 1.0100 1.0100 1.0100 1.0100 1.010011 Constant Constant 1.0000 1.0000 1.0000 1.0000 1.0000 1.000012 Elimination Factor Eliminate 1.0000 0.0000 0.0000 0.0000 0.0000 0.000013 Other Other 1.0000 0.0000 0.0000 0.0000 0.0000 0.000014 Repair & Maintenance Repair 1.0000 1.0400 1.0400 1.0400 1.0400 1.040015 Customer Acct. Growth + Inflation (Water) Cust-W/S 1.0000 1.0260 1.0250 1.0240 1.0230 1.023016 Rate Revenue - Water Water Rev 1.0000 1.0000 1.0000 1.0000 1.0000 1.000017 Rate Revenue - Wastewater Wastewater Rev 1.0000 1.0000 1.0000 1.0000 1.0000 1.000018 Flow Growth + Inflation Flow 1.0000 1.0260 1.0250 1.0240 1.0230 1.023019 Capital Escalator - ENR Index (10 Yr Change) Capital-ENR 1.0000 1.0285 1.0285 1.0285 1.0285 1.028520 Capital Escalator - Marginal Capital-Marginal 1.0000 1.0100 1.0100 1.0100 1.0100 1.010021 Capital Escalator - High Capital-High 1.0000 1.0500 1.0500 1.0500 1.0500 1.050022 Bureau of Labor and Statistics - Water and Wastewater Maintenance Index ( 5 Yr Avg.) WS Main Index 1.0000 1.0384 1.0384 1.0384 1.0384 1.038423 CIP Contingency CIP Cont. 1.0000 1.1000 1.1000 1.1000 1.1000 1.100024 Calculated in Model Calculated N/A N/A N/A N/A N/A N/A

Page 1 of 1Table 9
Town of Highland Beach, FloridaRevenue Sufficiency and Rate Study - Water and Wastewater Systems
Summary of Expense Allocation Factors
Line EscalationNo. Description Reference Water Wastewater Indirect
1 Direct Water Expense Water 100.00% 0.00% 0.00%2 Direct Wastewater Expense Wastewater 0.00% 100.00% 0.00%3 Indirect Expense Indirect 0.00% 0.00% 100.00%4 Total 2019 Rate Revenue Revenue 64.02% 35.98% 0.00%5 Total Estimated Treated Flow 2020 Flow 63.11% 36.89% 0.00%6 Total Fixed Assets - 2019 Assets 97.61% 2.39% 0.00%7 50% / 50% Split 50/50 50.00% 50.00% 0.00%

Page 1 of 3Table 10
Town of Highland Beach, FloridaRevenue Sufficiency and Rate Study - Water and Wastewater Systems
Projection and Allocation of Operating and Maintenance Expenditures to Water and Wastewater Systems
Line Escalation Fiscal Year Ending September 30,No. Description Factor 2020 2021 2022 2023 2024 2025
Total Water System OperationsPersonal Services
1 Regular Salaries and Wages Labor 484,930$ 501,900$ 516,957$ 532,466$ 548,440$ 564,893$ 2 Additional Personnel - Water Calculated - - 107,601 110,788 114,118 117,594 3 Additional Personnel - Wastewater Calculated - - - - - - 4 Overtime Labor 36,000 36,000 37,080 38,192 39,338 40,518 5 Shift Differential Pay Labor 6,960 7,000 7,210 7,426 7,649 7,879 6 Education Incentive Pay Labor 6,000 6,000 6,180 6,365 6,556 6,753 7 FICA Taxes Labor 49,220 50,000 51,500 53,045 54,636 56,275 8 Retirement Contributions Labor 78,900 80,000 82,400 84,872 87,418 90,041 9 Health Insurance / Allowance Ins-Health 159,200 175,100 183,855 193,048 202,700 212,835 10 Workers Compensation Labor 42,000 45,000 46,350 47,741 49,173 50,648 11 Compensated Absences Labor - - - - - -
Operating Expenses12 Professional Fees Inflation 60,000$ 150,000$ 75,000$ 76,875$ 78,720$ 80,531$ 13 Other Contractual Services Inflation 46,520 37,000 37,962 38,911 39,845 40,761 14 Travel and Per Diem Inflation 3,745 3,745 3,842 3,938 4,033 4,126 15 Training and Development Inflation 2,700 2,700 2,770 2,839 2,908 2,974 16 Communications Inflation 4,050 3,700 3,796 3,891 3,984 4,076 17 Postage and Freight Inflation 200 200 205 210 215 220 18 Utility Services Electric 300,000 300,000 307,890 315,988 324,298 332,827 19 Insurance and Bonds Inflation 145,000 145,000 148,770 152,489 156,149 159,740 20 Repair and Maintenance - General Repair 150,000 165,000 171,600 178,464 185,603 193,027 21 Repair and Maintenance - RO Cartridges Repair - - - - - - 22 Repair and Maintenance - Vehicle Repair 2,000 2,500 2,600 2,704 2,812 2,925 23 Renewal and Replacements Repair - - - - - - 24 Other Current Charges - Licenses and Permits Labor 5,450 5,450 5,614 5,782 5,955 6,134 25 Administrative Charges Inflation 327,870 325,000 333,450 341,786 349,989 358,039 26 Operating Supplies Inflation 230,000 230,000 235,980 241,880 247,685 253,381 27 Uniforms Labor 7,000 7,000 7,210 7,426 7,649 7,879 28 Operaing Supplies - Safety Inflation 3,500 3,500 3,591 3,681 3,769 3,856 29 Operaing Supplies - Gasoline Inflation 4,250 4,250 4,361 4,470 4,577 4,682 30 Books, Dues, Education, and Subscriptions Labor 1,610 3,110 3,203 3,299 3,398 3,500 31 Depreciation Inflation - - - - - -
Capital Outlay32 Buildings Inflation -$ -$ -$ -$ -$ -$ 33 Improvements Other Than Buildings Inflation - - - - - - 33 Machinery and Equipement Inflation - - - - - - 34 Reclass Expenditures from CIP Calculated 108,000 51,425 - - 335,690 -
Other Uses35 Reserve for Contingency Calculated 64,800 68,700 71,609$ 73,757$ 75,949$ 78,183$ 36 Bad Debt Expense Calculated 3,125 3,594 4,025 4,508 4,779 4,898
Total Wastewater System OperationsOperating Expenses
37 Other Contractual Services Inflation 60,000$ 105,000$ 60,000$ 61,500$ 62,976$ 64,424$ 38 Other Contractual Services Inflation 19,000 19,000 19,494 19,981 20,461 20,932 39 Utility Services Electric 40,000 40,000 41,052 42,132 43,240 44,377 40 Sewage Treatment - City of Delray Beach Calculated 959,755 988,052 909,542 936,816 964,924 993,866 41 Insurance and Bonds Ins-Property 7,000 9,000 9,360 9,734 10,124 10,529 42 Repair and Maintenance - General Repair 57,000 80,000 83,200 86,528 89,989 93,589 43 Renewal and Replacements Repair - - - - - - 44 Other Current Charges - General Inflation - - - - - - 45 Administrative Charges Inflation 147,000 154,350 158,363 162,322 166,218 170,041 46 Operating Supplies Inflation - 1,000 1,026 1,052 1,077 1,102 47 Depreciation Inflation - - - - - -
Capital Outlay48 Buildings Calculated -$ -$ -$ -$ -$ -$ 49 Improvements Other Than Buildings Calculated - - - - - - 50 Machinery and Equipement Calculated - - - - - - 51 Reclass Expenditures from CIP Calculated - - - - - -
Other Uses52 Reserve for Contingency Calculated 38,693$ 41,892$ 38,461$ 39,602$ 40,770$ 41,966$ 53 Bad Debt Expense Calculated 1,739 2,174 2,456 2,775 2,942 3,015
54 TOTAL BUDGETED O&M 3,663,217$ 3,853,342$ 3,785,567$ 3,899,285$ 4,350,756$ 4,133,037$
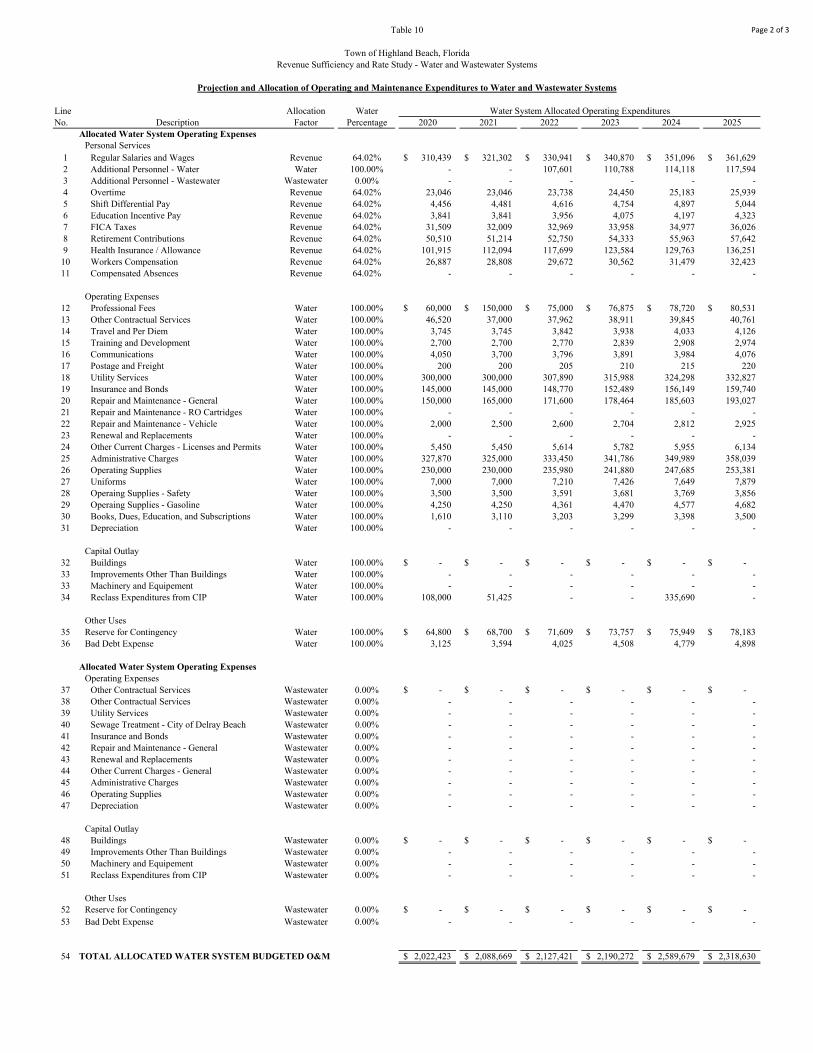
Page 2 of 3Table 10
Town of Highland Beach, FloridaRevenue Sufficiency and Rate Study - Water and Wastewater Systems
Projection and Allocation of Operating and Maintenance Expenditures to Water and Wastewater Systems
Line Allocation Water Water System Allocated Operating ExpendituresNo. Description Factor Percentage 2020 2021 2022 2023 2024 2025
Allocated Water System Operating ExpensesPersonal Services
1 Regular Salaries and Wages Revenue 64.02% 310,439$ 321,302$ 330,941$ 340,870$ 351,096$ 361,629$ 2 Additional Personnel - Water Water 100.00% - - 107,601 110,788 114,118 117,594 3 Additional Personnel - Wastewater Wastewater 0.00% - - - - - - 4 Overtime Revenue 64.02% 23,046 23,046 23,738 24,450 25,183 25,939 5 Shift Differential Pay Revenue 64.02% 4,456 4,481 4,616 4,754 4,897 5,044 6 Education Incentive Pay Revenue 64.02% 3,841 3,841 3,956 4,075 4,197 4,323 7 FICA Taxes Revenue 64.02% 31,509 32,009 32,969 33,958 34,977 36,026 8 Retirement Contributions Revenue 64.02% 50,510 51,214 52,750 54,333 55,963 57,642 9 Health Insurance / Allowance Revenue 64.02% 101,915 112,094 117,699 123,584 129,763 136,251 10 Workers Compensation Revenue 64.02% 26,887 28,808 29,672 30,562 31,479 32,423 11 Compensated Absences Revenue 64.02% - - - - - -
Operating Expenses12 Professional Fees Water 100.00% 60,000$ 150,000$ 75,000$ 76,875$ 78,720$ 80,531$ 13 Other Contractual Services Water 100.00% 46,520 37,000 37,962 38,911 39,845 40,761 14 Travel and Per Diem Water 100.00% 3,745 3,745 3,842 3,938 4,033 4,126 15 Training and Development Water 100.00% 2,700 2,700 2,770 2,839 2,908 2,974 16 Communications Water 100.00% 4,050 3,700 3,796 3,891 3,984 4,076 17 Postage and Freight Water 100.00% 200 200 205 210 215 220 18 Utility Services Water 100.00% 300,000 300,000 307,890 315,988 324,298 332,827 19 Insurance and Bonds Water 100.00% 145,000 145,000 148,770 152,489 156,149 159,740 20 Repair and Maintenance - General Water 100.00% 150,000 165,000 171,600 178,464 185,603 193,027 21 Repair and Maintenance - RO Cartridges Water 100.00% - - - - - - 22 Repair and Maintenance - Vehicle Water 100.00% 2,000 2,500 2,600 2,704 2,812 2,925 23 Renewal and Replacements Water 100.00% - - - - - - 24 Other Current Charges - Licenses and Permits Water 100.00% 5,450 5,450 5,614 5,782 5,955 6,134 25 Administrative Charges Water 100.00% 327,870 325,000 333,450 341,786 349,989 358,039 26 Operating Supplies Water 100.00% 230,000 230,000 235,980 241,880 247,685 253,381 27 Uniforms Water 100.00% 7,000 7,000 7,210 7,426 7,649 7,879 28 Operaing Supplies - Safety Water 100.00% 3,500 3,500 3,591 3,681 3,769 3,856 29 Operaing Supplies - Gasoline Water 100.00% 4,250 4,250 4,361 4,470 4,577 4,682 30 Books, Dues, Education, and Subscriptions Water 100.00% 1,610 3,110 3,203 3,299 3,398 3,500 31 Depreciation Water 100.00% - - - - - -
Capital Outlay32 Buildings Water 100.00% -$ -$ -$ -$ -$ -$ 33 Improvements Other Than Buildings Water 100.00% - - - - - - 33 Machinery and Equipement Water 100.00% - - - - - - 34 Reclass Expenditures from CIP Water 100.00% 108,000 51,425 - - 335,690 -
Other Uses35 Reserve for Contingency Water 100.00% 64,800$ 68,700$ 71,609$ 73,757$ 75,949$ 78,183$ 36 Bad Debt Expense Water 100.00% 3,125 3,594 4,025 4,508 4,779 4,898
Allocated Water System Operating ExpensesOperating Expenses
37 Other Contractual Services Wastewater 0.00% -$ -$ -$ -$ -$ -$ 38 Other Contractual Services Wastewater 0.00% - - - - - - 39 Utility Services Wastewater 0.00% - - - - - - 40 Sewage Treatment - City of Delray Beach Wastewater 0.00% - - - - - - 41 Insurance and Bonds Wastewater 0.00% - - - - - - 42 Repair and Maintenance - General Wastewater 0.00% - - - - - - 43 Renewal and Replacements Wastewater 0.00% - - - - - - 44 Other Current Charges - General Wastewater 0.00% - - - - - - 45 Administrative Charges Wastewater 0.00% - - - - - - 46 Operating Supplies Wastewater 0.00% - - - - - - 47 Depreciation Wastewater 0.00% - - - - - -
Capital Outlay48 Buildings Wastewater 0.00% -$ -$ -$ -$ -$ -$ 49 Improvements Other Than Buildings Wastewater 0.00% - - - - - - 50 Machinery and Equipement Wastewater 0.00% - - - - - - 51 Reclass Expenditures from CIP Wastewater 0.00% - - - - - -
Other Uses52 Reserve for Contingency Wastewater 0.00% -$ -$ -$ -$ -$ -$ 53 Bad Debt Expense Wastewater 0.00% - - - - - -
54 TOTAL ALLOCATED WATER SYSTEM BUDGETED O&M 2,022,423$ 2,088,669$ 2,127,421$ 2,190,272$ 2,589,679$ 2,318,630$
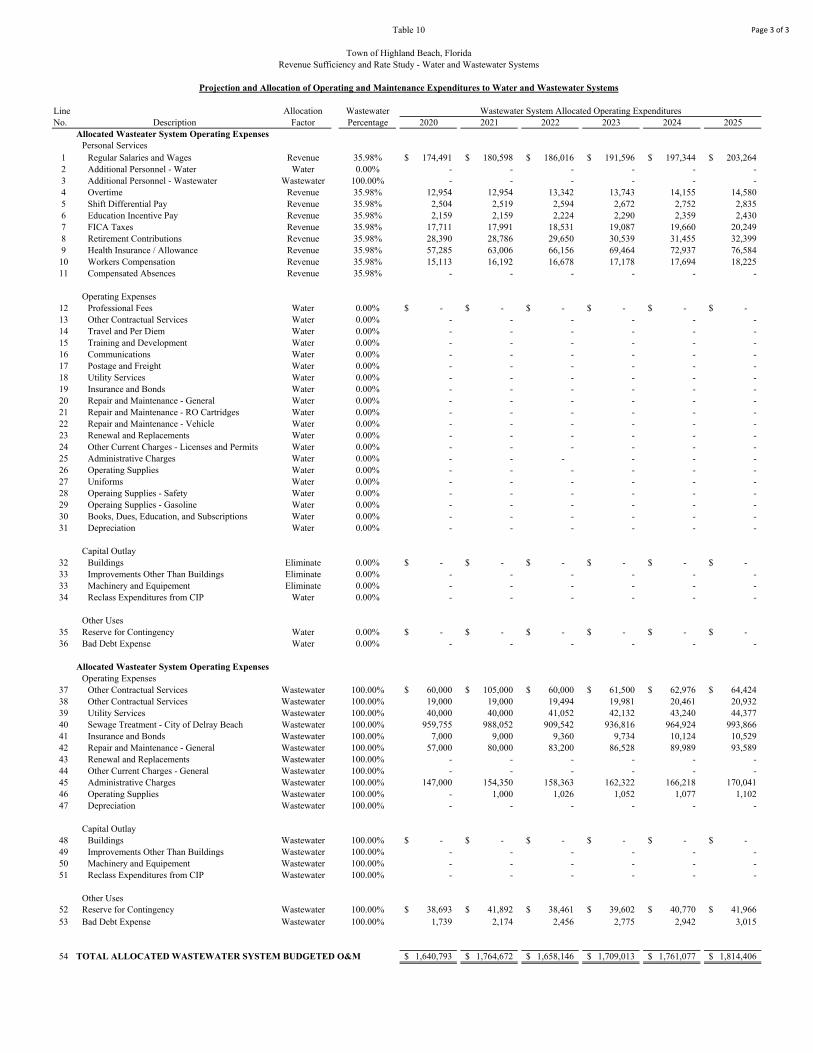
Page 3 of 3Table 10
Town of Highland Beach, FloridaRevenue Sufficiency and Rate Study - Water and Wastewater Systems
Projection and Allocation of Operating and Maintenance Expenditures to Water and Wastewater Systems
Line Allocation Wastewater Wastewater System Allocated Operating ExpendituresNo. Description Factor Percentage 2020 2021 2022 2023 2024 2025
Allocated Wasteater System Operating ExpensesPersonal Services
1 Regular Salaries and Wages Revenue 35.98% 174,491$ 180,598$ 186,016$ 191,596$ 197,344$ 203,264$ 2 Additional Personnel - Water Water 0.00% - - - - - - 3 Additional Personnel - Wastewater Wastewater 100.00% - - - - - - 4 Overtime Revenue 35.98% 12,954 12,954 13,342 13,743 14,155 14,580 5 Shift Differential Pay Revenue 35.98% 2,504 2,519 2,594 2,672 2,752 2,835 6 Education Incentive Pay Revenue 35.98% 2,159 2,159 2,224 2,290 2,359 2,430 7 FICA Taxes Revenue 35.98% 17,711 17,991 18,531 19,087 19,660 20,249 8 Retirement Contributions Revenue 35.98% 28,390 28,786 29,650 30,539 31,455 32,399 9 Health Insurance / Allowance Revenue 35.98% 57,285 63,006 66,156 69,464 72,937 76,584 10 Workers Compensation Revenue 35.98% 15,113 16,192 16,678 17,178 17,694 18,225 11 Compensated Absences Revenue 35.98% - - - - - -
Operating Expenses12 Professional Fees Water 0.00% -$ -$ -$ -$ -$ -$ 13 Other Contractual Services Water 0.00% - - - - - - 14 Travel and Per Diem Water 0.00% - - - - - - 15 Training and Development Water 0.00% - - - - - - 16 Communications Water 0.00% - - - - - - 17 Postage and Freight Water 0.00% - - - - - - 18 Utility Services Water 0.00% - - - - - - 19 Insurance and Bonds Water 0.00% - - - - - - 20 Repair and Maintenance - General Water 0.00% - - - - - - 21 Repair and Maintenance - RO Cartridges Water 0.00% - - - - - - 22 Repair and Maintenance - Vehicle Water 0.00% - - - - - - 23 Renewal and Replacements Water 0.00% - - - - - - 24 Other Current Charges - Licenses and Permits Water 0.00% - - - - - - 25 Administrative Charges Water 0.00% - - - - - - 26 Operating Supplies Water 0.00% - - - - - - 27 Uniforms Water 0.00% - - - - - - 28 Operaing Supplies - Safety Water 0.00% - - - - - - 29 Operaing Supplies - Gasoline Water 0.00% - - - - - - 30 Books, Dues, Education, and Subscriptions Water 0.00% - - - - - - 31 Depreciation Water 0.00% - - - - - -
Capital Outlay32 Buildings Eliminate 0.00% -$ -$ -$ -$ -$ -$ 33 Improvements Other Than Buildings Eliminate 0.00% - - - - - - 33 Machinery and Equipement Eliminate 0.00% - - - - - - 34 Reclass Expenditures from CIP Water 0.00% - - - - - -
Other Uses35 Reserve for Contingency Water 0.00% -$ -$ -$ -$ -$ -$ 36 Bad Debt Expense Water 0.00% - - - - - -
Allocated Wasteater System Operating ExpensesOperating Expenses
37 Other Contractual Services Wastewater 100.00% 60,000$ 105,000$ 60,000$ 61,500$ 62,976$ 64,424$ 38 Other Contractual Services Wastewater 100.00% 19,000 19,000 19,494 19,981 20,461 20,932 39 Utility Services Wastewater 100.00% 40,000 40,000 41,052 42,132 43,240 44,377 40 Sewage Treatment - City of Delray Beach Wastewater 100.00% 959,755 988,052 909,542 936,816 964,924 993,866 41 Insurance and Bonds Wastewater 100.00% 7,000 9,000 9,360 9,734 10,124 10,529 42 Repair and Maintenance - General Wastewater 100.00% 57,000 80,000 83,200 86,528 89,989 93,589 43 Renewal and Replacements Wastewater 100.00% - - - - - - 44 Other Current Charges - General Wastewater 100.00% - - - - - - 45 Administrative Charges Wastewater 100.00% 147,000 154,350 158,363 162,322 166,218 170,041 46 Operating Supplies Wastewater 100.00% - 1,000 1,026 1,052 1,077 1,102 47 Depreciation Wastewater 100.00% - - - - - -
Capital Outlay48 Buildings Wastewater 100.00% -$ -$ -$ -$ -$ -$ 49 Improvements Other Than Buildings Wastewater 100.00% - - - - - - 50 Machinery and Equipement Wastewater 100.00% - - - - - - 51 Reclass Expenditures from CIP Wastewater 100.00% - - - - - -
Other Uses52 Reserve for Contingency Wastewater 100.00% 38,693$ 41,892$ 38,461$ 39,602$ 40,770$ 41,966$ 53 Bad Debt Expense Wastewater 100.00% 1,739 2,174 2,456 2,775 2,942 3,015
54 TOTAL ALLOCATED WASTEWATER SYSTEM BUDGETED O&M 1,640,793$ 1,764,672$ 1,658,146$ 1,709,013$ 1,761,077$ 1,814,406$

Page 1 of 1Table 11
Town of Highland Beach, FloridaRevenue Sufficiency and Rate Study - Water and Wastewater Systems
Calculation of Wastewater Treatment Expenditures
Line Fiscal Year Ending September 30,No. Description 2019 2020 2021 2022 2023 2024 2025
Wastewater Treatment Cost From City1 Implemented Increase 3.00% 3.00% 3.00% 3.00% 3.00%
2 Disposal Charge 3.3694$ 3.3917$ 3.4935$ 3.5983$ 3.7062$ 3.8174$ 3.9319$ 3 Total Rate Per 1,000 Gallons 3.3694$ 3.3917$ 3.4935$ 3.5983$ 3.7062$ 3.8174$ 3.9319$
4 Wastewater Treated by Delray Beach (000's) 245,793 252,014 252,770 252,770 252,770 252,770 252,770 5 Average Daily Flow - MGD 0.673 0.690 0.693 0.693 0.693 0.693 0.693
6 Wastewater System Units 4,396 4,396 4,396 4,396 4,396 4,396 4,396 7 Estimated Annual Wastewater Treated Per Unit 55,913 57,328 57,500 57,500 57,500 57,500 57,500
8 Purchased Wastewater Expense 828,185$ 854,755$ 883,052$ 909,542$ 936,816$ 964,924$ 993,866$
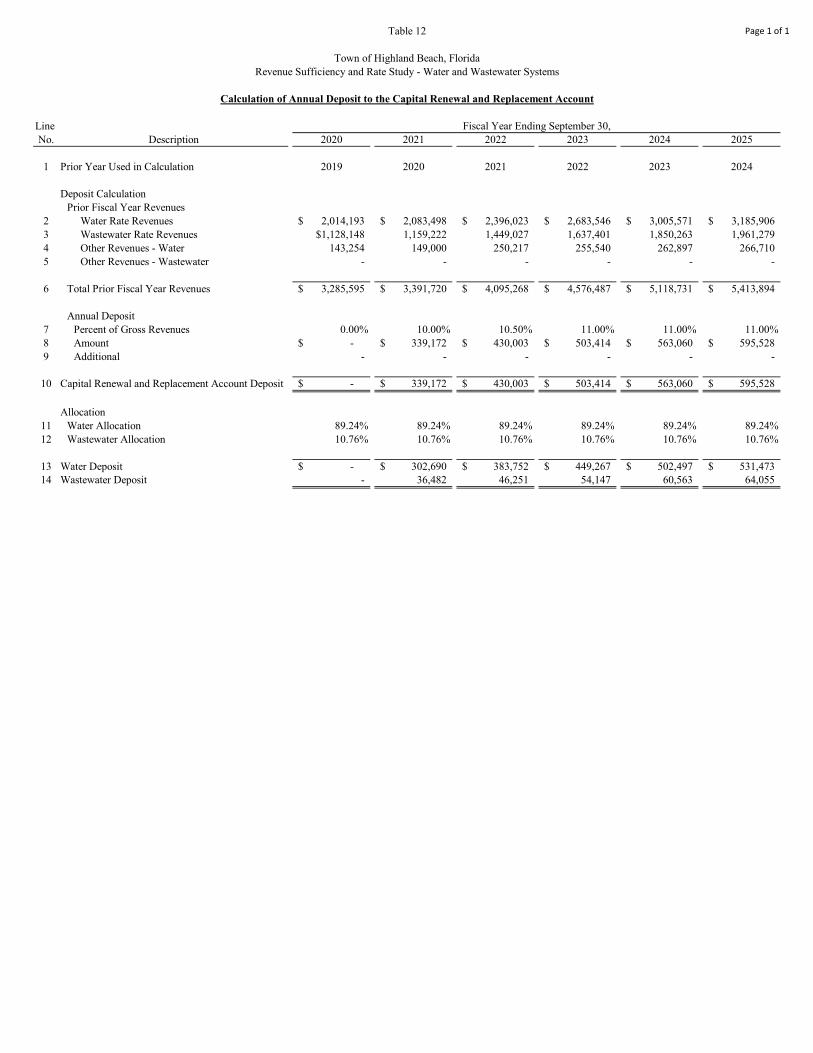
Page 1 of 1Table 12
Town of Highland Beach, FloridaRevenue Sufficiency and Rate Study - Water and Wastewater Systems
Calculation of Annual Deposit to the Capital Renewal and Replacement Account
Line Fiscal Year Ending September 30,No. Description 2020 2021 2022 2023 2024 2025
1 Prior Year Used in Calculation 2019 2020 2021 2022 2023 2024
Deposit CalculationPrior Fiscal Year Revenues
2 Water Rate Revenues 2,014,193$ 2,083,498$ 2,396,023$ 2,683,546$ 3,005,571$ 3,185,906$ 3 Wastewater Rate Revenues $1,128,148 1,159,222 1,449,027 1,637,401 1,850,263 1,961,279 4 Other Revenues - Water 143,254 149,000 250,217 255,540 262,897 266,710 5 Other Revenues - Wastewater - - - - - -
6 Total Prior Fiscal Year Revenues 3,285,595$ 3,391,720$ 4,095,268$ 4,576,487$ 5,118,731$ 5,413,894$
Annual Deposit7 Percent of Gross Revenues 0.00% 10.00% 10.50% 11.00% 11.00% 11.00%8 Amount -$ 339,172$ 430,003$ 503,414$ 563,060$ 595,528$ 9 Additional - - - - - -
10 Capital Renewal and Replacement Account Deposit -$ 339,172$ 430,003$ 503,414$ 563,060$ 595,528$
Allocation11 Water Allocation 89.24% 89.24% 89.24% 89.24% 89.24% 89.24%12 Wastewater Allocation 10.76% 10.76% 10.76% 10.76% 10.76% 10.76%
13 Water Deposit -$ 302,690$ 383,752$ 449,267$ 502,497$ 531,473$ 14 Wastewater Deposit - 36,482 46,251 54,147 60,563 64,055

Page 1 of 1Table 13
Town of Highland Beach, FloridaRevenue Sufficiency and Rate Study - Water and Wastewater Systems
Capital Improvement Plan (CIP)
Line Fiscal Year Ending September 30,No. Description 2020 Adjustments 2020 2021 2022 2023 2024 2025 Total
WATER SYSTEMWater CIP Projects
1 Replace 2 of 4 WTP Air Handlers 100,000$ - 100,000$ -$ -$ -$ -$ -$ 100,000$ 2 Replace 1 of 2 WTP Chillers 80,000 - 80,000 - - - - - 80,000 3 Paint Elevated Tank Outer Bowl & Logo 80,000 - 80,000 - - - - - 80,000 4 Paint the WTP Membrane Floors & GST 28,000 - 28,000 - - - - - 28,000 5 Replace 2013 Ford F150 Pickup Truck 30,000 - 30,000 - - - - - 30,000 6 Replace Inhibitor & CL2 Pumps & Piping 60,000 - 60,000 - - - - - 60,000 7 Replace East Chiller at Water Pl ant - - - 80,000 - - - - 80,000 8 Replace 3,400 Sodium Hypochlorite Day - - - 100,000 - - - - 100,000 9 Replace Building and Public Works Carpeting - - - 50,000 - - - - 50,000
10 Rehabilitation of Both Shallow Injection - - - 100,000 - - - - 100,000 11 Rehabilitation of Well Number 6 - - - - 80,000 - - - 80,000 12 VFD Replacements - - - - 250,000 - - - 250,000 13 Replace 2014 Ford Escape SUV - - - - - 30,000 - - 30,000 14 Well Number 8 Rehabilitation - - - - - 80,000 - - 80,000 15 Upgrade WTP SCADA System Software - - - - - 25,000 - - 25,000 16 Replace Membrane Train Turbos - - - - - 120,000 - - 120,000 17 Replace Water Plant Roof - - - - - 250,000 - - 250,000 18 Paint the Elevated Storage Tank interior - - - - - - 300,000 - 300,000 19 Replace Cartridge Filter Vessels - - - - - - 100,000 - 100,000 20 Replace Water Plant Blowers - - - - - - 50,000 - 50,000 21 WTP De-Gasifier and Scrubber System - - - - - - - 30,000 30,000 22 Replace the West Chiller at the WTP - - - - - - - 90,000 90,000 23 Departmental Capital - Operating Budget Reclassification - - - - - - - - -
24 Total Water CIP Projects 378,000$ -$ 378,000$ 330,000$ 330,000$ 505,000$ 450,000$ 120,000$ 2,113,000$
WASTEWATER SYSTEMWastewater CIP Items
25 Lift Station #4 Rehabilitation 100,000$ -$ 100,000$ -$ -$ -$ -$ -$ 100,000$ 26 Lift Station # 1 Electrical Panel Replacement 25,000 - 25,000 - - - - - 25,000 27 Lift Station #1 Rehabilitation - - - 150,000 - - - - 150,000 28 Wastewater Collection System Piping Rehabilitation (Phase 1) - - - 500,000 - - - - 500,000 29 Storm Water TIde Flex Check Valves - - - 25,000 - - - - 25,000 30 Lift Station #2 Rehabilitation - - - - 100,000 - - - 100,000 31 Wastewater Collection System Piping Rehabilitation (Phase 2) - - - - 250,000 - - - 250,000 32 Raise Lift Station #3 - - - - 150,000 - - - 150,000 33 Raise Lift Station #2 - - - - - 150,000 - - 150,000 34 Replace Emergency Generator at Lift Station #1 (Master) - - - - - - 150,000 - 150,000 35 Raise Lift Station #4 - - - - - - - 150,000 150,000 36 Wastewater Collection System Rehabilitation - - - - 2,500,000 - - - 2,500,000 37 Departmental Capital - Operating Budget Reclassification - - - - - - - - -
38 Total Wastewater CIP Items 125,000$ -$ 125,000$ 675,000$ 3,000,000$ 150,000$ 150,000$ 150,000$ 4,250,000$
39 TOTAL CAPITAL IMPROVEMENT PLAN 503,000$ -$ 503,000$ 1,005,000$ 3,330,000$ 655,000$ 600,000$ 270,000$ 6,363,000$

Page 1 of 2Table 14
Town of Highland Beach, FloridaRevenue Sufficiency and Rate Study - Water and Wastewater Systems
Capital Improvement Plan Adjusted for Inflation and Funding Plan (CIP)
Line Escalation Funding Fiscal Year Ending September 30,No. Description Factor Purpose Source 2020 2021 2022 2023 2024 2025 Total
CIP Inflation Indices - Annual1 Low Inflation 0.00% 1.00% 1.00% 1.00% 1.00% 1.00%2 Average Inflation 0.00% 2.50% 2.50% 2.50% 2.50% 2.50%3 High Inflation 0.00% 5.00% 5.00% 5.00% 5.00% 5.00%4 ENR Index 0.00% 2.85% 2.85% 2.85% 2.85% 2.85%5 No Inflation 0.00% 0.00% 0.00% 0.00% 0.00% 0.00%
CIP Inflation Indices - Cumulative Factor6 Low Inflation Low 1.0000 1.0100 1.0201 1.0303 1.0406 1.0510 7 Average Inflation Avg 1.0000 1.0250 1.0506 1.0769 1.1038 1.1314 8 High Inflation High 1.0000 1.0500 1.1025 1.1576 1.2155 1.2763 9 ENR Index ENR 1.0000 1.0285 1.0578 1.0880 1.1190 1.1509 10 No Inflation None 1.0000 1.0000 1.0000 1.0000 1.0000 1.0000
WATER SYSTEM11 Replace 2 of 4 WTP Air Handlers None Non-Expansion R&R 100,000$ -$ -$ -$ -$ -$ -$ 12 Replace 1 of 2 WTP Chillers None Non-Expansion Op. Reserves 80,000 - - - - - - 13 Paint Elevated Tank Outer Bowl & Logo None Non-Expansion WOpX 80,000 - - - - - - 14 Paint the WTP Membrane Floors & GST None Non-Expansion WOpX 28,000 - - - - - - 15 Replace 2013 Ford F150 Pickup Truck None Non-Expansion Op. Reserves 30,000 - - - - - - 16 Replace Inhibitor & CL2 Pumps & Piping None Non-Expansion Op. Reserves 60,000 - - - - - - 17 Replace East Chiller at Water Pl ant ENR Non-Expansion R&R - 82,280 - - - - 82,280 18 Replace 3,400 Sodium Hypochlorite Day ENR Non-Expansion R&R - 102,850 - - - - 102,850 19 Replace Building and Public Works Carpeting ENR Non-Expansion WOpX - 51,425 - - - - 51,425 20 Rehabilitation of Both Shallow Injection ENR Non-Expansion R&R - 102,850 - - - - 102,850 21 Rehabilitation of Well Number 6 ENR Non-Expansion Debt1 - - 84,625 - - - 84,625 22 VFD Replacements ENR Non-Expansion Debt1 - - 264,453 - - - 264,453 23 Replace 2014 Ford Escape SUV ENR Non-Expansion W-Rates - - - 32,639 - - 32,639 24 Well Number 8 Rehabilitation ENR Non-Expansion Debt1 - - - 87,037 - - 87,037 25 Upgrade WTP SCADA System Software ENR Non-Expansion R&R - - - 27,199 - - 27,199 26 Replace Membrane Train Turbos ENR Non-Expansion Debt1 - - - 130,555 - - 130,555 27 Replace Water Plant Roof ENR Non-Expansion Debt1 - - - 271,990 - - 271,990 28 Paint the Elevated Storage Tank interior ENR Non-Expansion WOpX - - - - 335,690 - 335,690 29 Replace Cartridge Filter Vessels ENR Non-Expansion R&R - - - - 111,897 - 111,897 30 Replace Water Plant Blowers ENR Non-Expansion R&R - - - - 55,948 - 55,948 31 WTP De-Gasifier and Scrubber System ENR Non-Expansion R&R - - - - - 34,526 34,526 32 Replace the West Chiller at the WTP ENR Non-Expansion R&R - - - - - 103,577 103,577 33 Departmental Capital - Operating Budget Reclassification ENR Non-Expansion Op. Reserves - - - - - - - 34 Departmental Capital - Operating Budget Reclassification ENR Non-Expansion R&R - - - - - - -
35 TOTAL WATER SYSTEM 378,000$ 339,405$ 349,078$ 549,420$ 503,535$ 138,103$ 1,879,541$
WASTEWATER SYSTEM36 Lift Station #4 Rehabilitation None Non-Expansion Op. Reserves 100,000$ -$ -$ -$ -$ -$ -$ 37 Lift Station # 1 Electrical Panel Replacement None Non-Expansion Op. Reserves 25,000 - - - - - - 38 Lift Station #1 Rehabilitation ENR Non-Expansion Op. Reserves - 154,275 - - - - 154,275 39 Wastewater Collection System Piping Rehabilitation (Phase 1) ENR Non-Expansion Op. Reserves - 514,250 - - - - 514,250 40 Storm Water TIde Flex Check Valves ENR Non-Expansion R&R - 25,713 - - - - 25,713 41 Lift Station #2 Rehabilitation ENR Non-Expansion Debt1 - - 105,781 - - - 105,781 42 Wastewater Collection System Piping Rehabilitation (Phase 2) ENR Non-Expansion Debt1 - - 264,453 - - - 264,453 43 Raise Lift Station #3 ENR Non-Expansion Debt1 - - 158,672 - - - 158,672 44 Raise Lift Station #2 ENR Non-Expansion Debt1 - - - 163,194 - - 163,194 45 Replace Emergency Generator at Lift Station #1 (Master) ENR Non-Expansion R&R - - - - 167,845 - 167,845 46 Raise Lift Station #4 ENR Non-Expansion R&R - - - - - 172,629 172,629 47 Wastewater Collection System Rehabilitation ENR Non-Expansion Debt1 - - 2,644,531 - - - 2,644,531 48 Departmental Capital - Operating Budget Reclassification ENR Non-Expansion Op. Reserves - - - - - - - 49 Departmental Capital - Operating Budget Reclassification ENR Non-Expansion R&R - - - - - - -
50 TOTAL WASTEWATER SYSTEM 125,000$ 694,238$ 3,173,437$ 163,194$ 167,845$ 172,629$ 4,371,342$
51 TOTAL CAPITAL IMPROVEMENT PLAN 503,000$ 1,033,643$ 3,522,515$ 712,614$ 671,380$ 310,731$ 6,250,883$

Page 2 of 2Table 14
Town of Highland Beach, FloridaRevenue Sufficiency and Rate Study - Water and Wastewater Systems
Capital Improvement Plan Adjusted for Inflation and Funding Plan (CIP)
Line Escalation Funding Fiscal Year Ending September 30,No. Description Factor Purpose Source 2020 2021 2022 2023 2024 2025 Total
CAPITAL IMPROVEMENT FUND - FUNDING SOURCES52 Capital Funded From Water Rate Revenues W-Rates -$ -$ -$ 32,639$ -$ -$ 32,639$ 53 Capital Funded From Wastewater Rate Revenues WW-Rates - - - - - - - 54 Operating Reserves Fund Op. Reserves 295,000$ 668,525$ -$ -$ -$ -$ 668,525$ 55 Capital Renewal and Replacement Account R&R 100,000 313,693 - 27,199 335,690 310,731 987,313 57 Water Impact Fees W-Impact Fee - - - - - - - 58 Wastewater Impact Fees WW-Impact Fee - - - - - - - 61 Proposed Debt 1 Debt1 - - 3,522,515 652,776 - - 4,175,291 62 Proposed Debt 2 Debt2 - - - - - - - 63 Proposed Debt 3 Debt3 - - - - - - - 64 Proposed Debt 4 Debt4 - - - - - - - 65 Proposed Debt 5 Debt5 - - - - - - - 66 Reclass to Operating Expenses - Water WOpX 108,000 51,425 - - 335,690 - 387,115 67 Reclass to Operating Expenses - Wastewater WWOpX - - - - - - -
68 TOTAL CAPITAL IMPROVEMENT FUND - FUNDING SOURCES 503,000$ 1,033,643$ 3,522,515$ 712,614$ 671,380$ 310,731$ 6,250,883$

Page 1 of 1Table 15
Town of Highland Beach, FloridaRevenue Sufficiency and Rate Study - Water and Wastewater Systems
Revenue Requirements - Water System
Line Fiscal Year Ending September 30,No. Description 2020 2021 2022 2023 2024 2025
Operating and Maintenance Expenses1 Total Operating Expenses 2,022,423$ 2,088,669$ 2,127,421$ 2,190,272$ 2,589,679$ 2,318,630$
2 Total Operating and Maintenance Expenses 2,022,423$ 2,088,669$ 2,127,421$ 2,190,272$ 2,589,679$ 2,318,630$
Debt Service3 Existing Debt 1,549,224$ 1,549,224$ 1,549,224$ 1,549,224$ 1,180,012$ 810,800$ 4 Proposed Debt - - 12,775 25,550 25,550 25,550 5 Less Connection Charges to Pay Debt Service - (226,353) (234,202) (242,323) (250,726) (259,420)
6 Total Debt Service 1,549,224$ 1,322,871$ 1,327,797$ 1,332,451$ 954,836$ 576,930$
Other Revenue Requirements7 Capital Funded From Rate Revenues -$ -$ -$ 32,639$ -$ -$ 8 Transfers to Operating Reserves - - - - - - 9 Transfers to Capital Renewal and Replacement Account - 302,690 383,752 449,267 502,497 531,473
10 Total Other Revenue Requirements -$ 302,690$ 383,752$ 481,906$ 502,497$ 531,473$
11 Gross Revenue Requirements 3,571,647$ 3,714,230$ 3,838,970$ 4,004,629$ 4,047,012$ 3,427,033$
Less Income and Funds From Other Sources12 Other Revenues 179,720$ 187,070$ 191,083$ 195,042$ 198,938$ 202,761$ 13 Unrestricted Interest Income 42,528 40,425 41,264 43,439 43,386 43,820 14 Transfer - General Fund for Debt Service 1,430,000 1,058,297 796,691 533,004 184,823 - 15 Transfers From Operating Reserves 119,224 - - - - - 16 Transfers from Capital Renewal and Replacement Account - - - - 335,690 -
17 Net Revenue Requirements 1,800,176$ 2,428,438$ 2,809,932$ 3,233,144$ 3,284,176$ 3,180,452$
Existing Revenues 18 Water System 2,083,498$ 2,083,498$ 2,083,498$ 2,083,498$ 2,083,498$ 2,083,498$ 19 Total Existing Revenues 2,083,498$ 2,083,498$ 2,083,498$ 2,083,498$ 2,083,498$ 2,083,498$
Revenues From Prior Period Adjustments20 Water System N/A -$ 312,525$ 600,048$ 922,073$ 1,102,407$
21 Total Current Revenues 2,083,498$ 2,083,498$ 2,396,023$ 2,683,546$ 3,005,571$ 3,185,906$
22 Existing Surplus / (Deficiency) 283,323$ (344,940)$ (413,909)$ (549,598)$ (278,604)$ 5,453$ 23 Percent of Rate Revenues 13.60% (16.56%) (17.27%) (20.48%) (9.27%) 0.17%
Rate Adjustments24 Water System 0.00% 15.00% 12.00% 12.00% 6.00% 2.50%
Additional Revenue From Current Year Adjustment25 Water System -$ 312,525$ 287,523$ 322,026$ 180,334$ 79,648$
26 Total Additional Revenue From Current Year Adjustment -$ 312,525$ 287,523$ 322,026$ 180,334$ 79,648$ 27 Total Revenue With Rate Adjustments 2,083,498$ 2,396,023$ 2,683,546$ 3,005,571$ 3,185,906$ 3,265,553$
28 Net Surplus / (Deficiency) After Rate Adj. 283,323$ (32,415)$ (126,386)$ (227,573)$ (98,270)$ 85,101$ 29 As Percent of Total Rate Revenues 13.60% (1.35%) (4.71%) (7.57%) (3.08%) 2.61%

Page 1 of 1Table 16
Town of Highland Beach, FloridaRevenue Sufficiency and Rate Study - Water and Wastewater Systems
Revenue Requirements - Wastewater System
Line Fiscal Year Ending September 30,No. Description 2020 2021 2022 2023 2024 2025
Operating and Maintenance Expenses1 Total Operating Expenses 1,640,793$ 1,764,672$ 1,658,146$ 1,709,013$ 1,761,077$ 1,814,406$
2 Total Operating and Maintenance Expenses 1,640,793$ 1,764,672$ 1,658,146$ 1,709,013$ 1,761,077$ 1,814,406$
Debt Service3 Existing Debt -$ -$ -$ -$ -$ -$ 4 Proposed Debt - - 50,825 101,650 101,650 101,650 5 Less Connection Charges to Pay Debt Service - - - - - -
6 Total Debt Service -$ -$ 50,825$ 101,650$ 101,650$ 101,650$
Other Revenue Requirements7 Capital Funded From Rate Revenues -$ -$ -$ -$ -$ -$ 8 Transfers to Operating Reserves - - - - - - 9 Transfers to Capital Renewal and Replacement Account - 36,482 46,251 54,147 60,563 64,055
10 Total Other Revenue Requirements -$ 36,482$ 46,251$ 54,147$ 60,563$ 64,055$
11 Gross Revenue Requirements 1,640,793$ 1,801,154$ 1,755,222$ 1,864,810$ 1,923,290$ 1,980,112$
Less Income and Funds From Other Sources12 Other Revenues -$ -$ -$ -$ -$ -$ 13 Unrestricted Interest Income 23,904 22,722 23,193 24,416 24,386 24,630 14 Transfer - General Fund for Debt Service - - 30,482 40,637 20,321 - 15 Transfers from Operating Reserves 105,000 105,000 - - - - 16 Transfers from Capital Renewal and Replacement Account - - - - - -
17 Net Revenue Requirements 1,511,890$ 1,673,432$ 1,701,546$ 1,799,758$ 1,878,583$ 1,955,481$
Existing Revenues 18 Wastewater System 1,159,222$ 1,159,222$ 1,159,222$ 1,159,222$ 1,159,222$ 1,159,222$ 19 Total Existing Revenues 1,159,222$ 1,159,222$ 1,159,222$ 1,159,222$ 1,159,222$ 1,159,222$
Revenues From Prior Period Adjustments20 Wastewater System N/A -$ 289,805$ 478,179$ 691,041$ 802,057$
21 Total Current Revenues 1,159,222$ 1,159,222$ 1,449,027$ 1,637,401$ 1,850,263$ 1,961,279$
22 Existing Surplus / (Deficiency) (352,668)$ (514,211)$ (252,519)$ (162,357)$ (28,320)$ 5,798$ 23 Percent of Rate Revenues (30.42%) (44.36%) (17.43%) (9.92%) (1.53%) 0.30%
Rate Adjustments24 Wastewater System 0.00% 25.00% 13.00% 13.00% 6.00% 2.50%
Additional Revenue From Current Year Adjustment25 Wastewater System -$ 289,805$ 188,374$ 212,862$ 111,016$ 49,032$
26 Total Additional Revenue From Current Year Adjustment -$ 289,805$ 188,374$ 212,862$ 111,016$ 49,032$ 27 Total Revenue With Rate Adjustments 1,159,222$ 1,449,027$ 1,637,401$ 1,850,263$ 1,961,279$ 2,010,311$
28 Net Surplus / (Deficiency) After Rate Adj. (352,668)$ (224,405)$ (64,145)$ 50,505$ 82,696$ 54,830$ 29 As Percent of Total Rate Revenues (30.42%) (15.49%) (3.92%) 2.73% 4.22% 2.73%
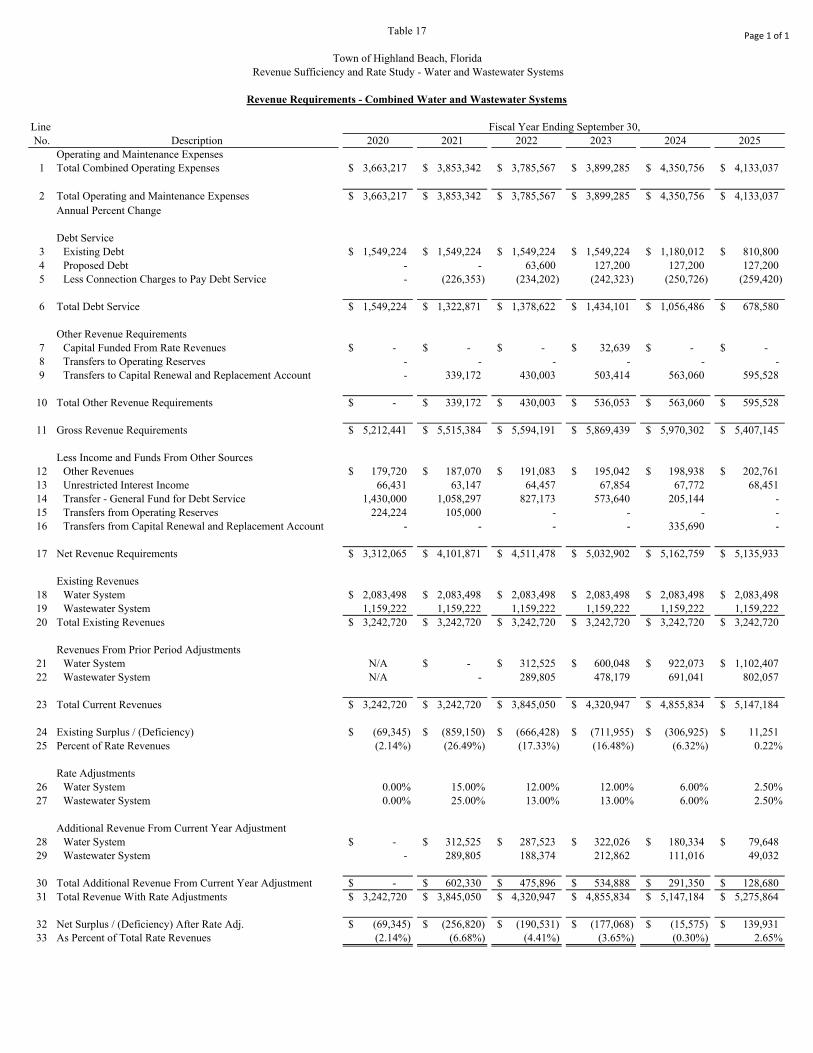
Page 1 of 1Table 17
Town of Highland Beach, FloridaRevenue Sufficiency and Rate Study - Water and Wastewater Systems
Revenue Requirements - Combined Water and Wastewater Systems
Line Fiscal Year Ending September 30,No. Description 2020 2021 2022 2023 2024 2025
Operating and Maintenance Expenses1 Total Combined Operating Expenses 3,663,217$ 3,853,342$ 3,785,567$ 3,899,285$ 4,350,756$ 4,133,037$
2 Total Operating and Maintenance Expenses 3,663,217$ 3,853,342$ 3,785,567$ 3,899,285$ 4,350,756$ 4,133,037$ Annual Percent Change
Debt Service3 Existing Debt 1,549,224$ 1,549,224$ 1,549,224$ 1,549,224$ 1,180,012$ 810,800$ 4 Proposed Debt - - 63,600 127,200 127,200 127,200 5 Less Connection Charges to Pay Debt Service - (226,353) (234,202) (242,323) (250,726) (259,420)
6 Total Debt Service 1,549,224$ 1,322,871$ 1,378,622$ 1,434,101$ 1,056,486$ 678,580$
Other Revenue Requirements7 Capital Funded From Rate Revenues -$ -$ -$ 32,639$ -$ -$ 8 Transfers to Operating Reserves - - - - - - 9 Transfers to Capital Renewal and Replacement Account - 339,172 430,003 503,414 563,060 595,528
10 Total Other Revenue Requirements -$ 339,172$ 430,003$ 536,053$ 563,060$ 595,528$
11 Gross Revenue Requirements 5,212,441$ 5,515,384$ 5,594,191$ 5,869,439$ 5,970,302$ 5,407,145$
Less Income and Funds From Other Sources12 Other Revenues 179,720$ 187,070$ 191,083$ 195,042$ 198,938$ 202,761$ 13 Unrestricted Interest Income 66,431 63,147 64,457 67,854 67,772 68,451 14 Transfer - General Fund for Debt Service 1,430,000 1,058,297 827,173 573,640 205,144 - 15 Transfers from Operating Reserves 224,224 105,000 - - - - 16 Transfers from Capital Renewal and Replacement Account - - - - 335,690 -
17 Net Revenue Requirements 3,312,065$ 4,101,871$ 4,511,478$ 5,032,902$ 5,162,759$ 5,135,933$
Existing Revenues 18 Water System 2,083,498$ 2,083,498$ 2,083,498$ 2,083,498$ 2,083,498$ 2,083,498$ 19 Wastewater System 1,159,222 1,159,222 1,159,222 1,159,222 1,159,222 1,159,222 20 Total Existing Revenues 3,242,720$ 3,242,720$ 3,242,720$ 3,242,720$ 3,242,720$ 3,242,720$
Revenues From Prior Period Adjustments21 Water System N/A -$ 312,525$ 600,048$ 922,073$ 1,102,407$ 22 Wastewater System N/A - 289,805 478,179 691,041 802,057
23 Total Current Revenues 3,242,720$ 3,242,720$ 3,845,050$ 4,320,947$ 4,855,834$ 5,147,184$
24 Existing Surplus / (Deficiency) (69,345)$ (859,150)$ (666,428)$ (711,955)$ (306,925)$ 11,251$ 25 Percent of Rate Revenues (2.14%) (26.49%) (17.33%) (16.48%) (6.32%) 0.22%
Rate Adjustments26 Water System 0.00% 15.00% 12.00% 12.00% 6.00% 2.50%27 Wastewater System 0.00% 25.00% 13.00% 13.00% 6.00% 2.50%
Additional Revenue From Current Year Adjustment28 Water System -$ 312,525$ 287,523$ 322,026$ 180,334$ 79,648$ 29 Wastewater System - 289,805 188,374 212,862 111,016 49,032
30 Total Additional Revenue From Current Year Adjustment -$ 602,330$ 475,896$ 534,888$ 291,350$ 128,680$ 31 Total Revenue With Rate Adjustments 3,242,720$ 3,845,050$ 4,320,947$ 4,855,834$ 5,147,184$ 5,275,864$
32 Net Surplus / (Deficiency) After Rate Adj. (69,345)$ (256,820)$ (190,531)$ (177,068)$ (15,575)$ 139,931$ 33 As Percent of Total Rate Revenues (2.14%) (6.68%) (4.41%) (3.65%) (0.30%) 2.65%

Page 1 of 3Table 18
Town of Highland Beach, FloridaRevenue Sufficiency and Rate Study - Water and Wastewater Systems
Summary of Projected Fund Balances and Calculation of Interest Income
Line Interest Earnings Fiscal Year Ending September 30,No. Description Restricted 2020 2021 2022 2023 2024 2025
Projected Ending Cash Balances1 Operating Reserves Fund 5,847,631$ 4,817,286$ 4,626,755$ 4,449,687$ 4,434,113$ 4,574,043$ 2 Customer Deposits 2,020 2,040 2,060 2,080 2,100 2,130 3 Capital Renewal and Replacement Account 64,280 89,760 519,763 995,978 887,657 1,172,454 4 Debt Service Sinking Fund 387,306 330,718 344,655 358,525 264,122 169,645 5 Debt Service Reserve - - - - - - 6 Water Plant Connection Charge (Impact Fee) Fund 2,311,083 2,108,910 1,898,608 1,677,615 1,445,519 1,201,890 7 Wastewater Plant Connection Charge (Impact Fee) Fund 730,229 738,259 747,119 756,089 765,159 774,339 8 Construction Fund - - 652,776 - - -
9 Total Projected Ending Cash Balances 9,342,549$ 8,086,972$ 8,791,736$ 8,239,974$ 7,798,670$ 7,894,501$
Operating Reserves Fund10 Beginning Year Balance 6,336,847$ 11 Adjustments to Cash - Receivables / Payables 263,633 12 Adjusted Beginning Year Balance 6,600,480$ 5,847,631$ 4,817,286$ 4,626,755$ 4,449,687$ 4,434,113$
Transfers In -13 Year End Surplus -$ -$ -$ -$ -$ 139,931$ 14 From Renewal & Replacement Account - - - - - - 15 From Debt Service Reserve Fund ` - - - - - - 16 From Revenue Requirements - - - - - -
Transfers Out -17 Year End Deficiencies 69,345$ 256,820$ 190,531$ 177,068$ 15,575$ -$ 18 To Customer Deposits - - - - - - 19 To Debt Service Reserve - - - - - - 20 To Renewal & Replacement Account 164,280 - - - - - 21 To Fund Operations 224,224 105,000 - - - - 22 Additional Customer Deposit - - - - - - 23 To Fund Capital Improvements 295,000 668,525 - - - -
Interest Income Calculation24 Average Annual Balance 6,224,056$ 5,332,459$ 4,722,021$ 4,538,221$ 4,441,900$ 4,504,078$ 25 Interest Rate Assumed 1.00% 1.10% 1.20% 1.20% 1.20% 1.20%26 Interest Income Restricted No 62,240$ 58,660$ 56,660$ 54,460$ 53,300$ 54,050$
27 End of Year Balance 5,847,631$ 4,817,286$ 4,626,755$ 4,449,687$ 4,434,113$ 4,574,043$
Minimum Targeted 28 Days of O&M Expense 150 150 150 150 150 150 29 Amount 1,505,432 1,583,565 1,555,712 1,602,446 1,787,982 1,698,508
Minimum target Met? Yes Yes Yes Yes Yes Yes
Customer Deposits30 Beginning Year Balance 2,000$ 2,020$ 2,040$ 2,060$ 2,080$ 2,100$
Transfers In -31 From Operating Fund -$ -$ -$ -$ -$ -$ 32 Additional From Operating Fund - - - - - -
Transfers Out -33 To Renewal & Extension Fund - - - - - -
Interest Income Calculation35 Average Annual Balance 2,000$ 2,020$ 2,040$ 2,060$ 2,080$ 2,100$ 36 Interest Rate Assumed 1.00% 1.10% 1.20% 1.20% 1.20% 1.20%37 Interest Income Restricted Yes 20$ 20$ 20$ 20$ 20$ 30$
38 End of Year Balance 2,020$ 2,040$ 2,060$ 2,080$ 2,100$ 2,130$

Page 2 of 3Table 18
Town of Highland Beach, FloridaRevenue Sufficiency and Rate Study - Water and Wastewater Systems
Summary of Projected Fund Balances and Calculation of Interest Income
Line Interest Earnings Fiscal Year Ending September 30,No. Description Restricted 2020 2021 2022 2023 2024 2025
Capital Renewal and Replacement Account39 Beginning Year Balance -$ 64,280$ 89,760$ 519,763$ 995,978$ 887,657$
Transfers In -40 From Operating Fund 164,280$ -$ -$ -$ -$ -$ 41 From Reserve Fund - - - - - - 42 From System Revenues - 339,172 430,003 503,414 563,060 595,528
Transfers Out -43 To Operating Fund -$ -$ -$ -$ -$ -$ 43 To Fund Major Operating Repairs and Maintenance Expenses - Water - - - - 335,690 - 44 To Fund Major Operating Repairs and Maintenance Expenses - Wastewater - - - - - - 44 To Capital Improvement Plan 100,000 313,693 - 27,199 335,690 310,731
Interest Income Calculation48 Average Annual Balance 32,140$ 77,020$ 304,761$ 757,870$ 941,817$ 1,030,056$ 49 Interest Rate Assumed 1.00% 1.10% 1.20% 1.20% 1.20% 1.20%50 Interest Income Restricted No 321$ 847$ 3,657$ 9,094$ 11,302$ 12,361$
51 End of Year Balance 64,280$ 89,760$ 519,763$ 995,978$ 887,657$ 1,172,454$
Debt Service Sinking FundInterest Income Calculation
52 Average Annual Balance (Quarter of Annual PMT) 387,306$ 330,718$ 344,655$ 358,525$ 264,122$ 169,645$ 53 Interest Rate Assumed 1.00% 1.10% 1.20% 1.20% 1.20% 1.20%54 Interest Income Restricted No 3,870$ 3,640$ 4,140$ 4,300$ 3,170$ 2,040$
Debt Service Reserve55 Beginning Year Balance -$ -$ -$ -$ -$ -$
Transfers In -56 From Operating Fund -$ -$ -$ -$ -$ -$
Transfers Out -59 To Operating Fund -$ -$ -$ -$ -$ -$
Interest Income Calculation64 Average Annual Balance -$ -$ -$ -$ -$ -$ 65 Interest Rate Assumed 1.00% 1.10% 1.20% 1.20% 1.20% 1.20%66 Interest Income Restricted No -$ -$ -$ -$ -$ -$
67 End of Year Balance -$ -$ -$ -$ -$ -$
Water Plant Connection Charge (Impact Fee) Fund68 Beginning Year Balance 2,288,203$ 2,311,083$ 2,108,910$ 1,898,608$ 1,677,615$ 1,445,519$
Transfers In -69 Water Connection Charge Revenue -$ -$ -$ -$ -$ -$
Transfers Out -72 To Capital Improvement Plan -$ -$ -$ -$ -$ -$ 73 To Pay General Fund to Debt Service - 226,353 234,202 242,323 250,726 259,420
Interest Income Calculation76 Average Annual Balance 2,288,203$ 2,197,907$ 1,991,809$ 1,777,446$ 1,552,252$ 1,315,809$ 77 Interest Rate Assumed 1.00% 1.10% 1.20% 1.20% 1.20% 1.20%78 Interest Income Restricted Yes 22,880$ 24,180$ 23,900$ 21,330$ 18,630$ 15,790$
79 End of Year Balance 2,311,083$ 2,108,910$ 1,898,608$ 1,677,615$ 1,445,519$ 1,201,890$

Page 3 of 3Table 18
Town of Highland Beach, FloridaRevenue Sufficiency and Rate Study - Water and Wastewater Systems
Summary of Projected Fund Balances and Calculation of Interest Income
Line Interest Earnings Fiscal Year Ending September 30,No. Description Restricted 2020 2021 2022 2023 2024 2025
Wastewater Plant Connection Charge (Impact Fee) Fund80 Beginning Year Balance 722,999$ 730,229$ 738,259$ 747,119$ 756,089$ 765,159$
Transfers In -81 Wastewater Connection Charge Revenue -$ -$ -$ -$ -$ -$
Transfers Out -84 To Capital Improvement Plan -$ -$ -$ -$ -$ -$ 85 To Pay General Fund to Debt Service - - - - - -
Interest Income Calculation88 Average Annual Balance 722,999$ 730,229$ 738,259$ 747,119$ 756,089$ 765,159$ 89 Interest Rate Assumed 1.00% 1.10% 1.20% 1.20% 1.20% 1.20%90 Interest Income Restricted Yes 7,230$ 8,030$ 8,860$ 8,970$ 9,070$ 9,180$
91 End of Year Balance 730,229$ 738,259$ 747,119$ 756,089$ 765,159$ 774,339$
Construction Fund92 Beginning Year Balance -$ -$ -$ 652,776$ -$ -$
Transfers In -93 Proposed Debt 1 -$ -$ 4,175,291$ -$ -$ -$ 94 Proposed Debt 2 - - - - - - 95 Proposed Debt 3 - - - - - - 96 Proposed Debt 4 - - - - - - 97 Proposed Debt 5 - - - - - -
Transfers Out -98 Proposed Debt 1 CIP Projects -$ -$ 3,522,515$ 652,776$ -$ -$ 99 Proposed Debt 2 CIP Projects - - - - - -
100 Proposed Debt 3 CIP Projects - - - - - - 101 Proposed Debt 4 CIP Projects - - - - - - 102 Proposed Debt 5 CIP Projects - - - - - -
Interest Income Calculation103 Average Annual Balance -$ -$ 326,388$ 326,388$ -$ -$ 104 Interest Rate Assumed 1.00% 1.10% 1.20% 1.20% 1.20% 1.20%105 Interest Income Restricted Yes -$ -$ 3,920$ 3,920$ -$ -$
106 End of Year Balance -$ -$ 652,776$ -$ -$ -$
Interest Income107 Unrestricted No 66,431$ 63,147$ 64,457$ 67,854$ 67,772$ 68,451$ 108 Restricted Yes 30,130 32,230 36,700 34,240 27,720 25,000
109 Total Interest Income 96,561$ 95,377$ 101,157$ 102,094$ 95,492$ 93,451$
System Allocated Unrestricted Interest Income (Based on Revenue)110 Water System 64.02% 42,528$ 40,425$ 41,264$ 43,439$ 43,386$ 43,820$ 111 Wastewater System 35.98% 23,904 22,722 23,193 24,416 24,386 24,630

Table 19
Town of Highland Beach, FloridaRevenue Sufficiency and Rate Study - Water and Wastewater Systems
Summary of Proposed Rates - for the Projection Period
Line Fiscal Year Ending September 30,No. Description 2021 2022 2023 2024 2025
Water Rates
1 Identified Rate Adjustment 12.00% 12.00% 6.00% 2.50%
Bi‐monthly Water RatesAll residential and Commercial Classes
2 Readiness‐to‐Serve Charge ‐ All Units [1] 38.63$ 43.27$ 48.46$ 51.37$ 52.65$
Water Use per UnitBi‐monthly Usage Charges (per Unit)
3 0 ‐ 20,000 gallons 2.60$ 2.91$ 3.26$ 3.46$ 3.55$ 4 21,000 ‐ 40,000 Gallons 4.53 5.07 5.68 6.02 6.17 5 41,000 ‐ 60,000 Gallons 5.81 6.51 7.29 7.73 7.92 6 61,000 Gallons or more 7.09 7.94 8.89 9.42 9.66
Irrigation Classe7 Readiness‐to‐Serve Charge ‐ All Accounts [2] 38.63$ 43.27$ 48.46$ 51.37$ 52.65$
Water Use per UnitBi‐monthly Usage Charges (per Unit)
8 0 ‐ 40,000 Gallons 4.53$ 5.07$ 5.68$ 6.02$ 6.17$ 9 41,000 ‐ 60,000 Gallons 5.81 6.51 7.29 7.73 7.92 10 61,000 Gallons or more 7.09 7.94 8.89 9.42 9.66
Wastewater Rates
11 Identified Rate Adjustment 13.00% 13.00% 6.00% 2.50%
Bi‐monthly Wastewater RatesAll residential and Commercial Classes
12 Readiness‐to‐Serve Charge ‐ All Units 28.50$ 32.21$ 36.40$ 38.58$ 39.54$
Wastewater Use Per Unit (Based on Metered Water Use)Bi‐monthly Usage Charges (per Unit)
13 All Residential Classes(up to 20,000 gallons per unit) [3] 2.56$ 2.89$ 3.27$ 3.47$ 3.56$ 14 Commercial Class (All Metered Water Use) 2.56 2.89 3.27 3.47 3.56
______________[1] Rate applicable to all dwelling units assigned to an account as determined by the City with single family residential being considered as one (1) unit (Equivalent Dwelling Unit).
[2] All individually‐metered irrigation water meters are classifed as one (1) unit (equivalent dwelling unit)
[3] Rates based on metered water usage at customer premise. Bi‐monthly wastewater usage charges shall be based on the water meter readings for all meters serving the applicant's property with a maximum billed bi‐monthly flow equal to 20,000 gallons multiplied by the number of units.

Page 1 of 1
Residential Service for a 5/8" or 3/4" MeterLine 0 2,000 4,000 6,000 8,000 10,000 15,000 30,000No. Description Gallons Gallons Gallons Gallons Gallons Gallons Gallons Gallons
Town of Highland Beach1 Existing Rates - FY2020 $16.80 $21.62 $26.44 $31.26 $36.08 $41.78 $62.68 $130.722 Proposed - FY2021 19.31 24.51 29.71 34.91 40.11 45.31 67.96 148.71
Other Florida Utilities:3 City of Boca Raton [2] 14.69 16.41 18.13 19.85 21.57 23.29 30.61 64.614 Broward County 17.13 20.37 24.90 30.72 44.36 58.00 96.39 220.145 City of Boynton Beach 12.90 16.34 19.78 23.23 26.67 31.48 46.93 93.286 City of Cooper City [2] 12.79 19.13 25.47 32.31 39.65 46.99 70.24 154.497 City of Coral Springs 13.95 17.43 20.91 26.29 31.67 39.73 65.91 186.818 City of Dania Beach 14.55 22.73 30.91 41.54 54.62 67.70 102.03 224.589 City of Delray Beach 15.72 15.72 16.97 19.47 21.97 24.47 32.97 70.4710 Village of Golf [2] 32.20 32.20 32.20 32.20 32.20 32.20 38.93 71.9111 Town of Hillsboro Beach 24.00 24.00 30.94 37.88 44.82 52.56 73.91 147.0612 Town of Jupiter 22.21 24.83 27.45 30.07 33.63 37.19 47.45 94.5513 City of Lake Worth 21.14 27.96 34.78 45.28 55.78 70.00 121.54 339.8414 Town of Lantana 21.14 23.78 26.42 29.74 33.74 37.74 51.94 100.3415 Town of Manalapan [2] 21.43 26.11 30.79 35.47 40.15 44.83 56.53 91.6316 Martin County [2] 17.61 22.13 26.65 31.17 35.69 40.21 56.21 122.0617 Palm Beach County 16.05 19.03 22.01 28.61 35.21 41.81 83.36 218.1618 Village of Palm Springs [2] 12.27 18.37 24.47 30.57 38.53 46.49 66.39 135.2919 City of West Palm Beach [2] 23.08 30.22 37.36 44.51 53.47 62.43 87.21 168.9720 Seacoast Utility Authority 21.75 23.95 26.15 28.35 37.03 45.71 67.41 132.5121 City of Tamarac 11.77 15.31 19.44 24.16 31.28 38.40 64.21 157.6622 Village of Tequesta [2] 19.67 25.91 32.15 38.39 44.63 50.87 72.86 161.0123 Village of Wellington [2] 20.01 24.53 29.05 33.57 40.31 47.05 63.90 146.20
24 Other Florida Utilities' Average $18.38 $22.21 $26.52 $31.59 $37.95 $44.72 $66.52 $147.69
Footnotes:[1]
[2] Utility is currently involved in a rate study, is planning to conduct a rate study, or will implement a rate revision within the next twelve months.
Unless otherwise noted, amounts shown reflect residential rates in effect July, 2020 and are exclusive of taxes or franchise fees, if any, and reflect rates charged for inside the city service. All rates are as reported by the respective utility. This comparison is intended to show comparable charges for similar service for comparison purposes only and is not intended to be a complete listing of all rates and charges offered by each listed utility.
Table 20
Revenue Sufficiency and Rate Study - Water and Wastewater SystemsTown of Highland Beach, Florida
Comparison of Typical Monthly Residential Bills for Water Service [1]
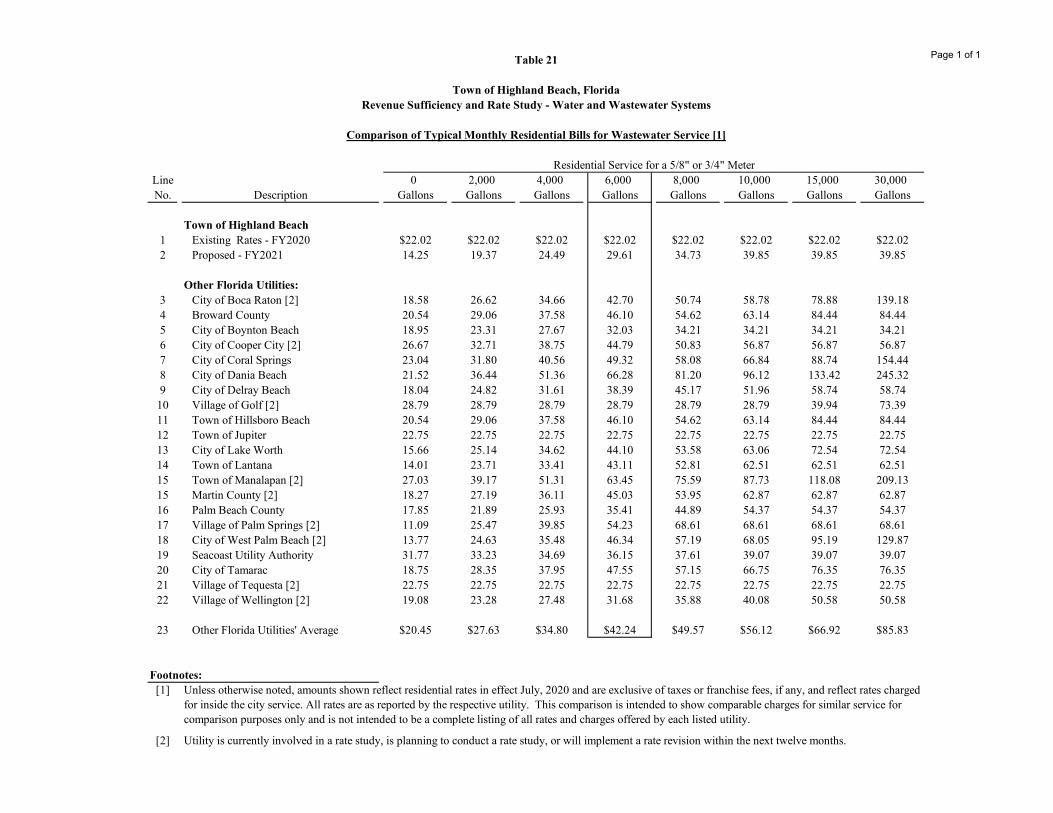
Page 1 of 1
Residential Service for a 5/8" or 3/4" MeterLine 0 2,000 4,000 6,000 8,000 10,000 15,000 30,000No. Description Gallons Gallons Gallons Gallons Gallons Gallons Gallons Gallons
Town of Highland Beach1 Existing Rates - FY2020 $22.02 $22.02 $22.02 $22.02 $22.02 $22.02 $22.02 $22.022 Proposed - FY2021 14.25 19.37 24.49 29.61 34.73 39.85 39.85 39.85
Other Florida Utilities:3 City of Boca Raton [2] 18.58 26.62 34.66 42.70 50.74 58.78 78.88 139.184 Broward County 20.54 29.06 37.58 46.10 54.62 63.14 84.44 84.445 City of Boynton Beach 18.95 23.31 27.67 32.03 34.21 34.21 34.21 34.216 City of Cooper City [2] 26.67 32.71 38.75 44.79 50.83 56.87 56.87 56.877 City of Coral Springs 23.04 31.80 40.56 49.32 58.08 66.84 88.74 154.448 City of Dania Beach 21.52 36.44 51.36 66.28 81.20 96.12 133.42 245.329 City of Delray Beach 18.04 24.82 31.61 38.39 45.17 51.96 58.74 58.74
10 Village of Golf [2] 28.79 28.79 28.79 28.79 28.79 28.79 39.94 73.3911 Town of Hillsboro Beach 20.54 29.06 37.58 46.10 54.62 63.14 84.44 84.4412 Town of Jupiter 22.75 22.75 22.75 22.75 22.75 22.75 22.75 22.7513 City of Lake Worth 15.66 25.14 34.62 44.10 53.58 63.06 72.54 72.5414 Town of Lantana 14.01 23.71 33.41 43.11 52.81 62.51 62.51 62.5115 Town of Manalapan [2] 27.03 39.17 51.31 63.45 75.59 87.73 118.08 209.1315 Martin County [2] 18.27 27.19 36.11 45.03 53.95 62.87 62.87 62.8716 Palm Beach County 17.85 21.89 25.93 35.41 44.89 54.37 54.37 54.3717 Village of Palm Springs [2] 11.09 25.47 39.85 54.23 68.61 68.61 68.61 68.6118 City of West Palm Beach [2] 13.77 24.63 35.48 46.34 57.19 68.05 95.19 129.8719 Seacoast Utility Authority 31.77 33.23 34.69 36.15 37.61 39.07 39.07 39.0720 City of Tamarac 18.75 28.35 37.95 47.55 57.15 66.75 76.35 76.3521 Village of Tequesta [2] 22.75 22.75 22.75 22.75 22.75 22.75 22.75 22.7522 Village of Wellington [2] 19.08 23.28 27.48 31.68 35.88 40.08 50.58 50.58
23 Other Florida Utilities' Average $20.45 $27.63 $34.80 $42.24 $49.57 $56.12 $66.92 $85.83
Footnotes:[1]
[2] Utility is currently involved in a rate study, is planning to conduct a rate study, or will implement a rate revision within the next twelve months.
Table 21
Town of Highland Beach, Florida
Unless otherwise noted, amounts shown reflect residential rates in effect July, 2020 and are exclusive of taxes or franchise fees, if any, and reflect rates charged for inside the city service. All rates are as reported by the respective utility. This comparison is intended to show comparable charges for similar service for comparison purposes only and is not intended to be a complete listing of all rates and charges offered by each listed utility.
Comparison of Typical Monthly Residential Bills for Wastewater Service [1]
Revenue Sufficiency and Rate Study - Water and Wastewater Systems

Page 1 of 1
Residential Service for a 5/8" or 3/4" MeterLine 0 2,000 4,000 6,000 8,000 10,000 15,000 30,000No. Description Gallons Gallons Gallons Gallons Gallons Gallons Gallons Gallons
Town of Highland Beach1 Existing Rates - FY2020 $38.81 $43.63 $48.45 $53.27 $58.09 $63.80 $84.70 $152.732 Proposed - FY2021 33.56 43.88 54.20 64.52 74.84 85.16 107.81 188.56
Other Florida Utilities:3 City of Boca Raton [2] 33.27 43.03 52.79 62.55 72.31 82.07 109.49 203.794 City of Boynton Beach 31.85 39.65 47.45 55.26 60.88 65.69 81.14 127.495 City of Cooper City [2] 39.46 51.84 64.22 77.10 90.48 103.86 127.11 211.366 City of Coral Springs 36.99 49.23 61.47 75.61 89.75 106.57 154.65 341.257 City of Dania Beach 36.07 59.17 82.27 107.82 135.82 163.82 235.45 469.908 City of Delray Beach 33.76 40.54 48.58 57.86 67.14 76.43 91.71 129.219 Village of Golf [2] 41.06 47.16 53.26 59.36 67.32 75.28 106.33 208.68
10 Town of Hillsboro Beach 43.62 59.28 74.94 90.61 108.09 125.57 171.65 253.4111 Town of Jupiter 44.96 47.58 50.20 52.82 56.38 59.94 70.20 117.3012 City of Lake Worth 36.80 53.10 69.40 89.38 109.36 133.06 194.08 412.3813 Town of Lantana 35.15 47.49 59.83 72.85 86.55 100.25 114.45 162.8514 Town of Manalapan [2] 48.46 65.28 82.10 98.92 115.74 132.56 174.61 300.7615 Martin County [2] 35.88 49.32 62.76 76.20 89.64 103.08 119.08 184.9316 Palm Beach County 33.90 40.92 47.94 64.02 80.10 96.18 137.73 272.5317 Village of Palm Springs [2] 34.17 55.69 77.21 98.74 122.08 131.04 155.82 237.5818 City of West Palm Beach [2] 25.54 39.94 54.92 70.50 88.47 106.45 159.40 287.5319 Seacoast Utility Authority 51.44 59.14 66.84 74.54 82.24 89.94 111.93 200.0820 City of Tamarac 38.76 52.88 67.00 81.12 97.46 113.80 140.25 222.55
21 Other Florida Utilities' Average $37.84 $50.07 $62.40 $75.85 $89.99 $103.64 $136.39 $241.31
Footnotes:[1]
[2] Utility is currently involved in a rate study, is planning to conduct a rate study, or will implement a rate revision within the next twelve months.
Unless otherwise noted, amounts shown reflect residential rates in effect July, 2020 and are exclusive of taxes or franchise fees, if any, and reflect rates charged for inside the city service. All rates are as reported by the respective utility. This comparison is intended to show comparable charges for similar service for comparison purposes only and is not intended to be a complete listing of all rates and charges offered by each listed utility.
Revenue Sufficiency and Rate Study - Water and Wastewater Systems
Table 22
Town of Highland Beach, Florida
Comparison of Typical Monthly Residential Bills for Combined Service [1]