2021 capital markets day
TRANSCRIPT

2021 Capital Markets DayMarch 24, 2021

2
Legal DisclaimersForward-Looking StatementsThis document contains, and our officers and representatives may from time to time make, certain “forward-looking statements” within the meaning of the safe harbor provisions of the US Private Securities Litigation Reform Act of 1995. Forward-looking statements can be identified by words such as “anticipate,” “intend,” “commitment,” “look forward,” “maintain,” “plan,” “goal,” “seek,” “target,” “assume,” “believe,” “project,” “estimate,” “expect,” “strategy,” “future,” “likely,” “may,” “should,” “will” and similar references to future periods. Examples of forward-looking statements include, among others, statements Alcon makes regarding its liquidity, revenue, gross margin, effective tax rate, foreign currency exchange movements, earnings per share, its plans and decisions relating to various capital expenditures, capital allocation priorities and other discretionary items, market growth assumptions, and generally, its expectations concerning its future performance and the effects of the COVID-19 pandemic on its businesses.Forward-looking statements are neither historical facts nor assurances of future performance. Instead, they are based only on Alcon’s current beliefs, expectations and assumptions regarding the future of its business, future plans and strategies, and other future conditions. Because forward-looking statements relate to the future, they are subject to inherent uncertainties and risks that are difficult to predict. Such forward-looking statements are subject to various risks and uncertainties facing Alcon, including: the effect of the COVID-19 pandemic as well as other viral or disease outbreaks; the commercial success of its products and its ability to maintain and strengthen its position in its markets; the success of its research and development efforts, including its ability to innovate to compete effectively; its success in completing and integrating strategic acquisitions; pricing pressure from changes in third party payor coverage and reimbursement methodologies; global and regional economic, financial, legal, tax, political, and social change; data breaches or other disruptions of its information technology systems; ongoing industry consolidation; its ability to properly educate and train healthcare providers on its products; changes in inventory levels or buying patterns of its customers; the impact of a disruption in its global supply chain or important facilities; ability to service its debt obligations; its ability to comply with the US Foreign Corrupt Practices Act of 1977 and other applicable anti-corruption laws, particularly given that it has entered into a three-year Deferred Prosecution Agreement with the US Department of Justice; uncertainty and impact relating to the potential phasing out of LIBOR and transition to alternative reference rates; the need for additional financing through the issuance of debt or equity; its reliance on outsourcing key business functions; its ability to protect its intellectual property; the impact on unauthorized importation of its products from countries with lower prices to countries with higher prices; uncertainties regarding the success of Alcon’s separation and Spin-off from Novartis and the subsequent transformation program, including the expected separation and transformation costs, as well as any potential savings, incurred or realized by Alcon; the effects of litigation, including product liability lawsuits and government investigations; its ability to comply with all laws to which it may be subject; effect of product recalls or voluntary market withdrawals; the implementation of its enterprise resource planning system; its ability to attract and retain qualified personnel; the accuracy of its accounting estimates and assumptions, including pension plan obligations and the carrying value of intangible assets; the ability to obtain regulatory clearance and approval of its products as well as compliance with any post-approval obligations, including quality control of its manufacturing; legislative and regulatory reform; the ability of Alcon Pharmaceuticals Ltd. to comply with its investment tax incentive agreement with the Swiss State Secretariat for Economic Affairs in Switzerland and the Canton of Fribourg, Switzerland; its ability to manage environmental, social and governance matters to the satisfaction of its many stakeholders, some of which may have competing interests; its ability to operate as a stand-alone company; whether the transitional services Novartis has agreed to provide Alcon are sufficient; the impact of the spin-off from Novartis on Alcon’s shareholder base; the impact of being listed on two stock exchanges; the ability to declare and pay dividends; the different rights afforded to its shareholders as a Swiss corporation compared to a US corporation; and the effect of maintaining or losing its foreign private issuer status under US securities laws. Additional factors are discussed in Alcon’s filings with the United States Securities and Exchange Commission, including its Form 20-F. Should one or more of these uncertainties or risks materialize, or should underlying assumptions prove incorrect, actual results may vary materially from those anticipated. Therefore, you should not rely on any of these forward-looking statements. Forward-looking statements in this document speak only as of the date of its filing, and Alcon assumes no obligation to update forward-looking statements as a result of new information, future events or otherwise. The forward-looking statements included in this document cannot be reconciled to the comparable IFRS measures without unreasonable efforts, because we are not able to predict with reasonable certainty the ultimate amount or nature of extraordinary items in the fiscal year. These items are uncertain, depend on many factors and could have a material impact on our IFRS results for the guidance period.
This presentation also includes information about products that have neither been submitted nor received FDA approval. Not all products approved or available in all markets.
Intellectual propertyThis report may contain references to our proprietary intellectual property. All product names appearing in italics or ALL CAPS are trademarks owned by or licensed to Alcon Inc.
Non-IFRS measuresAlcon uses certain non-IFRS metrics when measuring performance, including when measuring current period results against prior periods, including core results, percentage changes measured in constant currencies, and freecash flow. Because of their non-standardized definitions, the non-IFRS measures (unlike IFRS measures) may not be comparable to the calculation of similar measures of other companies. These non-IFRS measures arepresented solely to permit investors to more fully understand how Alcon management assesses underlying performance. These non-IFRS measures are not, and should not be viewed as, a substitute for IFRS measures.

3
Presenters
David EndicottChief Executive Officer
Tim StonesiferChief Financial Officer
Jeannette BankesPresident, Surgical
Andy PawsonPresident, Vision Care
Christina ChengHead of Investor Relations
Karen KingHead of Corp. Affairs and
Investor Relations
Michael OnuscheckPresident, Global
Business & Innovation

4
CET CT TOPIC SPEAKER
14:00 08:00 IntroductionKaren King Christina ChengInvestor Relations
Driving Growth in Eye Care David EndicottChief Executive Officer
Unlocking Shareholder Returns Tim StonesiferChief Financial Officer
Q&A
15:05 09:05 Break
15:10 09:10 Strengthening Leadership in Surgical
Jeannette BankesPresident, Surgical
Accelerating Growth in Vision Care
Andy PawsonPresident, Vision Care
Transforming Eye CareMichael OnuscheckPresident,Global Business & Innovation
Q&A
17:00 11:00 Conclusion David EndicottChief Executive Officer
Agenda

5
DRIVING GROWTH IN EYE CAREDAVID ENDICOTT, CEO
5

6
Top Five Reasons to Invest in Alcon
1. Highly attractive markets
2. Global leader in eye care
3. Delivering on strategic initiatives
4. Innovating products that improve outcomes
5. Creating shareholder value

1.Operating in Attractive Markets

8
#1 in Implantables, Consumables,
Equipment/Other, Ocular Health
#2 in Contact
Lenses
$10B Surgical
$15B Vision Care
End marketsgrowing 4%historically1
2015-2019
81. Market Scope, GfK, Nielsen, IQVIA, Euromonitor, Alcon internal estimates.

9
Favorable megatrends underpinning solid markets
1. World Health Organization. Multisectoral action for a life course approach to healthy ageing: draft global strategy and plan of action on ageing and health. 69th World Health Assembly, Geneva, 2016 April 22 (A69/17).2. Hamel, K and Kharas, H. A global tipping point: Half of the world is now middle class or wealthier. Brookings. 27 September 2018.3. B. Holden, T. Fricke, et al. Global Prevalence of Myopia and High Myopia and Temporal Trends from 2000 through 2050. Ophthalmology, 2016.
Aging population
By 2050, more than 2 billion people will
be over age 601
Increasing wealth
The middle class will grow by ~1.7 billion
people in 10-15 years2
Increasing myopia
An estimated 50% of the world will be myopic by 20503
Increasing sense of wellness
People are more determined to stay
fit and healthy
New technologies
Improving patient outcomes and
increasing access
10
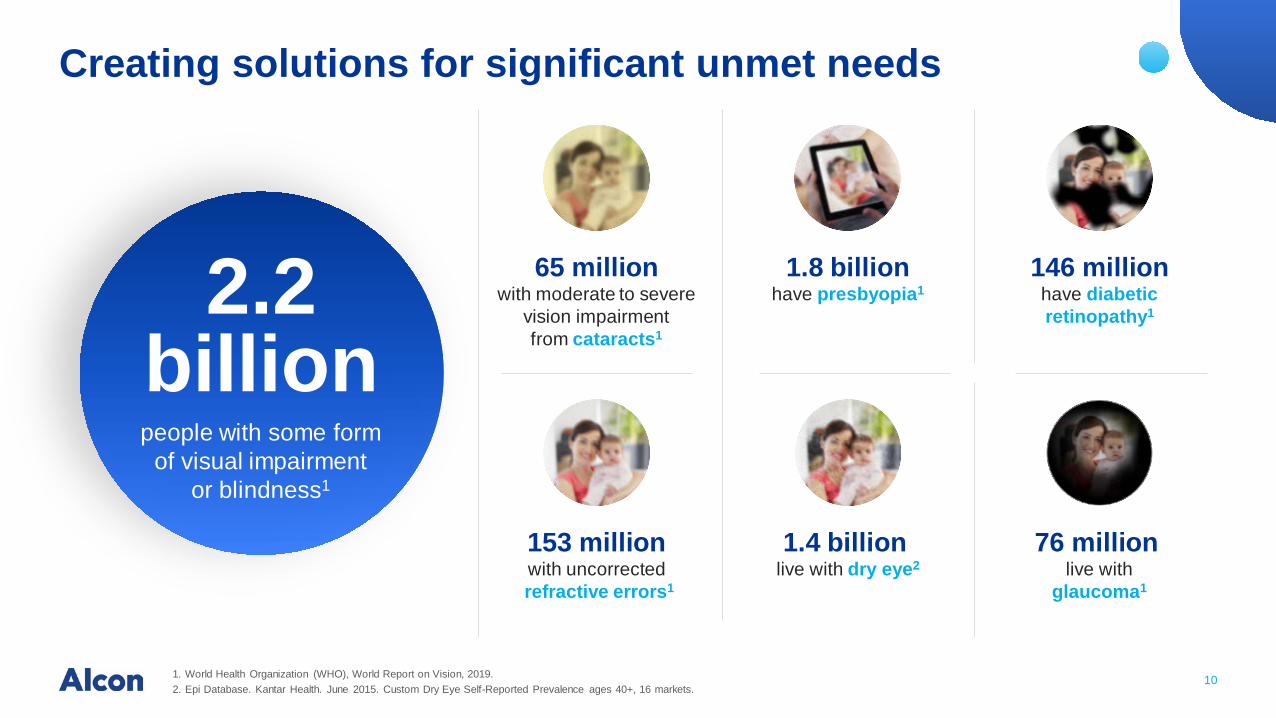
Creating solutions for significant unmet needs
1. World Health Organization (WHO), World Report on Vision, 2019.2. Epi Database. Kantar Health. June 2015. Custom Dry Eye Self-Reported Prevalence ages 40+, 16 markets.
153 million with uncorrectedrefractive errors1
146 millionhave diabetic retinopathy1
76 millionlive with
glaucoma1
2.2billionpeople with some form
of visual impairment or blindness1
65 millionwith moderate to severe
vision impairment from cataracts1
1.8 billionhave presbyopia1
1.4 billionlive with dry eye2

111. ASCRS clinical survey. 2018.2. World Health Organization (WHO), World Report on Vision, 2019.
~37%of US population with presbyopia1
146millionindividuals with
diabeticretinopathy2
Creating solutions for significant unmet needs

2.Global Leader in Eye Care
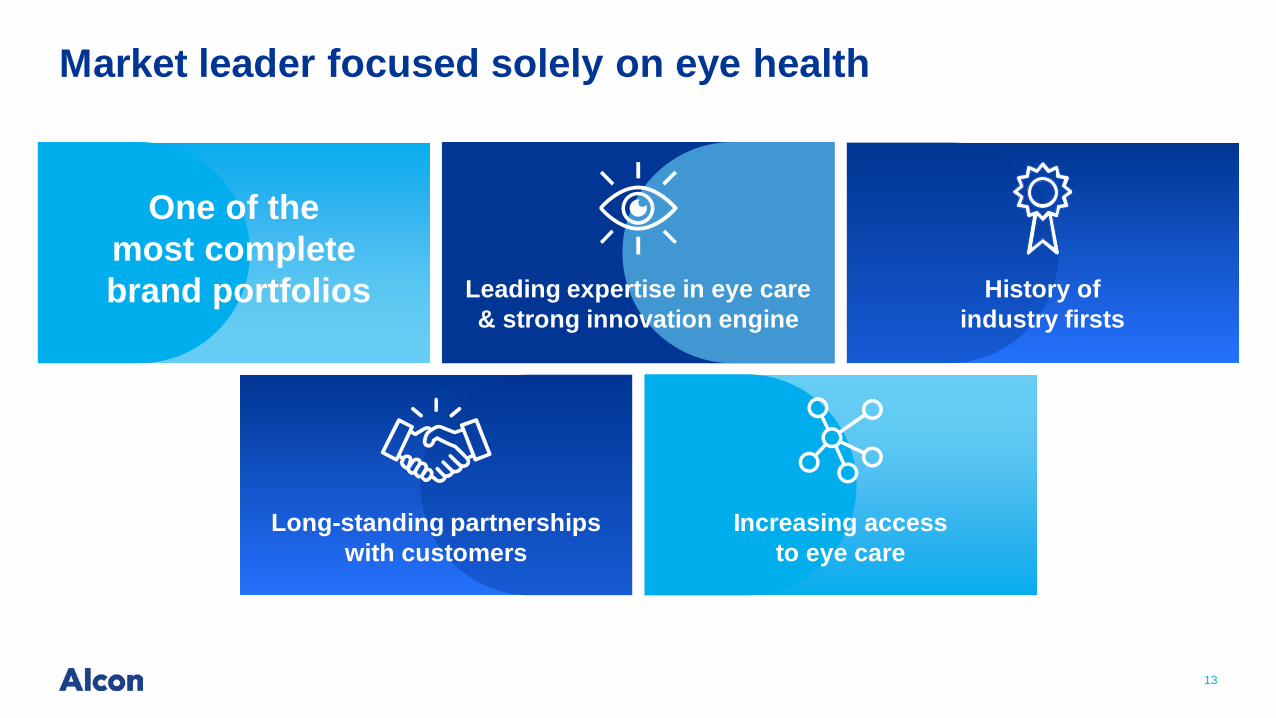
13
Market leader focused solely on eye health
One of the most completebrand portfolios Leading expertise in eye care
& strong innovation engineHistory of
industry firsts
Long-standing partnerships with customers
Increasing access to eye care
14
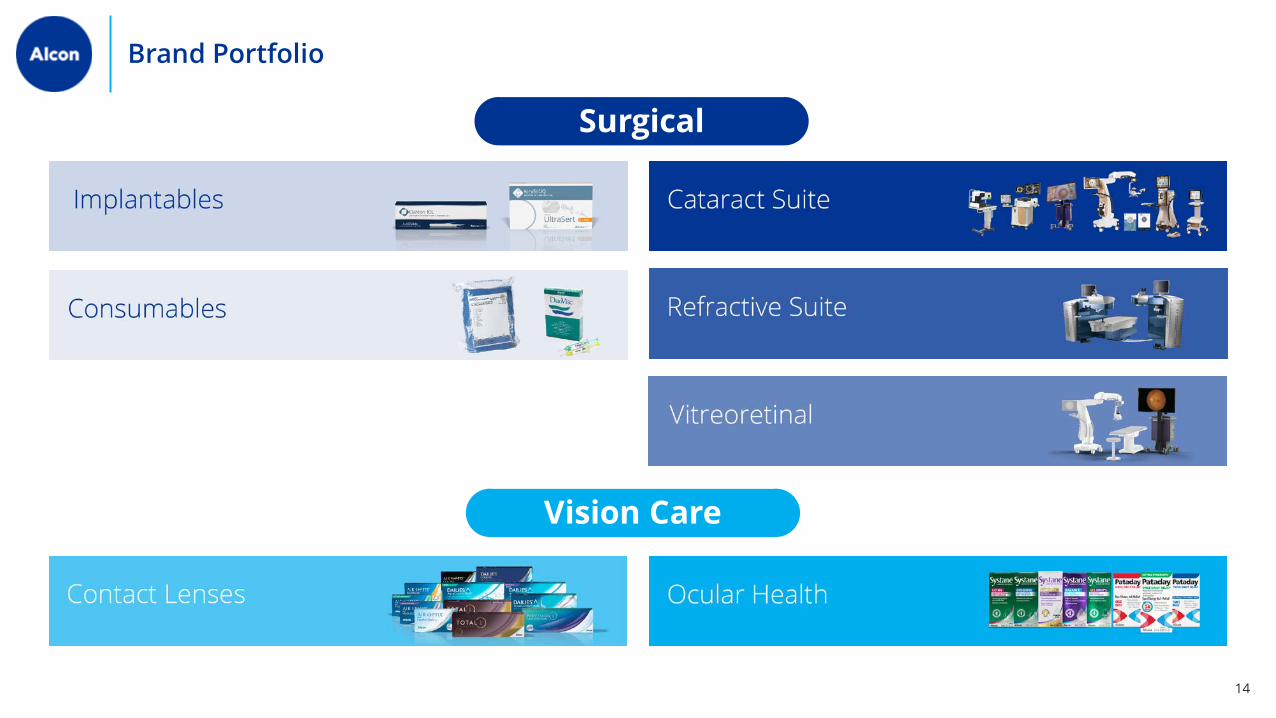
Surgical
Brand Portfolio
Vision Care

15
Driving industry-leading expertise in eye care
CATARACTDiagnostic, visualization, microscope, phaco-emulsification, laser guided capsulotomy, optical lens design and manufacturing, ophthalmic pharma solutions, consumable manufacturing and distribution, digital systems
RETINADiagnostic, visualization, vitrectomy, instrumentation, consumable manufacturing and distribution
REFRACTIVEDiagnostic, visualization, femtosecond and excimer laser technology, instrumentation, digital systems
CONTACT LENSOptical design, material and surface chemistry, contact lens manufacturing
OCULAR HEALTH AND DRY EYEArtificial tears, tear film optimization, drug delivery solutions, manufacturing and distribution

16
Delivering first-to-market innovations for 75 years
1950Alcon’s first two ophthalmic products for minor eye infections and red, itchy eyes
Ocular Health
Intraocular lens (IOL)
Daily silicone hydrogel lens
2005First material designed as an IOL (AcrySof), with 125M implants in the last 30 years
1953Founder Robert Alexander created the DROPTAINER eye drop dispensing bottle, the standard in eye care
2011Launched the world’s first and only water gradient daily contact lens
2008Launched CONSTELLATION Vision System, the leader in vit-ret surgical equipment
Vit-ret surgery

17
Developing new products with a customer-centric approach
18,000 doctorsattended Alcon’s educational programs in 2020
70 training centerswith state-of-the-art facilities
75 yearsserving the eye care industry
17

1818
500+ medical missionsin 69 countries serving 38,000 patients in 2019
4,000+ doctorsin Russia, China, India, Vietnam, Bangladesh, Indonesia, and Nepal trained in the Phaco Development Program
5.5 millionpatients served by doctors trained under the Phaco Development Program; now replicating in vit-ret
Building medical capacity in underdeveloped markets

3.Delivering on Strategic Initiatives

20
STANDING UP OF ALCON IS COMPLETE
20

21
On track with strategic priorities
• Enterprise-wide systems enabling speed and agility: Workday, Veeva Vault and SAP
• IT site migration complete, significantly de-risked
• Manufacturing facilities transitioned
• TSAs primarily complete
Separation primarily complete
• Four shared service centersin low-cost countries
• Franchise-centered model
• Streamlined international structure
• Accelerating innovation
• New stage-gate process aligns R&D, manufacturing and commercial teams
Transforming Alcon
• State-of-the-art proprietary manufacturing technology successfully installed and quality certified at three regional sites; capacity ramp up ongoing
• Advanced inventory build for new product launches during 2020 downturn
Expanding capabilities

22
Foundation for a stronger culture in place
US OTC switch of Pataday, leading ocular allergy eye drop, just 17 days post-FDA approval
Concurrent launches of PRECISION1 sphere and
toric in Europe
Speed
Consolidation of 500+ brand websites
in six months
Ongoing rollout of MyAlconto every international market
Simplicity
Aligned incentive compensation with critical
key performance indicators for Alcon’s long-term
success, including specific innovation milestones
Accountability
Celebrating brilliant contributions to
Alcon innovation
New Ways of Working workshops to help clarify
decision rights for business functions
Ownership

4.Innovating to Improve Outcomes

24
Accelerating innovation near-term
ATIOLs Interconnected equipment
Silicone hydrogel or SiHy
contact lenses
Eye drops

25
Gaining share in fast growing markets
Illustrative purposes only. * Not currently in market.
SLOW
FAST
Systane MDPF
PRECISION1
Pataday
PanOptixVivity
LOW HIGH
PRECISION1 toric
DAILIES TOTAL1 toric*
Market shareM
arke
t gro
wth
Reusables*

26
Gaining momentum with PRECISION1 sphereVISION CARE
First contact lens manufactured on our new contact lens platform
Democratizes silicone hydrogel for more consumers
Improve retention among first-time users dropping out due to poor comfort, end of day acuity or handling issues

27
Establishing a presence in SiHy toric with PRECISION1 for Astigmatism
1. Alcon data on file, 2020.
VISION CARE
Settles in less than 60 seconds1
Less than 3° of oscillation with each blink1
Stabilized 8 and 4 o’clock points help reduce lower lid interaction1

28
Reigniting the reusable market with TOTAL30VISION CARE
Second lens manufactured on our new contact lens platform
Premium-ize reusable SiHy with a unique water gradient surface
Leveraging the outstanding comfort of DAILIES TOTAL1 for a lens that feels like nothing on Day 1 and Day 30

29
Broadening patient options with two unique PCIOLsSURGICAL
PanOptix: first trifocal IOL in the US for spectacle independence
Vivity: first non-diffractive EDOF in the industry
Patented X-WAVE technology delivers presbyopia correction with no halos or glare
Incremental innovations in IOL delivery systems

30
ATIOL penetration continues to increase
1. Alcon data on file, based on a survey of US patients.
4 out of 10US patients are willing to pay for a better performing IOL1
New IOL designs, better IOL placement tools and surgeon experience
7%2016
8%2019
10%2020
Global ATIOL Market Penetration (% of units)
SURGICAL

31
Increasing access to industry leading Ocular Health solutions
VISION CARE
Grow the Systane brand with formulations to address different forms of dry eye
Expand into important preservative-free category
Broaden access to the leading Rx ocular allergy solution with the OTC switches of Pataday family

32
Expanding into the $400M diagnostics and visualization market
SURGICAL
LuxOR with ORA technology: perform pre-operative diagnostics and digital guidance
NGENUITY: 3D visualization for heads-up surgery on complex cases
ARGOS: advanced biometry for easier IOL planning and greater precision in cataract surgery

33
Robust innovation engine pushing theboundaries of eye care today
DisruptiveATIOLs
Digital Health Solutions
Next generation contact
lens design
Presbyopiasolutions
Novel deliverybeyond the drop

5.Unlocking Shareholder Value

3535
Unlocking shareholder returns
SALES
~$10Bby 20251
CORE OPERATING MARGIN
approaching mid-20sby 20252 (%)
1. 5-year outlook is subject to various risks and uncertainties. See Legal Disclaimers on page 2 and the assumptions underlying our outlook on page 41 for more information.2. For additional information regarding the core results discussed above, which are non-IFRS measures, see Appendix starting on page 88.

36
Alcon maintaining leadership in an attractive market
Accelerating innovation that improves patient and customer outcomes
Progress on strategic priorities, supporting long-term financial goals
Key Takeaways
36
Roadmap for $10B sales by 2025, with optionality from market adjacencies

37
UNLOCKING SHAREHOLDER RETURNSTIM STONESIFER, CFO
37

38
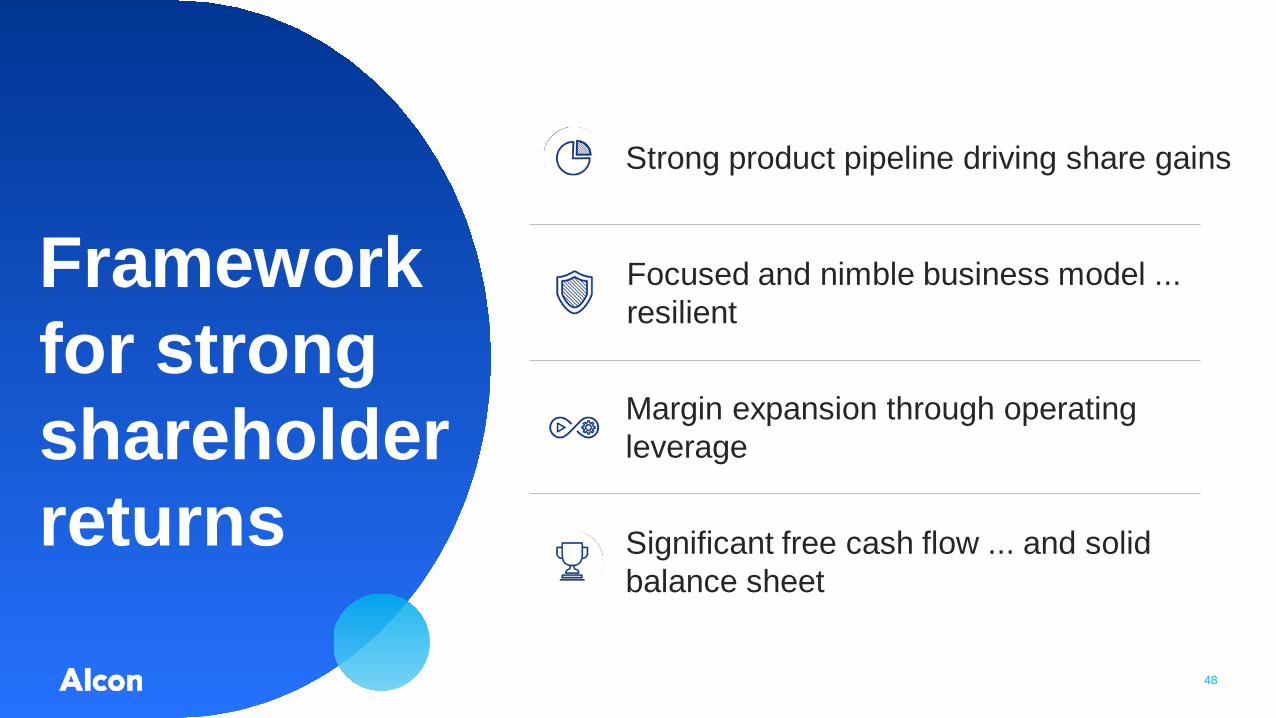
Framework for strong shareholder returns
Margin expansion through operating leverage
Significant free cash flow ... and solid balance sheet
Strong product pipeline driving share gains
Focused and nimble business model ... resilient

39
Growing sales aligned with accelerating product pipeline
1 2 3 4
$6.6 $6.8$7.1 $7.4
Sales ($B)
1 2 3 4
Product approvals
1 2 3 4
First-to-market launches
2643
6480
8 1014 15
2016 2017 2018 2019

40
Business resilience evidenced by rapid 2H 2020 rebound
1. For additional information regarding the core results and constant currencies (cc) discussed above, which are non-IFRS measures, see Appendix starting on page 88.
1Q20 2Q20 3Q20 4Q20
Sales($B)
$1.8
$152 $146 $145
$174
1 2 3 4
Core R&D1
($M)Core operating margin1
y/y cc growth1
$1.2
$1.8 $1.9 16.6%
-6.6%
15.3% 14.9%
+4% -34% -1% +1%
New launches driving 2H recovery PanOptix, PRECISION1, Pataday
Strategic initiatives on track ... separation, transformation, contact lens manufacturing expansion
Disciplined expense management while continuing R&D investment
Strengthened balance sheet with successful capital raise
1Q20 2Q20 3Q20 4Q20 1Q20 2Q20 3Q20 4Q20

41
2019-2025 outlook assumptions
• Markets return to historical levels by 2H 2021 and onward
• New product launches drive better than market growth
• Efficiencies from optimization of new lens manufacturing platform realized mid-plan
• Reinvesting savings from transformation into R&D and new product launches
• Core R&D spend of 7-9% of sales to maintain robust pipeline
• Core tax rate of approximately 20%
• No significant impact from foreign currency
• Capex returns to mid-single digits (as % of sales) in the latter years of the plan
Outlookassumes:
Outlook doesnot assume:
• New M&A and business development opportunities
• Entry into new white spaces

4242
Strong long-term financial goals post-COVID
1. 5-year outlook is subject to various risks and uncertainties. See Legal Disclaimers on page 2 and the assumptions underlying our outlook on page 41 for more information.2. For additional information regarding the core results and free cash flow discussed above, which are non-IFRS measures, see Appendix starting on page 88.
CORE OPERATING MARGIN2
approaching mid-20sby 20251 (%)
SALES
~$10Bby 20251 (mid-single digit CAGR 2019-2025)
FREE CASH FLOW2
~$1.8-$2.0Bby 20251
43
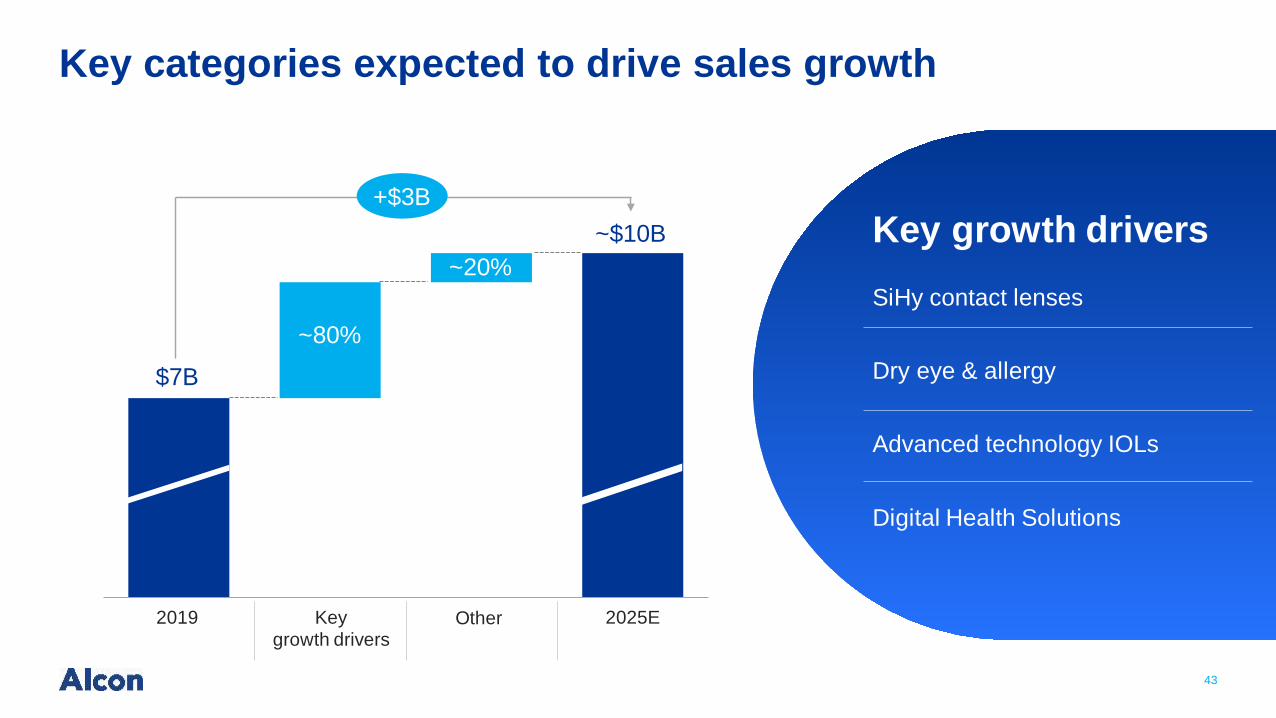
Key categories expected to drive sales growth
~$10B
2019 Keygrowth drivers
Other 2025E
$7B
+$3B
~20%
~80%
Key growth driversSiHy contact lenses
Dry eye & allergy
Advanced technology IOLs
Digital Health Solutions

44
Segment margins expected to converge by 2025
1. 5-year outlook is subject to various risks and uncertainties. See Legal Disclaimers on page 2 and the assumptions underlying our outlook on page 41 for more information.
Segment contribution margins1 (% of sales) New contact lens manufacturing lines
2019 2020 2025E
Surgical
Vision Care
18%
14%
23%
18%
2023E2021E2019 2020 2024E2022E 2025E
• Vision Care margin expansion from improved optimization on new contact lens manufacturing lines
• Surgical expansion driven by favorable ATIOL mix• Segment contribution does not include G&A expenses for Corporate
activities and other items
• Vision Care current margins suppressed during line installation and start-up
• Average line takes ~24 months to fully optimize production and process
ILLUSTRATIVE

45
Margin expansion driven primarily by operating leverage
1. For additional information regarding core operating margin, which is a non-IFRS measure, see Appendix starting on page 88.2. 5-year outlook is subject to various risks and uncertainties. See Legal Disclaimers on page 2 and the assumptions underlying our outlook on page 41 for more information.
1 2 3 4
17%
2019 Gross marginimprovement
Operational efficiency andP&L leverage
2025E
Core operating margin1,2
(% of sales) Approaching mid-20s Drivers
Sales acceleration from new innovation and pipeline launches
Favorable product mix
Manufacturing efficiencies from optimization of new contact lens platform

46
Generating significant free cash flow
1. 5-year outlook is subject to various risks and uncertainties. See Legal Disclaimers on page 2 and the assumptions underlying our outlook on page 41 for more information.2. For additional information regarding free cash flow, which is a non-IFRS measure, see Appendix starting on page 88.
Free cash flow1,2
~$1.8B-$2.0B
2019 2025E
$0.4B
DriversAccelerating sales growth
Expanding margins
Stabilizing capital and IT investments
Completing transformation and separation

47
Capital allocation priorities remain consistent
1. Subject to shareholder approval.
Maintain investment grade credit rating
• R&D investments in developing next-gen IOLs, surgical suite, contact lens and ocular health
• Marketing key product launches across geographies
• Continued investment into capacity expansion
Invest in organic growth
• Agnostic to the source of innovation
• Bolt-on acquisitions and adjacencies
• White space opportunities: • New device categories• Eye drop delivery devices
• Ophthalmic pharma
Invest in BD&L and M&A
• Expect to initiate new dividend in 20211
• Payout policy of 10% of core net income1
Return to shareholders
48
Framework for strong shareholder returns
Margin expansion through operating leverage
Significant free cash flow ... and solid balance sheet
Strong product pipeline driving share gains
Focused and nimble business model ... resilient

49
STRENGTHENING SURGICAL LEADERSHIPJEANNETTE BANKES, PRESIDENT SURGICAL
49

50
3
5
2
10
Leading position in the global surgical market
1. Market Scope; Alcon internal estimates; Company press release; see Legal Disclaimers for more information about future industry growth projections.2. Implantables include IOLs, surgical glaucoma devices; Consumables include cataract, vitreoretinal, and refractive disposable instruments; Equipment includes cataract and vitreoretinal consoles and
accessories, FLACS laser, refractive lasers, equipment service & maintenance, microscopes, diagnostics, and drops for mydriatics, cycloegics, diagnostics and anesthetics.3. All trademarks are property of the respective owner.
4.2
Others
~$10B market
Implantables2
2019 industrysales1 ($B)
2019-2025E industry CAGR1
~6%
2019 global surgical sales1 ($B)
Consumables2
Equipment /Other2
Total
~3%
~3%
~4%
SURGICAL
51
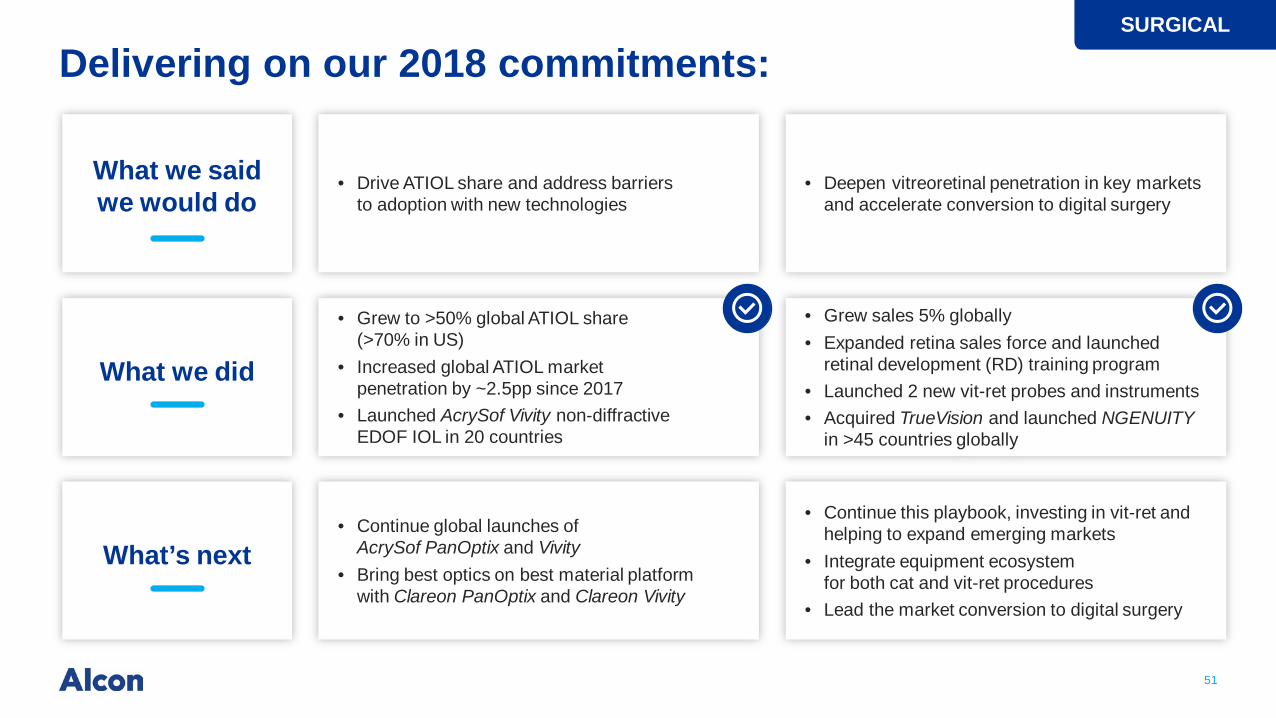
Delivering on our 2018 commitments:SURGICAL
• Drive ATIOL share and address barriersto adoption with new technologies
• Grew to >50% global ATIOL share (>70% in US)
• Increased global ATIOL marketpenetration by ~2.5pp since 2017
• Launched AcrySof Vivity non-diffractiveEDOF IOL in 20 countries
• Continue global launches ofAcrySof PanOptix and Vivity
• Bring best optics on best material platformwith Clareon PanOptix and Clareon Vivity
• Deepen vitreoretinal penetration in key markets and accelerate conversion to digital surgery
• Grew sales 5% globally• Expanded retina sales force and launched
retinal development (RD) training program• Launched 2 new vit-ret probes and instruments• Acquired TrueVision and launched NGENUITY
in >45 countries globally
• Continue this playbook, investing in vit-ret and helping to expand emerging markets
• Integrate equipment ecosystemfor both cat and vit-ret procedures
• Lead the market conversion to digital surgery
What we saidwe would do
What we did
What’s next

52
What’s next: driving global share in PCIOL market
1. Market Scope, as of Q4 2020.2. Alcon data on file. Percentage of PanOptix patients saying they would choose the same lens again.
SURGICAL
Non-diffractive optic delivers minimal visual disturbance
20/20 distance, >20/25intermediate and 20/32
near vision
Q1 2021 US launch
20/20 near, intermediate and distance vision
99% patient satisfaction2
150 bps US PCIOL penetration growth 2019-2020
AcrySof IQ PanOptixTrifocal IOL
AcrySof IQ VivityExtended Depth of Vision IOL
Global PCIOL share leadership
Alcon sales for every +100 bps in
global PCIOL penetration
>75%share1
20%
40%
60%
80%
Alcon PCIOL market share in US
2Q19 4Q20
~$100M>50%share

53
What’s next: gaining share with PanOptix, a unique trifocal IOL with patented ENLIGHTEN technology
1. Alcon data on file. Based on mean value of binocular defocus curve at near, intermediate, and distance at 6 months (n=127).
ENLIGHTEN optical technology
Ligh
tene
rgy
Focaldistance
0 orderdistance
1st orderintermediate
120 cm (47 in)
2nd orderintermediate
60 cm (24 in)
3rd ordernear
40 cm (16 in)
Simplified for illustration purposes.
Step 1: Create an additional focal point
at 120 cm
Step 2: Redirect the new 1st
order intermediate focal point’s light energy to distance
SURGICAL
ENLIGHTENoptical technology
Proprietary design optimizes intermediate focal point (60 cm) – most common middle-vision sight distance
Without compromising exceptional near (40 cm) and distance vision1
Compared to 80cm intermediate vision offered by our competitors
54
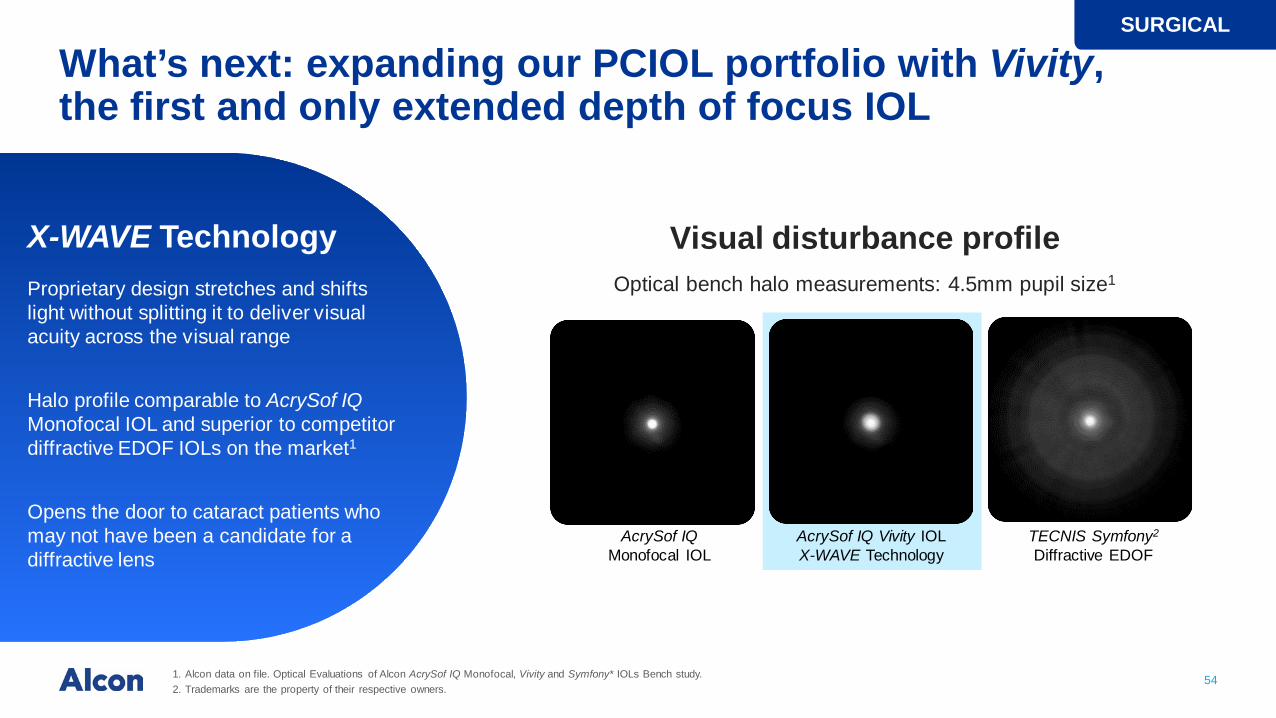
What’s next: expanding our PCIOL portfolio with Vivity, the first and only extended depth of focus IOL
1. Alcon data on file. Optical Evaluations of Alcon AcrySof IQ Monofocal, Vivity and Symfony* IOLs Bench study.2. Trademarks are the property of their respective owners.
Visual disturbance profileOptical bench halo measurements: 4.5mm pupil size1
SURGICAL
X-WAVE Technology Proprietary design stretches and shifts light without splitting it to deliver visual acuity across the visual range
Halo profile comparable to AcrySof IQMonofocal IOL and superior to competitor diffractive EDOF IOLs on the market1
Opens the door to cataract patients who may not have been a candidate for a diffractive lens
AcrySof IQMonofocal IOL
AcrySof IQ Vivity IOLX-WAVE Technology
TECNIS Symfony2
Diffractive EDOF

55
What’s next: investing in an ecosystem of the futureDiagnostics and visualization deliver interconnectivity in office and in OR
NGENUITYIntra-operative visualization, heads-up 3D display
LuxOR RevaliaIntra-operative visualization, digital microscope
Consumables Cataract, vitreoretinal, refractive surgery
CENTURION andCONSTELLATIONCataract and vitreoretinal surgical platforms
ARGOS biometerIn-office pre-operative cataract diagnostics
Digital Health Solutions: Cataract PlannerCloud-based platform, improving patient outcomes
Alcon Equipment Ecosystem
SURGICAL

56
What’s next: improving procedure efficiency and patient outcomes
1. Based on a time-and-motion study of 1,000 patients; comparing to a regular practice that has a IOLMaster500 or Lenstar biometer; time savings from both optical biometer and manual a-scan measurements.2. Compared to analog microscopes including the Leica Proveo 8 and Zeiss OPMI LUMERA® 700 scopes; achieved specified performance at maximum system magnification with an aperture setting of 30% open
and viewing distance of 1.2 meters.
SURGICAL
ARGOS biometer
• Faster, easier, better pre-operative biometry solution
• Can help practices reduce pre-operative biometric measurement time by 30-40%1 through reduced measurement time
NGENUITY
• 3D digital visualization system transforms the surgical experience
• Up to 5x extended depth of field2, increased magnification, and depth resolution to help surgeons “See Better, Do Better”
Digital Health SolutionsCataract Planner
• Cloud-based platform enables equipment connectivity and streamlined data exchange
• Integrates Alcon’s equipment ecosystem across our pre-operative and intra-operative footprint

57
What’s next: focusing on fast-growing and underpenetrated markets
1. Total procedures performed by active participants since program inception in 2008 (~4k Surgeons actively participated in our Phaco and Retina Development Programs in all international markets in 2020).2. Total video view count on AEA in all international markets from 1/1/2020 - 12/31/2020.3. Total of 26 major Surgical launches in 2018 - 2020.
+50bps
internationalATIOL penetration (2018-2019)
20productlaunches in underpenetrated markets(2018-2020)3
>75regulatoryfilings pendingand planned for 2021
>5Mprocedures in underpenetrated markets via PhacoDevelopment Programs1
~60Kvideos viewed on Alcon Experience Academy in 20202
SURGICAL

58
Surgical pipeline: rich product flow fueling growthSURGICAL
Next generation phaco vit-ret consoleBest-in-class console for cataract and vitreoretinal surgery
2019 – 2020 2021 – 2022 2023+
PanOptix (US)Trifocal IOL
Vivity(International) Extended range vision IOL; monofocal-like disturbance
Vivity (US)Non-diffractive extended depth of focus IOL
InnovEyesRefractive diagnostic for myopia treatment
Digital Health SolutionsCloud-based Cataract Planner
Clareon familyof productsIOLs with trifocal, extended range vision and toric optical designs on our Clareon material platform; compatible delivery devices
Next generation diagnostic All-in-one office diagnostic platform
Novel delivery systemAllows for smaller incision sizes
Next generation refractive suiteModular and upgradable refractive console
Legion(International) Value segment phacoconsole
ARGOS biometerPre-operative biometerwith image guidance

59
Continuous innovation sustaining leadership position in a growing market
Developing integrated equipment ecosystem to deliver efficiency in clinic and OR
Launching best-in-class products to drive global share in PCIOL market
Investing in growth markets to drive new revenue streams
Key Takeaways
59

60
ACCELERATING GROWTH IN VISION CAREANDY PAWSON, PRESIDENT VISION CARE
60

61
Leading position in the global vision care market
1. GFK, Nielsen, IQVIA, CBG, Euromonitor data, Market Scope, Company filings, Alcon internal estimates; see Legal Disclaimers on page 2 for more information about future industry growth projections.2. All trademarks are property of the respective owner.
Others
~$15B market
2019 industry sales1 ($B)
2019-2025E industry CAGR12019 global vision care sales1 ($B)
ContactLenses
OcularHealth
Total
9
6
15
VISION CARE
3.2 ~5%
~4%
~4%

62
Delivering on our 2018 commitments:
1. Internal estimates.
What we saidwe would do
What we did
What’s next
VISION CARE
• Deliver 3 novel lensdesigns on a new flexible manufacturing base
• Drive Ocular Health with Systane Complete• Win in daily disposables
• Grew DAILIES TOTAL1multifocal share to 45% intotal daily multifocal lens category1
• Launched PRECISION1 to lead in share of new fits in US
• Initiated manufacturing on 2 new novel lens designs
• Launched Systane Complete in over 30 countries
• Completed OTC switches of Pataday Once Daily and Twice Daily
• Continue PRECISION1 rollout with PRECISION1 for Astigmatism
• Specialty expansion with DAILIES TOTAL1
• Launch TOTAL30 in the reusable family (pending approval)
• MDPF (three variants)• Pataday Extra Strength
OTC switch
63
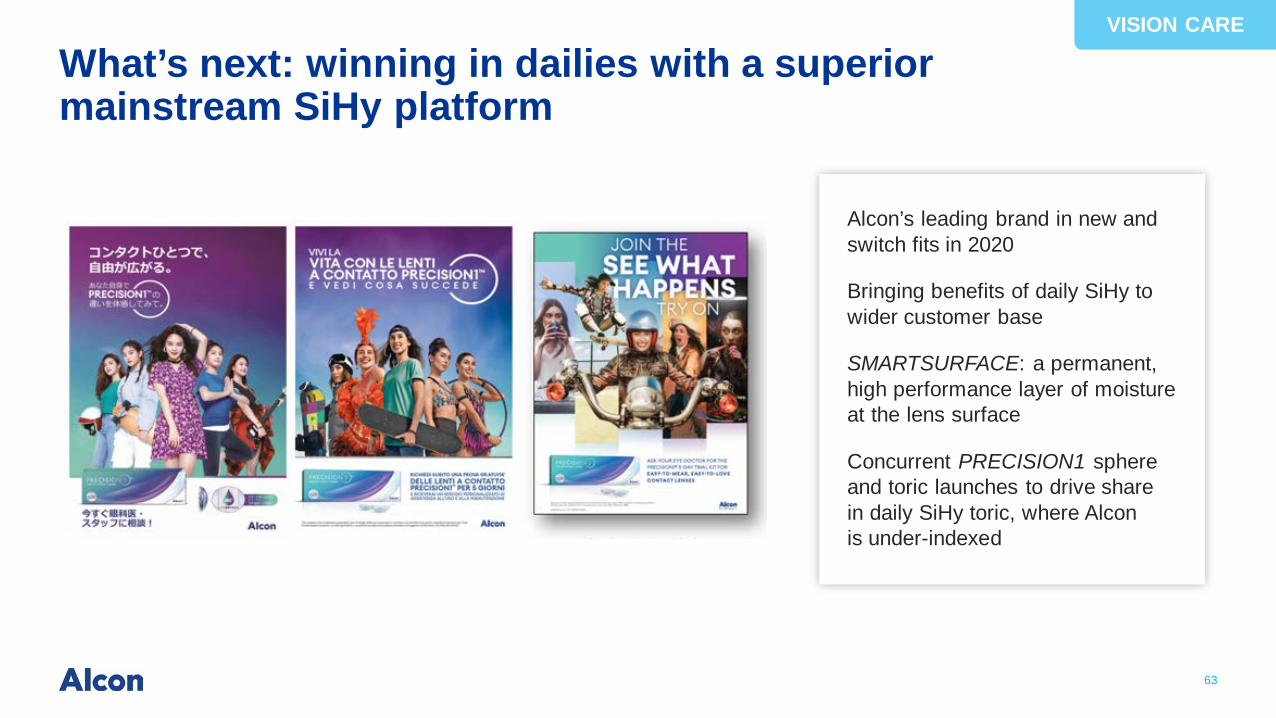
What’s next: winning in dailies with a superior mainstream SiHy platform
VISION CARE
Alcon’s leading brand in new and switch fits in 2020
Bringing benefits of daily SiHy to wider customer base
SMARTSURFACE: a permanent, high performance layer of moisture at the lens surface
Concurrent PRECISION1 sphereand toric launches to drive share in daily SiHy toric, where Alcon is under-indexed

64
What’s next: launching best-in-class, only water gradient lens in the $4B reusables market
VISION CARE
Leveraging DAILIES TOTAL1 water gradient technology
New biomimetic surface properties
“Feels like nothing” even onday 30
Upgrade monthly wearers to the Totalplatform
Favorable cost profile driving attractive economics and margin at launch
Launch planned for 2022

65
• Building on Systane family blockbuster potential, in the high growth and margin dry eye market
• Launching 3 Multi-Dose Preservative-Free variants in the next few years• Entering ~$1B global segment where Alcon is under-
indexed with single-digit share • Marriage of best dry eye formulation with
preservative-free technology
• Pataday family has captured #1 US share position and Alcon now holds more than 50% US market share
• Pataday Once Daily Extra Strength currently executing full retail launch with patent protection for several years
• Driving market growth through commercial execution and investment in direct-to-consumer advertising
What’s next: continued innovation in dry eye and allergy
VISION CARE
1. Internal estimates.
66
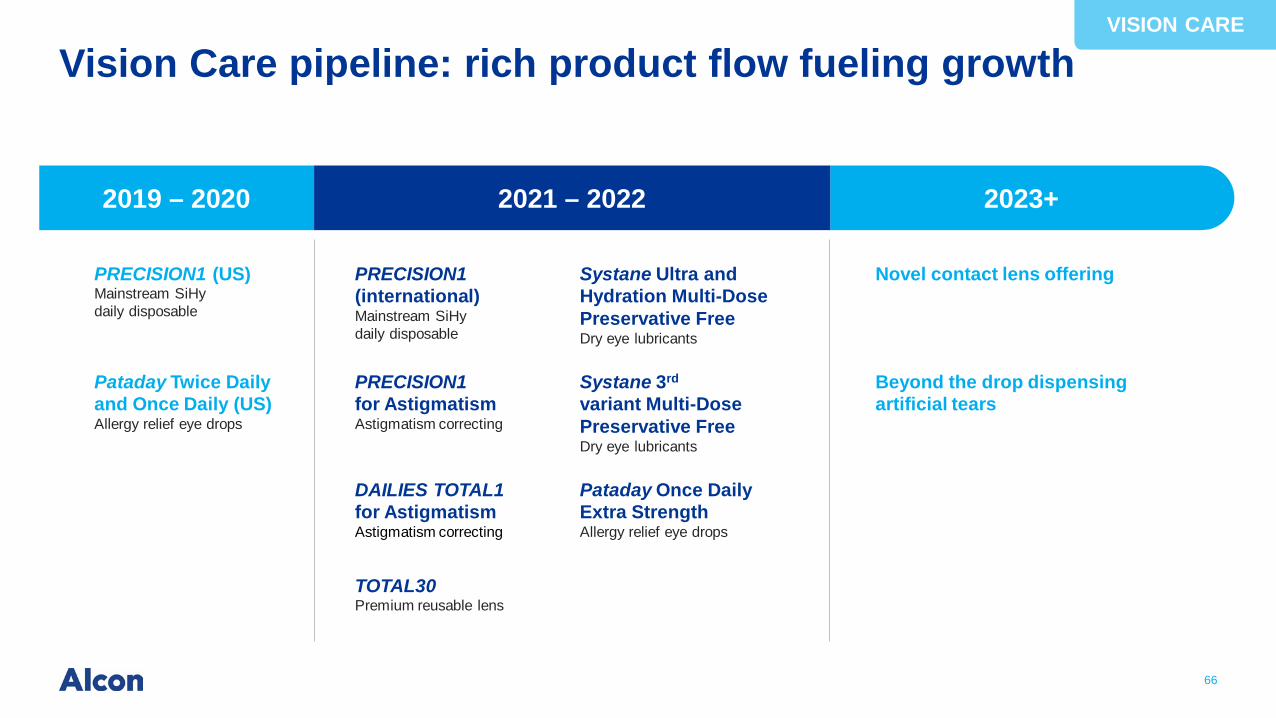
Vision Care pipeline: rich product flow fueling growthVISION CARE
Beyond the drop dispensing artificial tears
2019 – 2020 2021 – 2022 2023+
PRECISION1 (US)Mainstream SiHydaily disposable
Pataday Twice Dailyand Once Daily (US)Allergy relief eye drops
PRECISION1(international)Mainstream SiHydaily disposable
PRECISION1for AstigmatismAstigmatism correcting
Systane Ultra and Hydration Multi-Dose Preservative FreeDry eye lubricants
Systane 3rd
variant Multi-Dose Preservative FreeDry eye lubricants
Novel contact lens offering
DAILIES TOTAL1for AstigmatismAstigmatism correcting
Pataday Once Daily Extra StrengthAllergy relief eye drops
TOTAL30Premium reusable lens

67
Rich product flow driving growth ahead of market
Winning in daily disposables with PRECISION1 and DAILIES TOTAL1 and entering the fast-growing toric segment
Reigniting the reusable segment with TOTAL30
Taking share in new segments with SystaneMulti-Dose Preservative Free and Pataday
Key Takeaways
67

68
TRANSFORMING EYE CAREMICHAEL ONUSCHECK, PRESIDENT INNOVATION
68

69
How we think about innovation
Deep understanding of eye care needs
World-class expertise
Balanced incrementalversus disruptive
Agnostic tointernal versus
external

70
External innovation: rich BD&L activities focused on augmenting core business growth
Agnostic to the source of innovation
Remain the partner of choice for commercializing technologies globally
Leverage Alcon’s global footprint and scale
Offer flexibility to execute various investment structures
Bolt-on capabilities and enter adjacent categories

7171
Continuing to expand the frontiers of eye care through internal and external innovation
$30B+ addressable markets1
Accommodating IOLs
Customizable IOLS
Next generation retinal tamponades
Surgical glaucoma
Corneal treatments
Presbyopia correction
Dry eye delivery devices
Ophthalmic pharma
Robotic technology
1. Includes existing and emerging white space markets.Market Scope; GfK; Nielsen; IQVIA; Euromonitor; Santen; Alcon internal estimates.

72
Internal innovation: world-class resources focused on continued pipeline rejuvenation
26Surgical
launches since 2018
14Vision Care
launches since 2018
+15%core R&D investment
versus 2018
1,400R&D associates
11,000patents granted
100+ active projectsin development

73
Robust innovation engine pushing theboundaries of eye care today
DisruptiveATIOLs
Digital Health Solutions
Next generation contact
lens design
Presbyopiasolutions
Novel deliverybeyond the drop

74
Evolving breakthrough ATIOL technology
1. Alcon internal study.
SURGICAL
IOL innovation
Long history of delivering innovation to the market
PanOptix and Vivity recent examples
+$200M PCIOL sales versus 2018
True accommodating IOLs
Up to 2 Diopters objective accommodation achieved
Multiple diopter change achieved in implanted subjects
Customizable IOLs
Multiple programsin adjustable IOLs
Multiple active programs increasing our aggregate probability of success

75
Evolving breakthrough ATIOL technology
1. Alcon internal bench data.2. PowerVision clinical study.
SURGICAL
Customizable Accommodating
Power adjustmentenergy applied
Gaze targetnear/far (clinical study subject)
farnear
farnear
farnear
Decreasing powerIncreasing power
Change in lens power1
(bench data)Change in optical power2
(clinical study subject)
Time Time
Lens
Pow
er
Lens
Pow
er

76
Enriching our installed base to win the next decadeof consumables
SURGICAL
30,000+ active phaco and vitreoretinal consoles
Leading installedequipment base
$2B+ Alcon consumables business
Driving proceduralconsumables annuity
Superior fluidics for cataract and vitreoretinal
Near-physiological IOPwith less ultrasound
Improved occlusion break surge control
Shorter case times
Coming soon

77
Meaningful solutions that deliver value to practicesSURGICAL
Clinical challenge
Occlusion break surge
Transient fluid rush after clearance of a lens fragment
Can cause IOP to fall or the capsule to vault forward
Increases potential risk of posterior capsule rupture
Lower surge break volumes
More efficient cataract clearing
Shortercase times
Lower risk of ruptures and tears
Technology advancement
300 350 650400 450 600500 550
Infiniti(2003)
CENTURION(2013)
Next Gen
Active Sentry(2019)
Vacuum (mmHg)
Chamber instability surge volume micro-liters of fluid (55 mmHG IOP)
78
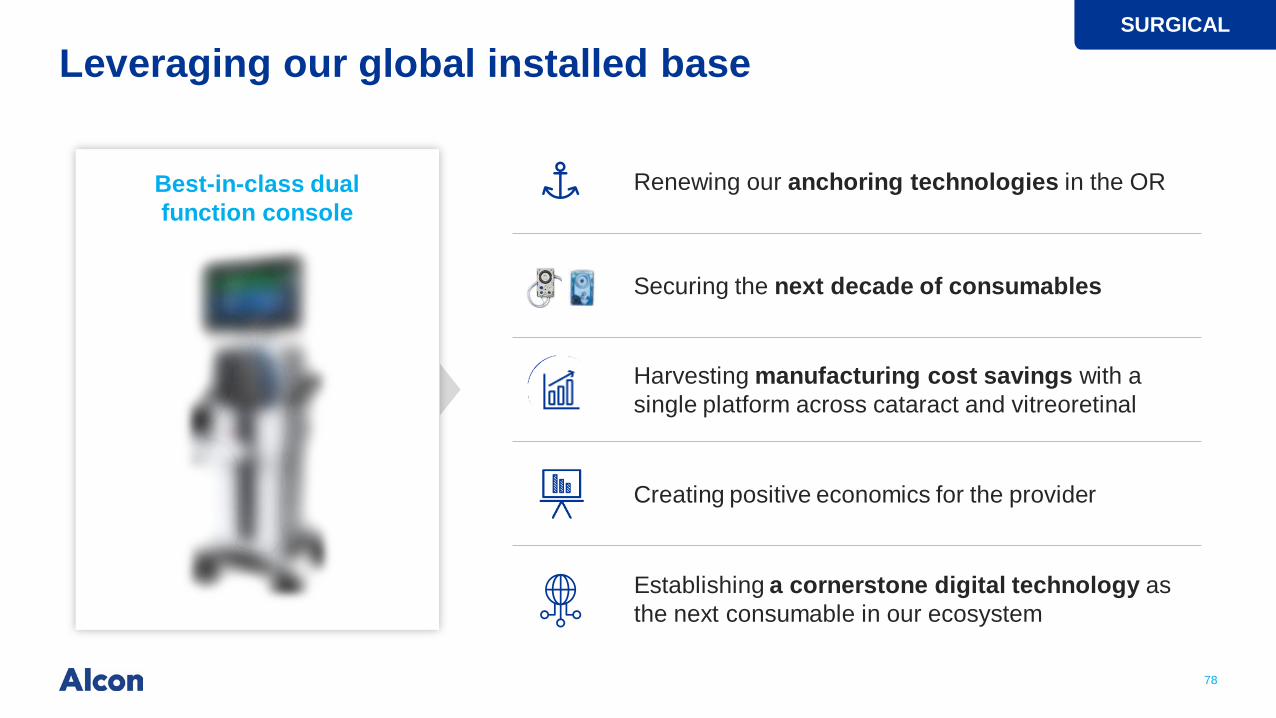
Leveraging our global installed baseSURGICAL
Coming soon
Best-in-class dual function console
Renewing our anchoring technologies in the OR
Securing the next decade of consumables
Harvesting manufacturing cost savings with a single platform across cataract and vitreoretinal
Creating positive economics for the provider
Establishing a cornerstone digital technology as the next consumable in our ecosystem
79
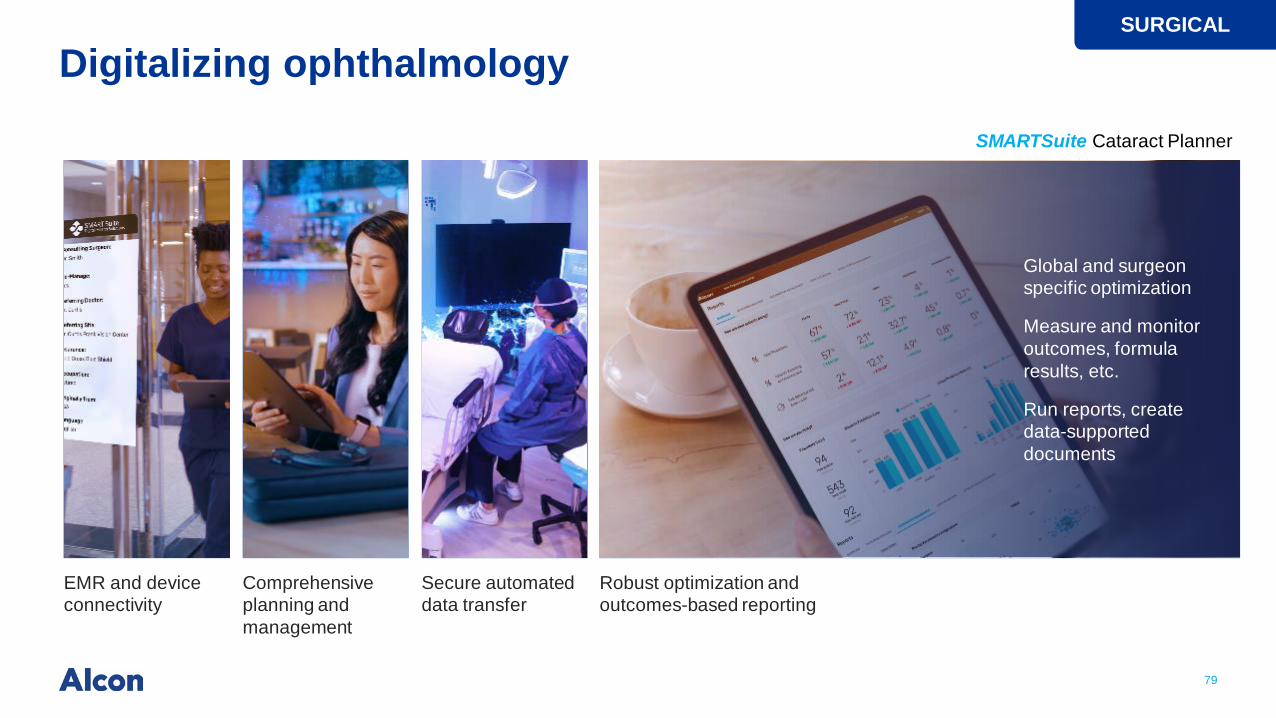
Digitalizing ophthalmology
Robust optimization andoutcomes-based reporting
Global and surgeonspecific optimization
Measure and monitor outcomes, formularesults, etc.
Run reports, create data-supported documents
Comprehensive planning and management
EMR and device connectivity
Secure automateddata transfer
SMARTSuite Cataract Planner
SURGICAL

80
Driving efficiency and improving outcomes with aninterconnected digital ecosystem
1. J Cataract Refract Surgery, vol 16, May (1990); Eye 23, 149–152 (2009); J Cataract Refract Surgery, 44:447-452 (2018).
SURGICAL
Targeting ~35% improvement in time spent planning a case
3055
7390
20091990 2018 Target with AI
% patients within +/- 0.5D of target
Targeting ~90% within +/-0.5D
Outcomes1Efficiency
EMR
Diagnostic
Planner Planner
Cloud-based Artificial Intelligence
Pre-op Post-opOffice OR
Console
Diagnostic
Visualization

81
New manufacturing platform: creating a powerful engine for future innovation in contact lenses
1. Relative to the manufacture of our leading dailies brand.
highly modular, flexible production
single modality and chemistry
dedicated, fixed manufacturing
multiple modalities and chemistries
semi-automated, rigid capacity fully automated, fast cycle times
To ...From … Finalizing 3rd novel Lens
VISION CARE
Outputper line1
Costper lens1
CAPEXper line1

82
Presbyopia correction: an untapped market opportunity
1. CLI, ResearchAndMarkets, Alcon analysis.
VISION CARE
Presbyopia prevalence estimated to be80% by age 45-551
~60% of those needing multifocal correction are interested in contacts1
Multifocal category growing ~15% annually1
Multifocal solutions today compromise on distance visual acuity
83
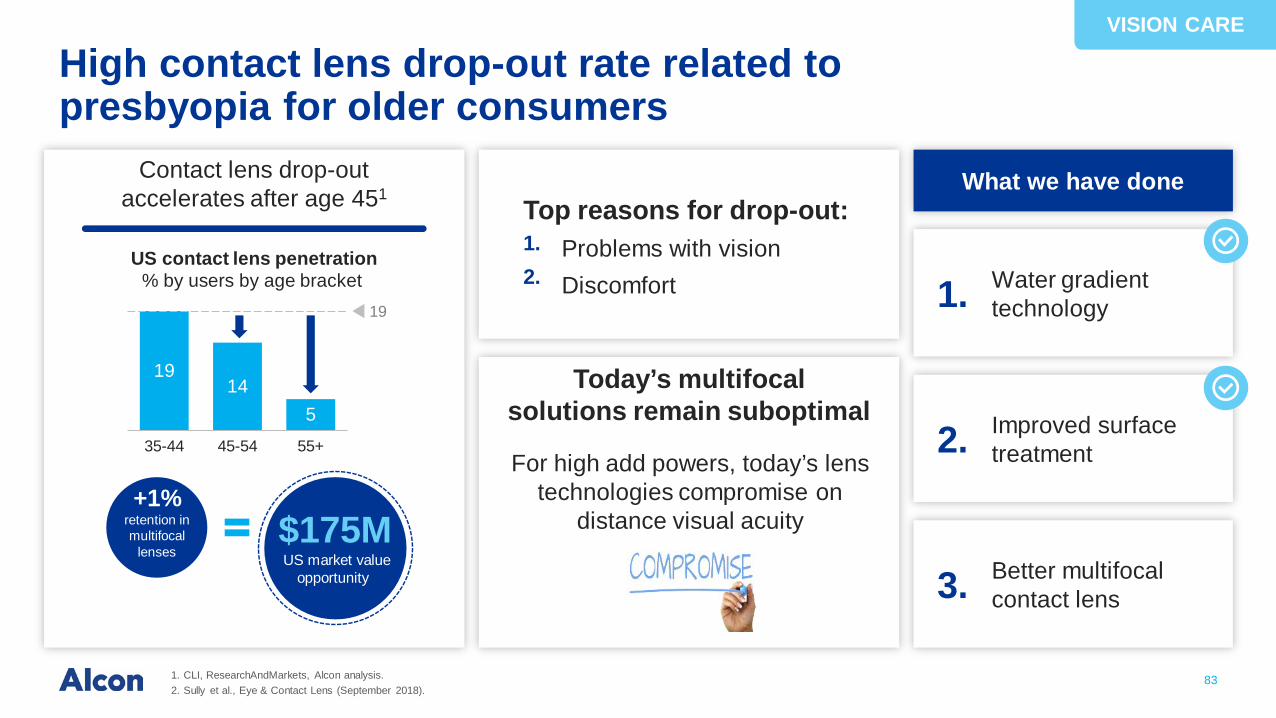
High contact lens drop-out rate related to presbyopia for older consumers
1. CLI, ResearchAndMarkets, Alcon analysis.2. Sully et al., Eye & Contact Lens (September 2018).
VISION CARE
1914
535-44 45-54 55+
19
+1%retention in multifocal
lenses$175MUS market value
opportunity
Contact lens drop-out accelerates after age 451
US contact lens penetration% by users by age bracket
What we have done
Today’s multifocal solutions remain suboptimal
Top reasons for drop-out: Problems with visionDiscomfort
1.2. 1.
2.
3.
Water gradient technology
Improved surface treatment
Better multifocal contact lens
For high add powers, today’s lens technologies compromise on
distance visual acuity

84
1. Davies et al, Journal of Ophthalmology (June, 2017).2. Market Scope – 2019 Dry Eye Products Report.
VISION CARE
Traditional eye drop delivery remains ripe for innovation
Pain points70% have difficulty aiming eye drops1
50% miss on the first try1
40% use the wrong product for dry eye33% dry eye patients are diagnosed2

85
Ocular Health innovation going beyond the dropVISION CARE
Unique delivery advantage for new and existing agents used to treat a spectrum of eye conditions
Premium delivery offinely misted solutions
Impregnated films that dissolve over time
Innovative packaging options to meet unique
consumer needsEluting devices that
deliver over time

86
Robust product pipeline driving sustainable growth
Developing breakthrough innovation to expand markets
Driving the digitalization of eye care
Protecting the core business with next generation products
Key Takeaways
86

87
ConclusionAlcon is a world-class leader in an attractive market
Exciting innovation sustains leadership position and expands markets
Best-in-class products fuel growth and market share
Operating leverage drives significant margin expansion and free cash flow
87

88
APPENDIX
88

89
Non-IFRS financial measuresAlcon uses certain non-IFRS metrics when measuring performance, including when measuring current period results against prior periods, including core results, percentage changesmeasured in constant currencies and free cash flow. Because of their non-standardized definitions, the non-IFRS measures (unlike IFRS measures) may not be comparable to thecalculation of similar measures of other companies. These non-IFRS measures are presented solely to permit investors to more fully understand how Alcon management assessesunderlying performance. These non-IFRS measures are not, and should not be viewed as, a substitute for IFRS measures.
Reconciliation of guidance for forward-looking non-IFRS measuresThe forward-looking guidance included in this presentation cannot be reconciled to the comparable IFRS measures without unreasonable efforts, because we are not able to predict withreasonable certainty the ultimate amount or nature of exceptional items in the fiscal year. These items are uncertain, depend on many factors and could have a material impact on ourIFRS results for the guidance period.
Core ResultsAlcon core results, including core operating income and core net income, exclude all amortization and impairment charges of intangible assets, excluding software, net gains and losses onfund investments and equity securities valued at fair value through profit and loss ("FVPL"), fair value adjustments of financial assets in the form of options to acquire a company carried atFVPL, obligations related to product recalls, and certain acquisition related items. The following items that exceed a threshold of $10 million and are deemed exceptional are also excludedfrom core results: integration and divestment related income and expenses, divestment gains and losses, restructuring charges/releases and related items, legal related items,gains/losses on early extinguishment of debt or debt modifications, past service costs for post-employment benefit plans, impairments of property, plant and equipment and software, aswell as income and expense items that management deems exceptional and that are or are expected to accumulate within the year to be over a $10 million threshold.
Taxes on the adjustments between IFRS and core results take into account, for each individual item included in the adjustment, the tax rate that will finally be applicable to the item basedon the jurisdiction where the adjustment will finally have a tax impact. Generally, this results in amortization and impairment of intangible assets and acquisition-related restructuring andintegration items having a full tax impact. There is usually a tax impact on other items, although this is not always the case for items arising from legal settlements in certain jurisdictions.
Alcon believes that investor understanding of its performance is enhanced by disclosing core measures of performance because, since they exclude items that can vary significantly fromperiod to period, the core measures enable a helpful comparison of business performance across periods. For this same reason, Alcon uses these core measures in addition to IFRS andother measures as important factors in assessing its performance.
A limitation of the core measures is that they provide a view of Alcon operations without including all events during a period, such as the effects of an acquisition, divestment, oramortization/impairments of purchased intangible assets and restructurings.

90
Non-IFRS financial measuresConstant CurrenciesChanges in the relative values of non-US currencies to the US dollar can affect Alcon's financial results and financial position. To provide additional information that may be useful toinvestors, including changes in sales volume, we present information about changes in our net sales and various values relating to operating and net income that are adjusted for suchforeign currency effects. Constant currency calculations have the goal of eliminating two exchange rate effects so that an estimate can be made of underlying changes in the consolidatedincome statement excluding (i) the impact of translating the income statements of consolidated entities from their non-US dollar functional currencies to the US dollar and (ii) the impact ofexchange rate movements on the major transactions of consolidated entities performed in currencies other than their functional currency. Alcon calculates constant currency measures bytranslating the current year's foreign currency values for sales and other income statement items into US dollars, using the average exchange rates from the prior year and comparingthem to the prior year values in US dollars.
Free Cash FlowAlcon defines free cash flow as net cash flows from operating activities less cash flow associated with the purchase or sale of property, plant and equipment. Free cash flow is presentedas additional information because Alcon management believes it is a useful supplemental indicator of Alcon's ability to operate without reliance on additional borrowing or use of existingcash. Free cash flow is not intended to be a substitute measure for net cash flows from operating activities as determined under IFRS.
91
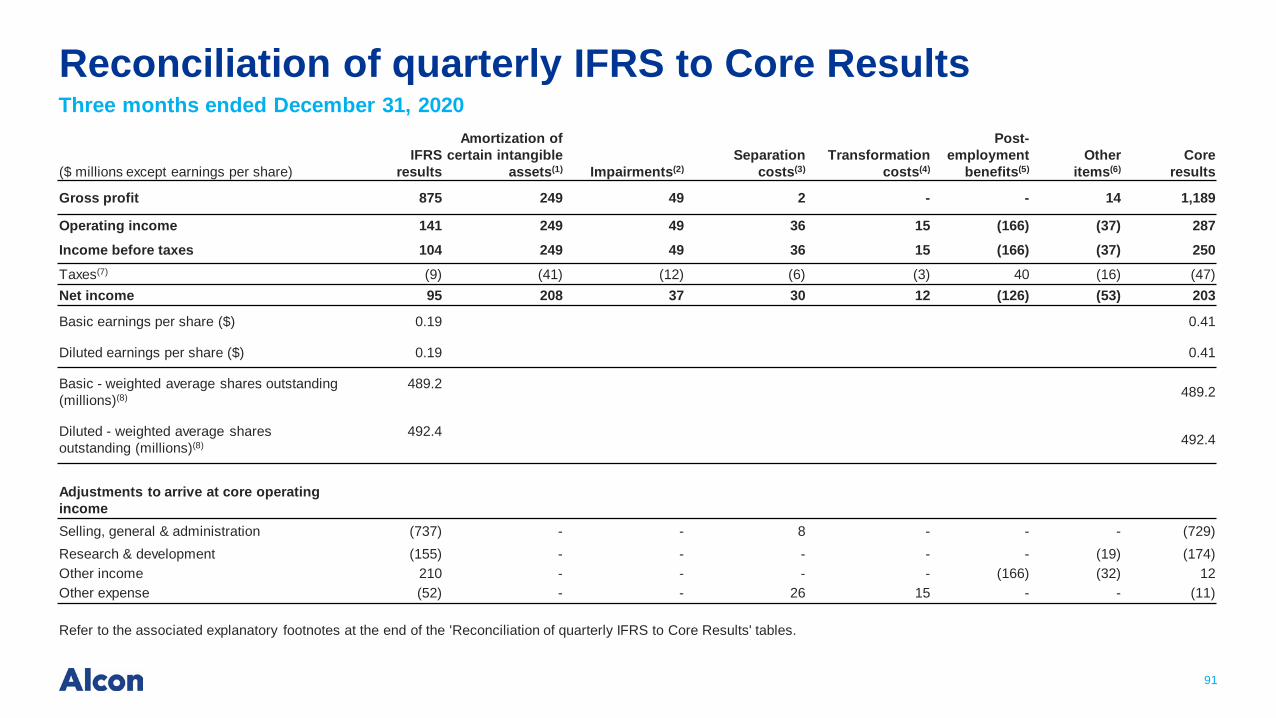
Reconciliation of quarterly IFRS to Core ResultsThree months ended December 31, 2020
($ millions except earnings per share)IFRS
results
Amortization of certain intangible
assets(1) Impairments(2)Separation
costs(3)Transformation
costs(4)
Post-employment
benefits(5)Other
items(6)Core
results
Gross profit 875 249 49 2 - - 14 1,189
Operating income 141 249 49 36 15 (166) (37) 287Income before taxes 104 249 49 36 15 (166) (37) 250Taxes(7) (9) (41) (12) (6) (3) 40 (16) (47)Net income 95 208 37 30 12 (126) (53) 203
Basic earnings per share ($) 0.19 0.41
Diluted earnings per share ($) 0.19 0.41
Basic - weighted average shares outstanding (millions)(8)
489.2 489.2
Diluted - weighted average shares outstanding (millions)(8)
492.4 492.4
Adjustments to arrive at core operating incomeSelling, general & administration (737) - - 8 - - - (729)Research & development (155) - - - - - (19) (174)Other income 210 - - - - (166) (32) 12Other expense (52) - - 26 15 - - (11)
Refer to the associated explanatory footnotes at the end of the 'Reconciliation of quarterly IFRS to Core Results' tables.

92
Reconciliation of quarterly IFRS to Core Results
($ millions except (loss)/earnings per share)IFRS
results
Amortization of certain intangible
assets(1) Impairments(2)Separation
costs(3)Transformation
costs(4)
Post-employment
benefits(5)Other
items(6)Core
results
Gross profit 848 250 - 4 - - 14 1,116
Operating (loss)/income (129) 255 61 48 14 12 18 279(Loss)/income before taxes (168) 255 61 48 14 12 18 240Taxes(7) 21 (44) (8) (7) (3) (2) (4) (47)Net (loss)/income (147) 211 53 41 11 10 14 193
Basic (loss)/earnings per share ($) (0.30) 0.39
Diluted (loss)/earnings per share ($) (0.30) 0.39
Basic - weighted average shares outstanding (millions)(8)
489.1 489.1
Diluted - weighted average shares outstanding (millions)(8)
489.1 492.0
Adjustments to arrive at core operating incomeSelling, general & administration (685) - - 5 - - - (680)Research & development (216) 5 61 - - - 5 (145)Other income 7 - - - - - (1) 6Other expense (83) - - 39 14 12 - (18)
Refer to the associated explanatory footnotes at the end of the 'Reconciliation of quarterly IFRS to Core Results' tables.
Three months ended September 30, 2020

93
Reconciliation of quarterly IFRS to Core Results
($ millions except (loss) per share)IFRS
results
Amortization of certain intangible
assets(1) Impairments(2)Separation
costs(3)Transformation
costs(4)Other
items(6)Core
results
Gross profit 345 250 41 4 - 14 654
Operating (loss) (466) 258 41 62 13 13 (79)(Loss) before taxes (502) 258 41 62 13 13 (115)Taxes(7) 80 (43) (10) (11) (3) (1) 12Net (loss) (422) 215 31 51 10 12 (103)
Basic (loss) per share ($) (0.86) (0.21)
Diluted (loss) per share ($) (0.86) (0.21)
Basic - weighted average shares outstanding (millions)(8)
489.0 489.0
Diluted - weighted average shares outstanding (millions)(8)
489.0 489.0
Adjustments to arrive at core operating loss
Selling, general & administration (595) - - 6 - - (589)Research & development (163) 8 - - - 9 (146)Other income 9 - - - - (3) 6Other expense (62) - - 52 13 (7) (4)
Refer to the associated explanatory footnotes at the end of the 'Reconciliation of quarterly IFRS to Core Results' tables.
Three months ended June 30, 2020

94
Reconciliation of quarterly IFRS to Core Results
($ millions except (loss)/earnings per share)IFRS
results
Amortization of certain intangible
assets(1) Impairments(2)Separation
costs(3)Transformation
costs(4)Other
items(6)Core
results
Gross profit 872 252 16 3 - (10) 1,133
Operating (loss)/income (28) 259 16 71 7 (23) 302(Loss)/income before taxes (69) 259 16 71 7 (23) 261Taxes(7) 12 (44) (4) (13) (1) 8 (42)Net (loss)/income (57) 215 12 58 6 (15) 219
Basic (loss)/earnings per share ($) (0.12) 0.45
Diluted (loss)/earnings per share ($) (0.12) 0.45
Basic - weighted average shares outstanding (millions)(8)
488.6 488.6
Diluted - weighted average shares outstanding (millions)(8)
488.6 491.2
Adjustments to arrive at core operating incomeSelling, general & administration (677) - - 3 - - (674)Research & development (139) 7 - - - (20) (152)Other income 9 - - - - - 9Other expense (93) - - 65 7 7 (14)
Refer to the associated explanatory footnotes at the end of the 'Reconciliation of quarterly IFRS to Core Results' tables.
Three months ended March 31, 2020
95
Reconciliation of quarterly IFRS to Core Results
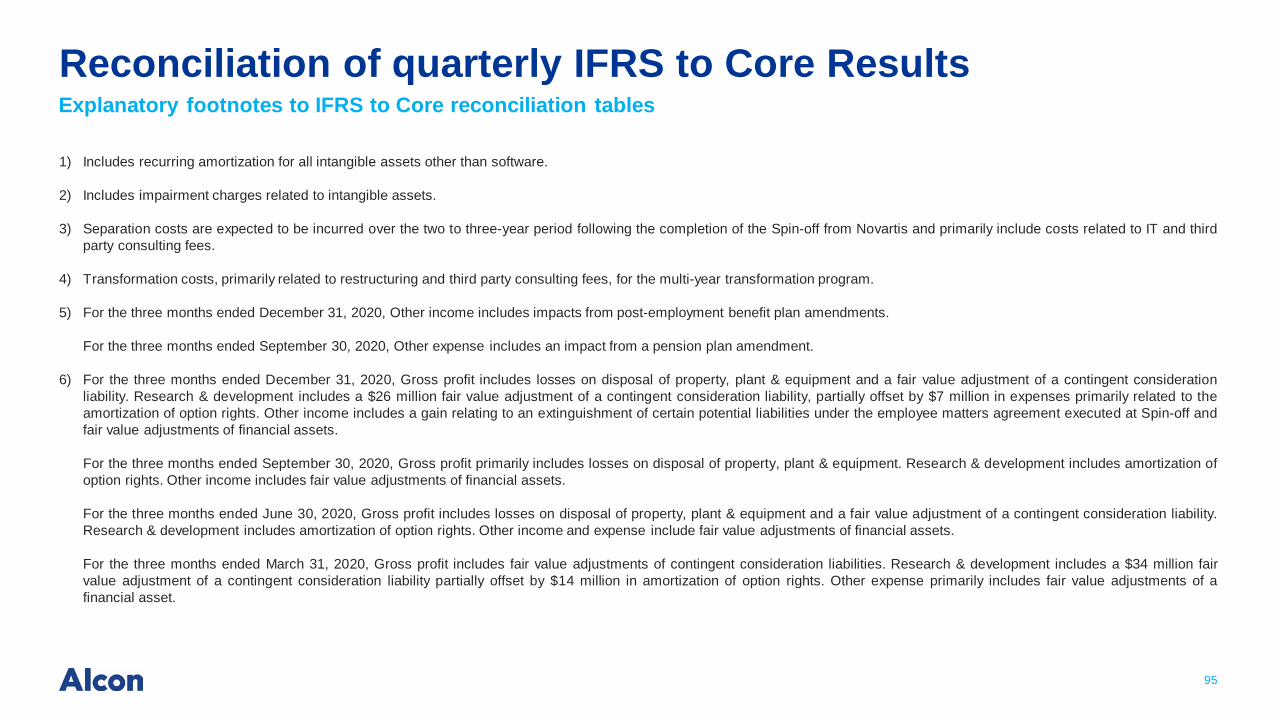
1) Includes recurring amortization for all intangible assets other than software.
2) Includes impairment charges related to intangible assets.
3) Separation costs are expected to be incurred over the two to three-year period following the completion of the Spin-off from Novartis and primarily include costs related to IT and thirdparty consulting fees.
4) Transformation costs, primarily related to restructuring and third party consulting fees, for the multi-year transformation program.
5) For the three months ended December 31, 2020, Other income includes impacts from post-employment benefit plan amendments.
For the three months ended September 30, 2020, Other expense includes an impact from a pension plan amendment.
6) For the three months ended December 31, 2020, Gross profit includes losses on disposal of property, plant & equipment and a fair value adjustment of a contingent considerationliability. Research & development includes a $26 million fair value adjustment of a contingent consideration liability, partially offset by $7 million in expenses primarily related to theamortization of option rights. Other income includes a gain relating to an extinguishment of certain potential liabilities under the employee matters agreement executed at Spin-off andfair value adjustments of financial assets.
For the three months ended September 30, 2020, Gross profit primarily includes losses on disposal of property, plant & equipment. Research & development includes amortization ofoption rights. Other income includes fair value adjustments of financial assets.
For the three months ended June 30, 2020, Gross profit includes losses on disposal of property, plant & equipment and a fair value adjustment of a contingent consideration liability.Research & development includes amortization of option rights. Other income and expense include fair value adjustments of financial assets.
For the three months ended March 31, 2020, Gross profit includes fair value adjustments of contingent consideration liabilities. Research & development includes a $34 million fairvalue adjustment of a contingent consideration liability partially offset by $14 million in amortization of option rights. Other expense primarily includes fair value adjustments of afinancial asset.
Explanatory footnotes to IFRS to Core reconciliation tables

96
Reconciliation of quarterly IFRS to Core Results
7) For the three months ended December 31, 2020, total tax adjustments of $38 million include tax associated with operating income core adjustments and discrete tax items. Taxassociated with operating income core adjustments of $146 million totaled $25 million with an average tax rate of 17.1%. Core tax adjustments for discrete items totaled $13 million,primarily related to a change in estimate related to periods prior to the Spin-off.
For the three months ended September 30, 2020, total tax adjustments of $68 million include tax associated with operating income core adjustments and discrete tax items. Taxassociated with operating income core adjustments of $408 million totaled $65 million with an average tax rate of 15.9%.
For the three months ended June 30, 2020, total tax adjustments of $68 million include tax associated with operating income core adjustments and discrete tax items. Tax associatedwith operating income core adjustments of $387 million totaled $67 million with an average tax rate of 17.3%.
For the three months ended March 31, 2020, total tax adjustments of $54 million include tax associated with operating income core adjustments and discrete tax items. Tax associatedwith operating income core adjustments of $330 million totaled $64 million with an average tax rate of 19.4%. Core tax adjustments for discrete items totaled $10 million, primarilyrelated to tax expense from the delayed spin of a legal entity.
8) For the three months ended December 31, 2020, core basic earnings per share was calculated using the weighted-average shares of common stock outstanding during the period.Core diluted earnings per share also contemplate dilutive shares associated with unvested equity-based awards as described in Note 5 to the Q4 2020 Condensed ConsolidatedInterim Financial Statements.
For the three months ended September 30, 2020, core basic earnings per share was calculated using the weighted-average shares of common stock outstanding during the period.Core diluted earnings per share also contemplate dilutive shares associated with unvested equity-based awards as described in Note 5 to the Q3 2020 Condensed ConsolidatedInterim Financial Statements.
For the three months ended June 30, 2020, core basic and diluted loss per share are calculated using the weighted-average shares of common stock outstanding during the period.
For the three months ended March 31, 2020, core basic earnings per share was calculated using the weighted-average shares of common stock outstanding during the period. Corediluted earnings per share also contemplate dilutive shares associated with unvested equity-based awards as described in Note 5 to the Q1 2020 Condensed Consolidated InterimFinancial Statements.
Explanatory footnotes to IFRS to Core reconciliation tables

97
Reconciliation of annual IFRS to Core Results
($ millions except (loss)/earnings per share)IFRS
results
Amortization of certain intangible
assets(1) Impairments(2)Separation
costs(3)Transformation
costs(4)
Post-employment
benefits(5)Other
items(7)Core
results
Gross profit 2,940 1,001 106 13 - - 32 4,092
Operating (loss)/income (482) 1,021 167 217 49 (154) (29) 789(Loss)/income before taxes (635) 1,021 167 217 49 (154) (29) 636Taxes(8) 104 (172) (34) (37) (10) 38 (13) (124)Net (loss)/income (531) 849 133 180 39 (116) (42) 512
Basic (loss)/earnings per share ($) (1.09) 1.05
Diluted (loss)/earnings per share ($) (1.09) 1.04
Basic - weighted average shares outstanding (millions)(9)
489.0 489.0
Diluted - weighted average shares outstanding (millions)(9)
489.0 491.8
Adjustments to arrive at core operating incomeSelling, general & administration (2,694) - - 22 - - - (2,672)Research & development (673) 20 61 - - - (25) (617)Other income 235 - - - - (166) (36) 33Other expense (290) - - 182 49 12 - (47)
Refer to the associated explanatory footnotes at the end of the 'Reconciliation of annual IFRS to Core Results' tables.
Twelve months ended December 31, 2020

98
Reconciliation of annual IFRS to Core Results
($ millions except (loss)/earnings per share)IFRS
resultsAmortization of certain
intangible assets(1)Separation
costs(3)Transformation
costs(4)Legal
items(6)Other
items(7)Core
results
Gross profit 3,662 1,007 10 - - (16) 4,663
Operating (loss)/income (187) 1,040 237 52 32 91 1,265(Loss)/income before taxes (332) 1,040 237 52 32 91 1,120Taxes(8) (324) (140) (54) (7) (8) 338 (195)Net (loss)/income (656) 900 183 45 24 429 925
Basic (loss)/earnings per share ($) (1.34) 1.89
Diluted (loss)/earnings per share ($) (1.34) 1.89
Basic - weighted average shares outstanding (millions)(9) 488.2 488.2
Diluted - weighted average shares outstanding (millions)(9)
488.2 490.1
Adjustments to arrive at core operating income
Selling, general & administration (2,847) - 30 - - 15 (2,802)Research & development (656) 33 4 - - 35 (584)Other income 55 - - - - (9) 46Other expense (401) - 193 52 32 66 (58)
Refer to the associated explanatory footnotes at the end of the 'Reconciliation of annual IFRS to Core Results' tables.
Twelve months ended December 31, 2019

99
Reconciliation of annual IFRS to Core Results
1) Includes recurring amortization for all intangible assets other than software.
2) Includes impairment charges related to intangible assets.
3) Separation costs are expected to be incurred over the two to three-year period following the completion of the Spin-off from Novartis and primarily include costs related to IT and thirdparty consulting fees.
4) Transformation costs, primarily related to restructuring and third party consulting fees, for the multi-year transformation program.
5) For the twelve months ended December 31, 2020, Other income and other expense include impacts from pension and other post-employment benefit plan amendments.
6) Includes legal settlement costs and certain external legal fees.
7) For the twelve months ended December 31, 2020, Gross profit includes $35 million primarily for losses on disposal of property, plant & equipment partially offset by $3 million in fairvalue adjustments of contingent consideration liabilities. Research & development includes $60 million in fair value adjustments of contingent consideration liabilities, partially offset by$35 million in expenses primarily related to the amortization of option rights. Other income includes a gain relating to an extinguishment of certain potential liabilities under theemployee matters agreement executed at Spin-off and fair value adjustments of financial assets.
For the twelve months ended December 31, 2019, Gross profit includes $37 million in fair value adjustments of contingent consideration liabilities, partially offset by $21 million in spinreadiness costs, manufacturing sites consolidation activities, and integration of recent acquisitions. Selling, general & administration primarily includes spin readiness costs and theintegration of recent acquisitions. Research & development includes $73 million for the amortization of option rights, post-marketing study following a product's voluntary marketwithdrawal, and the integration of recent acquisitions, partially offset by $38 million in fair value adjustments for contingent consideration liabilities. Other income primarily includes arealized gain on a financial asset. Other expense primarily includes spin readiness costs, fair value adjustments of a financial asset and other items.
Explanatory footnotes to IFRS to Core reconciliation tables

100
Reconciliation of annual IFRS to Core Results
8) For the twelve months ended December 31, 2020, total tax adjustments of $228 million include tax associated with operating income core adjustments and discrete tax items. Taxassociated with operating income core adjustments of $1.3 billion totaled $221 million with an average tax rate of 17.4%. Core tax adjustments for discrete items totaled $7 million.
For the twelve months ended December 31, 2019, total tax adjustments of $129 million include tax associated with operating income core adjustments and discrete tax items. Taxassociated with operating income core adjustments of $1.5 billion totaled $215 million with an average tax rate of 14.8%. Core tax adjustments for discrete items totaled $344 million,primarily including $304 million in non-cash tax expense for re-measurement of deferred tax balances as a result of Swiss tax reform, tax expense related to rate changes in the USfollowing legal entity reorganizations executed related to the Spin-off, non-cash tax expense related to the re-measurement of deferred tax assets and liabilities following a tax ratechange in India, and net changes in uncertain tax positions.
9) Core basic earnings per share was calculated using the weighted-average shares of common stock outstanding during the period. Core diluted earnings per share also contemplatedilutive shares associated with unvested equity-based awards as described in Note 5 to the Q4 2020 Condensed Consolidated Interim Financial Statements.
Explanatory footnotes to IFRS to Core reconciliation tables

101
Reconciliation of Free Cash Flow
($ millions) 2019
Net cash flows from operating activities 920
Purchase of property, plant & equipment (553)
Proceeds from sale of property, plant & equipment -
Free cash flow 367
The following is a summary of Alcon free cash flow for the twelve months ended December 31, 2019 together with a reconciliation to net cash flows from operating activities, the most directly comparable IFRS measure:

102
Glossary of acronymsATIOL Advanced Technology Intraocular LensBD&L Business, Development & Licensingbps basis pointsCAPEX Capital ExpenditureCAGR Compound Annual Growth RateEDOF (or EDF) Extended Depth of FocusEMR Electronic Medical RecordFDA Food and Drug AdministrationG&A General & Admistrative ExpenseIOL Intraocular LensIOP Intraocular PressureMDPF Multi-Dose Preservative-FreeOR Operating RoomOTC Over-the-CounterPCIOL Presbyopia Correcting Intraocular LensP&L Profit & LossSiHy Silicone HydrogelTSA Transition Service Agreement