2.500 desalination and water purification desalination and water purification more than 1 billion...
TRANSCRIPT

MIT OpenCourseWarehttp://ocw.mit.edu
2.500 Desalination and Water Purification Spring 2009
For information about citing these materials or our Terms of Use, visit: http://ocw.mit.edu/terms.

2.500 Desalination & Water Purification
Spring 2009
Tuesday/Thursday 1:00-2:30 Professor John H Lienhard VProfessor John H. Lienhard V
Ghana
Figure from Wilf, M., and M. Balaban. Membrane Desalination and Membrane Filtration. L'Aquila, Italy: European Desalination Society, 2007. Used with permission.
Photo by Amy Smith. Used with permission.

2.500 Desalination and Water Purification
More than 1 billion people lack access to clean drinking waterdrinking water
Half the hospital beds in the world are occupied by patients with easily prevented water-borne disease Half the pp people in the world do not have sanitation systems as good as those in Ancient Rome.
In 2000, unsafe water mortality amounted to 80 million years of lost life (Science, 25 Jan 2008)
This situation is expected to get WORSE. Tanzania
2
Image from Wikimedia Commons,
Yangon, Myanmar
May 2008 …after cyclone
Images removed due to copyright restrictions. Please see http://www.nytimes.com/slideshow/2008/05/05/world/0505-MYANMAR_index.html http://graphics8.nytimes.com/images/2008/05/05/nytfrontpage/23097528.JPG
Photo source: The New York Times 7 May 2008The New York Times, 7 May 2008

Images removed due to copyright restrictions. Please see: http://www.flickr.com/photos/andrewheavens/100063338/
http://jimbicentral.typepad.com/photos/uncategorized/2007/09/18/water_scarcity.jpg
Sources: postnewsline.com; Andrew Heavens (flickr.com). 4

Latin America and Caribbean 6%
Europe 2%
Africa 27%
Asia 65%
Water supply, distribution of unserved populations
Figure by MIT OpenCourseWare.

6
100
80
60
40
20
0Africa Asia Latin
America& Caribbean
Oceania Europe North America
House or yard connection for water Connected to sewer
%
Figure by MIT OpenCourseWare.

7

Water stress means that the annual
water supply is below 1700 m3 per person.
Water scarcity means that themeans that the
annual water supply is below 1000 m3 per
person.p
Source: Gardener-Outlaw & Engelman
Source: Gardner-Outlaw, Tom, and Robert Engelman. "Sustaining Water, Easing Scarcity: A Second Update." Population Action International, May 1997. (PDF)
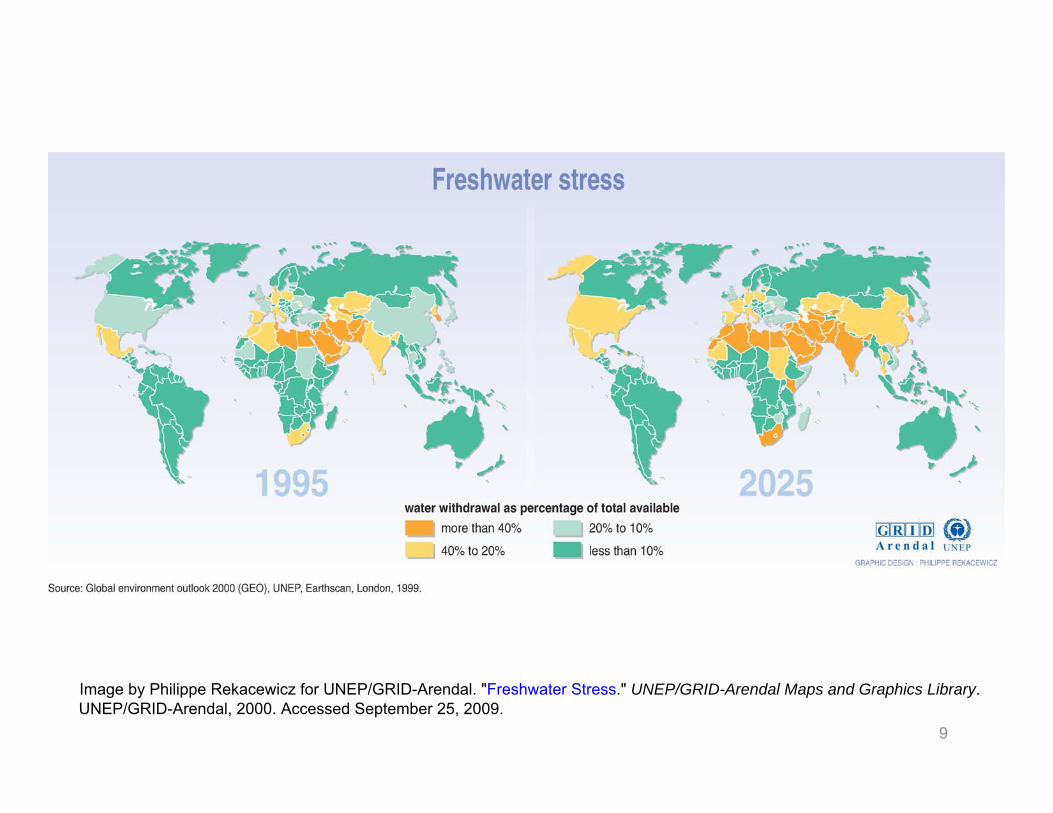
Image by Philippe Rekacewicz for UNEP/GRID-Arendal. "Freshwater Stress." UNEP/GRID-Arendal Maps and Graphics Library. UNEP/GRID-Arendal, 2000. Accessed September 25, 2009.
9

UNEP/GRID-Arendal. "Areas of Physical and Economic Water Scarcity." 10 UNEP/GRID-Arendal Map and Graphics Library. UNEP/GRID-Arendal, 2008. Accessed September 25, 2009.

Aral Sea – water diverted for agriculture Image from NASA Earth Observatory.
Source: infranetlab.org 11

World Insolation (kWh/m2-day)
12
1.0-1.9 2.0-2.9 3.0-3.9 4.0-4.9 5.0-5.9 6.0-6.90.0-0.9
Figure by MIT OpenCourseWare.

Source: Wikipedia
Image from Tobler, W., et al. "The Global Demography Project."TR-95-6. Santa Barbara, CA: National Center for Geographic Information Analysis, 1995.Image is in the public domain.
13

14
UNEP/GRID-Arendal. "Areas of Physical and Economic Water Scarcity." UNEP/GRID-Arendal Map and Graphics Library. UNEP/GRID-Arendal, 2008. Accessed September 25, 2009.

Per capita water consumption (m3/y)
Worldwide average NigeriaNigeria China Mexico ItalyItaly USA
World desalting capacity World desalting capacity
800
5050
300
800 10001000
2000
22
Source: Science, v. 319, 25 Jan 2008

laist.com
Cleaning a sidewalk in Long Beach, CA 16
Image removed due to copyright restrictions. Please see: http://www.flickr.com/photos/peggyarcher/975676140/in/set-72157601398334771/

Industrial 59%
Industrial 10%
Competing water uses (low-and middle-income countries)
Agricultural 82%
Agricultural 30%
Domestic 11%Domestic 8%
Competing water uses(high-income countries)
Figure by MIT OpenCourseWare.
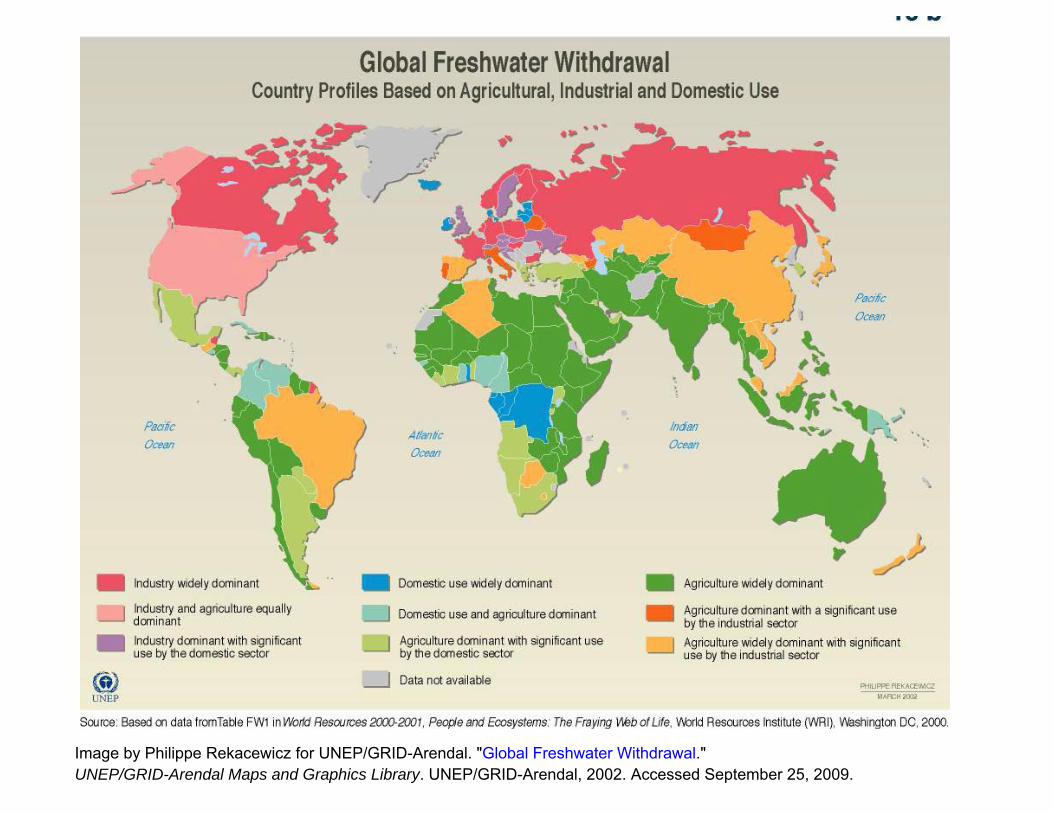
Image by Philippe Rekacewicz for UNEP/GRID-Arendal. "Global Freshwater Withdrawal." UNEP/GRID-Arendal Maps and Graphics Library. UNEP/GRID-Arendal, 2002. Accessed September 25, 2009.

Author’s definition of “waste” is not clear; however, it is common for municipal water distribution systems to lose 20 to 40% of water by leakage.
19Image by Philippe Rekacewicz for UNEP/GRID-Arendal. "Trends and Forecasts in Water Use, by Sector." UNEP/GRID-Arendal Maps and Graphics Library. UNEP/GRID-Arendal, 2002. Accessed September 25, 2009.
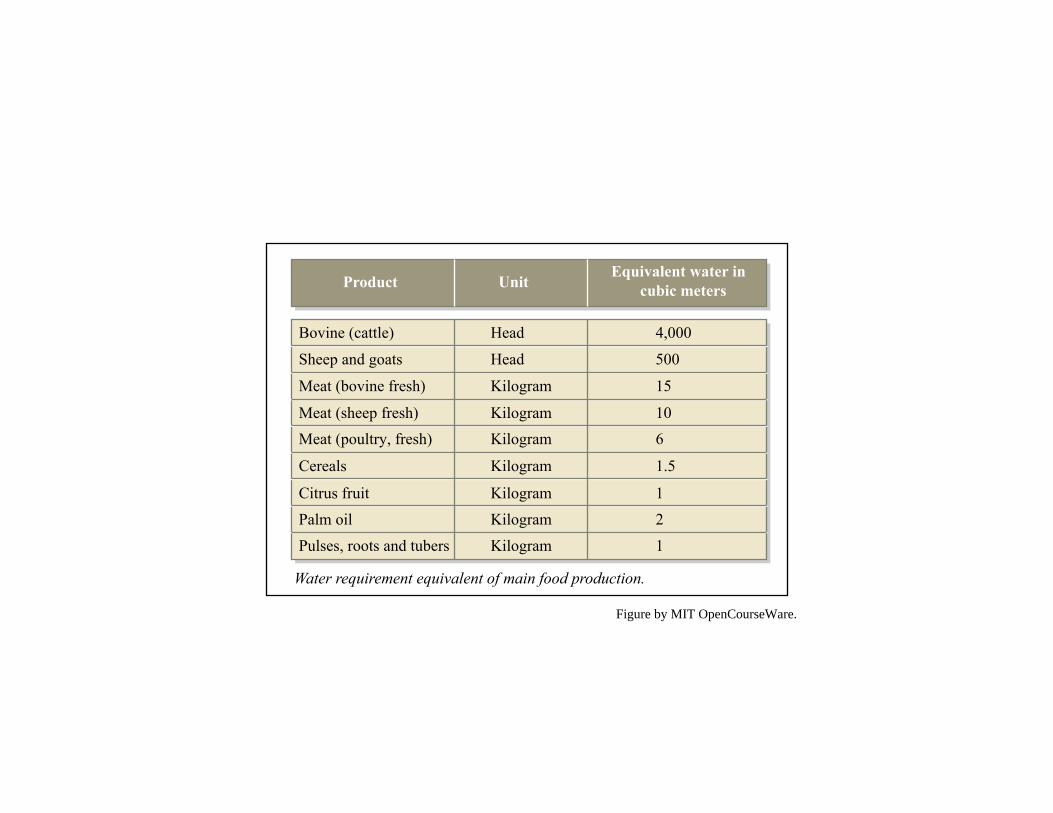
Product UnitEquivalent water in
cubic meters
Bovine (cattle)
Sheep and goats
Meat (bovine fresh)
Meat (sheep fresh)Meat (poultry, fresh)
Cereals
Citrus fruit
Palm oil
Pulses, roots and tubers
Head
Head
Kilogram
KilogramKilogram
Kilogram
Kilogram
Kilogram
Kilogram
4,000
500
15
106
1.5
1
2
1
Water requirement equivalent of main food production.
Figure by MIT OpenCourseWare.

Bottled waterexpportation…
…andand importation
Image by Emmanuelle Bournay. "Major Bottled Water Exporters and Importers."UNEP/GRID-Arendal Maps and Graphics Library. UNEP/GRID-Arendal, 2006. Accessed September 25, 2009.
21

consume
t t
Many countries that consume larglar ege
amounts of bottled water have excellent
tap water…
Image by Emmanuelle Bournay. "Total Bottled Water Consumption." UNEP/GRID-Arendal Maps and Graphics Library. UNEP/GRID-Arendal, 2006. Accessed September 25, 2009.
22

(Ground water: lakes, etc.)
(Precipitation over land)
Approximately 23% of renewable water is appropriated for human uses, including agriculture Accessible annual run off is about 12 500 km3/y of whichincluding agriculture. Accessible annual run-off is about 12,500 km3/y, of whichabout 54% is acquired for human use.
Courtesy of Sandia National Labs. Used with permission. Source: Miller, 2003.

d
Water flows (km3/y)Water flows (km /y)
Precipitation on land Available river flow and h
120,000 recharge
12,000
• Evaporation on land 70,000
• River runoff and groundwater
• Withdrawal for human use • Agriculture 3,500
g recharge 50,000
• Industry 1,000 • Domestic 500
Source: Science, v. 319, 25 Jan 2008 World desalting capacity = 13 km3/y

Source: Sommariva,2007
Figures from Wilf, M., and M. Balaban. Membrane Desalination and Membrane Filtration. L'Aquila, Italy: European Desalination Society, 2007. Used with permission.
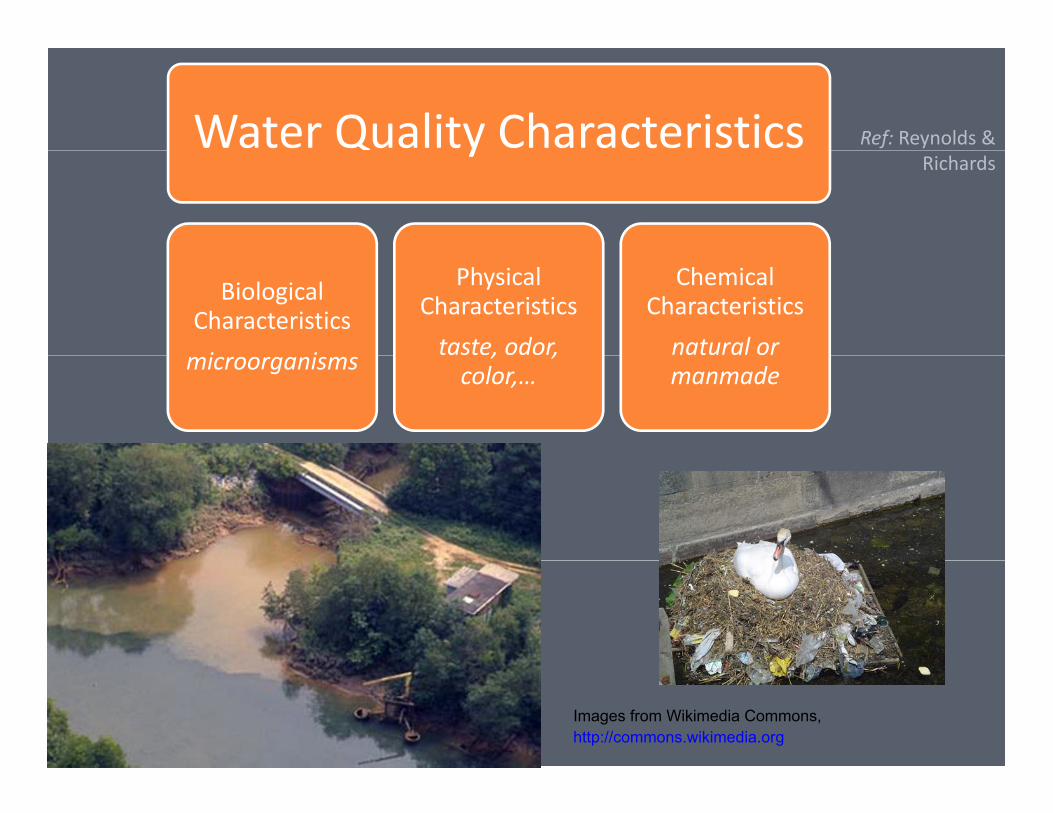
QWater Quality Characteristics Ref: Reynolds &
y Richards
Biological Characteristics
i i
Physical Characteristics
taste, odor,
Chemical Characteristics
natural or microorganisms , , color,… manmade
Images from Wikimedia Commons, http://commons.wikimedia.org

•
•
•
Bi l i l
• Bacteria • Viruses • ProtozoaProtozoa • Coliform bacteria (indicate human waste) • Helminths • Fungi algae
Biological Fungi, algae
• Total solids (dissolved and suspended) • TurbidityTurbidity • Color (apparent and true) • Taste & odor (organic compounds in surface water; dissolved gases in ground water)
Physical water; dissolved gases in ground water)
• Temperature
• pHp• Anions & cations (dissolved solids) • Alkalinity (HCO3
‐, CO3 2+,OH‐ system)
• Hardness (Ca2+, Mg2+)Chemical ( g ) • Dissolved gases (O2, CO2, H2S, NH3, N2,CH4…) • Priority pollutants (organic and inorganic) 27

fMicrobial contamination is the
#1 concern for water • Protozoans
– Amoeba, cryptosporidium, giardia, algae,… • Bacteria
– Salmonella, typhus, cholera, shigella, … Salmonella, typhus, cholera, shigella, … • Viruses
– Polio, hepatitis A, meningitis, encephalitis,… • Helminths • Helminths
– Guinea worm, hookworm, roundworm,…
• Principal transmission is by human waste • Principal purification technique is chlorination, especially
for bacteria.
Ref: Faust and Aly, 1998. 28

Some water borne diseases can be eradicated…
…3,500,000 cases of Guinea worm in 19861986….
…<5000 cases in 2008…
29
…80% in Sudan.
Courtesy of The Carter Center. Used with permission.

, y, g , ,
t
Physical characteristicsPhysical characteristics
• Suspended solids include silt, clay, algae, colloids,p bacteria…remove by settling, filtration, or flocculation
• Turbidity interferes with passage of light, usually as the result of colloidal material
• Color is due to dissolved (true color) or colloidal ( l ) t i l i l(apparent color) material…iron, manganese, clay,…
• Taste/odor …typically treated by aeration (to release dissolved gas from ground water) or activated carbondissolved gas from ground water) or activated carbon (to remove organics from surface water)
30

EPA Primary Standards for ~130 chemicals EPA Primary Standards for 130 chemicals
• Toxic metals – Arsenic, lead, mercury, cadmium, chromium,…
• Organic compounds – insecticides, herbicides, PCBs, petrochemicals, PAH, benzene, halogenated hydrocarbons,…very long listlong list
• Nitrate or nitrite – fertilizer byproduct
• Fluorine – damages teeth and bones at high concentrations
• Radionuclides – mainly natural alpha emitters…
• Secondary standards for taste, odor, appearance: Cl‐, SO4 2‐, pH, 4
color, odor, iron, manganese, copper, zinc, foaming agents…
Ref: WHO, 2006. 31

Source: Twort et al.
32
0.0001 µm 0.001 µm 0.01 µm 0.1 µm 1 µm 10 µm 100 µm
Comparison of treatment methods with particle size.
Micro filtration
Sand filtration
Ultra filtration
Nano filtration
Reverse osmosis
Dissolved saltsCa, Mg, Na
Organic compounds
Viruses
Organic macromolecules
Colloids
Bacteria
Protozoanparasites
∆p
Algae
Figure by MIT OpenCourseWare.
water and deh dration. Seawater contains
Why not drink seawater?Why not drink seawater?
• Seawater is usually about 3.5% by weightSeawater is usually about 3.5% by weight dissolved salts (35000 ppm)
• Human blood has the [osmotic] equivalent ofHuman blood has the [osmotic] equivalent of about 0.9% salinity (~9000 ppm)
• Ingesting too much salt leads to excretion of water and dehydration. Seawater containsy about 3x more dissolved salts than human blood. You can’t drink it. It also tastes bad.
33

S li i TDS S li i TDS
Characterization of Water SalinityCharacterization of Water Salinity
Minimum Maximum Salinity, TDS [ppm or mg/kg]
Salinity, TDS [ppm or mg/kg]
S t 15 000 50 000 Seawater 15,000 50,000
Brackish water 1 500 15 000 Brackish water 1,500 15,000
River water 500 1,500River water
(brackish)
500 1,500
Pure water 0 500Pure water 0 500
After Fritzmann, 2007 34

(1982) 35
Courtesy of Robert H. Stewart. Used with permission.

Substance (amounts in mg/kg) (amounts in mg/kg)
Standard Seawater Seawater
Cambridge City Water City Water
Massachusetts Water Resources Water Resources
Authority
Poland SpringsSprings
Bottled Water
Maximum Allowable Allowable
Sodium, Na+ 10781 79 30 2.6-5.6 aesthetics: 200
Magnesium, Mg2+ 1284 5 0.8 0.7-1.9 -
C l i C 2+ Calcium, Ca2+ 412412 2525 4 54.5 3 5 9 53.5-9.5 -
Potassium, K+ 399 nr[1] 0.9 0.74-0.88 -
Strontium, Sr+ 13 nr nr nr -
Chloride, Cl- 19353 140 21 1.5-6.6 250
Sulfate, SO4 2- 2712 27 8 0.87-5.9 250
Bicarbonate, HCO3 - 126 nr nr 13-28 -
Bromide, Br- 67 nr 0.016 not detected -
Boric Acid B(OH) Boric Acid, B(OH)3 2626 nrnr nrnr nrnr -
Fluoride, Fl- 1.3 1 1 0.0-0.27 2-4
Water 965000 - - - -
Total dissolved solids 35200 320 110 33-57 500
Nitrate, NO3 0.46 0.11 0.12-0.42 10
Retail Cost, US$/m3 free? 1.05 1.18 ~300 to 3000 -
[1] nr = not reported.
36

t
Substance (amounts in mg/kg)
Standard Seawater
High Salinity Brackish
W tWater
Low Salinity Brackish
W tWater
Massachusetts Water Resources
A th iAuthority Sodium, Na+ 10781 1837 90 30
Magnesium, Mg2+ 1284 130 11.7 0.8
Calcium Ca2+ Calcium, Ca2+ 412412 105105 9696 4 54.5
Potassium, K+ 399 85 6.5 0.9
Strontium, Sr+ 13 nr nr nr
Chloride, Cl-Chloride, Cl 1935319353 29702970 191191 2121
Sulfate, SO4 2- 2712 479 159 8
Bicarbonate, HCO3 - 126 250 72.6 nr
Bromide, Br- 67 nr nr 0.016
Boric Acid, B(OH)3 26 nr nr nr
Fluoride, Fl- 1.3 1.4 0.2 1
SiO2 2 17 24 3.3
Nitrate, NO3 nr 5.0 nr 0.11
Total dissolved solids 35200 5881 647 110
Brackish compositions are representative; from M. Wilf, 2007 37

t
Seawater purification
Fresh waterWork
Desalination
Seawater
Concentrated
system
Concentrated brine
Ideally, this requires 2.5 to 7 kJ per kg fresh water produced.
PPracti ticall lly, it t it takkes an ordder off magnit itudde more energy.
38

N fil i (NF)
M l i ff di ill i (MED MEE)
Principal desalination techniquesPrincipal desalination techniques
• Membrane techniques – Reverse osmosis (SWRO or BWRO) – Electrodialysis (ED) – Capacitative deionization (CDI) – Nanofiltration (NF)
• Distillation techniques – Multistage flash evaporation (MSF) – Multieffect distillation (MED or MEE) – Vapor compression distillation – Solar thermal distillation (concentrating or not)
• Related methods • Related methods – Deionization – Water softening
39

Installed desalination cappacityy
Waste 6% Pure 5%
Brine <1% Unknown <1%
Seawater 7% Pure 7%
Brine <1% Unknown <1% S O
Seawater 7% River 26%
Waste 9%U R C
Seawater 55%River 9% Brackish 24%
Brackish 51%USGlobal
C E
PV C i 3% Multi-Effect Distillation 2% Nano Filtration 15%
Ref: Wagnick/ GWI 2005
P R O C
Electrodialysis 5%
Vapor Compression 3% Others 2%
Vapor Compression 3% Multi-Effect Distillation 1%
Others 2% Nano-Filtration 15%
C E S
Multi-Stage Flash 40%
Multi-Stage Flash 1%
Electrodialysis 9%
Park Center for Complex SystemsPark Center for Complex SystemsMassachusetts Institute of TechnologyMassachusetts Institute of Technology
4040
USGlobal SReverse Osmosis 44% Reverse Osmosis
69% Ref: Wagnick/ GWI 2005
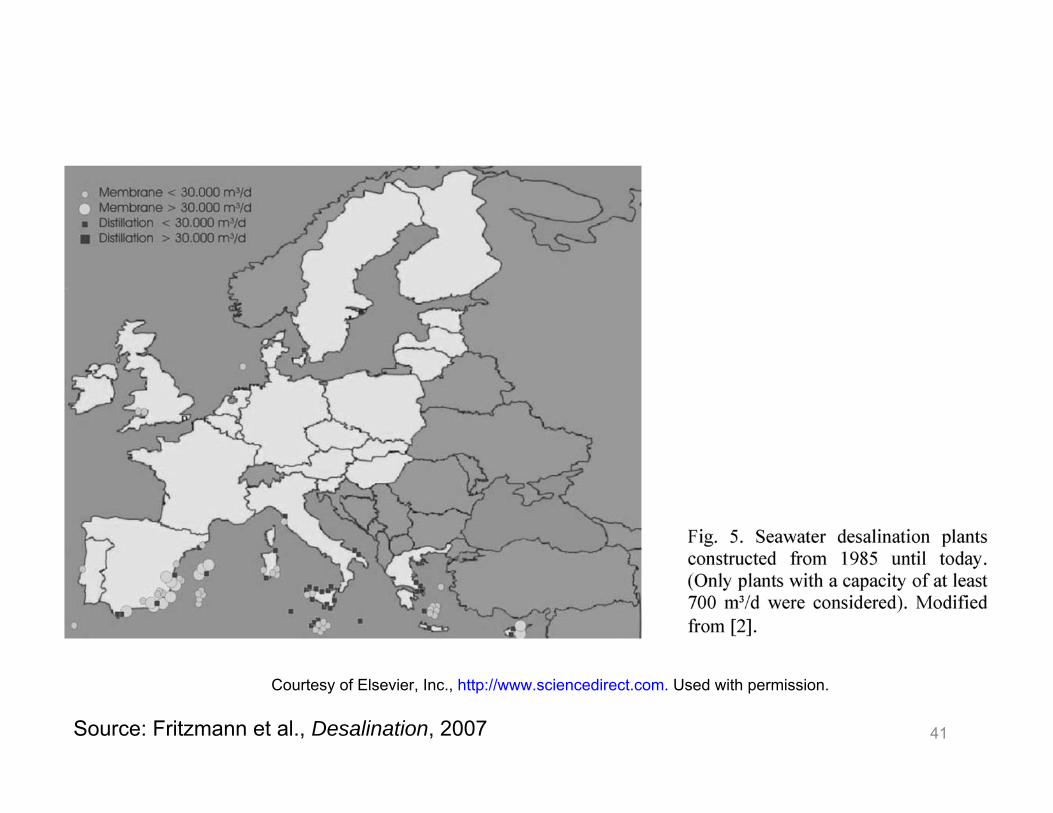
Courtesy of Elsevier, Inc., http://www.sciencedirect.com. Used with permission.
Source: Fritzmann et al., Desalination, 2007 41

42
Brine heater
Steam from boiler
Condensate to boiler
Brine Brine
SteamSteamSteam
Brine Blowdown 42oC
Product water
Seawater feed
Chemical injection
Flash evaporation and heat recoveryHeating
90.6OC
1) Multi Stage Flash - MSF
Figure by MIT OpenCourseWare.

Ref: Sommariva, 2007
Courtesy of Corrado Sommariva. Used with permission.

Courtesy of Elsevier, Inc., http://www.sciencedirect.com. Used with permission.
Source: Fritzmann et al., 2007 44

Courtesy of Dennis Freeman, Martha Gray, and Alexander Aranyosi. Used with permission. Please also see: http://images.encarta.msn.com/xrefmedia/aencmed/targets/illus/ilt/0007ff2f.gif
Osmosis to achieve equilibrium water will Osmosis. to achieve equilibrium, water will diffuse through a semi-permeable membrane into a solution. This occurs until sufficient hyydrostatic ppressure developps to offset the osmotic pressure Sources:
http://encarta.msn.com (left) http://library.tedankara.k12.tr/
Image removed due to copyright restrictionsPlease see:http://library.tedankara.k12.tr/chemistry/vol1/balances/trans76.jpg

Courtesy of Elsevier, Inc., http://www.sciencedirect.com. Used with permission.
If pressure is applied to the solution, the direction of osmotic flow can be reversed. In this way solvent can be driven through the membrane, purifying it.
Source: Fritzmann et al., 2007 46

Source: Sommariva,2007 Figures from Wilf, M., and M. Balaban. Membrane Desalination and Membrane Filtration. L'Aquila, Italy: European Desalination Society, 2007. Used with permission.

First stage has 32 pressure vessels; second stage has 14 (Wilf & Balaban ,2007)
Figures from Wilf, M., and M. Balaban. Membrane Desalination and Membrane Filtration. L'Aquila, Italy: European Desalination Society, 2007. Used with permission.

CONVENTIONAL ELECTRODIALYSIS
The process principle
+
Courtesy of Heiner Strathmann. Used with permission.
ions are removed from a feed solution and concentrated in alternating cells a cation and an anion-exchange membrane, and a diluate and concentrate cell form a cell pair
Strathmann, 2007

CONVENTIONAL ELECTRODIALYSIS
The electrodialysis stack
Courtesy of Heiner Strathmann. Used with permission.
an electrodialysis stack is composed of 100 to 400 cell pairs between electrode 50compartments Strathmann, 2007

CONVENTIONAL ELECTRODIALYSIS
Water desalination costs Process principles of electrodialysis
reverse and reverse osmosis
sea water brackish surface tt waterwater
ion-exchange electrodialysis osmosis cost 10.0-------------
-
p ++++
+++
-
++
+++
[€]
distillation distillation
H2O1.0 + +
0.1 + H2O
0.1 1 10 100 feed water cncentration [g/L] electrodialysis reverse osmosis
+
iirreversibl ible energy loss i ibl ll irreversible energy loss proportional to ion transport proportional to water costs estimated for a required product
= zi F Ci U V) transport ( Eirr )concentration of < 0.2 g/L (200 ppm) (Eirr = p Vwater
Strathmann, 2007 Courtesy of Heiner Strathmann. Used with permission.

Solar Distillation
Optimally bad?
~ 1 L/m2-day
..obvious improvements… …multiple glazing to control IR and convective loss… 52
Refs: Ettouney & Rizzuti, 2006; Duffie & Beckman, 2006
Product
BrineSchematic of simple solar still.
Feed seawater
Water vapor
Sun radiation
ReflectionSolar radiation
2nd cover
1st cover
Absorber plateBond
Insulation
Sheet-and-tube solar collector.
Tube
Figure by MIT OpenCourseWare.
Figure by MIT OpenCourseWare.

Humidification‐ Preheated seawater Dehumidification Desalination (HDH)
Warm humid
i
Air heating,
open cycle air DehumidifierHumidifier
Dry air
Condensate
Solar Collector
y in
Air outBrine out Cold seawater
in 53
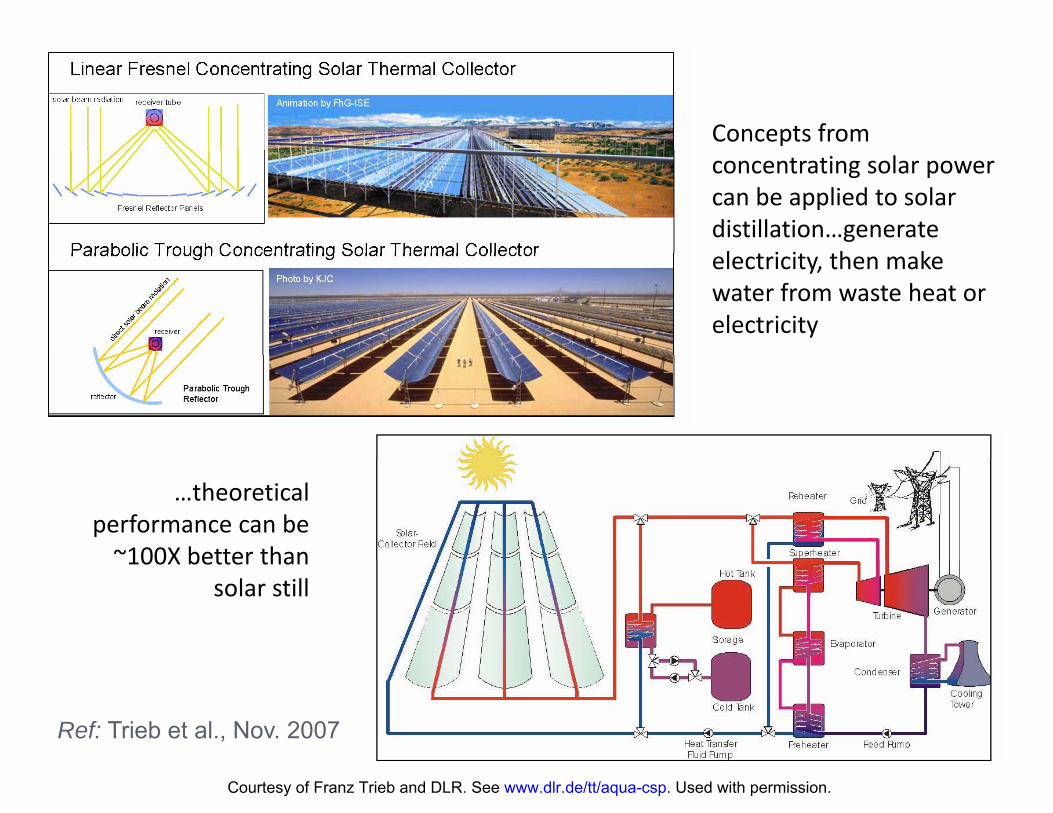
Concepts from concentrating solar power can be applied to solar distillation…generate ellectriiciity, thhen makke water from waste heat or electricity
…theoretical performance can be ~100X100X better thanbetter than
solar still
Ref: Trieb et al., Nov. 2007
Courtesy of Franz Trieb and DLR. See www.dlr.de/tt/aqua-csp. Used with permission.

, p
Major concerns in desalination systemsMajor concerns in desalination systems
• Cost: hardware, site development • Cost: energy consumption • Cost: maintenance
– Scaling, from precipitation of salts (has a controlling influence on design of thermal systems)
– Fouling from bacteria and other deposits Fouling, from bacteria and other deposits – Degradation of membranes – Corrosion of hardware
• Disposal of brine efflux, environmental impact
R li bili di ib i• Reliability, distribution,… 55

Figures from Wilf, M., and M. Balaban. Membrane Desalination and Membrane Filtration. L'Aquila, Italy: European Desalination Society, 2007. Used with permission.
Source: Sommariva,2007

Prices for consumers in office sppaces occupypy ingg 4180 m2 of city space and using 10,000 m3/y
57
Country $/M3
Germany
DenmarkBelgium
NetherlandsFrance
Italy
Finland
Ireland
Sweden
SpainU.S.A.
Australia
South Africa
Canada
United Kingdom
$1.91
$1.64$1.54
$1.25$1.23
$1.18
$0.76
$0.69
$0.63
$0.58
$0.57$0.51
$0.50
$0.47
$0.40
Figure by MIT OpenCourseWare.

Some notes on 2 500 this semesterSome notes on 2.500 this semester
Term pp jroject on ppurifyyingg villagge well water in Haiti (will be introduced in March)
Visit Koch Membrane Systems in Wilmington on Tuesday March 10Tuesday, March 10
Visit GE Ionics in Watertown on Friday, March 13 Final project presentations on Tuesday May 12
GRADING Approximately: homework (55%) term project (35%) Approximately: homework (55%), term project (35%),
class participation (10%)
Listeners must register as listeners 58
Listeners must register as listeners

on sReadings to accompany this lecture, all all on Website
Michael Specter, The Last Drop, The New Yorker, 23 October 2006, pp. 60-71. W t f P l W t f Lif UNESCO 2003 Water for People, Water for Life, UNESCO, 2003 (skim)
Section on Water Quality from Reynolds & Section on Water Quality from Reynolds & Richards, Unit Operations…,1995
EPA Primary Drinking Water Standards y g Peruse the other general articles on water if you
are interested…
59
Course

8. T. . Re nolds and P.A. Richar Unit and Processes in nvironmental ed.
‐
References 1. Water for People, Water for Life, United Nations World Water Development Report. Paris: UNESCO Paris: UNESCO 1. Water for People, Water for Life, United Nations World Water Development Report.
Publishing, 2003. 2. UNESCO Photobank, http://photobank.unesco.org/exec/index.htm 3. J.P. Holdren, “Science and Technology for Sustainable Well‐Being,” Science, 319 (25 Jan 2008) 424‐434. 4. United Nations Environment Program (UNEP), Maps and Graphics Library. http://maps.grida.no/ 5. T. Gardener‐Outlaw, R. Engelman, Sustaining Water, Easing Scarcity: A Second Update. Washington DC:
P l A i i l 1997Populatiion Action IInternational, 1997. 6. J.E. Miller, “Review of water resources and desalination technologies,” Sandi report SAND‐2003‐0800,
2003. Albuquerque: Sandia National Laboratory. 7. Water quality results obtained from web sites of the Massachusetts Water Resources Authority, the
Cambridge City Water Department, and the Poland Spring Water Company. 8. T.D. Reynolds and P.A. Richards, ds, Unit Operations and Processes in Environmental Engineeringngineering,, 2nd ed.y Operations
Boston: PWS Publishing Co., 1995. 9. A.C. Twort, D.D. Rathnayaka, and M.J. Brandt, Water Supply, 5th ed., IWA Publishing. 10. M. Wilf, The Guidebook to Membrane Desalination Technology. L’Aquila Italy: Balaban Desalination
Publications, 2007. 11. C. Fritzmann, J. Lowenberg, T. Wintgens, T. Melin, “State‐of‐the‐art reverse osmosis desalination,
Desalination 216 (2007) 1‐76Desalination, 216 (2007) 1 76. 12. M. Wilf and M. Balaban, Membrane Desalination and Membrane Water Filtration, European
Desalination Society intensive course notes, L’Aquila, Italy, February 2007. 13. S.D. Faust and O.M. Aly, Chemistry of Water Treatment, 2nd ed. Boca Raton: Lewis Publishers/CRC,
1998. 14. WHO Guidelines for drinking‐water quality, 3rd edition. Geneva: World Health Organization, 2006. 15. Seawater Salinity Graphic from Texas A&M University Physical Oceanographic Course Web site.
http://oceanworld.tamu.edu/resources/ocng_textbook/chapter06/chapter06_03.htm 16. M. Al‐Ghamdi, Saline Water Conversion Corporation: Challenge, Achievement, and Future Prospective.
Lecture notes, April 2006. 17. C. Sommariva, Short Course Notes on Reverse Osmosis Desalination, 2007. 1818. H Strathmann Electromembrane processes: State of the art processes and recent developments H. Strathmann, Electromembrane processes: State‐of‐the‐art processes and recent developments,
lecture notes, 2007. 19. Dr. Franz Trieb et al., Concentrating Solar Power for Seawater Desalination, German Aerospace Center
(DLR), Institute of Technical Thermodynamics, Nov. 2007. 60