2nd inventory and assessment of current and...
TRANSCRIPT
To assist in salmon recovery efforts in the marine nearshore, two bodies of work were undertaken.
1st The Marine Shoreline Inventory Report
2nd Inventory and Assessment of Current and Historic Beach Feeding Sources/ Erosion and Accretion Areas for the Marine Shorelines of WRIA 8 & 9
Thanks to the KCD for providing funding for both projects

MethodologyData were collected using photo interpretation of aerial orthogonal (USGS 2002, one foot resolution) and oblique photos (WADOE 2000)Data were collected at a 50 foot resolution within City of Seattle and 100 foot everywhere else.After pilot work, initial classification methods were field checked and modified.
Marine Shoreline Inventory Report-by Anchor Environmental

Data that was generated for WRIA 9 shorelines only
1. Substrate2. Marsh habitat3. Marine rails 4. Energy5. Boat ramps6. Freshwater inputs7. Marine riparian
vegetation (MRV)
8. Large woody debris 9. Shoreline armoring10. Impervious surfaces11. Overwater structures12. Net shore drift13. Jetties, breakwaters, and
groins14. Aquaculture/shellfish
harvest areas
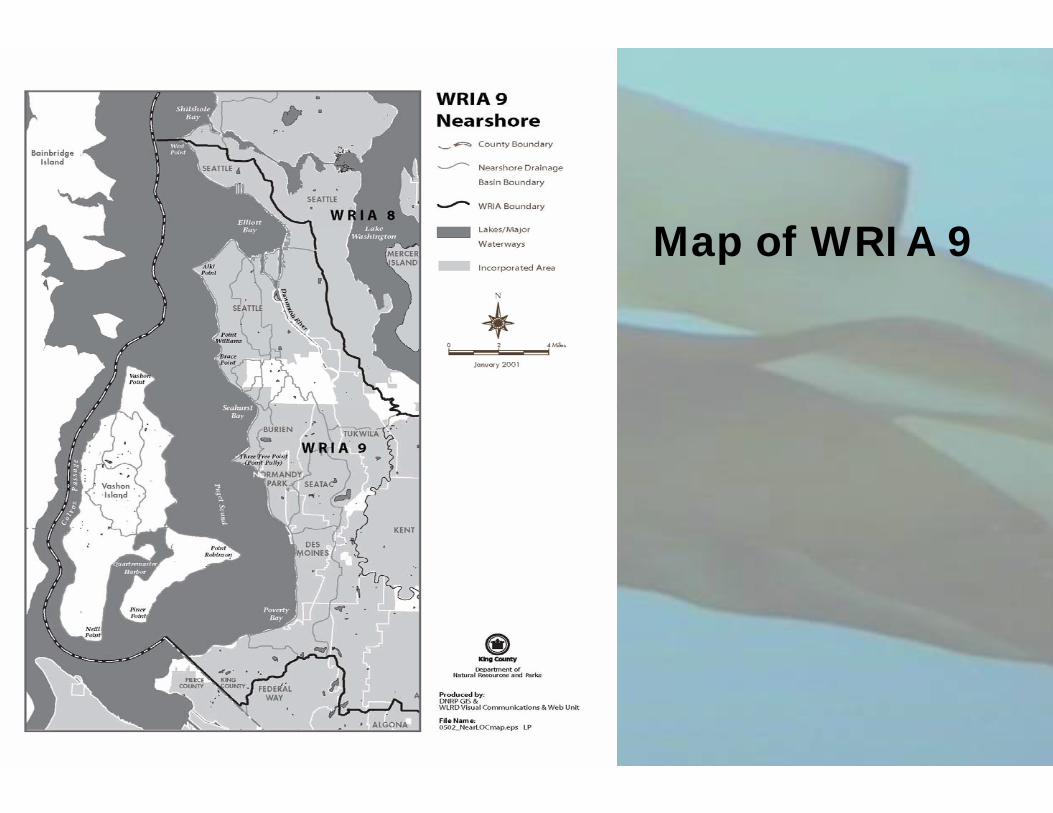
Map of WRIA 9

Armoring in WRIA 9
~90 miles of shoreline63% is armoredMainland is 80% armoredIslands are 50% armoredArmoring decreased as you got further away from Seattle, even though you get closer to Tacoma.
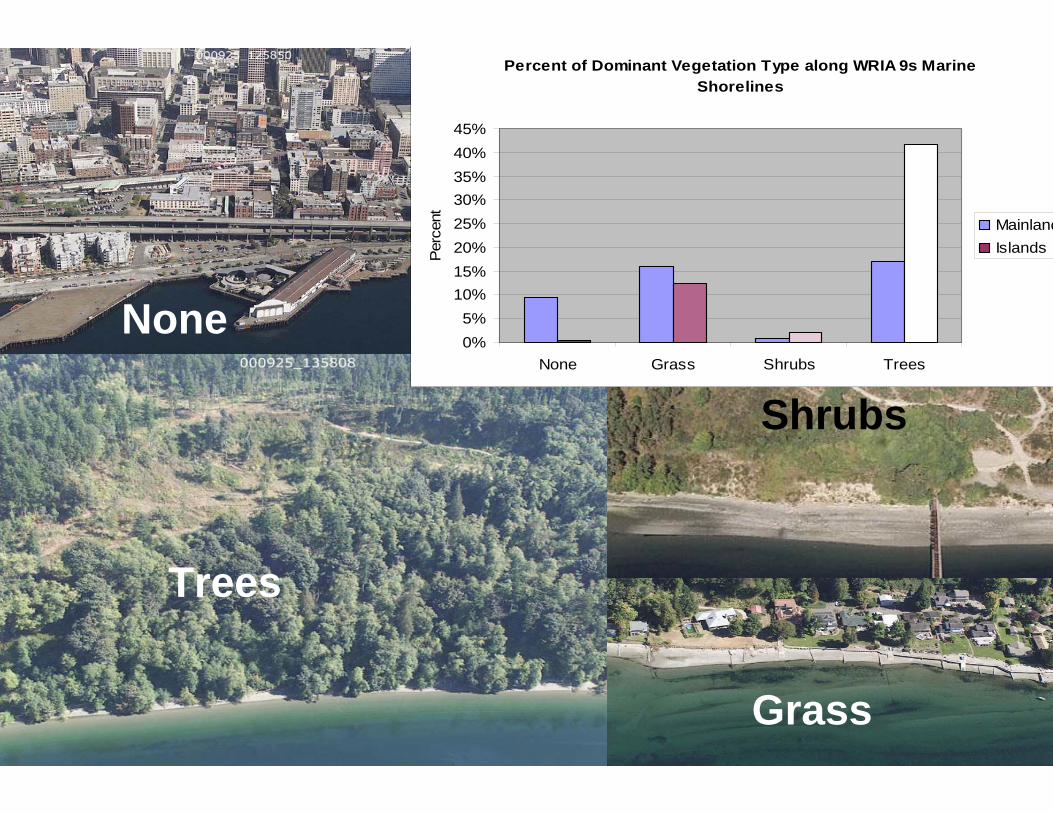
None
Grass
Shrubs
Trees
Percent of Dominant Vegetation Type along WRIA 9s Marine Shorelines
0%5%
10%15%20%25%30%35%40%45%
None Grass Shrubs Trees
Per
cent Mainland
Islands

Shoreline Amoring in Relation to MRV
0%10%20%30%40%50%60%70%80%
Unarmored Armored
Perc
ent None
Grass ShrubsTrees


Armoring & Trees—Adjacency
Shoreline Tree Adjacency in Relation to Shoreline Armoring
0%10%20%30%40%50%60%70%80%90%
100%
Unarmored Armored
Perc
ent
AdjacentSeparated

Armoring & OverhangingTrees
Trees Overhanging the Shoreline in Relation to Shoreline Armoring
0%10%20%30%40%50%60%70%80%90%
Unarmored Armored
Perc
ent
OverhangingNot Overhanging


Wood Accumulations
0%
5%
10%
15%
20%
25%
30%
35%
None Drift Logs LWD
Perc
ent
MainlandIslands

Wood & Armoring
0%
10%
20%
30%
40%
50%
60%
70%
80%
90%
Unarmored Armored
Perc
ent None
LWDDrift Logs

SummaryNo big surprises…Islands in better shape than the mainlandArmored shorelines have degraded MRV and have fewer woody debris accumulations.Armoring is not the cause of vegetation change, but is indicative of the concurrent change that comes with armoring (upland development)However, armoring is likely directly responsible for the lower amounts of LWD and drift logs seen

Inventory and Assessment of Current and Historic Beach Feeding Sources/Erosion and Accretion Areas for the Marine Shorelines of WRIA 8 & 9
Jim Johannessen, Licensed Engineering Geologist, MSAndrea MacLennan, MS
Coastal Geologic Services, IncBellingham, WA
With historic Accretion Shoreform mapping by Aundrea McBrideSkagit River System Cooperative
www.coastalgeo.com
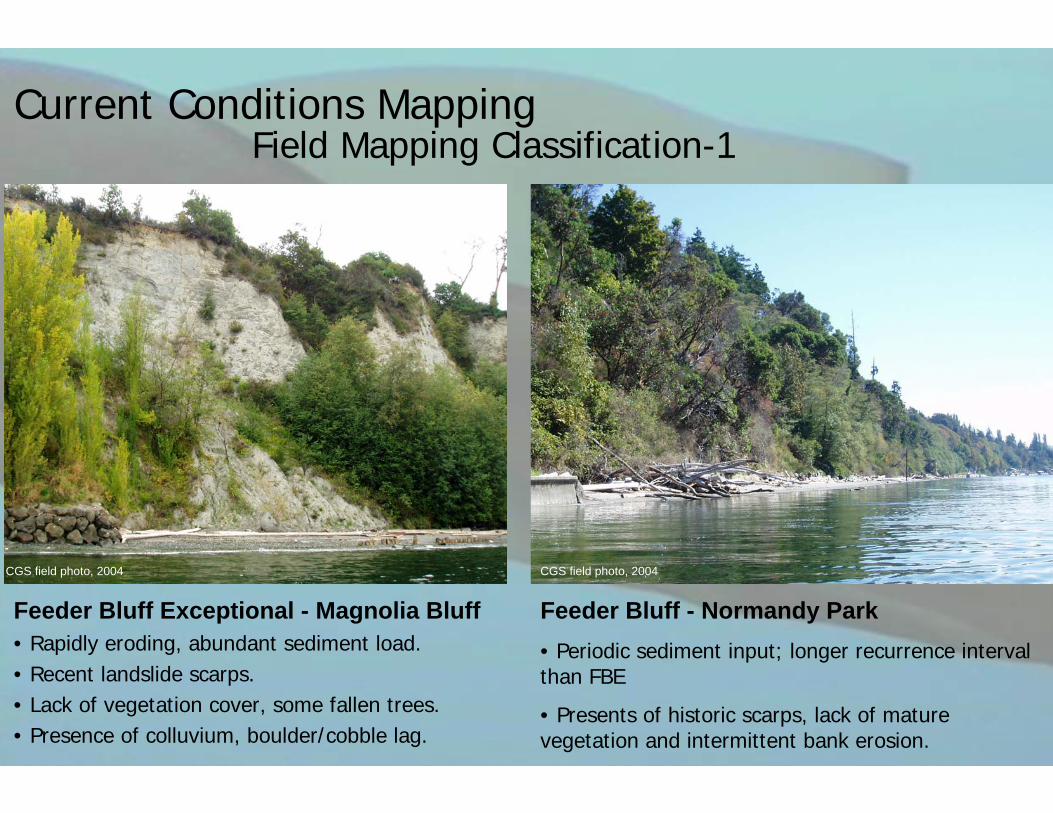
Current Conditions MappingField Mapping Classification-1
Feeder Bluff Exceptional - Magnolia Bluff • Rapidly eroding, abundant sediment load.• Recent landslide scarps.• Lack of vegetation cover, some fallen trees.• Presence of colluvium, boulder/cobble lag.
Feeder Bluff - Normandy Park• Periodic sediment input; longer recurrence interval than FBE
• Presents of historic scarps, lack of mature vegetation and intermittent bank erosion.
CGS field photo, 2004 CGS field photo, 2004

Current Conditions Mapping.Field Mapping Classification-2
Transport Zone – South Vashon Island• Lack of visible indicators of erosion or accretion.• Mature vegetation e.g. conifers.• Occasional toe erosion.
Accretion Shoreform – East Maury Island• Broad backshore area (greater than 10 ft).• Backshore vegetation community. • Spit and/or lagoon landward of a spit. • Relatively fine-grained sediment and very old drift logs in the backshore.
AS(es) were classified into 5 sub-categories to capture their
contrasting condition. Categories including the
location of any modifications and presence/absence of a
stream or creek.
CGS field photo, 2004 CGS field photo, 2004

Current Conditions MappingField Mapping Classification-3
Modified –• Bulkheaded or otherwise altered. • Natural geomorphic character of shore is (largely) concealed.• Potential sediment sources lost.
Modified – by BNSF Railway• Modified by BNSF railway.
No Appreciable Drift• Modified to the degree that net shore-drift is precluded.
• Typically also consists of fill areas.
• Common in marinas and Port facilities.
CGS field photo, 2004CGS field photo, 2004 DOE oblique, 2001

Current Conditions Results..• mapped at 1:24,000• typical length 300-700 ft• 858 shore segments
Shoretype Number of Units Min Length (ft) Max Length (ft) Mean Length (ft) % of Study AreaFeeder Bluff Exceptional 29 61 2,861 709 3.30%Feeder Bluff 184 23 3,560 517 15.10%Transport Zone 95 19 1,808 274 4.10%Accretion Shoreform 247 5 2,930 473 18.50%Modified 287 21 29,986 1,004 45.60%Modified - RR 16 829 17,247 5,293 13.40%Sum 858 100.00%
Mod + Mod-RR + AS-mods = 69% MODIFIED
22 drift cells had NO INTACT SEDIMENT SOURCE (61 cells total)

Historic Conditions MethodsPurpose and Rationale
Historic Bluff Conditions
Historic Elliot Bay (will not cover)
Historic Accretion Shoreform Mapping
University of Washington Libraries Special Collection, Negative No. UW9452.

Historic Conditions Methods
• Current Conditions mapping used as starting point
> researched historic condition of currently modified shores only
• Relied on concurrence between available data sets
Media Year Source
1940 US ACOE1947 Snoho Cty
1977/78 DOE & SC1990 DNR2002 USGS
Oblique aerial photos 2000/01 DOEMaps 1841 US Ex.
1841 NOAA1850+ GLO1854 USCS
1855-56 Anonymous1878 Koch, A.
1879 NOAA1884 Kroll1891 NOAA1890 City of Seattle1891 Kroll
1866/99 USC&GS1905 NOAA1991 USGS
1893-34 M. Stixrud1854 US Coast Survey
B. Collins data 2004 T-sheets2005 T-sheets
Vector data Year Source Theme Notes2004 DNR-geology Surface Geology Mapped Qb, Qls1975 DOE-CZA Slope stability Recent landslides 1975 DOE-CZA Slope stability Historic landslides2004 KC-DNR&P 1933-60 landslides WRIA9 shoreline2004 KC-DNR&P 1996-97 landslides WRIA9 shoreline2004 BNSF/WRIA8 1996-97 landslides WRIA8 shoreline
Shoretype 2004 CGS Geomorphic character FBE, FB, TZ, AS, ModLandslides 2004 CGS Recent landslides In previous 2-3 yrsToe erosion 2004 CGS Recent toe erosion In previous 2-3 yrs
Coverage & Applicability, Misc.Vertical aerial photography
1936 Walker & Assoc. Historic conditions, landslide mapping WRIA 9 only, stereo pairsPhoto mosaics – WRIA8 & 9 – not georeferencedHistoric conditions, landslide mapping, WRIA8 onlyColor and 1:6000 B&W orthos – 3 ft resolutionCoastal areas only - 1ft pixel King and Snohomish County (no scale)West Point to Alki Point (Wilkes map)Puget Sound Admiralty Inlet (Wilkes map)Cadastral GLO Survey Maps – some digitized in S. end, Reconnaissance of Seattle Harbor and Duwamish BayPlan of Seattle 1855-56Bird’s Eye View of Seattle and Environs (Kroll) perspective
1878 Glover, E. Birds Eye View of City of Seattle (Kroll) perspective drawingSeattle Harbor, Puget SoundCity of Seattle –downtown perspective drawingSeattle to Olympia & Vashon/Maury IslandsSeattle Tidelands, many maps, filed by subarea.Bird’s eye view of Seattle, incl. Smith Cove to AlkiAll WRIA8&9 T-sheets plus descriptive reports 1899; Admiralty Inlet & Puget SoundGeology of Vashon & Maury Islands (landslide and beach Map of part of Seattle Harbor showing SoundingsPreliminary survey of Duwamish Bay, Washington TerritoryAquatic/tidal wetland habitat loss – Elliott Bay (Green/Duw)Cartographic symbol mapping

Historic Conditions MethodsHistoric Bluff Conditions
HSSI = Historic Sediment Source Index
Reach topography, surface geology, landslide history, landscape and net shore-drift context, T-sheets, historic air photos (1936/47)
Index scores convey the relative likelihood that unit was a source of littoral sediment
Prior to scoring units – modified shores were delineated into segments of homogenous geomorphic character
University of Washington Special Collections Libraries. Negative No. UW 1682

1:24,000Legend
Subarea Boundaries
Current Conditions Shoretypes
Modified
Modified - by BNSF RR
No Appreciable Drift
Historic Conditions Shoretypes (offshore)
Feeder Bluff Exceptional
# Drift Cell Boundaries
Potential Feeder Bluff
Feeder Bluff
Transport Zone
Accretion Shoreform
Feeder Bluff Exceptional
Feeder Bluff
NOT Feeder Bluff
Data sources: All mapping by Coastal Geologic Services, Inc., Bellingham, WA, 2005.
Base map - Finlayson D.P., Haugerud R.A., Greenberg, H. and Logsdon, M.G. (2000) Puget Sound Digital Elevation Model.
Historic Conditions ResultsHistoric Bluff Conditions
NE Vashon Is.

#
#
#
Using T-sheets (1870s)
Historic Conditions ResultsHistoric Accretion Shoreforms
Using Historic Photos (1930s)

#
#
###
#
##
###
#
#
#
#
LegendDepositiona l Open Beach
Longshore Lagoon
Drowned Channel Lagoon
Delta Lagoon
Stream Mouth
Feeder bluff Exceptional
Feeder bluff
Transport zone
Accret ion shoreform
Modified
Modified - by BNSF RR
No Appreciab le Drift
Historic Conditions ResultsHistoric Accretion Shoreforms

Comparing Current and Historic Conditions....
This equates to a 63.4% loss of sediment sources; leaving only 36.6% of the historic sediment sources currently intact.
Historically sediment sources accounted for 50.3% of study area, currently only 18.4%
Most Common Shoretypes:
•Historically was Feeder Bluffs
•Current conditions is Armored
Historic Accretion Shoreforms were mapped ~40 miles of shore: Current conditions mapped apx. 22 miles of AS

Restoration Prioritization
Data sources: All mapping by Coastal Geologic Services, Inc., Bellingham, WA, 2005.
Legend
Bluffs of HIGH restoration priority
1:200,000
(By segment number)
Base map - Finlayson D.P., Haugerud R.A., Greenberg, H. and Logsdon, M.G. (2000) Puget Snd Digital Elev Mod.
Highest rated bluffs for Restoration in study area:
- Northern Railroad sub-area
- Magnolia Bluffs
- Normandy Park to Des Moines
- Southern Quartermaster Harbor
- East Vashon Island
- North of Three Tree Pt
- Inner Quartermaster Harbor
- North side Burton Peninsula

Conservation Prioritization
1:100,000
(By segment number)
Legend
Bluffs of HIGH conservation priority
Data sources: All mapping by Coastal Geologic Services, Inc., Bellingham, WA, 2005.Base map - Finlayson D.P., Haugerud R.A., Greenberg, H. and Logsdon, M.G. (2000) Puget Sound Digital Elevation Model.
Highest rated bluffs for Conservationthroughout the study area:
- South Quartermaster Harbor
- Southeast Vashon Island
- Federal Way
- Magnolia Bluffs

Restoration and Conservation Prioritization
LegendRestoration UnitsRank by Drift Cell
#1 Priority
#2 Priority
#3 Priority
Conservation UnitsRank by Drift Cell
#1 Priority
#2 Priority
#3 Priority
Data sources: All mapping by Coastal Geologic Services, Inc., Bellingham, WA, 2005.Base map - Finlayson D.P., Haugerud R.A., Greenberg, H. and Logsdon, M.G. (2000) Puget Sound Digital Elevation Model.
Magnolia

ConclusionsFeeder bluff and accretion shoreform mapping along 121 miles of WRIA 8 & 9Current and Historic dataMapping provides process-based physical information that’s been lackingBased primarily on new field data collection & not modelsData is already being used for:
- GIS-based salmon habitat restoration models- shoreline characterizations (several
jurisdictions)- restoration and conservation prioritization
efforts
GIS data from Anchor report available, but not posted on KC servers.Feeder bluff GIS data is on Plibrary 2, enviro_ext.Reports can be found @
http://dnr.metrokc.gov/wlr/waterres/marine/marine-shoreline.htm
http://dnr.metrokc.gov/wrias/9/ShorelineInventory.htm
http://www.engr.washington.edu/epp/psgb/2005psgb/2005proceedings/papers/B7_HIGGI.pdf