2nd national aquaculture summit: improving governance in ... · aquaculture contributes to food...
TRANSCRIPT

2nd National Aquaculture Summit:Improving Governance
in Aquaculture Value Chains
1
Philippine Institute for Development StudiesSurian sa mga Pag-aaral Pangkaunlaran ng Pilipinas
www.pids.gov.ph
Gilberto M. LlantoPresident, Philippine Institute for Development Studies (PIDS)2nd National Aquaculture Summit, SMX Convention Center, 24 May 2017
1. Aquaculture: status, challenges, and potential
2. Aquaculture value chains
3. Policy, regulatory, and institutional issues
4. Learning from Thailand
Outline

Aquaculture: status, challenges, and potential
3

Status of Philippine Aquaculture• With 7,107 islands and over 36,000 km of coastline, the Philippines ranks fifth in the world after Canada, Indonesia, Greenland, and Russia in coastline length.
• In 2015, the Philippines’ total agriculture GDP reached PHP1,172 billion. Fourteenpercent came from fisheries and aquaculture products
• In 2015, the Philippine exports were only 28 percent of Indonesia’s and 16 percent that of Vietnam.
4Source: Dy, R. (2017). Agribusiness and Rural Progress: actions for poverty reduction. Pasig City, Philippines: University of Asia and the Pacific.
Country Fish, shrimps, mollusc Prepared Fish Prepared
shrimp, othersSeaweeds and Carrageenan Total
Vietnam 4,299 401 1,182 3 5,885 Thailand 1,738 2,625 1,038 9 5,410 Indonesia 2,650 346 605 196 3,797 Philippines 473 238 56 235 1,002 Malaysia 504 102 33 7 646

The Aquaculture Industry and Inclusive Growth (1)• In a study coordinated by the Food and Agriculture Organization of the United Nations (FAO) (2015), the contribution of the Philippine aquaculture was found to be about 3.5% of GDP and 28.7% to agriculture GDP (reference date: 2012 to 2014).
•The study found that the socio-cultural factors that can be related to the successful development of aquaculture in a community are as follows: 1. the knowledge of appropriate aquaculture technologies, 2. the skills and resources to use the technologies, 3. the formation of groups, cooperatives or clusters especially in communities with strong
clan or community ties, 4. the inclusion of women especially in small-scale aquaculture for this provide household
benefits
5Source: Ayson (2015). Aquaculture contributes to food security and poverty alleviation. http://www.seafdec.org.ph/2015/aquaculture-contributes-food-security-poverty-alleviation/

The Aquaculture Industry and Inclusive Growth (2)
•Some 1.6 million small fishers who have a high incidence of poverty, may potentially benefit from improved aquaculture
•Food processing industry will thrive with expanded raw materials; other forward and backward market linkages
• Third, fisheries and aquaculture play second fiddle to the DA centralized commodity programs, such as rice and corn.
• Fourth, sectoral exports lag severely compared with ASEAN peers• Fifth, the imperative to protect the Philippine waters from poaching and destructive fishing
6Edited: Source: Dy, R. (2017). Agribusiness and Rural Progress: actions for poverty reduction. Pasig City, Philippines: University of Asia and the Pacific.

7
Aquafarm Type/ Environment Area of Aquafarms (Hs.) Number of AquafarmsALL AQUA FARMS 170,733.9 129,763
FISHPOND 151,342.4 73,812 Brackishwater 134,739.9 26,986 Freshwater 16,602.5 46,826
FISH PEN 6,655.6 3,078 Brackishwater 83.6 419 Freshwater 6,296.0 1,860 Marine 276.0 799
FISH CAGE 2,125.6 10,639 Brackishwater 136.5 1,606 Freshwater 915.6 5,931 Marine 1,073.5 3,102
OYSTER 356.5 3,303 MUSSEL 350.2 2,303 SEAWEED 9,155.8 34,190 RICE FISH 457.9 352 SMALL FARM RESERVOIR 290.0 2,086 Note: Compiled data from 2005 to 2010Source: PSA inventory of aquaculture farms, June 2012

8
PSA (2016) National Production (in MT)
Seaweeds 1,404,519.2Milkfish 398,088.2Tilapia 259,045.6Grouper 172.6Carps 16,849.2Oyster 20,260.8Mussel 19,774.6Mudcrab 16,198.5Whiteleg Shrimp 1,673.7Black Tiger Prawn 49,139.5

• As of September 2015, there are 80 aquaculture facilities nationwide. But only half of this (e.g. 40 facilities) are fully-functioning.
9
No. of Facilities (as of Sept. 2016)CAR 3 Region 1 4 Region 2 6 Region 3 5 Region 4A 5 Region 4B 6 Region 5 7 Region 6 6 Region 7 8 Region 8 8 Region 9 4 Region 10 7 Region 11 4 Region 12 2 Region 13 3 ARMM 2 TOTAL 80
DA-BFAR Established Mariculture Parks (as of 2017)Total Declared Area 34,806.8Total Area Developed 1,362.3Total No. of BFAR Managed MPs 16Total No. of LGU Managed MPs 27Total No. of Non-Operating MPs 24Total No. of Established MPs 67
Compiled by: BFAR Aquaculture Division

10
Region Total No. of FLAs Total Area (Ha.)Region 1 200 1,244.5 Region 2 7 75.9 Region 3 65 489.2 Region 4A 52 4,832.5 Region 4B 319 4,759.1 Region 5 453 7,459.4 Region 6 1,475 14,202.4 Region 7 446 4,497.1 Region 8 319 4,730.3 Region 9 436 7,942.8 Region 10 65 1,473.3 Region 11 135 1,311.6 Region 12 81 1,163.9 Region 13 142 2,502.9 ARMM 35 776.4 TOTAL 4,230 57,461.2
Data source: Fisheries Regulatory & Quarantine Division Fishpond Lease SectionFrom: 1973-2016

Fisheries: Volume of Production by Sector, Philippines, 2013 -2015 (Metric Tons)
11
2013 2014 2015Annual Growth(13-14)
Annual Growth(14-15)
AQUACULTURE 2,373,386.5 2,337,605.0 2,348,161.2 (1.51) 0.45 Brackishwater Fish cage 1,031.3 979.8 1,172.0 (4.99) 19.61 Brackishwater Fish pen 915.8 855.6 832.2 (6.58) (2.73)Brackishwater Fishpond 325,463.7 320,832.9 323,629.0 (1.42) 0.87 Freshwater Fish cage 105,320.5 87,742.2 94,723.1 (16.69) 7.96 Freshwater Fish pen 65,176.6 62,643.3 60,833.3 (3.89) (2.89)Freshwater Fishpond 148,131.6 148,740.6 147,569.4 0.41 (0.79)Marine Fish cage 101,572.1 110,712.6 105,606.5 9.00 (4.61)Marine Fish pen 22,251.3 14,256.4 11,148.7 (35.93) (21.80)Oyster 22,069.8 22,355.2 20,260.8 1.29 (9.37)Mussel 22,894.2 18,761.8 15,949.1 (18.05) (14.99)Seaweed 1,558,377.7 1,549,576.0 1,566,361.7 (0.56) 1.08 Small Farm Reservoir 178.2 146.5 72.0 (17.78) (50.81)Rice Fish 3.5 2.2 3.5 (37.62) 59.78
Source: PSA (2016). Fisheries Statistics of the Philippines, 2013-2015

Fisheries: Value of Production by Sector, Philippines, 2013 -2015 (million Pesos)
12Source: PSA (2016). Fisheries Statistics of the Philippines, 2013-2015
2013 2014 2015 2016 Percentage Share (2016)
AQUACULTURE 93,731.2 93,949.0 93,340.9 91,141.9 100.00Brackishwater Fish cage 123.0 109.1 131.2 106.7 0.12Brackishwater Fish pen 93.7 90.1 88.2 216.2 0.24Brackishwater Fishpond 48,335.7 48,514.6 50,442.5 51,787.2 56.82Freshwater Fish cage 7,727.8 7,079.9 7,557.6 7,559.9 8.29Freshwater Fish pen 3,679.4 3,455.1 3,325.2 2,815.5 3.09Freshwater Fishpond 10,862.8 11,127.2 11,019.4 10,179.9 11.17Marine Fish cage 10,596.6 11,267.3 10,928.0 10,776.8 11.82Marine Fish pen 1,971.4 1,374.4 1,131.0 1,113.3 1.22Oyster 170.9 179.5 180.9 203.4 0.22Mussel 252.6 222.7 215.4 273.8 0.30Seaweed 9,903.2 10,517.7 8,315.3 6,104.7 6.70Small Farm Reservoir 13.7 11.3 5.9 0.3 0.00Rice Fish 0.2 0.2 0.3 4.3 0.00Value of Production as Percentage of GDP (%) 0.81 0.74 0.70 0.63

Aquaculture value chains
13

Tilapia Supply Chain: Major Players and their Activities
14Source: Jamandre, W., Hatch, U., Bolivar, R. and R. Borski. “Improving the supply chain of Tilapia industry in the Philippines”, a paper presented during the IIFET 2012 Tanzania Proceedings. https://ir.library.oregonstate.edu/xmlui/bitstream/handle/1957/35115/Improving the Supply Chain of Tilapia Industry of the Philippines.pdf?sequence=1

A Value Chain Model for Aquaculture
15
Consumption
Wholesale Retail
Distribution
Trading, Processing
Production
Inputs: seed, feed, chemical, etc.
Small-scale farms
Medium/ large scale
farms
• Technology Standards
• Finance• Business services• Transport
Logistics• Market linkages
• Policies and regulatory environment
• Institutional framework

16
CHALLENGE OF COORDINATION TO GET
RIGHT MIX
Major Governing Regulations• The Philippine Fisheries Code of 1998 (RA 8550) – development, management, conservation and utilization of fisheries and aquatic resourcesChapter II. Article III. AquacultureChapter III. Article II. The Fisheries and Aquatic Resources Management Councils (FARMCs)Chapter IV. Fishery Reserves, Refuge and SanctuariesChapter VI. Prohibition and Penalties
•Fisheries Administrative Order No 196 (2000) provides detailed guidelines on the creation and implementation of FARMCs
•The Philippine Environment Code (1988) – provides a chapter on fisheries and aquatic resources and requires the government to establish a system of rational exploitation
17Sources: http://www.fao.org/fishery/countrysector/naso_philippines/en; Aquaculture Asia – Soya Bean Association (Regional Workshop held on June 11-12, 2013) http://www.aquaculture.asia/pages/soybeanassociation.html

SOURCE: LIFTED FROM PHILIPPINES’ PRESENTATION DURING THE TWO-DAY REGIONAL WORKSHOP AT THE NOVOTEL PLOENCHIT IN BANGKOK, THAILAND LAST JUNE 11, 2013. HTTP://WWW.AQUACULTURE.ASIA/PAGES/SOYBEANASSOCIATION.HTML

Policy, regulatory, and institutional Issues
19
Some Issues (1)• Siltation from deforested upland areas
• Pollution
• Destructive fishing practices (muro-ami, cyanide fishing, blastfishing, use of mesh nets)
• Uncontrolled shoreline development
• Overharvesting of mangroves
• Damage from anchors, divers, tourists, collectors
• Lime extraction and sand quarrying
• Proliferation of illegal fish pens/cages in rivers and lakes
• High fish stocking densities in fish pens/cages that causes mass mortality
• Poor management practices such as overfeeding, etc.
20Source: Lifted from Philippines’ presentation during the two-day regional workshop at the Novotel Ploenchit in Bangkok, Thailand last June 11, 2013. http://www.aquaculture.asia/pages/soybeanassociation.html
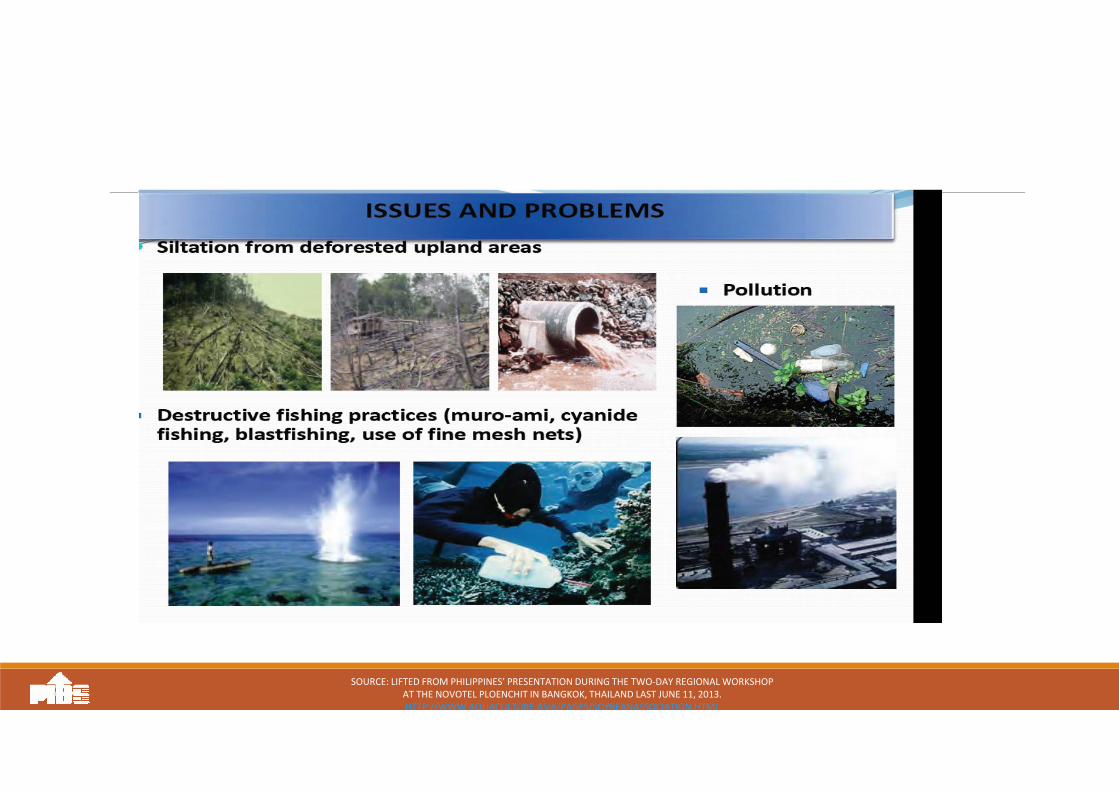
SOURCE: LIFTED FROM PHILIPPINES’ PRESENTATION DURING THE TWO-DAY REGIONAL WORKSHOP AT THE NOVOTEL PLOENCHIT IN BANGKOK, THAILAND LAST JUNE 11, 2013. HTTP://WWW.AQUACULTURE.ASIA/PAGES/SOYBEANASSOCIATION.HTML

SOURCE: LIFTED FROM PHILIPPINES’ PRESENTATION DURING THE TWO-DAY REGIONAL WORKSHOP AT THE NOVOTEL PLOENCHIT IN BANGKOK, THAILAND LAST JUNE 11, 2013. HTTP://WWW.AQUACULTURE.ASIA/PAGES/SOYBEANASSOCIATION.HTML

Some Issues (2)The case of Laguna de Bay:
• Environment-related problems
• Lack of access to cheap capital
• Obstruction of navigational lanes by fishpens
• Existence of illegal fishpens
• Poaching and overall limited support
from the government
23Source: Israel (2007). “The current state of aquaculture in Laguna de Bay” PIDS Discussion Paper Series No. 2007-20.
Source: photo by neodelphi of flickr.com

Some Issues (3)• Results of the 2006 ADB Study:
• There is a FLA registry maintained by the BFAR but there is a lack of centralized database on private fishponds covered by Certificates of Land Title
• FLA holders undertook “paper subdivisions” of their properties so as to comply to the Comprehensive Agrarian Reform Law that provided for a retention limit of 5 ha.
• Granting of long-term leases of up to 25 years, renewable for another 25 years is intended to give fishpond developers a chance to recoup their investment –situation showed otherwise; almost a third of the FLAs are sill either semi-developed or partially developed
• Production from brackishwater fishponds has stagnated and may even be on the decline• Very low annual rental that prevailed for many years made it affordable for people to apply
for an area larger than they can afford to develop and operate• Limit fishpond holdings to those who are genuinely interested in producing fish rather than as
having a “status symbol” of sorts• Challenge: how to bring in fresh investments and improve productivity?
24Source: ADB (2006). “Strategy for Sustainable Aquaculture Development for Poverty Reduction, Philippines” Midterm Report.

Learning from Thailand, among top global producers • Thailand pro-actively supports the industry. Its long history of regulation and policy support has resulted in a mature and highly disciplined industry. • Regulations – standardized and stricter in line with strengthened governance in resource allocation, environmental integrity, stringent food safety and quality standards• Market expansion- from local to national and to international markets• Early investments in infrastructure- transport; electricity; free-of-charge testing, analysis that led to increased sanitary measures that supported product upgrading [value addition]
25Source: Ponte, Kelling, Jespersen and Kruijssen [2014]

Learning from Thailand (2)•Highly regulated quality inputs such as seed and feeds to support product upgrading
• Other public services: technical extension service, free-of-cost training, testing and auditing services as well as internet-based information services and market facilitation
• Postharvest documentation that supports traceability has provided a solid base for third-party certification
• Public and private collaboration in preventing early morbidity syndrome in shrimp
26Source: Ponte, Kelling, Jespersen and Kruijssen [2014]

Conclusion• Different participants in the value chains benefit from the market linking mechanism created by the value chains.
•Domestic regulations [e.g., food safety and quality control, standards] and public sector support in terms of necessary public goods [e.g, research and development] , affect the efficient functioning of the value chains.
• An important regulatory concern is the fishpond lease agreements [FLAs] that have to be more responsive to the requirements of a growing aquaculture industry
•It is very important to improve the governance of value chains. An important part of governance is the policy, regulatory and institutional framework of the value chain. Thailand provides neat lessons.
•Private-public sector partnership/collaboration is imperative.
27

Philippine Institute for Development StudiesSurian sa mga Pag-aaral Pangkaunlaran ng Pilipinas
Service through policy research
28
Website: www.pids.gov.ph
Facebook: facebook.com/PIDS.PH
Twitter : twitter.com/PIDS_PH
E-mail: [email protected]
A.M.D.G.