2q06 - earnings release
TRANSCRIPT

7/27/2019 2Q06 - Earnings Release
http://slidepdf.com/reader/full/2q06-earnings-release 1/32
06/30/2006
Closing Quotes
USIM3 R$ 85.00 / açãoUSIM5 R$ 77.65 / açãoUSNZY US$ 35.75 (1 ADR = 1 ação)
XUSI € 28,39
Bovespa Market Cap
R$ 17.5 billionUS$ 8.1 billion
INVESTOR RELATIONS
Bruno Seno FusaroHead of Investor RelationsTel: (55 31) [email protected]
www.usiminas.com.br
Belo Horizonte, August 10,2006 –Usinas Siderúrgicas de Minas GeraisS/A - USIMINAS (BOVESPA: USIM3,USIM5, USIM6; OTC: USNZY; Latibex:XUSI) announced today its secondquarter 2006 results (2Q06). Theoperational and financial information of the Company, except where indicated tothe contrary, are presented based onconsolidated figures in reais accordingto Brazilian law. All comparisons made
in this release take into considerationthe same period of 2005 (2Q05), exceptwhen specified differently.
Net profit in the 1st half is R$ 1.0 billion and
EBITDA reaches R$ 2.0 billion
Positive outlook is confirmed and Usiminas sales volumes and margins improve.
“Our forecast since the beginning of 2006 was that the global steel market would reversethe decline seen in 2005. The recovery has been verified in the domestic market, even in theface of new turbulence in the international financial market, which the country has been ableto overcome with maturity. In the same way, conditions abroad have proven much morefavorable. Steel demand remained positive and prices in gradual increase, driven by growth
n the global economy and inflation and interest rates at low levels in the main economies, inspite of some pressure from the United States.
We are experiencing a new growth phase in the global steel industry, mainly characterized by Chinese demand. We also saw continuation of the consolidation process, a transnational movement, which is a consequence of globalization, although at a slow pace.
n view of the constantly changing environment and multiple variables, the sustainability of the Usiminas System and its position of leadership in the domestic market arencreasingly evidence, and the consistent results in the period encourage us to continue
to go forward. We recorded expressive growth in comparison to the first quarter of thisyear. Domestic market sales already account for 69% of the total sold in 2Q06.Accumulated net revenues in the 1st half were R$ 6.0 billion, we registered net profit of R$ 1.0 billion and reached operating cash generation, measured by EBITDA, of R$ 2.0 billion.
Our mills are operating at a stable rate, and we seek constant advance. We aremplementing an action plan composed of several operational measures aimed to reduce
costs, improve processes and increase revenues in order to generate more value to thebusiness.
n this continuous evolutionary process, we note that Brazilian steel production is on agrowth path, and Usiminas is actively participating through a vigorous investmentprogram underway, which focuses on strengthening and maximizing the existingoperations and future growth.
We can affirm that our business strategy is perfectly aligned with the trends derived from the significant transformations we are watching. We remain confident in thestrengthening of the Usiminas System” Rinaldo Campos Soares - CEO
2Q06
Conference calls: 08/11
National 10:00 a.m.International 11:30 a.m.
R$ million 2Q 2006 2Q 2005 1Q 2006Chg.
2Q06/2Q051H 2006
1H
2005Chg.
1H06/1H05
Total Sales Volume (000 t) 2,028 1,829 1,954 11% 3,982 3,598 11%
Net Revenues 3,053 3,484 2,958 -12% 6,011 6,954 -14%
Gross Profit 1,013 1,557 888 -35% 1,901 3,296 -42%
Operating Result (EBIT) a 890 1,359 741 -34% 1,631 2,928 -44%
Financial Result (78) (175) (118) -56% (196) (336) -42%
Net Income 704 810 345 -13% 1,049 1,812 -42%
EBITDA b 1,046 1,629 908 -36% 1,955 3,359 -42%
EBITDA (R$/t) 516 891 465 -42% 491 934 -47%
Total Assets 18,066 17,278 17,817 5% 18,066 17,278 5%
Net Debt 1,603 2,426 1,497 -34% 1,603 2,426 -34%
Stockholders' Equity 9,451 7,761 9,097 22% 9,451 7,761 22%
a) Earnings before interest, tax and participations.
b) Earnings before interest, taxes, depreciation, amortization and participations.
Highlights

7/27/2019 2Q06 - Earnings Release
http://slidepdf.com/reader/full/2q06-earnings-release 2/32
2/32
Other Highlights
• EBITDA Margin:34% in 2Q06 and 33% in 1H06.
• Debt Reduction in 1HQ06: R$ 59 million.
• Cash Position on 06/30/06: R$ 2.0 billion.
• Market Cap on 06/30/06: R$ 17.5 billion (US$ 8.1 billion).
• Usiminas shares are among the four most traded in the BOVESPA theoretical index and are among the five
most traded in Latin America.
• Investment program following schedule.
• Growing international demand and gradually increasing prices.
• 3Q06 should show better price behavior in the year in the international market.
• Usiminas is leader in domestic market, with a 52% market share.
• Domestic demand recovered and grew 14% compared to 1Q06.
• Usiminas Mecânica concluded repair of CSN blast furnace in record time.
• Usiminas receives award from Arvin Meritor.
• Usiminas is a finalist in the Transparency Award promoted by ANEFAC/ FIPECAFI /SERASA.
• Usiminas is a finalist in the National and Regional APIMEC Awards.
•
Cosipa issues EUROBOND and signs contract with BNDES to finance investments.
Analysis of the Economy and Outlook
International Economy
Behavior of the international market in the second quarter of this year confirmed the trend of stable demand andgradually increasing prices.
The main macroeconomic factors that led to the positive scenario can be highlighted as follows:•
Global economy growing at a rate similar to international forecasts;• Inflation and interest rates at low levels, in spite of some pressure from the US;• Favorable investment environment;• Steel demand growth at 4% to 6% annual level.
Demand grew in the three main steel consumption markets: NAFTA, EUROPE and ASIA, with the latter being led byChina. With good economic performance fueling demand and supply adjusted to demand, markets remained nervous,with low inventory levels.
As a consequence, prices rose faster than expected, especially from the second half of the quarter onward. Theproduct that had the most significant price increase was slab, especially after blast furnace accidents in some millsaround the world.

7/27/2019 2Q06 - Earnings Release
http://slidepdf.com/reader/full/2q06-earnings-release 3/32
3/32
This favorable scenario of rising prices for steel products was further favored by increases in prices of raw materials,among which was zinc, which determined the rapid rise in prices for coated products to a higher than normal level ofsupply and demand. Another factor which spurred the steel price recovery in the international market was thebehavior of scrap and pig iron prices, which pressured the costs of minimills.
Average quarterly international price levels on a FOB/ton basis were approximately: slab: US$ 400.00; heavy plate:US$ 550.00; hot rolled coil: US$ 550.00; cold rolled coil: US$ 600.00 and coated coil US$ 700.00.
China:
Recent facts that should be followed:- Increase in exports, that reached 20 million tons in the first half;- Price reduction at the end of the quarter.
However, there are doubts of whether the facts mentioned above are a trend or a tactical adjustment related to aspeculative movement for inventory build-up.
On this last item, it is worth observing that hot rolled prices were reduced by up to US$ 90.00/ton, depending on theclassification of the mills. The mills that deliver higher-quality products had prices reduced by US$ 30.00/ton.
Taking into consideration economic growth above 10.5% in the quarter, contrary to expectations of the Chinesegovernment, and the consequent increase in steel demand, inventory levels do not seem to be so high. Therefore, apreliminary conclusion is that prices fluctuations per se do not indicate a trend.
3rd Quarter
Our view is that in the third quarter prices will reach the highest level in the year, as per the table below:(FOB/metric ton)
Forecast for Flat Steel Export Prices in 3Q06FOB – Base (w/o extras) US$/ton
Slab 520 – 550 (*)Heavy Plate 700Hot rolled Coil 600Cold rolled Coil 700
Coated Coil 800 – 850
(*) Sales to Western countries. For Asia, prices are CFR
However, it should be mentioned that these FOB price levels can see a slight reduction due to the trend for increasingocean freight prices currently observed in the market.
4th Quarter:
Finally, the outlook for the fourth quarter of this year is for market stability. Slight price reduction could occur evenwith continued firm demand. Production costs will continue to be a determining factor to keep prices at higher levelsand will be the main regulators of supply and demand. Consolidation will continue to contribute, adjusting productionto supply, so that industry margins will be preserved.
Domestic Scenario
As mentioned in the previous quarter, the country is more mature and less susceptible to changes that could generatemistrust in the market and instability in the economy. For the first time since the beginning of the Real Plan, Brazil hasfaced a turmoil in the international financial market without seeing impacts on the exchange rate and on interestrates. After the crisis in May and June, the SELIC base interest rate was once again cut and rating agencies upgradedthe rating of Brazilian sovereign debt, bringing the Country closer to investment grade.

7/27/2019 2Q06 - Earnings Release
http://slidepdf.com/reader/full/2q06-earnings-release 4/32
4/32
In a more detailed analysis of the Brazilian economic behavior in the first half of 2006, it can be observed that exportshave given way to family consumption and investments after two years as the main driver of country growth.
Market segments whose demand was linked to domestic consumer goods (autos, electronics, household appliances) andcapital goods (industrial machinery and equipment) have demonstrated quite positive results, as it can be observed inthe information shown in the table below.
Performance of other segments, such as small-diameter tubes and rerolling, has been affected by exchangeappreciation, causing an increase in indirect imports (made up of products that use steel as raw material).
Generally speaking, the domestic flat steel market, contrary to what was seen in 2005, is growing in a sustainablemanner this year, which allows us to forecast a positive outlook for demand in 2006 compared to the previous year.
The IBS (Brazilian Iron and Steel Institute) expects the flat steel market to grow around 7% in 2006.Demand by Sector
Industry 2Q06 / 2Q05 2Q06 / 1Q06Automotive 19.5% 14.4%
Agricultural/Highway Eqmt 1.2% 1.4%
Industrial 55.2% 42.3%
Electronic 24.8% 12.8%
White Goods 21.8% 11.3%
Civil Construction/Shapes (0.3)% 14.%
Rerolling 1.8% 21.5%
Small Diameter Tubes 9.3% 2.5%
Distribution 17.3% 20.3%
Large Diameter Tubes (39.0)% 1.6%
Other (13.8)% 4.6%
Total 9.4% 14.0%
Flat steel demand in the domestic market has been recovering since 1Q06, after a period of retraction that started in2Q05. On a year-on-year basis, demand grew 9.4%, with the following highlights:
Industrial analysis – demand growth in the second quarter:
Automotive industry (automobile and autoparts): has shown positive growth in the past few years.
Electrical/Electronic Goods and Home Appliances: are benefited by lower interest rates, expansion of creditavailability and increase in available income.
Industrial Machinery and Equipment: has also shown positive results in the period, driven by increase in investments,
which have also been favored by lower interest rates and by greater business confidence in regard to future economicbehavior and the domestic market.
Large Diameter Tubes: This segment has been negatively impacted by the postponement of pipeline projects byPetrobras.
Demand analysis compared to 1Q06The domestic market grew 14% in 2Q06, indicating a recovery trend which began in 1Q06. The automotive industry isstill the highlight, supported more by domestic sales this year than by exports. Industrial machinery and equipment,home appliance and electronics have posted quite positive growth, as well as the civil construction and rerollingsegments.

7/27/2019 2Q06 - Earnings Release
http://slidepdf.com/reader/full/2q06-earnings-release 5/32
5/32
Distribution segment: accounts for approximately 30% of the flat steel domestic demand. In 2005, it experienced highinventory levels. However, this year it was able to reverse the situation, with inventory coming in line since thebeginning of the year in relation to sales, which made it possible to recover its purchasing volumes from the mills.
On a semester basis (1H06/1H05), flat steel demand retracted by 4%. Nevertheless, reiterating the information above,when compared to 2H05, demand grew 14.6%.
Raw Materials
Iron Ore: In 2Q06, price increase of iron ore was confirmed for sinter feed and granulated ore of 19% in theinternational market. In the case of pellets, there was a 3% reduction, which resulted in the smallest price differencein relation to granulated ore in the past few years, thus contributing to an increase in demand for pellets by steelmakers.
Global demand for iron ore should still remain heated over the medium and long terms, basically due to China, whichincreased imports by 23% in the first half of 2006 over the same period in 2005.
Coal: The Usiminas System finalized coal negotiations for the 2006/2007 period with a price reduction varying between8% and 45% depending on the type of material (an average of 17%). This, together with reduced negotiated oceanfreight, will result in lower costs in the period mentioned of around US$ 100 million.
Such reduction was a consequence not only of international market conditions, which evidenced greater supply, butalso the efforts of the technical and sales personnel in developing and using cheaper coal without affecting optimaloperational conditions at Usiminas and Cosipa. The effect of this reduction will begin to be felt in 3Q06, with thearrival of shipments at lower prices, which will start to be consumed in the process.
In the medium term, the outlook is for new price reductions for coal, due to the stabilization of demand and start upof new mines, mainly in Australia and Canada.
Alloys: Alloy, metals and refractory supply in 2Q06 occurred normally. The most significant fact deserving attentionwas the average prices of nickel and zinc on the London Exchange, which increased 30% on a quarterly basis in 2Q06.
The Steel Industry – Global and Brazilian Production
World
In 1H06, global raw steel production reached 596 million tons, 8% above the same period in 2005, according topreliminary data from IISI (International Iron and Steel Institute). Excluding China, global production in the period grewonly 3%.
In June alone, production totaled 104 million tons, an increase of 13% compared to the same month in 2005.China accounted for 34% of global raw steel production, with slightly less than 200 million tons in the January-Juneperiod, compared to 31% in 2005. Production in the first six months of the year grew 19% from the same period in2005.
Some of the more significant production increases in the January-June period in 2006 occurred in the United States(7%), India (17%), Turkey (11%) and Russia (7%). Production in the EU grew 4% in the period, reaching 101 million tons.
Brazil
According to preliminary data from the IBS (Brazilian Iron and Steel Institute), in 1H06 15 million tons of raw steelwere produced, a decline of 9% from the first half of 2005. Usiminas accounted for 30% of the total. Finished steelproduction (flat and long products) reached 11 million tons in 1H06, the same level as in 1H05.Raw steel production in Latin America declined by approximately 6% in 1H06 in comparison to 1H05 and Brazilianproduction was around 48% of the total.

7/27/2019 2Q06 - Earnings Release
http://slidepdf.com/reader/full/2q06-earnings-release 6/32
6/32
Usiminas System Production and Sales
The Ipatinga and Cubatão mills have operated with stability and have met production plans for 2006.
In 2Q06, raw steel production at the two mills totaled 2.2 million tons and accumulated 4.3 million tons in the year.Finished and slab production was 1.9 million tons and reached 3.8 million tons in 1H06.
On 6/30/06, the two companies had 13,720 employees.
Value Creation Agenda:
With the aim of reevaluating production processes and creating new forms of savings, mainly in production costs, thetwo mills implemented an action plan called “Value Creation Agenda”.
Under the coordination of the Industrial Director, the agenda was extended to all of the production areas of bothplants, organizing an action plan focused on process improvement, cost savings and revenue increases. Among themeasures taken are optimization of raw materials mix, yields, specific consumption and recovery of materials isexpected in relation to cost composition of slab making, seeking to identify new opportunities and improvement of
goals.
Other Relevant Production Facts:
At the Ipatinga facility, there was an improvement in the general customer satisfaction index in regard to productsand services from Usiminas, which reached the mark of 83.2% in 1H06 versus 80.3% in 2005. Focused on improvementin customer satisfaction, Usiminas uses the process targeting points of improvement and achievement of competitiveadvantages. The effects are verified in subsequent evaluations.
At the Cubatão facility the highlight is for the renewal of the Det Norske Veritas (DNV) Manufacturing SurveyArrangement (MAS) certificate, allowing this plant to supply materials to the shipbuilding industry with assured quality.
Thousand tons 2Q 2006 2Q 2005 1Q 2006 Chg.2Q06/2Q05 Chg.2Q06/1Q06 1H 2006 1H 2005 Chg.1H06/1H05
Ipainga Mill 1,168 1,161 1,110 1% 5% 2,278 2,296 -1%
Cubatão Mill 1,021 1,042 992 -2% 3% 2,013 2,074 -3%
Total 2,189 2,203 2,102 -1% 4% 4,291 4,370 -2%
Production (Crude Steel)
7/27/2019 2Q06 - Earnings Release
http://slidepdf.com/reader/full/2q06-earnings-release 7/32
7/32
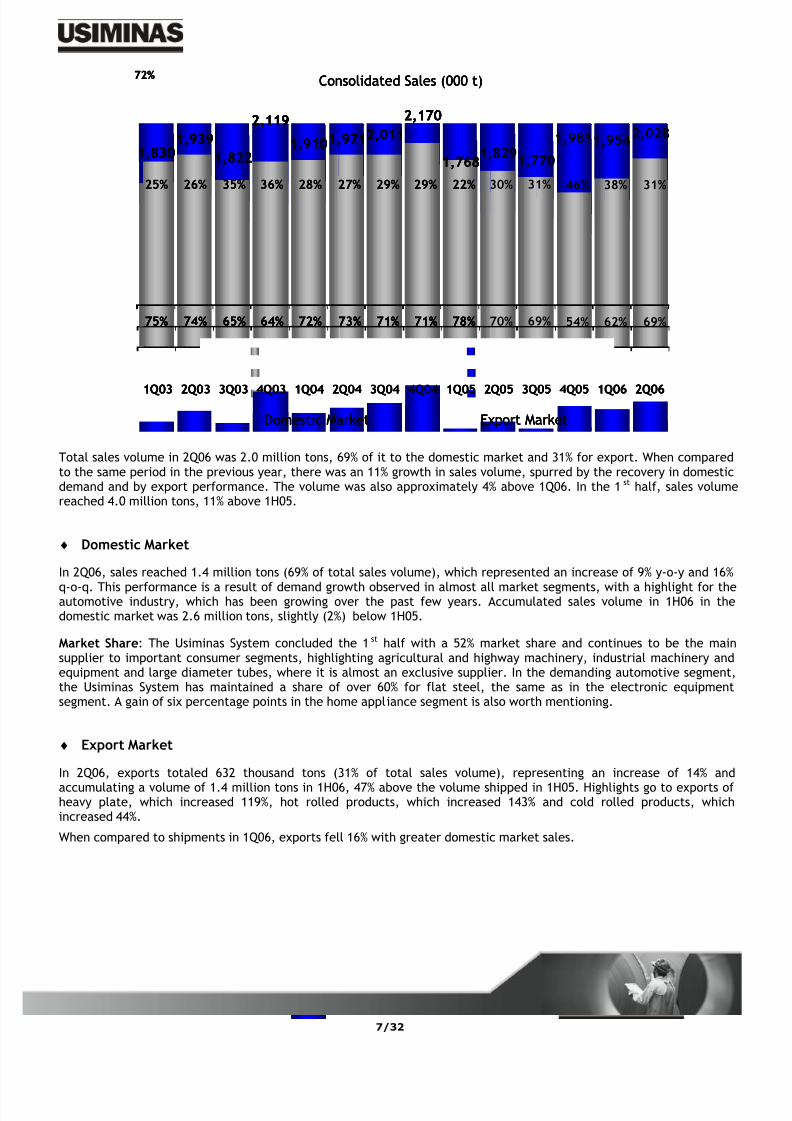
Total sales volume in 2Q06 was 2.0 million tons, 69% of it to the domestic market and 31% for export. When comparedto the same period in the previous year, there was an 11% growth in sales volume, spurred by the recovery in domesticdemand and by export performance. The volume was also approximately 4% above 1Q06. In the 1 st half, sales volumereached 4.0 million tons, 11% above 1H05.
♦ Domestic Market
In 2Q06, sales reached 1.4 million tons (69% of total sales volume), which represented an increase of 9% y-o-y and 16%q-o-q. This performance is a result of demand growth observed in almost all market segments, with a highlight for theautomotive industry, which has been growing over the past few years. Accumulated sales volume in 1H06 in thedomestic market was 2.6 million tons, slightly (2%) below 1H05.
Market Share: The Usiminas System concluded the 1 st half with a 52% market share and continues to be the mainsupplier to important consumer segments, highlighting agricultural and highway machinery, industrial machinery andequipment and large diameter tubes, where it is almost an exclusive supplier. In the demanding automotive segment,the Usiminas System has maintained a share of over 60% for flat steel, the same as in the electronic equipmentsegment. A gain of six percentage points in the home appliance segment is also worth mentioning.
♦ Export MarketIn 2Q06, exports totaled 632 thousand tons (31% of total sales volume), representing an increase of 14% andaccumulating a volume of 1.4 million tons in 1H06, 47% above the volume shipped in 1H05. Highlights go to exports ofheavy plate, which increased 119%, hot rolled products, which increased 143% and cold rolled products, whichincreased 44%.
When compared to shipments in 1Q06, exports fell 16% with greater domestic market sales.
Consolidated Sales (000 t)
1Q03 2Q03 3Q03 4Q03 1Q04 2Q04 3Q04 4Q04 1Q05 2Q05 3Q05 4Q05 1Q06 2Q06
Domestic Market Export Market
72%
75% 74% 65% 64% 73%72% 71% 71%
25%
1,8301,939
26%
1,822
35%
2,119
36% 28%
1,910
27%
1,9712,011
29%
2,170
29%
78%
1,768
22%
70%
1,829
30%
69%
1,770
31%
54%
1,981
46%
62%
1,954
38%
69%
2,028
31%
Consolidated Sales (000 t)
1Q03 2Q03 3Q03 4Q03 1Q04 2Q04 3Q04 4Q04 1Q05 2Q05 3Q05 4Q05 1Q06 2Q06
Domestic Market Export Market
72%
75% 74% 65% 64% 73%72% 71% 71%
25%
1,8301,939
26%
1,822
35%
2,119
36% 28%
1,910
27%
1,9712,011
29%
2,170
29%
78%
1,768
22%
Consolidated Sales (000 t)
1Q03 2Q03 3Q03 4Q03 1Q04 2Q04 3Q04 4Q04 1Q05 2Q05 3Q05 4Q05 1Q06 2Q06
Domestic Market Export Market
72%
75% 74% 65% 64% 73%72% 71% 71%
25%
1,8301,939
26%
1,822
35%
2,119
36% 28%
1,910
27%
1,9712,011
29%
2,170
29%
78%
1,768
22%
75% 74% 65% 64% 73%72% 71% 71%
25%
1,8301,939
26%
1,822
35%
2,119
36% 28%
1,910
27%
1,9712,011
29%
2,170
29%
78%
1,768
22%
70%
1,829
30%
69%
1,770
31%
54%
1,981
46%
62%
1,954
38%
69%
2,028
31%

7/27/2019 2Q06 - Earnings Release
http://slidepdf.com/reader/full/2q06-earnings-release 8/32
8/32
Country 2Q06 % 1H06 %
USA 96.7 15% 290.8 21%
Mexico 67.9 11% 207.5 15%
Canada 46.2 7% 141.2 10%
Germany 80.6 13% 135.7 10%
Thailand 98.7 16% 98.7 7%Other 45.3 7% 114.6 8%
Chile 16.6 3% 64.1 5%
Spain 28.4 4% 59.1 4%
Argentina 27.3 4% 56.0 4%
South Korea 9.6 2% 48.2 3%
India 47.0 7% 47.0 3%Colombia 16.6 3% 36.8 3%
Venezuela 23.1 4% 35.2 3%
Taiwan 16.0 3% 24.6 2%Portugal 12.0 2% 24.5 2%
Total 632.0 100% 1384.0 100%
Exports by Country – 2Q06 and 1H06 (1000 ton)
Thousand tons 2Q 2006 2Q 2005 1Q 2006Chg.
2Q06/2Q051H 2006 1H 2005
Chg.
1H06/1H05
Usiminas
Domestic Market 832 75% 745 78% 724 68% 12% 1,556 72% 1,591 83% -2%
Export Market 277 25% 212 22% 339 32% 31% 616 28% 326 17% 89%
Total 1,109 100% 957 100% 1,063 100% 16% 2,172 100% 1,917 100% 13%
Cosipa
Domestic Market 564 61% 531 61% 478 54% 6% 1,042 58% 1,068 64% -2%
Export Market 355 39% 341 39% 413 46% 4% 768 42% 613 36% 25%
Total 919 100% 872 100% 891 100% 5% 1,810 100% 1,681 100% 8%
System
Domestic Market 1,396 69% 1,276 70% 1,202 62% 9% 2,598 65% 2,659 74% -2%
Export Market 632 31% 553 30% 752 38% 14% 1,384 35% 939 26% 47%
Total 2,028 100% 1,829 100% 1,954 100% 11% 3,982 100% 3,598 100% 11%
Sales Volume
Usiminas
Expt
25%
Dom
Mkt
75%
Sales Volume Mix – 2Q06
System
Expt
31% Dom
Mkt
69%
Cosipa
Expt
38%Dom
Mkt
62%
Usiminas
Expt
25%
Dom
Mkt
75%
Sales Volume Mix – 2Q06
System
Expt
31% Dom
Mkt
69%
Cosipa
Expt
38%Dom
Mkt
62%

7/27/2019 2Q06 - Earnings Release
http://slidepdf.com/reader/full/2q06-earnings-release 9/32
9/32
Economic and Financial Performance
Net Revenue
In 2Q06, net revenue totaled R$ 3.1 billion, 3% higher in comparison with 1Q06, due to greater sales volume. Over thehalf, net revenue totaled R$ 6.0 billion, 14% lower than in 1H05. In spite of the high shipments in the period, thedecline was the result of three factors: lower prices, changing mix (greater share of exports) and the exchange rate
(appreciation of the real against the dollar).In 2Q06, total per-ton net revenue (domestic and export markets) of Usiminas/Cosipa reached R$ 1,419/ton, 3% abovenet per-ton revenue in 1Q06.
COGS
In 2Q06, the cost of goods sold (COGS) totaled R$ 2.0 billion, remaining stable in comparison to 1Q06 COGS, with adecrease of R$ 29 million (1.4%).
The per-ton cost of goods sold (Usiminas and Cosipa) in the quarter was R$ 975/ton.
In 1H06, COGS totaled R$ 4.1 billion, 12% above that of 1H05. The following are the main variations:
The main item is raw materials, which accounted for 50% of production cost in 1H06. When compared to 1H05, theyshowed a reduction of 6% in value. However, higher coal and zinc costsoffset a reduction in the cost of coke and otherraw materials.
Other cost items, such as supplies, electrical energy and third-party services, increased in the 1 st half.
Gross Profit
Gross profit was R$ 1.0 billion in 2Q06, 14% greater than in 1Q06. Gross margin rose from 30% in 1Q06 to 33% in 2Q06. In1H06, gross profit totaled R$ 1.9 billion and gross margin was 32%, lower compared with the results in 1H05.
The Company is implementing an action plan focused on process improvement and cost reduction with a view to
achieve better margins and value generation.
Operating Profits before Financial Expense (EBIT)
Operating profit before financial expense grew 20% compared to 1Q06 and totaled R$ 0.9 billion. In the 1H06, ittotaled R$ 1.6 billion, 44% lower than in 1H05.
Operating expenses and revenues declined 16% in 2Q06 from 1Q06. The main variations were in Sales Expense, whichwere 6% lower, mainly due to decrease in demurrage expense; SG&A grew 23% as a result of increase in sundry expenseand labor adjustments, as well as Other Expenses and Operational Revenue, which showed a non-recurring gain due toreversion of provision for fiscal contingencies – PIS/COFINS.
The amount of operational expense and revenues in 1H06 showed a reduction of 27% compared to 1H05. The mainvariations were sales expense, which were 17% above, basically due to greater expenses with distribution cost due tolarge export volume and payment of demurrage. SG&A increased 7% basically due to effects of labor adjustments.Other expense and revenues showed gains in the period, a consequence of actuarial surplus at FEMCO (Cosipa pensionfund) and a non-recurring gain with reversion of provision for fiscal contingencies relative to PIS/COFINS.
EBITDA
Ebitda was R$ 1.0 billion in 2Q06, 15% above the total posted in the previous quarter. Ebitda margin rose from 31% to34% in 2Q06.Accumulated Ebitda in 1H06 was R$ 2.0 billion, 42% below 1H05. Ebitda margin was 33% in 1H06 versus 48% in 1H05, forthe reasons already explained above.

7/27/2019 2Q06 - Earnings Release
http://slidepdf.com/reader/full/2q06-earnings-release 10/32
10/32
Financial Result
Net financial expense declined 34% in relation to 1Q06 mainly due to the reduction of exchange losses and swaptransactions.In 1H06, net financial expense declined R$ 140 million (41%) in relation to 1H05 basically due to lower exchange lossesand swap transactions, as well as reduction of interest payment on debt.
Equity Income
In the consolidated quarterly results, the highlights are Ternium and MRS, which contributed with R$ 35 million and R$13 million, respectively.
Financial Result and Indebtedness
Total consolidated debt went from R$ 3.3 billion on 3/31/06 to R$ 3.6 billion on 6/30/06, of which 26% denominated inlocal currency and 74% in foreign currency. Considering cash and securities, net debt on 6/30/06 totaled R$ 1.6 billion,equivalent to US$ 0.7 billion. Short-term debt accounted for 28% and long-term debt for 72%, which is considered anadequate profile by the Company. The Net Debt/Ebitda ratio, which on 3/31/06 was 0.3 times, rose to 0.4 times on6/30/06. Effective debt amortization in 1H06 was R$ 59 million.
Income Tax and Social Contribution
In the quarter, the amount referring to income tax was impacted by a provision for payment of interest on equitycapital, according to determination of the Board of Directors in the most recent meeting, which authorized constitutionof a provision for this purpose.
Net Income
Usiminas posted a consolidated net income of R$ 704 million in 2Q06, 104% higher than in 1Q06, due to the effectsmentioned above. In 1H06, net profit was R$ 1.0 billion, with a net margin of 17%, while net margin in 1Q06 was 12%,which reflects the Company has made to achieve better results, and confirms the expectations of better margins as of2Q06.
Consolidated Net Debt /
EBITDA
0 ,
7
0 ,
9
2 ,
4
2 ,
6
2 ,
5
2 ,
3
2 ,
2
1 ,
9
1 ,
7
1 ,
3
1 ,
0
1 ,
0
1 ,
0
0 ,
7
0,40,4
2,72,5
2,32,1
1,6
2,6
1,1
0,70,4 0,4 0,4 0,3
1Q032Q03 3Q03 4Q031Q04 2Q04 3Q044Q04 1Q05 2Q053Q05 4Q05 1Q06 2Q06
CND (US$ bil lion) CND/EBITDA
EBITDA & EBITDA Margin
4 7 9
4 1 4
4 0 4
5 3 9
6 5 5
6 4 6
6 5 2
5 3 8
4 2 2
3 1 8
2 6 3
2 2 5
2 5 5
2 5 8
34%
31%31%
41%
47%
50%48%49%
36%
46%
39%
31%33%
42%
1Q03 2Q03 3Q03 4Q03 1Q04 2Q04 3Q04 4Q04 1Q05 2Q05 3Q05 4Q05 1Q06 2Q06
EBITDA (US$ million) EBITDA Margin

7/27/2019 2Q06 - Earnings Release
http://slidepdf.com/reader/full/2q06-earnings-release 11/32
11/32
Capital Expenditure
Capex in fixed assets totaled R$ 231 million, mainly on maintenance, technological updating of equipment andenvironmental protection.
Investment projects followed their normal course of technical specifications, price tenders, contract signing andconstruction, according to the established schedule.
The investments aim at quality and mix improvements, capacity expansion and cost reduction and have a total budgetestimated between US$ 2.2 and US$ 2.4 billion. The main investments in the industrial facilities of Ipatinga andCubatão and their benefits are detailed below:
USIMINAS - IPATINGA:
Blower for Blast Furnace No. 3: operating since Feb/06. It will increase nominal electrical power production by 6MW.
New Coke Oven Battery (No. 3): production of 750,000 tons/yr of coke as of 2H09, with a view to make coke
production self-sufficient.
Steel Shop no. 3: improvements which will increase production of liquid steel to 2.8 million tons/yr as of 1H2010 andincrease steel production volume with higher added value.
Heavy Plate Mill: increase in the production capacity by 300,000 tons/yr as of 1H2010 with quality improvements forAPI steel.
New Thermoelectric Power Plant: will provide generation of 60 MW of electrical power at the mill as of April 2008,using off gases.
COSIPA - CUBATÃO:
Hot Strip Mill No. 2: production of 2.25 million tons/yr of hot rolled strip as of 1H2010 in the first phase and 4.65million tons in the second phase.
Modernization of Continuous Casting Machine no. 3: increase production capacity in the steel shop by 190,000tons/yr as of January 2008, making it possible to produce higher value-added steel demanded by secondary steelrefining for vacuum degassing and ladle furnace.
Pressure Recovery Turbine on Blast Furnace no. 2: provide average electrical power generation of 11.9 MW/h as of2H2008.
Revamping no. 5 of Blast Furnace no. 1: will assure production increase and provide operational guarantee as ofJanuary 2008.

7/27/2019 2Q06 - Earnings Release
http://slidepdf.com/reader/full/2q06-earnings-release 12/32
12/32
Capital Markets
• Bovespa Index Performance
Usiminas preferred class “A” shares (USIM5), which have greater liquidity, fell 3.2% in the period, while the IbovespaIndex fell 3.5%. On the other hand, voting shares (USIM3) appreciated 1.3%, above the industry average. Theperformance follows a highly volative market, in which global investors paid close attention to data on the US economybecause of US interest rate outlook.
Considering the period between 01/01 to 06/30/06, USIM5 shares appreciated 39.7%, while the IBOVESPA Indexappreciated only 9.5%.
On 6/30/06, USIM5 preferred PN shares were quoted at R$ 77.65 and USIM3 ON voting shares were R$ 85.00. Tradingvolume in the period (considering ON and PN shares) was R$ 6.0 billion. The Company continued to be recommended asan investment option among the companies in the steel industry, according to market consensus of its prospectiveperformance.
Stock, ADR orIndex
Number of Trades
(daily avg)
Share Traded(000 shares)
Volume Traded000 $
Appreciation%
ClosingQuotation
06/30/06
USIM3 (ON) 1,469 2,078 184,834 1.3% R$ 85.00
USIM5 (PNA) 98,588 76,191 5,840,256 -3.2% R$ 77.65
USNZY (ADR) 34 754 25,907 -3.4% US$ 35.75
XUSI (Latibex) 30 530 15,653 -5.1% € 28,39
IBOVESPA 3,101,993 1,283,492,797 134,651,156 -3.5% 36,630
Trading Summary Table for Usiminas Shares - 2Q06
50
70
90
110
130
150
Dec-05 Jan-06 Feb-06 Mar-06 Apr-06 May-06 Jun-06
IBOVESPA USIM5 SID
USIM5 vs Ibovespa and Steel Industry
(12/29/2005 = base 100)
109,5
139,7
131,9

7/27/2019 2Q06 - Earnings Release
http://slidepdf.com/reader/full/2q06-earnings-release 13/32
13/32
Usiminas ranks fourth among the companies with greatest weight in the IBOVESPA, with a share of 5.22% in thetheoretical portfolio. The Ibovespa, main index in the São Paulo Stock Exchange, is used by the entire market as basisfor decision making.According to the ranking elaborated by Economática, Usiminas shares are among the five most traded in the LatinAmerican market in 2006. The methodology adopted was that of daily average volume.
• ADR Performance in the US
In 2Q06, Usiminas shares traded in the United States as Level 1 – OTC (Over the Counter) ADRs (“USNZY”). Theydevalued 3.4%. USNZY was quoted at US$ 35.75 on 6/30/06.
• Latibex Madrid Performance
Listed on the Latibex since 7/05/05, Usiminas shares (“XUSI”) already rank third among the most traded shares and, in2Q06, devalued 5.1%. The share was quoted at EUR 28.39 on 6/30/06.
• Shareholder Composition
The Company’s capital totals R$ 5.4 billion that represent 225,285,820 shares – 112,280,152 voting shares, 112,591,092preferred class A shares and 414,576 preferred class B shares. From the adjusted net income of the fiscal year, aminimum legal share (25%) is destined for remuneration of the shareholders. Holders of preferred shares receiveddividends 10% greater than those attributed to voting shares.
• Cosipa issues Eurobond in the amount of US$ 200 million
Cosipa issued 10-year bonds in the amount of US$ 200 million, with a coupon of 8.25% per year, paid semestrally at theprice of 99.165% over the face value of the security. The bonds will mature on June 14, 2016 and received a riskclassification of BB+ by Standard & Poor’s and a Ba2 rating by Moody’s. The bonds have a yield for the investor of8.375% per year (spread of 335 basis points above Treasury notes in the United States).
This issue had a demand of 2.3 times its size, and the coordinating banks are ABN AMRO and UBS. Funds are destined tofinance investment needs of Cosipa.
Subsidiary Cosipa maintains two Eurobonds outstanding: the first, in the amount of US$ 75 million, was issued inNovember 2003, with maturity set for November 2006 and coupon of 7.25%; the second, in the amount of US$ 175million, was issued in January 2004 and will come due in January 2009 with a coupon of 8.25%.
Other Highlights
• Usiminas receives award from Arvin Meritor
Wheel manufacturer Arvin Meritor awarded Usiminas the “Distinguished Supplier Award 2006 – Steel Industry” during
its II Annual Supplier Mercosur Meeting in Campinas, SP. Usiminas is an exclusive supplier of hot rolled products toArvin Meritor and this was the fifth prize received. The awarded companies are chosen by automotive industry clients.Commercial service, delivery performance, development and product quality, in addition to partnership in newbusiness were the criteria used by Arvin Meritor for giving the award.
• Usiminas is a finalist in the Transparency Award
Usiminas is one of ten publicly-traded companies that are finalists in the 10 th Transparency Awards 2006, sponsored bythe National Association of Finance, Administrative and Accounting Executives (ANEFAC), by the Accounting Research,Actuarial and Financial Institute Foundation (FIPECAFI) and SERASA.
This is the fourth time that Usiminas is nominated for the awards. The Company was also nominated in 1998, 2003 and2005.

7/27/2019 2Q06 - Earnings Release
http://slidepdf.com/reader/full/2q06-earnings-release 14/32
14/32
The prize is nationally recognized for its sobriety and technical rigor with which participants are selected and thewinners are chosen. The candidates nominated to receive the awards are companies that publish accountingstatements in a clear, precise and transparent manner, demonstrating the respect of the company for its consumers,shareholders, investors, customers, suppliers, creditors and society as a whole.
• Usiminas is a finalist in the National and Regional Analyst Association (APIMEC) Awards
Usiminas was nominated to two other prizes this quarter: National and MG Apimecs. The Company is competing in twoof the six categories of the national awards: Investor Relations Professional and Publicly listed company. With regardto the Regional Apimec Award in Minas Gerais, it is competing in the Quality – Best Meeting Category. These Apimecawards are the oldest conceded to professionals, companies and institutions that significantly contribute to thetechnical improvement and development of capital markets.
• Cosipa signs BNDES financing contract
Subsidiary Cosipa signed a financing contract with BNDES in the amount of R$ 130 million, destined for investments inmodernization of its no. 3 continuous casting machine and installation of a pressure recuperating turbine on its BlastFurnace no. 2. Such investments will make it possible to increase steel shop capacity by 190,000 tons of liquid steelper year and increase own generation of electrical power in its industrial facilities located in Cubatão, SP. Thefinancing matures in five years with two-year grace period and the cost is TJLP + 2.5% per annum and currency basket+2.5% per annum.
Other Companies of the Usiminas System (non-consolidated information)
Ternium
On 8/02/06, Ternium released its 2Q06 figures, as per the table below:
Summary of Results 2Q06 1H06
Product shipments – thsd t 2,412.9 4,660.8Net Sales – US$ million 1,709.1 3,238.0
Gross profit – US$ million 631.0 1,172.7
Operating profit – US$ million 476.7 869.2
EBITDA – US$ million 582.2 1,082.7
EBITDA Margin 34% 33%
Net profit – US$ million 289.2 483.7
Ternium’s results continued to show improvement in 2Q06. Revenues increased compared to 1Q06 as a result of betterprices and sales volume. These factors associated to stable costs produced an increase in EBITDA margin.
Demand for steel products in the main markets where Ternium sells maintained the positive trend during the secondquarter, as is the case with the main economies in South and Central America. Prices for steel products increased inthe period mainly in North America. Ternium expects that demand and prices for its products remain stable and doesnot foresee any seasonal impact relative to raw materials cost and energy cost fluctuations.
Ternium is one of the largest steel producers in the Americas, offering a large array of products including flat and longsteel products. The company has operational facilities in Mexico (Hylsamex), Argentina (Siderar) and Venezuela (Sidor)and has a vast distribution network.
Usiminas has a 14.25% share of Ternium’s capital, in which it is a partner with the Techint Group.

7/27/2019 2Q06 - Earnings Release
http://slidepdf.com/reader/full/2q06-earnings-release 15/32
15/32
Unigal
A joint venture between Usiminas and Nippon Steel, the company processes cold rolled coils by the hot dip galvanizedprocess.
In 2Q06, 110.1 thousand tons were processed, 11% above the volume shipped in 2Q05. In 1H06, a total of 217.5thousand tonswere processed, around 7% higher in comparison to the same period in 2005.
Net revenue in 2Q06 totaled R$ 35.4 million, (R$ 75.6 million in 1H06), a decrease of 33% in relation to 2Q05 (28% lessthan in 1H05).
In the quarter, EBITDA reached R$ 29.9 million, accumulating a total of R$ 62.4 million in 1H06. Net profit reached R$6.5 million and accumulated R$ 1.7 million in the 1st half.
Usiminas has 79.3% of Unigal’s capital.
MRS Logística
On 7/26/06, MRS released in 2Q06 results as per the table below:
Summary of Results 2Q06 1H06
Volume transported – million tons 27.9 52.9
Gross Revenues – R$ million 548.9 1,027.0
Net Revenues – R$ million 474.0 885.4
Operating Profit (before financial results) – R$ million 193.7 348.6
EBITDA – R$ million 224.8 410.4
EBITDA Margin 47% 46%
Net Profit – R$ million 114.5 212.9
MRS Logística is a concessionaire that controls, operates and monitors the Southeast Federal Railroad Network. Thecompany operates in the rail transporation market, interconnecting the States of Rio de Janeiro, Minas Gerais and SãoPaulo. The region concentrates approximately 65% of Brazil’s GDP. It also contains the largest industrial complexes inthe country. Through MRS’s network it is also possible to reach the ports of Sepetiba and Santos (the largest in LatinAmerica).
MRS’s activities focus on rail transportation of general cargo, such as ores, finished steel products, cement, bauxite,agricultural products, green coke and containers and integrated logistics.
Usiminas has 20% of the voting capital and is part of the Company’s controlling group.
Usiminas Mecânica
The Company recorded a net profit of R$ 3.7 million in 1H06. It is worth mentioning that current results are due to theslowdown in the operations seen in 4Q05 and 1Q06. With market recovery, the outlook for the 2nd half is favorable.
Usiminas holds 99.98% of Usiminas Mecânica’s capital.
7/27/2019 2Q06 - Earnings Release
http://slidepdf.com/reader/full/2q06-earnings-release 16/32
16/32
Highlights
• UMSA concludes repair of CSN blast furnace in record time
On 6/23/06, the repair work on CSN’s No. 3 blast furnace was delivered in Volta Redonda, RJ. Responsible for thesupply of 60% of the pig iron used in its steel production of around 6 million tons, the blast furnace was halted for fivemonths after an accident on January 22.
Usiminas Mecânica is the only company in Brazil capable of making such repair and overcame the challenges in a shorttime, demonstating capacity to mobilize and manage the works, guaranteeing the quality of services and equipmentwithin safety requirements.
• Partnership
Usiminas Mecânica is today the largest constructor of metallic structures for Petrobras. In addition to the P-50 and P-47 platforms, the Company is also responsible for the supply of structure for four more platforms for petroleumextraction still under construction: P-51, P-52, P-53 and P-54. In order to build these modules, UMSA uses special highstrength steel produced by Usiminas and Cosipa.
• Passageway Bridge (Ponte da Passagem)
After competing with the main construction companies in the country, UMSA won the public tender made by theEspírito Santo state government for construction of the Passageway Bridge (Ponte da Passagem), in Vitória. The boldproject consists of a cable suspension bridge with 60-meter high steel tower, two 12-meter wide lanes and threetraffic lanes each way. The construction may becomethe new calling card for the state’s capital city. Deadline forconclusion of the bridge is 12 months.

7/27/2019 2Q06 - Earnings Release
http://slidepdf.com/reader/full/2q06-earnings-release 17/32
17/32
Other Information:Investor Relations Department
Financial Investor Relations Brasil
Lígia Montagnani – ConsultantTel: +55 11 3897-6405 [email protected]
Custodian Bank: Banco Bradesco S/AShareholder Department
Phone: + 55 11 3684.9495
ADR’s – Depositary Bank: The Bank of New York
Visit the Investor Relations site: http://www.usiminas.com.br/ri_investidores/
Conference call: Friday, August 11
Local, at 10 AM (Brasília).Telephones for connection:
Brazil: (11) 4688-6301Abroad: (+55 11) 4688-6301
International, at 11:30 AM (Brasília).Telephones for connection:
USA: (1 800) 860-2442Brazil: (11) 4613-6301
Other countries: (1 412) 858-4600
Pin numbers: 452 (local) / 954 (international)
The audio of the conference calls will be transmitted live through the Internet accompanied by slidepresentation on the website: www.usiminas.com.br
Gilson Rodrigues Bentes [email protected] Tel: (11) 5070-8980 (Cosipa – SP)Tel: (31) 3499-8617 (Usiminas – BH)
Matheus Perdigão [email protected] Tel: (31) 3499-8056
Luciana Valadares dos [email protected]
Tel: (31) 3499-8619
Bruno Seno [email protected]
Tel: (31) 3499-8710
Declarations contained in this release relative to the business outlook of the Company, forecasts of operational and financial resultsand references to growth potential constitute mere forecasts and were based on the expectations of Management in relation to future performance. These expectations are highly dependent on market behavior, the economic situation in Brazil, its industry and international markets and, therefore, are subject to change.

7/27/2019 2Q06 - Earnings Release
http://slidepdf.com/reader/full/2q06-earnings-release 18/32
18/32
R$ thousand 2Q 2006 2Q 2005 1Q 2006
Chg.
2Q06/2Q05
Net Revenues 1,676,619 1,824,359 1,607,694 -8%
Domestic Market 1,387,718 1,510,842 1,213,164 -8%
Export Market 288,901 313,517 394,530 -8%
COGS (1,105,649) (1,014,385) (1,071,346) 9%
Gross Profit 570,970 809,974 536,348 -30%
Gross Margin 34% 44% 33% -10 p.p.
Operating Income (Expenses) (48,820) (82,525) (93,143) -41%
Selling (32,461) (27,826) (37,026) 17%
General and Administrative (40,458) (34,595) (32,323) 17%
Others, Net 24,099 (20,104) (23,794) -220%
EBIT 522,150 727,449 443,205 -28%
EBIT Margin 31% 40% 28% -9 p.p.
Financial Result (24,361) (89,227) (58,354) -73%
Financial Income 25,200 (25,914) (10,216) -197%
Financial Expenses (49,561) (63,313) (48,138) -22%
Equity Income 262,071 360,739 70,912 -27%
Operating Result 759,860 998,961 455,763 -24%
Non-Operating Income 1,055 713 1,245 48%
Profit Before Taxes 760,915 999,674 457,008 -24%
Income Tax / Social Contribution (51,486) (194,983) (131,143) -74%
Net Income 709,429 804,691 325,865 -12%
Net Margin 42% 44% 20% -2 p.p.
Net Income per thousand shares 3.23383 3.66806 1.48541 -12%
EBITDA 566,757 832,814 525,210 -32%
EBITDA Margin 33.8% 45.6% 32.7% -11,8 p.p.
Depreciation 65,261 64,327 65,189 1%
Provisions (20,654) 41,038 16,816 0%
Income Statement - Parent Company
Brazilian GAAP (Legislação Societária)

7/27/2019 2Q06 - Earnings Release
http://slidepdf.com/reader/full/2q06-earnings-release 19/32
19/32
R$ thousand 1H 2006 1H 2005Chg.
1H06/1H05
Net Revenues 3,284,313 3,727,523 -12%
Domestic Market 2,600,882 3,180,068 -18%
Export Market 683,431 547,455 25%
COGS (2,176,995) (1,901,945) 14%
Gross Profit 1,107,318 1,825,578 -39%
Gross Margin 34% 49% -15 p.p.
Operating Income (Expenses) (141,963) (161,438) -12%
Selling (69,487) (49,952) 39%
General and Administrative (72,781) (62,058) 17%
Others, Net 305 (49,428) -101%
EBIT 965,355 1,664,140 -42%
EBIT Margin 29% 45% -16 p.p.
Financial Result (82,715) (118,935) -30%
Financial Income 14,984 30,631 -51%
Financial Expenses (97,699) (149,566) -35%
Equity Income 332,983 853,767 -61%
Operating Result 1,215,623 2,398,972 -49%
Non-Operating Income 2,300 2,938 -22%
Profit Before Taxes 1,217,923 2,401,910 -49%
Income Tax / Social Contribution (182,629) (570,136) -68%
Net Income 1,035,294 1,831,774 -43%Net Margin 32% 49% -17 p.p.
Net Income per thousand shares 4.71923 8.34987 -43%
EBITDA 1,091,967 1,832,927 -40%
EBITDA Margin 33.2% 49.2% -16,0 p.p.
Depreciation 130,450 127,749 2%
Provisions (3,838) 41,038 0%
Income Statement - Parent Company
Brazilian GAAP (Legislação Societária)

7/27/2019 2Q06 - Earnings Release
http://slidepdf.com/reader/full/2q06-earnings-release 20/32
20/32
R$ thousand 2Q 2006 2Q 2005 1Q 2006Chg.
2Q06/2Q05
Net Revenues 3,053,395 3,483,816 2,957,602 -12%
Domestic Market 2,334,602 2,595,465 2,131,823 -10%Export Market 718,793 888,351 825,779 -19%
COGS (2,040,310) (1,927,054) (2,069,201) 6%
Gross Profit 1,013,085 1,556,762 888,401 -35%
Gross Margin % 33% 45% 30% -12 p.p.
Operating Income (Expenses) (123,028) (198,108) (147,146) -38%
Selling (65,959) (60,836) (69,972) 8%
General and Administrative (74,173) (66,731) (60,468) 11%
Others, Net 17,104 (70,541) (16,706) -124%
EBIT 890,057 1,358,654 741,255 -34%
EBIT Margin % 29% 39% 25% -10 p.p.
Financial Result (77,665) (174,840) (118,331) -56%Financial Income 69,388 (111,538) (20,521) -162%
Financial Expenses (147,053) (63,302) (97,810) 132%
Equity Income 48,156 26,057 (58,561) 85%
Operating Result 860,548 1,209,871 564,363 -29%
Non-Operating Income 688 669 11,290 3%
Profit Before Taxes 861,236 1,210,540 575,653 -29%
Income Tax / Social Contribution (152,065) (395,613) (226,027) -62%
Income before Taxes 709,171 814,927 349,626 -13%
Minority Interests (5,122) (4,473) (5,013) 15%
Net Income 704,049 810,454 344,613 -13%
Net Margin 23% 23% 12% 0 p.p.Net Income per thousand shares 3.20930 3.69433 1.57087 -13%
EBITDA 1,046,473 1,629,244 908,039 -36%
EBITDA Margin % 34.3% 46.8% 30.7% -12,5 p.p.
Depreciation 171,999 198,452 170,838 -13%
Provisions (15,583) 72,138 (4,054) -122%
Income Statement - Consolidated
Brazilian GAAP (Legislação Societária)

7/27/2019 2Q06 - Earnings Release
http://slidepdf.com/reader/full/2q06-earnings-release 21/32
21/32
R$ thousand 1H 2006 1H 2005Chg.
1H06/1H05
Net Revenues 6,010,997 6,953,815 -14%
Domestic Market 4,466,425 5,395,871 -17%
Export Market 1,544,572 1,557,944 -1%
COGS (4,109,511) (3,657,840) 12%
Gross Profit 1,901,486 3,295,975 -42%
Gross Margin 32% 47% -15 p.p.
Operating Income (Expenses) (270,174) (368,044) -27%
Selling (135,931) (116,305) 17%
General and Administrative (134,641) (126,016) 7%
Others, Net 398 (125,723) -100%
EBIT 1,631,312 2,927,931 -44%
EBIT Margin 27% 42% -15 p.p.
Financial Result (195,996) (335,618) -42%
Financial Income 64,738 (34,539) -287%
Financial Expenses (260,734) (301,079) -13%
Equity Income (10,405) 174,624 -106%
Operating Result 1,424,911 2,766,937 -49%
Non-Operating Income 11,978 2,135 461%
Profit Before Taxes 1,436,889 2,769,072 -48%
Income Tax / Social Contribution (378,092) (940,515) -60%
Income before Taxes and Profit Sharing 1,058,797 1,828,557 -42%
Profit Sharing (10,135) (16,750) -42%
Net Income 1,048,662 1,811,807 -42%
Net Margin 17% 26% -9 p.p.
Net Income per thousand shares 4.78017 8.42327 -43%
EBITDA 1,954,512 3,359,273 -42%
EBITDA Margin 32.5% 48.3% -15,8 p.p.
Depreciation 342,837 338,299 1%
Provisions (19,637) 93,043 -121%
Income Statement - Consolidated
Brazilian GAAP (Legislação Societária)

7/27/2019 2Q06 - Earnings Release
http://slidepdf.com/reader/full/2q06-earnings-release 22/32
22/32
2Q 2006 2Q 2005 2Q 2006 2Q 2005
Operating Activities
Net Income (Loss) in the Period 709,429 804,691 704,049 810,454
Financial Expenses and Monetary Var/Net Exchge Var (114,037) 48,764 (25,213) (4,305)Depreciation, Exhaustion and Amortization 65,261 64,327 172,016 197,921
Investment Write-offs (Decrease in Permanent Assets) (38) 4,419 14 4,631
Equity in the Results of Subsidiaries/Associated Companies (262,070) (360,739) (48,156) (26,093)
Dividend Income from Subsidiaries 0 0 5,122 3,079
Income Tax and Social Contribution 51,486 194,983 152,065 395,125
Provisions (52,435) (25,740) (53,738) 17,254
Adjustment for Minority Participation 0 0 0 1,723
Total 397,596 730,705 906,159 1,399,789
Increase/Decrease of Assets
Accounts Receivables 27,776 (52,091) (35,139) (54,920)
Inventories (5,495) (124,815) (44,190) (407,737)
Recovery of Taxes (10,301) 3,776 (9,040) 78,624
Deferred Income Tax & Social Contrb'n (24,902) 56,327 136 89,983
Judicial Deposits (9,483) (6,820) (32,122) (12,160)
Accounts Receivables from Affiliated Companies 556,907 17,282 10,727 (25,636)
Others (11,249) 119,903 21,635 81,002
Total 523,253 13,562 (87,993) (250,844)
Increase (Decrease) of Liabilities
Increase (Decrease) in Suppliers 50,711 100,443 60,428 165,105
Amounts Owed to Affiliated Companies 36,375 4,942 17,291 (26,931)
Customers Advances 4,866 (2,532) 70,335 (32,861)
Tax Payable 17,007 (50,691) 28,740 (75,686)
Income Tax and Social Contribution (71,647) (93,831) (167,987) (174,658)
Others (40,767) (155,126) (31,841) (178,196)
Total (3,455) (196,795) (23,034) (323,227)
Cashflow Generated from Operating Activities 917,394 547,472 795,132 825,718
Financial Activities
Inflow of Loans and Financing 1,515 0 504,878 93,347
Payment of Loans and Financing (34,146) (47,934) (242,786) (338,337)
Interest paid on Loans, Financ., & taxes payable in installments (20,136) (13,598) (69,283) (76,736)
Swap Operation Redemptions (154,380) 0 (311,046) 140
Dividends Paid (529,897) (785,719) (543,414) (785,719)
Net Funds from Financial Activities (737,044) (847,251) (661,651) (1,107,305)
Investment Activities(Additions) in Long-term Investments (527,320) (7,833) 0 (25,647)
(Additions) to Permanent Assets, except Deferred Charges (71,530) (91,559) (119,755) (129,601)
(Additions) Right off of permanent assets 0 0 0 0
Funds Used for Investments (598,850) (99,392) (119,755) (155,248)
Exchange Variation of Cash and Cash Equivalents 153,547 (28) 148,456 (64,238)
Cash Balance Change (264,953) (399,199) 162,182 (501,073)
At the Beginning of the Period 1,126,582 1,469,959 1,879,794 2,333,825
At the End of the Period 861,629 1,070,760 2,041,976 1,832,752
R$ thousandParent Company Consolitaded
Cash Flow
Brazilian GAAP (Legislação Societária)

7/27/2019 2Q06 - Earnings Release
http://slidepdf.com/reader/full/2q06-earnings-release 23/32
23/32
1H 2006 1H 2005 1H 2006 1H 2005
Operating Activities
Net Income (Loss) in the Period 1,035,294 1,831,774 1,048,662 1,811,772
Financial Expenses and Monetary Var/Net Exchge Var (225,859) 122,242 (124,906) 189,099
Depreciation, Exhaustion and Amortization 130,450 127,749 342,837 337,768
Investment Write-offs (Decrease in Permanent Assets) 115 13,646 151 14,074
Equity in the Results of Subsidiaries/Associated Companies (332,983) (853,767) 10,405 (175,331)
Dividend Income from Subsidiaries 0 0 10,135 12,321
Income Tax and Social Contribution 182,629 570,136 378,092 938,388
Provisions (55,657) (20,158) (78,823) 40,955
Adjustment for Minority Participation 0 0 0 1,723
Total 733,989 1,791,622 1,586,553 3,170,769
Increase/Decrease of Assets
Accounts Receivables 19,394 8,933 29,668 180,184
Inventories 114,641 (264,163) 70,891 (668,236)
Recovery of Taxes (21,229) (1,789) (14,000) 61,711
Deferred Income Tax & Social Contrb'n (5,934) 170,417 28,325 251,926
(Decrease) in Judicial Deposits (7,701) (6,955) (36,697) (17,288)
Accounts Receivables from Affiliated Companies 554,360 26,844 281,220 (27,123)
Others 18,824 129,557 7,494 161,114
Total 672,355 62,844 366,901 (57,712)
Increase (Decrease) of Liabilities
Increase (Decrease) in Suppliers 48,479 165,515 6,650 192,019
Amounts Owed to Affiliated Companies 37,815 51,417 9,611 41,836
Customers Advances 8,333 (3,380) 114,531 (637)
Tax Payable 10,901 (37,637) 45,933 (72,813)
Income Tax and Social Contribution (328,202) (413,247) (619,792) (585,446)
Others (35,782) (222,042) 72,670 (181,010)
Total (258,456) (459,374) (370,397) (606,051)
Cashflow Generated from Operating Activities 1,147,888 1,395,092 1,583,057 2,507,006
Financial Activities
Inflow of Loans and Financing 2,226 0 545,724 206,626
Payment of Loans, Financing and Debentures (166,945) (374,779) (604,446) (990,367)
Interest paid on Loans, Financ. & taxes payable in installments (53,264) (52,777) (167,089) (193,636)
Swap Operation Redemptions (259,383) (15,830) (463,530) (78,005)
Dividends Paid (536,747) (792,728) (550,264) (807,639)
Net Funds from Financial Activities (1,014,113) (1,236,114) (1,239,605) (1,863,021)
Investment Activities
(Additions) in Long-term Investments (527,320) (295,624) (262,029) (391,572)
(Additions) to Permanent Assets, except Deferred Charges (119,486) (191,783) (231,091) (255,124)
(Additions) Right off of permanent assets 0 0 0 0
Funds Used for Investments (646,806) (487,407) (493,120) (646,696)
Exchange Variation of Cash and Cash Equivalents 292,741 1,050 260,990 (66,711)
Cash Balance Change (220,290) (327,379) 111,322 (69,422)
At the Beginning of the Period 1,081,919 1,398,139 1,930,654 1,902,174At the End of the Period 861,629 1,070,760 2,041,976 1,832,752
Cash Flow
Brazilian GAAP (Legislação Societária)
R$ thousandParent Company Consolitaded

7/27/2019 2Q06 - Earnings Release
http://slidepdf.com/reader/full/2q06-earnings-release 24/32
24/32
30-jun-06 31-dec-05 30-jun-06 31-dec-05
Current Assets 3,159,251 3,719,421 6,602,557 6,640,126
Cash and Cash Equivalents 861,629 1,081,919 2,041,976 1,930,654
Trade Accounts Receivable 856,070 875,464 1,642,623 1,682,139
Taxes Recoverable 34,622 13,393 101,535 87,535
Inventories 1,150,836 1,265,477 2,460,970 2,531,861
Deferred Income Tax & Social Contrb'n 190,346 184,412 202,317 243,617
Other Securities Receivables 65,748 298,756 153,136 164,320
Long-Term Receivable 755,346 1,090,700 1,311,080 1,549,137 Deferred Income Tax & Social Contrb'n 491,550 491,550 837,641 824,666
Related Company Credits 6,219 327,405 1,059 267,140
Deposits at Law 182,319 174,618 340,640 303,943
Taxes Recoverable 23,774 42,074 45,623 63,989
Others 51,484 55,053 86,117 89,399
Permanent Assets 9,309,823 8,460,759 10,152,705 10,005,995
Investments 5,888,177 5,028,034 1,606,724 1,356,091
Property, Plant and Equipment 3,421,646 3,432,725 8,518,726 8,621,736
Deferred - - 27,255 28,168
Total Assets 13,224,420 13,270,880 18,066,342 18,195,258
Balance Sheet - AssetsBrazilian GAAP (Legislação Societária) - R$ thousand
AssetsParent Company Consolidated

7/27/2019 2Q06 - Earnings Release
http://slidepdf.com/reader/full/2q06-earnings-release 25/32
25/32
30-jun-06 31-dec-05 30-jun-06 31-dec-05
Current Liabilities 1,429,094 2,111,496 3,309,044 3,940,371
Loans and Financing and Taxes Payable in Installments 329,534 543,092 1,002,957 1,182,990
Suppliers, Subcontractors and Freight 192,963 144,484 401,746 395,096
Taxes, Charges and Payroll Taxes 249,449 386,736 453,709 676,851
Related Companies 104,431 66,616 67,819 58,208
Financial Instruments 54,081 271,587 497,457 675,817
FEMCO - - 7,087 10,607
Dividends Payable 359,640 540,544 361,064 546,955
Others 138,996 158,437 517,205 393,847
Long-Term Liabilities 2,302,070 2,351,422 5,213,227 5,418,178
Loans and Financing and Taxes Payable in Installments 700,546 724,773 2,345,684 2,436,823
Related Companies 59,041 57,658 11,186 14,062
Provision for Contingencies 552,246 579,083 1,030,900 1,058,218
Actuarial Liability 898,628 899,990 983,176 980,086
Financial Instruments 12,995 - 260,915 336,736
FEMCO - - 289,485 312,153
Others 78,614 89,918 291,881 280,100
Minority Interests - - 92,839 84,139
Shareholders' Equity 9,493,256 8,807,962 9,451,232 8,752,570
Capital 5,400,000 2,400,000 5,400,000 2,400,000
Reserves 3,057,962 2,494,671 3,002,570 2,434,141
Revenues from Fiscal Year 1,035,294 3,913,291 1,048,662 3,918,429
Total Liabilities and Shareholders' Equity 13,224,420 13,270,880 18,066,342 18,195,258
Balance Sheet - Liabilities and Shareholders' EquityBrazilian GAAP (Legislação Societária) - R$ thousand
Liabilities and Shareholders' EquityParent Company Consolidated

7/27/2019 2Q06 - Earnings Release
http://slidepdf.com/reader/full/2q06-earnings-release 26/32
26/32
R$ thousand 2Q 2006 2Q 2005 1Q 2006Chg.
2Q06/2Q05
Net Revenues 1,234,902 1,469,912 1,113,086 -16%
Domestic Market 880,383 964,218 734,745 -9%
Export Market 354,519 505,694 378,341 -30%
COGS (875,836) (848,717) (862,620) 3%
Gross Profit 359,066 621,195 250,466 -42%
Gross Margin 29% 42% 23% -13 p.p.
Operating Income (Expenses) (37,988) (77,135) (13,948) -51%
Selling (15,931) (14,970) (16,052) 6%
General and Administrative (15,073) (14,835) (11,176) 2%
Others, Net (6,984) (47,330) 13,280 -85%
EBIT 321,078 544,060 236,518 -41%
EBIT Margin 26% 37% 21% -11 p.p.Financial Result (46,999) (29,246) (34,216) 61%
Operating Result 274,079 514,814 202,302 -47%
Non-Operating Income (490) (486) (465) 1%
Profit Before Taxes 273,589 514,328 201,837 -47%
Income Tax / Social Contribution (91,220) (175,583) (67,234) -48%
Minority Interests (1,672) (1,366) (989) 22%
Net Income 180,697 337,379 133,614 -46%
EBITDA 416,824 698,153 307,054 -40%
EBITDA Margin 33.8% 47.5% 27.6% -13,7 p.p.
Companhia Siderúrgica Paulista - COSIPA
Income Statement - ConsolidatedBrazilian GAAP (Corporate Law)
R$ thousand 1H 2006 1H 2005Chg.
1H06/1H05
Net Revenues 2,347,988 2,827,565 -17%
Domestic Market 1,615,128 1,936,524 -17%
Export Market 732,860 891,041 -18%
COGS (1,738,456) (1,564,409) 11%
Gross Profit 609,532 1,263,156 -52%
Gross Margin 26% 45% -19 p.p.
Operating Income (Expenses) (51,936) (134,293) -61%
Selling (31,983) (33,084) -3%
General and Administrative (26,249) (29,027) -10%Others, Net 6,296 (72,182) -109%
EBIT 557,596 1,128,863 -51%
EBIT Margin 24% 40% -16 p.p.
Financial Result (81,215) (153,876) -47%
Operating Result 476,381 974,987 -51%
Non-Operating Income (955) (1,245) -23%
Profit Before Taxes 475,426 973,742 -51%
Income Tax / Social Contribution (158,454) (335,165) -53%
Minority Interests (2,661) (4,429) -40%
Net Income 314,311 634,148 -50%
EBITDA 723,878 1,367,779 -47%
EBITDA Margin 30.8% 48.4% -17,6 p.p.

7/27/2019 2Q06 - Earnings Release
http://slidepdf.com/reader/full/2q06-earnings-release 27/32
27/32
1Q 06 1Q 05 1H 2006 1H 2005
Operating ActivitiesNet Income (Loss) in the Period 180,697 337,379 314,311 634,148
Financial Expenses and Monetary Var/Net Exchge Var 59,323 (15,790) 79,410 97,881
Depreciation, Exhaustion and Amortization 93,595 121,587 186,638 186,133
Investment Write-offs (Decrease in Permanent Assets) 33 9 33 229
Dividend Income from Subsidiaries 0 0 0 0
Income Tax and Social Contribution 91,220 175,582 158,454 335,164
Provisions 7,234 41,680 (14,901) 58,505
Others adjustments 1,672 1,367 2,661 4,430
Adjustment for Minority Participation 0 0 0 0
Total 433,774 661,814 726,606 1,316,490
Increase/Decrease of Assets
Increase (Decrease) in Accounts Receivables (35,946) 23,098 82,309 177,710Increase (Decrease) in Inventories (33,352) (245,653) (42,979) (320,921)
Increase (Decrease) in Recovery of Taxes (2,609) (4,777) (2,920) 27,933
Increase (Decrease) from Deferred Income Tax & Social Contrb'n (2,786) 0 0 0
Increase (Decrease) in Judicial Deposits (20,343) (4,514) (27,471) (8,879)
Others 17,412 (28,811) 19,453 28,779
Total (77,624) (260,657) 28,392 (95,378)
Increase (Decrease) of Liabilities
Increase (Decrease) in Suppliers 42,734 76,806 9,738 62,168
Amounts Owed to Affiliated Companies 0 0 (570) 0
Tax Payable 9,939 (23,521) 30,383 (20,623)
Income Tax and Social Contribution (54,779) (74,944) (214,316) (183,098)
Others (18,941) (77,411) (10,439) (59,426)
Total (21,047) (99,070) (185,204) (200,979)
Cashflow Generated from Operating Activities 335,103 302,087 569,794 1,020,133
Financial Activities
Inflow of Loans and Financing 464,715 16,191 482,126 19,822
Payment of Loans, Financing and Debentures (146,156) (181,205) (354,457) (430,308)
Interest paid on Loans, Financ., Debent.and tax installments (34,941) (52,800) (96,232) (128,337)
Swap Operation Redemptions (135,422) 16 (182,551) (50,768)
Dividends Paid (1,477) (118,077) (1,477) (133,811)
Others 0 0 0 0
Net Funds from Financial Activities 146,719 (335,875) (152,591) (723,402)
Investment Activities
(Additions) to Permanent Assets, except Deferred Charges (36,864) (40,749) (91,706) (62,264)
Funds Used for Investments (36,864) (40,749) (91,706) (62,264)
Exchange Variation of Cash and Cash Equivalents (5,176) (40,934) (15,882) (45,489)
Cash Balance Change 439,782 (115,471) 309,615 188,978
At the Beginning of the Period 457,399 637,836 587,566 333,387
At the End of the Period 897,181 522,365 897,181 522,365
Consolitaded
Companhia Siderúrgica Paulista - COSIPA
Cash Flow
Brazilian GAAP (Corporate Law)
R$ thousandConsolitaded

7/27/2019 2Q06 - Earnings Release
http://slidepdf.com/reader/full/2q06-earnings-release 28/32
28/32
Assets30-jun-06 31-Dec-05
Current Assets 2,578,501 2,349,188
Cash and Cash Equivalents 897,181 587,566
Trade Accounts Receivable 507,940 586,749
Taxes Recoverable 18,036 17,978
Inventories 1,083,158 1,040,179
Deferred Income Tax & Social Contrb'n 8,215 51,986
Other Securities Receivables 63,971 64,730
Long-Term Receivable 411,812 366,490
Deferred Income Tax & Social Contrb'n 235,582 219,353
Deposits at Law 126,062 96,929
Taxes Recoverable 21,248 21,264
Others 28,920 28,944
Permanent Assets 4,535,184 4,626,838
Investments 131 131
Property, Plant and Equipment 4,509,186 4,600,125
Deferred 25,867 26,582
Total Assets 7,525,497 7,342,516
Companhia Siderúrgica Paulista - COSIPA
Balance Sheet - Assets
Consolidated
Brazilian GAAP (Corporate Law) - R$ thousand
7/27/2019 2Q06 - Earnings Release
http://slidepdf.com/reader/full/2q06-earnings-release 29/32
29/32
Liabilities and Shareholders' Equity
30-Jun-06 31-Dec-05
Current Liabilities 1,496,879 1,864,879
Loans and Financing and Taxes Payable in Installments 580,910 688,995
Suppliers, Subcontractors and Freight 204,039 236,526
Taxes Payable in Installments 66,743 33,569
Income Tax and Social Contribution 93,356 202,338
Salaries 56,841 61,862
Financial Instruments 397,799 367,103
Actuarial Liability 7,087 10,605
Dividends Payable 1,424 205,467
Others 88,680 58,414
Long-Term Liabilities 2,705,395 2,743,920
Loans and Financing and Taxes Payable in Installments 1,673,291 1,576,109
Provision for Contingencies 403,020 402,445
Actuarial Liability 319,320 337,536
Financial Instruments 133,977 225,478
Deferred Income Tax & Social Contrb'n 171,073 147,431
Others 4,714 54,921
Minority Interests 30,380 29,185
Shareholders' Equity 3,292,843 2,704,532
Capital 2,037,814 1,763,814
Reserves 940,718 940,718
Revenues from Fiscal Year 314,311 -
Total Liabilities and Shareholders' Equity 7,525,497 7,342,516
Companhia Siderúrgica Paulista - COSIPA
Balance Sheet - Liabilities and Shareholders' EquityBrazilian GAAP (Corporate Law) - R$ thousand
Consolidated

7/27/2019 2Q06 - Earnings Release
http://slidepdf.com/reader/full/2q06-earnings-release 30/32
30/32
Total 1,419 1,379 1,396 1,635 1,800 1,836
Heavy Plates 1,591 1,645 1,807 2,009 2,031 2,034Hot Coils/Sheets 1,294 1,239 1,340 1,445 1,673 1,654Cold Coils/Sheets 1,550 1,485 1,512 1,610 1,834 1,922Electrogalvanized Coils 1,987 1,943 2,052 2,191 2,253 2,291Hot Dip Galvanized Coils 1,934 1,861 2,095 2,094 2,195 2,289Processed Products 1,812 1,766 1,982 2,078 2,296 2,342Slabs 656 692 644 803 1,052 1,081
3Q 05 2Q 051Q 06 1Q 052Q 06
Net Revenues per tonne - USIMINAS + COSIPA
R$ / t.4Q 05
Thousand tonsChg.
2Q06/2Q05
Chg.
1H06/1H0
TOTAL SALES 2,028 100% 1,829 100% 1,954 100% 11% 3,982 100% 3,598 100% 11%
Heavy Plates 443 22% 424 24% 365 19% 4% 808 20% 800 22% 1%
Hot Coils/Sheets 576 28% 434 24% 540 28% 33% 1,115 28% 945 26% 18%Cold Coils/Sheets 505 25% 481 26% 521 27% 5% 1,028 26% 933 26% 10%
Electrogalvanized Coils 63 3% 55 3% 61 3% 15% 124 3% 128 4% -3%
Hot Dip Galvanized Coils 107 5% 80 4% 105 5% 34% 212 5% 154 4% 38%
Processed Products 77 4% 79 4% 83 4% -3% 159 4% 144 4% 10%
Slabs 257 13% 276 15% 279 14% -7% 536 14% 494 14% 9%
TOTAL SALES - DOMESTIC MARKET 1,397 69% 1,275 70% 1,202 62% 10% 2,598 65% 2,660 74% -2%
Heavy Plates 262 13% 353 19% 211 11% -26% 473 12% 659 18% -28%
Hot Coils/Sheets 528 26% 401 22% 434 23% 32% 961 24% 887 25% 8%
Cold Coils/Sheets 382 19% 336 18% 349 18% 14% 732 18% 729 20% 0%
Electrogalvanized Coils 54 3% 46 2% 44 2% 17% 98 3% 97 3% 1%
Hot Dip Galvanized Coils 86 4% 69 4% 77 4% 25% 163 4% 143 4% 14%
Processed Products 43 2% 43 2% 43 2% 0% 85 2% 85 2% 0%
Slabs 42 2% 27 1% 44 2% 56% 86 2% 60 2% 43%
TOTAL SALES - EXPORTS 631 31% 554 30% 752 38% 14% 1,384 35% 938 26% 48%
Heavy Plates 181 9% 71 4% 154 8% 155% 335 9% 141 4% 138%
Hot Coils/Sheets 48 2% 33 2% 106 5% 45% 154 4% 58 2% 166%
Cold Coils/Sheets 123 6% 145 8% 172 9% -15% 296 7% 204 5% 45%
Electrogalvanized Coils 9 0% 9 0% 17 1% 0% 26 1% 31 1% -16%
Hot Dip Galvanized Coils 21 1% 11 1% 28 1% 0% 49 1% 11 0% 345%
Processed Products 34 2% 36 2% 40 2% -6% 74 2% 59 2% 25%
Slabs 215 11% 249 13% 235 12% -14% 450 11% 434 12% 4%
1H 2006 1H 2005
Sales Volume Breakdown - Consolidated
1Q 20062Q 2006 2Q 2005

7/27/2019 2Q06 - Earnings Release
http://slidepdf.com/reader/full/2q06-earnings-release 31/32
31/32
Thousand tonnesChg.
2Q06/2Q05
Domestic Market 1,396 100% 1,275 100% 1,202 100% 10%
Auto 179 13% 167 13% 153 13% 7%Autoparts 255 18% 167 13% 223 19% 53%
Shipbuilding 5 0% 12 1% 4 0% -59%
Line Pipes 71 5% 111 9% 71 6% -36%
Small Diameter Pipes 107 8% 96 8% 92 8% 11%
Packaging 22 2% 20 2% 21 2% 9%
Household Appliances 34 2% 22 2% 29 2% 53%
Civil Construction 128 9% 96 8% 108 9% 34%
Electrical Equipment 67 5% 56 4% 59 5% 20%
Distributors 338 24% 307 24% 273 23% 10%
Industrial Equipment 58 4% 37 3% 41 3% 59%
Others 132 9% 184 13% 128 10% -28%
2Q 06 2Q 05 1Q 06
Sectorial Sales - Consolidated
1H06 (*) 2005 (*) 2004 (*) 2003 (*)
DOMESTIC MARKET 52% 53% 55% 60%
Auto 58% 59% 55% 62%
Autoparts 62% 59% 62% 67%
Shipbuilding 100% 100% 100% 100%
Electrical Equipment 64% 66% 63% 58%
Household Appliances 39% 33% 36% 44%
Line Pipes 95% 94% 98% 95%
Small Diameter Pipes 52% 54% 60% 68%
Packaging 13% 14% 15% 16%
Civil Construction 44% 44% 48% 58%
Distributors 44% 44% 51% 59%
(*) Defined by USIMINAS, Cosipa, CSN, Acesita and CST markets.
Source: Information System - IBS
Market Share - Usiminas System (*)
(% volume)

7/27/2019 2Q06 - Earnings Release
http://slidepdf.com/reader/full/2q06-earnings-release 32/32
31-dec-05Short Term Long Term TOTAL TOTAL
TOTAL DEBT
Foreign Currency (*) 629,865 2,030,916 2,660,781 2,757,591 -4%
IGP-M 114,983 55,346 170,329 223,758 -24%
TJLP 216,740 94,525 311,265 404,768 -23%
Others 19,074 26,513 45,587 57,685 -21%
Sub-Total 980,662 2,207,300 3,187,962 3,443,802 -7%
Debentures 0 0 0 0 0%
Sub-Total 980,662 2,207,300 3,187,962 3,443,802 -7%
Taxes Payable in Installments 22,295 138,384 160,679 176,011 -9%
TOTAL 1,002,957 2,345,684 3,348,641 3,619,813 -7%
FEMCO 7,087 289,485 296,572 322,760 -8%
TOTAL DEBT 1,010,044 2,635,169 3,645,213 3,942,573 -8%Cash and Cash Equivalents 2,041,976 1,930,654 6%
NET DEBT 1,603,237 2,011,919 -20%
(*) 91.2%
Chg.
jun06/dec05
Loans and Financing by Index - Consolidated
30-jun-06
of total foreign currency is denominated in US dollars
R$ million
R$ million 2Q 2006 2Q 2005 1Q 2006Chg.
2Q06/2Q051H 2006 1H 2005
Chg.
1H06/1H05
Monetary Effects (13,296) (24,869) (18,324) -47% (31,620) (54,318) -42%
Exchange Variation 41,475 241,119 89,955 -83% 131,430 219,543 -40%
Hedge Income (Expenses) (41,031) (317,748) (167,402) -87% (208,433) (381,029) -45%
Interest on Loans, Financing, ACC's and Pre-Payment (66,174) (87,033) (70,604) -24% (136,778) (180,468) -24%
Financial Income 56,852 58,175 78,972 -2% 135,824 141,024 -4%
Other Financial Expenses (55,491) (44,484) (30,928) 25% (86,419) (80,370) 8%
NET INTEREST INCOME (77,665) (174,840) (118,331) -56% (195,996) (335,618) -42%
Financial Income - Consolidated