2q21 earnings presentation aug 2021
TRANSCRIPT

1
2Q21 EARNINGS PRESENTATION AUG 2021

2
This presentation and the information contained herein does not constitute an offer for sale or solicitation of an offer to buy any securities of the issuer.
This document contains forward-looking statements within the meaning of Section 27A of the Securities Act of 1933, and Section 21E of the Securities Exchange Act of 1934, each as amended, including, in particular, statements about StoneCo Ltd.’s (the“Company”) plans, strategies and prospects and estimates of industry growth or prospects. These statements identify prospective information and may include words such as “believe,” “may,” “will,” “aim,” “estimate,” “continue,” “anticipate,” “intend,”“expect,” “forecast,” “plan,” “predict,” “project,” “potential,” “aspiration,” “objectives,” “should,” “purpose,” “belief,” and similar, or variations of, or the negative of such words and expressions, although not all forward-looking statements contain theseidentifying words. All statements other than statements of historical fact contained in this presentation may be forward-looking statements. The Company has based these forward-looking statements on its estimates and assumptions of its financial resultsand its current expectations and projections about future events and financial trends that it believes may affect its financial condition, results of operations, business strategy, short-term and long-term business operations and objectives, and financial needsas of the date of this presentation. These forward-looking statements are conditioned upon and also involve a number of known and unknown risks, uncertainties, and other factors that could cause actual results, performance or events to differ materiallyfrom those anticipated by these forward-looking statements. Such risks, uncertainties, and other factors may be beyond the Company’s control and may pose a risk to the Company’s operating and financial condition. In addition, the Company operates in avery competitive and rapidly changing environment. New risks emerge from time to time. It is not possible for the Company’s management to predict all risks, nor can the Company assess the impact of all factors on its business or the extent to which anyfactor, or combination of factors, may cause actual results to differ materially from those contained in any forward-looking statements that the Company may make. Accordingly, you should not rely upon forward-looking statements as predictions of futureevents.
Risks that contribute to the uncertain nature of the forward-looking statements include, among others, risks associated with the Company’s ability to anticipate market needs and develop and deliver new and enhanced products and services functionalitiesto address the rapidly evolving market for payments and point-of-sale, financial technology, and marketing services; the Company’s ability to differentiate itself from its competition by delivering a superior customer experience and through its network ofhyper-local sales and services, the Company’s ability to expand its product portfolio and market reach and deal with the substantial and increasingly intense competition in its industry; the Company’s ability to retain existing clients, attract new clients, andincrease sales to all clients; changes to the rules and practices of payment card networks and acquiring processors; the Company’s ability to obtain debt and equity financings; possible fluctuations in the Company’s results of operation and operating metrics;the effect of management changes and business initiatives; and other known and unknown risks, all of which are difficult to predict and many of which are beyond the Company’s control. The Company has provided additional information in its reports on filewith the Securities and Exchange Commission concerning factors that could cause actual results to differ materially from those contained in this presentation and encourages you to review these factors. The statements contained in this presentation arebased on the Company’s current beliefs and expectations and speak only as of the date of this presentation. The Company disclaims any intention or obligation to update or revise any forward-looking statements, whether as a result of new information,future events and/or otherwise, except to the extent required by law.
To supplement the financial measures presented in this press release and related conference call, presentation, or webcast in accordance with IFRS, Stone also presents the following non-IFRS measures of financial performance: Adjusted Net Income,Adjusted Net Cash Provided by / (Used in) Operating Activities, Adjusted Free Cash Flow and Adjusted Net Cash. A “non-IFRS financial measure” refers to a numerical measure of Stone’s historical or future financial performance or financial position thateither excludes or includes amounts that are not normally excluded or included in the most directly comparable measure calculated and presented in accordance with IFRS in Stone’s financial statements. Stone provides certain non-IFRS measures asadditional information relating to its operating results as a complement to results provided in accordance with IFRS. The non-IFRS financial information presented herein should be considered in conjunction with, and not as a substitute for or superior to, thefinancial information presented in accordance with IFRS. There are significant limitations associated with the use of non-IFRS financial measures. Further, these measures may differ from the non-IFRS information, even where similarly titled, used by othercompanies and therefore should not be used to compare Stone’s performance to that of other companies. Stone has presented Adjusted Net Income to eliminate the effect of items from Net Income that it does not consider indicative of its continuingbusiness performance within the period presented. Stone defines Adjusted Net Income as Net Income (Loss) for the Period, adjusted for (1) non-cash expenses related to the grant of share-based compensation and the fair value (mark-to-market) adjustmentfor share-based compensation classified as a liability, (2) amortization of intangibles related to acquisitions, (3) one-time impairment charges, (4) unusual income and expenses and (5) tax expense relating to the foregoing adjustments. Stone has presentedAdjusted Free Cash Flow metric, which has limitations as it omits certain components of the overall Cash Flow Statement and does not represent the residual cash flow available for discretionary expenditures. For example, this metric does not incorporatethe portion of payments representing principal reductions of debt or cash payments for business acquisitions. Therefore, we believe it is important to view Free Cash Flows measures only as a complement to our entire consolidated Statements of Cash Flows.Stone has presented Adjusted Net Cash metric in order to adjust its Net Cash / (Debt) by the balances of Accounts Receivable from Card Issuers and Accounts Payable to Clients, since these lines vary according to the Company’s funding source together withthe lines of (i) Cash and Cash Equivalents, (ii) Short-term Investments, and (iii) Debt balances, due to the nature of Stone’s business and prepayment operation.
As certain of these measures are estimates of, or objectives targeting, future financial performance (“Estimates”), they are unable to be reconciled to their most directly comparable financial measures calculated in accordance with IFRS. There can be noassurance that the Estimates or the underlying assumptions will be realized, and that actual results of operations or future events will not be materially different from the Estimates. Under no circumstances should the inclusion of the Estimates be regardedas a representation, undertaking, warranty or prediction by the Company, or any other person with respect to the accuracy thereof or the accuracy of the underlying assumptions, or that the Company will achieve or is likely to achieve any particular results.
Certain market and/or industry data used in this presentation were obtained from internal estimates and studies, where appropriate, as well as from market research and publicly available information. Such information may include data obtained fromsources believed to be reliable. However, the Company disclaims the accuracy and completeness of such information, which is not guaranteed. Internal estimates and studies, which the Company believes to be reliable, have not been independently verified.The Company cannot assure recipients of this presentation that such data is accurate or complete.
The trademarks included herein are the property of the owners thereof and are used for reference purposes only. Such use should not be construed as an endorsement of the products or services of the Company.
Recipients of this presentation are not to construe the contents of this summary as legal, tax or investment advice and recipients should consult their own advisors in this regard. This presentation has been prepared solely for informational purposes. Neitherthe information contained in this presentation, nor any further information made available by the Company or any of its affiliates or employees, directors, representatives, officers, agents or advisers in connection with this presentation will form the basis ofor be construed as a contract or any other legal obligation.
Disclaimer

3
Highlights of 2Q21 Earnings
✓ Over 1 million active clients in SMB with 188,000 net adds in 2Q21
✓ SMB (ex-Micro) average TPV per client +8% q/q and average TPV
per Micro client +60% q/q
✓ Stone SMB clients settling in Stone banking account increased to
273,000 (39% of Stone SMB client base vs 29% in 1Q21)
Strong fundamentals in SMB core business with accelerating TPV growth and record net addition of clients
▪ TPV with highest sequential growth in the industry, largely driven by SMBs▪ Record net addition of clients in SMBs▪ Healthy unit economics, with increasing average TPV and revenue per client▪ Increased engagement in banking products
✓ Additional provisions led to negative impact from credit product in Total Revenue and Income of R$397.2 mm
✓ Coverage ratio of 209% for NPL 60 days with no payments and 112% for NPL 60 days with no principal amortization
Short-term challenges in Credit, with sustained positive long-term prospects▪ Short-term headwinds in credit, potentialized by malfunctioning of registry of receivables▪ We decided to increase coverage for potential losses, with negative impact in revenues▪ Focus on re-building product, processes and policies given the new environment and learnings
✓ StoneCo Total Revenue and Income (ex-Credit)1 +68% y/y✓ StoneCo Adjusted EBT (ex-Credit)2 +58% y/y, despite
approximately R$180mm incremental investments in the growth of our business
Significant growth in payments revenue and continued investments in our business ▪ Payments and software revenue growing fast: (i) subscription revenue +90% y/y; (ii) revenue from
transaction activities +58% y/y▪ Strong investments in the growth of the business: selling expenses, especially marketing and hubs,
technology and client service operations
1) Growth of Total Revenue and Income excluding revenues from credit product both from 2Q20 and from 2Q21.2) StoneCo Adjusted EBT excluding the credit product revenue and financial expenses related to the product. 3) Pro-forma numbers for software are calculated as if StoneCo had acquired 100% stake of the software companies in its portfolio, regardless of the stake acquired. In this number, we considered only companies in which we have the option to increase our stake and consolidate in our results.
StoneCo has made minority investments in some companies and has not yet exercised option to consolidate them. There is no assurance that StoneCo will exercise its option to consolidate any companies in which it has made a minority investment. 4) StoneCo unique clients, excluding overlap of clients that use more than one solution.
✓ Expand and enhance our core SMB operations and software capabilities✓ Significant investments in our banking product
✓ Pro-forma software revenue3 of R$62.4 mm (+52.5% y/y organically)
✓ Subscribed client base4 of 143,000, 4.1x y/y
✓ Annualized software pro-forma revenue over R$1.2b when considering Linx, which will be consolidated in the 3Q21
Software business growing organically, with focus on executing on Linx priorities
▪ Value of the asset reconfirmed at Linx: clients with high stickiness, high switching costs, access to unparalleled level of data and knowledge of retail
▪ Focus on migrating Linx Pay to Stone platform, investing in platform evolution and capturing synergies
✓ Working towards our vision for “Stone Capital”, an asset-light business model for credit
✓ Further advance in partnership with Inter
Building capabilities for the long-term
4
18.4%
12.6%11.2% 11.1%
3.3%
0.0%
2.0%
4.0%
6.0%
8.0%
10.0%
12.0%
14.0%
16.0%
18.0%
20.0%
Player 2 Player 3 Player 4
2Q21 TPV growth q/q
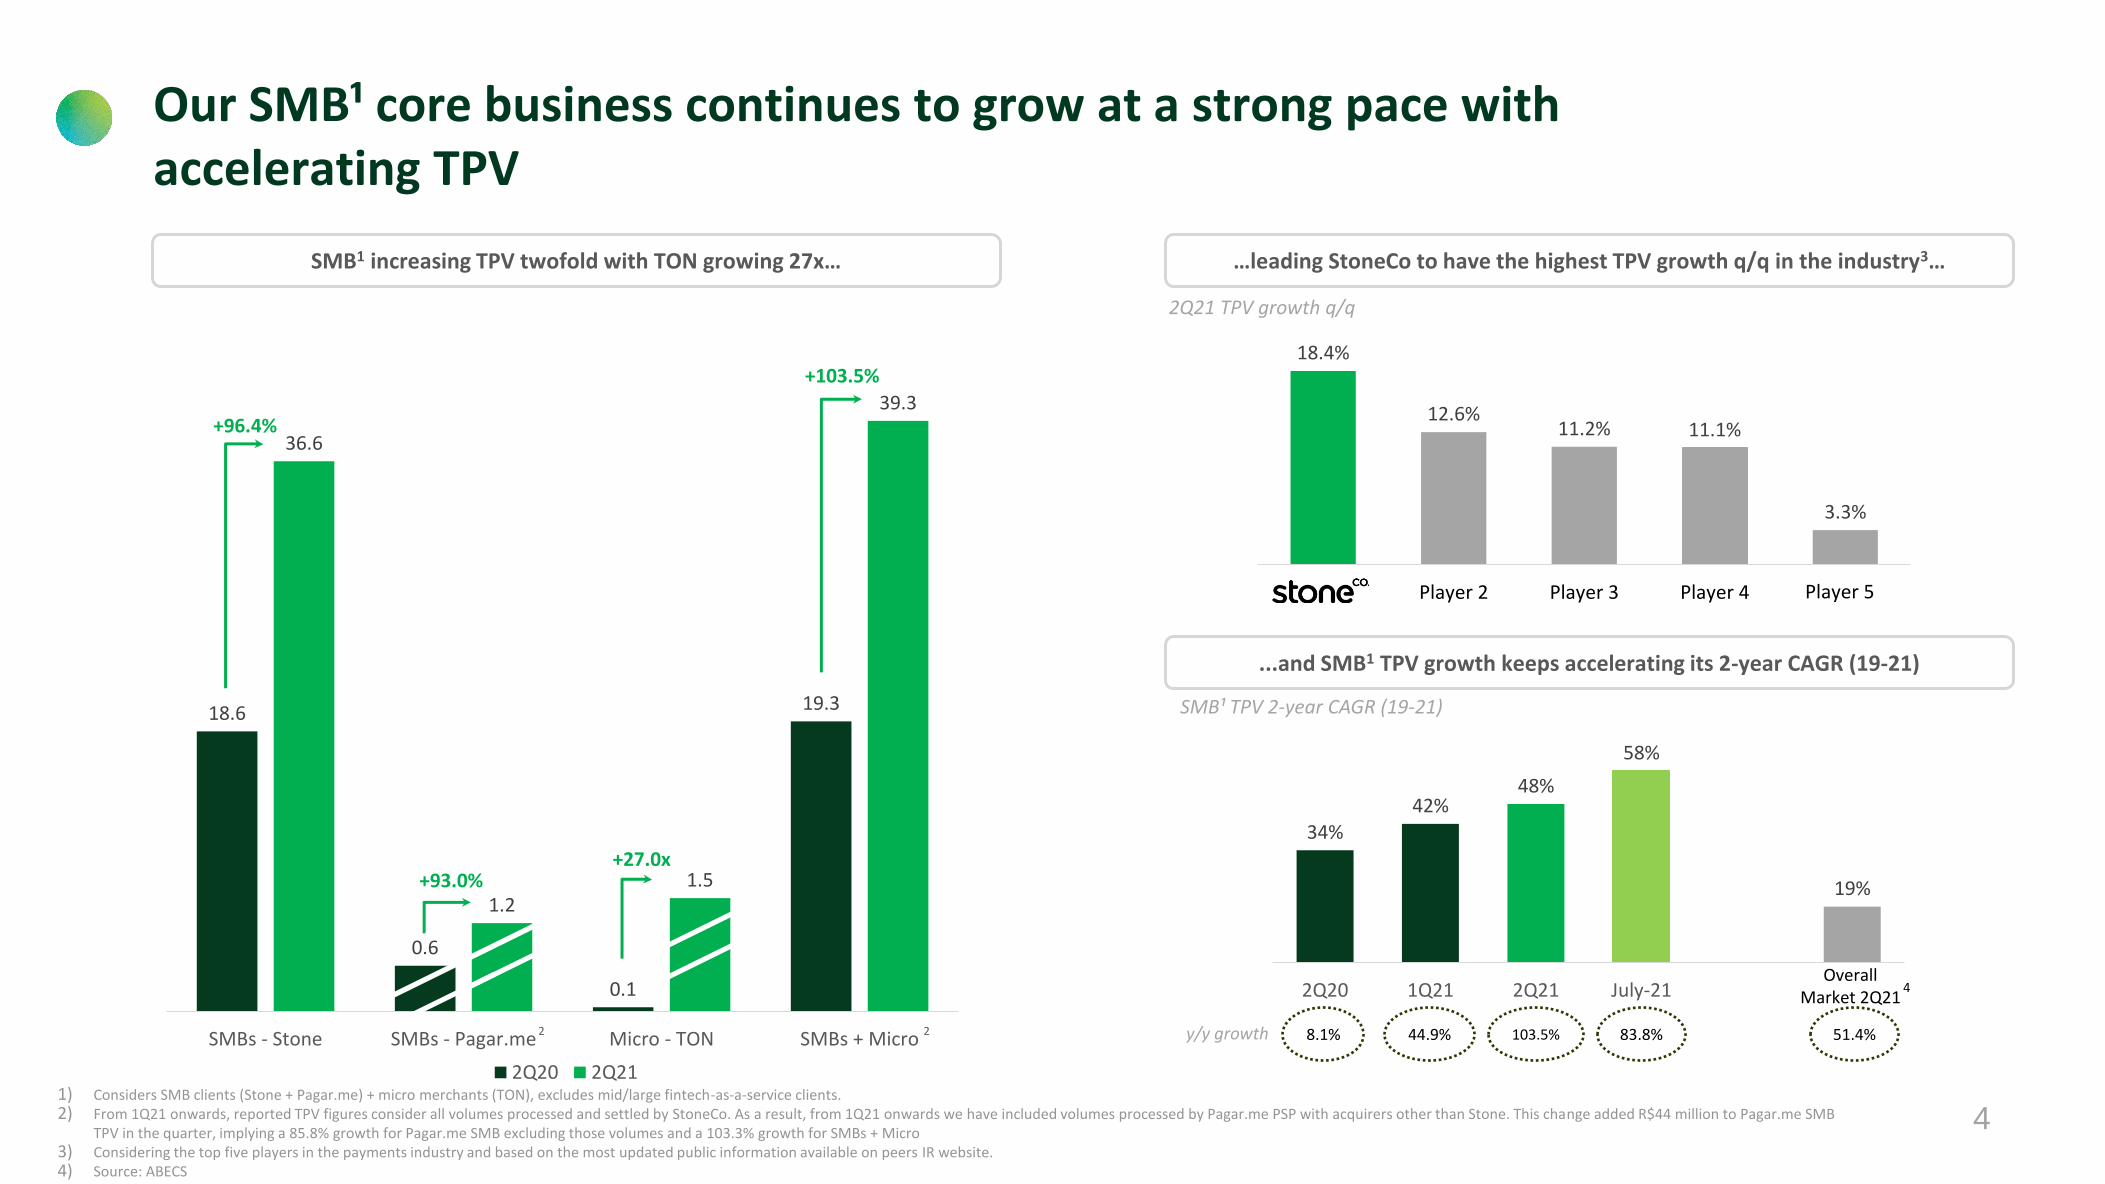
Our SMB¹ core business continues to grow at a strong pace with accelerating TPV
1) Considers SMB clients (Stone + Pagar.me) + micro merchants (TON), excludes mid/large fintech-as-a-service clients.2) From 1Q21 onwards, reported TPV figures consider all volumes processed and settled by StoneCo. As a result, from 1Q21 onwards we have included volumes processed by Pagar.me PSP with acquirers other than Stone. This change added R$44 million to Pagar.me SMB
TPV in the quarter, implying a 85.8% growth for Pagar.me SMB excluding those volumes and a 103.3% growth for SMBs + Micro3) Considering the top five players in the payments industry and based on the most updated public information available on peers IR website.4) Source: ABECS
SMB1 increasing TPV twofold with TON growing 27x…
34%42%
48%
58%
19%
0%
10%
20%
30%
40%
50%
60%
70%
2Q20 1Q21 2Q21 July-21
SMB¹ TPV 2-year CAGR (19-21)
...and SMB1 TPV growth keeps accelerating its 2-year CAGR (19-21)
…leading StoneCo to have the highest TPV growth q/q in the industry3…
Player 5
18.6
0.6
0.1
19.3
36.6
1.21.5
39.3
SMBs - Stone SMBs - Pagar.me Micro - TON SMBs + Micro
2Q20 2Q21
+103.5%
+27.0x+93.0%
+96.4%
8.1% 44.9% 83.8%103.5%y/y growth
4
51.4%2 2
Overall Market 2Q21

5
Strong active base growth with increasing average TPV
Active Clients – payments (‘000)1 Average TPV per SMB (ex-Micro)2 active clients
Quarterly Net Adds – payments (‘000)1 Average TPV per Micro client
100
119129
150
2Q20 1Q21 2Q21 July-21
100
141
226258
2Q20 1Q21 2Q21 July-21
1) “Active Clients” are merchants that have completed at least one electronic payment transaction with Stone or Pagar.me SMB within the preceding 90 day and with TON in the preceding 365 days.2) Consider only Stone SMB and Pagar.me SMB.
-9.1
11.92.6
47.3
140.0
188.0
SMBs (Stone and Pagar.me) Micro (TON) SMBs + Micro
2Q20 2Q21
482.9
35.2
517.3
717.6
330.3
1,045.8
SMBs (Stone and Pagar.me) Micro (TON) SMBs + Micro
2Q20 2Q21
+102.2%
+9.4x
+48.6%
Indexed to 100
Indexed to 100

6
10% 14%20%
27%34%
41%48%
0%
10%
20%
30%
40%
50%
60%
70%
80%
90%
100%
4Q19 1Q20 2Q20 3Q20 4Q20 1Q21 2Q21
Continued penetration of financial solutions
1) Clients who have transacted at least R$ 1 in the past 30 days.2) Stone SMB payments clients which are also active in digital banking, credit or both solutions within the last 90d3) Considers clients liquidating in our Stone Digital Banking account regardless of which acquirer is being used.4) Includes Pix In, wiretransfers, boleto issuance and TPV from other acquirers.5) Includes Pix Out, wiretransfers, bill payments, boletos paid, withdrawals, recharge and others.
Nearly half of Stone SMB are active in multiple financial solutions2SMB Money-In and Money-Out Transactions
67.0 105.6
167.7
237.4
340.1
-
50.0
100.0
150.0
200.0
250.0
300.0
350.0
400.0
2Q20 3Q20 4Q20 1Q21 2Q21
Banking Active Clients1 (´000)+43%
Record Net Addition of active clients in Stone SMB banking Acquiring clients settling directly in their Stone SMB account3 (‘000)
55.588.6
133.4
188.4
272.6
0.0
50.0
100.0
150.0
200.0
250.0
300.0
2Q20 3Q20 4Q20 1Q21 2Q21
All SMB clients using TON and Pagar.me products settle transactions automatically in theirdigital account as part of the standard offering
+45%
PrepaidPayments TPV
+2.3xy/y
+30% q/q
Total AccountsBalance
+3.8xy/y
R$862.0mm
Prepaid CardTPV
+4.4x y/y
R$293.7mm
Banking Money-In Volumes4
+4.4x y/y
R$4.9b
Banking Money-Out Volumes5
+5.5x y/y
R$14.6b
We will invest heavily in our digital banking account in the medium-term

7
Short-term headwinds in credit led us to increase coverage for potential losses, with negative impact in revenues
Decision to increase coverage for losses Leading to negative impact in revenue
Registry system not working properly Credit portfolio was flat q/q due to lower disbursements
752.7
376.2
141.5 174.959.8 0.8
0.0
100.0
200.0
300.0
400.0
500.0
600.0
700.0
800.0
1Q21 2Q21 Apr-21 May-21 June-21 July-21
Credit Disbursements (R$mm)
1,9011,708
1,997 1,998
1Q21 2Q21 2Q21
New Methodology1
1Q21
Previous Methodology▪ Card collateral system still ineffective, with current challenges with registry of
receivables system▪ Cautious approach to temporarily stop disbursements
Gross Outstanding Balance 1,998 100%
Allowance for bad debt 781 39%
+60 days without principal payments 699 35%
+60 days without any payments 373 19%
CoverageRatio2209%
R$mmOutstanding Balance (%)
112%
▪ Increased coverage por potential losses due to potential deterioration in the quality of guarantees
1) New methodology: (i) we stopped accrual of outstanding balances with over 60 days without reducing principal (already done in the fair value calculation, but not in the portfolio outstanding) - decreases the portfolio balance in R$98.5 million vs. old method; (ii) we are now considering the outstanding balance of distressed clients, whereas in the old method we considered only the recovery value of those balances (fair value) - increases the portfolio balance in R$388.4 million vs. old method. Our portfolio as of Jun/21 calculated in the previous methodology was R$1,707.9mm
2) The ratio between allowance for bad debt and NPL3) Risk adjusted return: The estimated internal rate of return of the aggregated cash flows of the loan portfolio net of expected losses on the loans, which are derived from a time dependent mortality curve and recovery expectations.4) Risk adjusted return net of cost of funding: The estimated internal rate of return of the aggregated cash flows of the loan portfolio net of expected losses on the loans, which are derived from a time dependent mortality curve and recovery expectations, brought at present value by a
discounted curve derived from StoneCo’s funding costs specifically to the portfolio of loans.5) Weighted average life: the weighted average estimated time of the principal repayment of the loan.
▪ Higher provisions through fair value adjustment of our portfolio
▪ Adjustment mainly led by lower-than-expected recovery of non-performing clients
▪ Negative impact in Total Revenue and Income of R$397mm in 2Q21
▪ Revised expected returns in legacy portfolio:
Despite impacts, we have received over 100% of disbursed amounts from older disbursements (4Q19 and 1H20)
0.58%RAR p.m.3
0.02%RAR net of CoF p.m.4
7Months WAL5
Portfolio Metrics

8
Credit product: re-cap of our vision and recent learnings (“Stone Capital”)
• We aim to build “Stone Capital” as an asset-light model, in which funding and underwriting risk for credit stays with multiple partners
• The opportunity in working capital solutions to SMBs is huge and the new receivables registry system will be transformational for Brazil as it creates the basis for a much bigger market for collateralized credit
• We will continue to build on a credit product that is completely embedded in our solutions and leverages on the strength of our SMB operation
• Merchants' data will be key in financial solutions and our software business gives us an edge for the future
Recent Learnings
What We Are Doing Differently
We developed a product with the assumption of a full functioning Registry System, which is yet to work properly
Our previous assumption regarding recovery of non-performing contracts was higher than observed in 2Q21, influenced by how relevant the problem of collateral leakage is
Even though Fair Value methodology is an IFRS standard, we learned that it brings a level of volatility that creates management complexity
Brought in 2021 a more experienced team to improve our credit scoring model, risk management and funding capabilities
Enhancing policies and processes to: i. Improve underwriting risk through a broader set of collaterals ii. Improve recovery process and re-negotiation capabilities iii. Access guarantees contractually given to us
New credit contracts to be recognized on an accrual basis starting on 3Q21
Vision
Exploring new strategic partnerships to enable asset light model

9
Software continues to show organic traction
R$1.2bn+annualized pro-forma revenue1
including Linx2
(2Q21)
19.6
62.4
213.5
242.3
0
50
100
150
200
250
300
350
2Q20 2Q21
233.0
Pro-Forma Revenue 1,2 (R$mm)
3.2x
52.5% organically
304.7+30.8%
1) Pro-forma numbers for software are calculated as if StoneCo had acquired 100% of the software companies in its portfolio, regardless of the stake acquired. StoneCo has made minority investments in some companies and has not yet exercised option to consolidate them. There is no assurance that StoneCo will exercise its option to consolidate any companies in which it has made a minority investment.
2) We consider Linx´s Total Net operating revenues line in this calculation, as reported by the company.3) Includes unique clients, excluding overlap of clients that use more than one solution. 4) Number of clients is presented as reported by the company, which follows a client concept based on “CLIFORS”, that refers to a paying entity represented by 1 taxpayer’s ID, regardless of number of stores.
35
143
0
20
40
60
80
100
120
140
160
2Q20 2Q21
StoneCo Subscribed Software Clients3 (000)
4.1x
Linx Software Clients4 (000)
64
72
30
35
40
45
50
55
60
65
70
75
2Q20 2Q21
+13%
Software Client Base
10
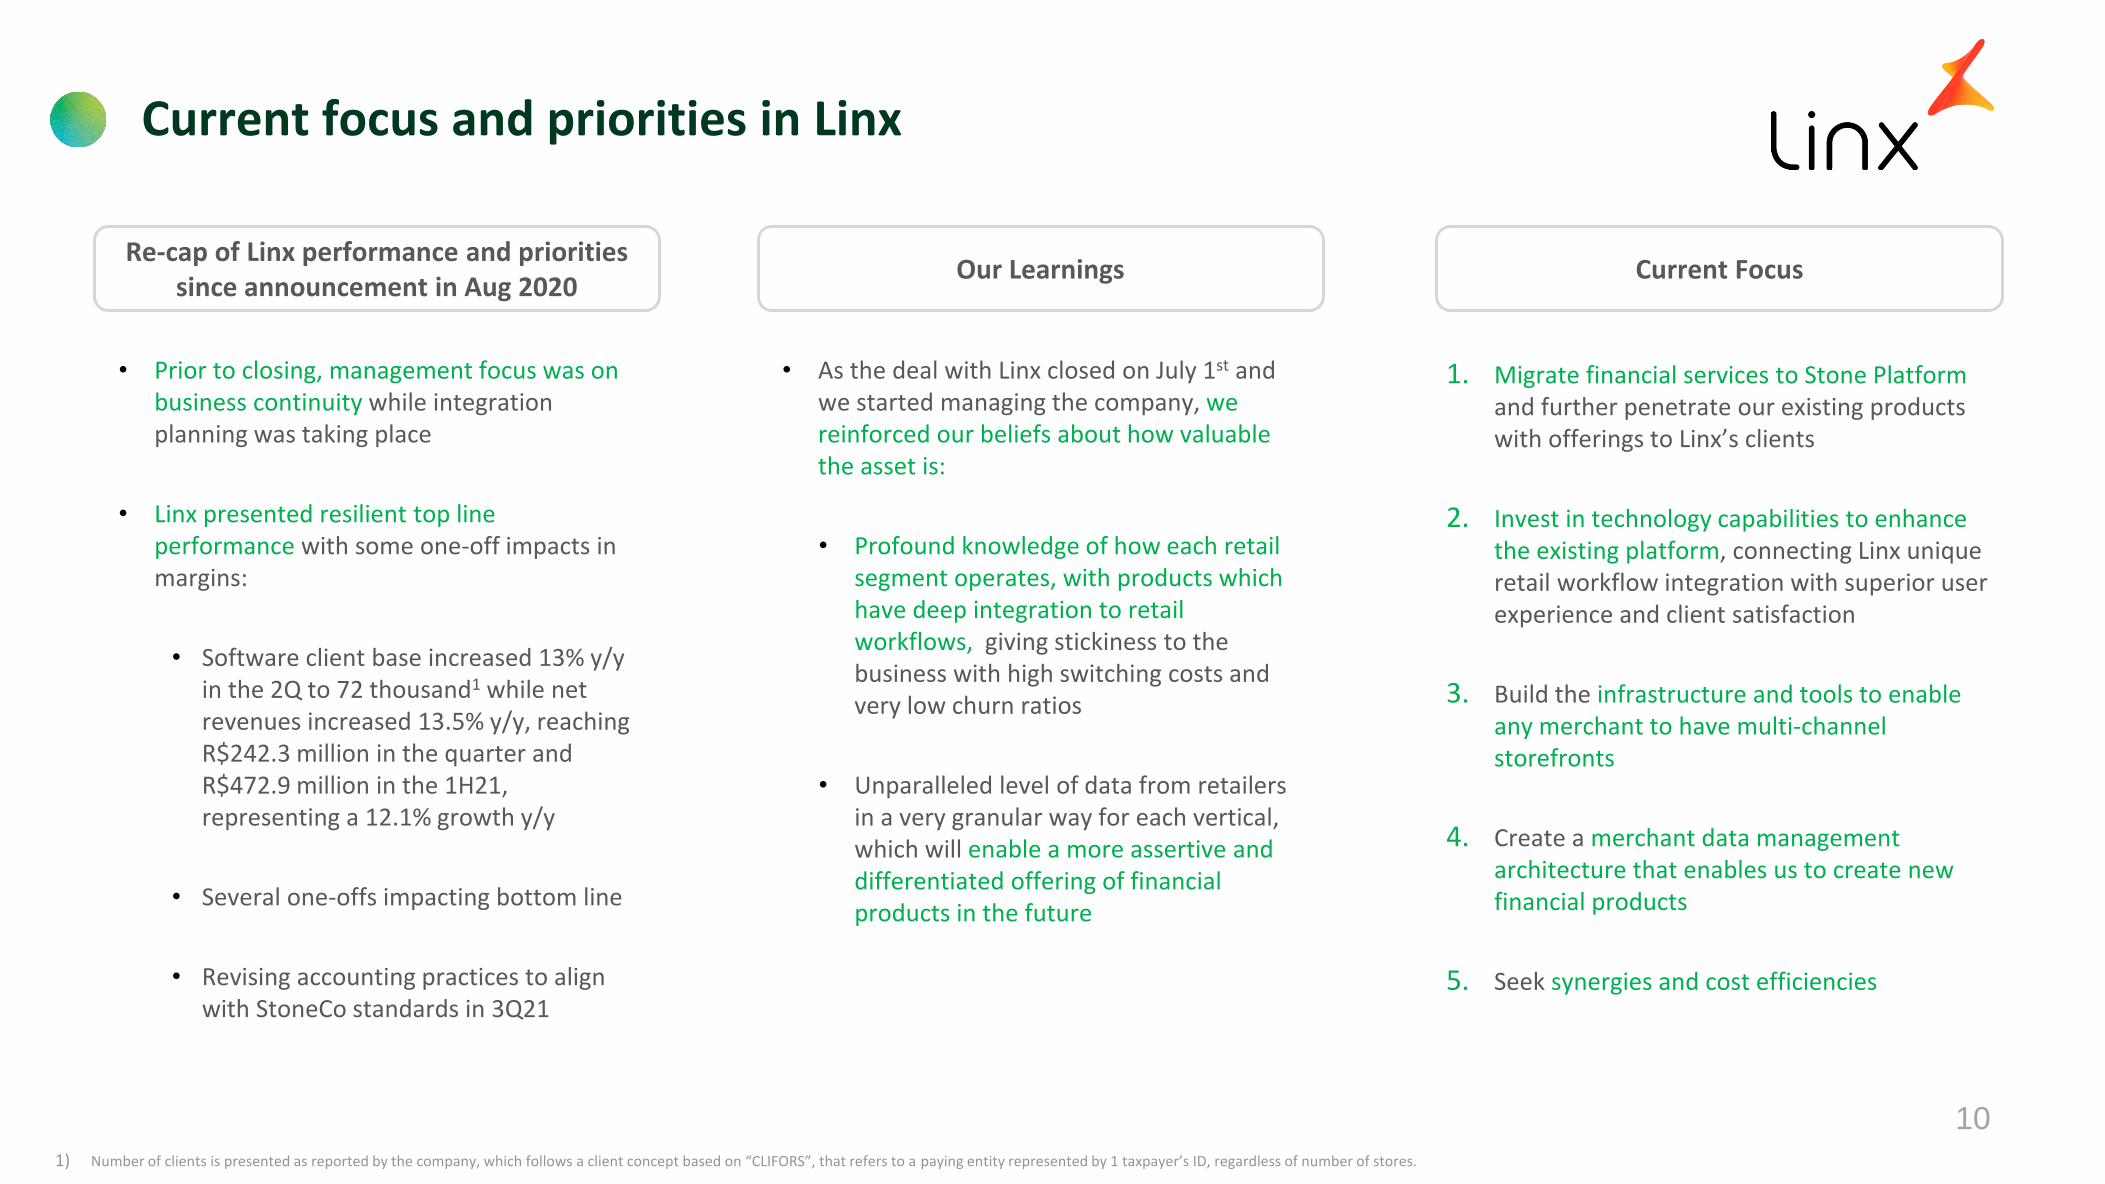
• Prior to closing, management focus was on business continuity while integration planning was taking place
• Linx presented resilient top line performance with some one-off impacts in margins:
• Software client base increased 13% y/y in the 2Q to 72 thousand1 while net revenues increased 13.5% y/y, reaching R$242.3 million in the quarter and R$472.9 million in the 1H21, representing a 12.1% growth y/y
• Several one-offs impacting bottom line
• Revising accounting practices to align with StoneCo standards in 3Q21
Re-cap of Linx performance and priorities since announcement in Aug 2020
• As the deal with Linx closed on July 1st and we started managing the company, we reinforced our beliefs about how valuable the asset is:
• Profound knowledge of how each retail segment operates, with products which have deep integration to retail workflows, giving stickiness to the business with high switching costs and very low churn ratios
• Unparalleled level of data from retailers in a very granular way for each vertical, which will enable a more assertive and differentiated offering of financial products in the future
Our Learnings Current Focus
1. Migrate financial services to Stone Platformand further penetrate our existing products with offerings to Linx’s clients
2. Invest in technology capabilities to enhance the existing platform, connecting Linx unique retail workflow integration with superior user experience and client satisfaction
3. Build the infrastructure and tools to enable any merchant to have multi-channel storefronts
4. Create a merchant data management architecture that enables us to create new financial products
5. Seek synergies and cost efficiencies
Current focus and priorities in Linx
1) Number of clients is presented as reported by the company, which follows a client concept based on “CLIFORS”, that refers to a paying entity represented by 1 taxpayer’s ID, regardless of number of stores.

11
Key Accounts - Fintech-as-a-Service (FaaS)
3.54.8 5.7
13.2
13.213.7
2Q20 1Q21 2Q21
Platform Services Sub-acquirers
Key Accounts TPV (R$bn)1 ex-Coronavoucher
✓ Our Key Accounts business includes integrated partners, marketplaces, online stores and sub-acquirers. We continue to focus on platforms to whom we can offer value-added services that result in longer term relationships with better unit economics.
✓ Although we serve sub acquirers because of incremental contributions, these clients are less strategic and excluding this group of clients we see healthier growth and unit economics
Sub-acquirers: 71% of Key Accounts TPV and 52% of Revenue2
Platforms: 29% of Key Accounts TPV and 48% of Revenue2
✓ Marketplaces, E-commerce platforms, software companies
✓ White label solution that enable platforms to create their own financial services offering to their clients
✓ Allows merchants to enable more sophisticated sales experience to their clients through platform features
✓ Segment with better unit economics
✓ Focus of our commercial efforts in Key Accounts
✓ More volatility in volumes
✓ Lower unit economics
✓ Not part of our strategic focus
✓ Currently serving approximately 15 sub-acquirers
✓ Top 2 subacquirers clients represent only 3% of StoneCo´s revenue net of funding costs
16.7
18.0
19.5 +16.2% y/y
+62.2% y/y
+4.0% y/y
1) From 1Q21 onwards, reported TPV figures consider all volumes processed and settled by StoneCo. As a result, from 1Q21 onwards we have included volumes processed by Pagar.me PSP with acquirers other than Stone. This change added R$113 million to Pagar.me Key Accounts in the quarter, implying a 15.5% growth ex-Coronavoucher when excluding these volumes
2) TPV and Revenue Ex-Coronavoucher

12
Strategic investment and partnership with Inter
1. Connecting Stone merchants to InterShop, driving the digitization of Stone merchant base and providing an omnichannel journey for Intershopconsumers
2. Enable a seamless mobile payment experience between Inter consumers and Stone merchants, online and offline
3. Enhance value proposition to Stone and Inter client base, by leveraging product and payment technology capabilities from both companies
4. Leverage Inter’s funding capabilities to drive further efficiency in Stone’s WK offerings and giving Inter clients access to new investment opportunities in fixed income, through the offering of FIDCs.
Value Creation Drivers
Complete platform for final consumers
Complete platform for merchants
• Integrate Linx platforms to Intershop, enabling Linx clients' inventory to be sold through Intershop (omnichannel)
• Help Intershop to serve non-account clients leveraging Stone payment and risk management platforms
• Enable Linx and Stone food service client base to sell online through Intershop
• Opportunity to create a data architecture that will enrich both consumer and seller ecosystems and, through targeted incentives, help drive more buying experiences between Inter consumers and StoneCo sellers
• Jointly offer credit and working capital solutions to StoneCo and Inter client base
• Explore cross selling opportunities to strengthen both ecosystems
• Initial funding agreements finalized
• Exploring opportunities to leverage Inter retail distribution for Stone funding capabilities
Mid-term Ambitions

13
Continued investments for future growth
+ 91% Technology Headcount in 2Q21 y/y
+ 88% Customer Service and Logistics
Headcount in 2Q21 y/y
Sales Technology Client Service Operations
In 2Q21 we increased investments1 by approximately R$180mm vs. 2Q20
+ 231% Marketing Investments 2Q21 y/y
+ 98% Salesforce Headcount 2Q21 y/y
1) Hiring of additional headcount in sales team, client service operations and technology (excluding any increases in expenses per headcount), marketing expenses for TON and Stone, TAG technology and software solutions

14
288
347.7
414.1
529.4535.8
586.2
671.1
782.9
716.8667.4
934.3
1,001.4
867.7
613.4
0
200
400
600
800
1000
1200
2.0
21.6
7.1
0.2
1.8
16.518.5
21.8
26.626.529.8
32.6
40.237.638.1
69.7
64.4
51.0
60.4
0
10
20
30
40
50
60
70
80
23.235.2
65.0
113.7
190.2
330.3
0
50
100
150
200
250
300
350
163.2203.2
237.4271.0
308.9
353.2
417.7
485.5
537.0 527.1
591.7
662.2
722.3
766.5
0
100
200
300
400
500
600
700
800
900
Active Clients – Payments(Thousands)
Total Payment Volume4
(R$ in billions)
Total Revenue and Income(R$ in millions)
Top-Line Growth – Quarterly DataFinancial and operating metrics
Coronavoucher TPV
+45.4%
+58.6%
-8.1%
Total ex-TON 1,2 TON3
9.4x
2Q21 impacted by R$- 397.2mm result in the credit product
1) SMB clients (Stone + Pagar.me) and mid/large fintech-as-a-service clients. Excludes micro merchants (TON. “Active Clients” (ex-TON) are merchants that have completed at least one electronic payment transaction with Stone within the preceding 90 days. 2) From 1Q21 onwards, reported Active Client Base includes clients from our PSP solution that were not previously included in our reported numbers. Please refer to the reconciliation of historical numbers from previous and current metric in our 1Q21 earnings release.3) Clients that have transacted with TON at least once in the preceding 12 months.4) From 1Q21 onwards, reported TPV figures consider all volumes processed and settled by StoneCo. As a result, from 1Q21 onwards we have included volumes processed by Pagar.me PSP with acquirers other than Stone. This change added R$157 million to total TPV in the quarter,
implying a 58.2% growth excluding those volumes, or 62.3% ex-Coronavoucher.

15
Financial Expenses(as % of Total Revenue and Income)
Operating Leverage and Profitability – Quarterly Data
Total Costs and Expenses1
(as % of Total Revenue and Income)
58.1%
49.6%46.6%
44.1%39.7%
45.3%42.5%
39.6%
46.8%
60.4%
48.6%47.5%
59.9%
105.5%
0.0%
20.0%
40.0%
60.0%
80.0%
100.0%
120.0%
23.8%21.3%20.1%
14.2%12.4%13.4%
15.1%13.7%
20.7%
9.4%6.9% 6.4%
10.7%
25.7%
0
0.05
0.1
0.15
0.2
0.25
0.3
1) Includes Cost of Services, Administrative Expenses and Selling Expenses.2) Adjusted Net Income and Adjusted Net Margin are non-IFRS financial measures. Please see the appendix for a reconciliation of this non-IFRS financial measure to the most directly comparable IFRS financial measures.
Margins in 2Q21 impacted by the credit product result, which reduced our Total Revenue and Income
by R$397.2 million and had the same impact in our Earnings Before Taxes
Adjusted Net Income and Margin2
(R$ in millions)
26.5
71.189.3
155.9
186.3194.0201.9
275.0
162.3150.3
287.9
357.8
187.4
-150.5
9.2%
20.5%
21.6%
29.5%
34.8%33.1%
30.1%
35.1%
22.6% 22.5%
30.8%
35.7%
21.6%
-0.4
-0.3
-0.2
-0.1
0
0.1
0.2
0.3
0.4
-200
-100
0
100
200
300
400
500
-24.5%
16
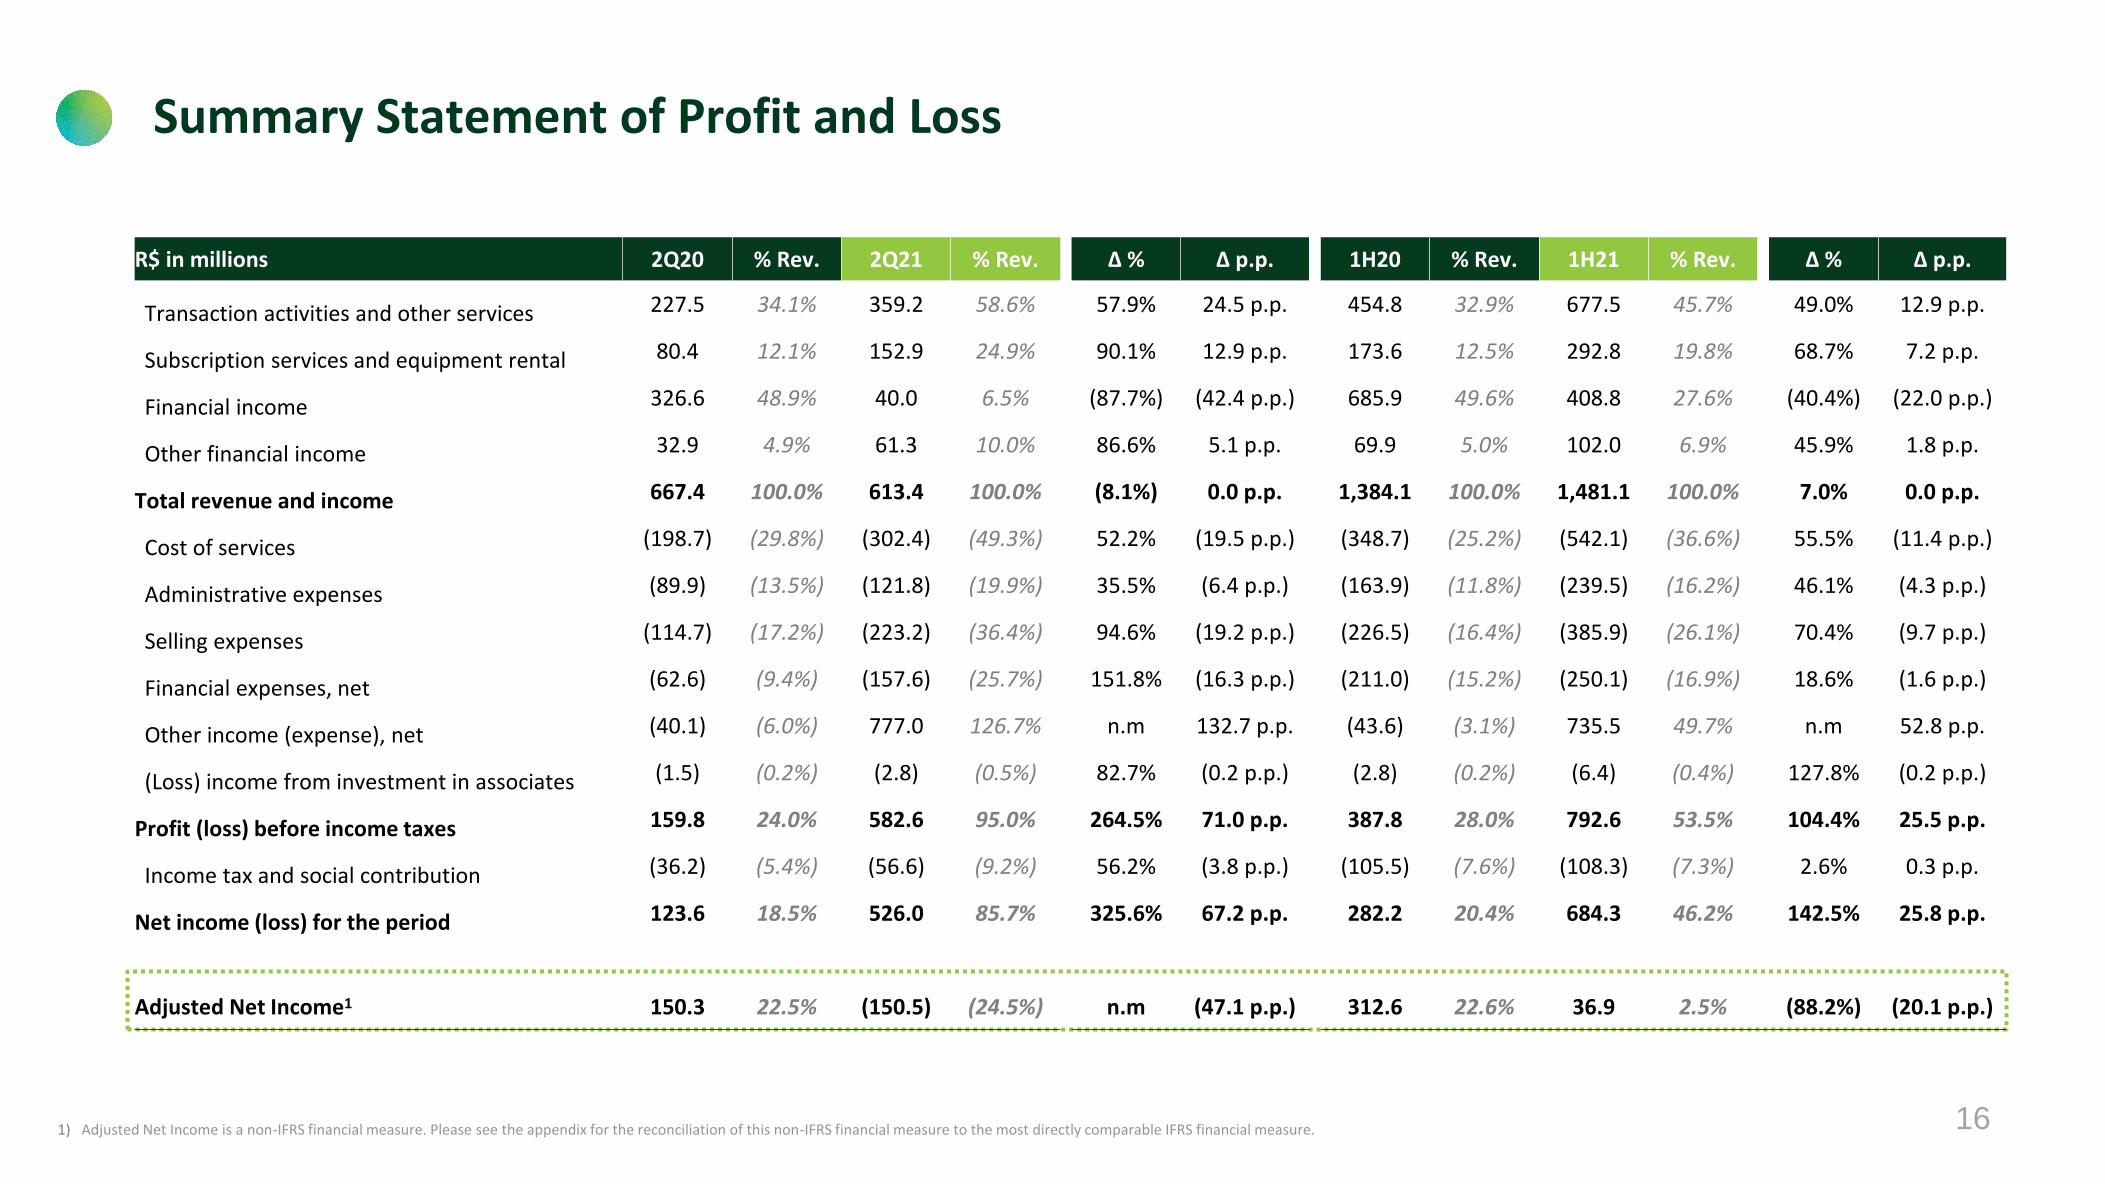
Summary Statement of Profit and Loss
1) Adjusted Net Income is a non-IFRS financial measure. Please see the appendix for the reconciliation of this non-IFRS financial measure to the most directly comparable IFRS financial measure.
R$ in millions 2Q20 % Rev. 2Q21 % Rev. Δ % Δ p.p. 1H20 % Rev. 1H21 % Rev. Δ % Δ p.p.
Transaction activities and other services 227.5 34.1% 359.2 58.6% 57.9% 24.5 p.p. 454.8 32.9% 677.5 45.7% 49.0% 12.9 p.p.
Subscription services and equipment rental 80.4 12.1% 152.9 24.9% 90.1% 12.9 p.p. 173.6 12.5% 292.8 19.8% 68.7% 7.2 p.p.
Financial income 326.6 48.9% 40.0 6.5% (87.7%) (42.4 p.p.) 685.9 49.6% 408.8 27.6% (40.4%) (22.0 p.p.)
Other financial income 32.9 4.9% 61.3 10.0% 86.6% 5.1 p.p. 69.9 5.0% 102.0 6.9% 45.9% 1.8 p.p.
Total revenue and income 667.4 100.0% 613.4 100.0% (8.1%) 0.0 p.p. 1,384.1 100.0% 1,481.1 100.0% 7.0% 0.0 p.p.
Cost of services (198.7) (29.8%) (302.4) (49.3%) 52.2% (19.5 p.p.) (348.7) (25.2%) (542.1) (36.6%) 55.5% (11.4 p.p.)
Administrative expenses (89.9) (13.5%) (121.8) (19.9%) 35.5% (6.4 p.p.) (163.9) (11.8%) (239.5) (16.2%) 46.1% (4.3 p.p.)
Selling expenses (114.7) (17.2%) (223.2) (36.4%) 94.6% (19.2 p.p.) (226.5) (16.4%) (385.9) (26.1%) 70.4% (9.7 p.p.)
Financial expenses, net (62.6) (9.4%) (157.6) (25.7%) 151.8% (16.3 p.p.) (211.0) (15.2%) (250.1) (16.9%) 18.6% (1.6 p.p.)
Other income (expense), net (40.1) (6.0%) 777.0 126.7% n.m 132.7 p.p. (43.6) (3.1%) 735.5 49.7% n.m 52.8 p.p.
(Loss) income from investment in associates (1.5) (0.2%) (2.8) (0.5%) 82.7% (0.2 p.p.) (2.8) (0.2%) (6.4) (0.4%) 127.8% (0.2 p.p.)
Profit (loss) before income taxes 159.8 24.0% 582.6 95.0% 264.5% 71.0 p.p. 387.8 28.0% 792.6 53.5% 104.4% 25.5 p.p.
Income tax and social contribution (36.2) (5.4%) (56.6) (9.2%) 56.2% (3.8 p.p.) (105.5) (7.6%) (108.3) (7.3%) 2.6% 0.3 p.p.
Net income (loss) for the period 123.6 18.5% 526.0 85.7% 325.6% 67.2 p.p. 282.2 20.4% 684.3 46.2% 142.5% 25.8 p.p.
Adjusted Net Income1 150.3 22.5% (150.5) (24.5%) n.m (47.1 p.p.) 312.6 22.6% 36.9 2.5% (88.2%) (20.1 p.p.)

17
Our business excluding credit product continues to grow at a strong pace
1) Excluding net revenues from credit product from Total Revenue and Income and from Adjusted EBT both from 2Q20 and from 2Q21. Adjusted EBT numbers also exludes financial expenses associated with the credit product but do not exclude any cost and expenses.2) Adjusted EBT considers reported EBT with the same adjustments of Adjusted Net Income, with the exception of Tax Effects on Adjustments.
Evolution of StoneCo revenue excluding the credit product Performance excluding credit product1
Total Revenue and Income – excluding the credit product (R$mm) Adjusted EBT2 (R$mm)Take Rate (%)
+68%
697.4
602.2
777.9
852.4 842.2
1,010.6
1Q20 2Q20 3Q20 4Q20 1Q21 2Q21
+7bps +58%
1.50%
1.57%
2Q20 2Q21
137.7
217.9
2Q20 2Q21

18

19
Appendix – Adjusted Net Income Reconciliation and EPS (Non-IFRS)
1) Consists of expenses related to the vesting of one-time pre-IPO pool of share-based compensation.
2) On intangibles related to acquisitions. Consists of expenses resulting from the amortization of the fair value adjustment on intangible assets and property and equipment as a result of the application of the acquisition method, a significant portion of which relate to the EdB acquisition.
3) Consists of the gain on re-measurement of our previously held equity interest in Equals (3Q18) and Linked (2Q20) to fair value upon the date control was acquired.
4) Consists of (i) impairment charges associated with certain processing system intangible assets acquired in the EdB acquisition that we no longer use, in an amount of R$6.4 million in 2Q18 and (ii) impairment associated with improvements made to certain leased office space upon the termination of the lease, in an amount of R$2.0 million for 2Q18.
5) Consists of the fair value adjustment related to associates call option, M&A and Bond Issuance expenses, earn-out interests related to acquisitions, gains/losses in the sale of companies and dividends from Linx.
6) Calculated as Adjusted Net Income attributable to owners of the parent (Adjusted Net Income reduced by Net Income attributable to Non-Controlling interest) divided by diluted number of shares (figures available in the Earnings Release). Adjustments consider share-based compensation expenses and amortization of fair value adjustments, in line with previous disclosures.
Net Income Bridge (R$mm) 1Q18 2Q18 3Q18 4Q18 1Q19 2Q19 3Q19 4Q19 1Q20 2Q20 3Q20 4Q20 1Q21 2Q21
Net income (loss) for the period 24.7 63.0 90.4 127.1 177.0 171.9 191.3 264.0 158.6 123.6 249.1 306.1 158.3 526.0
Share-based compensation expenses 1 0.0 0.0 24.8 36.0 10.1 28.4 11.2 14.6 2.1 37.8 30.8 50.0 20.7 46.4
Amortization of fair value adjustment on intangibles related to acquisitions 2 2.7 2.8 2.8 4.3 3.8 4.3 4.6 4.6 3.4 3.4 6.9 3.5 6.9 8.8
Fair Value adjustments of assets whose control was acquired 3 0.0 0.0 (21.4) 0.0 0.0 0.0 0.0 0.0 0.0 (3.0) 0.0 0.0 0.0 (12.0)
One-time impairment charges 4 0.0 8.4 0.0 0.0 0.0 0.0 0.0 0.0 0.0 0.0 0.0 0.0 0.0 0.0
Mark-to-market and Cost of Funds related to the investment in Banco Inter 0.0 0.0 0.0 0.0 0.0 0.0 0.0 0.0 0.0 0.0 0.0 0.0 0.0 (836.2)
Other expenses 5 0.0 0.0 0.0 0.0 0.0 0.0 0.0 (1.7) 0.0 1.7 13.5 15.6 10.0 12.7
Tax effect on adjustments (0.9) (3.1) (7.3) (11.5) (4.6) (10.5) (5.3) (6.4) (1.8) (13.3) (12.5) (17.4) (8.5) 103.8
Adjusted net income (loss) 26.5 71.1 89.3 155.9 186.3 194.0 201.9 275.0 162.3 150.3 287.9 357.8 187.4 (150.5)
Weighted Average Number of Shares (diluted) (millions of shares) 223.3 223.3 223.6 266.6 282.4 282.4 282.2 281.8 281.8 282.0 297.2 313.7 314.8 314.5
Diluted Adjusted EPS 0.11 0.27 0.39 0.59 0.66 0.69 0.71 0.97 0.58 0.54 0.99 1.16 0.60 (0.47)