2q21 earnings presentation august 5, 2021
TRANSCRIPT

2Q21 Earnings Presentation
August 5, 2021
Confidential 2
Forward-looking statementsSome of the statements contained in this presentation may constitute forward-looking statements within the meaning of the
federal securities laws. Forward-looking statements relate to expectations, projections, plans and strategies, anticipated events or
trends, and similar expressions concerning matters that are not historical facts. In some cases, you can identify forward-looking
statements by the use of forward-looking terminology such as "may," "will," "should," "expects," "intends," "plans," "anticipates,"
"believes," "estimates," "predicts," or "potential" or the negative of these words and phrases. You can also identify forward-looking
statements by discussions of strategy, plans, or intentions.
The forward-looking statements contained in this presentation reflect our current views about future events and are subject to
numerous known and unknown risks, uncertainties, assumptions and changes in circumstances that may cause actual results to
differ significantly from those expressed or contemplated in any forward-looking statement.
While forward-looking statements reflect our good faith projections, assumptions and expectations, they are not guarantees of
future results. Furthermore, we disclaim any obligation to publicly update or revise any forward-looking statement to reflect
changes in underlying assumptions or factors, new information, data or methods, future events or other changes, except as
required by applicable law. Factors that could cause our results to differ materially include but are not limited to: (1) the continued
course and severity of the COVID-19 pandemic, and its direct and indirect impacts (2) general economic conditions and real
estate market conditions, (3) regulatory and/or legislative changes, (4) our customers' continued interest in loans and doing
business with us, (5) market conditions and investor interest in our contemplated securitization and (6) changes in federal
government fiscal and monetary policies.
For a further discussion of these and other factors that could cause future results to differ materially from those expressed or
contemplated in any forward-looking statements, see the section titled ''Risk Factors" previously disclosed in our Form 10-Q filed
with the SEC on May 14, 2020, as well as other cautionary statements we make in our current and periodic filings with the SEC.
Such filings are available publicly on our Investor Relations web page at www.velfinance.com.

Confidential 3
2Q21 Highlights
Production
&
Loan
Portfolio
Earnings
Financing
&
Capital
▪ Net Income of $9.5 million and Core income(1) of $8.5 million; diluted EPS of $0.28 and
Core diluted EPS of $0.25
– Results driven by strong net interest income growth resulting from increased nonperforming
asset resolutions and improved loan portfolio performance
▪ Portfolio NIM(2) of 4.83%, an increase of 73 basis points (bps) from 1Q21
▪ Book value per common share as of June 30, 2021, was $11.62, compared to $11.12 as
of March 31, 2021
▪ Loan production volume in 2Q21 totaled $256.5 million in UPB(3), a 10.1% Q/Q increase
driven by continued strong demand and the re-introduction of short-term loans
▪ Steady improvement in loan performance drives a 153 bps Q/Q decrease in
nonperforming loans (NPL) as a % of loans held for investment
▪ NPL and Real Estate Owned (REO) resolutions in 2Q21 recovered 103.9% of UPB(2)
resolved, continuing our consistent track record of net gains over and above contractual
principal and interest due
▪ Completed our VCC 2021-1 securitization totaling $264.5 million of UPB, Velocity’s first
securitization of 2021, which priced with a weighted average rate of 1.73%
– Reflects strong investor appetite and Velocity’s extensive track record of performance
▪ Velocity Financial, Inc. (NYSE:VEL) was added to the Russell 2000 and 3000 indices in
June 2021
Subsequent to Quarter-End
▪ Continued to strengthen the Company’s liquidity profile with the addition of a new non-
mark-to-market warehouse financing facility with a maximum capacity of $100.0 million(1) “Core” income is a non-GAAP measure which excludes non-recurring and/or unusual activities from GAAP net income.(2) Net Interest Margin(2) Unpaid Principal Balance

Confidential 4
$11.12
$11.62
0.08 0.04
0.38
Book value at3/31/21
Loan Sales ProvisionRecovery
PortfolioEarnings
Book value at6/30/21
Core Income and Book Value Growth
Core Income Book Value Per Share
▪ Core income totaled $8.5 million ($0.25 per diluted share), which excludes a $1 million loan loss provision
recovery
▪ GAAP net income in 2Q21 included $6.98 million of interest income from the realization of contractual interest,
default interest and prepayment fees on nonperforming loans in 2Q21, a 59% increase from 1Q21
– Corporate interest expense normalized in 2Q21 compared to 1Q21. 1Q21 included $3.33 million of nonrecurring
interest expense from the refinancing of our corporate debt
▪ Book value per share as of June 30, 2021, was $11.62, compared to $11.12 per share as of
March 31, 2021(1)
Core Income $8,453
(1) Based on 20,087,494 common shares outstanding as of June 30, 2021, and March 31, 2021.(2) Includes an increase to APIC from stock-based compensation.
Recovery of Loan Loss Provision $(1,000)
GAAP Net Income $9,453
(1) (1)(2)

Confidential 5
$129.2 $148.8 $146.5
$50.1
$84.2 $95.3
$14.7
$179.3
$233.0
$256.5
4Q20 1Q21 2Q21
Investor 1-4 Rental Traditional Commercial Short-term Loan Products
Production Momentum Continues to Build
▪ Loan production totaled $256.5 million in UPB for 2Q21, a 10.1% Q/Q increase from $233.0 million in UPB in
1Q21
– Driven by the re-introduction of short-term loans to the production mix and growth of long-term traditional
commercial loan production
▪ Loan origination volume in July 2021 totaled $104.4 million in UPB
Loan Production Volume
($ of UPB in millions)
New Product Additions and Continued Strong Demand Drive 2Q21 Volume Growth

Confidential 6
$841.3$1,007.6 $958.5 $984.8 $1,026.5
$259.7
$254.5 $259.1 $275.0 $292.6$193.2
$187.1 $182.4 $183.2 $183.8$177.6
$172.8 $172.0 $177.7$183.2
$118.2$117.9 $118.5 $121.6
$131.0$254.8$246.5 $241.4 $248.4
$253.0$1,844.8$1,986.3 $1,931.9 $1,990.7
$2,070.2
2Q20 3Q20 4Q20 1Q21 2Q21
Investor 1-4 Rental
Mixed Use
Multifamily
Retail
Warehouse
All Other
▪ Total loan portfolio as of June 30, 2021, was $2.07 billion in UPB, a 4.0% Q/Q increase from $1.99 billion in
UPB as of March 31, 2021
– Net Portfolio growth of $80 million driven by strong production activity
▪ Strong credit discipline has maintained low average loan-to-value ratios in the portfolio, which is a key
component of Velocity’s success in profitably resolving loans
▪ Lower W.A. coupon primarily reflects run-off of short-term loans during temporary suspension of production(1)
Loan Portfolio
Loan Portfolio by Property Type
(UPB in millions)
(1) Temporary suspension of short-term loan production occurred from March 2020 to April 2021.(2) $ in thousands
Loan to Value 65.80% 66.18% 66.13% 66.28% 66.70%
Loan Count 6,294 6,029 5,878 5,935 6,125
W.A. Coupon(1)
8.60% 8.56% 8.51% 8.42% 8.29%
Average Loan Balance(2)
$327.1 $329.5 $330.9 $335.4 $338.0

Confidential 7
7.59%
8.41%
8.90%
4.63%5.01%
4.81%
2Q20 1Q21 2Q21
HFI Loan Yield W.A. Cost of funds
▪ 2Q21 Portfolio NIM(1) was 4.83%, an increase of 73 bps from 4.10% in 1Q21, driven by an increase in the HFI
loan yield and a reduction in the portfolio-related weighted average cost of funds
– Interest income grew 10.5% Q/Q, driven by strong nonperforming asset resolutions which resulted in increased
realization of delinquent and default interest income
– The portfolio-related weighted average cost of funds decreased as result of the 2021-1 securitization, which priced
at weighed average cost of 1.73%, and the continued paydown of higher cost securitizations
Portfolio Yield and Cost of Funds
Portfolio Related
Portfolio NIM Rises On Improved Loan Performance and Strong Resolution Activity
$18.6 $19.9
$24.4
3.54%
4.10%
4.83%
2Q20 1Q21 2Q21
Net interest margin
Portfolio Net Interest Income & NIM(1)
Net Interest Margin
(1) Net Interest Income and Net Interest Margin related to the loan portfolio only; excludes corporate debt.
Portfolio Related ($ in millions)

Confidential 8
$268.9
$314.7$332.8 $335.0
$315.5
14.6%15.8%
17.2% 16.8%15.3%
6/30/2020 9/30/2020 12/31/2020 3/31/21 6/30/2021
Total nonaccrual loans % nonaccrual to total HFI loans
Nonperforming Loans(1)
▪ Total nonperforming loans as of June 30, 2021, totaled $315.5 million in UPB, or 15.3% of total loans held for
investment, compared to $335.0 million, or 16.8% as of March 31, 2021
– The quarter-over-quarter improvement was driven by the resolution of 17.37% of nonperforming loan UPB as of
March 31, 2021
o Payoffs accounted for 10.58% of nonperforming loan UPB as of March 31, 2021, and loans brought back to
performing (accrual) status accounted for 6.79%
o Realized all delinquent contractual interest in addition to default interest and prepayment fees
$ UPB in millions
Loan Investment Portfolio Performance
(1) For additional detail, please see page 17 in the Appendix of this presentation.(2) Loans in nonaccrual status granted forbearance as a result of the COVID-19 pandemic. These loans are included in total nonaccrual loans.
Confidential 9
2Q21 Asset Resolution Activity
Resolution Activity
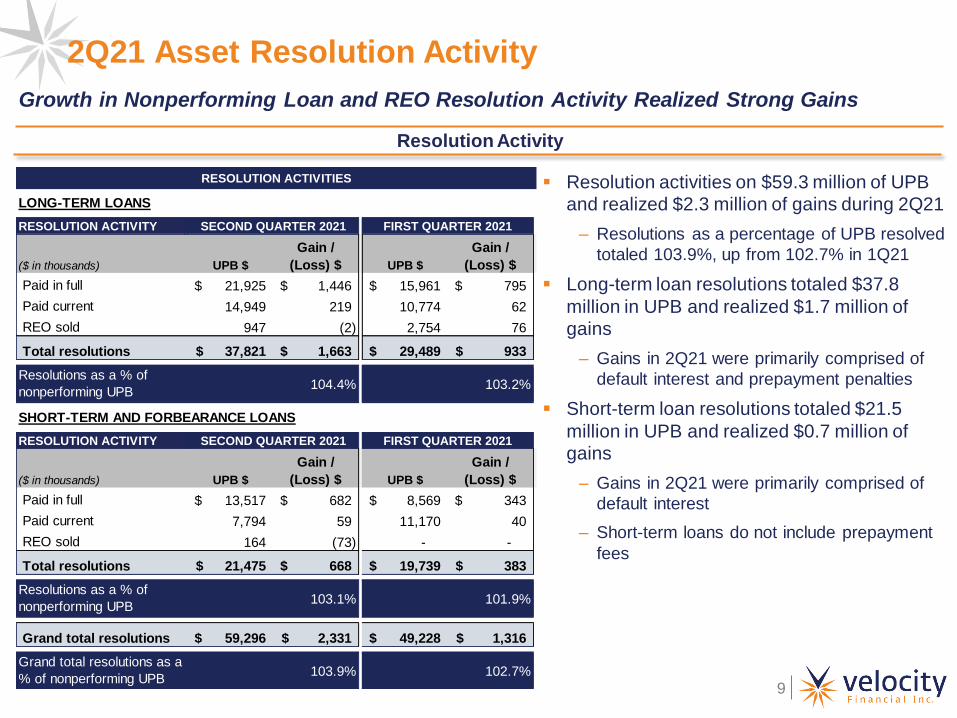
▪ Resolution activities on $59.3 million of UPB
and realized $2.3 million of gains during 2Q21
– Resolutions as a percentage of UPB resolved
totaled 103.9%, up from 102.7% in 1Q21
▪ Long-term loan resolutions totaled $37.8
million in UPB and realized $1.7 million of
gains
– Gains in 2Q21 were primarily comprised of
default interest and prepayment penalties
▪ Short-term loan resolutions totaled $21.5
million in UPB and realized $0.7 million of
gains
– Gains in 2Q21 were primarily comprised of
default interest
– Short-term loans do not include prepayment
fees
Growth in Nonperforming Loan and REO Resolution Activity Realized Strong Gains
LONG-TERM LOANS
RESOLUTION ACTIVITY
($ in thousands) UPB $
Gain /
(Loss) $ UPB $
Gain /
(Loss) $
Paid in full 21,925$ 1,446$ 15,961$ 795$
Paid current 14,949 219 10,774 62
REO sold 947 (2) 2,754 76
Total resolutions 37,821$ 1,663$ 29,489$ 933$
Resolutions as a % of
nonperforming UPB104.4% 103.2%
SHORT-TERM AND FORBEARANCE LOANS
RESOLUTION ACTIVITY
($ in thousands) UPB $
Gain /
(Loss) $ UPB $
Gain /
(Loss) $
Paid in full 13,517$ 682$ 8,569$ 343$
Paid current 7,794 59 11,170 40
REO sold 164 (73) - -
Total resolutions 21,475$ 668$ 19,739$ 383$
Resolutions as a % of
nonperforming UPB103.1% 101.9%
Grand total resolutions 59,296$ 2,331$ 49,228$ 1,316$
Grand total resolutions as a
% of nonperforming UPB103.9% 102.7%
RESOLUTION ACTIVITIES
SECOND QUARTER 2021
SECOND QUARTER 2021 FIRST QUARTER 2021
FIRST QUARTER 2021

Confidential 10
▪ Velocity’s CECL reserve as a percentage of the HFI portfolio as of June 30, 2021, was 19 bps compared to
29 bps as of March 31, 2021, and 28 bps as of June 30, 2020
– Provision recovery primarily resulted from a reduction in the macroeconomic component of the loan loss
reserve resulting from a more optimistic outlook for improvement in the U.S. economy
▪ Charge-offs were $986.4 thousand for six months ended June 30, 2021, compared to $377.1 thousand for
the six months ended March 31, 2021, and $245.5 thousand for the same period in the prior year
– Nearly half, or $420.5 thousand of the 2Q21 charge-off amount was related to one loan that transferred to
REO, all or part of which could be recovered upon sale of the REO
CECL Reserve and Charge-Offs
Loan Loss Reserve
Loan Loss Reserve Recovery Driven by Improved Economic Outlook
Charge-offs(1)
$5,220.5
$5,881.0
$3,963.1 0.28%0.29%
0.19%
6/30/20 3/31/21 6/30/21
Total CECL Reserve CECL as % of Loans HFI
$245.5
$377.1
$986.4
0.17%
0.23%
0.59%
6/30/20 3/31/21 6/30/21
Charge-offsCharge-offs as % of Average Nonaccrual Loans
(1) For the six moths ended.

Confidential 11
Net Interest
Income Growth
Driven By
Production and
Improved Loan
Performance
Optimizing the
Capital
Structure and
Financing
Costs
Transitioning to
a More
“Normalized”
Economic
Environment
▪ Considerable momentum the U.S. economy was gained during this spring, with further
improvement expected in 2H 2021
– COVID risks have diminished, but further caution is still warranted given delta variant
▪ Real estate prices remain strong, particularly for residential real estate, and losses
remain low
▪ Government assistance starting to be released to landlords and tenants which is
expected to be a tailwind going forward
▪ The strong market reception for Velocity’s VCC-2021-1 securitization in May expected to
continued as we prepare for our second securitization of 2021 in the third quarter
▪ Exploring options to collapse and refinance 2 to 3 of Velocity’s older, higher cost,
securitizations before year end, resulting in further cost of funds reductions
▪ Total warehouse line capacity reached $550.0 million as of July 31, 2021, with the
addition of a fifth warehouse line
▪ Increasing demand for traditional commercial and ARV-Pro loans as the economy re-
opens expected to drive incremental production volume , bolstering continued strong
activity in Investor 1-4 Rental loans
▪ Net interest income growth expected to continue, driven by solid HFI portfolio growth and
continued reduction in the level of nonperforming loans
▪ Nonperforming loan resolutions activity to remain strong
Outlook for Velocity’s Business

Confidential 12
$334,375
$221,913 (1)
$100,000+Platform Value
Embedded Gain in Securitized Portfolio
Fully Diluted Value of Equity(2)
$656,289
($ in thousands, except per share data)
– We elect to carry our retained interests in securitizations at amortized cost to minimize volatility
– The graph below reflects our estimate of economic value of equity (a non-GAAP financial measure) by adding the net
present value of expected future gains embedded in the securitized portfolio and the value of our unique origination
platform – our estimate of economic value of equity does not represent a substitute for GAAP book value of equity
– Recent M&A precedents for business purpose lenders demonstrate significant platform/franchise values that
investors are ascribing to businesses like Velocity Financial
– These transactions have demonstrated platform values of $100MM+ based on ~10%+ of annual production
Economic Value of Equity is significantly higher than GAAP Book Value of Equity
Economic Value of Equity
Economic Value of Equity
(1) Embedded gain in portfolio assumes a 10% discount rate of projected securitization earnings and is net of $49,061,026 of deferred loan origination costs and securitization deal costs.
(2) Fully Diluted Value of Equity assumes 6/30/2021 GAAP Book Value of Equity of $233.5MM + $90.0MM from full conversion of preferred stock to common stock, for which Velocity
has the option effective October 8, 2021, and $10.9MM from exercise of all warrants.
(3) Economic Value of Equity per Share ("EVPS") calculated using 33,960,141 shares outstanding assuming dilution impact based on Velocity's average stock
price for Q2 2021.
$2.94+
$6.53
$9.85
$19.33+ (3) EVPS

Appendix

Confidential 14
Vertically Integrated Platform
Highly Customized Platform Integrates All Functional Areas to Enable Efficient Workflow Execution
Sourcing
Appraisal
Securitization
Asset Management
Underwriting
Servicing
▪ 100% of new loan applications submitted via fully integrated broker portal
▪ Proprietary network of local appraisers with internal licensed appraisers
driving valuation process
▪ Uniform credit guidelines, pricing engine, and collaborative real time
process
▪ Strong institutional ownership with outstanding performance
▪ Seamless and instantaneous transfer of loan data with 3rd party servicers
▪ Hands on internal asset mangers focused on minimizing credit losses

Confidential 15
Velocity Financial, Inc. Balance Sheet
6/30/2021 3/31/2021 12/31/2020 9/30/2020 6/30/2020
Unaudited Unaudited Audited Unaudited Unaudited
(In thousands)
Assets
Cash and cash equivalents $ 27,741 $ 20,434 $ 13,273 $ 19,210 $ 9,803
Restricted cash 7,921 6,808 7,020 7,821 6,735
Loans held for sale, net 7,916 0 13,106 0 212,344
Loans held for investment, at fair value 1,370 1,364 1,539 3,327 2,956
Loans held for investment 2,057,046 1,983,435 1,924,489 1,977,236 1,836,065
Net deferred loan costs 26,707 25,070 23,600 23,850 25,754
Total loans, net 2,093,039 2,009,869 1,962,734 2,004,413 2,077,119
Accrued interest receivables 11,094 11,169 11,373 13,134 17,793
Receivables due from servicers 73,517 77,731 71,044 44,466 36,028
Other receivables 10,169 3,879 4,085 402 4,609
Real estate owned, net 20,046 14,487 15,767 14,653 15,648
Property and equipment, net 3,625 3,891 4,145 4,446 4,718
Deferred tax asset 13,196 9,246 6,654 1,832 5,556
Other assets 7,257 7,325 6,779 16,489 9,042
Total Assets $ 2,267,605 $ 2,164,839 $ 2,102,874 $ 2,126,866 $ 2,187,051
Liabilities and members' equity
Accounts payable and accrued expenses $ 70,049 $ 65,003 $ 63,361 $ 61,859 $ 55,938
Secured financing, net 164,053 129,666 74,982 74,776 74,571
Securitizations, net 1,558,163 1,453,386 1,579,019 1,670,930 1,599,719
Warehouse & repurchase facilities 151,872 203,314 75,923 19,541 160,796
Total Liabilities 1,944,137 1,851,369 1,793,285 1,827,106 1,891,024
Mezzanine Equity
Series A Convertible preferred stock 90,000 90,000 90,000 90,000 90,000
Stockholders' Equity
Stockholders' equity 233,468 223,470 219,589 209,760 206,027
Total Liabilities and members' equity $ 2,267,605 $ 2,164,839 $ 2,102,874 $ 2,126,866 $ 2,187,051
Book value per share 11.62$ 11.12$ 10.93$ 10.44$ 10.26$
Shares outstanding 20,087 20,087 20,087 20,087 20,087
Quarter Ended

Confidential 16
Velocity Financial, Inc. Income Statement
($ in thousands) 6/30/2021 3/31/2021 12/31/2020 9/30/2020 6/30/2020
Unaudited Unaudited Audited Unaudited Unaudited
Revenues
Interest income $ 44,978 $ 40,707 $ 41,556 $ 41,374 $ 39,755
Interest expense - portfolio related 20,566 20,832 21,442 22,347 21,189
Net interest income - portfolio related 24,412 19,875 20,114 19,027 18,566
Interest expense - corporate debt 4,309 7,350 1,900 1,913 1,894
Net interest income 20,103 12,525 18,214 17,114 16,672
Provision for loan losses (1,000) 105 406 1,573 1,800
Net interest income after provision for loan losses 21,103 12,420 17,808 15,541 14,872
Other operating income (expense) 2,432 2,801 4,691 1,349 (1,339)
Total net revenues 23,535 15,221 22,499 16,890 13,533
Operating expenses
Compensation and employee benefits 4,546 5,186 4,135 5,692 5,863
Rent and occupancy 430 463 424 415 448
Loan servicing 1,922 1,867 1,977 2,168 1,754
Professional fees 795 533 1,415 1,051 588
Real estate owned, net 1,039 509 217 898 408
Other operating expenses 1,918 2,059 2,578 1,641 1,847
Total operating expenses 10,650 10,617 10,746 11,865 10,908
Income before income taxes 12,885 4,604 11,753 5,025 2,625
Income tax expense 3,432 1,208 2,177 1,544 484
Net income $ 9,453 $ 3,396 $ 9,576 $ 3,481 $ 2,141
Less: Deemed dividends on preferred stock - - - - $ 48,955
Less: Undistributed earnings allocated to participating securities 3,571 $ 1,281 n.a. n.a. n.a.
Net income (loss) allocated to common shareholders $ 5,882 $ 2,115 $ 9,576 $ 3,481 $ (46,814)
Basic earnings (loss) per share 0.29$ 0.11$ 0.48$ 0.17$ (2.33)$
Diluted earnings (loss) per common share 0.28$ 0.10$ 0.29$ 0.11$ (2.33)$
Basic weighted average common shares outstanding 20,087 20,087 20,087 20,087 20,087
Diluted weighted average common shares outstanding 33,960 33,407 32,793 32,435 20,087
Quarter Ended

Confidential 17
Investor 1-4
Rental49%
Mixed Use
14%
Multifamily
9%
Retail
9%
Office
6%
Warehouse
6%Other
7%
HFI Loan Portfolio
Portfolio by Property Type
(100% = $2.06 billion UPB)(1)
(1) As of June 30, 2021
Portfolio by State
New York
23%
California
22%
Florida
13%New Jersey
8%
Other
34%

Confidential 18
HFI Portfolio Delinquency Trends
September 30, 2020
($ in thousands) $ % $ % $ % $ % $ %
Performing/Accruing:
Current 1,186,267$ 64.3% 1,474,076$ 74.2% 1,445,131$ 74.9% 1,528,684$ 76.8% 1,645,019$ 79.8%
30-59 days past due 121,320 6.6% 108,601 5.5% 89,284 4.6% 67,100 3.4% 69,165 3.4%
60-89 days past due 145,976 7.9% 74,351 3.7% 62,694 3.2% 59,700 3.0% 32,484 1.6%
90+ days past due 122,195 6.6% 14,589 0.7% 1,953 0.1% 152 0.0% 152 0.0%
Total Performing 1,575,758 85.4% 1,671,617 84.2% 1,599,062 82.9% 1,655,636 83.2% 1,746,820 84.7%
Nonperforming/Nonaccrual:
<90 days past due 18,657 1.0% 23,502 1.2% 20,778 1.1% 18,076 0.9% 20,740 1.0%
90+ days past due 136,577 7.4% 119,248 6.0% 82,004 4.2% 72,303 3.6% 50,638 2.5%
Bankruptcy 8,668 0.5% 8,646 0.4% 12,655 0.7% 15,226 0.8% 17,659 0.9%
In foreclosure 104,947 5.7% 163,331 8.2% 217,376 11.2% 229,443 11.5% 226,506 11.0%
Total nonperforming loans 268,849 14.6% 314,727 15.8% 332,813 17.2% 335,048 16.8% 315,543 15.3%
Total loans held for investment 1,844,607$ 100% 1,986,343$ 100% 1,931,875$ 100% 1,990,684$ 100% 2,062,363$ 100%
June 30, 2021March 31, 2021June 30, 2020 December 31, 2020

Confidential 19
$1,990.7 $2,070
$146
$27
Loan Porfolio at3/31/21
PrincipalPayments
Loan Sales Foreclosures Loan Production Loan Porfolio at06/30/21
Loan Portfolio Rollforward
$(145.9)
$(27.2)
Loan Portfolio Waterfall
(UPB in millions)
(1)
$257.6
$(7.5)
(1) Includes $1.1 million in UPB of repurchased loans