3.1. canning facility and accessories -...
TRANSCRIPT

44
3. MATERIALS AND METHODS
3.1. CANNING FACILITY AND ACCESSORIES
3.1.1. Pilot scale retorting unit
The pilot scale mill wall model 24 rotary retorting system (John Fraser and
sons Ltd, UK. Model.no.5682) was used for the experiments. This pilot scale retorting
system performs laboratory scale thermal process in a manner which ensures close
simulation with commercial scale equipment and which produces a high degree of process
reproducibility and accuracy. Plate-1 shows the pilot retort used for the study. The model
24 system for pure steam, steam /air and over pressure water immersion process comprises
three major components; the retort, the receiver and the control system. The retort provides
a chamber in which the product is subjected to the required thermal process. The receiver
provides a pressurized volume to balance the overpressure in the retort during super heated
water cooks and during overpressure cooling. The control system provides the means to
sequence process events, regulate energy flows and document retort temperature and
pressure. Retort is constructed of mild steel and it can withstand a working pressure of 50
psig. It has got a dimension of 594mm inside diameter X 650 mm inside length on parallel
portion. It has got a swing bolt type door with hinge on the left side. It has a standard
square cage, which is perforated with side slots. The speed of rotation of cage ranged from
0 to 51 rpm and was electronically controlled. Instrument pockets are provided on the right
side of the shell. These include pressure gauge, retort thermometer, pockets for
thermocouple glands and petcock at the rear end. Sparge pipes are provided on the
retort.They are four in number and provide on the bottom and top, left and right. Number of
holes are 43 per sparge in 3 rows. The holes are of 4mm diameter. A water gauge is
45
provided on the right hand side of the retort, the gauge bottom indicates retort half full and
the gauge top indicates retort is full. A pressure relief valve is provided on the retort which
gas got a size of 1”and it will release if the pressure is above 55 psig. The pressure gauge,
which is provided on the retort, has got a range of 0 to 60 psig. A 4-blade stainless steel fan
is fitted to the retort for use during processing. The fan is designed to run at 1500 rpm and
to displace in the order of 500 CFM free air and so create considerable turbulence within
the retort during processing to ensure well mixing of steam and that no stagnant air pockets
are allowed to exist.
The retort is connected to a very efficient cooling system. As soon as the process is
over steam can be switched off and water can be allowed to enter into the retort with the
help of a water pump from the water-storing tank. The same water can be recirculated with
the help of a recirculating pump. This will provide a very efficient cooling mechanism by
spraying water from the top of the retort. A high specification Myson MSK 50 –2/2090
pump suitable for use with super heated water up to 130 °C is fitted to recycle water
through the retort.
The receiver is also constructed of mild steel and has got a working pressure of 50
psig. The dimension of the receiver is 594mm inside diameter X 850 mm on parallel side.
It has got a water gauge with the gauge top indicates the receiver is full and the gauge
bottom indicates receiver below over flow level. It has got a pressure relief valve and the
setting is on 55 psig. It also has got a pressure gauge with a range of 0-60psig. The
pressure in the receiver is hydraulically and pneumatically transmitted to the retort at the
points in the sequence when the retort is required to be at over pressures. Two modulating
valves control the receiver pressure, one regulates air into the vessel and the other acts on
the vent and regulates air out. The controller is designed with a dual output to operate the

46
system. The pressure control valve is connected to the vent valves on the receiver and so
the transfer line between the two vessels must be open when the pressure is controlled from
the sensor mounted on the retort.
Networks of pipes are provided for the entrance of the steam, air and water into the
retort and also discharge of the steam, air and water from the retort. All pumps are on the
left side and the hand valves are on the right hand side. Incoming services are on the rear
left, between upright members and outgoing discharges is on the rear center and right
between upright members. Safety valve discharges are on the rear, between upright
members and then to local drain.
The control systems specification sequence of all aspects of the retort operation is
performed manually but with assistance from discrete electronic controllers on retort
temperature and receiver pressure. The controllers and a number of other components are
integrated into a PLC managed safety system.
The control system has got a digital temperature indicator and pressure indicator. A
digital three-pin circular chart recorder is fitted to record retort temperature and pressure
and receiver pressure. A Eurotherm digital indicator is fitted to display cage rotation
speed. The instrument is connected to the 0-10 V output of the motor control unit and is
scaled for 0-51 rpm. A digital electronic timer is provided to assist the timing of the cook
period. The timer is integrated into the PLC monitor system and is used to prompt the
operator to begin cooling. A Mitsubishi FI series 60 I/O Programmable Logic Controller is
provided to monitor system safety. The PLC observes retort door interlocks and
temperature and pressure alarms and acts upon the automatic valves pump and cage drive.
A set of 23 valves is fitted to isolate and regulate the services to and
interconnections between the two vessels. Four styles of valves are fitted; they fall into two

47
categories, automatic and manual. The automatic valves include modulating valves on
retort system receive air and receiver vent, air line link to the receiver and retort steam line
and the transfer line between the retort and the receiver. The manual valves are all globe
valves for local service isolation.
3.1.2. Ellab data recorder (Model TM 9608, Ellab A/S)
Temperature range of the instrument is –100.0 to +350.0 °C. Resolution of the
instrument is 0.1°C. There are 8 channels with selective functions for product (Tc) and
chamber (Ta) temperatures. These 8 channels are updated within 4 seconds with each
channel getting updated within 30 seconds. The Fo constants are programmed
T=121.1.1°C, Z=10 °C and Cook value constants T=100 °C, Z=33 °C. The print out
interval from the instrument can be selected and it varies from 30 seconds to 60 minutes.
The print out shows Tc and Ta min/max, peak temperatures, channel numbers and the
actual process time they were measure and the corresponding Fo and Cook value of each
channel.
3.1.3. Can punch
Holes were made in the containers to fit thermocouple glands using Ellab TC 89
can punch suitable for rigid containers (Plate-2).
3.1.4. Packing glands and accessories
Ellab A/S, Model No: GKJ 13009 C042 packing glands for all kinds of containers
were used for the experiments (Plate-2). The GKM is as standard delivered with a GKM-U
rubber oring. For special applications it can be used with wedge washers and silicon
washers. Packing glands are usually made up of brass, stainless steel or polyoxymethylene

48
Plate-1. Overpressure autoclave (John Fraser Ltd, Model 24 Rotary Pilot Scale
Retorting System
Plate-2. Can punch, thermocouple glands and probes
.

49
3.1.5. Standard Thermocouple Probes
The probes used for the experiments are that of Ellab A/S, Model No: SSA 12040
G700 TS stainless steel electrode with a length of 40mm, diameter 1.2mm (Plate-2). These
probes are copper/cupronickel thermocouples; they are sealed probes with the conductor
being insulated from the process medium.
3.1.6. Exhaust line
The filled cans were exhausted using steam in an exhaust line (Can tech machines,
Mumbai). It has a total length of 10 meters and can work on variable speed so that the
exhausting time can be adjusted.
3.1.7. Double Seamer
The cans were seamed immediately after exhausting using the semi automatic
double seamer (Super Seam, Model No: 24 DS, Chennai). It can seam cans having
diameter ranging from 51 to 178 mm and height 51 to 248 mm and has a maximum output
of 40 cans per minute.
3.1.8. Double seam analyzer
The double seam parameters of cans were measured using SEAMetal 9000 system
(Quality by Vision, Israel). It consists of seam saw, optical unit and the software (Plate-3).
In order to accurately measure the seam parameters, a clean and precise section of the seam
with little or no deformation should be made. This is done with the seam saw equipped
with twin blade discs kept 12.9 cm apart and rotating at a speed of 500 rpm. Two cuts are
made simultaneously. Once the cut is made, the inner portion is pushed inside using a no
head screw driver so that the cut sections can be viewed through the seam analyzer.Usually
three cuts are made in a can one after the other by rotating the can approximately 120°.

50
Plate-3. Double seam analyser (SEAMetal 9000 system (Quality by Vision, Israel)
Seam saw
Double seam analyser

51
The optical unit of the seam analyzer is equipped with a camera that catches the
image of the cut section of the seam and forms a magnified image (50 times) of the latter in
the screen. With the help of the software, the various parameters required for measuring the
double seam parameters can be marked on the image thus formed.
3.1.9. Lacquer Coating Breakage detector
Lacquer Coating Breakage (LCB) detector developed by CIFT was used for testing
the coating perfection of cans. It is easy to use without damaging the cans and can be easily
incorporated to production lines. The checking time is 30 sec and the result is given as both
audio and light indication.
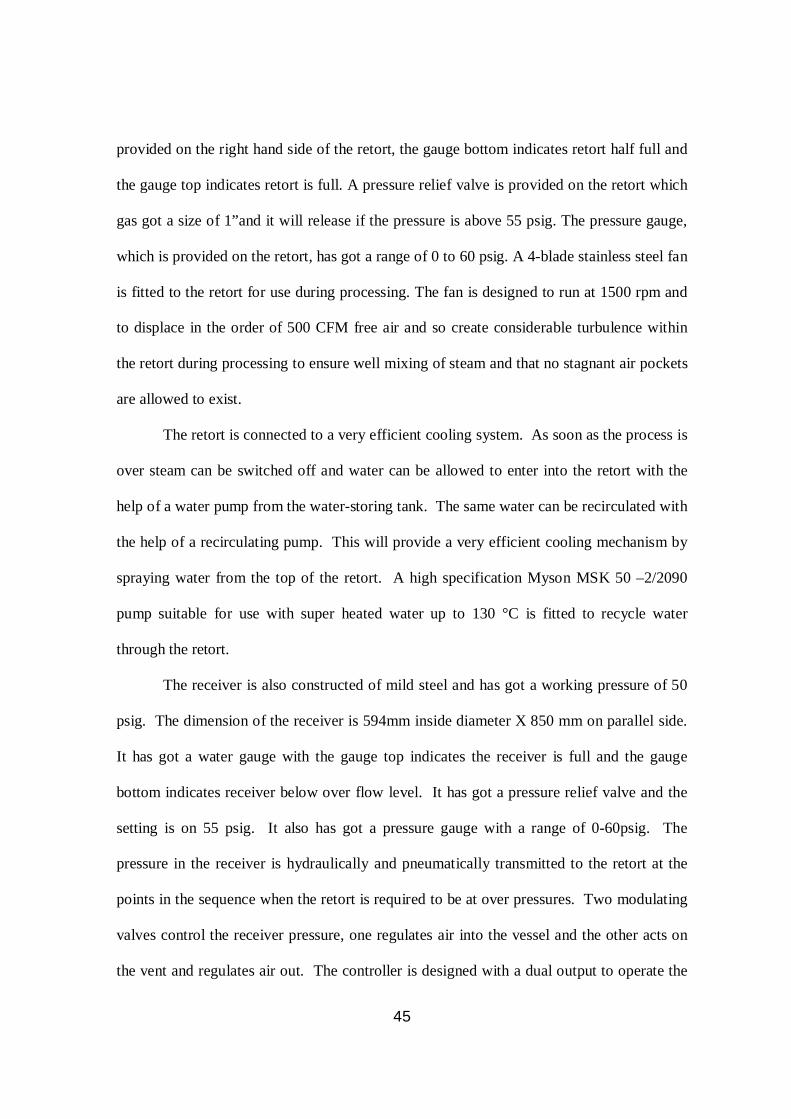
3.2. INSTRUMENTS 3.2.1. Texture Analyser
It is a general-purpose material-testing machine manufactured by Lloyd
instruments, UK , Model LRX plus (Plate-4a). The software used in the instrument is
Nexygen. When used with Nexygen software, data output is to a computer display and
printer. The main part of the instrument is a load cell. Standard cells are there with values
of 5000 N, 500N and 50 N and each one can be used depending on the type. The LRX plus
machines are fitted with two magnetically activating limit stops. Reaching magnetically
activated limit stop will result in the machine stopping. The speed of the cross edge
movement varies from .01-1016mm/min. The unit has a liquid crystal display (LCD) to
show set up information, load and extension values and a key pad to input information for
operating the machine when under the control of the console. The operating status of the
machine is shown on and described on the display. The display, which has 4 lines of forty
characters, is used to show or request information. The information displayed depends up
on the status of the machine but generally; the top line displays title or help information for
each display. The lower lines are split into four blocks, one block above each soft key to
indicate the function of the key.
52
Plate-4 a. Food Texture Analyzer (Lloyd instruments, UK (Model LRX plus)
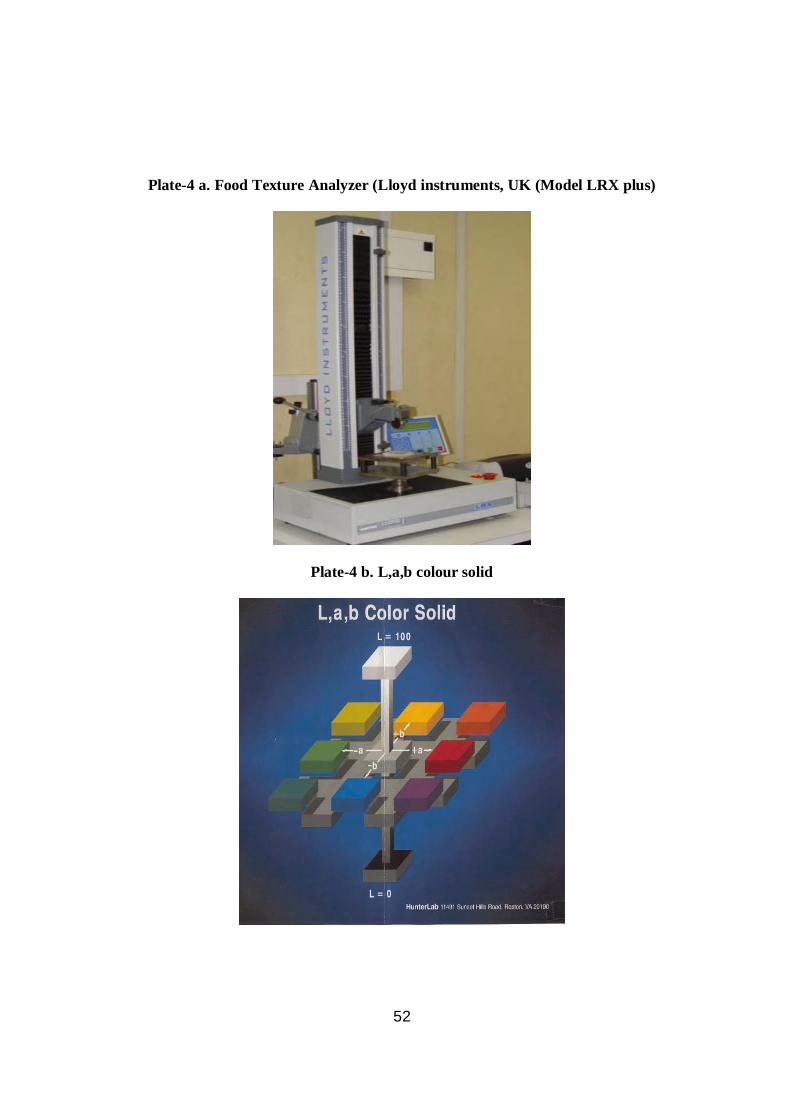
Plate-4 b. L,a,b colour solid
53
3.2.2. Coloriespectrophotometer
Colour measurements were done using a Hunter lab Colorimeter Model No D/8-S
(Miniscan XE Plus) with geometry of diffuse /8° (sphere 8 mm view) and an illuminant of
D65/10 deg. Samples to be analysed were homogenized and loaded inside the sample
holder for determination of the CIE L*, a* and b* values. First step in measuring is
standardization. Standardization sets the top and bottom of the scale for the neutral axis.
During standardization the bottom of the scale was set first. This was done by placing the
black glass or light trap at the sample port. The top of the scale was then set by using white
tile. In order to measure the L*,a* and b* values, sample holder loaded with sample is
placed at the instrument port with the side to be measured toward the port. Sample should
be flat against the port and completely cover. When the read key is pressed the sample will
be measured and its values saved in the instrument. In the Hunter scale, L* measures
lightness and varies from 100 for perfect white to zero for black, approximately as the eye
would evaluate it. The chromacity dimensions (a and b) give understandable designations
of color as follows: a* measures redness when positive, gray when zero, and greenness
when b* measures yellowness when positive, gray when zero, and blueness when negative
(Plate-4 b.).
MATERIALS
3.3.1. Containers
3.3.1.1. Indigenous Polymer Coated Tin Free Steel Can and Easy Open Ends (EOE)
Indigenous Polymer Coated Tin Free Steel cans of size 307 X 109 (6 oz capacity)
manufactured by M/s Amtech Packs, Mysore were used for the study (Plate-5 a). These are

54
2- piece cans manufactured by (Draw and Redraw) DRD process and are available along
with Easy Open Ends (EOE). Both the can and EOE are made from Electrochemically
Chromium Coated Steel (ECCS) plate coated with Poly Ethylene Terephthalate (PET) on
either side (Plate-5 b). The PET coating substitutes the lacquer coating of conventional tin
and aluminium cans is laid as a continuous layer over the chromium coated steel plates by
the process of lamination. The EOE is also manufactured from electrochemically
chromium coated steel plates with polymer coating and is provided with unique features
like triple fold technology, scoring along the periphery, and pull up tab all of which
facilitates the easy opening of the cans without employing a can opener. Cans and EOE
were thoroughly washed before use to remove adhering impurities and dried well to
remove traces of water.
3.3.1.2. Tin and Aluminium Cans
Tin cans of 8 Oz capacity and procured from M/s Sherton Industries, Bangalore,
India and aluminium cans of 8 Oz capacity and manufactured by M/s Klass Engineering
Company, Bangalore, India were used for the study. Tin cans were of 3-piece type while
aluminium cans were of 2-piece type.
3.3.2. Fish
Fishes used for the study were yellow fin tuna (Thunnus albacores) and Mackerel
(Rastelliger kanagurta), Indian white shrimp (Feneropenaeus indicus) and Squid (Loligo
dauvacelli d orbigny). They were collected from fisheries harbor (Cochin), iced at the ratio
1:1 (raw material: ice) and transported to the laboratory under iced condition (0-4 °C).
They were then washed using potable water to remove dirt. Mackerel was beheaded,
degilled and made free of fins, washed thoroughly in potable water and cut into 2.5 cm size
pieces, while shrimp was peeled and deveined followed by thorough washing in potable
water. Squid was made free of viscera carefully without disturbing the ink sac and peeled
off the skin and washed in potable water

55
Plate-6 a. Polymer coated Tin Free Steel (TFS) cans and Easy Open Ends (EOE)
Plate-6 b. Functional layers of TFS can

56
3.3.3. Oil
Double refined sunflower oil was used for the curry preparation.
3.3.4. Salt and other curry ingredients
Salt of edible quality confirming to IS: 594-1962 was used. All other ingredients
used for the curry preprations were of good quality, food grade and fit for human
consumption.
3.3.5 Squid masala curry
Squid masala curry was prepared following the recipe given in Table-1. Peeled
squid were cut into rings of 0.8 cm width using a sharp stainless steel knife. The rings were
then blanched in 8 % brine at 80 °C for 6 min. For curry preparation, chopped coconut was
fried to a golden brown and kept aside. Sliced onions were light fried along with green
chilly, curry leaves and ginger garlic paste. To this tomato paste was mixed along with
chilly powder, turmeric powder, pepper powder and little salt. Blanched squid rings were
added to this mixture along with fried coconut pieces and mixed thoroughly.
Table-1. Recipe for squid masala
Item Quantity
Squid 1 kg
Green chillies 75 g
Ginger 50 g
Garlic 50 g
Onion 500 g
Coconut 2 ½ (chopped)
Chilly powder 10 g
Pepper powder 10 g

57
Salt To taste
Coriander powder 10 g
Turmeric powder 5 g
Tomato 150 g
3.3.6. Shrimp curry
The peeled shrimps were hot blanched in 3% brine solution at 80 °C for about 7
min. After this they were cooled immediately to room temperature by keeping under fan.
For the shrimp curry preparation, green chilly, curry leaves and ginger garlic paste were
light fried along with sliced onions. To this tomato paste was mixed along with chilly
powder, turmeric powder, pepper powder and little salt. Blanched shrimp was added to this
mixture and mixed thoroughly. The recipe for shrimp curry is given in Table-2.
Table-2. Recipe for shrimp curry
Item Quantity
Shrimp 1 kg
Green chillies 75 g
Ginger 50 g
Garlic 50 g
Onion 500 g
Chilly powder 10 g
Pepper powder 10 g
Salt To taste
Coriander powder 10 g
Turmeric powder 5 g
Tomato 150 g

58
3.4. METHODS
3.4.1. ANALYSIS OF CAN
3.4.1.1. Determination of water capacity (IS: 6093, 1970)
Two holes of 3 - 4 mm diameter were drilled about 5 cm apart as close as possible
to the countersink, from the inside surface outwards on a can end. This was attached by
double seaming on the other end of the can body. The can was weighed to the nearest 1g
and the container was filled with water at 27 °C employing a narrow water jet through one
of the holes. Surplus water on the out side of the can was removed using a blotting paper
and the filled can was weighed to the nearest 1g. The difference between the weights was
noted and to this 0.45% of the value was added. This represents the capacity in milliliters.
3.4.1.2. Air pressure test (IS: 9396, 1979)
This test was performed to determine the pressure holding capacity of the cans and
to check for any leakage through the double seam. The cans were pierced with a piercing
type of pressure gauge and then air was pumped inside using a foot operated pump until
any distortion of the can or any leakage through the double seam area was noticed. The
double seamed cans have to be immersed in boiling water for 5 min prior to the test.
3.4.1.3. Determination of Vacuum (IS: 3336-1968)
The vacuum in the can was determined with a vacuum gauge of the piercing type.
3.4.1.4. Test for coating perfection
The perfection of the PET coating was analysed using the Lacquer Coating
Breakage (LCB) detector. The can was filled with 10% brine and attached to the LCB

59
detector in such a way that one of the electrodes is in contact with the edge of the flange
where the base metal is exposed and the other electrode is dipped in the brine. Presence of
any discontinuity in the coating allows the circuit to complete which will be indicated by
light and audio indicators.
3.4.1.5. Sulphide blackening test (Anon, 1977)
Resistance of cans to sulphide blackening was analyzed following the Cysteine test.
For this, cans were filled with the test solution consisting of 0.5 g of cysteine chloride in 1
liter of buffer solution (3.56 g KH2 PO4 and NA2H PO4. 2 H2O in 1 liter of distilled water).
Filled cans were double seamed and retorted for 30 min at 125 °C. They were then left to
cool down at room temperature for 24 hrs and were opened and evaluated for any
blackening.
3.4.1.6. Test for delamination of PET coating
The polymeric coating of TFS can was subjected to delamination test using various
organic solvents like acetone, carbon tetra chloride, chloroform, diethyl ether, ethyl acetate,
n-heptane, methanol, and petroleum ether. Panels of 1 X 1 cm size were taken and
immersed in organic solvents. They were taken out after 24 hrs and examined for any
delamination of the PET coating. When there was no peeling they were kept immersed for
another 12 hrs. The panels were taken out and heated in water bath for few minutes and
examined for delamination of the coating.

60
3.4.1.7. Test for thickness of PET coating
The PET coating was first delaminated from the base metal by immersing in
chloroform for 24 hrs. It was then dried in air at room temperature. The dried material was
analyzed for its thickness using a digital micrometer.
3.4.1.8. Test for suitability of can for processing at different temperature and pressure
The cans were processed at different temperatures and pressures of 115 (10lbs),
121.1.1 (15lbs), 126 (20lbs) and 130 0C (25 lbs) in a pilot scale retort of model 24 rotary
retorting systems (John Fraser and sons Ltd, UK. Model.No.5682) to determine it’s ability
to withstand different processing conditions.
3.4.1.9. Test for food contact application
Suitability of the can for food contact application was found out by determining the
water extractives at 121.1 ˚C for 2 hrs and soluble chloroform extractives as per the
methods of FDA (2003). The cans were filled with 200ml of hot glass distilled water and
immediately heat-sealed. The sealed cans were heat processed at 121.1.1 °C for 2 hrs. After
processing the processed water was transferred into clean beakers and evaporated up to
50ml.The contents of the beaker were transferred into another clean pre weighed tared
platinum dish and evaporated to dryness. After cooling the weight of the dish is again taken
to the nearest 0.1 mg to find out the amount of water extractives. To those dishes
containing water extractives 50 ml of chloroform is added to dissolve all the chloroform
extractives. The contents are filtered and evaporated to dryness in a clean pre weighed tared
platinum dish. After drying the weight of the dish is again taken to the nearest 0.1 mg to
determine the amount of chloroform extractives.

61
3.4.1.10. Test for seam integrity
The seam integrity of the polymer coated tin free steel cans was analysed following
the cut out analysis (Balachandran, 2003) and using the semi-automatic Double seam
analyser (Quality By Vision, Model SEAMetal 9000M, Israel). For cut out analysis, double
seamed cans were selected at random and three equidistant points were marked on the
circumference of the seam of the can. Using a micrometer, the Seam length (L), Seam
thickness (Ts), Body hook, Cover hook, Body plate thickness (Tb), Cover plate thickness
(Tc), were measured. From these parameters, the % overlap was calculated using the
formula.
% Overlap = BH +CH +1.1tc - L
L – (2.2tc + 1.1tb)
Where
BH = Body hook length
CH = Cover hook length
tc = Cover plate thickness
tb = Body plate thickness
L = Seam length.
For the purpose of seam analysis using the double seam analyser, double seamed
cans were selected at random and three cut sections were made on the double seam one
after the other using the twin blades of the seam saw which are rotating at a speed of about
500 rpm. The cut width is 12.9 mm, which accurately fits to the camera of seam analyser.
The double seam parameters such as Seam length (L), Seam thickness (T), Body hook
(BH), Cover hook (CH), Body thickness (tb), End plate thickness (tc) etc were measured
using the seam analyzer SEAMetal 9000M.

62
3.4.2. THERMAL PROCESSING
3.4.2.1. Prepration of test cans
Adequate number of test cans were prepared to trace the thermal history during the
heating and cooling phases of the canning operation. For this the cans were perforated from
the side by using the can punch which can form holes through which the packing gland can
be inserted into the can. The perforation was done in such a way that the thermocouple tip
will be pointed towards the centre of the can at one third height from the bottom which is
recognised as the slowest heating point. The packing gland was then tightly screwed into
the can body with the rubber gasket which helps in forming leak proof joint.
3.4.2.2. Standardisation of optimum process parameters for ready to eat fish products
in polymer coated tin free steel cans
Heat penetration studies were conducted with the purpose of standardizing the
optimum process condition for various ready to eat fish products in tin free steel cans. The
heat penetration studies of Squid masala and shrimp curry were carried out seperately by
thermal processing at 121.1 0 C to F0 values of 7, 8 and 9 and 6, 7 and 8 respectively in a
stationary retort. In both cases, about 160 ±2 g of product was packed in washed and dried
6 Oz polymer coated easy open-end TFS cans, maintaining headspace of 0.4 mm. During
can filling, care was taken to avoid the curry from contaminating the sealing area of the
cans. Adequate numbers of test cans were prepared by fixing with thermocouple glands at
about one third height from the bottom of the can with the tip of the gland pierced into the
core of the meat. The cans were exhausted under steam in an exhaust box for 10 min and
immediately double seamed in a double seaming machine. The sealed cans of squid masala
63
and shrimp curry were divided into 3 batches and were loaded inside the retort (John Fraser
and sons Ltd, UK. Model.No.5682) separately on perforated stainless steel trays. The
themocouple probes were attached to the thermocouple glands that were already attached to
the test cans. The lead wire from the thermocouples were attached to the Ellab data
recorder (Model TM 9608, Ellab A/S). Three test cans were employed for each trial run of
each product. Care was taken to maintain the initial product temperature at 35 °C. Squid
masala was processed at 121.1 °C to three different F0 values of 7, 8 and 9 min while
shrimp curry was processed to F0 6, 7 and 8 min. Triplicate runs for each F0 value was also
conducted. The cans were cooled rapidly by spraying water under pressure to a core
temperature of 40 °C so as to prevent the proliferation of thermophiles and the product
from getting overcooked. The cooling water was maintained with constant chlorine residual
level of 2 mg/L. Graves et al. (1977) recommended a residual chlorine level of 1–3 mg/L to
maintain bacterial control in cooling water. The thermal history of the retort and the test
cans during the entire thermal process operation was collected at every 30 sec using Ellab
data recorder (Model TM 9608, Ellab A/S) evaluated as described in section 3.4.2.4. The
cans were then dried, labeled and stored. The cans were stored at room temperature for
about 15 days and then subjected for the analysis of commercial sterility, instrumental
colour, texture, shear force and sensory parameters for the selection of optimum process
conditions.
3.4.2.3. Canning of mackerel in brine (MIB) at different retort temperatures
In order to determine the effect of different retort temperatures on the heat
penetration parameters, sensory and biochemical characteristics, Mackerel in brine was
thermally processed at different retort temperatures of 115, 121.1 and 130 0 C in a

64
stationary retort to the standardized F0 value of 8 min. Many workers have reported that F0
value of above 9 min was not satisfactory for canned mackerel products based on the
sensory characteristics (Srinivasa Gopal et al., 1998 and 2001). Triplicate runs for each
tmeperature was conducted and the average values were taken.
Freshly cut mackerel pieces were blanched in 10% brine for 15 min and then about 140± g
of fish pieces were filled into the cans. Test cans were fixed with fish piece with the tip of
the thermocouple gland piercing into the core of the meat. Precooking was done at 100 °C
for about 20 min. The precook exudate was drained off and the cans were filled with 60ml
of hot brine solution. The filled cans were then steam exhausted in free flowing steam for
10-12 min and immediately double seamed in a seaming machine. The filled and sealed
cans were divided into three batches and thermally processed to a F0 value of 8 min at 115,
121.1 and 130 0C (John Fraser and sons Ltd, UK. Model.No.5682). Care was taken to
maintain the initial product temperature at 35 °C. Triplicate run for each temperature was
conducted. At the end of the process cans are cooled immediately. Thermal data during
heating and cooling phases of the thermal process operation was collected and evaluated as
described in section 3.4.2.4. The cooled cans were dried, labeled and stored. (IS: 3849-
1976). The cans were kept for maturation for about 14 days and analysed for commercial
sterility, instrumental colour, texture and shear force, sensory and biochemical parameters.
3.4.2.4. Thermal process evaluation
The recorded data were analysed using a computer. The lethality accumulated
during the entire processing (heating and cooling) was calculated from the temperature
history inside by numerical integration based on the original work of Ball (Ball and Olson,
1957).
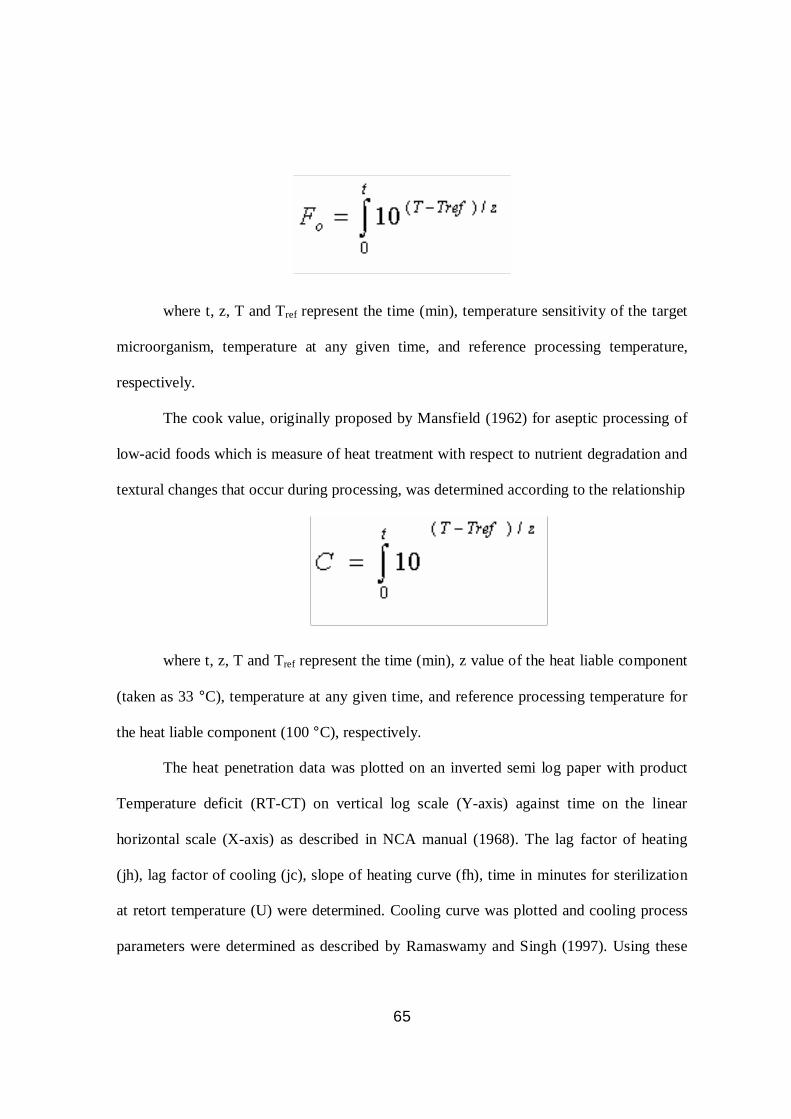
65
where t, z, T and Tref represent the time (min), temperature sensitivity of the target
microorganism, temperature at any given time, and reference processing temperature,
respectively.
The cook value, originally proposed by Mansfield (1962) for aseptic processing of
low-acid foods which is measure of heat treatment with respect to nutrient degradation and
textural changes that occur during processing, was determined according to the relationship
where t, z, T and Tref represent the time (min), z value of the heat liable component
(taken as 33 °C), temperature at any given time, and reference processing temperature for
the heat liable component (100 °C), respectively.
The heat penetration data was plotted on an inverted semi log paper with product
Temperature deficit (RT-CT) on vertical log scale (Y-axis) against time on the linear
horizontal scale (X-axis) as described in NCA manual (1968). The lag factor of heating
(jh), lag factor of cooling (jc), slope of heating curve (fh), time in minutes for sterilization
at retort temperature (U) were determined. Cooling curve was plotted and cooling process
parameters were determined as described by Ramaswamy and Singh (1997). Using these

66
parameters the process time (B) was calculated according to mathematical method
(Stumbo, 1973). The total process time was calculated by adding 58% of come up time
(CUT) to B.
Process time (B) = fh [log I x Jh – log g]
Total Process time (T) = B + 58% of come up time
3.4.3. STORAGE STUDY
Ready to eat squid masala and shrimp curry were prepared and processed in large
scale according to the chosen F0 values and kept for storage studies at room temperature
(30±20C) during which samples were taken on monthly basis and were analyzed for
instrumental color, TPA, shear force, TBA, pH and sensory characteristics for a period of
one year following standars methods.
3.4.4. ANALYSIS OF FISH MEAT
3.4.4.1. Physiochemical Parameters
3.4.4.1.1. pH (IS: 2168-1971)
5g of the sample was dispensed in 10ml of distilled water and pH was measured by
using pH meter.
3.4.4.1.2. Instrumental colour
The L*, a* and b* or CIE Lab colour values of the samples were analyzed using
Hunter lab colorimeter (Model No: Miniscan-XE plus, Hunter associates laboratory,
Virginia, USA). Squid muscle and shrimp pieces were finely homogenized in a food

67
homogenizer (Kenstar Kitchen Appliances India Limited, Aurangabad, India.) and loaded
inside the sample holder while fish meat was made free of skin and bones before
homogenising.
3.4.4.1.3. Texture profile attributes
The texture profiles of samples were analyzed using a food texture analyzer (model
LRX Plus, Lloyds Instruments, Hampshire, U.K.) and Nexygen software (Lloyds
Instruments). The sample was placed on a flat platform and was subjected to double
compression by a cylindrical probe with a 50-mm diameter. The test was conducted at a
speed of 12 mm/min using a 50-N load cell. The sample was allowed for a double
compression of 40% with a trigger force of 0.5 kg during which the various textural
parameters like hardness1, hardness2, cohesiveness, springiness, gumminess, chewiness
were determined.
3.4.4.1.4. Warner –bratzler shear force
The shear force of samples was determined using the Food texture analyzer (Lloyds
Instruments, Model LRX Plus, Hampshire, UK) and software Nexygen. The test was done
with a load cell of 50N fitted with the Warner-Bratzler shear attachment, which is a 3mm
thick steel blade with a V-cut at the lower edge. The blade edge was not sharpened and
fitted loosely into the slit in the table. The sample to be tested was placed on the table under
the blade and was allowed to be cut by the blade that was moving downwards at a constant
speed of 50mm/s through the slit of the table. The shearing direction was set perpendicular
to the orientation of the muscle fibers.

68
3.4.4.2. Biochemical parameters
3.4.4.2.1. Proximate composition 3.4.4.2.1.1. Determination of moisture (AOAC, 2000)
A known weight of sample (10 gm) was weighed in a preweighed clean petridish on
an electronic balance. The samples were allowed to dry until uniform weight by placing in
a hot air oven at 100 °C for 6 hrs. Then cooled in a desiccator and weighed. The moisture
content was calculated and expressed as percentage.
3.4.4.2.1.2. Determination of crude protein (AOAC, 2000)
About 0.5- 1 gm of the minced sample was transferred into a Kjeldahl flask of 100
ml capacity. A few glass beads and a pinch of digestion mixture and 10 ml of concentrated
sulphuric acid were also added. It was then digested over a burner until the solution turned
colourless. To the digested and cooled solution distilled water was added in small
quantities with intermittent shaking and cooling until the addition of water generated no
heat. It was transferred quantitatively into a1 00 ml standard flask and made up to the
volume. With a 2 ml pipette, the made up solution was transferred to the reaction chamber
of the Micro-Kjeldahl distillation apparatus. 2 drops of phenolphthalein indicator and 40%
sodium hydroxide were added till the indicator changed to pink. Distillation was done for 4
minutes and ammonia liberated was absorbed into 2% boric acid containing a drop of
Tashiro’s indicator. The amount of ammonia liberated was determined by titration with
0.01 N standard sulphuric acid. Crude protein was calculated by multiplying total nitrogen
content with conversion factor of 6.25 and expressed as percentage.

69
3.4.4.2.1.3. Determination of ash content (AOAC, 2000)
About 1-2 gm of the sample was transferred into a preweighed silica crucible. The
samples were then charred by placing in a muffle furnace at 550 °C for 4 hrs until a white
ash was obtained. Crucibles were weighed after cooling in a desiccator and percentage of
ash was calculated.
3.4.4.2.1.4. Estimation of crude fat (AOAC, 2000)
About 2-3 gm of accurately weighed moisture free sample was taken in a thimble
plugged with cotton and extracted with petroleum ether (Boiling point 40-60 °C) in a
soxhlet apparatus for for about 10 hrs at a condensation rate of 5-6 drops per second.
Excess solvent was evaporated and the fat was dried at 100 °C to constant weight. The
crude fat was calculated and expressed as percentage.
3.4.4.2.2. Amino acid profile (Ishida et al., 1981)
Reagents
1. 6 N HCl
2. Buffer A Tri Sodium Citrate 32.7g, Distilled
Ethanol 140 ml, Perchloric acid 16.6 ml,
pH 3.2. Make up to 2 liter with distilled
water.
3. Buffer B Tri sodium citrate 117.6 g, Boric acid 24.8
g, 4 N NaOH 45 ml, pH 10. Make up to 2
lire with distilled water.
4. Buffer C
0.05 N HCl.
5. OPA Buffer Sodium carbonate 40.7 g, Boric acid 13.57
g, Potassium sulfate 18.8 g. make up to 1
liter.

70
6. O-phthalaldehyde reagent OPA 80 mg, Methanol 1.4 ml, 2 Mercapto
ethanol 0.2 ml, Brij 0.15 ml. make upto
100 ml with OPA buffer.
7. Sodium hypochlorite reagent 0.3 ml sodium hypochlorite make up to
100 ml.
Procedure
About 100-150 mg of sample was weighed accurately into a heat sealable test tube.
10 ml of 6 N HCl was added and the tube was heat sealed after filling with pure nitrogen
gas. Hydrolysis was carried out in a hot air oven at 110 °C for 24 hrs. After hydrolysis, the
contents were removed quantitatively and filtered into a round bottom flask through
whatman filter paper No 42. The contents of the flask were flash evaporated to remove the
traces of HCl and the process was repeated for 2-3 times with added distilled water. The
residue was made upto 10 ml with 0.05 N HCl. The sample thus prepared was filtered
through a membrane filter of 0.45 µm and 20 µ ml of this was injected to Shimadzu HPLC-
LC10AS consisting of column packed with strongly acidic cation exchange resin i.e.
Styrene divinyl benzene copolymer with sulfonic group. The column used Na type i.e. ISC-
07/S1504 Na having a length of 19 cm and diameter 5mm. The mobile phase consists of
two buffers, Buffer A and buffer B. The oven temperature was maintained at 60 °C. The
amino acids were eluted from the column by stepwise elution i.e. acidic amino acids first
followed by neutral and then basic amino acids. The amino acid analysis was done with
non-switching flow method and fluorescence detection after post column derivatisation
with O-phthalaldehyde. In the case of Proline and Hydroxy proline, imino group was
converted into amino group with odium hypochlorite. Amino acid standard was also run to

71
calculate the concentration of amino acid depending upon the standard chromatogram. The
results were quantified and represented as gram amino acid per 100 g proteins.
3.4.4.2.3. Determination of Tryptophan (Sastry and Tummru, 1985)
Reagents
5% NaOH
6 N HCl
2.5% Sucrose
0.6% thioglycolic acid
50 % H2SO4
0.1 N HCl
Standard tryptophan ( 10 µ g/ml)
Procedure
About 200-250 g of fish muscle was accurately weighed and was hydrolyzed with
10 ml 5% NaOH at 110 0C for 24 hrs in a sealed tube filled with pure nitrogen. The
hydrolysate was neutralized to p H 7.0 with 6 N HCl using phenolphthalein indicator. The
volume was made up to 100 ml with distilled water. The solution was then filtered through
whatman filter paper No. 1 and filtrate was used for the estimation. To a test tube
containing 4 ml of 50 % H2SO4, 0.1 ml of 2.5 % sucrose and 0.1 ml of 06 % thioglycolic
acid were added and these tubes were kept for 5 min in water bath at 45-50 0C and cooled
The sample was then added to the test tubes. A set of (0.1-0.8 ml) standard tryptophan
(10µ g/ ml) was run in this way the volume was made up to 5 ml with 0.1 N HCl and
allowed to stand for 5 min for the development of color. The absorbance was measured
against a reagent blank at 500 nm in a spectrophotometer.

72
3.4.4.2.4. Estimation of minerals and metallic contaminants using Atomic Absorption
Spectrophotometer (AOAC, 1980)
Reagents
1. Nitric acid
2. Perchloric acid
Reagents 1and 2 were mixed in the ratio 9:4
Stock solution of sodium, potassium and calcium were prepared by diluting concentrated
solution of 1000 mg/l (Merck).
Procedure
Samples size of 200mg of fish muscle and gravy was used for the experiment. To
the sample containing flask, 7ml of nitric acid and perchloric acid (9:4) mixture was added,
covered with a watch glass and left at room temperature over night. The sample was then
digested using a microwave digester (Milestone ETHOS PLUS lab station Closed Vessel
Microwave Digestion System). The completely digested samples were allowed to cool at
room temperature, filtered (glass wool) carefully and transferred into a clean 50 ml
volumetric standard flask and then diluted to the mark with ultra pure water (Milli Q,
Millpore). The digested samples were analyzed using Varian Spectra-220 AA, Atomic
Absorption Spectrophotometer equipped with a deuterium back ground corrector for the
determination of minerals and metallic contaminants.
3.4.4.2.5. ATP breakdown products
The ATP breakdown products were determined according to the method of Ryder
(1985) using High Performance Liquid Chromatography (HPLC). Merck Hitachi Li

73
Chrome HPLC fitted with L-7100 quaternary gradient pump, L-7400 UV detector and C18
stainless steel column was used for the analysis. Merck Hitachi Model D-
7000,Chromatography Data Station Software HPLC System Management (HSM) was used
in the study.
3.4.4.2.5.1. Standard preparation
The standard nucleotide solution was prepared individually so as to give a
concentration of 10 mM. For this, 27.755 mg ATP, 23.5585 mg ADP, 17.36 mg AMP,
17.4105 mg IMP, 6.805 mg Hx and 13.41 mg HxR was dissolved in 5 ml milli Q purified
(0.22 µm Millipore) distilled water separately. Initially, Hx and HxR were dissolved in 0.1
N NaOH and made up to known volume using milli Q purified distilled water. From this 10
mM stock solution, 0.01, 0.05, 0.1, 0.5 and 1.0 mM mixed standard solutions were
prepared by diluting with milli Q purified distilled water and used for obtaining standards
curve area.
3.4.4.2.5.2. Sample preparation
Fish extract used for the analysis was prepared by homogenizing 5 g of fish muscle
(without skin) with 25 ml chilled 0.6 M perchloric acid in a laboratory homogenizer (ART
modern Labortechnik, Zienkener Str. Muellheim, Germany) at 00 C for 1 min. The
homogenate was centrifuged at 6000 rpm for 20 min at 40 C. The supernatant was then
decanted and immediately neutralized to pH 6.5 - 6.8 with 1 M potassium hydroxide
solution. After standing at 1-20 C for 30 min, the precipitated potassium perchlorate was
removed by filtration through a syring of pore size 0.45 µm.The filtrate was stored at -700
C until analysed. High Performance Liquid Chromatography (Merck Hitachi Li Chrome
HPLC fitted with L-7100 quaternary gradient pump, L-7400 UV detector, set at 240 nm)
74
was used for quantitative analysis of ATP breakdown compounds of prepared samples. 20
µL aliquots of the sample extracts were injected into the HPLC and the separation of the
nucleotide products was achieved by a 5 µm pore size column (C18 stainless steel column
with size 250 x 4 mm, length x dia). Integration was carried out using Chromatography
data station software, HPLC System Management (HSM) programme installed into the
computer system. The mobile phase of 0.04 M potassium dihydrogen orthophosphate and
0.06 M dipotassium hydrogen orthophosphate dissolved in Milli Q purified distilled water
was used at a flow rate of 1.5 ml/min. The peaks obtained from fish muscleextracts were
identified by comparing against the standard solutions. ATP breakdown products,
comprising ADP, AMP, IMP, Hx and HxR were measured and K value was calculated
using the formula described by Saito et al. (1959).
[HxR] + [Hx]
K-value (%) = ------------------------------------------------------------------ X 100
[ATP] + [ADP] + [AMP] + [IMP] + [HxR] + [Hx]
3.4.4.2.6. Biogenic Amines
The biogenic amines content in fish was determined using rapid HPLC method as
described by Ozogul et al. (2002). The gradient system and the flow rate were modified
depending on the retention time of the standard amine solution to get good resolution
within a short time.
3.4.4.2.6.1. Preparation of standard amines solution
16.57 mg of histamine di-hydrochloride, 18.29 mg of putrescine di-hydrochloride,
17.14 mg cadaverine dihyrochloride, 17.52 mg of agmatine sulphate, 12.67 mg of tyramine

75
hydrochloride, 17.20 mg of spermine tetrahydrochloride and 17.53 mg of spermidine tri-
hydrochloride were dissolved separately in 10 ml of HPLC grade water. The final
concentration of free base for each amine was 1 mg/ ml solution. From this, 2.5, 6.25, 12.5
and 18.75 µl of each standard was taken and made up to 250 µl using HPLC grade water
and derivatized to get a concentration of 10, 25, 50 and 75 µg/ml (ppm) respectively.
3.4.4.2.6.2. Preparation of sample
Fish muscle (5 g) was taken and made free of and transferred to a centrifuge tube.
The sample was homogenized with 25 ml 6% TCA for 3 min, centrifuged at 12000 rpm for
10 min at 40 C and filtered through Whatman No. 1 filter paper. The aliquot was made up
to 25 ml with 6% TCA and stored at -200 C until analysis.
3.4.4.2.6.3. Derivatisation procedure
A stock solution of 2% benzoyl chloride in acetonitrile was prepared to enhance the
reaction with amines. For derivatization of standard amine solution and fish sample, 50 µL
and 2 ml was used respectively. One milliliter of 2 M sodium hydroxide was added,
followed by 1 ml benzoyl chloride (2%), and mixed on a vortex mixer for 1 min. The
reaction mixture was left at room temperature (25 0C) for 30 min. The benzoylation was
stopped by adding 2 ml of saturated sodium chloride solution and the solution was
extracted two times with 2 ml of diethyl ether. The upper organic layer was transferred into
a clean test tube after mixing and evaporated to dryness in a stream of nitrogen or using
vacuum drier. The residue was dissolved in 500 µL of acetonitrile and stored at -20 0C
untill use and 20 µL was injected into the HPLC.

76
3.4.4.2.6.4. Chromatographic condition
Merck Hitachi Li Chrome HPLC fitted with L-7100 quaterinary gradient pump and
L-7400 UV detector was used for the analysis. Merck Hitachi Model D-7000,
Chromatography Data Station Software HPLC System Management (HSM) was used in
the study. The column used was Li Chrome CART® 250-4 C18 RP of size 250 x 4 mm
(length x dia) with pore size of 5 µm. Chromatographic separation was done by continuous
gradient elution with acetonitrile (solvent A) and HPLC grade Millipore water (solvent B)
as described by Ozogul et al. (2002). The gradient started with 50% acetonitrile and
increased to 80% in 10th minute. The pressure was maintained between 1300 to 1500 psi
throughout the separation period.
3.4.4.2.7. Determination of sulfhydryl content (Sedlak and Lindsay, 1968)
This method is based on the development of a yellow colour when DTNB is added
to compounds contained sulfhydryl groups to form 2-nitro 5- mercaptobenzoic acid.
3.4.4.2.7.1. Prepration of tissue extract
About 800 mg of sample was homogenised with n16 ml 0.02 M EDTA in a tissue
homogeniser for 2 min @ 10,000 rpm. Tubes were kept in ice bath to avoid heat generation
during homogenisation. The homogenate was kept in ice bath until used.
3.4.4.2.7.2. Determination of total sulfhydryl group
Aliqots of 0.5 ml of tissue homgenate was mixed in 15 ml stoppered test tube with
105 ml 0.2 M tris buffer, ph 8.2 and 0.1 ml 0.01 M 5,5-dithiobis-2-nitrobenzoic acid
(DTNB). A reagent blank (without sample) and a sample balnk (without DTNB) wre
prepared in similar manner.the test tubes were stoppered and allowed to stand with

77
occsional shaking for 30 min, then filtered through Whatman filter paper No.2, thereby
attaining clear filterate. Then the absorbance was read in a Spectronic 20 Genesys at 412
nm.
3.4.4.2.7.3. Prepration of standard curve
Standard solution of concentration 2X10⁻⁴ cystine ranging from 0.1-0.5 ml was
pipetted in duplicate. The volume was made upto 0.5 ml with 0.02M EDTA. To this 1.5 ml
tris buffer was added, followed by 0.1 ml 0.01 M DTNB and made upto 10 ml with
absolute methanol and then proceeded as given above for sample.
A graph was drawn taking concentration along the X-axis and absorbance along the Y-axis
and the concentartion of the sample was calculated from the standard graph. The sulfhydryl
content was estimated acoring to the formula
Conc. in the volume taken for estimation X 16 1 mole SH/g DM= ----------------------------------------------------------------------
Wt: of the sample X % DM X volume taken for estimation 3.4.4.2.8. Determination of Indole in shrimp (Cheuk and Finne, 1981)
About 35-40g of the muscle was homogenized with 80ml ice cold 6% TCA solution
in a Laboratory mixer emulsifier (Euro Turrax T20b Ika Labortechnik) for 1 min. and 80ml
ice cold petroleum was added and blended once more for 1 min. The homogenate was
transferred to centrifuges tubes and centrifuged for 10 min. at 10,000 rpm in a refrigerated
centrifuge (REMI cooling Centrifuge). Supernatant was filtered through Whattmann no.1
filter paper under slight suction and was transferred to a separatory funnel. After the

78
formation of two layers, the lower acid layer was transferred to a second separatory funnel
and was re-extracted with 40ml light petroleum as described above. The procedure was
repeated thrice and the light petroleum extracts were combined into one separatory funnel
and indole was extracted with exactly 10ml freshly prepared Ehrlich’s reagent by vigorous
shaking for 1min. When layers were separated and cleared, the lower coloured layer was
transferred to a cuvette and absorbance was read at 570 nm against a reagent blank
solution. Concentrations of indole in the samples were determined from a standard curve.
3.4.4.2.8.1. Preparation of Ehrlich’s reagent
To 9 g of paradimethylaminobenzldehyde (Sigma Chemicals Co., St. Louis, USA)
45 ml of concentrated hydrochloric acid was added in 250 ml volumetric flask and was
then made up to volume with ethanol.
3.4.4.2.8.2. Preparation of Standard Curve
A stock solution of indole was prepared by accurately weighing 10mg indole
(sigma chemicals Co., St.Louis, USA), and dissolving it in 100ml light petroleum. Then 0.1
to 0.5 ml stock indole solution was accurately pipetted to separatory funnels and 80 ml 6%
TCA and 80 ml light petroleum were added. Indole was then extracted by the procedures
described above and absorbance was read at 570 nm in a spectrophotometer. A standard
curve was constructed as concentration (µg) versus absorbance.
3.4.4.2.9. Volatile compounds
3.4.4.2.9.1. Preparation of Trichloro Acetic Acid (TCA) Extract
About 10 g of accurately weighed sample was extracted with 10% trichloro acetic
acid (TCA) by grinding in a mortar and pestle, the content was filtered quantitatively

79
through Whatman Filter paper No.1. Filter paper was thoroughly washed with TCA and
filtrate was made up to 100 ml. The TCA extract was used to measure Trimethyl amine
and Total Volatile base nitrogen of fish.
3.4.4.2.9.2. Total Volatile Base Nitrogen (TVB-N) (Conway, 1950)
Conway unit were cleaned in chromic acid, soaked in water, washed and dried.
Cover plates were coated on underside with wax grease. The units were kept ready before
preparing the extract.
One ml of the supernatant was taken from the TCA extract prepared and was put in
the outer chamber of Conway micro diffusion unit, spreading it around the chamber as
much as possible. One ml of standard acid is taken in the central chamber and one ml
saturated potassium carbonate solution in the outer chamber. Cover plate was put on
ensuring that no leak occurs. Solutions in the outer chamber were gently swirled with great
care to mix them. Unit was left overnight. Acid in the central chamber was titrated against
0.01N sodium hydroxide using 2 drops of Tashiro’s indicator. A reagent blank was also
titrated by taking standard acid at central compartment and 10% TCA in the outer chamber.
Total volatile base nitrogen (TVB-N) was calculated and expressed as mg N/100 g.
3.4.4.2.9.3. Tri-methylamine nitrogen (TMA-N)(Conway 1950)
1ml of standard 0.01N sulfuric acid was taken in the inner chamber of the diffusion
unit. To the outer chamber 1ml of TCA extract and 1ml of neutralized formaldehyde and
1ml of saturated potassium carbonate were added. The unit was then sealed, gently swirled
and kept overnight undisturbed. The amount of non-reacted acid in the inner chamber was
determined by titration against standard 0.01N sodium hydroxide using Tashiro’s indicator.

80
Blank was simultaneously carried out with 1ml of 10% TCA solution. TMAN was
calculated as mg N/100 g of the muscle.
3.4.4.2.10. Determination of Thiobarbutyric acid (TBA) value (Tarladgis et al., 1960)
10 g of fish meat was mixed with 100 ml 0.2 N HCI and homogenised to make
slurry. Slurry was poured to a round bottom flask and connected to the TBA distillation
apparatus. Distillation was done until 50 ml of the distillate was collected within 10
minutes. 5 ml of distillate was taken in a test tube, 5 ml TBA reagent was added and heated
for 35 mins. A blank was also done with distilled water. Colour developed was measured in
a spectrophotometer at 538 nm and TBA value was determined and expressed as mg
malonaldehyde/kg of fish sample.
3.4.4.3. Microbiological Analysis
3.4.4.3.1. Total plate count (Hitching et al., 1995)
10 g of the sample was weighed aseptically into a sterile sample dish and
transferred into a sterile polythene pouch and soaked in 90 ml normal saline for 15 minutes,
after which it was blended in a Stomacher blender(Stomacher 400 Circulator) for 60
seconds at normal speed. Using a sterile pipette, 1 ml of the supernatant was aseptically
transferred into a 9 ml saline tube and mixed well using Vortex mixer. Similarly further
dilutions were prepared for the inoculation. 1 ml each of the appropriate dilutions was
pipetted to appropriately marked sterile petridishes taken in duplicates for each dilution.
About 15-18 ml of molten plate count agar medium cooled to 45 °C, was poured to each
plate, mixed well with the inoculam and allowed to set for 30 minutes. The plates were
incubated at 37 °C for 48 hours in an inverted position. After the incubation period, the
81
individual bacterial colonies were counted. The average counts of the triplicates were taken
and TPC/g of the sample was calculated.
3.4.4.3.2. Commercial sterility (IS: 2168-1971)
About eight cans were selected at random from each batch processed to different F0
values. Four cans from each batch were incubated at 55 °C for 4 days and another four
were incubated at 37 °C for 14 days. The incubated cans were opened under aseptic
conditions and the samples were transferred to sterile thioglycollate broth tubes. Then a
layer of sterile liquid paraffin was applied in each tube so as to create anaerobic condition.
The tubes were then incubated at 37 °C for 48 hrs and observed for any development of
turbidity, which indicates survival of microorganisms. Tubes not showing any turbidity
were incubated for further 48 hrs at 37 °C to ascertain the sterility.
3.4.4.4. Sensory evaluation
Sensory characteristics of the squid masala and shrimp curry processed to different
F0 values amd mackerel procesed in brine at different retort temperatures were evaluated by
a panel of 10 trained judges on a 10-point scale (IS 6273 (II) 1971; Vijayan 1984).The
characteristics covered under the taste panel were color, flavor, texture and overall
acceptability. Attributes studied under texture were chewiness, succulence, toughness and
fibrosity. The overall impression of the product on the assessor was scored in overall
acceptability. Samples were served to the panelists after warming in a microwave oven for
3 min on a coded dish. The panelists were asked to assign a score of 1–10 as prescribed by
Vijayan (1984). A sensory score of 4.0 was taken as the margin of acceptance. The sensory
score card used in the study is given in Annexure-1.

82
3.4.5. Statistical analysis
Experiment results are expressed in mean±standard deviation. Multiple
comparisons of the significant analysis of variance were performed by Duncan’s multiple
comparison test.AP < 0.05 was considered statistically significant. All data were analyzed
with the aid of statistical package program SPSS 10.0 for Windows (SPSS, Inc., Chicago,
IL) (SPSS 2000).