3d force prediction using fingernail imaging with...
TRANSCRIPT

3D Force Prediction Using Fingernail Imaging with Automated CalibrationThomas Grieve∗
Department of MechanicalEngineering
University of Utah
Lucas Lincoln†
Department of MechanicalEngineering
University of Utah
Yu Sun‡
Department of ComputerScience and Engineering
University of South Florida
John M. Hollerbach§
School of ComputingUniversity of Utah
Stephen A. Mascaro¶
Department of MechanicalEngineering
University of Utah
ABSTRACT
This paper demonstrates a system for 3D force prediction using fin-gernail imaging, in which video images of the human fingernail areused to predict the normal and shear forces that occur when the fin-ger is in contact with a flat surface. The automated calibration usesa magnetic levitation haptic device (MLHD) whose flotor has beenmodified to apply forces to the human fingerpad.
The system accurately predicts forces with an RMS error of 0.3Nnormal force, 6% of the full range of 10N, and a shear force error of0.3N, 3% of the full range of ±2.5N. This paper also demonstratesthat varying the number of pixels used to represent the finger be-tween 100 and 500 pixels has little effect on the results, indicatingthat a real-time application could use low-resolution images with-out loss of accuracy.
1 INTRODUCTION
Fingernail imaging as a means of estimating the level of force on ahuman finger was first proposed by Mascaro and Asada in [7]. Theconcept of fingernail imaging is based on the movement of bloodin the tissue underlying the fingernail. As the fingerpad interactswith surfaces, blood pools in certain regions and flees from others.This results in a coloration change in the tissue beneath the finger-nail, which is essentially transparent. This paper presents a methodof automatically calibrating the fingernail imaging system over theuseful 3D force space. As prior imaging calibration methods relyon user input and only calculate force on one axis at a time, this newcalibration procedure results in a more robust model that is betterable to predict arbitrary combinations of normal and shear force.
In [7], a fingernail sensor designed to detect this coloration effectwas introduced. The sensors are mounted on the test subject’s fin-gernail and consist of an array of LEDs to illuminate the fingernailand photodetectors to measure the coloration effect. The colorationinformation allows calibration of a model, which leads to the pre-diction of forces. The original research found that force magnitudeand direction could be predicted over a range of shear forces up to2N with an error of 0.5N and normal force up to 3N with an errorof 1N. It was later demonstrated in [8] that the fingernail colorationresponse exhibits common patterns across all people. This justifiesthe use of this method to detect finger force. Detecting force inthis way has a wide range of potential applications. For example,computer input devices such as a keyboard or mouse could be com-pletely replaced by a finger force detection system using an attached
∗e-mail: [email protected]†e-mail:[email protected]‡e-mail:[email protected]§e-mail:[email protected]¶e-mail:[email protected]
camera. The detection method can also be used to study graspingforces in a variety of environments.
The on-nail sensor approach suffers from two major problems.First, the sensors must be custom manufactured to fit each test sub-ject. Second, and perhaps more important, the resolution of thesesensors is limited by the number of photodetectors and LEDs thatcan be imbedded into the sensors. An attempt to overcome thesedifficulties was made in [11], wherein the fingernail was imagedby a high-resolution digital camera. This provides a much largerdata set while eliminating the need for customization. Using thisnew method, the error was reduced to 0.3N over a range of normalforce up to 10N. In later experiments, force magnitude was pre-dicted in one direction at a time with an accuracy of 0.1N over therange of normal force up to 10N and shear force up to 2N [13]. Itwas demonstrated in [14] that discrete finger force directions couldbe predicted with an accuracy of 90% without any individual cal-ibration. This prediction accuracy held steady as the resolution ofthe images was decreased to 10×10 pixels. The major limitationsof finger force prediction using a digital camera are the need forconsistent lighting and the requirement that the fingernail remainin view of the camera. Future work will investigate solutions tothese problems so that the method can be used in a wide variety ofenvironments.
A major challenge for both methods of imaging is the needfor calibration. In the past, this has occurred mainly using user-supplied forces. The test subject was presented with a force sensormounted on a frame and asked to apply forces to explore the spacefor calibration. As in [9], guidance through the force space is pro-vided by a GUI that shows a target force as a circle whose radiusis proportional to the normal force, while the (x,y)-position of thecenter of the circle represents the shear forces ( fx, fy). The testsubject is asked to apply forces to the sensor so that a second circlematches the target circle. One limitation of this method is the timerequired for the test subject to become familiar with the interfaceto the extent that they can follow the target. A second drawback isthat the user becomes fatigued after a time, which places a limit onthe number of images that can be recorded in a given sitting. Third,it is difficult for a human to consistently control these three vari-ables. These problems will be amplified as it is eventually desiredto include shear torque, fingerpad contact angle with the sensor andfinger joint angles. As such, an automated calibration system isdesired which will allow the test subject to remain passive whilethe calibration occurs. This would reduce the fatigue, allowing formore time in the calibration. Additionally, the images can be col-lected more rapidly, as the speed of the controller can be set muchhigher than that achievable by a human controlling the finger. Fi-nally, the controller could be augmented to control other variablesof interest, allowing more detailed calibration to occur.
In [5], a controller designed to apply forces to the human fin-gerpad using a 6-DOF magnetic levitation haptic device (MLHD)was designed. This controller, in a modified form, provides thebasis for the automated calibration procedure detailed herein. The
113
IEEE Haptics Symposium 201025 - 26 March, Waltham, Massachusetts, USA978-1-4244-6822-5/10/$26.00 ©2010 IEEE
Authorized licensed use limited to: The University of Utah. Downloaded on May 20,2010 at 17:43:37 UTC from IEEE Xplore. Restrictions apply.

main purpose of this paper is to detail the methods and present theresults of this automated calibration. Section 2 details the exper-imental setup, while section 3 explains how the data analysis wasperformed. Section 4 compares the effectiveness of different regis-tration methods. Section 5 demonstrates the successful implemen-tation of this calibration method and the results of predicting forceusing this method.
2 CALIBRATION SETUP
To use fingernail imaging as a means of detecting fingerpad forcelevels, individual calibration is necessary. Automated calibrationcan be performed using the MLHD developed by Hollis [1]. Withthis method, the test subject is asked to relax while the MLHD iscontrolled to exert force on the subject’s fingerpad. This has thedual benefits of allowing the data collection to proceed more rapidlywhile simultaneously limiting the exertion required by the test sub-ject. In this way a much larger data set can be collected than wouldbe possible otherwise, allowing for the formation of a more detailedmodel.
During calibration, the test subject is seated in front of theMLHD. An armrest with an adjustable finger restraint is used toguide the subject’s finger to the correct location and posture. Thecamera is mounted over the MLHD flotor using an adjustable mi-crophone extender, which allows the camera to be repositioned foreach test subject. A lighting dome is placed over the camera toprovide consistent, indirect lighting between tests. The dome hasseveral white LEDs mounted such that they provide diffuse light-ing over the finger. A light shield covers the MLHD during teststo eliminate the effects of ambient light. The setup is illustrated inFigure 1.
Figure 1: Illustration of Calibration Setup
Data was collected from 16 test subjects. The subjects includeboth males and females. The subjects range in age from early 20sto late 50s. Each subject was asked to sit in the testing apparatus,as shown in Figure 2, while they were introduced to the MLHD andthe purpose of the calibration. A sample trajectory was run withoutthe light shield to allow the test subject to see what happens during atest and for the experimenter to verify that everything is performingas desired. Then the light shield was put in place and several testtrajectories were run on each subject.
The controller developed in [5] has been modified as shown inFigure 3. The MLHD is now controlled using pure force control.The input signal is calculated using a PIV force controller, as in[10]. This signal is sent to the MLHD server as a force command.This improves the step response as shown in Figure 4, as well as the
Figure 2: Calibration setup
disturbance rejection performance. The system still requires almost0.2 seconds to dampen the vibrations in the unchanging directions.However, as the intended trajectories will use ramps rather thansteps, this effect is not seen during normal operation.
Figure 3: New force controller for automated calibration
Figure 4: Force response of new controller
It is desired that the calibration routine fully explore the usefulforce space for the coloration effect. This force space includes nor-mal force up to 10N and shear force up to 5N. The test trajectoriesthat have been selected vary the method used to cover the conicalforce space in several different ways. Some use a Cartesian (x-y-z) grid overlaid on the cone, while others use cylindrical (r-θ -z)grids. These are illustrated in Figure 5. The minimum distancebetween adjacent points on the grid, ∆F, is varied between 0.125Nand 0.5N. The slope of the edge of the cone is varied between 0.25and 0.67. Some trajectories cover the entire cone while others only
114
Authorized licensed use limited to: The University of Utah. Downloaded on May 20,2010 at 17:43:37 UTC from IEEE Xplore. Restrictions apply.

cover the lower (0N ≤ fn < 4N), middle (4N ≤ fn < 7N) or upper(7N≤ fn ≤ 10N) portions. Additionally, some specialty trajectoriesonly apply z-direction forces, while others only apply shear forcein one direction (i.e., fy = 0 or fx = 0). 28 different trajectorieshave been designed for use. Each trajectory contains between 30and 800 target force levels. However, due to time constraints andfatigue, only a few of these trajectories can be applied to any giventest subject in one sitting. Trajectories are selected at random foreach test subject. Thus, several hundred (and in most cases a fewthousand) images can be collected for each test subject in a single30-minute training period.
Figure 5: Sample trajectories of the type used in calibration. Left:Cylindrical Grid. Right: Cartesian Grid.
Within a given trajectory, each force level is held for 0.4 seconds.During this time the camera records an image at a resolution of1024× 768 pixels. As part of this process, the ( fx, fy, fz) valuesrecorded by the force sensor are stored in the (R,G,B) indices ofpixel (1,1) of the image. The range of forces to be recorded is:
−5.0N≤ fx ≤ 5.0N−5.0N≤ fy ≤ 5.0N−10.0N≤ fz ≤ 0.0N
Each force direction has a possible range of 10N. A margin oferror of 1N is added to each end of the above ranges, giving a pos-sible range of 12N. Each color channel can store an integer between0 and 255. Thus, the forces are encoded using the following formu-las:
R = floor(21.25( fx +6))G = floor(21.25( fy +6))B = floor(21.25(1− fz)) (1)
So, fx = 0.0N corresponds to R = 127, while fz = −5.0N re-sults in B = 127. This has the advantage of not requiring an addi-tional file to store the force data, while maintaining required pre-cision. The error in recording the force using this encoding is atmost 1/21.25 = 0.047N, which is an order of magnitude below theminimum level of distinguishable error previously established us-ing fingernail imaging (0.3N).
3 DATA ANALYSIS
Once the images have been collected, Matlab is used to processthem. First, each image is registered to a target image. Second,the force and intensity information are extracted from each image.Finally, the least squares method is used to form a model from allof the images.
Since the finger moves during the calibration procedure, it is nec-essary to register each image to a target image. The target chosen
for each data set is the first image taken from that test subject. Theprocess of registration is discussed in section 4.
The recorded force information is decoded from each image us-ing the inverse of Equations 1. These values are stored as the forcevector f:
f =
fxfyfz
=
R21.25 −6
G21.25 −61− B
21.25
(2)
As the number of pixels is extremely large and the changes in in-tensity correlate with position, the registered images are subdividedinto cells of a specified size. Additionally, it has been found thatthe green channel is most sensitive to changes in force [11], so theother channels are discarded and only the green-channel intensityvalues of all pixels in each cell are averaged. The results are storedin the pixel vector p:
p =
p1p2...
pm
(3)
The force is assumed to be a linear combination of the cell inten-sities:
fx = a0 +a1 p1 +a2 p2 + · · ·+am pm
fy = b0 +b1 p1 +b2 p2 + · · ·+bm pm
fz = c0 + c1 p1 + c2 p2 + · · ·+ cm pm
This results in the following matrix equation:
fxfyfz
=
a0 a1 a2 · · · amb0 b1 b2 · · · bmc0 c1 c2 · · · cm
1p1p2...
pm
f = Ap
A =
a0 a1 a2 · · · amb0 b1 b2 · · · bmc0 c1 c2 · · · cm
The transpose is taken and the equations for each image are
stacked, to form the final least squares equation. This is solvedfor the coefficient matrix A. These values can be used to test themodel.
3.1 Model VerificationThe first test for the model, training, is to determine how well thedata fits the model. This is done by applying the model to each ofthe training images in turn and calculating the predicted force. Thisis then compared to the actual force measured when the image wasrecorded. The total RMS error for the data set is calculated. Thisis the equivalent of finding the error with which a straight line fits aset of (x,y) data.
The second test for the model, validation, is to determine howwell the model fits an image that was not used to form the model.To accomplish this, an image is removed from the data set. A modelis formed using the remaining data. This model is then applied tothe removed image and a predicted force is calculated. This is com-pared to the actual force measured when the image was recorded.Again, the total RMS error for the data set is calculated.
The results of these two tests will be discussed in detail in Sec-tion 5. First, an investigation into different registration methods ispresented.
115
Authorized licensed use limited to: The University of Utah. Downloaded on May 20,2010 at 17:43:37 UTC from IEEE Xplore. Restrictions apply.
4 REGISTRATION
Fingernail locations vary in the image frame as the MLHD appliesshear and normal forces to the finger. As a particular fingernailis imaged, it is necessary to register all points on each image to acommon reference. Successful registration directly influences theaccuracy of the force prediction, as well as its repeatability.
The fingernail is a relatively featureless item, making robust, ac-curate registration somewhat difficult. Adding to this difficulty isthe varying intensities which result from the testing itself, as im-age registration techniques rely on intensity measurements acrossimage sets. In other words, the variations of interest (pixel inten-sity changes) must be preserved while correcting for movement anddistortions [2].
Three registration techniques are explored: A Harris featurepoint detection algorithm, a Canny edge detection algorithm andan affine rigid body transformation method. The former two casesare used in conjunction with random sample consensus (RANSAC)model fitting [4].
4.1 Methods
4.1.1 Harris
The Harris feature detection system [6] is used to detect cornerpoints by first smoothing the image using a Gaussian filter, com-puting the gradients isotropically and finding local gradient max-ima. An example image is shown in Figure 6(a), which shows thefinger imaged in the MLHD test setup during a data collection withdetected feature points indicated by plus signs.
The Harris algorithm is used to find feature points in the firstimage and then in each successive image. As each image is pro-cessed, the neighborhoods of and distances between feature pointson the first image and the current image are compared to determinematching feature points (Figure 6(b)). Once this correlation hastaken place, RANSAC is performed to determine the transforma-tion model. The inliers found using RANSAC are shown in Figure6(c). The current image is then transformed so that it aligns withthe first image.
Figure 6: Illustration of the Harris method. (a) The reference imageshowing feature points as small + signs. (b) Harris feature points withcorrelated points connected by lines. (c) RANSAC inliers connectedby lines. (d) Image for qualitative inspection after transformation.
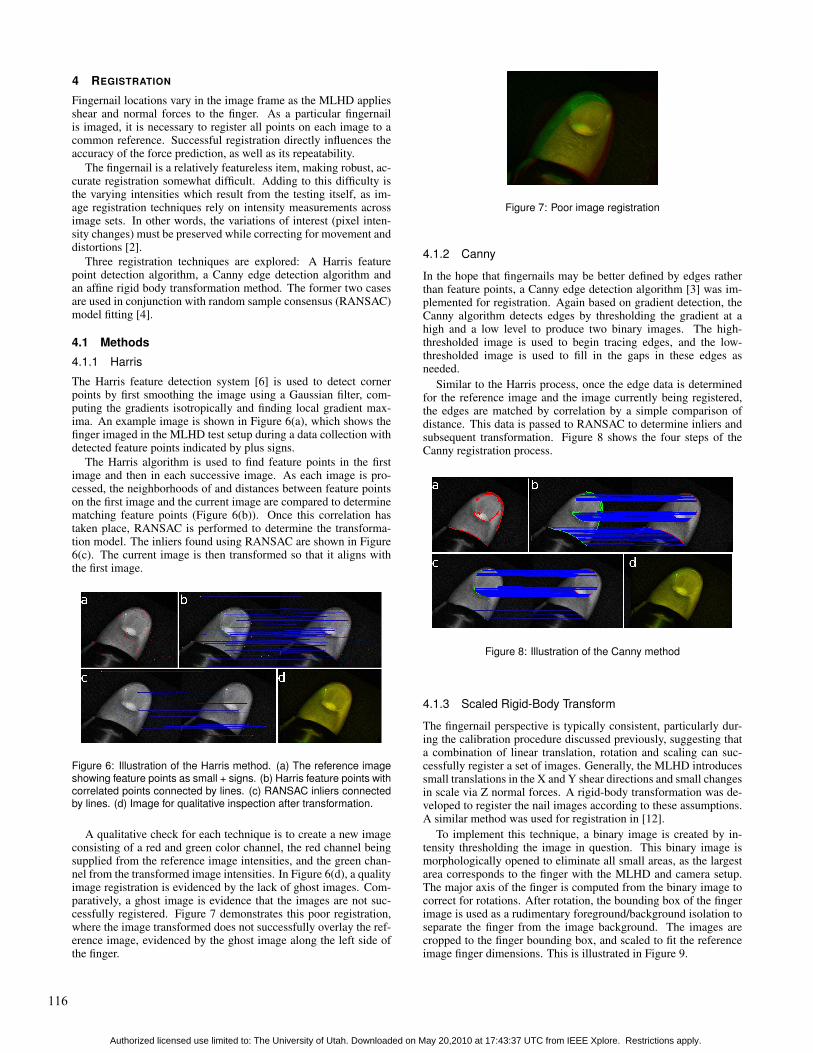
A qualitative check for each technique is to create a new imageconsisting of a red and green color channel, the red channel beingsupplied from the reference image intensities, and the green chan-nel from the transformed image intensities. In Figure 6(d), a qualityimage registration is evidenced by the lack of ghost images. Com-paratively, a ghost image is evidence that the images are not suc-cessfully registered. Figure 7 demonstrates this poor registration,where the image transformed does not successfully overlay the ref-erence image, evidenced by the ghost image along the left side ofthe finger.
Figure 7: Poor image registration
4.1.2 Canny
In the hope that fingernails may be better defined by edges ratherthan feature points, a Canny edge detection algorithm [3] was im-plemented for registration. Again based on gradient detection, theCanny algorithm detects edges by thresholding the gradient at ahigh and a low level to produce two binary images. The high-thresholded image is used to begin tracing edges, and the low-thresholded image is used to fill in the gaps in these edges asneeded.
Similar to the Harris process, once the edge data is determinedfor the reference image and the image currently being registered,the edges are matched by correlation by a simple comparison ofdistance. This data is passed to RANSAC to determine inliers andsubsequent transformation. Figure 8 shows the four steps of theCanny registration process.
Figure 8: Illustration of the Canny method
4.1.3 Scaled Rigid-Body Transform
The fingernail perspective is typically consistent, particularly dur-ing the calibration procedure discussed previously, suggesting thata combination of linear translation, rotation and scaling can suc-cessfully register a set of images. Generally, the MLHD introducessmall translations in the X and Y shear directions and small changesin scale via Z normal forces. A rigid-body transformation was de-veloped to register the nail images according to these assumptions.A similar method was used for registration in [12].
To implement this technique, a binary image is created by in-tensity thresholding the image in question. This binary image ismorphologically opened to eliminate all small areas, as the largestarea corresponds to the finger with the MLHD and camera setup.The major axis of the finger is computed from the binary image tocorrect for rotations. After rotation, the bounding box of the fingerimage is used as a rudimentary foreground/background isolation toseparate the finger from the image background. The images arecropped to the finger bounding box, and scaled to fit the referenceimage finger dimensions. This is illustrated in Figure 9.
116
Authorized licensed use limited to: The University of Utah. Downloaded on May 20,2010 at 17:43:37 UTC from IEEE Xplore. Restrictions apply.

Figure 9: Illustration of the Rigid Body Transformation method
4.2 Evaluation of Registration MethodsFor our immediate work, it is required that the registration be ac-curate when registering images taken in the MLHD/Camera setupand this accuracy is the primary focus of evaluation. Additionally,reducing computation time is desirable now (as a large foundationof data is being gathered and analyzed) and in the future (for realtime implementation). A robust method is desirable for future real-environment application (with varying lighting conditions and fin-ger orientation). With these considerations in mind, the registrationtechniques were evaluated for use with this project.
To determine the accuracy of the registration, data sets were reg-istered with each method. A model was built to the image data andforce readings and the validation results were compared. More de-tails on the analysis procedure, including validation, are discussedin Section 3 of this paper.
Given the same set of images, force readings and optimized pa-rameters for model fitting and validation, the RMS error differencein the least-squares fit can be attributed to the different registrationmethods. Because the actual fit for each data set varies dependingon other factors besides the image registration, absolute accuracymeasurements are not used, instead favoring a relative comparisonof each registration’s results to the average from the same data set.The data sets differ in subject, level of lighting, quality of focus,number of images, and trajectory. The RMS error comparison re-sults are shown in Figure 10.
Figure 10: RMS Error Comparison of Registration Methods
The average time elapsed per image registered for each methodwas compared in the same manner as the accuracy. This will beimportant for developing real-time applications of the imaging pro-cess. The results are plotted in Figure 11.
These results show that, on the data gathered using theMLHD/Camera setup, the rigid body transform is both fastest andmost successful. It provided consistently lower RMS errors whilealso being the least computationally extensive. Additionally, therigid-body transformation has fewer input parameters. Thus it re-quires fewer adjustments from one data set to the next, as a single
Figure 11: Running Time Comparison of Registration Methods
configuration was successful over nearly all data sets. Harris andCanny both required parameter customization for each data set asimage intensities and focus changed.
Qualitatively, however, Canny is often successful in findingedges. In a situation where perspective or background are chang-ing, a well-configured Canny algorithm should be investigated foruse with registration. The time required may be prohibitive for areal-time application, however.
5 RESULTS
5.1 TrainingA plot of one test subject’s training results is shown in Figure 12.In all, 1505 images were collected from this subject. The forcesapplied cover the force space cone in a combination of Cartesianand cylindrical grids. The RMS error in the x- and y- directions is0.3N, 6% of the full range. The z-direction force shows an RMSerror of 0.3N, 3% of the full range.
Figure 12: Subject 5’s Training Results
A histogram of the training RMS error for all test subjects isshown in Figure 13. These plots have been normalized with thefull range of the force, so that a distance of 0.1 on the shear plotsrepresents 0.5N, while the same distance of the z-direction plot rep-resents 1.0N. The errors can be seen to fall between 0-15% of thefull range of forces for all subjects in all three directions.
5.2 ValidationThe same test subject’s validation results are shown in Figure 14.The RMS error in the shear directions is 0.3N, 6% of the full range,while the normal force has an error of 0.3N, 3% of the full range.
Figure 15 shows the RMS error histogram results for validation.Again, these plots are normalized to the full range of forces. Thevalidation error can be seen to fall between 0-15% of the full rangeof forces for all three directions.
5.3 Cell Size EffectsFinally, an investigation into the effect of cell size is performed.By varying the number of cells used to represent an image of the
117
Authorized licensed use limited to: The University of Utah. Downloaded on May 20,2010 at 17:43:37 UTC from IEEE Xplore. Restrictions apply.

Figure 13: RMS Error of Group Training Results
Figure 14: Subject 5’s Validation Results
finger, the effect of image resolution on the accuracy of the resultscan be investigated. If a reduced number of cells retains the desiredaccuracy, it would indicate that the resolution of images in real-time applications can be reduced without loss of accuracy. It shouldbe noted that if the number of cells is greater than the number ofimages, the least squares method will find an exact solution for thecoefficient matrix. Thus, the training results would show 0% error.This exact solution is not useful for predicting force in additionalimages, as it is the equivalent of finding the exact polynomial thatwill fit a set of data points when what is desired is a linear best-fitline. The model would be trained to the noise in the data. For thisreason, the model is restricted to a number of cells less than thenumber of images. The method was tested using 500, 250 and 100cells for each image.
A sample of the training results is shown in Figure 16. A largernumber of cells reduces the training error. This is to be expected,as it is the equivalent of using a higher-order polynomial to approx-imate a set of data.
The validation results for the same four test subjects is given inFigure 17. This shows an interesting effect. It seems that the erroris slightly lower, in general, at 250 cells than it is at either 100 or500 cells. The difference is not large, however, and the predictionerror values are acceptable at every number of cells tested.
The error for all test subjects is shown in Figures 18 and 19.From these plots, it is easy to see that there is little significant dif-ference between using 100 and 500 cells. It should be noted thatreducing the number of cells from 500 to 100 results in a signifi-cant savings in computation time. For any real-time application, itwill be desirable to use as few cells as possible while maintainingnecessary accuracy. Thus, it is probably sufficient to use 100 cellsfor a real-time application.
This matches what was observed in previous work. It wasdemonstrated in [12] that reducing the fingernail image to 10×10pixels did not significantly affect the accuracy of the results. Thus,in spite of increasing the complexity of the model to include arbi-trary 3-dimensional force, the ability to reduce the resolution andstill retain accuracy is not affected.
Another important result of this analysis is that a model trained
Figure 15: RMS Error of Group Validation Results
Figure 16: Effect of Cell Size on RMS Error in Training Results ofSubjects 14-17
on a set of 100-cell images would not require as large a calibra-tion data set as a model trained on a set of 500-cell images. Sincethere would be fewer coefficients in the low-resolution model, thecalibration procedure could be performed more quickly. The cur-rent method requires 30 minutes of calibration time followed by ap-proximately 45 minutes of data analysis. It is possible that using acalibration system with 100-cell images, the calibration time couldbe shortened to 10 minutes and the data analysis to 25 minutes.
5.4 Comparison to Previous Work
The validation results are compared with previous efforts in Figure20. The first set of results, labeled Sensor, come from the origi-nal fingernail sensor developed in [7]. These include normal forcesup to 3N and shear forces up to 2N. The second set, labeled Di-rectional, comes from [11], the original fingernail imaging system.The second set of results include normal forces up to 10N and upto 2N of shear force. It should be noted that in this prior work,only one direction of force was estimated at any one time. The cur-rent work is labeled Automated. It can be seen that the automatedcalibration system matches or improves on the error in each forcedirection. Thus, despite increasing the complexity of the model toinclude arbitrary 3-dimensional force, the prediction accuracy im-proves. Figure 21 relates the same information as a percentage ofthe force space covered in that work.
6 CONCLUSION
The calibration procedure detailed herein has been shown to pro-vide a level of accuracy matching that previously achieved. Since
118
Authorized licensed use limited to: The University of Utah. Downloaded on May 20,2010 at 17:43:37 UTC from IEEE Xplore. Restrictions apply.

Figure 17: Effect of Cell Size on RMS Error in Validation Results ofSubjects 14-17
Figure 18: Effect of Cell size on RMS Error in Training Results of AllSubjects
the calibration now calculates arbitrary force rather than only calcu-lating force oriented along one axis at a time, this is an improvementon previous experiments. The shear force represented by an imageis estimated to within 0.3N, or 6% of the full range of ±2.5N. Thenormal force is estimated to within 0.3N, or 3% of the full range of10N. Three different registration methods were compared and therigid-body transformation method was found to provide fast, accu-rate results. Adjusting the number of cells used to represent thefinger between 100 and 500 has been shown to have little effect onthe accuracy of the measurements. This means that a real-time ap-plication could use a relatively low-resolution image of the finger. Italso indicates that a relatively small data set is all that is required toperform accurate calibration. This could significantly reduce cal-ibration and analysis time and allow a test subject to move morequickly from beginning calibration to using a demo program basedon the calibration. These results could be applied to a real-timesystem, for example, to control the cursor on a computer screenwithout the need for an input device such as a mouse.
In future work, the authors desire to investigate the effects ofvarying contact angles, finger joint angles and shear torque on thecoloration effect. The MLHD will need to be augmented to do this,as the range of motion of the flotor is insufficient. The authorsplan to add a 3-DOF mechanism to the MLHD to allow for thedesired range of motion. This would allow for simultaneous 3-DOFforce, 1-DOF torque and 2-DOF contact angle control to determinewhether these additional variables affect the accuracy of calibration.
Figure 19: Effect of Cell size on RMS Error in Validation Results ofAll Subjects
Figure 20: Comparison of Absolute Validation Error with Prior Work.Sensor data comes from [7]. Directional data comes from [11]. Cur-rent work is listed as Automated.
ACKNOWLEDGEMENTS
This work was supported by NIH Grant 1R21EB004600-01A2 andIGERT Grant DGE-0654414.
REFERENCES
[1] P. Berkelman and R. Hollis. Lorentz magnetic levitation for hapticinteraction: device design, function, and integration with simulatedenvironments. Intl J Robotics Research, 9:644–667, 2000.
[2] A. Brown. A survey of image registration techniques. ACM Comput-ing Surveys, 24:226–276, 1992.
[3] J. Canny. A computational approach to edge detection. IEEE Transac-tions on Pattern Analysis and Machine Intelligence, PAMI-8(6):679–698, 1986.
[4] M. A. Fischler and R. Bolles. Random sample consensus: a paradigmfor model fitting with applications to image analysis and automatedcartography. Communications of the ACM, 24(6):381–395, jun 1981.
[5] T. Grieve, Y. Sun, J. Hollerbach, and S. Mascaro. 3-d force control onthe human fingerpad using a magnetic levitation device for fingernailimaging calibration. In World Haptics, pages 411–416, 2009.
[6] C. Harris and M. Stephens. A combined corner and edge detector. InProceedings Fourth Alvey Vision Conference, pages 147–151, 1988.
[7] S. Mascaro and H. Asada. Photoplethysmograph fingernail sensorsfor measuring finger forces without haptic obstruction. IEEE Trans-actions on Robotics and Automation, 17(5):698–708, 2001.
[8] S. Mascaro and H. Asada. The common patterns of blood perfusionin the fingernail bed subject to fingertip touch force and finger pos-
119
Authorized licensed use limited to: The University of Utah. Downloaded on May 20,2010 at 17:43:37 UTC from IEEE Xplore. Restrictions apply.

Figure 21: Comparison of Relative Validation Error with Prior Work.Sensor data comes from [7]. Directional data comes from [11]. Cur-rent work is listed as Automated.
ture. Haptics-e: The Electronic Journal of Haptics Research, 4(3):1–6, 2006.
[9] S. Mascaro and H. H. Asada. Measurement of finger posture andthree-axis fingertip touch force using fingernail sensors. IEEE Trans.on Robotics and Automation, 20:26–35, 2004.
[10] Sciavicco and Siciliano. Modeling and Control of Robot Manipula-tors. London; New York: Springer, 2000.
[11] Y. Sun, J. M. Hollerbach, and S. A. Mascaro. Measuring fingertipforces by imaging the fingernail. In Proc. 14th Symposium on HapticInterfaces for Virtual Environment and Teleoperator Systems, pages125–131, 2006.
[12] Y. Sun, J. M. Hollerbach, and S. A. Mascaro. Eigennail for fingerforce direction recognition. In Proc. IEEE Intl. Conf. Robotics andAutomation, pages 3251–3256, 2007.
[13] Y. Sun, J. M. Hollerbach, and S. A. Mascaro. Predicting fingertipforces by imaging coloration changes in the fingernail and surroundingskin. IEEE Trans. on Biomedical Engineering, 55(10):2363–2371,2008.
[14] Y. Sun, J. M. Hollerbach, and S. A. Mascaro. Finger force directionestimation with computer vision. IEEE Transactions on Robotics, InPress.
120
Authorized licensed use limited to: The University of Utah. Downloaded on May 20,2010 at 17:43:37 UTC from IEEE Xplore. Restrictions apply.