41. triassic (upper carnian-lower rhaetian
TRANSCRIPT

von Rad, U., Haq, B. U , et al., 1992Proceedings of the Ocean Drilling Program, Scientific Results, Vol. 122
41. TRIASSIC (UPPER CARNIAN-LOWER RHAETIAN) MAGNETOSTRATIGRAPHY OF LEG 122SEDIMENTS, WOMBAT PLATEAU, NORTHWEST AUSTRALIA1
Bruno Galbrun2
ABSTRACT
During drilling at Sites 759, 760, and 761 of Leg 122 (Exmouth Plateau, northwest Australia), a thick section ofUpper Triassic sediments was recovered. Paleomagnetic analyses were made on 398 samples from Holes 759B,760A, 760B, and 761C. Progressive thermal demagnetization, alternating field demagnetization, or mixed treatmentremoved an initial unstable component and isolated a characteristic remanent magnetization which is of normal orreversed polarity. The magnetostratigraphic results allow us to propose a magnetic polarity sequence which extendsfrom the upper Carnian to lower Rhaetian. This sequence reveals many more reversals than previously suggestedfrom paleomagnetic studies. The magnetostratigraphic data also allow us to suggest correlations between Sites 759and 760.
INTRODUCTION
One of the major objectives of Leg 122 was to refine theMesozoic geological time scale. The unexpected recovery ofan Upper Triassic sequence during Leg 122 on the ExmouthPlateau (northwest Australia) offered us the opportunity tospecify the magnetic polarity sequence of this period.
A 900-m-thick sequence of Triassic (upper Carnian throughlower Rhaetian) sediments was cored at four sites (Sites 759,760, 761, and 764) on the Wombat Plateau, a small subplateauof the northern Exmouth Plateau (Fig. 1). The compositesection recovered at these four sites comprises (1) a paralic tomarginal-marine, middle Carnian-Norian section of an earlyrift environment, and (2) an almost complete marine Rhaetiancarbonate platform sequence. The oldest sediments recoveredare of middle Carnian age (Site 759), and represent the oldestmarine sediments recovered by scientific ocean drilling.Spores and pollens proved to be the best source of ageinformation for the Triassic.
The objective of this study was to obtain a detailedmagnetostratigraphy for each site. We report here the resultsobtained from Holes 759B, 760A, 760B, and 761C. These dataallow us to present a magnetic polarity sequence from upperCarnian through lowermost Rhaetian, and to suggest correla-tions between Sites 759 and 760.
SAMPLING AND MEASUREMENTSAll of the archive sections of cores from Holes 759B, 760A,
760B, and 761C were measured on board using the pass-through cryogenic magnetometer. The natural remanent mag-netization (NRM) intensities range through a broad intervalfrom sedimentary units too weakly magnetized to be mea-sured, to very highly magnetized sections of Holes 760A and760B. Given these problems of NRM intensity, severe coredisturbance of some soft sediments, and magnetic overprint-ing (the 9-mT alternating field demagnetization provided bythe pass-through cryogenic magnetometer was often insuffi-
1 von Rad, U., Haq, B. U., et al., 1992. Proc. ODP, Sci. Results, 122:College Station, TX (Ocean Drilling Program).
2 Université Paris VI, Département de Géologie Sédimentaire, UA-CNRS1315, 4 place Jussieu, 75252 Paris cedex 05, France.
cient to remove all of the secondary overprint), the whole-core measurements generally proved of little practical use.Thus, extended sampling was performed for shore-basedanalysis.
Two or three oriented samples were collected from each1.5-m section of recovered sedimentary rocks. In soft sedi-ments, such as claystones, oriented specimens (7 cm3) werecut from the working half of the split core, placed in plasticsample boxes, and capped. In indurated sediments, such aslimestones or siltstones, oriented minicores were drilled per-pendicular to the axis of the split core with a water-lubricateddrill press. All samples were scored with a vertical orientationmark.
Measurements of the material were made on a 3-axis RS-01(LETI/CEA) cryogenic magnetometer (Département de Géol-ogie Sédimentaire, Université Paris VI). The backgroundnoise level of this instrument is such that it could measuresamples as weakly magnetized as 2 × 10~5 A/m with goodprecision. For samples with an intensity of magnetization lessthan 10~5 A/m, the imprecision is too great and such measure-ments were rejected as unreliable indicators of the polarity.
Thermal demagnetization, alternating field (AF) demagne-tization, and mixed treatment (moderate heating and subse-quent AF demagnetization), which is very effective for oldsedimentary rocks (Daly, 1981; Galbrun et al., 1988), wereused to isolate stable remanence. AF demagnetization wasperformed on a single-axis Schonstedt AF demagnetizer. Themost weakly magnetized samples could not be demagnetizedat high fields because of acquisition of anhysteretic remanentmagnetization (ARM) components caused by the demagne-tizer. Thermal demagnetization was done in a furnace with aseparate cooling chamber. Friable samples were enclosed inaluminium foil in order to avoid splitting during heating. Thedirection of characteristic magnetization was computed oneach sample by an analysis of remanent magnetization direc-tions during demagnetization treatment and by applying aleast-squares line fit to the region of stability after the remov-ing of unstable overprinting (Kirschvink, 1980). For samplesthat could not be demagnetized at high steps (given NRMintensity weakness, magnetic alteration during thermal de-magnetization, or ARM effect during AF demagnetization),the characteristic direction was defined at the last step mea-sured with good precision during the demagnetization.
685

B. GALBRUN
15
17"
19
21
Australia
T = Transform Margin
109c 111' 113' 115' 117' 119
Figure 1. Bathymetric map of Exmouth Plateau with location of Leg 122 sites. Bathymetry in meters.
Since borehole cores were not oriented azimuthally, onlyinclination values were used for polarity interpretation. In theSouthern Hemisphere, negative inclinations result from anormal polarity, positive inclinations from a reversed polarity.
MAGNETIC PROPERTIES AND POLARITYINTERPRETATION
Site 759Site 759 is located on the southeastern flank of Wombat
Plateau (16°57'S, 115°33'E). The Upper Triassic stratigraphicsuccession from Hole 759B consists of three units. The oldest,Unit V (205.0-308.0 mbsf), consists of a sequence of lami-nated silty claystones, bioturbated mudstones, siltstones, andsandstones (Shipboard Scientific Party, 1990a). This unit is ofCarnian age. Unit IV (135.9-205.0 mbsf) consists of interbed-ded, neritic carbonates and dark gray, silty claystones. UnitIII consists of alternating neritic carbonates and paralic clay-stones of Norian age.
A total of 145 samples were taken from Hole 759B. Theclaystones and silty claystones of Unit V have an NRM intensityranging from 10"4 to 2.67 × 10~3 A/m. Units IV and III, whichcomprise some neritic carbonates, are less magnetized and somesamples have an NRM intensity weaker than 10~4 A/m.
Seven pilot samples were progressively AF demagnetizedin peak fields of 5, 10, 15, 20, 25, 30, 40, and 50 mT. Thistreatment was effective in removing a secondary soft compo-
nent in 15-20 mT peak fields and in defining a vector at higherfields that demagnetized to give a fairly linear segment towardthe origin of a vector diagram (Fig. 2A). Thirty-four sampleswere thermally demagnetized up to 450°C. This technique wasreasonably effective in removing secondary magnetization by200°-240°C heating and isolating a stable component (Fig. 2B).But most of the samples become viscous after heating at 300°Cand some magnetic alterations occurred. This phenomenon ofmagnetic alteration during high temperature heating is verycommon in sedimentary rocks (Lowrie and Heller, 1982). Onthe basis of the pilot studies all the remaining samples weredemagnetized by a mixed treatment. Fifty-three soft sedimentsamples in plastic boxes were heated at 100°C (above 100°Cthe plastic boxes melt), and then AF demagnetized to a peakfield value of 35 or 40 mT. Fifty-one minicores were heated at150° and/or 210°C (these applications of heat were effective inremoving most of the secondary component), and then demag-netized by AF to a peak field value of 35 or 40 mT. Thesemixed treatments were also effective in isolating a stablecomponent (Figs. 2C and 2D). This stable component is ofnegative or positive inclination and thus is most probably aprimary component.
The direction of the characteristic remanent magnetization(ChRM) of each sample was computed by applying a threedimensional least-squares line fit technique to vectors in theregion of linear decay toward the origin of the vector plot. Theset of vectors used for this analysis varied from sample to sample
686

TRIASSIC MAGNETOSTRATIGRAPHY
N/N N/N122-759B-32R-1, 47cm
50 mT4 0 mT
UP/EAST
mT NRM =6.5I x \0 A/m
N/N
JOO'C NRM = 4.44 x 10 A/mO
/ 122-759B-21R-2, 43cm
B
NRM = 9.40 × IO~4A/m
200"— .
ISO*
IOO C
300*
, 340-
122-769B-30R-1, 109cm.
-UP/EAST
N/NNRM = I.56 x 10 Am
JO mT20 mT
25 mT32 mT
39 mT
122-7δ9B-21R-1, 34cm
UP/EAST UP/EAST
Figure 2. Representative demagnetization diagrams of Hole 759B samples. A. AF demagnetization. B. Thermal demagnetization. C, D. Mixed cleaning.Solid circles denote projection in the vertical (horizontal) plane. The initial declination is arbitrary because orientation control is lacking.
depending on the treatment used (AF, thermal, or mixed). Somesamples do not reach a linear decay to the origin of the vectorplot. They either had too weak an NRM intensity to be demag-netized at a field intensity or temperature sufficient to remove allthe secondary component, or they acquired an ARM componentduring AF demagnetization. Only those samples that weresufficiently demagnetized to reveal their true polarity wereconsidered. Of these, the ChRM direction was defined as the lastdirection measured with good precision.
The ChRM directions plotted against depth allow us topropose a magnetic polarity sequence for Hole 759B (Fig. 3).This sequence is dominated by normal polarity except in itsuppermost part, which seems to be of reversed polarity (topsof Cores 122-759B-6R, -7R, and -8R), but the polarity cannotbe positively determined because the recovery at the top ofHole 759B was very poor (2% to 30%). From Cores 122-759B-11R through -25R, the recovery is also poor (up to 50% only),and the polarity is normal except for short reversed-polarityzones defined by single samples. The lower part of the holewas well recovered (Cores 122-759B-26R through -39R) andthe polarity sequence is well defined. It is of normal polaritywith three short reversed magnetozones and four others thatare defined by single samples.
Thus the upper Carnian-lower Norian of Hole 759Byielded a good magnetostratigraphic record.
Site 760
Site 760 is located 5 km north of Site 759 at the top ofWombat Plateau (16°55'S, 115°34'E). We drilled 422 m of
Triassic rocks (upper Carnian to Norian). The sedimentsrecovered from Holes 760A and 760B consist mainly of siltyclay stones, clayey siltstones, and silty sandstones, except inUnit VI (284.9-464.05 mbsf) in which some fossiliferouslimestones are interbedded (Shipboard Scientific Party,1990b).
We studied 211 samples from Holes 760A and 760B. TheNRM intensities range from 4.70 × 10"5 to 7.18 × 10"3 A/m,but most of the samples have intensities ranging from 10~4 to10-3 A/m.
A pilot set of 10 samples was measured on board with thespinner magnetometer. An initial soft component of the NRMwas removed at 5 mT. Above this field a stable component ofnormal or reversed polarity was isolated (Shipboard ScientificParty, 1990b). Eight samples were treated thermally in 50°Csteps up to 400°C. An initial unstable component was removedby 250°C (Fig. 4A). The characteristic magnetization is clearlydefined above this temperature. But thermal demagnetizationwas complicated by creation of a new magnetic mineral duringheating: the samples become very viscous above 350°C. Thiseffect, very common in sedimentary rocks, is due to thedestruction of clay minerals.
Given these pilot studies all of the remaining samples wereanalyzed by mixed demagnetization (thermal and AF). Fifty-four soft sediments in plastic boxes were heated at 100°C andAF demagnetized. One-hundred thirty-nine indurated mini-cores were thermally demagnetized at various temperatures(150° and 210°C, or 250°C) and subjected to subsequent AFdemagnetization. All these mixed treatments were effective in
687

B. GALBRUN
QN R M I n t e n s i t y I n c l i n a t i o n(A / ml "Is
10-5 10-2 -90 *90
1-50.00 - =
I
-70.00 - =
-80.00 - =-EE
-90.00 - =
100.00 - =
110.00 - |
120.00
130.00 - =
140.00 - §
mn
150.00 - =E
160.00 - i=E
170.00 - =
180.00 - =E1
190.00 - §|E
200.00 - =
1210.00 - =
1220.00 - §
1230.00 - =
240.00 - =
250.00 - =
260.00 - =
270.00 - |
1280.00 - =
1290.00 - =
I300.00 -ë
—
• • • ü
—
-
—
• • • • • i
• • • •
• • •
• • •
6
7
8
9
101
11
12
13
M
15
16
17•
18
19
20
21
22
23
24
25
262728293031323334353637
38
39
ne,
ysto
2 2
, pac
ksr s
ilty
cto
ne
8-a** I•sB 5-
Uni
i•a
inst
cned
dcd
'la
te g
iin
terb
iy ca
rboi
idst
one,
u So T
ands
ll
Uni
oal,
!;
as i
i
;>• °
Init
ith s
orca
rbon
siI sI I• s . 1fc i
•Q i>G e
coc
sto
£ J
3 "8O w
it V
ty c
lays
lin
dsto
ne
e = aö _ u
Iri1 H-t3Si>ö
aa
c
CO
—
o
d
00
03
ü
Figure 3. Magnetostratigraphic results from Hole 759B, showing depth, recovery (black), cores, lithological units, age,NRM intensity, inclination, and polarity interpretation (black = normal polarity, white = reversed polarity, and hatchedareas = no polarity information owing to poor recovery).
688

TRIASSIC MAGNETOSTRATIGRAPHY
N/N
UP/EAST
122-760A-37X-3, 28cm
NRM = l,2
N/N 122-760A-25X-1, 19cmUP/EAST
NRM =4.9 x ICT4A/m
N/N
NRM = 3.6
/ 122-760A-28X-1, 113cm' UP/EAST
N/N
122-760B-19R-2, 12cm
UP/EAST
122-760B-20X-1, 71cm N/N
NRM =6.32 xlO~4A/m
•UP/EAST
Figure 4. Representative demagnetization diagrams of samples fromHoles 760A and 760B. A. Thermal demagnetization. B. Mixed treat-ment (100°C and AF demagnetization) on soft samples in plasticboxes. C. Mixed treatment (150°C, 210°C, or 250°C, and AF demag-netization) on indurated minicores.
removing the secondary component and in isolating the pri-mary magnetization (Figs. 4B and 4C). The ChRM directionswere computed using the same technique as for Site 759.
The characteristic magnetization directions are presentedin Figures 5 and 6 for Holes 760A and 760B, respectively.They define good magnetic polarity sequences, although therecovery was sometimes poor.
Site 761Site 761 is located on the central part of Wombat Plateau
(16°44'S, 115°32'E). We penetrated 162.9 m of Triassic sedi-ments in Hole 761C (Shipboard Scientific Party, 1990c). Theupper part of this sedimentary sequence (Unit IV, 259.5-338.3mbsf) consists of 78.8 m of white shallow-water limestones ofRhaetian age. Subunit Va (338.3-399.3 mbsf) is a 61.0-m-thicksequence of very dark gray to black marine limestones withcalcareous clay stones. Below these are 23.1 m of dark calcar-eous claystones alternating with crinoidal limestones (SubunitVb, 399.3-422.4 mbsf). Only 2.6 m of sediments (Core 122-761C-33R) were recovered from the black Norian siltstonesand claystones of Unit VI (422.4-436.7 mbsf).
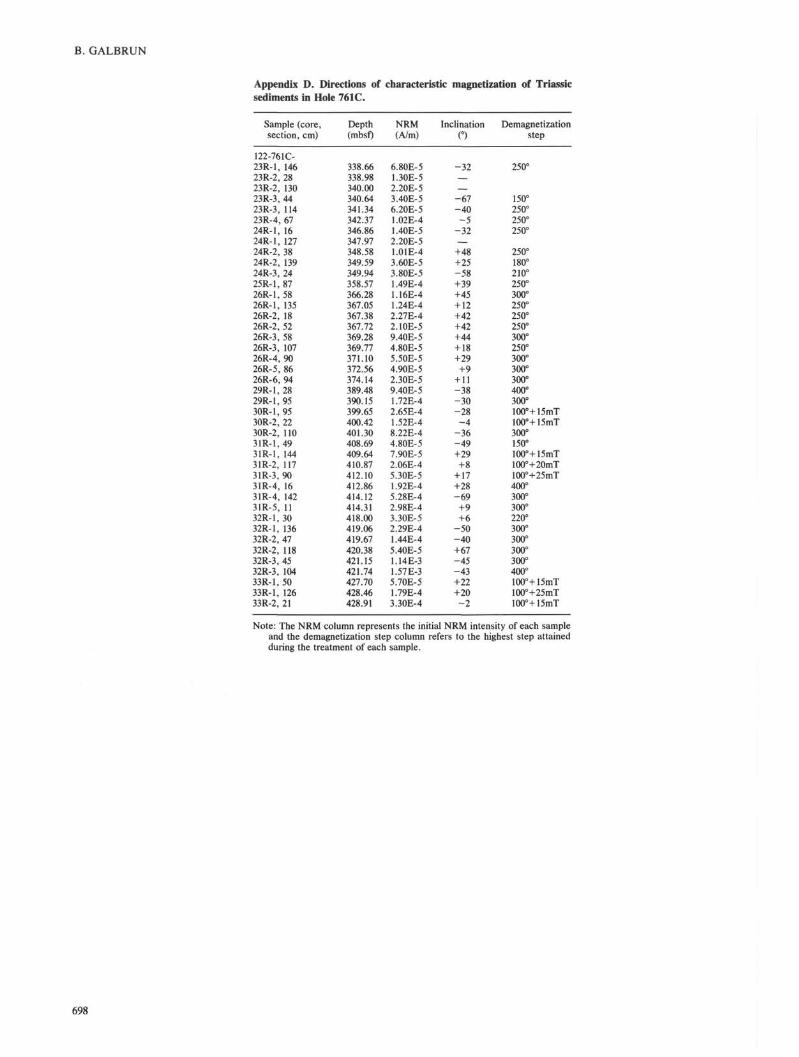
Unit IV was poorly recovered (less than 8%) and thus notsampled. Forty-two samples were studied from Cores 122-761C-23R through -33R (Units V and VI). The NRM intensi-ties of siltstones and claystones of Unit VI and calcareousclaystones of Subunit Vb range from 3.3 × 10"5 to 1.6 × 10~3
A/m. The sediments of Subunit Va, on which the relativeproportion of carbonates to terrigenous sediments is moreimportant, have weaker NRM intensities, ranging from 1.3 ×10~5to 1.7 × lO"4 A/m.
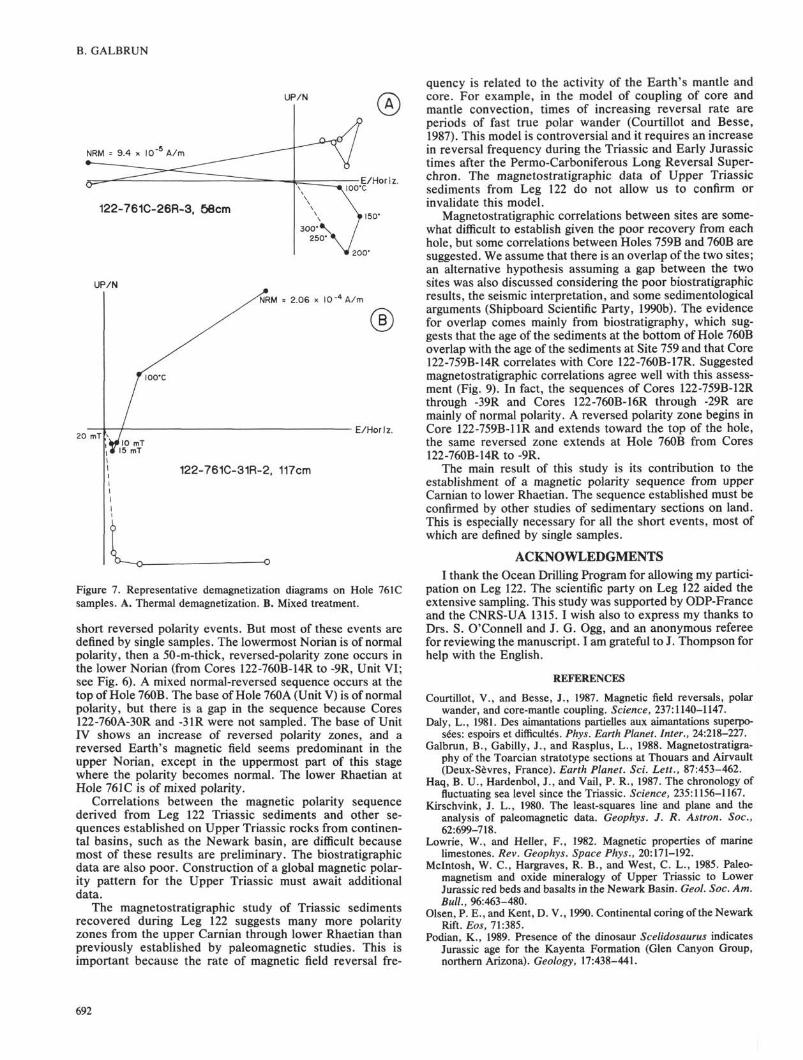
Thirty-four indurated minicores were subjected to progres-sive thermal demagnetization at 50°C increments from 100° to400°C. A first soft component is removed by 200°C heating(Fig. 7A). During further thermal cleaning the magnetizationvector decays univectorially toward the origin of the projec-tion; thus, a stable component of negative or positive inclina-tion is easily determined. However, some erratic changes indirection and NRM intensity occur above 35O°C in mostsamples. This change is attributed to the destruction of clayminerals and formation of a new magnetic mineral. Thus onlya few samples were heated above 300°C. Eight soft samples inplastic boxes were heated at 100°C and AF-demagnetized topeak fields of 10,15, 20, and 25 mT. This mixed treatment wasalso effective in removing the soft secondary componentabove 10 mT (Fig. 7B).
The characteristic remanent magnetization directions de-fine a magnetic polarity sequence which is presented in Figure8. Three samples from Cores 122-761C-23R and -24R were tooweakly magnetized and no characteristic direction could becomputed on these samples. The magnetic polarity sequenceshows an alternation of normal and reversed zones, most ofwhich are defined by two or more samples. Five short polarityzones are established by single samples.
DISCUSSION AND CONCLUSIONThe Upper Triassic magnetic polarity sequence is not well
known (Haq et al., 1987). Few magnetostratigraphic studieshave been carried out on sections of this age and none havingammonite or conodont biostratigraphy, although these groupsof fossils are used to define the boundary stages of the UpperTriassic.
Some paleomagnetic studies of Upper Triassic continentalsedimentary or volcanic rocks in North America (Reeve andHelsley, 1972; Steiner and Helsley, 1974) have yielded mag-netostratigraphic results. The Upper Triassic Kayenta Forma-tion (Utah) reveals four normal and four reversed intervals ofpolarity (Steiner and Helsley, 1974), but the age of thisformation is now regarded as Lower Jurassic considering
689
B. GALBRUN
NRM I n t e n s i t y(A / ml
10-5 10-2
I n c l i n a t i o n
-90
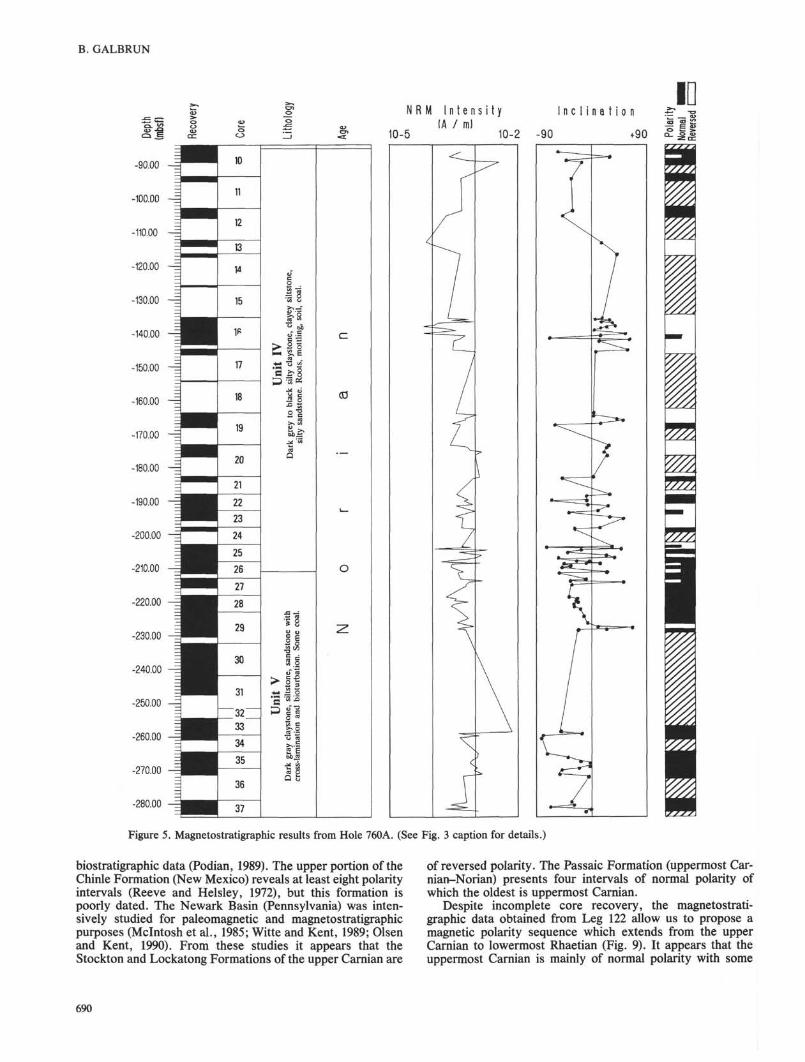
Magnetostratigraphic results from Hole 760A. (See Fig. 3 caption for details.)
biostratigraphic data (Podian, 1989). The upper portion of theChinle Formation (New Mexico) reveals at least eight polarityintervals (Reeve and Helsley, 1972), but this formation ispoorly dated. The Newark Basin (Pennsylvania) was inten-sively studied for paleomagnetic and magnetostratigraphicpurposes (Mclntosh et al., 1985; Witte and Kent, 1989; Olsenand Kent, 1990). From these studies it appears that theStockton and Lockatong Formations of the upper Carnian are
of reversed polarity. The Passaic Formation (uppermost Car-nian-Norian) presents four intervals of normal polarity ofwhich the oldest is uppermost Carnian.
Despite incomplete core recovery, the magnetostrati-graphic data obtained from Leg 122 allow us to propose amagnetic polarity sequence which extends from the upperCarnian to lowermost Rhaetian (Fig. 9). It appears that theuppermost Carnian is mainly of normal polarity with some
690

Figure 6. Magnetostratigraphic results from Hole 760B. (See Fig. 3 caption for details.)
B. GALBRUN
UP/N
E/Horiz.
122-761C-26R-3, δβcm
UP/N
20 mT
200*
= 2.06 × IO"4A/m
E/Horiz.
122-761C-31R-2, 117cm
Figure 7. Representative demagnetization diagrams on Hole 761Csamples. A. Thermal demagnetization. B. Mixed treatment.
short reversed polarity events. But most of these events aredefined by single samples. The lowermost Norian is of normalpolarity, then a 50-m-thick, reversed-polarity zone occurs inthe lower Norian (from Cores 122-760B-14R to -9R, Unit VI;see Fig. 6). A mixed normal-reversed sequence occurs at thetop of Hole 760B. The base of Hole 760A (Unit V) is of normalpolarity, but there is a gap in the sequence because Cores122-760A-30R and -31R were not sampled. The base of UnitIV shows an increase of reversed polarity zones, and areversed Earth's magnetic field seems predominant in theupper Norian, except in the uppermost part of this stagewhere the polarity becomes normal. The lower Rhaetian atHole 761C is of mixed polarity.
Correlations between the magnetic polarity sequencederived from Leg 122 Triassic sediments and other se-quences established on Upper Triassic rocks from continen-tal basins, such as the Newark basin, are difficult becausemost of these results are preliminary. The biostratigraphicdata are also poor. Construction of a global magnetic polar-ity pattern for the Upper Triassic must await additionaldata.
The magnetostratigraphic study of Triassic sedimentsrecovered during Leg 122 suggests many more polarityzones from the upper Carnian through lower Rhaetian thanpreviously established by paleomagnetic studies. This isimportant because the rate of magnetic field reversal fre-
quency is related to the activity of the Earth's mantle andcore. For example, in the model of coupling of core andmantle convection, times of increasing reversal rate areperiods of fast true polar wander (Courtillot and Besse,1987). This model is controversial and it requires an increasein reversal frequency during the Triassic and Early Jurassictimes after the Permo-Carboniferous Long Reversal Super-chron. The magnetostratigraphic data of Upper Triassicsediments from Leg 122 do not allow us to confirm orinvalidate this model.
Magnetostratigraphic correlations between sites are some-what difficult to establish given the poor recovery from eachhole, but some correlations between Holes 759B and 760B aresuggested. We assume that there is an overlap of the two sites;an alternative hypothesis assuming a gap between the twosites was also discussed considering the poor biostratigraphicresults, the seismic interpretation, and some sedimentologicalarguments (Shipboard Scientific Party, 1990b). The evidencefor overlap comes mainly from biostratigraphy, which sug-gests that the age of the sediments at the bottom of Hole 760Boverlap with the age of the sediments at Site 759 and that Core122-759B-14R correlates with Core 122-760B-17R. Suggestedmagnetostratigraphic correlations agree well with this assess-ment (Fig. 9). In fact, the sequences of Cores 122-759B-12Rthrough -39R and Cores 122-760B-16R through -29R aremainly of normal polarity. A reversed polarity zone begins inCore 122-759B-11R and extends toward the top of the hole,the same reversed zone extends at Hole 760B from Cores122-760B-14R to -9R.
The main result of this study is its contribution to theestablishment of a magnetic polarity sequence from upperCarnian to lower Rhaetian. The sequence established must beconfirmed by other studies of sedimentary sections on land.This is especially necessary for all the short events, most ofwhich are defined by single samples.
ACKNOWLEDGMENTSI thank the Ocean Drilling Program for allowing my partici-
pation on Leg 122. The scientific party on Leg 122 aided theextensive sampling. This study was supported by ODP-Franceand the CNRS-UA 1315. I wish also to express my thanks toDrs. S. 0'Connell and J. G. Ogg, and an anonymous refereefor reviewing the manuscript. I am grateful to J. Thompson forhelp with the English.
REFERENCES
Courtillot, V., and Besse, J., 1987. Magnetic field reversals, polarwander, and core-mantle coupling. Science, 237:1140-1147.
Daly, L., 1981. Des aimantations partielles aux aimantations superpo-sées: espoirs et difiicultés. Phys. Earth Planet. Inter., 24:218-227.
Galbrun, B., Gabilly, J., and Rasplus, L., 1988. Magnetostratigra-phy of the Toarcian stratotype sections at Thouars and Airvault(Deux-Sèvres, France). Earth Planet. Sci. Lett., 87:453-462.
Haq, B. U., Hardenbol, J., and Vail, P. R., 1987. The chronology offluctuating sea level since the Triassic. Science, 235:1156-1167.
Kirschvink, J. L., 1980. The least-squares line and plane and theanalysis of paleomagnetic data. Geophys. J. R. Astron. Soc,62:699-718.
Lowrie, W., and Heller, F., 1982. Magnetic properties of marinelimestones. Rev. Geophys. Space Phys., 20:171-192.
Mclntosh, W. C , Hargraves, R. B., and West, C. L., 1985. Paleo-magnetism and oxide mineralogy of Upper Triassic to LowerJurassic red beds and basalts in the Newark Basin. Geol. Soc. Am.Bull., 96:463-480.
Olsen, P. E., and Kent, D. V., 1990. Continental coring of the NewarkRift. Eos, 71:385.
Podian, K., 1989. Presence of the dinosaur Scelidosaurus indicatesJurassic age for the Kayenta Formation (Glen Canyon Group,northern Arizona). Geology, 17:438-441.
692

TRIASSIC MAGNETOSTRATIGRAPHY
Reeve, S. C , and Helsley, C. E., 1972. Magnetic reversal sequence inthe upper portion of the Chinle Formation, Montoya, New Mex-ico. Geol. Soc. Am. Bull., 83:3795-3812.
Shipboard Scientific Party, 1990a. Site 759. In Haq, B. U., von Rad,U., 0'Connell, S., et al., Proc. ODP, Init. Repts., 122: CollegeStation, TX (Ocean Drilling Program), 81-114.
, 1990b. Site 760. In Haq, B. U., von Rad, U., O'Connell, S.,et al., Proc. ODP, Init. Repts., 122: College Station, TX (OceanDrilling Program), 115-160.
., 1990c. Site 761. In Haq, B. U., von Rad, U., O'Connell, S.,et al., Proc. ODP, Init. Repts., 122: College Station, TX (OceanDrilling Program), 161-211.
Steiner, M. B., and Helsley, C. E., 1974. Magnetic polarity sequenceof the Upper Triassic Kayenta Formation. Geology, 2:191-194.
Witte, W. K., and Kent, D. V., 1989. A middle Carnian to earlyNorian (-225 Ma) paleopole from sediments of the Newark Basin,Pennsylvania. Geol. Soc. Am. Bull., 101:1118-1126.
Date of initial receipt: 15 June 1990Date of acceptance: 16 January 1991Ms 122B-150
N R M I n t e n s i t y(A / ml
10-5 10-2
I n c l i n a t i o n
Figure 8. Magnetostratigraphic results from Hole 761C. (See Fig. 3 caption for details.)
693

B. GALBRUN
Hole 760AHole 760B
Depth(mbsf)
BBS•U-90
- -120
Hole 759B
Depth(mbsf)
-50
-110
-140 -
-170 -
-200 -
-230-
<D
ü
-290 -
-480
Hole 761CDepth(rrt>sf)-340
--180
--180
--210 c
00
--240 ,_
O
- -270
- -300
- -330
- -360
• -390
--420
-460 —
O
<D1-370 —
-400
GC
L-430 §
Figure 9. The three magnetic polarity sequences plotted against depth(black = normal polarity, white = reversed polarity, and short bars =single samples with polarity inteΦretation opposite adjacent sam-ples). Suggested correlations between sites.
694

TRIASSIC MAGNETOSTRATIGRAPHY
Appendix A. Directions of characteristic magnetization of Triassicsediments in Hole 759B.
Appendix A (continued).
Sample (core,section, cm)
122-759B-6R-1, 807R-1, 437R-1, 1047R-2, 277R-2, 888R-1, 5211R-1,4311R-1, 8311R-2, 2712R-1, 2312R-1, 7412R-1, 11812R-2, 3813R-1, 3913R-2, 2413R-2, 7513R-2, 11413R-3, 4913R-3, 7914R-1, 1814R-1, 6514R-2, 3314R-2, 6514R-2, 13216R-1, 4616R-1, 8417R-1, 5917R-1, 13217R-2, 2218R-1, 3318R-1, 9618R-1, 14018R-2, 2118R-2, 5719R-1, 3119R-1, 10019R-1, 14219R-2, 3819R-2, 9819R-3, 3120R-1, 2620R-1, 7220R-1, 12520R-2, 2920R-2, 7620R-2, 12620R-3, 1920R-3, 7120R-3, 12221R-1, 3821R-1, 9621R-1, 14321R-2, 4321R-2, 9721R-2, 14221R-3, 4322R-1, 3422R-1, 7622R-1, 14822R-2, 2222R-2, 10223R-1, 2823R-1,6423R-2, 4723R-2, 11523R-3, 1024R-1, 2024R-1, 6324R-1, 13224R-2, 2924R-2, 10325R-1, 1525R-1, 7625R-2, 33
Depth(mbsf)
NRM(A/m)
Inclination
oDemagnetization
step
Sample (core,section, cm)
Depth(mbsf)
NRM(A/m)
Inclination Demagnetizationstep
41.3050.4351.0451.7752.3860.0288.4388.8389.7797.7398.2498.6899.38
107.39108.74109.25109.64110.49110.79116.68117.15118.33118.65119.32135.96136.34145.59146.32146.72154.83155.46155.90156.21156.57164.31165.00165.42165.88166.48167.31173.76174.22174.75175.29175.76176.26176.79177.21177.72183.38183.96184.43184.93185.47185.92186.43192.84193.26193.98194.22195.02202.28202.64203.97204.65205.10211.70212.13212.82213.29214.03221.15221.76222.83
2.01E-41.73E-41.86E-44.00E-51.20E-42.10E-51.55E-45.30E-42.81E-42.98E-41.43E-41.00E-52.60E-51.90E-56.70E-51.35E-41.96E-47.19E-49.60E-55.80E-51.00E-41.03E-43.80E-54.93E-41.51E-42.82E-42.70E-41.40E-42.22E-41.47E-41.72E-41.75E-41.38E-43.69E-41.15E-37.98E-45.12E-49.62E-46.86E-45.34E-43.03E-43.55E-41.21E-42.47E-49.20E-52.35E-42.94E-43.14E-44.14E-44.50E-42.37E-44.14E-44.44E-45.61E-41.07E-36.22E-41.57E-31.16E-31.52E-34.25E-42.01E-43.95E-41.64E-46.25E-46.25E-47.35E-45.22E-45.96E-45.20E-45.54E-46.36E-44.03E-44.08E-41.04E-4
+ 12+ 11+22+ 19+ 16+ 16+20- 3 9-61-13- 5 9- 7 3- 3 0- 3 3- 1 2- 3 0- 3 9- 3 8- 2 9- 2 7- 6
- 3 8-54- 4 6+ 16-20+ 15- 4 6-34- 4 9- 4 3- 4 7- 5 5- 1 3- 7
-34-38- 2 2- 1 8- 1 2- 3 9- 1 9- 1 8-34- 3 7- 9
- 1 1+8
-34- 3 2+8
- 2 3- 2 3- 1 6-24- 1 6- 1 9- 2 1- 2 8- 3 6+ 10-21- 2 7- 4 5- 5 8-21- 3 3- 3 9- 1 6- 2 6- 5 6- 1 0- 2 7- 1 9
100°100°100°200°320°240°100°100°360°100°100°100°280°240°320°100°100°360°360°100°100°100°100°360°320°320°100°100°100°100°100°100°100°100°100°100°100°100°100°100°100°100°100°100°100°100°100°100°100°100°100°100°100°100°100°100°150°210°
+20mT+ 15mT+ 15mT
+ 15mT+ 15mT
+25mT+ 15mT+ 10mT
+ 15mT+20mT
+ 15mT+25mT+ 15mT+ 10mT
+25mT+ 10mT+ 15mT+ 10mT+ 10mT+ 10mT+ 10mT+25mT+40mT+40mT+25mT+40mT+40mT+32mT+25mT+25mT+25mT+20mT+ 10mT+ 10mT+20mT+20mT+28mT+28mT+30mT+28mT+35mT+40mT+30mT+32mT+39mT+25mT
50mT250°210°210°210°250°210°210°210°100°100°100°100°100°100°100°
+25mT+25mT+25mT
+25mT+25mT+25mT+40mT+32mT+32mT+32mT+32mT+25mT+25mT
26R-1, 326R-1, 4227R-1, 3227R-1, 9827R-2, 4128R-1, 828R-1, 12228R-2, 3328R-2, 9929R-1, 11329R-2, 3229R-2, 10829R-3, 1629R-3, 7330R-1, 10930R-2, 283OR-3, 1530R-3, 2831R-1, 12531R-1, 14531R-2, 3131R-2, 8831R-3, 9032R-1, 4732R-1, 9732R-1, 14232R-2, 4732R-2, 8332R-2, 13232R-3, 5833R-1, 3633R-1, 9633R-2, 3533R-2, 9333R-3, 2034R-1, 2934R-1, 12034R-2, 1534R-2, 11034R-3, 7535R-1, 13035R-2, 1435R-2, 10935R-3, 14236R-1, 3136R-l,9036R-2, 5036R-2, 11436R-3, 3336R-3, 8437R-1, 4737R-1, 11537R-2, 5837R-2, 13337R-3, 7438R-1, 6438R-1, 12038R-2, 3938R-2, 12438R-3, 4438R-3, 14638R-4, 6739R-1, 3639R-1, 11839R-2, 3939R-2, 12539R-3, 6339R-3, 12539R-4, 4139R-4, 13739R-5, 48
230.53230.92235.82236.48237.41240.58241.72242.33242.99246.64247.32248.08248.66249.23251.59252.28253.65253.78256.25256.45256.81257.38258.90260.47260.97261.42261.97262.33262.82263.58265.36265.%266.85267.43267.70270.29271.20271.65272.60273.75275.80276.14277.09278.92279.81280.40281.50282.14282.83283.34284.47285.15286.08286.83287.74289.64290.20290.89291.74292.44293.46294.17298.86299.68300.39301.25302.13302.75303.41304.37304.98
3.21E-45.53E-46.43E-43.15E-47.14E-44.48E-47.65E-41.76E-43.87E-45.07E-41.32E-37.33E-45.78E-41.12E-39.40E-44.99E-44.90E-47.58E-44.36E-46.13E-46.89E-46.56E-45.04E-46.51E-41.23E-37.87E-43.25E-48.32E-44.37E-45.55E-42.24E-45.64E-45.10E-46.18E-44.42E-46.15E-46.07E-45.65E-45.17E-46.52E-46.31E-42.68E-47.96E-42.67E-35.39E-44.67E-43.94E-44.51E-45.34E-46.27E-46.09E-44.47E-46.86E-41.34E-42.10E-42.58E-45.56E-47.80E-45.45E-44.42E-41.28E-45.01E-42.78E-48.31E-49.07E-41.20E-31.28E-46.64E-48.48E-45.70E-48.89E-4
- 2 5- 1 8- 3 8
+2- 3 7+ 16+50+3
- 4 0- 4 0- 4 1- 4 0- 3 5- 2 1- 3 5- 1 8+45- 5 6- 2 9- 2 4- 2 6+ 15- 4 1- 3 2- 5 9+23+31- 4 6- 3 5- 4 5
+9- 3 0- 4 0- 3 5- 2 8- 3 2- 3 0- 2 8- 4 6- 2 4- 3 5- 4 9- 2 3- 4 6- 3 7- 3 0- 4 8- 4 2+ 17- 2 1- 2 1- 3 2- 4 9- 3 3- 2 6- 4 3- 3 6- 3 9- 4 1- 3 9- 3 4- 3 0- 2 7- 3 3- 3 8- 4 8+33+ 37- 3 8- 2 8- 4 0
250°210° +25mT100° +40mT210° +25mT210° +25mT210° +25mT100° +32mT210° +25mT250°240°
50mT270°240°250°340°270°340°150° +39mT300°300°250°
50mT300°
50mT150° +39mT300°340°250°340°210° +25mT210° +25mT250°
50mT210° +25mT210° +25mT210° +25mT210° +20mT150° +39mT210° +25mT210° +25mT210° +25mT210° +25mT210° +25mT150° +39mT
50mT210° +25mT210° +10mT210° +22mT210° +22mT210° +22mT210° +22mT210° +22mT210° +22mT210° +22mT250°210° +22mT210° +22mT210° +22mT210° +30mT210° +30mT210° +30mT210° +30mT150° +39mT210° +30mT210° +30mT250°210° +30mT
50mT210° +30mT210° +30mT210° +30mT
Note: The NRM column represents the initial NRM intensity of each sampleand the demagnetization step column refers to the highest step attainedduring the treatment of each sample.
695

B. GALBRUN
Appendix B. Directions of characteristic magnetization of Triassicsediments in Hole 760A.
Appendix B (continued).
Sample (core,section, cm)
122-760A-10X-2, 6810X-3, 6710X-4, 2510X-CC, 2511X-1,6412X-1, 6812X-2, 6813X-1, 6914X-1, 1516X-1, 3316X-1, 6216X-1, 8816X-1, 13616X-2, 2416X-2, 8016X-2, 12616X-3, 3316X-3, 10316X-4, 3316X-4, 10316X-5, 2916X-5, 5716X-5, 10317X-1, 3117X-1, 7119X-1, 3119X-1, 6919X-2, 2519X-2, 6919X-3, 2519X-3, 6920X-1, 2320X-1, 7120X-2, 2820X-2, 7120X-3, 1221X-1, 2321X-1.6822X-1, 2422X-1, 6722X-2, 2422X-2, 6722X-3, 2422X-3, 6723X-123X-:23X-:23X-:24X-124X-:25X-:25X-:25X-1
1,241,67>, 33I, 831,261,601,791,89I, 128
25X-2, 22
Depth(mbsf)
85.8887.3788.4588.9593.84
103.38104.88112.89116.35135.53135.82136.08136.56136.94137.50137.96138.53139.23140.03140.73141.49141.77142.23145.01145.41164.01164.39165.45165.89166.95167.39173.43173.91174.98175.41176.32182.93183.38188.14188.57189.64190.07191.14191.57193.14193.57194.73195.23198.16198.50203.69203.79204.18204.62
NRM(A/m)
4.59E-42.50E-46.24E-43.58E-34.68E-44.94E-42.12E-47.20E-54.47E-42.31E-47.07E-42.84E-49.41E-41.40E-41.11E-46.20E-51.86E-43.59E-46.30E-55.89E-44.65E-44.25E-43.17E-43.01E-41.02E-33.54E-41.06E-35.66E-45.95E-42.97E-44.56E-42.58E-46.32E-47.67E-41.42E-39.88E-41.25E-38.82E-43.65E-44.29E-46.86E-45.54E-48.74E-43.59E-49.78E-47.48E-43.48E-45.17E-44.82E-49.52E-44.89E-47.88E-41.14E-41.93E-3
Inclination
O
- 5 6+30-44- 1 6-33- 3 1- 4 9+ 16+41+ 18+6
+ 30+ 13+34+38+24+ 14+2
+58+7
- 7 1+65+ 10+61
+6+3+2
+40+52+ 13- 6 1+ 28+ 24+21+22+24+2
-51+30- 9- 8
- 6 7- 7
+28+8
- 3 9+22+53+ 12-30+ 35- 7 4+47- 1 7
Demagnetizationstep
240°+30mT240°240°+20mT100°+40mT240°+30mT100°+20mT100°+30mT100°+45mT100°+20mT100°+10mT240°+25mT240°+15mT460°240°+15mT240°+15mT240°+10mT240°+20mT240°+ 15mT240°+15mT25O°+3OmT100°+15mT100°+20mT25O°+3OmT250°+30mT300°250°+25mT250°+25mT250°+10mT250°+15mT250°+15mT200°100°+45mT250°+30mT250°+25mT250°+30mT250°+25mT250°+20mT250°25O°+3OmT250°+20mT250°+20mT25O°+15mT460°250°+25mT250°+30mT250°+25mT250°+20mT250°+20mT100°+10mT100°+10mT100°+45mT100°+ 15mT100°+40mT100°+40mT
Sample (core,section, cm)
25X-2, 8925X-3, 2225X-3, 8925X-3, 13025X-4, 2225X-4, 6225X-4, 8925X-5, 3025X-5, 7126X-1, 4926X-1, 8726X-1, 12226X-2, 1326X-2, 3726X-CC,1226X-CC,4327X-1, 2527X-1, 7927X-1, 11927X-2, 4927X-2, 8128X-1, 5928X-1, 11328X-2, 2528X-2, 5328X-2, 12828X-3, 3528X-3, 12029X-2, 4429X-3, 3329X-3, 13929X-4, 1729X-4, 7029X-4, 8533X-3, 11533X-4, 1134X-1, 3334X-1, 8635X-1, 5835X-2, 1835X-2, 10735X-3, 3535X-3, 10535X-4, 4235X-4, 11835X-5, 6835X-5, 13537X-1, 6637X-1, 14537X-2, 6837X-2, 11637X-3, 28
Depth(mbsf)
205.29206.12206.79207.20207.62208.02208.29209.20209.61208.39208.77209.12209.53209.77211.02211.33213.15213.69214.09214.89215.21218.49219.03219.65219.93220.68221.25222.10224.84226.23227.29227.57228.10228.25258.55259.01259.73260.26264.98266.08266.97267.75268.45269.32270.08271.08271.75279.56280.35281.08281.56282.18
NRM(A/m)
4.21E-41.41 E-31.06E-37.12E-43.35E-41.60E-43.02E-42.32E-42.20E-41.31 E-32.90E-42.73E-42.73E-42.77E-45.31E-43.96E-44.55E-41.48 E-37.20E-46.04E-46.11E-42.08E-43.58E-43.22E-46.82E-43.23E-42.73E-43.66E-46.99E-43.81E-49.29E-45.76E-43.79E-45.89E-47.18E-34.09E-41.21E-34.31E-41.16E-31.13 E-38.31E-47.48E-48.74E-41.11E-39.45E-41.45E-35.21E-46.26E-42.67E-46.62E-41.97E-41.18E-3
Inclination(°)
- 4 2+22+39- 5 6- 3 5- 3
- 1 1- 2 0+ 18+ 15- 4 8- 3 5- 3 7- 5 2+26- 5 6
- 8- 3 7+ 52- 3 1- 3 4- 3 8- 2 3- 2 6- 2 4- 3 0- 2 9- 1 8- 1 1
- 8+8
+66+ 18- 2 3- 5 2- 1 6- 8 0- 8 2- 7 3- 3 9- 2 0
0- 2
-20- 5 0-54- 4
- 3 3- 2 9- 6 9
0- 1 0
Demagnetizationstep
100°+30mT100°+30mT100°+20mT100°+16mT100°+16mT100°+16mT100°+30mT100°+22mT100°+22mT100°+30mT100°+22mT100°+16mT100°+16mT100°+10mT100°+16mT100°+28mT100°+28mT100°+28mT100°+28mT100°+20mT100°+28mT100°+22mT100°+28mT100°+20mT100°+28mT100°+28mT100°+28mT100°+28mT100°+ lOmT100°+28mT300°100°+16mT100°+22mT100°+28mT100°+28mT100°+26mT100°+16mT100°+10mT460°250°+30mT250°+20mT250°+30mT250°+30mT250°+30mT250°+30mT250°+30mT250°+20mT250°+20mT250°+10mT250°+15mT250°+10mT400°
Note: The NRM column represents the initial NRM intensity of eachsample and the demagnetization step column refers to the higheststep attained during the treatment of each sample.
696

TRIASSIC MAGNETOSTRATIGRAPHY
Appendix C. Directions of characteristic magnetization of Triassic Appendix C (continued).
Sample (core,
section, cm)
122-760B-6R-1, 356R-1, 1136R-2, 326R-2, 867R-1,217R-1, 1207R-2, 177R-2, 1318R-1, 358R-1, 1218R-2, 328R-2, 1058R-3, 349R-1, 179R-1, 1289R-2, 1309R-3, 11610R-1, 10710R-2, 6210R-2, 13111R-2, 9511R-3, 9412R-1, 8112R-1, 10812R-2, 5012R-2, 10012R-3, 6013R-1, 5613R-1, 9714R-1, 8714R-3, 10314R-4, 8416R-1, 7716R-2, 7716R-3, 5816R-4, 2316R-4, 8317R-2, 13017R-3, 4218R-1, 13318R-2, 8619R-1, 8419R-2, 1219R-3, 4219R-3, 12719R-4, 13120R-1, 113
\JK.- , Di20R-2, 12720R-3, 5620R-3, 126
Depth
(mbsf)
283.35284.13284.82285.36292.71293.70294.17295.31302.35303.21303.82304.55305.34311.67312.78314.30315.66322.07323.12323.81332.95334.44340.81341.08342.00342.50343.60350.06350.47359.87363.03364.34378.77380.27381.58381.73382.33390.30390.93398.33399.36407.34408.12409.92410.77412.31417.13ΛΛQ Λ 3
418.03418.77419.56420.26
NRMf K 1 \(A/m)
9.10E-5
1.96E-4
1.63E-3
1.26E-4
6.91E-4
2.49E-4
4.84E-4
3.58E-4
2.74E-3
4.24E-4
6.40E-5
2.86E-4
8.90E-5
2.98E-4
2.27E-3
8.10E-5
4.63E-4
1.34E-3
9.98E-4
6.80E-4
1.25E-3
5.76E-4
1.43E-4
1.61E-4
1.65E-4
2.04E-4
1.02E-3
3.62E-3
7.74E-4
1.50E-3
4.22E-4
2.67E-4
4.70E-5
4.87E-4
1.29E-3
5.47 E-3
5.17E-3
2.45E-4
5.64E-4
6.25E-4
1.12E-3
1.43 E-3
3.41 E-3
7.57E-4
1.14E-3
4.69E-4
1.25 E-3
1.11 E-31.24 E-3
7.30E-4
9.06E-4
Inclination
(°)
+ 30
+23+ 30
-13+29+37+28-47+28-12-24-33-12+58+22+ 36
+4+ 20
+ 27
+ 37
+ 17
+ 16
+28-11
+7+35+ 15
+30+27
+ 8
+ 17
-21-42+28-21-24-23-21
- 2- 9
-33-46-20-16
- 7-33
- 6
— 13η
-12+9
Demagnetization
step
150°+30mT210°250°+15mT210°10O°+35mT100°+30mT10O°+35mT210°+10mT210°+30mT210°210°250°+22mT210°210°+10mT250°+45mT210°210°+25mT210°+30mT210°+30mT210°+30mT210°+10mT210°+10mT100°+10mT100°+10mT100°+15mT10O°+35mT100°+35mT100°+25mT150°210°+30mT210°+25mT210°210°+10mT210°+30mT250°+45mT210°+30mT210°+35mT100°+20mT100°+35mT210°+20mT210°+30mT21O°+3OmT210°+30mT210°+20mT210°+25mT210°+35mT210°+35mT
210°+35mT210°+35mT210°+35mT210°+10mT
Sample (core,section, cm)
20R-4, 5720R-4, 13020R-5, 6621R-1, 3421R-1, 8921R-2, 6521R-2, 12521R-3, 6621R-3, 12421R-4, 6522R-1, 2422R-1, 10122R-2, 4522R-2, 13922R-3, 4922R-3, 10322R-4, 4222R-4, 14623R-1, 5523R-1, 12223R-2, 2523R-2, 13023R-3, 2723R-3, 11223R-4, 3723R-4, 13225R-2, 7227R-1, 3027R-1, 13327R-2, 1727R-2, 13527R-3, 2727R-3, 13527R-4, 2227R-4, 13127R-5, 14327R-6, 12227R-6, 14228R-1, 3628R-2, 3628R-3, 1828R-4, 7329R-1, 3629R-1, 9429R-2, 7229R-2, 14329R-3, 5329R-3, 13029R-4, 41
Depth(mbsf)
421.07421.80422.66425.84426.39427.65428.25429.16429.74430.65435.24436.01436.95437.89438.49439.03439.92440.%445.05445.72446.26447.30447.77448.62449.37450.32465.72477.80478.83479.17480.35480.72481.85482.22483.31484.93486.22486.42487.36488.86490.18492.23496.86497.44498.72499.43500.03500.80501.41
NRM(A/m)
1.44 E-39.55E-41.93 E-33.49E-42.20E-45.82E-44.61E-47.25E-41.07 E-32.31E-46.70E-53.24E-44.14E-43.68E-47.61E-44.98E-46.06E-46.04E-44.31E-44.48E-41.31 E-36.72E-41.02 E-35.98E-48.70E-45.91E-44.71E-41.66E-46.77E-43.92E-45.34E-46.52E-45.74E-46.01E-47.51E-45.67E-44.90E-44.59E-41.64E-37.70E-45.64E-47.75E-48.48E-48.62E-46.48E-41.20 E-34.74E-49.82E-47.98E-4
Inclinationxiivniiαiiuii
n0
-29-33-24
+9-17
- 8-68-21-19
- 4+2
0+5
- 1 0+ 14-54-30-53-56-46-44-38-24+ 39
+7- 1 6
- 9- 1+9+8
+ 19+6
-10-16
- 3+4- 9- 6- 8- 5- 5
-13- 5
-10+ 12+ 11-60
+4
Demagnetizationstep
210°+20mT210°+30mT250°+35mT210°+10mT210°+10mT210°+20mT210°+20mT210°+10mT210°+30mT210°+10mT210°210°210°+30mT210°210°+30mT210°+20mT210°+30mT200°210°+30mT210°+35mT210°+30mT210°+20mT210°+35mT21O°+35mT210°+25mT210°+30mT10O°+35mT210°+35mT210°+35mT210°+30mT210°+35mT250°+15mT210°+35mT210°+30mT210°+35mT210°+35mT210°+35mT210°+25mT210°+30mT210°+30mT210°+30mT250°210°+25mT210°+30mT210°+30mT210°+30mT210°+10mT210°+10mT210°+30mT
Note: The NRM column represents the initial NRM intensity of each sampleand the demagnetization step column refers to the highest step attainedduring the treatment of each sample.
697
B. GALBRUN
Appendix D. Directions of characteristic magnetization of Triassicsediments in Hole 761C.
Sample (core,section, cm)
122-761C-23R-1, 14623R-2, 2823R-2, 13023R-3, 4423R-3, 11423R-4, 6724R-1, 1624R-1, 12724R-2, 3824R-2, 13924R-3, 2425R-1, 8726R-1, 5826R-1, 13526R-2, 1826R-2, 5226R-3, 5826R-3, 10726R-4, 9026R-5, 8626R-6, 9429R-1, 2829R-1, 9530R-1, 9530R-2, 2230R-2, 11031R-1, 4931R-1, 14431R-2, 11731R-3, 9031R-4, 1631R-4, 14231R-5, 1132R-1, 3032R-1, 13632R-2, 4732R-2, 11832R-3, 4532R-3, 10433R-1, 5033R-1, 12633R-2, 21
Depth(mbsf)
338.66338.98340.00340.64341.34342.37346.86347.97348.58349.59349.94358.57366.28367.05367.38367.72369.28369.77371.10372.56374.14389.48390.15399.65400.42401.30408.69409.64410.87412.10412.86414.12414.31418.00419.06419.67420.38421.15421.74427.70428.46428.91
NRM(A/m)
6.80E-51.30E-52.20E-53.40E-56.20E-51.02E-41.40E-52.20E-51.01E-43.60E-53.80E-51.49E-41.16E-41.24E-42.27E-42.10E-59.40E-54.80E-55.50E-54.90E-52.30E-59.40E-51.72E-42.65E-41.52E-48.22E-44.80E-57.90E-52.06E-45.30E-51.92E-45.28E-42.98E-43.30E-52.29E-41.44E-45.40E-51.14E-31.57E-35.70E-51.79E-43.30E-4
Inclination
o- 3 2
- 6 7- 4 0- 5
-32
+48+ 25-58+ 39+45+ 12+42+42+44+ 18+29
+9+ 11- 3 8- 3 0- 2 8- 4
- 3 6- 4 9+29+8
+ 17+ 28- 6 9
+9+6
- 5 0- 4 0+67- 4 5- 4 3+22+20- 2
Demagnetizationstep
250°
150°250°250°250°
250°180°210°250°300°250°250°250°300°250°300°300°300°400°300°100°+15mT100°+15mT300°150°100°+15mT100°+20mT100°+25mT400°300°300°220°300°300°300°300°400°100°+15mT10O°+25mT100°+15mT
Note: The NRM column represents the initial NRM intensity of each sampleand the demagnetization step column refers to the highest step attainedduring the treatment of each sample.
698